The post Understanding JVM Garbage Collection Part 10 – C4 (Azul Zing) appeared first on A Bias For Action.
]]>Zing provides a pauseless, generational, region based always compacting garbage collector called C4. The acronym C4 is derived for the algorithms 4 main features i.e. it is a continuously concurrent compacting collector. Azul Zing was specifically designed to be insensitive to fragmentation, allocation rates, mutation rates, use of soft or weak references, and heap topology [^15]. C4 unlike other generational garbage collectors supports simultaneous generational concurrency i.e. both young and old generation are collected concurrently using the same algorithm. Different generations are collected using a concurrent (non-stop-the-world) mechanisms that can be simultaneously and independently active on each generation. C4 is not ‘mostly’ concurrent, but fully concurrent and never resorts to a stop-the-world compaction. C4 is able to continuously perform concurrent young generation collections even during periods of high memory allocation. Unlike other GC algorithms C4 never reverts to fallback STW operations even during sustained high memory allocations. This is done without sacrificing response times. C4 also does concurrent compaction without the need for STW pauses. C4’s shining feature is its concurrent compaction which is responsible for significantly reducing GC pauses. Just like other concurrent collectors C4 is also region based. In C4 regions are called pages. Although the C4 algorithm is pauseless the implementation of the C4 algorithm does require the use of safepoints. Thus like other concurrent GC C4 does have STW phases but these are very small. These safepoint are injected when the GC alogrithm is transacting for one phase to another. The pause time is not determined by the heap size, allocation rate and the object graph. In most cases pauses are close to less that 1ms.
Azul Zing takes a different approach to memory management than a regular a JVM. To understand Zing’s approach lets quickly revise virtual memory basics. Virtual memory is an abstraction that enables the OS to project a much larger memory address space than it physically posses. In simple terms virtual memory provides an illusion of physical memory that in reality it does not posses. The OS projects a much larger address space. The Memory Management Unit (MMU) enables the OS to translate virtual addresses to physical addresses. Virtual memory address space is divided into sections called pages. These pages are usually 4k in size. These pages are swapped in and out of memory as required. If an application requests access to an address that is not backed by physical memory a page fault is triggered. A page replacement algorithm is used to determine the page that needs to be swapped out. Usually a Least Recently Used (LRU) algorithm or similar variants are used to determine the page that needs to be swapped out.
Physical memory (RAM) on a machine is almost never enough to accommodate the large number of applications handled by a OS. Virtual memory enables the OS to run/accommodate a large number of application that would never fit into RAM at the same time. The size of virtual memory is determined by the CPU’s word size (32 or 64 bit) and the amount of disk space on the physical machine. In theory a 64 bit CPU is able to accommodate 256TB of virtual memory.
Apart from its main benefit, providing a much large memory address space, virtual memory has a whole host of of other benefits. These includes:
- Reduces Fragmentation – The use of virtual memory reduces both internal and external fragmentation in RAM. Internal fragmentation occurs when memory allocated to a process exceeds its current needs but unused memory cannot be used by another process. External fragmentation is said to occur when a new process cannot be accommodated even thought enough memory is available.
- Efficient use of RAM – A any given point of time a process only uses a fraction of its code and data. One of the main advantages of virtual memory is that it enables efficient use of physical memory. Only code that is being actively being processed is loaded in physical memory. Additionally physical memory is also assigned to the process that actually needs it at a particular point of time.
- Provides a sand boxed addressed space – Virtual memory enables the OS to provide a sand boxed addressed space thus preventing malicious or unintended access of another process address space.
The quintessential virtual memory page has a 1 -> 0..1 mapping to physical memory. A virtual memory page is either either backed by a physical page or does not have a corresponding physical page in memory. You can also have an interesting alternative. You can have two virtual memory pages backed by the same physical page.
Most JVM behave just like any other process i.e. they allocate memory via system calls. These system calls allocate space on the OS virtual memory system. It is the OS’s virtual memory subsystems responsibility to swap VM pages in and out of physical memory. Generally for this reason you should always configure your heap to be less than physical memory. One can allocate a heap that exceeds physical memory but almost always this will be less performant than having the entire heap in memory. This is due to paging activity that will occur as the heap exceeds physical memory.
Azul Zing does not use the OS memory sub-system. It has it own kernel-level software, Zing System Tools (ZST), than enables it to tailor the virtual memory to the JVM’s needs. ZST is provides Linux virtual and physical memory management enhancement. ZST enables the JVM to bypasses the Linux memory subsystem thus providing a number of benefits. ZST enables the JVM to rapidly manipulate virtual memory. ZST is C4 secret sauce that enables the C4 algorithm to optimise virtual memory and physical for its needs. This enable C4 to sustain high object allocation rate without noticeable pauses.
The C4 algorithm is a mark and compact algorithm. The GC algorithm has three main operations. (More detail on these phases later.)
- Mark (Mark Phase) i.e. Identifying live objects.
- Relocation (Compact Phase) – Moving live objects to a new location.
- Remapping (Compact Phase) – Fixing references of newly moved objects.
C4 guarantees single pass marking and single pass references remapping. Central to assuring these guarantees is Load Value Barrier (LVB). C4 uses LVB barriers to support concurrent marking, compaction, and remapping. LVB are a read barrier which ensure that reference are “sane” when loaded before any mutator thread sees them. In other words the LVB helps synchronize concurrent threads thought the GC process. The LVB places invariants when the object is loaded i.e. conditions that must be satisfied before the object can be accessed. The LVB ensures two main things:
- The LVB ensures that the object has been moved from the from-space to the to-space. In C4 lingo a marked thought object is one that has been traversed using the marking phase i.e. moved to the to-space. Similarly a not marked through is a reference that has not been traversed during the marking phase. The LVB ensures that the reference state indicates that it has been “marked through” if a mark phase is in progress.
- The LVB also ensures that the object reference is not pointing to an object that has been relocated i.e. the object has been moved but the reference still points to the objects original memory location. If a reference does point to a relocated object then this is immediately fixed. Reference must point to the location in memory where the object has been relocated too. This trap will get triggered during the relocate and remap phases.
If the above conditions are not met a “trap condition is triggered” i.e. the reference is corrected to meet the above condition before making the reference visible to application code.The trap either marks the object or corrects the reference of the reallocated object. These traps provide the C4 algorithm a self-healing property. The same object reference will be corrected once and all applications threads will benefit from this correction. This ensures that there is a set amount of work that needs to be done during the the mark and relocation phases.
Zing stores the state of the pointers inside the reference itself. This is know as a coloured pointer. In a 64-bit system the references pointer have a additional bits that can be used the to store the state of the references. The actual reference only takes up around 44 bits and the additional bits can be used to store the state of the pointer. These bits are used to store the generation of the object, Not Marked Through (NMT) bit and whether the object has been remapped. When the algorithm is in progress we check the state of the object against a global state to determine if the object should be trapped. This global state is stored in a registers. If the trap is not triggered we progress with the normal path other wise we continue with the normal behavior. Note the address loaded needs to be unmasked as it contains more that just the object memory location.
A> Zing does not use a Tri-Coloured abstraction. Please do not confuse coloured pointers with a Tri-Coloured abstraction.
C4 has three main stages during a GC cycle:
- Mark Phase – The entire object graph is marked. The marking phase is what is called a precise wavefront marking i.e. simply put it marks the object graph as if it is unmodified through out the marking process. There is no need for a final remark to catch reference modifications that might have occurred due to mutator threads. C4 ensure that the marking is correct even though even though mutator threads are concurrently updating the object graph via the LVB. This allows the C4 marking to be single pass. The LVB ensures a self-healing process as it traps and marks any reference that is loaded but has not been marked. The LVB ensures any modifications to the object graph are trapped and marked appropriately.
- Relocation Phase – The relocation phase moves live objects so that sparsely populated pages can be freed. Sparsely populated pages are the ones with a few live objects and a large number of dead objects. Live objects from these pages are moved so that a particular page can be freed. C4 also follows a garbage first philosophy and selects the pages according to the amount of dead objects it contains. C4 selects a set of virtual pages to be released. C4 starts by selecting a page with the greatest amount of garbage. This virtual page is protected and cannot be accessed. The page being released is called the “from” page and relocates objects to the to page. Reference forwarding information is stored outside the from page in a forwarding tables. As soon as the relocation is done the from page’s physical memory is released. Although the physical page is released the virtual page backing this physical page is still needed as there will be object references into the page. Any object references into this pages is protected via the LVB.
- Remap Phase – The remap phase fixes references that are no longer valid because of the relocation phase. Remapping is lazily occurring via the LVB. As stale references are accessed by mutator threads the LVB traps and fixes stale references. However, to complete a GC cycle we need to fix all stale references. During the phase all stale references are fixed i.e. references are updated to point to the relocated area. At the end of the remap phase no stale references will exist. After all the stale references have been fixed the “from-virtual” page is recycled. C4 is not in a hurry to perform the remap phase as there are not critical physical being held up. Additionally C4 fuses the remap phase with the next GC cycles mark phase as both phases are traversing the same object graph. This phase is folded in with the next phase i.e. the next marking phase happens in conjunction with the remap phase. The last phase of the GC cycle is the start of the next GC cycle.
The post Understanding JVM Garbage Collection Part 10 – C4 (Azul Zing) appeared first on A Bias For Action.
]]>The post Understanding JVM Garbage Collection – Part 9 Garbage First (G1) Garbage Collector (GC) appeared first on A Bias For Action.
]]>The G1GC is a server-style generational, incremental, parallel, mostly concurrent, stop-the-world evacuating garbage collector which is suitable for multiprocessor machines with a large amount of memory. G1GC aims to meets garbage collection pause-time goals with high probability, while achieving high throughput. G1GC monitors its stop the world pauses in order to try and achieve it pause time goals. Initially the main goals for G1GC where:
- Easy to tune especially in comparison to CMS
- Predictable GC pause times avoiding long GC pauses
- Scales better with larger heap. Older garbage collectors would scale linearly i.e. the larger the heap the greater the pause time. G1GC aims to solve this problem.
- Eliminate full STW
Over time G1GC has evolved into a general-purpose collector. In fact OpenJDK 9 has made G1GC its default garbage collector. The main motivation for switching to G1GC as a default collector was:
“Limiting GC pause times is, in general, more important than maximising throughput. Switching to a low-pause collector such as G1 should provide a better overall experience, for most users, than a throughput-oriented collector such as the Parallel GC, which is currently the default.”
 |
|---|
| Garbage First (G1) Garbage Collector (G1)) |
As with other GC algorithms G1GC has 2 algorithms one for young generation and the other for the old generation. The young generation algorithm is an stop the world, parallel, copying GC algorithm. On the other hand the old generation algorithm is a mostly concurrent marking algorithm with an incremental compacting. Note G1GC does not do any sweeping The incremental compacting phase piggyback on the young generation GC.
 |
|---|
| G1GC Regions |
The G1GC divides the heap into small areas. These small areas are know as regions i.e. a small independent unit where memory can be allocated and reclaimed. The concept of regions enables G1GC to collect a subset of the heap instead of collecting the entire heap. G1GC heap is generational but generations are no longer contiguous. A region can be assigned to hold objects of any generation. Although non contiguous, regions still logically combined into Eden, Survivor and Tenured. A region can be free or assigned a particular generation i.e. young, survivor, tenured or humongous. Humongous regions are for objects that span more than one region. The number of regions per generation can change between collection sizes. G1GC adaptively resizes the number of regions per generation based on statistics collected. By default each region is one MB in size but get bigger for larger heaps. Regions size is also configurable. Permissible values include 1, 2, 4, 8, 16, 32, or 64 MB. A region size must be a power of two. By default the G1GC is looking for close to 2048 regions. The number of regions is calculated at startup. The calculation is done by dividing the total heap by permissible sizes and settling on an appropriate value which is close to or greater than 2000. Regions sizes can also be explicitly set using -XX:G1HeapRegionSize.
 |
|---|
| G1GC Collection Set |
A regional garbage collector need to identify a subset of regions that need to be collected. This enables the GC to meet pause time goals even on large heaps. Regions grouped together for a collection cycle are called collection sets (CSets) i.e. a set of regions from where live objects are evacuated into new regions. During a young collection a CSet is made up of only young regions. G1GC introduced a new concept called mixed collections. Unlike the Parallel collector the G1GC old generations collection is are incrementally and concurrently collected. Mixed collections are made up of the all young regions and a few candidate old regions with the most amount of garbage.
 |
|---|
| Remember Set |
Since G1 runs GC on select regions the garbage collector must be able to ascertain references between regions. This is a similar problem to tracking old generation to young generation references. As mentioned before old generation to young generation pointers are done via a card table. G1G1 uses a similar concept called remember set (RSet) to track these references. Just like card tables a RSet track references into a particular region. RSets enable us to identify references without having to scan the entire heap. RSets are used to track pointers from old generation regions to young generation regions and from old generation regions to other old generation regions. Since the young generation is collected a whole there are no young region to young region Rset. During a collection the CSets and RSets are scanned to determine inter region reference.
All free regions are added to a linked list called the “free list”. Free regions are assigned as thread-local allocation buffer (TLAB) to a mutating thread. G1GC uses a compare and swap method to ensure that a TLAB is assigned to a single thread in a safe manner. The mutating thread is free to assign objects into their allocated region/TLAB without the need for any synchronisation. The thread is allocated new regions as its previously allocated region is exhausted. When eden fills up a young generation collection is triggered.
 |
|---|
| G1GC Young Generation Collection |
The young generation is collected as a whole and live objects are moved from the Eden into a survivor space. Objects in the survivor space are moved from one survivor region to another survivor region. G1GC collects statistics for each GC cycle. This enables it to resize the Eden and survivor spaces to meet pause time goals. Eden can range from 5 to 60% for the heap memory and get dynamically adjusted. By default 10% for memory must always be free thus ensuring enough survivor space. Reserved free memory space is tuneable via -XX:G1ReservePercent VM argument. Regions offer a host of benefits which include:
- Enables Tenured to be collected in small chuck to meet latency goals
- Generation can be resized as necessary
- Heap defragmentation is not required with an evacuating collector. G1GC reclaims space by copying live data out of existing regions into empty regions.
Young generation G1GC is very similar to young generation GC in other collectors. The main difference is that G1GC operates on on non contiguous memory i.e. regions instead of a contiguous memory space. Young generation GC is done using a evacuating collectors as opposed to copying collectors employed by CMS or the parallel collector. Young generation garbage collection is a stop the world event. Live objects are moved from Eden to Survivor and between the two Survivor spaces. Objects from different Eden regions are compacted into survivor spaces. Objects that meet an aging threshold are promoted to old generation. The other key differences between G1GC young generation collection and other young generation collectors is that G1GC collects stats and resizes the young generation to meet pause time goals. In summary Young generation GC:
- Operates on non-contiguous regions logically. Similar to other Young generation GC collectors the Young generation is split into Eden and two survivor spaces.
- Young generation garbage collection is a stop the world events.
- Young generation garbage collection is done using multiple threads.
- Live objects are copied to survivor or old generation regions depending on the objects age.
- Young generation size is recalculated based on
- Young generation collection time.
- The size of the RSet
- Min and Max young generation limits
- And last but not least the pause time threshold.
Over time objects get promoted into old regions. This leads to increasing heap occupancy. Humongous objects allocations also lead to increasing heap occupancy. To avoid running out of space the JVM triggers GC that not only covers the young generation but also the old generation. Old generation collection is done under the umbrella of a mixed cycle. G1 triggers a mixed generation cycle when initiating heap occupancy percent is met. The initiating heap occupancy percent is the heap size threshold that triggers a marking cycle. By default this value is 45 but can be tuned using the -XX:InitiatingHeapOccupancyPercent VM arguments.
G1GC employs an algorithm called Snapshot-At-The-Beginning (SATB). The algorithm can only identify garbage that existed at the point of the snapshot. The GC algorithm works on a virtual snapshot of the heap taken during initial mark phase. Objects considered live at the time of the snapshot are considered live for the purpose of the whole reclamation run. This provides better latency but comes at a cost i.e. retaining some memory that could actually be freed. This memory will be freed during the next GC cycle. During the marking phase the state of the references can change as application threads are working in conjunction with GC threads. G1GC uses pre-write barriers that intercept and records object reference mutation. The object reference modifications are appended to a link list called the update write buffer. The update write buffer is processed to ensure that only dead objects are collected. The update write buffers are processed using the concurrent refinement threads. The concurrent refinement threads a set of threads dedicated to processing the update write buffers and updating the remember set for the appropriate region.
The old generation collection is similar to the CMS old generation collection phases i.e. some of the old generations phases are done in conjunction with young generation phases. Old generation collections have two phases:
- A concurrent marking cycle. The goal of the concurrent marking cycle is to finish marking before the heap is at capacity. Most of the cycle takes place concurrently while mutator threads are in progress.
- A mixed collection where all young generations regions are collected and some and old generation regions are collected. Old generation collections are reported as G1GC mixed collections.
The G1GC mixed collection phases are:
- Initial Mark (STW) – The Initial mark phase is a stop the world event. The initial mark phase identifies objects reachable from its GC roots. The main goal of the phase is to identifies survivor regions (not objects but regions) that might have root references to objects in the old generation. This phase is done in conjunction with the Young Generation garbage collection.
- Scan root Regions (Concurrent phase) – Scan survivor regions to identify references to old generation objects. This is a concurrent phase that happens in conjunction with running application threads. This phase must complete before the next young generation GC.
- Concurrent Mark (Concurrent phase) – G1 has concurrent marking phase which marks live objects found in the old generation regions. This phase may be interrupted by a young generation garbage collector. The concurrent marking extends from the end of a evacuation pause (where the initial marking work is done) to the remark phase.
- Remark (STW) – This phase helps complete the concurrent mark phase. It completes the marking of live objects. During this phase the GC traces all remaining live objects, performs references processing (process strong and weak references) and SATB buffers.
- Cleanup (STW) – This is a stop the world phase which scrubs the RSet and does other accounting tasks i.e. identify completely free regions. Empty regions are returned to the free list.
- Space-reclamation phase – This phase is called the mixed collection phase. The mixed collection phase evacuates object from both young and old generation regions. The cycle evacuates all young generation regions and some old generation regions. The main goal is to maintain pause time goals. Thus statistics and pause time goals determines the number the number of old generation regions that need to be evacuated to yield enough free space. Old generation regions are selected based on the heap space that can be reclaimed and the number of mixed cycles configured. The space reclamation phase can span many cycles i.e. mixed cycles continue to happen until enough space is reclaimed or the number of configured mixed cycles is exhausted. The number of mixed cycles is configured via -XX:G1MixedGCCountTarget and defaults to 8. While -XX:G1HeapWastePercent determines if enough space has been reclaimed. This phase ends as soon as G1 determines that it has evacuated enough old generation regions. Essentially the G1 algorithm wants to ensure that GC is freeing objects faster than the allocation rate.
G1GC also has the concept of Full GC. Full GC are triggered when:
- There are evacuation failures i.e. one cannot find free regions even after expanding the heap to its maximum size.
- The heap size reaches its configurable hard-margin (G1ReservePercent).
- It is unable to allocate a humongous object because it cannot find enough continuous regions to do the allocation.
- Collection rate cannot keep up with allocation rate i.e. the garbage collector runs out of free regions before the marking phase has completed.
Frequent full GC’s indicate a need for further tuning. The objective is to avoid a full GCs at all costs. Full GC’s are analogous to Concurrent Mode Failures in CMS. To make matters worse until Java 9 Full GC’s are single threaded STW collector i.e Serial GC collector. This makes full GC’s expensive. Java 10 onwards have switched to using a parallel collector for full GC’s. A full GC results in compacting the entire heap thus freeing up the most amount of memory possible.
The post Understanding JVM Garbage Collection – Part 9 Garbage First (G1) Garbage Collector (GC) appeared first on A Bias For Action.
]]>
CMS uses a STW parallel evacuating collector to collect the young generation. This is similar to the parallel collector, also known as Parallel Savage. CMS utilizes a parallel collector called ParNew, which is essentially the same as Parallel Savage but includes a callback interface. The concurrent collector uses this callback interface.
CMS performs a concurrent cycle to clean data from the old generation (CMS). The CMS garbage collection runs GC threads alongside application threads. The main goal of the CMS collector is to minimize garbage collection pauses, which involves a tradeoff of sharing application processing resources with garbage collection. Performing GC concurrently with application threads becomes problematic only if both compete for the same CPU cycles. Doing GC in conjunction with running application threads leads to a more complex set of GC phases.
The CMS GC cycle includes the following phases:
The CMS GC cycle consists of the following phases:
- Initial Mark: A stop-the-world operation that identifies objects reachable from roots, followed by resuming all application threads.
- Concurrent Mark: Calculation of the reachable object graph using one or more GC threads in conjunction with application threads.
- Concurrent Pre-clean: Retracing modified sections of the object graph using a single thread.
- Remark (STW): A stop-the-world operation that retracts sections of the roots and object graph modified since the pre-clean phase. Application threads resume at the phase’s end.
- Concurrent Sweep: Use of a single processor to add unreachable objects to the free lists for future allocation. Concurrent Reset: Use of a single processor to prepare for the next GC cycle.
he CMS collector also employs an evacuating collector to free space in the young generation, while utilizing a mark and sweep collector in the old generation. CMS does not compact the tenured generation. When compaction becomes necessary, CMS falls back on using ParallelOld. CMS falls back on using ParallelOld under two main circumstances:
- Concurrent mode failure – Occurs when Tenured does not have sufficient space to accommodate objects promoted from the young generation. Essentially, the allocation pressure on Tenured was higher than CMS’s cleaning rate for Tenured.
- Fragmented tenured – When Tenured is too fragmented, it prevents memory allocation.
In both cases, CMS resorts to using ParallelOld for garbage collection on Tenured. If necessary, CMS can also perform a full GC.
Tuning CMS is a non-trivial task that requires both GC tuning and application modifications. Making adjustments to tune CMS in the application can be particularly challenging. As of Java 9, CMS has been deprecated and is scheduled to be removed in JDK 14.
The post Understanding JVM Garbage Collection – Part 8 Concurrent Mark Sweep (CMS) Collector appeared first on A Bias For Action.
]]>The post Understanding JVM Garbage Collection – Part 7 Mostly Concurrent GC appeared first on A Bias For Action.
]]>
The main goal of concurrent collectors is to reduce GC pause times. They were developed due to the growing demands for reduced application pause time. GC threads run in conjunction with application threads doing most of the GC work before pausing. Truly concurrent collectors are very hard to achieve as mutator threads keep modifying the state of the heap. Thus concurrent collectors are generally mostly concurrent implementation. A Collector is termed “mostly/partly concurrent” where the majority of the garbage collection work is done in conjunction with application execution. Mostly/partly concurrent collectors do require stop-the-world pauses to do a small portion of their work some of its work.
There are two main aspects to concurrent collectors, i.e. concurrent marking and concurrent compaction. Initial implementations of concurrent collector just did concurrent marking and sweeping. Compaction was either ignored (CMS) or was done using a stop the world pause (G1GC). Newer algorithms such as Shenandoah, ZGC do both concurrent marking as well as concurrent collection. None the less both these algorithms still employ minor STW pauses.
Central to all concurrent collectors is tricolor marking. Tricolor marking has one important advantage: it can be performed without the need to halt the system for significant periods of time. The algorithm works as follows:
- A GC cycle starts off by marking all GC root objects as gray while all other objects are marked as white.
- The GC marking thread randomly selects a gray node and inspects its children.
- All children are colored gray.
- Once all its children are colored gray, it then colors itself black.
- The above process is repeated until there are zero gray nodes. When there are zero gray nodes, the scan is complete.
- All black nodes are live objects and must not be collected.
- All white nodes are dead objects and are eligible for collection
The simple mark-and-sweep algorithm cannot work with concurrent algorithms. Mark-and-sweep algorithms essentially assign objects two states or colors (dead or alive). Incremental or concurrent approaches require three colors to help identify the states of objects and to identify changes in object reachability. The tri-color algorithm enables the system to collect garbage periodically rather than when needed. Essentially, tri-color marking enables us to identify white nodes (dead objects) that are not attached to black nodes during the course of a garbage collection cycle.
A central problem with all concurrent collectors is that garbage collection (GC) and mutator threads may create race conditions because both threads are competing for the same object. For example, the GC may be moving an object whose reference is being modified by the application. In order for tri-color incremental/concurrent GC to work, mutator threads must coordinate with the GC collector to identify unreachable objects that have become reachable. GC and mutator threads coordinate via read and/or write barriers. A read or write barrier is simply a small piece of code that the Java Virtual Machine (JVM) injects into application code. This piece of code simply performs a task when an object is accessed or updated. In the case of tri-color marking, a read barrier detects when a white object is read and immediately colors it gray. A write barrier traps modifications to an object reference and processes it appropriately. There are two main approaches to write barriers:
- Snapshot-at-the-beginning (SATB) – The SATB algorithm works on a heap snapshot. The SATB algorithm ensures that no object pointers are destroyed while the collector is traversing the object graph. All pointer modifications are stored in buffers to determine if a white object should be collected.
- Incremental update – This write barrier turns a black object into a gray object if it modifies any of its pointers. This gray object will be re-scanned before the collection is complete. Unlike SATB, no extra data structures are required to track reference modifications. Now that we have covered the basics, let’s dig into various concurrent collector implementations. There are a number of mostly concurrent collector implementations.
The post Understanding JVM Garbage Collection – Part 7 Mostly Concurrent GC appeared first on A Bias For Action.
]]>JVM GC Implementation
Serial Collector

Parallel Collector
The parallel collector is the default garbage collector on 64-bit machines with two or more CPUs (up to Java 8). It is similar to serial collectors in that it is a generational collector, but it uses multiple threads to perform garbage collection. The parallel collector collects both the young and old generations using multiple threads. By default, the parallel collector calculates the number of garbage collection threads based on the number of cores or hardware threads. For machines with eight or more cores, the number of threads is set to 5/8 of the number of cores, while for machines with less than eight cores, the number of threads used is set to the number of cores. The use of multiple garbage collection threads helps to speed up the garbage collection process on multiprocessor hardware, hence the name throughput collector. Parallel GC is one of the best ways to minimize the total time spent on garbage collection and maximize throughput. However, it can lead to long pause times, making it unsuitable for certain applications, especially those with large heap sizes.

Initially, the parallel collector was only available for the young generation and was configured using the -XX:+UseParallelGC flag. This flag would enable parallel GC on the young generation while the old generation would use a serial collector. As heap sizes grew, it became evident that parallel GC was required for both the young and old generations. In Java 6 update, Parallel GC was introduced for both the young and old generations. Parallel GC could be turned on using -XX:+UseParallelOldGC. In Java 7, Parallel GC was made the default collector. As of JDK 8, the -XX:+UseParallelOldGC VM argument has been deprecated and should no longer be used. Simply using -XX:+UseParallelGC turns on the parallel collector for both old and young generations.

The parallel collector uses a mark-and-copy collector called ParallelScavenge for the young generation and a mark-sweep-compact collector called ParallelOld for the old generation collection, similar to the serial collector. However, the main difference is the use of multiple threads in the parallel collector.
Multi-threaded young generation collections can lead to a fragmented tenured due to promoting young generation objects to tenured using multiple threads. Each minor GC thread reserves a portion of tenured for object promotion, called promotion buffers. GC threads promoting only to their promotion buffers can lead to fragmentation as these buffers may not be optimally utilized. A major GC, or garbage collection of the old generation, can reduce fragmentation via compaction.
As of Java 6, old generation GC cycles are also multi-threaded, with ParallelOld GC not only collecting garbage but also compacting the heap. Compaction helps eliminate fragmentation and is only performed if the heap has reached a certain level of fragmentation. Compaction eliminates memory waste and leads to a better memory layout, but it does have a cost associated with it. The Parallel collector divides the heap into regions, with the number of parallel GC threads determining the number of regions. Each GC thread marks and sweeps objects in its own region, which prevents concurrency issues between threads.
During the compaction phase, the GC aims to move live data from higher regions into lower regions. The GC first fills up region 1 with live data, then moves on to filling regions 2. This frees up the higher regions while fully utilizing the lower regions, thus eliminating fragmentation.

The parallel collector’s GC process is illustrated in the diagram above. The diagram assumes that we have three GC threads, and thus the tenured heap area is divided into three regions (not to be confused with G1GC regions). Each GC thread is responsible for its own region. At the end of the mark and sweep phase, we can see a fragmented heap. The compaction process moves objects from lower regions to higher regions to free up space.
The parallel collector can be tuned using three main JVM parameters, which help optimize the collector for your application’s needs. These parameters are:
- Soft pause time goal – The maximum pause time goal can be specified using -XX:MaxGCPauseMillis. This is a soft goal, and the JVM will try to keep garbage collection under the specified pause time goal.
- Maximum throughput goal – GC throughput is measured using a ratio that compares the amount of time spent doing GC to the amount of time spent doing application work. Use the -XX:GCTimeRatio VM argument to set the throughput goal. For example, -XX:GCTimeRatio=9 means that the GC threads should spend no more than 10% of their time doing GC. The value is calculated using the following formula: (1/1+N). In our case, this was 1/(1+9), which is .10 or 10%.
- Maximum footprint goal – The maximum footprint goal establishes the total heap memory allocated. Use the -Xmx VM argument to set the total amount of heap memory allocated to the JVM. For example, -Xmx:1G will set the maximum heap size of 1G.
In the event that all of the above goals cannot be met, the collector focuses on them in the following priority order:
- Pause time goal
- Throughput goal
- Memory footprint goal
The collector maintains statistics on every GC run, and the collected statistics are used to establish if the pause time and throughput goals have been met. If the goals have not been met, future GC runs are adjusted to help meet these goals. Generation sizes, both young and old, are contracted and expanded to help meet these goals. To meet pause time goals, the GC might need to shrink the generation, while meeting throughput goals might require expanding the generation.
The post Understanding JVM Garbage Collection – Part 6 (Serial and Parallel Collector) appeared first on A Bias For Action.
]]>The JVM’s GC algorithms have evolved over the past three decades. The very first GC algorithm shipped with the JVM was the serial collector. Initially, Java was popular on the client side (Java Applets), and the serial collector was perfect for its GC needs. However, the serial collector worked well only on small heaps and did not scale to large heaps. Furthermore, it did not take advantage of increasingly prevalent multi-core CPUs. As Java’s popularity on the client side faded in the late 1990s and early 2000s, it became increasingly popular on the server side. This necessitated a new GC algorithm primarily catering to server-side applications.
The JVM introduced a parallel garbage collector to improve garbage collection performance in server-side applications. In contrast to the serial collector, the parallel collector divides the garbage collection process into separate workpieces and utilizes multiple garbage collection threads to handle each piece concurrently. Parallel garbage collection, also known as the throughput collector, represents a significant improvement over the serial garbage collector, particularly for JVMs with larger heaps deployed on multi-core CPUs. However, one of the main drawbacks of both serial and parallel collectors is the need for stop-the-world (STW) application pauses to collect garbage. The parallel collector’s pause times increase linearly with heap size, meaning that STW pause times grow as the heap size expands.
Concurrent GC represents the next evolution in the JVM’s GC algorithm space. This approach helps reduce garbage collection pause times, particularly for larger heaps. Concurrent GC takes advantage of available CPU cycles by performing garbage collection concurrently with application threads. With the increasing number of hardware threads/cores, concurrent GC has gained popularity as idle CPU cycles can be used effectively for garbage collection to reduce pause times. Concurrent GC has two main goals: concurrent marking and concurrent compacting. However, the latter is considerably more complex than the former.
Over the years, the JVM has introduced several concurrent garbage collectors. Concurrent Mark Sweep (CMS) was one of the first concurrent GC algorithms shipped on the HotSpot JVM. As the name suggests, CMS performs only concurrent marking and sweeping without concurrent compacting. CMS has two main shortcomings:
- CMS does not compact memory, which leads to heap fragmentation.
- CMS can be difficult to tune.
As memory became cheaper, heap sizes became enormous, necessitating a reorganization of the JVM heap to ensure minimal GC pauses with increasing heap sizes. To achieve this, the heap was divided into regions, and garbage collection was performed concurrently in the regions with the most garbage, following the garbage-first philosophy. G1GC was one of the first region-based GC algorithms. The primary goal of G1GC is to meet garbage collection pause-time objectives on large heaps with a high degree of certainty. Unlike CMS, G1GC provides compaction but does not perform concurrent heap compaction.
Shenandoah and ZGC represent the next evolution in the concurrent garbage collection space, intending to reduce GC pause times to less than 10ms. Currently, both of these GC implementations are non-generational and are among the first algorithms to provide concurrent compaction on the HotSpot JVM.
Azul’s Zing was a revolutionary development in the GC space as it introduced a proprietary pauseless GC algorithm.
| Collector Name | Generational | Regional | YG Algo | YG Algo STW | OG Algo | OG Algo STW | Notes |
|---|---|---|---|---|---|---|---|
| Serial Collector | Yes | No | Single threaded/Mark and Copy | Yes | STW Mark Sweep Compact | Yes | Only recommended on tiny heaps and single-core machines. Virtually unused today. |
| Parallel Collector | Yes | No | Parallel/Mark and Copy | Yes | Parallel STW Mark and Compact | Yes | The most popular and widely used algorithm today. The default GC up to Java 8. |
| CMS Collector | Yes | No | Parallel/Mark and Copy | Yes | Concurrent Mark Sweep | No but does not compact | Does not compact and falls back to the parallel collector if allocation pressure is too high or the old gen is too fragmented. |
| G1GC | Yes | Yes | Parallel/Mark and Copy | Yes | Concurrent Mark and STW compacting | Mark and Sweep do not require STW pauses but compacting does require STW pauses | Falls back to using the parallel collector for an old generation if allocation pressure is too high. |
| Shenandoah | No | Yes | Concurrent Mark and compacting | NA | Concurrent Mark and compacting | No | Falls back to using its failure modes if allocation pressure is too high. |
| ZGC | Yes | Yes | Concurrent Mark and compacting | No | Concurrent Mark Sweep and compacting | No | Does not need any fallback algorithms |
The post Understanding JVM Garbage Collection – Part 5 (JVM GC Evolution) appeared first on A Bias For Action.
]]>The terminology used to describe garbage collection algorithms can be confusing. In this section, we will explain some commonly used terms and their meanings.
- Live set – The live set refers to the number of live objects in a heap. The size of the live set has a significant impact on the amount of work required for garbage collection, as well as the duration of GC pause times. However, modern garbage collectors are often able to optimize the live set size separately from the GC pause times.
-
Heap size – The heap size refers to the total amount of memory that is allocated to the heap. The performance of a garbage collector can be influenced by the size of the heap. The garbage collection algorithm chosen is responsible for cleaning the entire heap or a subset of the heap. The size of the heap can have a direct impact on garbage collection and stop-the-world pause times. In general, larger heaps tend to have longer stop-the-world pause times, especially with older GC algorithms. However, modern garbage collectors use innovative methods to reduce the linear correlation between heap size and stop-the-world pause times.
-
Heap Fragmentation and Compaction – Memory allocation and deallocation can create gaps in memory, which are known as heap fragmentation. If fragmentation is not resolved, the heap can have plenty of space but be unable to allocate memory for new objects because of a lack of contiguous free space. To solve fragmentation, compaction is used to relocate live objects so that the heap has contiguous free space.
-
Mutation/Mutating Thread/Application Threads – In GC literature, “mutating threads” refers to application threads that change object references. These threads modify the object graph and are also known as application threads. The mutation rate is the rate at which references are updated in memory.
-
Stop-the-World – A stop-the-world pause is a complete halt of all application threads to perform a GC cycle. Some GC algorithms require stop-the-world pauses to garbage collect without interference from the application code. During a stop-the-world pause, the heap is unmodified by the application while GC is in progress.
- Safe Point – A safe point is a mechanism that brings application threads to a well-defined point regarding their interaction with the heap. Threads are no longer executing application code, enabling the JVM to perform work that would be difficult to do while threads are running and mutating the heap. The GC implementation signals threads to pause by issuing a safe point call. A safe point provides the GC algorithm with a slot to safely perform GC. Application threads perform regular safe point checks to determine if they should pause. Once a safe point call is issued, all application threads must block at a safe point. Safe point checking is done via polling, where every method regularly checks a particular memory location to determine if a safe point has been issued. The JVM injects safe point checks into every method, usually performed just before a method returns. At a safe point, all heap objects are in a consistent state, and all GC roots are known. Once all application threads have blocked at a safe point, GC can be performed. Safe points are used in several situations, including GC pauses, code deoptimization, flushing code cache, hot swapping of classes, and various debugging operations. The “Safe Point” diagram illustrates the safe point mechanism in a JVM. Running application threads are signalled to come to a safe point. However, it should be noted that application threads can take varying amounts of time to halt. Once all application threads are halted, GC takes place. Once GC has finished, the safe point is removed, and all application threads can continue.
|
|
|---|
| Safe Point |

- Time to Safe Point – The time taken for all application threads to come to a stop is known as Time To Safe Point (TTSP). It is the difference between when the safe point call is issued and when all application threads come to a halt.
- Moving Collectors – Moving collectors move objects into new areas and update all references to an object. This happens after a GC cycle. A non-moving collector, on the other hand, leaves all live objects in the same memory location. This often leads to memory fragmentation. There are two types of moving collectors:
- Evacuating/Copying Collector – An evacuating collector is a type of moving collector. An evacuating GC is one where the memory region collected is left completely empty. All live objects are moved to another memory region. Evacuating collectors perform well since there is no memory compaction overhead. They naturally defragment memory.
- Compacting Collector – A compacting collector is also a type of moving collector. The main goal of a compacting collector is to eliminate memory fragmentation. A compacting GC eliminates memory fragmentation by ensuring that all allocated memory is arranged in a single contiguous region at the end of a GC cycle.
- Incremental Collector – Incremental GC performs a single GC cycle in phases. Incremental GCs interleave a GC cycle in favor of application progress. Incremental GCs run for a specified period doing part of the GC work. Incremental collectors may pause due to various conditions. The collector could terminate due to numerous reasons such as a time budget or a higher priority GC phase that needs to be carried out. Incremental collectors would have done some productive work in the allocated time. This is in contrast to a phase that needs to be fully completed for it to have been productive.
- Serial vs Parallel vs Concurrent Collectors – It is important to understand the difference between Serial, Parallel, and Concurrent collectors to appreciate various GC algorithms. These three concepts are essential and must be internalized.
-
Serial collector – The serial collector is a type of garbage collector that uses a single thread to perform all GC phases. During a GC cycle, application threads are paused. The serial collector is simple and efficient for small-scale applications or systems with limited resources, but it may not be suitable for larger applications due to the long pauses it can cause.
-
|
|
|---|
| Serial Collector |

-
-
Parallel collectors – Parallel collectors use multiple GC threads to perform various phases of a GC cycle. Unlike serial collectors, parallel collectors operate using multiple threads for garbage collection. However, like serial collectors, parallel collectors pause application threads during GC cycles. The number of threads used by parallel collectors is typically configurable using an application argument.

Parallel Collector -
Concurrent collectors – Concurrent collectors work in conjunction with the application, unlike parallel collectors. GC work is carried out while application threads are running, allowing the application to continue running during garbage collection. Concurrent collectors may or may not use multiple GC threads to perform their work, and the number of threads used can vary depending on the GC cycle phase. The number of threads used can also be adjusted through application arguments, similar to parallel collectors.

Concurrent Collector
-
-
NUMA-aware – Modern multi-socket machines increasingly implement a Non-Uniform Memory Access (NUMA) architecture, which is in stark contrast to previous architectures that implemented Uniform Memory Access (UMA). In a NUMA architecture, memory is divided into separate regions called NUMA domains, each consisting of a set of CPUs/cores and its locally connected memory. Memory access latency is dependent on the memory location relative to the processor, as processors can access their own local NUMA domain faster than a remote one.
Garbage collectors that are aware of NUMA architectures provide memory placement that takes memory location into account, and are called NUMA-aware GCs. These collectors ensure that frequently used memory is locally located, while rarely used memory is remotely located. The diagram above illustrates the difference between UMA and NUMA architectures.

NUMA vs UMA UMA vs NUMA -
GC Invariant – The term “invariant” is commonly used when describing GC algorithms. However, it can be confusing for those who are not familiar with the concept. In computer science, an invariant is a condition that must be satisfied before a procedure or operation can be executed, and it must continue to hold true after the operation has been completed. GC invariants ensure that the program is in a particular state both before and after a GC operation, which helps to minimize any side effects that may occur as a result of the operation.
The post Understanding JVM Garbage Collection – Part 4 appeared first on A Bias For Action.
]]>The weak generational hypothesis has had a profound impact on the JVM’s heaps layout. Understanding the weak generational hypothesis is essential in order to understand various GC algorithms and approaches. The Weak Generational Hypothesis states that most objects die young. In other words, most objects created will be garbage collected very quickly. Barry Hayes, in his seminal paper “Using Key Object Opportunism to Collect Old Objects”, pointed out that “newly created objects have a much lower survival rate than older objects” [^1]. This hypothesis was derived from observing object allocations/deallocations on a large number of live systems. The hypothesis also states that objects that tend to live past a certain age continue to live for a long time.
 |
|---|
| Weak Generational Hypothesis |
The diagram above illustrates the weak generational hypothesis. One can observe that there are a large number of objects that die young. Objects that do survive tend to live for a very long time.
Garbage collectors (not all) have taken advantage of this hypothesis by structuring the heap according to object generations. The heap is structured so that short-lived objects can be easily and quickly collected. Long-lived objects are separated from short-lived objects and are garbage collected using a different algorithm. GC’s that take advantage of the weak generational hypothesis are known as generational garbage collectors.
JVM Garbage Collector Basics
JVM GC algorithms employ a tracing garbage collector, which makes use of the weak generational hypothesis. Since most objects die young, the JVM subdivides the heap into separate regions according to object age. The subdivision of the heap enables the JVM to employ efficient GC algorithms according to object age. At a high level, the JVM splits the heap into two areas. The two areas are the young generation, aka nursery and the old generation, aka tenured. When analysing generational garbage collectors, it is imperative to delve into:
- Young generation algorithm – GC algorithm used to collect garbage in the young generation. Young generation collectors are generally copying collectors as these are very efficient on heap areas with a large number of dead objects, i.e. a sparse section of the heap.
- Old generation algorithm– GC algorithm used to collect garbage in the old generation. These are generally compacting collectors. Objects in the area of the heap live much longer and thus fragment memory. Compacting collectors defragment memory and thus help make the best use of available memory.
Let’s dig deeper into the heap’s memory allocations spaces:
Young Generation
All newly created objects are allocated space in the young generation. The JVM further subdivides the young generation into sub-space, i.e. Eden, survivor one (S1), and survivor two (S2). To be precise, all newly created objects are allocated space in Eden. At startup, both of the survivor spaces are empty. At any given point in time, one of the survivor spaces (S1, S2) is always empty. During a minor GC, live objects are relocated from Eden and the “populated survivor space” into the “empty survivor space”. The GC maintains a counter called “age” for every object. An object’s age is incremented every time the object is moved from one heap area to another. Each object in the Java heap has a header. This header tracks the object age, i.e. the number of GC cycles an object has survived. The object age is tracked by utilising a few of the bits of this header. Objects are copied between survivor spaces a certain number of times before being eventually promoted to the Old Generation space. The process of promoting an object to the old generation is called aging. The actual threshold/age can is tuneable via the -XX:+MaxTenuringThreshold. By default, this value is 15 GC cycles.
 |
|---|
| Young Generation Heap Layout |
The garbage collection of the young generation is called a minor garbage collection or Minor GC. A Minor GC is triggered when the JVM is unable to allocate new objects. Typically minor GC’s employ a Mark and Copy GC algorithm as opposed to a Mark, Sweep, and Compact algorithm. After a minor GC, the entire Eden space is empty. All live objects from the Eden space are moved to a survivor space. This also holds true for the populated survivor space. All objects from one of the survivor spaces are cleared and copied into the other space, which was previously empty. During a Minor GC, the Old Generation is not collect. Minor GC’s necessitate stop-the-world pauses.
Memory allocation poses concurrency problems as multiple application threads can compete for the same memory area. Locking memory segments/areas during allocation is a simple solution. Locking, although simple, has the potential to severely slow down memory allocation. Eden is essentially a shared mutable state that multiple application threads are competing for. Efficiently managing Eden is a must to ensure quick memory allocation. Thread Local Allocation Buffer (TLAB) to the rescue. Eden is split into sub-areas called (TLAB). Every thread is assigned a TLAB. Each thread allocates memory into its own TLAB. Since each thread only allocates into its own TLAB, memory allocation takes place without an expensive synchronisation penalty. Allocating into a TLAB is as simple as allocating memory and bumping a pointer. If allocation inside a particular TLAB fails, the allocation is attempted in the shared Eden space. Allocation in the shared space is slower as this allocation needs to be synchronised. If the shared Eden space does not have enough space, then a minor GC is triggered, i.e. GC on the Young Generation. If the GC fails to free sufficient free memory inside Eden, the object is allocated in the Old Generation.
Old Generation
Tenured or long-lived objects are moved from the young generation into the old generation. Objects are garbage collected from the old generation during a major garbage collection event. For a number of GC algorithms, a major GC is a stop the world event which does mark, sweep, and compact. The term full GC and major GC are a source of confusion. Although there are is no formal definition, a full GC refers to cleaning the entire heap while a major GC just refers to cleaning tenured. A full GC is both a minor and major garbage collection. The JVM reports every Major Collection as Full GC.[^6]. This is because a major GC is triggered as a result of a minor GC. When the heap is full, a minor GC is triggered. If the minor GC cannot find enough space in tenured, it triggers a major GC, i.e., a full GC.
VisualVM is a great tool to help visualise GC. The GIF below visualises a GC currently in progress. Let’s understand a number of concepts introduced above with the help of visual aid. The first thing to notices is the spaces section. There are five different spaces i.e. Old Generation, Eden, S0, S1, and Metaspace. The first thing to take cognizance of is that all new objects are allocated into Eden. You will notice the amount of memory occupied by Eden steadily increases. A Minor GC immediately decreases the space occupied by Eden. As most of the objects in Eden are dead, these objects are removed from memory. The objects that are alive are copied into one of the survivor spaces, i.e., S0 or S1. Notice how at any given point in time, one of the survivor spaces is always empty. On every minor GC, the survivor space occupied is switched.
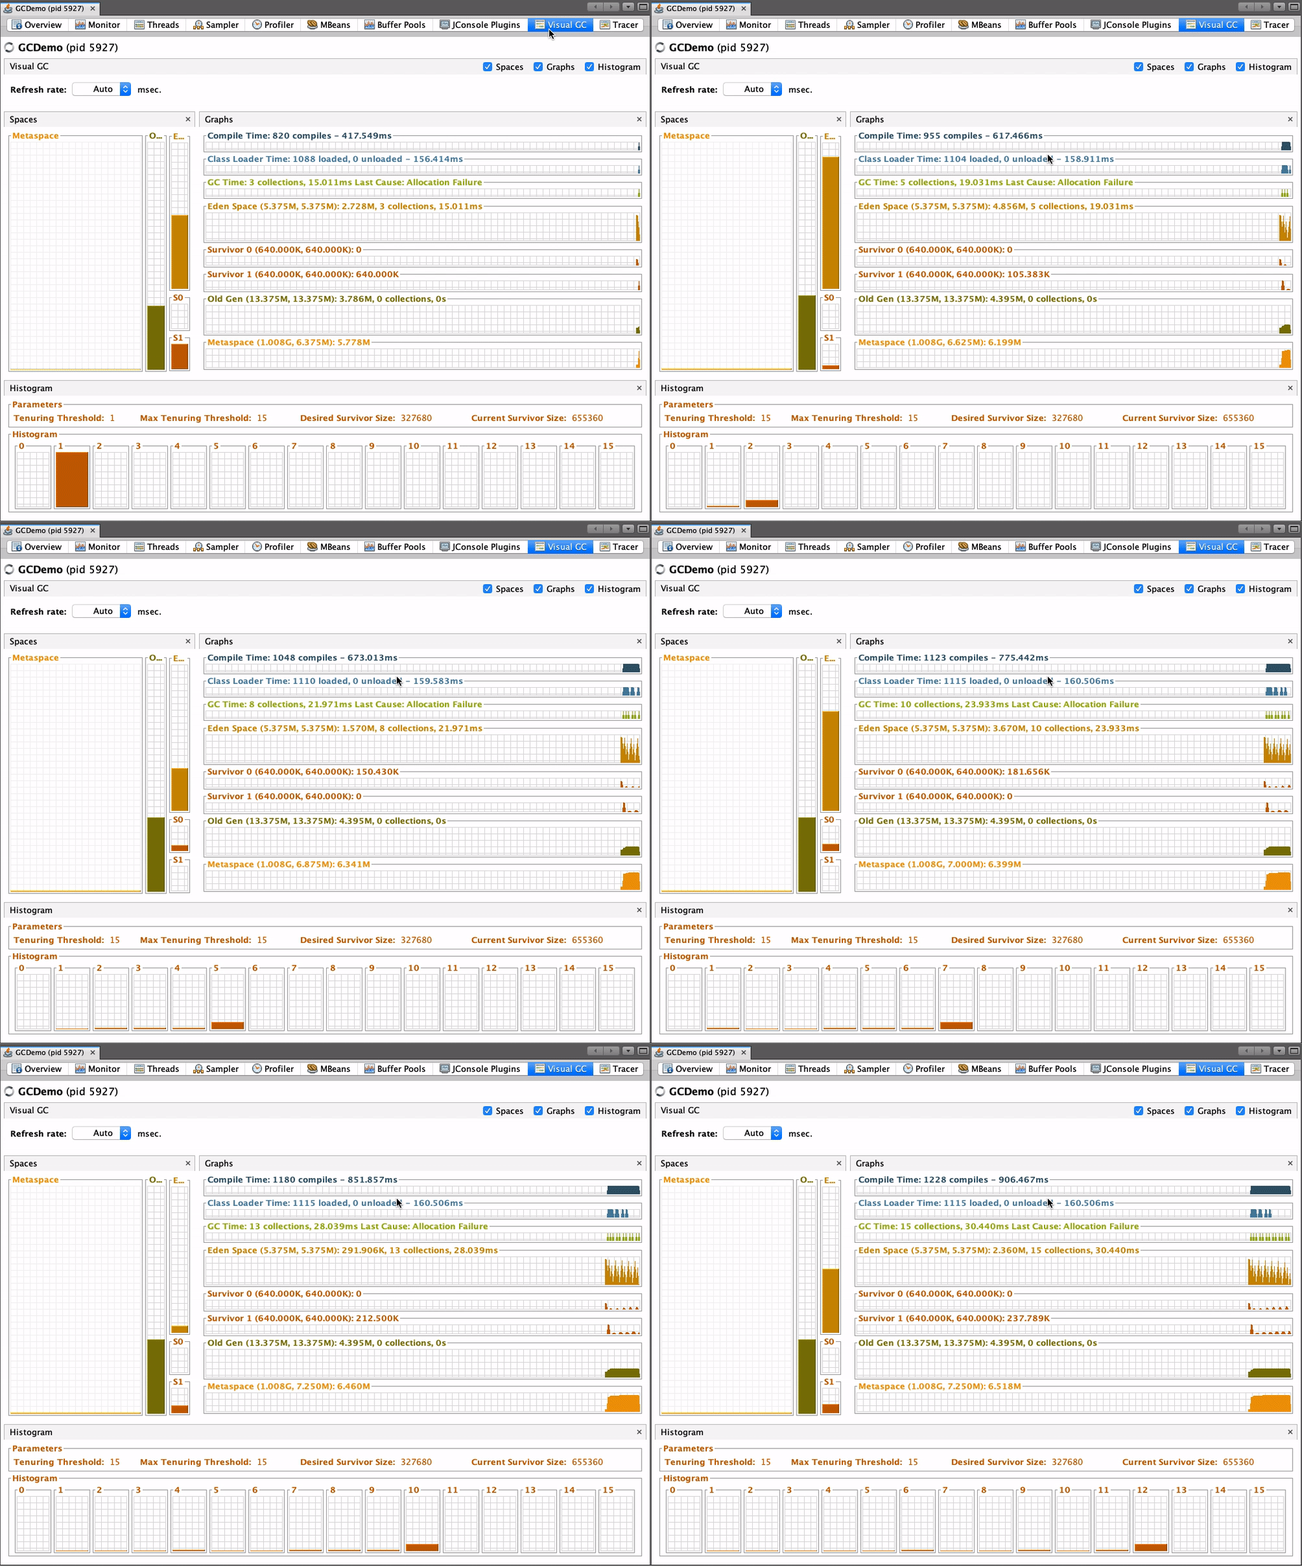
Notice the histogram section located at the bottom of the GIF. The section outlines objects in the young generation by object age. In the image above, the tenuring threshold and the max tenuring threshold that is set to 15. Notice how on every minor GC, the object’s tenuring threshold steadily increases till the object is aged and eventually promoted into the old generation.
Please take note of the “collections heading” in the Eden Space section under the graph section. On every minor GC the number of collections is incremented. This is a good way to gauge the number of minor GC tacking place. The number of Major GC’s can also be easily determined by looking at the “collections heading” in the Old Gen section. Along with the number of collections, these spaces also provide you with the total amount of time spent doing the respective GC.
The diagram below helps us visualize the Java Heap. Notice the TLAB’s and the shared memory space in Eden. Also, take note of the card table and how it helps identify portions of the old generation that need to be scanned when doing a young generation collection.
 |
|---|
| Java Heap Layout |
One of the key challenges with the old generation is tracking references from the old generation into the young generation. A divided heap necessitates the need to track higher to lower generation references, i.e. old generation reference into the young generation references. According to the weak generational hypothesis, there will be a few references from the old generation to the younger generations. One approach to track these references would be to trace the entire object graph. Tracing the complete object graph would eliminate many of the advantages provided by the generational GC approach. We thus need to narrow down the object traversal to prevent the GC cycle from having to traverse the entire object graph. Generally, a Write barrier + card-table are used to track potential old-generation to young generation references. Cards tables are populated using a write barrier. Every time an old generation object is mutated, a write barrier is used to update the card table. GC records the old to young generation references with the help of the card table. A card table is a bitmap that spans the entire old generation. When a potential young generation reference is created, the associated bit is flipped. A flipped bit indicates the need for the young generation to be scanned for potential references.
Java has a number of memory allocation spaces of which the heap is one.
 |
|---|
| Java Process Memory |
The diagram above summarizes the space occupied by a Java process. This section will provide a brief summary of non-heap memory allocation categories:
- Permanent Generation/Metaspace – Permanent Generation or PermGen was used to store class metadata up to Java 7. PermGen was a memory area that was laid out contiguously with the heap. The PermGen did not scale dynamically and thus was the root cause of many OutOfMemory exceptions in Java. In Java 8 PermGen was replaced with an area called Metaspaces. Metaspaces reside in native memory as opposed to being contiguously allocated along with the heap. Metaspaces are unbounded by default and thus can grow/shrink as needed.
- Thread Stack – Each Java thread created has its own thread stack, i.e., a separate piece of memory allocated for the thread’s needs. The thread stack contains information about methods called to reach the current execution point and all local variables associated with each of those method calls.
- Code cache – The JIT is continuously looking for optimisations. This is done by optimising frequently executed interpreted code into native code. The native code is stored in an area called code cache. The code cache can be tuned via command-line arguments. Once the code cache is full, the JIT will stop the compiler threads and will no longer optimise interpreted code.
- Buffer pools – This is a chunk of native memory allocated outside the heap. These buffers may use native OS code for I/O and are thus faster. Buffer pools are used by a number of libraries and frameworks to improve performance. Buffer pools are used to share memory between Java code and native code, or map regions of a file into memory.
- OS memory – The OS also has its own heap and stack for the Java process. This is independent of the JVM’s heap and stack. The OS also loads native libraries to drive the java process. The memory consumed by the OS is usually tiny.
The post Understanding JVM Garbage Collection – Part 3 appeared first on A Bias For Action.
]]>The Mark and Sweep algorithm is the basis for garbage collection in Java. Although the actual algorithms used by the JVM are considerably more complex, the mark and sweep algorithm forms the basis of garbage collection in the JVM and must be understood.
As you might have guessed, there are two main phases in a mark and sweep GC cycle, i.e. Mark and Sweep.
- Mark Phase – The mark phase involves tracing the entire heap for live objects. The JVM does the following during the mark phase:
- The GC holds a pointer to every object allocated on the heap, known as the “allocation list”, aka “ordinary object pointer (oop) table”. Garbage collection iterates through every pointer in the allocation list and clears the mark bit, i.e. makes them eligible for collection.
- Find all live objects by navigating from their corresponding GC root and setting the mark bit.
- Sweep Phase – The sweep phase identifies dead objects by:
- Looping through the allocation list again
- Free memory where the mark bit is clear
- Removing identified dead objects from the allocation list.[^4]
- Looping through the allocation list again
The above two phases by themselves will leave memory fragmented. In order to remove fragmentation, a number of GC algorithms have a compaction phase. This phase relocates objects, so that allocated memory is contiguous. Since objects are relocated in memory all pointers/references to that object are also updated.
 |
|---|
| Mark Sweep Compact |
The diagram above illustrates the three phase. In phase one, we allocate five objects, i.e. A, B, C, D, and E. A has a reference to B, D, and E, while B has a reference to C. Let’s assume an application threads removes the reference between A and B. When a GC cycle is triggered, the mark phase sets all the mark bits to zero. It then walks the object graph from the GC roots flipping the mark bit to 1 for all live objects. Objects with the mark bit set to zero are dead objects and must be removed. The sweep phase removes all objects with the mark bit as zero. Notice the sweep phase leaves memory fragmented. The compact phase rearranges objects so that we have contiguous free memory blocks.
A> The Mark, Sweep, and Compact phases described here are just the basics. The actual GC algorithms used by the JVM are much more complicated.[^4]
To run the garbage collection safely (without any concurrency issues) older GC algorithms stop all application threads (Stop the World Pauses) so that memory can be safely reclaimed. Thus a GC cycle does the following:
- Stops all application threads
- Runs garbage collection
- Starts all application threads again
 |
|---|
| Stop The World Pauses |
Newer GC algorithms (concurrent algorithms) employ various techniques to minimise STW GC pauses. Concurrent algorithms have managed to do most of the work concurrently but still require small GC pauses.
The above steps are a very simplistic approach to GC. GC algorithms employ various variations to the above three steps depending on what they are trying to achieve. Popular variations of these phases are:
-
Mark Sweep – This is the classic mark-and-sweep approach described above. This combination chooses to only execute the mark and sweep phase in a GC cycle. Thus dead objects are identified (mark) and removed (sweep), but memory is not compacted. Memory is recycled/reused in place. There is no memory movement to build contiguous memory blocks. The natural consequence of this approach is memory fragmentation. The CMS collector is an excellent example of a GC algorithm that only employs the mark and sweep phases. The diagram below illustrates the memory layout before and after a mark and sweep cycle. The key thing to notice is memory fragmentation after the dead objects are collected.

Mark Sweep -
Mark Sweep And Compact – This variation adds a compact phase to the classic mark-and-sweep algorithm. The GC cycle compacts memory after the sweep phase. This helps provide a contiguous free memory block for future allocations. Objects are relocated, and references are updated to build these free contiguous blocks of memory. GC algorithms employing all three phases are known as compacting collectors. The SerialGC and ParallelGC are good examples of collectors that use the Mark, Sweep, and Compact phases.

Mark Sweep Compact -
Mark and Copy aka Copying Collectors – The mark and copy is a variation of the mark, sweep and compact algorithm described above. Instead of sweeping or compacting dead objects, the algorithm copies live objects to a new area of the heap. The old area of the heap is now considered empty and can be used for future allocations. Both the mark and copy happen during the marking phase, i.e. copying live objects as they are encountered. The entire GC cycle can take place in a single tracing pass. This makes it a good fit for sparsely populated heaps. GC algorithms employing the mark and copy algorithm are known as copying collectors. The main disadvantage of a copying collector is its memory requirements. Theoretically, a copying collector requires a separate additional “to-space”, which is the same size as its “from-space”. The diagram below illustrates a copying collector’s memory layout before and after a GC cycle.

Copying Collector -
Mark and Compact aka Evacuating Collectors – The mark and compact variations omit the sweep phase. Instead of removing dead objects (sweeping) live objects are moved into a contiguous heap area aka regions. GC algorithms employing the mark and compact approach are known as evacuating collectors. This strategy seems very similar to the mark-and-copy variation. The main difference is that mark-and-copy targets a different memory region and empties the current region. The Mark and Compact target’s the same memory region. Mark-and-copy is designed to work on sparsely populated heaps. In contrast, mark-and-compact is designed to suit any kind of heap. The diagram below illustrates an evacuating collectors memory layout before and after a GC cycle.

Evacuating Collector The key thing to notice is that an evacuating collector is moving objects in the same heap area. The heap is divided into regions and objects are moved from one region to another.
The post Understanding JVM Garbage Collection (GC Mark , Sweep and Compact Basics) – Part 2 appeared first on A Bias For Action.
]]>Java was initially considered a slow language (late 90’s). That changed with the introduction of the HotSpot virtual machine in April 99. HotSpot improved performance via “just in time” compilation and adaptive optimisation. Since Apache Cassandra is written in Java, optimising Apache Cassandra requires a good understanding of the JVM’s inner workings.
The JVM is a complex application and has five critical subsystems.
-
The ClassLoader – Loads class files into the JVM.
-
The Interpreter – Executes instructions loaded via the ClassLoader.
-
JIT Compiler – Monitors the interpreter and produces optimised machine code for identified hot spots.
-
Garbage Collector – The JVM decouples application logic from memory management by providing garbage collectors. Garbage collectors track memory allocated on the heap and reclaim’s space occupied by unused objects.
-
Runtime Data Area – This holds code and application data required to execute a program.

JVM Overview
Java programs are stored in a .java file. These files are compiled into byte code using a Java compiler. Executing a Java program instructs the JVM to load all byte code associated with the program into memory via ClassLoader. The ClassLoader is responsible for loading, linking, and initialising all byte code associated with the program. The loaded classes are store in the method cache. The interpreter is responsible for compiling and executing the loaded code. The interpreter fetches instructions from the method cache. It is responsible for translating instructions in the method cache into assembly code. The generated assembly code executes on the target hardware.
To improve performance, the Just In Time (JIT) compiler continuously profiles compiled/executed code. The JIT compiler identifies frequently interpreted code, i.e., hot spots. Identified code hot spots are pre-compiled and placed in the code cache. For all future executions, the interpreter fetches the code from the code cache instead of the method cache.
The Garbage collector is responsible for allocating and deallocating dynamic memory to meet the application needs.
Due to the complex nature of the JVM, it is hard to reason about Java performance. Approach JVM performance as an experimental science.[^4]
The ClassLoader, Interpreter and the JIT Compiler are hardly ever the cause of performance problems. To tune Apache Cassandra, we need to optimise the Garbage Collector for our workload. It is the only subsystem that we can optimise. Optimising the Garbage Collector requires a deep understanding of garbage collection in the JVM.
Garbage Collection Basics
Overview
Applications have three types of memory allocations.
- Static Allocation – This type of memory is allocated at program startup and exists for the entire life of the program. Global, file scoped, and static variables come under the umbrella of statically allocated variables.
- Automatic – This type of memory is allocated upon entry into a block of code. It exists for the duration of that block. Automatic memory is essentially memory allocated on the stack.
- Dynamic Allocation – This is memory allocated by the program and exists until the program cleans it up. In Java, dynamic memory is allocated in a designated area of the application’s memory called the heap. The heap is automatically cleaned using a Garbage Collector (GC).
Languages such as C, C++ and Objective-C make memory management the responsibility of the programmer. The programmer is responsible for allocating and deallocating memory. Unfortunately, experience has shown that this approach is error-prone, complicated and expensive.
Java solves this problem by using a Garbage Collector (GC). A GC performs the following operations:
- Allocates space/memory, as requested by the application, for newly created objects.
- The GC identifies live objects, i.e., memory currently used by the application.
- The GC reclaim space occupied by dead objects, i.e., is responsible for freeing unused memory for reuse.
In Java, the GC allocates and deallocates memory on the heap. The GC keeps track of all objects allocated on the heap and automatically removes unused/dead objects. A GC is not free and comes at a cost, i.e. application pauses aka stop the world pauses. Most GC algorithms need to pause all application threads while unused objects are purged from the heap. Using a GC means that the programmer abdicates control on when memory is allocated or deallocated.
The GC is a complex piece of code that is tightly woven into the JVM. Garbage collectors have a number of responsibilities that include but not limited to:
- Determines the initial memory layout of the heap. If required, re-layouts the heap to optimise the program.
- Determines the layout of objects and their size
- Tracks objects over their lifetime
- Injects Just In Time (JIT) compilation codes
Your choice of GC has a significant impact on the performance of your application. A GC is chosen for a lifetime of a program and cannot be switched at runtime. GC is a complex topic that must be understood to tune any Java application. The JVM has numerous GC implementations with different tradeoffs. It is the implementer’s responsibility to choose the correct garbage collector for their workload. Tuning the GC necessitates understanding your workload, performance requirements and the pros and cons of the GC algorithm used.
GC Approaches
At a high level there are two main approaches to GC:
Reference Counting
Reference counting keeps a count of the number of references to an object. Object creation or referencing results in bumping up the reference count. Object dereferencing results in reducing the reference count. When the reference count reaches zero, the object is deallocated. Due to its simplicity, reference counting is used in several languages such as Python, Awk, and Perl. Reference counting’s main advantages are:
- Memory is reclaimed as soon as the object is no longer referenced by any object. Memory can be reclaimed as an object becomes garbage.
- Allocation/Deallocation costs are distributed throughout the computation.
The main disadvantages of reference counting are:
- All read and write operation comes with a reference counting overhead.
- Reference count manipulations must be atomic to prevent race conditions between objects mutating the reference count.
- Reference counting cannot reclaim cyclic data structures.
 |
|---|
| Reference Counting |
The image above illustrates the reference counting process with respect to object B. B’s reference count is bumped up as new objects refer to B. Similarly B’s reference count is bumped down as objects no longer refer to the object. Once the objects reference count is zero, the object is deallocated.
Another good way to understanding reference counting is via the Python REPL.
>>> import sys
>>> a = 'my-reference'
>>> sys.getrefcount(a)
2
>>> b = a
>>> sys.getrefcount(a)
3
>>> del b
>>> sys.getrefcount(a)
2
Python uses reference counting as one of its GC strategies. It also has a system library that enables one to access the objects current reference count. Note the sys.getrefcount will return the reference count plus one as it is also referring to the object when invoked. Observe how the reference count to objects increments when a new object refers to it. Similarly, the reference count decrements when an object reference is removed.
Tracing Garbage Collection
As opposed to reference counting tracing garbage collectors do not free memory immediately. GC is triggered when the system is running low on memory. The GC traces reachable objects starting from root objects also known as GC roots. A GC root is a pointer into a memory pool from outside that memory pool, i.e. an object that is accessible from outside the heap. In Java GC roots include, but not limited to,
- Pointers from local variables allocated on a stack.
- Pointers form the active Java thread.
- Pointers from Java native code handlers.
- Pointers from classes loaded into the system class loader.
The algorithm traces the entire object graph starting from the root nodes. Objects are marked as they are encountered. Marking is done by setting a flag on the objects or using some external data structure. After tracing is finished, all unreachable objects are known and eligible for completion. All objects that are not part of the object graph that originates from a GC root are eligible to be reclaimed to free unused memory.
A popular tracing algorithm is the Mark and Sweep algorithm.[^2]
|
|
|---|
| Tracing Garbage Collector |

The image above illustrates tracing GC at a high level. The application is paused when GC is required. The object graph from the GC root is traced. Dead objects (F) is identified and removed. The application is unpaused and continues its normal processing.
As we will discover, there are various approaches and strategies used when implementing a tracing garbage collector. At a high level, tracing garbage collectors are evaluated using the following three parameters:
- GC throughput – The amount of time the CPU spent performing GC.
- GC latency – The amount of time taken to perform individual garbage collection.
- GC footprint – The amount of memory used to execute the application.
The post Understanding JVM Garbage Collection – Part 1 appeared first on A Bias For Action.
]]>