Payout rates for a single premium immediate annuity, or SPIA, track long-term interest rates, and with the 10-year Treasury near 5% and near a one-year high, that backdrop supports firmer annuity quotes than were available two years ago. The actual monthly figure depends on your age, sex, state, and payout option, so a licensed agent should provide a specific number rather than a national average.
A revenue shortfall is eclipsing a quarter of strong subscriber gains at Verizon Communications (NYSE:VZ), and the market is siding with the top line. Verizon stock is at $42.72, down 4% in early trading. That decline puts the revenue line ahead of the customer count after the carrier’s Q3 2026 report, a reaction that mutes results that otherwise delivered the subscriber growth and the higher full-year targets Verizon has been chasing.
Sector-wide weakness is far softer by comparison. The Communication Services Select Sector SPDR ETF (NYSEARCA:XLC) is at $104.60, down 0.9%, though the fund leans heavily toward large internet and media companies, so its move offers sector context and says little about any single carrier. At the same time, the SPDR S&P 500 ETF Trust (NYSEARCA:SPY) is at $761.99, up 0.3%, leaving Verizon stock falling far harder than either fund.
Meanwhile, AT&T (NYSE:T) stock is at $20.95, up 0.1%, holding steady against the slide in Verizon stock. T-Mobile (NASDAQ:TMUS) shares are at $145.91, down 0.4%, a far smaller dip than the drop in Verizon stock. Steady trading in both rival stocks marks the selloff in Verizon shares as company-specific and puts the focus on Verizon’s own quarter.
Revenue Miss Overshadows Verizon’s Subscriber Surge
Verizon reported third-quarter results before the market opened, with adjusted earnings per share beating analyst estimates while revenue fell short of the consensus. Growth in Verizon’s subscriber base was the clear strong, as the company posted its strongest third-quarter postpaid phone additions in five years and its best haul of postpaid accounts in more than a decade.
Management also raised the full-year outlook for both adjusted earnings per share and postpaid phone net additions, which marks Verizon’s third consecutive quarterly guidance increase.
AT&T and T-Mobile Hold Firm as Verizon Slides

Still, Verizon stock is sliding on the revenue shortfall despite the subscriber gains and the higher targets. Customer-first offerings and an expanded loyalty program get the credit from Verizon for those gains, as the carrier steers away from heavy device subsidies to win and keep postpaid customers. Without visible revenue acceleration, that strategy faces a tougher reception from the market than the subscriber figures alone would suggest.
AT&T, T-Mobile and Verizon compete for postpaid customers, yet both rivals are barely moving. AT&T beat estimates and raised its outlook, though bears flag a Mexico impairment. T-Mobile lifted cash flow guidance, though shares sit below summer levels.
What the Revenue Miss Means for Verizon
Verizon must now show its subscriber gains can drive faster revenue growth in the coming quarters. Management’s raised outlook for earnings and phone additions gives the company room to make that case, though the top line now carries the burden of proof. Trends in Verizon’s service revenue may decide how Verizon stock trades from here.
Subscriber momentum and a string of guidance increases give optimists evidence that Verizon’s customer-first strategy is gaining traction. Skeptics focus on the revenue shortfall itself, which suggests subscriber wins alone haven’t yet satisfied Wall Street’s expectations for the top line. Both readings hold merit, and the decline in Verizon stock shows the skeptical view has the upper hand.

The question for shareholders is whether new-account momentum shows up in service revenue when Verizon next reports. Keeping one’s VZ stock exposure smaller is a prudent policy until Verizon’s revenue outlook resolves.
The post Verizon Falls 4% as Revenue Miss Overshadows Raised Outlook; AT&T and T-Mobile Hold Steady appeared first on 24/7 Wall St..
]]>Verizon (NYSE:VZ) and AT&T (NYSE:T) both raised guidance in their latest earnings reports. Retirees, however, get very different checks. Verizon offers a forward yield near 6.26% and keeps raising it. AT&T yields about 4.88% on a payout frozen since its 2022 cut. Income durability now matters more than headline yield.
Verizon Raises the Check While AT&T Holds It Flat
Verizon raised its quarterly dividend to $0.7075 from $0.69 this year, extending a record that began at $0.565 in 2016. That steady ladder helps a retiree keep pace with inflation.
AT&T paid $0.52 per quarter until early 2022, then cut to $0.2775, where it has stayed. Management plans to hold $1.11 annualized through 2028. Predictable, yes. Yet a flat check loses purchasing power every year.
| Income Lens | Verizon | AT&T |
|---|---|---|
| Quarterly Dividend | $0.7075 | $0.2775 |
| Forward Yield | 6.26% | 4.88% |
| Track Record | 19 consecutive yearly raises | Flat since 2022 cut |
| Leverage | 2.5x | 3.13x |
| 2026 Free Cash Flow Outlook | $21.94B to $22.14B | $18B+ |

Fewer Subsidies Fund Verizon’s Payout
Verizon paid $5.9 billion in first-half dividends against $10.2 billion of free cash flow, about 58% of free cash flow. The source is operational: equipment revenue fell nearly 20% as subsidies shrank, while EBITDA margin hit 40.1%. Customers still came, with 184,000 postpaid phone net adds. Management summed it up: “We’re growing our dividend, and we are paying down our debt.”
AT&T’s dividend used about 40% of third-quarter free cash flow, a smaller load. The pressure sits elsewhere. AT&T targets ~$10B of 2026 buybacks and $23-24B of capex, and leverage rose after the $23 billion EchoStar (NASDAQ:SATS) spectrum purchase. The growth engine works: a record 769,000 Advanced Connectivity internet net adds and fiber reaching 39M+ locations.


Verizon’s Upcoming Report Tests the Momentum
Verizon reports again soon, and I’ll focus on fixed wireless, where net adds fell 30.6%. Account revenue also slipped 1.4%, a crack worth monitoring. For AT&T, Barron’s highlighted Starlink fears weighing on shares, and fiber ARPU dropped 4%. Deleveraging back to 2.5x does not arrive until 2029.
Why Verizon’s Income Profile Stands Out for Retirees
For income investors, Verizon holds the edge on the data in this comparison: a higher yield, a payout that still increases, lower leverage, and comfortable cash coverage built on cheaper customer acquisition. That edge would weaken if leverage falls short of the 2027 target range or subscriber gains stall without subsidies. Total-return investors who value heavy buybacks and fiber expansion may prefer AT&T and its $24B+ repurchase plan through 2028. Retirees leaning on these checks should think in ladder terms rather than single names, the approach we laid out in a free guide on building lifetime income without selling shares: here.
The post AT&T Froze Its Dividend After a 2022 Cut. Is Verizon the Better Income Stock? appeared first on 24/7 Wall St..
]]>A report that SpaceX (NASDAQ:SPCX) wants access to 80,000 U.S. cell sites is hitting every major national wireless carrier at once. Shares of T-Mobile (NASDAQ:TMUS) fell 5% to $150.74 during morning trading, a sign of how directly the SpaceX threat lands on its wireless business.
Meanwhile, AT&T (NYSE:T) stock is down 4% to $21.79, a smaller decline that still tracks T-Mobile’s slide. Verizon Communications (NYSE:VZ) stock is trading at $43.70, down 3%, the most resilient of the national carriers.
Losses in the carriers are weighing on the sector fund that holds each of them. The Communication Services Select Sector SPDR ETF (NYSEARCA:XLC) is down 1% to $105.94; for broad-market context, the SPDR S&P 500 ETF Trust (NYSEARCA:SPY) is down 0.5% to $759.90.
Bloomberg Report Puts a Fourth Carrier in Play
Bloomberg reported, citing people familiar with the matter, that SpaceX is in talks with at least one major cell tower owner to secure access to a large network of U.S. cell sites. Such a deal would move SpaceX a step closer to building a fourth nationwide wireless carrier to take on AT&T, Verizon and T-Mobile in their home market. Starlink already serves over 13.6 million consumer subscribers worldwide, giving SpaceX an existing customer base to build from.
SpaceX laid the groundwork earlier this month by agreeing to acquire nationwide 800 MHz spectrum licenses to advance its Starlink Mobile strategy. When that agreement emerged, AT&T, T-Mobile and Verizon shares landed among the S&P 500’s top decliners. The tower talks would fill a separate gap, pairing that spectrum with the ground infrastructure a terrestrial carrier needs.
(we broke down why the tower owners come out ahead no matter which carrier wins this fight in a free report: SpaceX Is Coming for the Phone Companies, but the Tower Owners Win Either Way)
Why AT&T, Verizon and T-Mobile Are Falling Together
National networks at AT&T, Verizon and T-Mobile run on leased tower space, and each carrier makes recurring revenue from phone plans. Starlink delivers connectivity from satellites in orbit, so tower access would give SpaceX the ground-level footprint that space-based service lacks on its own. Adding towers to satellites and spectrum points to a fourth national competitor, which is why the three stocks are moving as a block.
A new nationwide rival would chase the same subscribers that AT&T, Verizon and T-Mobile already serve. That pressure on pricing and churn forms the bear case. Scale anchors the bull case, since AT&T runs its low-band spectrum on indoor building systems in high rises, hospitals and stadiums as well as on macro sites, a reach a newcomer would need years to duplicate.
AT&T CEO John Stankey has downplayed the spectrum threat, saying, “I wouldn’t over rotate on what I would call one carrier of low band spectrum.” Verizon CEO Dan Schulman has argued that satellites face hard limits in dense markets, stating, “It is basically not possible because of physics, not because of execution but because of physics for satellite to effectively compete against the terrestrial network in either mobility or broadband in urban and suburban geographies.” Tower access is exactly the piece that would help SpaceX work around that physical constraint.
T-Mobile’s position carries a twist, since the company already has a direct-to-cell partnership with Starlink. Chief executive Srini Gopalan has described direct-to-cell as “a technology that, in many ways, we worked with Starlink to invent,” and he’s also labeled it “a complementary category.” Those existing ties haven’t spared T-Mobile stock from the steepest drop in the sector.
Signed Tower Leases Would Raise the Stakes for Carriers
The next test for AT&T, Verizon and T-Mobile is whether SpaceX turns the talks into signed tower leases. A finished agreement would give SpaceX a ground network to pair with its satellites and spectrum, strengthening its case as a fourth carrier. Whether the Communication Services Select Sector SPDR ETF keeps trailing the SPDR S&P 500 ETF Trust is worth watching as the carriers digest the report.
SpaceX expects its spectrum purchase to close in the first half of 2027, giving AT&T, Verizon and T-Mobile a defined window before that piece is in place. Position sizes should stay modest until the outcome of SpaceX’s tower talks resolves.
The post Telecom Stocks Fall as SpaceX Eyes 80,000 Cell Sites: T-Mobile Sinks 5%, AT&T Drops 4%, Verizon Slides 3% appeared first on 24/7 Wall St..
]]>Bloomberg News reported on October 22, 2026, that SpaceX (NASDAQ:SPCX) is in talks for access to about 80,000 U.S. cell sites to build a fourth nationwide wireless carrier. That is roughly half of the 158,500 purpose-built towers operating in the U.S. last year.
| Stock | Oct. 22 Close | Session | Market Value | After Hours (7:59 p.m. ET) |
|---|---|---|---|---|
| Crown Castle | $78.83 | 0.23% | $33.54 billion | $86.29 (9.46%) |
| American Tower | $181.57 | 2.21% | $84.60 billion | $189.35 (4.28%) |
| Verizon | $45.20 | 3.76% | $187.80 billion | $43.51 (-3.74%) |
| AT&T | $22.74 | 3.79% | $153.19 billion | $21.99 (-3.30%) |
| T-Mobile | $158.79 | 3.28% | $170.33 billion | $151.91 (-4.33%) |
| SpaceX | $144.75 | -9.14% | $1.97 trillion | $146.44 (1.17%) |
After the close, Crown Castle (NYSE:CCI) and American Tower (NYSE:AMT) rose, while Verizon (NYSE:VZ), AT&T (NYSE:T) and T-Mobile (NASDAQ:TMUS) gave back their regular-session gains. SpaceX edged up after a steep daytime drop, which suggests investors had already priced in the news. After-hours trading is thin, and these moves can reverse at the open on October 23.
Only the Spectrum Deal Is Signed
No tower lease has been signed. The report relies on unnamed sources; SpaceX has not commented, and Crown Castle has not confirmed any SpaceX deal. The potential leases reportedly could run into the billions of dollars.
On October 8, SpaceX agreed to buy Grain Management’s portfolio, which includes 14 MHz of paired nationwide 800 MHz spectrum. The deal is expected to close in the first half of 2027, pending regulatory approval. Neither company disclosed a price, but reports put it at about $8 billion.
Elon Musk said, “This is the last critical piece of the spectrum puzzle needed for SpaceX.” Spectrum still needs towers.
Crown Castle Has the Most to Gain
Crown Castle owns about 40,000 U.S. towers, and T-Mobile, AT&T and Verizon supply 93% of its site rental revenue. A fourth large tenant would reduce that dependence for a stock that is down 15.16% over one year and 43.67% over five.
On October 21, Crown Castle’s chief executive said the company is “talking to all parties” but declined to discuss specific customers.
American Tower owns about 42,000 U.S. towers out of more than 148,000 sites worldwide, and it also runs CoreSite data centers. A SpaceX lease would therefore be a smaller share of its business. Its shares are down 24.87% over five years.
The carriers face pricing pressure, customer losses and higher network spending. AT&T fell 6.5% after its October 21 report even though it beat revenue estimates and raised its outlook. Scotiabank cut its T-Mobile target to $212 from $217. T-Mobile is down 20.08% year to date, while Verizon is up 18.54%.
Why the After-Hours Rally Could Fade
TD Cowen estimates that a nationwide terrestrial network would cost more than $80 billion and take many years to build. On October 20, SpaceX also said it plans to put Starlink towers on real estate from existing Starlink facilities, which could reduce how many towers it leases.
DISH, the last company to try to become a fourth carrier, walked away from its towers, and that will cut Crown Castle’s 2026 site rental billings by $220 million. Musk sees “a clear path to several hundred billion dollars a year in connectivity revenue,” but SpaceX’s connectivity unit brought in $5.20 billion in the third quarter.
What Crown Castle’s After-Hours Jump Is Pricing In
At $86.29, Crown Castle is pricing in a tenant that has signed nothing. It also carries net debt of 6.5x annualized adjusted EBITDA, a measure of cash earnings.
TD Cowen raised its target to $98 from $92, while BMO cut its target to $91 from $93.
American Tower carries less risk from these talks. It would collect rent if SpaceX leases towers, and its international towers and data centers would buffer the stock if the talks fail.
The test is a filing that discloses a signed SpaceX master lease, meaning a contract that covers many sites. Without one, expect Crown Castle to drift back toward its $78.83 close. Listen for SpaceX questions on Verizon’s October 26 call, American Tower’s October 27 call, and T-Mobile’s October 28 call.
The post SpaceX Is Coming for the Phone Companies, but the Tower Owners Win Either Way appeared first on 24/7 Wall St..
]]>For retirees without a paycheck, a portfolio comes down to one number: how much cash lands in the checking account each month. A pension and Social Security rarely cover every bill. Selling shares in a down market to pay for groceries turns paper losses into permanent ones, which is why so many retirees build an income layer that pays out no matter what the market does.
High-yield dividend payers can provide that layer. Splitting $75,000 evenly across six income names, or $12,500 in each, would yield more than $10,000 a year at current prices and payout levels. A $12,500 stake in each of these six high-yield names would produce the following, counting down from the lowest payout rate to the highest.
A note on conventions: the two operating companies, the business development company (BDC), and the closed-end fund, are shown using forward yield or distribution rate based on the most recently announced payout. The two covered-call exchange-traded notes (ETNs) pay a different amount every month, so their figures use trailing 12-month distributions, since annualizing a single month would give a misleading number.
AT&T
- Yield (forward): 4.85%
- Shares for $12,500: 545.85
- Annual Passive Income: ~$605.90
AT&T (NYSE:T) sells wireless and broadband service to consumers and businesses. In Q2, Mobility service revenue reached $17.4 billion and Consumer Wireline broadband revenue rose 27.3% to $2.93 billion. The company also added 432K postpaid phones and 646K internet customers. The yield is high because this is a mature carrier with heavy spending needs (capex guidance of $23 billion to $24 billion) and $144 billion in total debt, so the market prices it for income. The shares have fallen 11.03% over the past month.
On safety, the quarterly payout has held at $0.2775 since 2022. Against 2026 adjusted EPS guidance of $2.25 to $2.35, the $1.11 annual dividend works out to a payout ratio of 47% to 49%. Free cash flow guidance of over $18 billion also covers about $10 billion in planned 2026 buybacks. On October 6, 2026, AT&T announced a new fiber joint venture with Global Infrastructure Partners and CPP Investments.
Main Street Capital
- Yield (forward, regular monthly dividends only): 5.93%
- Shares for $12,500: 233.12
- Annual Passive Income: ~$741.33
Main Street Capital (NYSE:MAIN) provides customized debt and equity financing to lower middle-market businesses in manufacturing, healthcare, and business services. As a BDC, it passes most of its taxable income through to shareholders, which is the key source of the yield. It pays a regular monthly dividend of $0.265 and adds quarterly supplements of $0.30. Those supplements are left out of the forward figure above, which helps explain why trailing 12-month payouts come to $4.33.
For coverage, Q2 adjusted EPS of $1.04 beat estimates of $0.957, and net investment income covers the regular dividend well. Non-accruals stood at 1.1% of the portfolio at fair value, and NAV rose to $33.92 per share. The regular monthly dividend has been raised 12 times since Q4 2021.
Altria
- Yield (forward): 6.19%
- Shares for $12,500: 174.36
- Annual Passive Income: ~$774.17
Altria (NYSE:MO) owns Marlboro, which held a 39.5% retail share in Q2. This ultra-high-yield tobacco company is a mature cash generator: volumes are shrinking, but pricing power allows it to send most of its free cash flow to shareholders. In August, it raised the quarterly dividend to $1.11 from $1.06.
Against 2026 adjusted EPS guidance of $5.61 to $5.72, the $4.44 forward dividend uses 78% to 79% of earnings. Altria returned about $3.9 billion to shareholders in the first half of 2026. Weak spots include Oral Tobacco revenue, which fell 5.2%, and a Marlboro share that slipped 1.5 points.
Herzfeld Credit Income Fund
- Distribution Rate (forward): 13.62%
- Shares for $12,500: 834.45
- Annual Passive Income: ~$1,702.27
This closed-end fund was once the Herzfeld Caribbean Basin Fund. Herzfeld Credit Income Fund (NASDAQ:HERZ) has since shifted to instruments. It pays $0.17 per month. CEFs can reach double-digit distribution rates by using leverage and by setting managed distributions, which can include return of capital. Any return of capital is the investor’s own money coming back and should not be treated as income. The fund’s Section 19(a) notices show how each payment breaks down.
No net investment income coverage figure is available, so this payout carries the most uncertainty among the non-ETN holdings. The share price has fallen 28.27% year to date.
ETRACS Gold Shares Covered Call ETNs
- Distribution Rate (trailing 12-month): 27.15%
- Shares for $12,500: 88.87
- Annual Passive Income: ~$3,393.28
ETRACS Gold Shares Covered Call ETNs (NASDAQ:GLDI) is an exchange-traded note that tracks a strategy of holding SPDR Gold Shares and writing monthly calls against that position. Credit Suisse originally issued the notes, and UBS now holds them as senior unsecured obligations, meaning holders take on UBS issuer credit risk. Option premiums fund the monthly coupons, which is why the distribution rate is so high. Writing calls also caps how much the notes can gain when gold rallies, and distributions can include return of principal.
Since earnings don’t back the distributions, the key safety question is how much they change. Over the past year, payments ranged from $1.5878 to $5.5594. Annualizing the latest $1.9854 payment gives $23.8248, well below the trailing $38.1812.
ETRACS Crude Oil Shares Covered Call ETNs
- Distribution Rate (trailing 12-month): 51.81%
- Shares for $12,500: 270.04
- Annual Passive Income: ~$6,476.26
ETRACS Crude Oil Shares Covered Call ETNs (NASDAQ: USOI) follows the same playbook as GLDI, applied to the United States Oil Fund, and is also a UBS obligation. Volatile crude prices have produced large option premiums, and the notes have gained 50.08% year-to-date. Distributions are variable and can include return of principal.
Monthly payments swung from $0.4265 in January 2026 to $7.4743 in April. The next payment is $3.1386 on October 26. In late 2025, monthly payments fell below $1, showing how quickly this income can shrink as oil volatility fades.
Six Positions Side by Side
| Name | Rate Annual | Annual Dividend Income |
|---|---|---|
| AT&T | 4.85% | $605.90 |
| Main Street Capital | 5.93% | $741.33 |
| Altria | 6.19% | $774.17 |
| Herzfeld Credit Income Fund | 13.62% | $1,702.27 |
| ETRACS Gold Covered Call ETNs | 27.15% | $3,393.28 |
| ETRACS Crude Oil Covered Call ETNs | 51.81% | $6,476.26 |
| Total | 18.26% | $13,693.20 |
Combined, these six positions produce $13,693.20 of income per year on a $75,000 investment, a blended yield of 18.26%. USOI contributes $6,476.26, GLDI adds $3,393.28, Herzfeld adds $1,702.27, Altria adds $774.17, Main Street adds $741.33, and AT&T supplies $605.90. The two ETNs provide most of that total, so the margin above $10,000 acts as a buffer for the months when option premiums shrink.
You can adjust a portfolio like this at any point. You can move income that runs ahead of spending needs into steadier payers, and sell a position that stops pulling its weight in a single trading session. That flexibility lets you adapt your income plan as your retirement changes, without being locked into one fixed allocation.
The post How to Turn a $75,000 Investment into $10,000 in Yearly Passive Income appeared first on 24/7 Wall St..
]]>Verizon (NYSE:VZ) reports third-quarter results on October 26, days after SpaceX (NASDAQ:SPCX) announced a roughly $8 billion deal for nationwide 800 MHz spectrum. I think the deal makes this report more important. It shows how much momentum Verizon carries into a harder fight.
A Turnaround Faces Its First Real Test
Last quarter, Verizon posted adjusted EPS of $1.30 against a $1.27 consensus, its sixth straight beat. Revenue slipped 0.7% to $34.25 billion as equipment revenue fell nearly 20%, a deliberate pullback on subsidies. The core business strengthened: 184,000 postpaid phone net adds, churn down to 0.92%, and a record 40.1% adjusted EBITDA margin.
Management raised full-year adjusted EPS guidance to $4.99 to $5.04 and lifted the buyback target to up to $4.5 billion. Shares are up 16.94% year to date but down 4.89% over the past month. SpaceX’s spectrum announcement put Verizon, AT&T (NYSE:T), and T-Mobile (NASDAQ:TMUS) among the top decliners in the S&P 500 the day it landed.
Consensus Calls for Steady Growth
| Metric | Consensus | Prior Year | YoY Growth |
|---|---|---|---|
| Q3 2026 EPS | $1.2743 | $1.21 | 5.31% |
| Q3 2026 Revenue | $34.85 billion | $33.82 billion | 3.05% |
| FY 2026 EPS | $5.0179 | $4.71 | 6.54% |
| FY 2026 Revenue | $140.80 billion | $138.19 billion | 1.89% |
The Q3 EPS consensus has moved lower from $1.2925 90 days ago.
Service Revenue and Churn Will Answer the Starlink Question
Management guided mobility and broadband service revenue growth to approach 3% in Q3 and reach approximately 4% in Q4. I’ll be watching that number first. Hitting it would show the subsidy-light Simplicity and Verizon One strategy can grow revenue while maintaining price.
Churn comes next. Consumer postpaid phone churn fell to 84 basis points, which management called “a step change for Verizon.” For comparison, Q3 2025 delivered just 36,000 postpaid net adds with churn of 0.98%. You should look at whether retention holds now that a deep-pocketed entrant has a credible path into U.S. mobile.
The spectrum deal should close in the first half of 2027, and SpaceX plans to turn on service in early 2028. SpaceX said the spectrum could make Starlink Mobile “a major mobile carrier in the U.S.” In July, Verizon estimated satellite’s U.S. addressable market at 6 million to 8 million homes, mostly rural. I want to hear whether that framing changes now that SpaceX holds low-band spectrum built for indoor coverage.
Finally, AI Connect. The Google (NASDAQ:GOOGL) dark fiber agreement is valued at over $1 billion, and management flagged more deals by year-end.
Verizon Needs Proof Before Starlink Arrives
SpaceX’s threat is real, yet it sits more than a year away. That makes this report Verizon’s chance to show that lower churn, combined bundles, and Frontier’s fiber build a moat before a new carrier shows up. If service revenue speeds up and churn holds, Verizon heads into 2027 with its pricing power intact. If either slips, the market will treat it as early erosion, and the Starlink story will start to drive the stock.
The post Does SpaceX’s $8 Billion Spectrum Deal Mean Verizon’s Q3 Earnings Don’t Really Matter? appeared first on 24/7 Wall St..
]]>A dividend check is only as reliable as the cash behind it. The screen used here is simple: compare what a company actually brings in (free cash flow for ordinary businesses, funds from operations for REITs) with what it pays out, then check whether debt is filling the gap. That matters most to retired people who spend the income. Hospital landlord Medical Properties Trust (NYSE: MPT) now yields about 13.7% after its shares fell 44.05% this year. A yield that high often means the market is pricing in risk, and the stock may not be a bargain.
The quick test: a dividend starts to look unsustainable when the right cash measure only covers it, when free cash flow is shrinking, or when rising debt is quietly paying for the dividend alongside buybacks and deals (we laid out the full set of signals that a high yield is about to be cut in a free report on dividend traps).
Medical Properties Trust: A 13% Yield Built on a Collapsing Share Price
Medical Properties Trust owns hospitals and rents them to operators in the U.S., the U.K. and Europe. It now trades under the ticker MPT. It pays $0.09 per quarter, or $0.36 per year, while the stock trades at $2.63.
That yield is high because the price collapsed. The payout itself has not grown much. Shares are down 27.95% in a month and 80.22% over five years. For a REIT, normalized FFO is the right coverage test, and second-quarter NFFO of $0.15 per share puts the payout ratio near 60%. The balance sheet shows the stress.
Adjusted net debt runs 8.9x EBITDAre, interest coverage is just 1.9x, and the company refinanced with $2.4 billion of secured notes at 9.25%. Its weighted-average debt rate is 5.369%. Recovery from the Prospect Medical bankruptcy is still uncertain. This REIT already cut its dividend from $0.29 in 2023 to $0.08 in 2024.
Management raised the payout to $0.09 and says it is focused on debt. At the time of the filing, chief executive Edward K. Aldag, Jr., said, “We continue to take decisive steps to strengthen our balance sheet through our refinancing transactions and strategic asset sales.” For the dividend to hold, transition tenants need to lift annualized cash rent to $1 billion by year-end, and the asset sales need to close.
AT&T: Buybacks and Spectrum Eat Most of the Free Cash Flow
AT&T (NYSE: T) pays $0.2775 per share quarterly, which works out to a yield of about 5.0% at $22.08. The dividend has stayed flat since April 2022, when it was cut from $0.52.
On earnings, coverage is comfortable: the dividend is roughly 46% of the raised adjusted EPS guidance of about $2.40. The cash picture is tighter. Third-quarter free cash flow of $4.95 billion fell 5.9% year over year. The dividend costs about $7.6 billion a year, and adding the roughly $10 billion in planned 2026 buybacks brings shareholder payouts to about $17.6 billion. Full-year free cash flow guidance is $18 billion+, so almost nothing is left over. Meanwhile, net debt to adjusted EBITDA rose to 3.13x from 2.68x after the EchoStar spectrum deal. Shares fell 12.17% over the past month as fears about Starlink overshadowed earnings.
Management guides for the dividend to stay at its current level through 2028, with free cash flow climbing to $21 billion+ by then. Buybacks are the flexible piece, so the board can slow them before it has to touch the dividend.
Verizon: Frontier Deal Pushes Leverage Higher Behind a 6% Yield
Telecom giant Verizon (NYSE: VZ) pays $0.7075 quarterly, up from $0.69 earlier this year, for a yield of about 6.4%. Its dividend records show a long run of step-up increases.
On paper, coverage is solid. The dividend costs about $11.76 billion a year, against 2026 free cash flow guidance of $21.94 billion to $22.14 billion, and it takes about 57% of the low end of adjusted EPS guidance. Leverage is the warning sign. Net unsecured debt to adjusted EBITDA rose to 2.5x from 2.2x at year-end 2025 after the Frontier Communications deal closed, and unsecured debt totals $136.5 billion. Add buybacks of up to $4.5 billion, and cash going to shareholders reaches about $16.26 billion before paying down any debt. Second-quarter revenue fell 0.7%.
The counter-case is strong. Second-quarter free cash flow grew 27.1%, and the stock is up 15.12% this year, so this yield comes from the payout, not from a falling price.
W. P. Carey: A Reset Dividend Still Exposed to Tenant Credit
W. P. Carey (NYSE: WPC), a diversified net-lease REIT, pays $0.95 quarterly. That is a forward yield of about 6.1% at $62.57.
For a REIT, AFFO is the right measure, because EPS is distorted by depreciation. Full-year AFFO guidance of $5.19 to $5.27 per share means a payout of about 73% at the low end. The warning signs are history and credit. The dividend was cut from $1.14 to $0.86 in late 2023 after the office spinoff. Second-quarter impairments reached $79.4 million, and European same-store rents fell 2.6% in constant currency.
This is the best bull case on the list: occupancy is 98.5%, and 95% of debt is fixed-rate at a weighted 3.2%.
What Income Investors Holding These Should Watch
Each quarter, check the coverage measure that fits each company: NFFO for Medical Properties Trust, AFFO for W. P. Carey, and free cash flow after buybacks for AT&T and Verizon. Track leverage against what each company has promised. A missed deleveraging target is usually the first crack. When a cut does come, it usually drags the share price down, so a high yield alone isn’t enough reason to invest.
The post Are Your Dividends Safe? 4 Payouts the Cash Flow No Longer Covers appeared first on 24/7 Wall St..
]]>A quarter that topped forecasts and lifted the profit outlook isn’t protecting AT&T (NYSE:T), whose shares are falling harder than those of its biggest wireless rivals. AT&T stock is at $22.35, down 5%, a slide that shows sellers looking straight past the headline beat. That reaction runs against the usual script for a report that beats on revenue and raises guidance.
Selling stretches across the national carrier group, with Verizon Communications (NYSE:VZ) and T-Mobile (NASDAQ:TMUS) shares also trading lower. Specifically, Verizon stock is at $43.12, down 3%, a softer decline than the one hitting AT&T. T-Mobile stock is at $152.92, also down 3% and tracking Verizon closely.
Telecom weakness also registers in the Communication Services Select Sector SPDR ETF (NYSEARCA:XLC), which is at $109.08, down 1%. Advertising-driven businesses carry the most weight in that fund, so its dip works as sector context and says little about AT&T in particular. The SPDR S&P 500 ETF Trust (NYSEARCA:SPY) is at $771.34, up 0.3%, so the broad market is holding firm while carriers fall.
Beat and Raise Collide With a Mexico Write-Down
AT&T released its Q3 2026 results before the opening bell, with revenue of $32.3 billion and adjusted earnings per share both topping analysts’ expectations. AT&T also raised its full-year adjusted earnings per share outlook and trimmed its long-term capital investment plans. Chief executive John Stankey stated, “We are growing valuable customer relationships as more homes and businesses choose AT&T for all their advanced connectivity needs across both internet and on-the-go wireless.”

Beneath the headline beat, AT&T’s reported earnings per share landed far below its adjusted figure because of a non-cash impairment tied to its Mexico wireless business. Earlier this month, AT&T agreed to sell that operation, so the charge reflects a unit already headed out the door, and while such a charge leaves cash intact, the gap between reported and adjusted profit hands the quarter a messier headline than the beat alone would suggest.
AT&T’s Fiber Bundle Sets It Apart From Verizon and T-Mobile
Carrier stocks face a fresh competitive question after a very different kind of rival stepped toward the wireless market. SpaceX (NASDAQ:SPCX) agreed to buy a nationwide spectrum portfolio from Grain Management, subject to Federal Communications Commission approval. That spectrum, SpaceX stated, will help its Starlink Mobile service become a major mobile carrier in the U.S.
AT&T pairs its fiber home internet business with mobile service, while Verizon and T-Mobile lean more heavily on wireless, and this mix means a satellite-based rival reaches AT&T, Verizon and T-Mobile in different ways. On paper, the fiber bundle gives AT&T a home connection that a phone service can’t easily replace.
Even with that fiber anchor, AT&T shares are absorbing a bigger loss than either Verizon or T-Mobile stock. One upside case rests on the revenue beat, the higher profit outlook and a lower long-term spending plan. Weighing against AT&T are the impairment-driven gap in reported profit and a share price falling even after a stronger quarter.
Spectrum Ruling Shapes AT&T’s Next Move
The next test for AT&T is whether the Federal Communications Commission approves the SpaceX spectrum purchase. A ruling in favor would clarify how quickly Starlink Mobile can push into a market that AT&T, Verizon and T-Mobile already serve.
AT&T now carries a quarter that strengthened its profit outlook alongside a regulatory uncertainty that could reshape competition in its core wireless market. Its fiber footprint remains its main defense. Investors weighing their exposure should adjust their holdings carefully given that AT&T shares are earning little credit for the higher forecast.
The post AT&T Sinks 5% Despite Q3 Beat and Raised Outlook; Verizon and T-Mobile Drop 3% appeared first on 24/7 Wall St..
]]>IonQ (NYSE:IONQ) and D-Wave Quantum (NYSE:QBTS) reported second-quarter results one day apart in August. The two reports reflect different hardware strategies. IonQ’s revenue jumped on the back of a broad trapped-ion platform. D-Wave signed large annealing deals that have not reached its income statement yet. With both stocks down sharply this year, the hardware each company chose now influences the investment case.
Trapped Ions Bring In Revenue While Annealing Piles Up Bookings
IonQ’s revenue rose 286.8% to $80.05M, beating the $66.42M consensus. Acquisitions account for part of that jump, but organic growth of 132% shows the core business is still growing fast. Customers buy Tempo systems, ClavisXG Multiplex encryption, sensing gear and space terminals, and multi-product sales made up about 25% of revenue. Management summed up its view: “Our conviction is that quantum, like classical before it, ultimately scales on a semiconductor foundation.”
D-Wave brought in $3.08M in revenue, missing the $4.03M estimate. Bookings look much better. First-half bookings reached $35.5M, up from $2.9M, and that includes a $20 million system sold to Florida Atlantic University. AT&T (NYSE:T) used annealing to cut a network optimization job from 1 hour to under 15 seconds. Chief Executive Alan Baratz said “only our annealing systems are capable today of delivering true commercial production value.” Keeping that lead costs money, though: operating expenses nearly doubled to $54.98M.
| Business Driver | IonQ | D-Wave |
|---|---|---|
| Core Hardware | Trapped ions, moving to electronic control | Superconducting annealing plus gate-model |
| Revenue Engine | Systems, security, networking, space | Leap cloud service, system sales |
| Remaining Performance Obligations | $485 million | $40.7M |
One Builds a Foundry While the Other Sells Optimization Now
IonQ closed its $1.8 billion SkyWater acquisition, so it now controls every step from chip design to manufacturing in U.S. facilities. It is also changing from laser control to electronic qubit control, and it plans to commission its 256-qubit system in the first half of 2027. That makes IonQ a long-horizon call option on universal quantum computing.
D-Wave runs six customer applications in production, and commercial relevance for its gate-model program depends on reaching 100 logical qubits by 2032. Forbes Global 2000 companies now supply 47.7% of revenue, up from 20.4%. Enterprise demand is real, even if the dollar amounts are still small.
Fourth-Quarter Deliveries Will Test Both Stories
D-Wave expects fourth-quarter revenue to make up the majority of the year’s total. I will be watching whether the university system gets installed on schedule. For IonQ, watch the combined guidance that includes SkyWater, and whether the $280M to $290M outlook holds up during integration.
Cash, Backlog and Dilution Shape Both Investment Cases
Investors have sold off both stocks. IonQ is down 30.33% this year and D-Wave is down 54.95%, a steeper fall than IonQ’s. IonQ’s $1.24B in cash and its large backlog give it room to execute. Still, $141.8M in quarterly stock-based pay dilutes shareholders, and that concerns me. D-Wave offers proof of enterprise adoption today. Fourth-quarter revenue will show whether that adoption converts into sales.
The post D-Wave Quantum Vs. IonQ: Tech Differences Dictate Investment Strategy appeared first on 24/7 Wall St..
]]>Soda, toothpaste, phone service, power, and prescription drugs keep selling even as the economy slows, and the five companies in this group pay their shareholders from that steady demand. All five stocks have a beta well below 1, meaning they have historically moved less than the broader market. The yields run from about 2.3% at the two consumer staples to nearly 6% at the drugmaker. Pfizer (NYSE:PFE) leads the group with a forward yield of 5.83% for $29.49. Each pick below starts with whether the dividend is safe, and only then gets to the yield.
Coca-Cola: Rising Cash Flow Guidance Backs a Dividend Raised Through Two Recessions
Coca-Cola (NYSE:KO) pays an annualized forward dividend of $2.12 per share. At $93.32, that’s a yield of 2.27%. It has the lowest yield on this list and the best dividend record.
Dividend safety: The dividend accounts for about 64% of trailing EPS of $3.33. Management raised its 2026 free cash flow guidance to about $12.4 billion, up from $12.2 billion. Based on the current share count, the dividend would use roughly 74% of that figure. It also holds $12.9 billion in cash. In the available dividend history, the quarterly payout grows each year from $0.16 in 1999 to $0.53 in 2026. It kept rising through the financial crisis, from $0.38 in 2008 to $0.41 in 2009 and $0.44 in 2010. It rose again in the pandemic year, reaching $0.41 in 2020.
Bull case: Second-quarter adjusted EPS of $0.97 beat the $0.93 estimate. Revenue rose 6.7% to $13.38 billion, and global unit case volume grew 5%. Comparable EPS growth is now expected to reach 9%-10% this year. Coca-Cola sells mostly concentrate to bottlers in more than 200 countries and territories, so it earns high margins without having most of the factories and trucks. The stock’s beta is 0.318.
Risk: Investors have already noted. The stock is up 36.09% year to date and trades at about 28x trailing earnings. That places it close to the average analyst target of $94.74. Coca-Cola is also still fighting the IRS in tax court, and its fourth quarter has six fewer calendar days than last year’s.
Colgate-Palmolive: A Dividend Increase Every Year Since 2017 With an Ex-Date Close at Hand
Colgate-Palmolive (NYSE:CL) pays $0.53 a quarter, or $2.12 annualized. At $93.40, the yield is 2.27%. The next ex-dividend date is October 20, 2026, and that payment goes out November 13, 2026.
Dividend safety: On trailing GAAP EPS of $2.54, the payout ratio comes to about 83%. That figure looks worse than the business really is because restructuring charges are weighing on reported profit. In the second quarter, GAAP EPS was $0.86 after $129M in program charges, while Base Business EPS (which strips those charges out) was $0.99. Base Business operating profit grew 5% to $1.15 billion. The quarterly dividend has gone up every year in the recent record, from $0.40 in 2017 to $0.53 in 2026. That includes the pandemic year, when it rose to $0.44 in 2020 from $0.43 in 2019. Payments run without a break from 1999 through 2026.
Bull case: People keep brushing their teeth in a recession. Colgate holds 41.3% of the global toothpaste market and 32.7% of the manual toothbrush market. Hill’s Pet Nutrition brings in roughly 22% of total sales. Gross margin expanded 140 bps to 61.5%, and organic volume improved from the prior quarter for the third consecutive quarter. Management raised its Base Business EPS growth guidance to the mid-single digits.
Risk: North America sales fell 3.0%, and shareholders’ equity is only $236M. That leaves it with little buffer. The stock also trades at 37x trailing earnings, compared with 21x forward.
AT&T: Free Cash Flow Covers the Payout More Than Twice Over
AT&T (NYSE:T) pays $1.11 a year. At $23.27, the yield is 4.77%.
Dividend safety: Based on current shares, the dividend would use roughly 42% of management’s 2026 free cash flow guidance of $18B+. It also equals roughly 49% of adjusted EPS guidance at the low end ($2.25-$2.35). Free cash flow is expected to rise to $19B+ in 2027 and $21B+ in 2028. AT&T has a mixed dividend record. It held the payout at $0.52 a quarter through the 2020 pandemic, then cut it to $0.2775 in 2022 after spinning off WarnerMedia. It has paid that same amount every quarter from April 2022 through October 2026, and management says it expects to keep the $1.11 annualized rate.
Bull case: Wireless and broadband bills are among the last expenses families cut. AT&T added 432K postpaid mobile subscribers last quarter, with churn of just 0.86%, and 646K internet customers. Its fiber network reaches 38.6M locations, with a target of 40M by year-end 2026. AT&T plans to return $45B+ to shareholders from 2026 through 2028. The stock trades at about 10x forward earnings. This month, the company agreed to sell AT&T Mexico and announced a new fiber joint venture with Global Infrastructure Partners and CPP Investments.
Risk: Debt is heavy. Total debt stands at $144B, and net debt/EBITDA of 2.68x is above management’s 2.5x target. Interest expense rose 13.8%. One analyst also warned that a SpaceX threat could loom over the stock for an extended period. Shares are down 8.89% over the past month.
Dominion Energy: Data Center Demand Supports a Regulated Payout
Dominion Energy (NYSE:D) pays $0.6675 a quarter, or $2.67 annualized. At $63.03, the yield is 4.24%.
Dividend safety: The dividend comes to about 75% of the midpoint of 2026 operating EPS guidance ($3.57), which is a normal payout level for a regulated utility. Management reaffirmed its credit, dividend, and long-term growth guidance. Income investors should know the history. Dominion cut its quarterly dividend from $0.94 to $0.63 in late 2020 after selling its gas assets. It raised the payout to $0.6675 in 2022 and has kept it there since. A five-year capital plan of $64.7 billion means Dominion will depend on access to the capital markets.
Bull case: Electricity demand barely changes in a recession, and Dominion serves about 3.6 million homes and businesses under regulated rates. Second-quarter operating EPS of $0.79 beat the $0.6845 estimate, its sixth consecutive beat. Revenue rose 17.59%. Data center growth in Loudoun County, Virginia, supports long-term operating EPS growth guidance of 5% to 7% through 2030. The stock’s beta is 0.619, and it trades at about 16x forward earnings.
Risk: The proposed $66.8B merger with NextEra Energy still needs approvals in several states. The offshore wind project carries cost-recovery risk. GAAP net income fell to $340M from $760M after $626M in nonregulated impairments.
Pfizer: The Highest Yield in the Group at About 10x Forward Earnings
Pfizer pays $1.72 a year, for a yield of 5.83%. That is high-yield but just below the ultra-high-yield cutoff.
Dividend safety: The dividend takes up about 57% to 61% of the reaffirmed adjusted EPS guidance of $2.80-$3.00. Pfizer paid $9.8 billion in dividends in 2025. It expects no share repurchases in 2026, keeping more cash available for dividends and debt reduction. Its free cash flow yield is about 5.39%, and interest coverage is 5.78. The quarterly payout rose every year from $0.32 in 2017 to $0.43 in 2025, including increases through the pandemic to $0.38 in 2020 and $0.39 in 2021. So far, it has held at $0.43 through 2026.
Bull case: Patients keep filling prescriptions in a downturn. Second-quarter adjusted EPS of $0.77 beat the $0.68 estimate. New and acquired products grew 18%, with Eliquis up 19%. Management raised the midpoint of revenue guidance by $500M and plans 10 Phase 3 studies for berobenatide, its monthly GLP-1 obesity drug. CEO Albert Bourla said, “Our oncology portfolio remains a source of strength.” The stock has a beta of 0.276.
Risk: Pfizer posted a Q2 GAAP net loss of $248M after a $3.8B impairment. Generic and biosimilar competition is expected to cost about $1.1B in revenue this year, and the company is replacing its departed CFO. On GAAP numbers, the stock trades at 39x trailing earnings.
One Portfolio, Five Steady Paychecks
Coca-Cola and Colgate have the longest records of dividend increases. AT&T and Pfizer offer the highest yields, with payouts well covered by free cash flow and earnings guidance. Dominion adds regulated utility income supported by growing data center demand. Over the next few weeks, keep an eye on Colgate’s October 20 ex-dividend date, AT&T’s progress on paying down debt, and the approval schedule for Dominion’s merger.
The post 5 Dividend Stocks for Investors Who Want Income Without the Market’s Wild Swings appeared first on 24/7 Wall St..
]]>A 6% or 7% yield can carry a retirement income plan, but only for as long as the company can afford it. Kraft Heinz (NASDAQ:KHC) shows the problem. It yields 6.87%, and its shares have fallen 57.34% over the past ten years. Below are five familiar income names, each with a specific problem in its payout math.
A simple rule: a dividend is sustainable when earnings and free cash flow cover it with room to spare. When the company needs debt, asset sales, or one-time items to fill the gap, the payout is at risk.
Kraft Heinz: A Flat Payout on a Shrinking Business
Kraft Heinz has paid $0.40 per quarter on every listed payment since 2020. That kind of stability appeals to retirees. Much of the yield, though, comes from a falling stock price rather than a rising payout. Shares are down 17.71% over five years, and the current rate is already below the $0.625 the company paid in 2018.
The warning signs are piling up. A $7.4B non-cash impairment of goodwill and intangible assets produced a second-quarter net loss of $5.46B and trailing diluted EPS of -$2.87. Management expects organic sales to fall 0.5% to 2.0% and constant-currency adjusted operating income to drop 16% to 18%. On adjusted EPS guidance of $2.03 to $2.09, the $1.60 annual dividend takes roughly 77% to 79% of earnings, leaving little margin as profits shrink.
For the payout to hold, Kraft Heinz needs to deliver its guided free cash flow conversion of about 110% and get a return on ~$700 million in brand investment.
Pfizer: GAAP Earnings Fall Well Short of the Dividend
Pfizer (NYSE:PFE) yields 5.84% on a $1.72 annualized payout. Shares have gained 30.68% over the past year but are still down 7.02% over five years.
Measured against trailing diluted EPS of $0.76, the dividend comes to about 226% of GAAP earnings. Cash flow also falls short. In 2025, operating cash flow less capital spending left roughly $9.08 billion, while dividends cost $9.77 billion, a payout of about 108% of free cash flow. In the June 2026 quarter, operating cash flow was $835 million against $2.45 billion in dividends. Net debt runs at 3.01x EBITDA, Paxlovid revenue fell 95%, and buybacks are suspended so the company can reduce debt.
Management is firm on the payout. CEO Albert Bourla said: “We feel extremely confident that, even in the most stretched scenarios that we are running, we will be able to maintain our dividend.” Adjusted EPS guidance of $2.80 to $3.00 supports that view. Still, a dividend held flat through patent expirations is a stress signal and should not be read as a guarantee.
Dow Inc.: A Halved Dividend Leaning on a Cyclical Rebound
Dow Inc. (NYSE:DOW) yields 4.72% on a $0.35 quarterly payout. That rate is half the $0.70 Dow paid through mid-2025. The stock is up 43.33% in a year but down 33.37% over five.
The 2025 numbers explain the cut. Operating cash flow of $1.03 billion fell short of $2.48 billion in capital spending, leaving free cash flow of roughly -$1.45 billion while dividends cost $1.49 billion. Trailing diluted EPS is still -$1.84. The second quarter of 2026 was better, with free cash flow of $692M against $253M in dividends. Even so, management forecast third-quarter EBITDA to about $1.7 billion, down from $2.3 billion, and said extra cash goes to debt reduction first. The call included no clear commitment to the dividend.
A bright spot is that Dow has approximately $14 billion of liquidity and no substantive debt maturities due until 2029.
Verizon: Clean Coverage, but Debt Is Rising
Verizon (NYSE:VZ) yields 6.3% and raised its quarterly dividend to $0.7075 this year. Shares are up 18.54% over the past year, so the stock’s drop isn’t driving this yield. Coverage looks solid: the dividend takes about 74% of trailing EPS and roughly 54% of the low end of full-year free cash flow guidance.
The concern is the balance sheet. Unsecured debt stands at $136.5B, and net unsecured debt to adjusted EBITDA rose to 2.5x from 2.2x at the end of 2025. Revenue slipped 0.7%, and the company still plans buybacks of up to $4.5B. Verizon belongs on a watch list for now. Its coverage does not yet point to a cut.
AT&T: Ample Cash Flow, Heavy Spending and Debt
AT&T (NYSE:T) yields 4.72% on a $0.2775 quarterly dividend, the level it set in 2022 after cutting from $0.52. The dividend uses about 42% of 2026 free cash flow guidance of $18B+, and management guides to keeping it through 2028.
The pressure points are debt and spending. Total debt is $144B, leverage is 2.68x (above the company’s 2.5x target), and interest expense rose 13.8%. Legacy copper revenue fell 25.9%, and annual capex is forecast at $23 to $24B. One analyst has also warned that a SpaceX threat could weigh on the stock.
Signals That Show Whether a Dividend Is Stabilizing
Dividend cuts usually send shares lower too, so a high yield can lose income and principal at the same moment. Each quarter, compare free cash flow with dividends paid, and track whether leverage ratios are rising or falling. Also watch the gap between adjusted and GAAP earnings. Yield alone is never a reason to buy a stock (we pulled together key warning signs that a fat yield is about to be cut in a free report here: Dividend Traps).
The post These 5 Dividend Stocks Look Like Income Bargains. The Math Says Otherwise appeared first on 24/7 Wall St..
]]>Retirement income now faces a hard benchmark. The 10-year Treasury yielded 5.09% on October 16, so a dividend stock must offer more than a bond: a growing, cash-flow-funded payout. The five large caps below pay above-market yields supported by free cash flow and long payout records. A telecom selloff on Friday drove two of them to even higher yields. We judge each on safety first, then yield.
Realty Income: Monthly Checks Backed by 98.8% Occupancy
Realty Income (NYSE:O) yields about 6.01%, based on a forward annualized dividend of $3.258 and a price of $54.17. The newest monthly payment of $0.2715 went out October 15. Bills come monthly, which is the whole case for stocks that pay on the same schedule. (We rounded up seven of our favorite monthly payers in a free report here.)
Dividend safety: For a real estate investment trust (REIT), the key coverage measure is adjusted funds from operations (AFFO), a cash-flow figure. Management raised 2026 AFFO guidance to $4.44 to $4.45; the dividend uses roughly 73% of AFFO even at the low end. Occupancy is 98.8%, Fitch rates the company “A”, and net debt runs 5.4x pro forma adjusted EBITDAre. The company’s Q1 2026 filing counts its 115th consecutive quarterly dividend increase, and its payment history goes back to 1999.
Bull case: Realty Income put $2.6 billion to work in Q2 at a 7.3% initial cash yield, raised its 2026 investment target to $10.0 billion, and launched a $6 billion hyperscale data center joint venture. Shares fell 9.41% over the past month and trade below the $66.39 analyst target.
Risk: Tenants without investment-grade ratings account for 65.7% of annualized base rent, and rising rates make the REIT’s funding more expensive.
Verizon: Friday’s Selloff Lifted the Yield Near 6.8%
Verizon (NYSE:VZ) had its worst day since 2002 after news that SpaceX plans a U.S. network. Shares fell 10.14% to $41.65, raising the yield to about 6.79% on the $2.83 forward dividend.
Dividend safety: Free cash flow was $6.43 billion in Q2, up 27.1% from a year earlier, and the 2026 forecast calls for $21.94 billion to $22.14 billion. The dividend matches about 57% of the low end of adjusted EPS guidance ($4.99). The quarterly payout has risen from $0.64 in 2021 to $0.7075 today.
Bull case: Verizon added 184,000 postpaid phone subscribers, up from a loss of 9,000 a year earlier. Its adjusted EBITDA margin expanded to 40.1%, and the Frontier deal brought fiber connections to 10.9 million.
Risk: Net unsecured debt rose to 2.5x adjusted EBITDA after the Frontier acquisition, and satellite competition is a new threat to pricing.
AT&T: A Flat Dividend With Wide Cash Coverage
AT&T (NYSE:T) yields about 5.01% after a 9.85% drop on Friday. It cut its quarterly dividend in 2022, from $0.52 to $0.2775, and has paid that same amount ever since.
Dividend safety: The company expects at least $18 billion of free cash flow this year against a dividend bill of roughly $8 billion. The payout is about 49% of the low end of adjusted EPS guidance. AT&T plans to return over $45 billion to shareholders from 2026 to 2028.
Bull case: Q2 brought 432,000 postpaid phone net adds and 646,000 internet net adds. It is on track to reach more than 40 million fiber locations by year-end, and its free cash flow targets rise each year through 2028.
Risk: Dividend income will not grow. Legacy copper revenue fell 25.9%, and net debt stands at 2.68x adjusted EBITDA.
Chevron: Lower Yield, Strongest Balance Sheet in the Group
Chevron (NYSE:CVX) yields about 3.36%, the lowest of the five. It earns its place through dividend growth: the quarterly payout has risen every year from $1.42 in 2022 to $1.78 in 2026.
Dividend safety: Q2 free cash flow of $18.10 billion covers a quarterly dividend bill of more than $3.5 billion many times over. Net debt is 1.08x EBITDA, with interest costs covered 13.7x, and Chevron paid down $8.41 billion of debt in Q2 alone.
Bull case: Production rose 20% to 4,070 MBOED after the Hess acquisition. Chevron also reached $3 billion in cost savings ahead of schedule and signed a 2.67 GW power deal with Microsoft for an AI data center.
Risk: Earnings depend on oil prices. Shares are up 42.95% this year, so the yield has fallen.


Altria: A Fresh Raise and an Ultra-High-Yield Payout
Altria (NYSE:MO) yields about 6.19%, among the highest in the market, after raising its quarterly dividend to $1.11 from $1.06. The payout has risen every year, starting at $0.80 in 2019.
Dividend safety: The new $4.44 annual rate is about 79% of the low end of 2026 adjusted EPS guidance ($5.61). Debt-to-EBITDA was 1.9x, in line with the company’s target. On the Q2 call, management called the dividend “our primary vehicle” for returning cash to shareholders.
Bull case: Pricing power holds up. Smokeable price realization was 4.5%, and the segment’s margins were 64.8%. Retail share for the on! nicotine pouch brand rose to 8.6%.
Risk: Industry cigarette volumes fell 5%, and Marlboro’s retail share slipped to 39.5% as smokers trade down to cheaper brands.


Five Income Streams Ranked on Safety and Yield
Realty Income pays monthly, the two telecoms supply heavy free cash flow at marked-down prices, Chevron brings dividend growth and the best balance sheet, and Altria raised its payout again this year. Each dividend is covered by cash flow or earnings guidance with room to spare. Over the next few months, watch how Verizon and AT&T respond to SpaceX and where the 10-year yield goes from 5.09%.
The post 5 High-Yield Stocks to Buy Now Before Your Retirement Starts appeared first on 24/7 Wall St..
]]>At the 24% federal bracket, which for 2026 applies to taxable income over $105,700 for single filers ($211,400 for married couples filing jointly), a $500,000 portfolio split across five high-yield S&P 500 stocks produces about $27,400 in annual dividends. Held in a taxable account, roughly $4,651 of that goes to the IRS every year. In a Roth IRA, the tax on that income is zero.
Roth Versus Taxable: $4,651 a Year on One Portfolio
Each of five stocks gets a $100,000 allocation from the model. Each yield is the company’s forward annualized dividend divided by its share price as of Friday. Four of the five are corporations that pay qualified dividends, which are taxed at 15% for filers in the 22% through 32% brackets. Realty Income (NYSE:O) is a real estate investment trust (REIT), and its distributions generally face your full marginal rate as ordinary income.
| Stock | Yield | Annual Income | Tax at 24% Bracket |
|---|---|---|---|
| Verizon (NYSE:VZ) | 6.81% | $6,810 | $1,022 |
| Altria (NYSE:MO) | 6.21% | $6,210 | $932 |
| Realty Income | 6.01% | $6,010 | $1,442 |
| AT&T (NYSE:T) | 5.01% | $5,010 | $751 |
| Chevron (NYSE:CVX) | 3.36% | $3,360 | $504 |
| Total | $27,400 | $4,651 |
In the taxable account, the portfolio clears about $22,749 a year. In the Roth, it keeps the full $27,400. The difference is $4,651 more income each year, or $46,510 over 10 years, before any growth.
- Realty Income: This is the strongest case for Roth location. It makes up 20% of the money in the portfolio but about 31% of the tax bill, because its monthly distributions are taxed at ordinary rates. It just paid its 115th consecutive quarterly dividend increase.
- Verizon: Shares were headed for their worst day since 2002 on SpaceX U.S. network plans, which drove the yield to the highest in this group. The quarterly payout is $0.7075.
- Altria: Altria raised its quarterly dividend to $1.11 from $1.06. Every increase adds to the taxable income a Roth would shield.
- AT&T: AT&T fell alongside Verizon on Starlink fears. It has reiterated $45B+ in shareholder returns for 2026 to 2028.
- Chevron: Shares are up 42.86% year to date, which has pulled the yield down. That makes Chevron the smallest Roth winner in this group.
How Your Bracket Changes the Roth Advantage
For the same portfolio, the tax drag rises with your bracket. At the top bracket, which starts above $640,600 for single filers, qualified dividends are taxed at 20%.
| Bracket | Annual Tax Cost | Taxable Net Income | Roth Advantage |
|---|---|---|---|
| 22% | $4,531 | $22,869 | $4,531 |
| 24% | $4,651 | $22,749 | $4,651 |
| 32% | $5,132 | $22,268 | $5,132 |
| 37% | $6,502 | $20,898 | $6,502 |
Higher earners may also owe the 3.8% net investment income tax (NIIT), which increases every figure in the 32% and 37% rows. Because Realty Income is taxed at ordinary rates, its share of the bill grows faster than the others’ as your bracket rises.
Compounding Turns the Annual Gap Into Six Figures
This annual difference compounds over time. Reinvesting the $4,651 yearly tax savings at a conservative 4% inside the Roth grows the gap to about $55,840 after 10 years and $138,498 after 20 years. These figures assume no price gains and no dividend growth. Realty Income accounts for about $42,940 of that 20-year total by itself. That gap represents the long-run tax cost of keeping these five positions subject to annual taxation.
Key Tax Items to Review Before the Next Filing
- When you own Realty Income or any other REIT in a taxable account, compare the ordinary and qualified dividend amounts on your 1099-DIV (box 1a versus box 1b). Then figure the cost using the table above for your bracket.
- A phased Roth conversion could start with the positions paying ordinary income. Balance the one-time conversion tax against that stock’s 20-year compounded delta. The low-bracket years after you stop working and before your first RMD are usually the cheapest time to run those conversions, which is the whole subject of our free Roth guide: The Roth Window.
- When Roth space is limited, the highest-taxed income benefits the most from that shelter. In the 24% bracket, Chevron’s $100,000 position costs $504 a year in tax, while the same amount in Realty Income costs $1,442.
The post 5 Dividend Stocks for 100% Tax-Free Roth IRA Income appeared first on 24/7 Wall St..
]]>Income investors have one month of evidence that high yields can rise for unwelcome reasons. Four of these five large-cap dividend payers lost ground over the past month, and some of the drops were steep. A falling share price raises the yield on a fixed payout. The question for a long holding period is whether each payout can last a full cycle and keep growing. This Just Paid Investors scorecard looks at Altria (NYSE:MO), AT&T (NYSE:T), Enbridge (NYSE:ENB), Pfizer (NYSE:PFE) and Verizon (NYSE:VZ). For each one, it covers yield, growth run, payout coverage, and the most recent check sent to shareholders.
Why These Five Payouts Matter Now
Verizon shares fell 8.92% over the past month, and Enbridge slid 7.25%. AT&T dropped 5.22%, and Pfizer declined 3.41%. Altria was the only one of the five to gain, up 0.69%. Because of the decline, four of the five now yield roughly 6% or more. In this scorecard, the payout ratio is the annualized dividend divided by the midpoint of each company’s 2026 earnings guidance. For Enbridge, the ratio uses distributable cash flow (DCF) per share.
Dividend Scorecard at a Glance
| Company | Annual Dividend | Yield | Payout Ratio | Grade |
|---|---|---|---|---|
| Altria | $4.44 | 6.5% | 78.7% | A- |
| Verizon | $2.83 | 6.2% | 56.4% | A |
| Enbridge | $2.784 | 6.0% | 65.8% of DCF | B+ |
| Pfizer | $1.72 | 6.3% | 59.3% | B- |
| AT&T | $1.11 | 4.6% | 48.3% | C+ |
Altria: A Fresh 4.7% Raise Lands This Week
Altria’s most recent payment was $1.06 per share on July 10, 2026. The next check is larger. The quarterly rate goes up to $1.11, payable on October 9, 2026. The 4.7% increase beats the 3.9% raise in 2025, the company’s 60th increase in 56 years. At a share price of $68.27, the forward yield is 6.5%, even after a 24.15% gain so far this year.
Underlying results support the payout. First-quarter adjusted EPS came in at $1.32, beating the $1.25 estimate. Smokeable margins expanded to 65.1%. Guidance calls for 2026 adjusted EPS of $5.56 to $5.72. Volume is the weak spot. Marlboro’s retail share fell to 39.7%, and stockholders’ equity is negative $3.2 billion. Altria keeps the A− grade because of its long record of raises and its pricing power.
Verizon: 6.2% Yield Backed by Raised Guidance
Verizon’s dividend was $0.7075 per share on August 3, 2026. The rate is 2.5% above the prior $0.69 and continues a growth run of 18+ consecutive years. Second-quarter adjusted EPS of $1.30 beat the $1.27 estimate, and adjusted EBITDA margin expanded to 40.1% from 37.1%. Management raised full-year adjusted EPS guidance to $4.99 to $5.04 and projects free cash flow growth of 9% to 10%.
At a payout ratio near 56.4%, Verizon has the best mix of yield and coverage in the group. The Frontier deal closed on January 20, 2026, and fiber connections rose 41.9%. Debt is the balance, with $136.5 billion in unsecured borrowings.
Enbridge: Three Decades of Raises in Canadian Dollars
Enbridge’s dividend was C$0.97 per share on September 1, 2026. U.S. holders received $0.696, down from $0.707 the quarter before. The Canadian-dollar rate held steady, so the dip came from exchange-rate swings, which U.S. investors should expect with this stock. The pipeline operator has about 30 consecutive years of dividend increases. It guides 2026 DCF per share to C$5.70 to C$6.10, which sets the payout at about 65.8% of DCF.
A secured backlog of about C$41 billion supports roughly 5% near-term growth. Leverage of 5.1x debt-to-EBITDA has reached the top of the company’s target range, so Enbridge gets a B+ rather than an A.


Pfizer: 6.3% Yield With a Flat Payout in 2026
Pfizer’s dividend was $0.43 per share on September 1, 2026. The rate has been unchanged since early 2025 and was last raised from $0.42. The yield is 6.3%, and the shares remain 14.71% below their level of five years ago. First-quarter revenue rose 5.4% to $14.45 billion, and the non-COVID portfolio grew 22% operationally.
Pfizer has no share repurchases planned in 2026, so the dividend is its main way of returning cash to shareholders. Against adjusted EPS guidance of $2.80 to $3.00, the payout ratio is about 59.3%, a manageable level. Patent losses carry an estimated $1.5 billion revenue impact, and drug-pricing policy remains uncertain. Those risks hold the grade at B−.


AT&T: Below the 5% Line but Buybacks Lead
AT&T is the one name in this group that falls short of the headline yield. Its yield is 4.6% on its $0.2775 quarterly payment, last paid on August 3, 2026. The next payment is due November 2, 2026. The rate has stayed the same since the 2022 reset that followed the WarnerMedia spinoff.
The business itself is strong. Second-quarter adjusted EPS of $0.65 beat the $0.59 estimate, the company added 432,000 postpaid phone subscribers, and it expects more than $18 billion in free cash flow. Management is sending extra cash to buybacks of about $10 billion in 2026. Leverage of 2.68x is above the company’s target. AT&T has the lowest payout ratio of the five at 48.3%, but with no dividend growth since 2022, its grade is C+.
What to Watch Into Year-End
December is typically when Pfizer and Verizon announce dividend changes, so Pfizer’s next declaration will indicate whether its dividend growth streak continues. At Altria, investors can track whether nicotine pouch share rebounds from 13.4% and how much of the $720 million left in its buyback program is used before the program expires on December 31, 2026. Enbridge’s debt ratio and the Canadian dollar will set the size of its U.S.-dollar checks. AT&T’s progress toward over 40 million fiber locations will show whether it is ready to raise its payout again.
Of the five, Verizon and Altria have the strongest combination of yield, coverage, and dividend growth right now. The whole point of holding names like these is to collect the checks without ever selling a share, which is exactly the structure we laid out in a free dividend ladder guide.
The post 5 Large-Cap Giants Paying 5% and Bigger Dividends to Be Bought and Held Forever appeared first on 24/7 Wall St..
]]>Two of the largest mortgage REITs now offer forward yields above 16%. That happened after their share prices fell more than 12% in a single month: 12.59% for one and 13.17% for the other. A high yield is only worth as much as the company’s ability to keep it. All five of these income names show at least one warning sign that owners should watch.
What makes a dividend unsustainable: the payout uses up most or all of the right earnings measure for that business, free cash flow falls short of it, or new debt and new shares are paying for it. We spelled out the full set of red flags in a free dividend trap guide if you want the full checklist before reading on.
AGNC Investment: A 16% Yield With Little Room to Spare
GAAP earnings at a mortgage REIT jump around with bond prices, so the better test is distributable earnings against the dividend. AGNC Investment (NASDAQ:AGNC) earned $0.40 per share in Q2. Its dividends for the quarter came to $0.36, which works out to about 90% of earnings. At $8.76, the $0.12 monthly payout gives a forward yield of about 16.4%, which puts it in ultra-high-yield territory.
Much of that yield comes from the stock’s decline. The stock is down 9.57% year to date. The annual dividend equals about 16.8% of tangible book value of $8.58 per share. Liabilities total $109.22 billion against $12.54 billion of equity. AGNC also sold 16.2 million new shares through its at-the-market program, which dilutes existing holders. The company cut the monthly payout from $0.16 to $0.12 in April 2020.
To keep the payout whole, AGNC needs mortgage spreads to stay steady and rate moves to stay calm. Q2 was encouraging, with a 6.7% economic return.
Annaly Capital: A Fresh Raise Sits on Thin Coverage
Annaly Capital Management (NYSE:NLY) reported earnings available for distribution (EAD) of $0.79 per share. That covers its $0.75 quarterly dividend at about 95%. EAD has exceeded the dividend for the ninth consecutive quarter, and management raised the payout from $0.70. At $18.29, the forward yield comes to about 16.4%.
A margin of 4 cents a share leaves little room for error at 7.4x GAAP leverage. The stock is down 9.19% year to date, so a lower share price is doing part of the work behind the yield. The dividend history includes cuts from $0.30 to $0.25 in 2019 and from $0.88 to $0.65 in 2023.
Book value rose to $20.15 from $19.82 during the quarter.
Kraft Heinz: A Flat Payout Backed by Shrinking Sales
Using adjusted numbers, Kraft Heinz (NASDAQ:KHC) covers its $1.60 annual dividend. Full-year EPS guidance of $2.03 to $2.09 means the payout takes about 79% even at the bottom of the range. Management guided to free cash flow conversion of about 110%. GAAP results look much worse: trailing diluted EPS is -$2.87 after a $7.4 billion impairment. At $22.77, the forward yield is about 7.0%.
That yield is mostly the result of a falling stock. Shares are down 58.79% over ten years. Net sales fell 1.4%, and North American adjusted operating income dropped 15.8%. Organic sales are guided to decline 0.5% to 2.0% this year. Brand spending is rising to about $700 million, and the planned break-up is paused. The dividend has stayed flat at $0.40 a quarter since it was cut from $0.625 in 2019.
Management paid down $1.9 billion of debt in the quarter, and the CFO said “Our balance sheet remains very strong.” To keep the payout safe, the extra marketing spend needs to bring volume back.
AT&T: The Mildest Warning on the List
AT&T (NYSE:T) expects free cash flow of $18 billion or more, and adjusted EPS guidance of $2.25 to $2.35 covers its $1.11 dividend well. Management did say that buybacks plus dividends will use “essentially 100% of our outlook for free cash flow.” The forward yield of about 4.95% makes it high-yield. It falls short of ultra-high.
Leverage of 2.68x net debt to EBITDA is above the 2.5x target and is expected to rise to the 3.2x range after the EchoStar deal. Legacy EBITDA fell about 46%, and the shares are down 12.88% in a month. AT&T cut its dividend once before, from $0.52 to $0.2775 in 2022. If cash gets tight, buybacks could be scaled back before the dividend is touched.
Yield Alone Is Never a Buy Thesis
A dividend cut usually drags the share price down with it, so income investors take two losses at once. Before trusting a yield, check coverage on the right earnings base, free cash flow, and leverage. For owners of these five stocks, the next few quarterly reports will show whether coverage is holding up or getting lower.
The post Two Mortgage REITs Yield More Than 16%. Their Share Prices Tell Another Story appeared first on 24/7 Wall St..
]]>Telecom carriers work a lot like utilities. Customers pay every month, and mature, capital-intensive networks turn those bills into large, regular dividends. Verizon (NYSE:VZ), AT&T (NYSE:T) and BCE (NYSE:BCE) all run on that model, and all three got cheaper after a sharp Friday plunge in telecom stocks. Verizon, the largest of the group, now yields 6.12%. A big yield only counts if free cash flow covers it, and coverage looks quite different from one carrier to the next.
Verizon: Ultra-High Yield Backed by Two Decades of Raises
Verizon yields 6.12% at $43.18, which puts it in ultra-high-yield territory. The quarterly payout is $0.7075 per share, or $2.83 annualized.
Dividend safety: With 4,154,775,000 shares outstanding, the dividend costs about $11.76 billion a year. Management guides full-year free cash flow to $21.94 billion to $22.14 billion, so the payout takes up roughly 53.59% of that floor. Measured against trailing EPS of $3.84, the payout ratio is 72.79%. Against the bottom of the raised adjusted EPS guidance ($4.99 to $5.04), it drops to 56.71%. Second-quarter free cash flow rose 27.1% to $6.43 billion. Net unsecured debt stands at 2.5x adjusted EBITDA, and management targets 2.0 to 2.25 times during the 2027 timeframe. Verizon’s latest increase was its 20th consecutive year of dividend increases, and the payment record shows the quarterly rate climbing step by step from $0.615 to $0.7075. CEO Dan Schulman described an “ironclad commitment to our dividend” on the call.
Bull case: Verizon keeps paying you while it restores growth. After the Frontier deal, fiber connections reached 10.9 million, up 43.3%. The company added 184,000 postpaid phones in the quarter, and adjusted EBITDA margin expanded to 40.1% from 37.1%. Cash left over after the dividend is going to buybacks of up to $4.5 billion, and the stock trades at a forward P/E of 9.
Risk: Revenue has stalled. Quarterly revenue slipped 0.7%, wireless equipment revenue fell 20%, and fixed wireless broadband net adds dropped 30.6%. The shares are down 13.23% over the past month, a sign that investors are pricing in tougher competition.
AT&T: Lower Yield, Widest Free Cash Flow Cushion
AT&T yields 4.51% at $22.42, which makes it a high-yield name, though short of ultra-high-yield. It pays $0.2775 per quarter, or $1.11 annualized.
Dividend safety: Coverage is the strongest of the three. The payout costs about $7.61 billion a year, against full-year free cash flow guidance of $18 billion or more. That is roughly 42.26% of forecast cash flow. The payout ratio is 36.63% of trailing EPS and 49.33% of the lower bound of adjusted EPS guidance ($2.25 to $2.35). Second-quarter free cash flow slipped 4.0% to $4.67 billion, but the company holds $17.57 billion in cash. Leverage runs a bit hot, with net debt at 2.68x adjusted EBITDA versus a 2.5x target. The track record has a gap. AT&T cut its quarterly payment from $0.52 to $0.2775 in 2022 after the Warner spin-off, and the rate has stayed flat since then. This is a rebuilt dividend with no growth streak behind it.
Bull case: AT&T’s cash flow plan keeps going up: $19 billion or more in 2027 and $21 billion or more in 2028, supporting $45 billion or more in shareholder returns through 2028. The quarter brought 432,000 postpaid phone net adds and 646,000 internet net adds. Fiber now reaches 38.6 million locations, on the way to 60 million by 2030. The forward P/E is 10, and the stock is up 55.52% over five years. Today’s lower payout leaves room for an increase once debt reaches target.
Risk: Satellite competition is the newest worry. One analyst warned that the SpaceX threat could loom over AT&T’s stock for a prolonged stretch, and the shares have dropped 12.88% in a month.
BCE: Canadian Cash Flow, U.S. Dollar Payouts and a Reset Dividend
BCE is the odd one out. It is a Canadian carrier that trades on the NYSE, and it has pushed into U.S. wireline through its Ziply Fiber acquisition. The dividend is declared in Canadian dollars at C$1.75 annualized. Some screens show a yield of 9.32%, but that figure sets the Canadian-dollar rate against the U.S.-dollar share price. NYSE holders actually received $0.315, $0.313, $0.319 and $0.315 over the last four payments. At $18.86, that works out to a trailing yield of about 6.69%, still ultra-high-yield.
Dividend safety: The reset is the starting point. BCE’s per-share payment fell from $0.718 to $0.319, which ended its long growth record. The smaller payout now costs about C$1.63 billion a year, roughly 51% of the $3.2 billion in free cash flow BCE generated last year. Second-quarter free cash flow came in at over $1 billion, and 2026 guidance calls for free cash flow growth of 4% to 10%. Leverage of about 3.7 times is the highest in the group. BCE has $4.6 billion in liquidity, and its pension plans show a $4.9 billion solvency surplus. CEO Mirko Bibic told analysts: “We’re focused, hyper-focused on the 3.5 times leverage ratio by the end of 2027, and we’re going to hit that.”
Bull case: A dividend that has already been cut to fit cash flow is easier to maintain. BCE has raised $6.6 billion of its planned $7 billion in asset sales. The company is also targeting $1.5 billion in cost savings by 2028 and has 335 megawatts of AI data center capacity already under contract. U.S. fiber and AI infrastructure give it growth that the two domestic carriers can’t offer in the same form. The forward P/E is 11.
Risk: Currency drives your income here. Because the payout is denominated in Canadian dollars, each U.S.-dollar check moves with the exchange rate, as the swings between $0.311 and $0.319 per payment show. A weaker loonie means less income for U.S. holders even when BCE leaves its dividend unchanged.
What Telecom Income Really Depends On
All three carriers pay from the same engine: monthly subscriber cash that has to cover network spending, debt service as well as the dividend. Verizon matches ultra-high yield with a 20-year raise streak and room to spare. AT&T offers the widest free cash flow cushion at a lower yield. BCE now pays a smaller, better-covered dividend in a currency U.S. holders don’t control. In every case, the yield holds up only as long as free cash flow keeps going up and leverage keeps falling.
The post Historically Cheap Telecom Stocks Now Yielding 4.5% to 6.1% for Patient Dividend Hunters appeared first on 24/7 Wall St..
]]>Pre-Market Stock Futures:
Futures are trading mixed after a slow start to the week, ahead of the 3rd-quarter earnings season, which kicks off today with four large-cap financial stocks reporting, and for the first time in a long time, JPMorgan Chase & Company (NYSE: JPM) missed earnings expectations. The major indices closed mixed on Monday, as the bond market and banks were closed for the Columbus Day holiday. The Dow Jones Industrial was the only major index to close higher on Monday, finishing the day at 51,850, up 0.38%. The Nasdaq closed Monday at 27,245, down 0.44%, while the small-cap Russell 2000 ended the session at 2,796, down 0.37%. The S&P 500 closed just lower at 7,807, down just 0.06%. This followed the venerable index’s first close above the 7,800 level last Friday.
Treasury Bonds:
Again, the market was closed on Monday for the holiday. The 30-year Treasury closed last Friday at 5.60%, while the 10-year note ended last week at 5.24%.
Oil and Gas:
Oil prices were higher on Monday following the Houthi attack on the Riyadh Airport on Saturday, which killed 13 and wounded over 300 when missiles struck a departure terminal. This comes as OPEC+ sees demand rebounding. Brent Crude finished Monday’s session at $106, up 1.30%, while West Texas Intermediate was last seen at $93.21, up 1.48%. Natural gas closed the session at $3.16, down 1.65%.
Gold:
Gold started the week lower as a stronger dollar, rising energy prices, and traders’ anxiety over upcoming inflation brought out the sellers. At the final bell, bullion was priced at $4,169, down 0.59%, while Silver closed at $60.12, down 0.59%. One thing we did learn on Monday is that China continues to buy the precious metal at a furious pace, and many think that trend will continue.
Crypto:
The cryptocurrency market modestly recovered Monday, steadying after severe mid-week macro pressures and massive derivative liquidations. Early Friday trading was heavily impacted by the aftermath of nearly $1 billion in market-wide liquidations triggered on Thursday. Over-leveraged long positions were wiped out as Bitcoin hit an intraday low of $80,400. However, strong physical buying interest returned on Friday and again yesterday, pushing prices back up. At 8 AM, Bitcoin was trading at $83,360, while Ethereum was quoted at $2,503.
24/7 Wall St. reviews dozens of analyst research reports every day to identify fresh investment ideas for investors and traders alike. These daily analyst notes include recommendations on stocks to buy, sell, or avoid, as well as new coverage initiations. Important reminder: No single analyst report should ever be the sole basis for buying or selling a stock.
Here are some of the top Wall Street analyst upgrades, downgrades, and initiations from Tuesday, October 13, 2026.
Upgrades:
- American Electric Power (NYSE: AEP) was upgraded to Overweight from Equal Weight at KeyBanc, which has a $133 target price.
- Exelon (NYSE: EXC) was upgraded to Sector Weight from Underweight at KeyBanc, with a $41 target price.
- Galaxy Digital Holdings (NASDAQ: GLXY) was upgraded to Buy from Neutral at Citigroup, which nudged the target price for the shares to $28 from $26.
- VF Corporation (NYSE: VFC) was raised to Overweight from Neutral at Piper Sandler, which bumped the target price for the clothing company to $20 from $14.
- Viking Holdings (NYSE: VIK) was upgraded to Overweight from Equal Weight at Barclays, which raised the target price for the stock to $102 from $90.
Downgrades:
- AT&T (NYSE: T) was downgraded to Market Perform from Outperform at Bernstein, which trimmed the target price for the telecommunications giant to $24 from $25.
- Adobe (NASDAQ: ADBE) was downgraded to Hold from Buy at HSBC, which slashed the target price for the shares to $267 from $310.
- Arch Capital (NASDAQ: ACGL) was cut to Equal Weight from Overweight at Morgan Stanley, which trimmed the target price to $100 from $105.
- Pershing Square (NYSE: PS) was downgraded to Underperform from Neutral at Bank of AMERICA, and the target price was dropped to $38 from $54.
- RTX (NYSE: RTX) was downgraded to Hold from Buy at Deutsche Bank, which dropped the target price for the stock to $208 from $238.
Initiations:
- Air Products & Chemicals (NYSE: APD) was initiated with an Overweight rating at Barclays, with a $353 target price.
- Albemarle (NYSE: ALB) was started with an Equal Weight rating at Barclays, with a $109 target price.
- SoFi Technologies (NASDAQ: SOFI) was initiated with a Buy rating at StoneX, with a $25 target price.
- Technip FMC (NYSE: FTI) was initiated with a Buy rating at UBS, with an $89 target price.
- YETI Holdings (NASDAQ: YETI) was initiated with a Buy rating at Ladenburg, which has a $52 target price for the stock.
The post Here Are Tuesday’s Top Wall Street Analyst Research Calls: AT&T, Adobe, Albemarle, American Electric Power, Pershing Square, RTX, SoFi Technologies, Technip FMC, YETI Holdings, and More appeared first on 24/7 Wall St..
]]>T-Mobile (NASDAQ:TMUS) stock is up 3% to $152.65 in afternoon trading, recovering part of the worst one-day loss in its history as a public company. Meanwhile, Verizon (NYSE:VZ) stock is up 2% to $42.43, tracking T-Mobile shares higher at a slower pace. AT&T (NYSE:T) stock is up 0.8% to $22.36 as well, representing the smallest gain among the three carriers.
For contrast, the SPDR S&P 500 ETF Trust (NYSEARCA:SPY) is down 0.1% to $777.88. Notably, SpaceX (NASDAQ:SPCX) stock, whose Starlink unit set off the carrier selloff, is up 0.7% to $163.73.

Starlink’s Spectrum Push Sparked a Record Selloff
On October 9, Starlink said it’s adding up to 14 megahertz of paired spectrum in the 800 MHz band. SpaceX founder Elon Musk said the move was the last critical piece of the spectrum puzzle needed for SpaceX to provide complete phone coverage in America. T-Mobile shares fell more than 13% that Friday, Stocktwits reported, the largest single-session decline since the company went public in 2013, as the other large carriers closed lower.
The shared recovery points to a review of Friday’s selling, since the spectrum plan itself is unchanged. That gain recovers only a fraction of Friday’s damage.
Towers Versus Satellites in the Wireless Race
Verizon, AT&T and T-Mobile own licensed spectrum along with the towers and equipment that put it to work, and in rural markets, coverage is the main reason customers choose one carrier over another. That model depends on heavy, ongoing investment in physical infrastructure, which is the barrier a satellite network would try to bypass.
SpaceX reaches phones from orbit through Starlink Direct to Cell, which connects existing 4G Long-Term Evolution (LTE) handsets in places without ground coverage. Any spectrum SpaceX acquires would feed a network with no towers behind it, a far smaller physical presence than the carriers maintain.
T-Mobile stock is down 23% so far this year, so the satellite worry hit shares that were already under pressure. This earlier weakness makes it harder to isolate how much of the current discount stems from satellite risk alone.
Overreaction or Early Warning for Carriers?
For T-Mobile, the bearish case is easy to see. A satellite operator holding its own spectrum could compete for subscribers in rural areas, where coverage drives the choice of carrier. That threat doesn’t need to arrive soon to compress the multiple now, since share prices tend to discount long-dated risks early.
On the other hand, the bullish case holds that a decline of Friday’s size, tied to a capability still in development, already prices in a competitor that hasn’t launched a consumer plan. On that view, the burden of proof sits with SpaceX, which still has to show it can turn spectrum into a priced, marketed phone service.

What to Watch Next
The key question for T-Mobile is whether SpaceX files for the regulatory approvals a consumer wireless service would require. A filing like that would convert a capability on paper into a process with a regulatory timeline, giving the carriers a clearer sense of when competition could reach their customers.
At the end of the day, investors should keep their T-Mobile share positions measured until SpaceX’s regulatory path comes into focus, since Friday showed how quickly one headline can reset sector valuations.
The post T-Mobile Rebounds 3% After Record Drop on Starlink Spectrum Move; SpaceX Ticks Up, Verizon Edges Higher appeared first on 24/7 Wall St..
]]>The 24/7 Wall St. price target for AT&T (NYSE:T) is $30.55 over the next 12 months. With shares at $22.15 midday Friday, that means 37.9% upside. AT&T earns a buy rating from the model with high confidence.
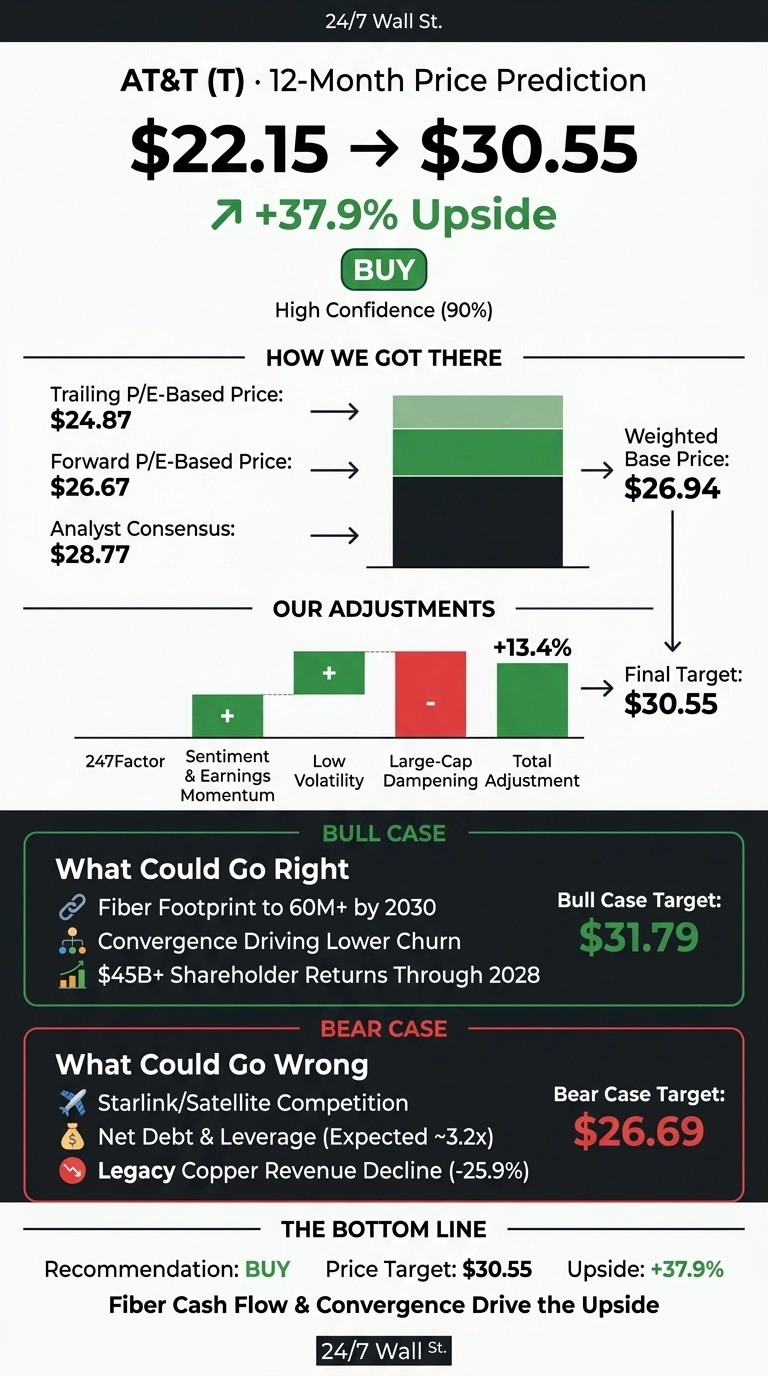
| Metric | Value |
|---|---|
| Current Price | $22.15 |
| Price Target from 24/7 Wall St. | $30.55 |
| Upside/Downside | 37.9% |
| Recommendation | BUY |
| Confidence Level | 90% |
The forward dividend of $1.11 yields about 5%. On free cash flow, management guides to $18B+ this year, rising to $21B+ in 2028, with buybacks at roughly $10B in 2026.
Starlink Spectrum Fears Knock AT&T to a Fresh Discount
Shares fell 9.95% in Friday’s session after SpaceX announced a spectrum deal for Starlink Mobile, which hit telecom stocks generally. AT&T is down 8.85% for the week, 13.48% for the month and 7.64% year to date. That leaves it 23% below its 52-week high of $28.75 and 12.8% above its low of $19.63.
Operations look much better than the share price. Q2 adjusted EPS of $0.65 beat the $0.5871 consensus. Revenue of $31.56B fell slightly short of the $31.81B estimate.
AT&T added 432,000 postpaid phones and on October 6 announced a new fiber joint venture with Global Infrastructure Partners and CPP Investments.
Why Bulls See $31.79 and Beyond
Fiber is the engine. AT&T covers 38.6M fiber locations and targets 60M+ by 2030. Consumer wireline broadband revenue rose 27.3%, and 42.5% of home internet customers also carry AT&T wireless. CEO John Stankey: “Where we have fiber, we win.”
Management guides to double-digit adjusted EPS growth over three years and $45B+ in shareholder returns. Analysts are mostly positive with 16 Buy or Strong Buy ratings and a $28.77 consensus target. An upside case covers $31.79, about 43.5% above the current price.
What Could Go Wrong for AT&T
Satellite-to-phone competition is now a live concern. Net debt stands at $144B, with leverage expected to rise to the 3.2 times range after the EchoStar (NASDAQ:SATS) spectrum purchase. Legacy copper revenue fell 25.9%, and interest expense rose 13.8%.
Capex rose 16.4% due to faster fiber deployment. The EchoStar and Lumen Technologies (NYSE:LUMN) deals are expected to add to earnings by 2028. Our bear case of $26.69 still is 20.5% above the current price.

How AT&T Compares to Verizon and T-Mobile
| Company | Forward P/E | Dividend Yield |
|---|---|---|
| AT&T | 9x | 5.0% |
| Verizon | 9x | 6.08% |
| T-Mobile | 12x | 2.46% |
Verizon (NYSE:VZ) competes head-to-head with AT&T in wireless and fiber. Its quarterly earnings fell 22% year over year, yet it trades at about the same multiple as AT&T, whose adjusted EPS beat expectations in Q2. That gap suggests AT&T deserves a premium.
T-Mobile (NASDAQ:TMUS) is the growth benchmark in wireless, with revenue up 7.9% year over year. At $30.55, AT&T would trade near 13x forward earnings, roughly in line with T-Mobile. Against both peers, our target looks reasonable.
AT&T Price Prediction 2026-2030
I’m sticking with our 24/7 Wall St. price target of $30.55, a buy rating and 90% confidence. The free cash flow path toward $21B+ tips the scale.
The bull case holds if fiber and wireless bundling keeps cutting churn. It weakens if Starlink cuts into AT&T’s wireless pricing or leverage remains above 2.5x. At about 9x earnings, the market is pricing in more disruption than AT&T’s results show.
Our model projects where AT&T could trade in the years ahead if current trends hold.
| Year | Price Target from 24/7 Wall St. |
|---|---|
| 2026 | $25.12 |
| 2027 | $30.55 |
| 2028 | $35.44 |
| 2029 | $39.32 |
| 2030 | $42.95 |
These estimates assume AT&T stays on track with fiber expansion and deleveraging. Satellite competition or delays in retiring copper lines could change these numbers.
The post Prediction: AT&T Could Have More Upside Than Its Dividend Suggests appeared first on 24/7 Wall St..
]]>Verizon Communications (NYSE:VZ) is priced at $41.65. Wall Street’s average price target is $51.12, which places the stock about 22.7% below where analysts think it should be.
Verizon runs one of the country’s largest wireless networks. After buying Frontier, it also has a fiber business with 10.9 million fiber connections. Wall Street has been watching because CEO Dan Schulman’s turnaround is finally delivering subscriber growth.
Arete Research is the most bullish firm on the stock. It rates Verizon a Buy with a $62.00 target, the Street high. That target means 48.9% upside.
SpaceX Hits a Turnaround Story in Mid-Stride
Starlink’s Carrier Ambitions Sparked Verizon’s Worst Day Since 2002
The main reason for the drop is SpaceX’s plan to turn Starlink into a major U.S. mobile carrier. Verizon fell 8.75% in the latest session, its worst day since 2002. The stock is down 14.84% over the past month and 5.18% over six months. Most of the damage came in a few days.
The whole sector took the hit. AT&T (NYSE:T) dropped 9.85% and T-Mobile US (NASDAQ:TMUS) dropped 13.27% in the same session, while the S&P 500 rose 0.6%. Verizon’s own results were mixed. Adjusted EPS of $1.30 beat the $1.27 estimate. But ARPA fell 1.4% and fixed wireless net additions fell 30.6%.
Arete’s $62 Target Depends on Cash Flow and Churn
Arete cut its target from $71.00 but kept its Buy rating. Its case has three parts: winning broadband share through fixed wireless, rising free cash flow as spending declines, and pricing power backed by low churn.
The cash flow numbers support the bulls. Free cash flow reached $6.426 billion last quarter, up 27.12%. Full-year guidance now calls for $21,940-$22,140 million. Verizon added 184,000 postpaid phone customers, compared with a loss of 9,000 a year earlier. Churn improved to 0.92%. Management raised EPS guidance to $4.99-$5.04 and expects service revenue growth of about 3.0% in Q3 and 4.0% in Q4. Those quarterly reports are the next tests. Schulman put it this way: “We are no longer predominantly reliant on expensive promotions to drive our growth.”
Arete’s broadband part leans on fixed wireless, the same segment where additions are slowing. Starlink also goes after rural and home internet customers. The wider Street is more cautious. Verizon has 3 Strong Buy ratings, 8 Buy ratings, 15 Hold ratings and no Sells.
All Three Carriers Fell, and T-Mobile Shows the Widest Gap
The peer group sold off together. Verizon fell alongside its rivals.
AT&T trades at $22.17. It is down 10.71% over the past month. Its $28.80 average target means 29.9% upside. Ratings tip bullish: 16 Buy-side ratings, 9 Holds and 1 Sell. Verizon does not offer as much consensus upside.
T-Mobile trades at $148.58. It is down 25.22% this year. Its $241.24 target means 62.4% upside, with 23 Buy-side ratings and 5 Holds.
T-Mobile has the largest potential upside in the group. Verizon’s consensus gap is the lowest of the three, and only Arete’s outlier target brings it near 50%. Price targets are estimates and can be wrong for any of these stocks.
Verizon Gains This Year but Lags the S&P 500
At $41.65, Verizon sits 22.7% below the $51.12 average target set by 26 analysts. The stock is up 9.23% this year. The S&P 500 is up 14.17% over the same period.
The stock trades at about 9x forward earnings and yields 6.12%.
Verizon’s Bull Case Comes With a Starlink Risk Attached
Optimism builds if churn keeps falling, service revenue growth reaches about 4% by year-end, and free cash flow lands within guidance while leverage moves toward the 2.0 to 2.25 times target. The bear case gains weight if Starlink pushes down rural wireless and home internet pricing and forces Verizon back into expensive promotions while carrying $136.5 billion in unsecured debt.
On balance, the data tip positive. The consensus gap of 22.7% looks more realistic than Arete’s 48.9%. A single-digit earnings multiple and a 6% yield pay investors while the satellite threat plays out.
The post Verizon’s Had A Difficult 6 Months: This Wall Street Research Firm Says It Will Provide Roughly 50% Returns From Here appeared first on 24/7 Wall St..
]]>On October 8, 2026, an ARK Invest fund sold 29,048 shares of SpaceX (NASDAQ:SPCX). At that day’s close, the shares were worth about $4.7 million. The stock fell 4.19% that session and closed at $160.57.
At 4:17 p.m. ET, after the close, Grain Management announced a definitive agreement to sell its nationwide 800 MHz spectrum portfolio to SpaceX. ARK’s funds trade during market hours, so the sale went through before anyone outside the deal knew about it. That timing was unlucky, and the wireless carriers turned out to be the bigger story.
On October 9, T-Mobile (NASDAQ:TMUS) fell 13.27%, AT&T (NYSE:T) fell 9.81%, and Verizon (NYSE:VZ) fell 8.75%. SpaceX rose a more modest 1.25% to $162.57.
How the Sale and the Announcement Lined Up

ARK releases each day’s trades after the market closes, so the October 8 trim only became public after Grain’s news was already out. That disclosure order is why the trade looks well timed in hindsight.
ARK also sold 54,873 shares on October 6, worth about $9.4 million. It reportedly sold another 22,276 shares on October 9, after the news was public. If ARK had known about the deal, selling into it would make little sense.
What SpaceX Actually Signed
The agreement covers up to 14 MHz of paired 800 MHz spectrum. Low-band signals travel farther and pass through walls better than the higher frequencies satellite services have mostly relied on. That matters if the goal is reaching an ordinary phone indoors.
The agreement is signed, but it still needs FCC approval. Neither company disclosed the price. The Wall Street Journal reported it at about $8 billion in cash. Grain is private, so that reported figure is the only number linked to it.
Elon Musk called the deal “the last critical piece of the spectrum puzzle needed for SpaceX to provide complete phone coverage in America.” Responding to Chamath Palihapitiya on X on October 8, he wrote: “To those who understand the spectrum wars, it’s an earthquake.” Because Musk speaks for the buyer, read both lines as a pitch.
Why the Carriers Took the Bigger Hit
A satellite company with nationwide low-band spectrum could become a fourth national wireless competitor. T-Mobile, which closed at $148.58, fell the most, likely because its growth story depends most on winning customers from rivals.
Verizon closed at $41.65 and AT&T at $22.18. SpaceX still has no retail stores, no existing phone subscribers, and no FCC approval, and a regulatory review gives the carriers time to respond. Drops that steep likely overstate how close that threat is, since it remains remote and still lacks approval.
ARK bought about 3.3 million shares on IPO day, and its SpaceX stake across all its funds is reportedly worth about $979 million. The three cuts are small next to that.
On October 8, ARK also sold three large technology holdings, the biggest worth about $14.3 million. It bought 159,918 shares of Kratos Defense (NASDAQ:KTOS), worth about $6.7 million. Trimming a winner to fund new positions is portfolio management, and it says little about the company.
What the Valuation and FCC Review Mean for SPCX
SpaceX went public at $135 on June 12, 2026, and it is now valued at $2.21 trillion. Second-quarter revenue came in at $7.81 billion, with a net loss of $541 million and $18.37 billion spent on capital projects.

Forbes has reported that SpaceX plans to raise $40 billion to buy AI chips. The spectrum deal adds another large cash commitment on top of that. At this valuation, the stock price already assumes the phone business will work.
SPCX’s valuation leaves little room for setbacks. Verizon’s selloff, by comparison, likely treats a competitor that still needs FCC approval as though it were already selling service.
The key test is the FCC’s decision on the Grain transfer. If the agency denies or conditions the transfer, or if SPCX closes below its $135 IPO price, the bearish case gets stronger. A clean approval, along with a named launch date, would weaken the case.
The post Cathie Wood Sold SpaceX Stock the Same Day It Dropped Its Spectrum Bombshell appeared first on 24/7 Wall St..
]]>A nationwide spectrum purchase by SpaceX (NASDAQ:SPCX) is reshaping the competitive map for U.S. wireless, and the established carriers are taking the hit. SpaceX stock is at $166.89, up 4% in morning trading, as the deal opens a new revenue path for Starlink. The move drives the company further from satellite broadband into a cellular business the carriers have long controlled.
Meanwhile, Verizon Communications (NYSE:VZ) shares are at $43, down 7%, as the market prices in a well-funded rival for wireless subscribers. AT&T (NYSE:T) stock is at $22.97, also down 7%.
The SPDR S&P 500 ETF Trust (NYSEARCA:SPY) is up 0.38%, so the carrier selloff is unfolding against a stronger broad market. The Communication Services Select Sector SPDR ETF (NYSEARCA:XLC) is flat, since that fund leans on large internet platforms rather than the carriers.
Spectrum Deal Turns Starlink Into a Wireless Rival
SpaceX said late Thursday it will acquire a nationwide low-band spectrum portfolio. The purchase positions Starlink, the company’s satellite broadband business, to run as a standalone cellular network in the U.S., a step beyond serving as a direct-to-cell add-on for existing carriers. Low-band spectrum penetrates buildings, and that property is what makes a satellite operator competitive against terrestrial networks.
Starlink’s mobile ambitions have been building. Before this deal, SpaceX had secured U.S. spectrum through an approved EchoStar license transfer and lined up international Starlink Mobile partners including SoftBank, NTT Docomo and Spark NZ. The nationwide coverage turns a partnership model into a head-to-head threat.
Satellite Constellation Meets Terrestrial Towers
SpaceX is vertically integrated across launch, spacecraft and satellite broadband, and its connectivity business owns the constellation itself. Verizon and AT&T own terrestrial networks and licensed spectrum. A satellite operator buying land-based spectrum reaches the same subscribers from a different asset base.
That asymmetry anchors the bear case, as a well-capitalized competitor moving into direct competition for wireless subscribers could pressure both carriers’ customer bases over time, and the selloff reprices competitive risk while reported results stand where they did before the announcement.
The optimistic view rests on the time and capital a nationwide network takes to build, which leaves carrier subscriber bases intact in the near term. AT&T chief executive John Stankey, speaking at the Goldman Sachs Communacopia conference in September, called Starlink a strong solution for airlines, rural territories and connected vehicles, and described satellite service as partly complementary through wholesale.
What to Watch Next
The open question is how quickly SpaceX can turn Starlink into a working independent cellular network across the U.S. Investors can watch for details on Starlink’s rollout timing, device support and pricing, since those specifics could decide whether the carrier selloff deepens or fades.
T-Mobile faces the same question, and any response from the three carriers on pricing or satellite partnerships could reshape the competitive picture, especially given Stankey’s wholesale framing, as AT&T’s next comments on Starlink may carry extra weight.
A repricing of competitive risk can outpace any change in subscriber numbers. Carrier shareholders should size their positions for a multiyear contest. SpaceX investors may want to watch for whether the gain holds as the cost of a nationwide build comes into focus.
The post SpaceX Climbs 4% on Nationwide Low-Band Spectrum Deal for Starlink Mobile; Verizon and AT&T Drop 7% appeared first on 24/7 Wall St..
]]>For years, a satellite company needed your phone carrier’s airwaves to reach your phone, but SpaceX (NASDAQ:SPCX) can now reach phones using spectrum it owns.
This week, the Federal Communications Commission authorized SpaceX to build a 15,000-satellite constellation at 326 to 335 kilometers, linking directly to ordinary phones. The order was reported Oct. 7, 2026. It came from an FCC bureau rather than the full commission, so it can still be reviewed.
AST SpaceMobile (NASDAQ:ASTS) fell 3.91% to $60.65, and Verizon (NYSE:VZ) slipped 0.48% to $45.76. AT&T (NYSE:T) rose 0.18% to $24.48, while T-Mobile US (NASDAQ:TMUS) gained 1.04% to $167.65.
SpaceX fell 2.51% to $167.60, but that decline followed a separate report on a $40 billion chip-financing plan rather than the approval.
Waiver Removes the Carrier as Gatekeeper
Satellite-to-phone rules assumed the satellite operator would lease spectrum from a carrier, making the carrier a gatekeeper. SpaceX now owns about 65 MHz of spectrum, bought from EchoStar (NASDAQ:SATS) in two deals totaling about $19.6 billion. The Federal Communications Commission waived the leasing rule, writing that “Requiring SpaceX to enter into a leasing arrangement with itself would be an unnecessary regulatory burden.”
The Federal Communications Commission said the grant promotes “competition in the provision of retail wireless services to American consumers.”
SpaceX President Gwynne Shotwell said the acquired spectrum “has terrestrial components, so we definitely intend to build out terrestrial.” Shares of AST SpaceMobile and Verizon fell.
Authorization Today, Service Years Away
SpaceX has a license and spectrum, but the constellation has no satellites in orbit yet, and the service has no price or subscribers. Launches begin in late 2027. The acquired bands can’t be used commercially until the EchoStar deal’s later stage closes, which is expected by Nov 30, 2027. Half the constellation must be in orbit by Oct 7, 2032, and all of it by Oct 7, 2035.
SpaceX claims the network “will deliver 5G speeds of up to 150Mbps per user,” far faster than its current direct-to-cell satellites. But satellite beams share capacity across wide areas, so per-user speed under real load is unproven.
AT&T and Verizon face the most exposure over time but least right now, as their AST SpaceMobile deals depend on a network not yet built.
T-Mobile is SpaceX’s current direct-to-cell partner and future competitor. The waiver removes the leverage that partnership provided.
AST SpaceMobile’s case rests on being the carrier-friendly alternative. A well-funded operator that needs no carrier partner weakens that case directly, which explains why AST fell hardest.
Carriers Answer With a Joint Venture
AT&T, Verizon and T-Mobile established a satellite-to-phone joint venture on Oct 2, 2026, which suggests they expected this, although a joint venture still needs satellites from another company.
The FCC votes on Oct. 29, 2026, on auctioning 25 MHz of spectrum for direct-to-device service. FCC Chairman Brendan Carr framed the goal as “leveraging this cutting-edge tech to end cell phone dead zones.”
What the Approval Means for SpaceX Investors
This order extends a business that already works, although the payoff is likely years away. Starlink subscribers doubled to 12.0 million, and SpaceX holds $93.52 billion in cash, which reduces its need for carrier help.
SpaceX holds a stronger position in direct-to-device than AST SpaceMobile, which has 13 spacecraft in orbit and a model dependent on carriers, just as a rival stops needing them.
If the Oct 29 vote advances an auction that the carriers’ venture can win, SpaceX’s lead narrows, and if launches haven’t begun by the end of 2027, this approval will likely remain a license without a working network.
The post SpaceX Just Got Permission to Compete With AT&T and Verizon From Orbit appeared first on 24/7 Wall St..
]]>The 10-year Treasury yield closed at 5.31% as of October 5, 2026, the high of the past month. Any dividend stock has to clear that bar. The five names below try to clear it with cash flow that comes from contracts: decades-long triple-net leases, monthly wireless and fiber bills, and fee-based pipeline volumes. Dividend safety comes first in each entry. A big yield only counts when the payout is covered, the balance sheet can carry it, and the dividend record shows how management acts under pressure.
VICI Properties: An 8% Yield Driven Mostly by a Falling Stock
VICI Properties (NYSE:VICI) offers a forward dividend of $1.84 annualized. At a share price of $22.62, that works out to a very high yield of 8.13%. Most of that yield comes from the share price. The stock is down 24.93% over the past year, 15.28% year to date and 9.32% in the past month alone. Over the same stretch, the dividend rose only slightly. Investors have been marking the stock down on concerns about a shifting gaming landscape and softer Las Vegas travel .
Dividend safety read: The fundamentals look much calmer than the chart. Management raised full-year 2026 AFFO guidance to $2.45 to $2.47 per diluted share. Against the forward dividend, that puts the payout at about 74.8% of the guidance center. The portfolio is 100% occupied, with a 39.6-year weighted average lease term and 2.0% annual escalators on most leases. The board raised the quarterly dividend from $0.45 to $0.46, payable October 8, 2026. The dividend record shows at least one increase in every year from 2018 through 2026, with flat quarters in between.
Bull case: Q2 AFFO came in at $0.62 per share (+4.6% YoY), and VICI added three tenants, bringing the total to 16. GAAP EPS of $0.48 missed the $0.71 estimate, but the miss came from a $271.1M non-cash credit-loss charge, so cash flow was unaffected. The average analyst target is $31.67. Chief Executive Edward Pitoniak said “VICI’s partner-driven model will continue to generate attractive, durable growth.”
Risk: Two tenants dominate the rent roll. Caesars Entertainment accounts for about 38% of rent and MGM Resorts for about 32%, and total debt is about $17.2B. If Las Vegas weakness reaches tenant balance sheets, the market will keep marking down the stock.
Omega Healthcare Investors: First Dividend Raise in Years With Coverage to Back It
Omega Healthcare Investors (NYSE:OHI) raised its quarterly dividend to $0.68 from $0.67, which puts the annualized forward payout at $2.72. At $44.89, the high yield is 6.06%. This yield has held up while the stock rose. Shares are up 16.41% over the past year.
Dividend safety read: Full-year AFFO guidance is now $3.22 to $3.26 per diluted share, which puts the payout at about 84.0% of the center. Coverage is the tightest on this list, but it is improving. Q2 funds available for distribution rose 6.3% to $0.78 per share. Operator EBITDAR coverage climbed to 1.65x from 1.55x. Omega held the dividend at $0.67 from the January 2020 ex-date through early 2026. It never cut through the pandemic, and its record of quarterly payments goes back to 1999.
Bull case: Q2 revenue rose 16.2% YoY to $328.2M, the company’s fifth consecutive earnings beat. Omega invested $126M in Q2 and another $93M in July, including its first U.K. care-home acquisition. Retiring CEO Taylor Pickett called the current environment “the most favorable operating backdrop that I have known in my career.”
Risk: Operator Genesis Healthcare is in Chapter 11 with $148.5M in loans outstanding. A CEO transition and Medicaid reimbursement policy are also live variables for a skilled-nursing landlord.
W. P. Carey: Steady Quarterly Raises Since the Reset
W. P. Carey (NYSE:WPC) declared a quarterly dividend of $0.95, payable October 15, 2026. The annualized forward rate is $3.80, a high yield of 5.94% at $63.93. Part of that yield comes from a recent 7.83% one-month decline.
Dividend safety read: AFFO guidance was raised to $5.19 to $5.27 per share, so the dividend takes about 72.7% of the center, the most conservative REIT payout here. Net leverage relative to EBITDA is 5.5x, and 95% of debt is fixed-rate at a weighted average of 3.2%. W. P. Carey cut its quarterly payout from $1.071 to $0.86 in late 2023 after selling office properties. Since then it has raised the dividend every quarter.
Bull case: Q2 AFFO of $1.34 beat the $1.24 estimate. Occupancy is 98.5%, and 47.8% of rent is tied to CPI escalators, a built-in inflation hedge when Treasury yields are climbing. Investment volume reached $1.3B year to date. CEO Jason Fox pointed to “AFFO growth now above 5% at the midpoint.”
Risk: Impairment charges were $79.4M in Q2, and European same-store rental income fell 2.6% in constant currency.
AT&T: Lowest Yield Here, Deepest Free Cash Flow Cushion
AT&T (NYSE:T) pays $0.2775 per quarter, or $1.11 a year. The $24.73 share price gives a 4.49% yield, below the 10-year Treasury. AT&T wins its spot on dividend safety and total return.
Dividend safety read: Full-year 2026 free cash flow guidance is $18B+. With about $7.61B in annual dividend cost, payouts account for roughly 42.3% of that free cash flow. Q2 alone produced $4.67B. The dividend was cut from $0.52 to $0.2775 in 2022 and has been flat since. AT&T is no Dividend Aristocrat.
Bull case: Adjusted EPS of $0.65 beat the $0.59 estimate. AT&T added 432K postpaid phone subscribers with churn of 0.86%, and fiber now reaches 38.6M locations. Management aims to return $45B+ to shareholders through 2028 and accelerated 2026 buybacks to about $10B.
Risk: Total debt of $144B and net debt to EBITDA of 2.68x sit above the company’s 2.5x target. That makes dividend growth unlikely until leverage comes down.
Energy Transfer: Ultra-High Yield Even After a 32% Rally
Energy Transfer (NYSE:ET) raised its quarterly distribution to $0.34 per unit, or $1.36 annualized. At $20.54, the units carry a very high yield of 6.62%, even though they are up 32.57% over the past year. Rising payouts are keeping this yield high, the best reason a yield can stay elevated.
Distribution safety read: Distributable cash flow of $2.70B+ per quarter against about $1.17B in distributions means coverage of roughly 2.3x. Q2 adjusted EBITDA rose 31% to $5.07B, and full-year guidance was raised to $18.8B to $19.1B. The company announced its nineteenth consecutive quarterly increase on July 27, 2026. That streak began after Energy Transfer cut its distribution in October 2020.
Bull case: Demand for natural gas from data centers and power plants is feeding new projects, including the Hugh Brinson Pipeline and the Nederland NGL export expansion . NGL exports rose 25% in Q2. The average analyst target is $24.74.
Risk: Total liabilities are $97.4B, interest expense is rising and some divisions carry commodity exposure. Unitholders also get a K-1 tax form, which complicates tax filing and makes the units awkward to hold in some retirement accounts.
Five Income Streams Built on Contracts
W. P. Carey and Energy Transfer offer the clearest mix of coverage and growth. Omega’s raise shows confidence from a landlord whose operators are getting best. VICI’s ultra-high yield mostly reflects a stock price that has been under pressure while the leases keep paying, and AT&T trades a lower yield for a free cash flow buffer the REITs cannot match. With the 10-year Treasury at 5.31%, these five names show where contract-backed cash flow can still compete with it.
The post 5 High-Yield Dividend Stocks Built to Beat a 5.31% Treasury appeared first on 24/7 Wall St..
]]>Verizon (NYSE:VZ) orAT&T (NYSE:T): Which yield can you trust to keep paying, and growing, for the next decade? I pick Verizon, and the gap between the two is wider than the reported yields suggest.
At recent prices of $45.40 and $24.11, Verizon’s $2.83 annualized dividend yields about 6.2%, while AT&T’s $1.11 yields about 4.6%. A yield is only worth something if the payment behind it holds up, so I compared the two on coverage, debt and operating momentum.
Dividend Coverage and Free Cash Flow: Verizon Wins
AT&T makes its strongest case here. Its payout comes to about 49% of the low end of its 2026 adjusted EPS guidance of $2.25-$2.35. Verizon’s comes to roughly 57% of its $4.99 to $5.04 range. On paper, AT&T’s dividend is better covered.
The cash flow points the other way. Verizon raised its 2026 free cash flow guidance to $21.94 billion to $22.14 billion, which works out to growth of 9% to 10%, on CapEx of $16 billion to $16.5 billion. AT&T targets more than $18 billion while spending $23 billion to $24 billion on CapEx. Management also says 2026 dividends plus buybacks will use up “essentially 100% of our outlook for free cash flow.” Verizon pays for a rising dividend, buybacks of up to $4.5 billion and debt reduction out of the same cash. AT&T also expects its legacy EBITDA to turn negative after 2027.
Balance Sheet and Debt: Verizon Wins Clearly
Both companies took on debt to buy fiber. The Frontier deal drove Verizon’s net unsecured debt to adjusted EBITDA to 2.5x, up from 2.2x, and interest expense rose 18.9% in Q1. That pressure is real, but leverage is heading down. CFO Tony Skiadas said earlier this year, “We remain firmly on track to achieve our target net unsecured leverage ratio of 2x to 2.25x during the 2027 timeframe.”
AT&T’s leverage is 2.68x on $144 billion of total debt, already above its target. Management expects leverage to rise to the 3.2x range after the EchoStar (NASDAQ:SATS) spectrum purchase and to return to 2.5x only within approximately three years. For a dividend that has already been cut once, leverage is moving the wrong way.
Subscriber and Revenue Trajectory: AT&T Wins
Right now AT&T is the stronger operator. Its Q2 revenue grew 2.3%, while Verizon’s fell 0.7%. AT&T added 432,000 postpaid phones with churn at 0.86%. Verizon added 184,000 with churn at 0.92%. AT&T also guides to a double-digit three-year adjusted EPS growth rate (CAGR) through 2028.
Verizon’s turnaround is building. A year earlier it lost 9,000 postpaid phones, and its EBITDA margin has since expanded to 40.1% from 37.1%. Even so, AT&T takes this round.
Track Record Settles the Decade Question
Verizon’s January increase was its 20th consecutive year of raises. Its quarterly payment has gone from 64 cents in 2022 to 70.75 cents. AT&T cut its quarterly dividend from 52 cents to 27.75 cents in 2022, a reduction of about 47%, and plans to hold $1.11 flat through 2028. Over 10 years, Verizon’s adjusted share price rose 53.02%, compared with 44.21% for AT&T.
Verdict: Verizon Is the Yield to Trust
Verizon wins for anyone who needs income that grows and lasts a decade. It pays the higher yield, produces more free cash flow on lower capex, and its leverage is falling while AT&T’s is rising. That is the whole idea behind a dividend ladder you never have to sell out of, which we laid out in a free guide here. AT&T fits total-return investors who want operating momentum and about $24 billion of buybacks over 2026 to 2028, and who can accept a frozen dividend.
Here is what would break the Verizon case. If the subscriber turnaround stalls and competition forces management to dip into what it calls its “large war chest,” getting leverage down would take longer than 2027, and dividend growth would likely shrink to small raises. Keep an eye on postpaid phone adds against guidance for the upper half of the 750,000 to 1 million range.
The post Verizon or AT&T: If I Had to Trust 1 of These Yields for the Next Decade, This Is It appeared first on 24/7 Wall St..
]]>D-Wave Quantum (NYSE:QBTS) is trading at $15.79. The consensus price target sits at $34.65, which means about 119% upside.
D-Wave is the only quantum computing company pursuing both annealing and gate-model systems. It runs production workloads for customers such as AT&T (NYSE:T) and Optum. In January 2026, it acquired Quantum Circuits to add gate-model capability.
The most bullish call on the stock comes from Rosenblatt Securities analyst John McPeake, who holds the Street-high $43.00 target. That target means about 172% upside from here.
A Revenue Miss and Rising Costs Pushed D-Wave Down Nearly 40%
Second-quarter revenue of $3.08M came in 23.63% below the $4.03M consensus and was about flat year over year. GAAP EPS of -$0.13 missed the -$0.0914 estimate.
Operating expenses nearly doubled to $54.98M, and adjusted EBITDA loss grew 85% to $37.1M. Cash and investments fell to $546.2M from $819.3M, with more than 90% of that drop due to the about $250 million cash payment for Quantum Circuits. Share count grew from 266.6M to 358.7M during fiscal 2025.
The stock is down 39.62% year to date and 66% below its 52-week high of $46.75. Other quantum stocks fell too, but D-Wave has the worst year-to-date loss in the group.
Rosenblatt’s $43 Call Rests on Annealing Already Earning Revenue
Of the 17 analysts tracked, 1 rates it Strong Buy, 15 rate it Buy and 1 rates it Hold. None rate it Sell. Rosenblatt reiterated its Buy rating despite the miss.
Rosenblatt’s view: D-Wave leads in commercial annealing systems that solve optimization problems today. Leap should generate high-margin recurring cloud revenue as customers move from pilot programs into production. Hybrid quantum-classical solvers deliver value now, so customers don’t wait for fault-tolerant machines.
First-half bookings reached $35.5M versus $2.9M a year earlier. Remaining performance obligations rose 668% to $40.7M, with about 57% recognized within 12 months. D-Wave has six customer applications in production.
Management expects third-quarter revenue to be “up modestly” and fourth-quarter revenue to be “up significantly,” with two annealing systems likely shipping in the fourth quarter. D-Wave doesn’t expect significant gate-model cloud revenue until 2032. Price targets are not guarantees, and this one depends on annealing doing the heavy work for years.
Quantum Stocks Fell Together, and D-Wave Fell Hardest
Every stock in the peer group sold off. D-Wave’s decline was sharper than its peers’.
IonQ (NYSE:IONQ) is down 3.52% year to date at $43.33. Its average target of $66.63 means about 54% upside. Analysts rate it 1 Strong Buy, 11 Buy, 2 Hold.
Rigetti Computing (NASDAQ:RGTI) is down 31.51% year to date at $15.17. Its target of $28.52 means about 88% upside. Ratings: 1 Strong Buy, 8 Buy, 4 Hold.
Quantum Computing Inc. (NASDAQ:QUBT) is down 23.39% year to date at $7.86. Its target of $18.67 means about 138% upside. Six analysts cover it (4 Buy, 2 Hold).
Quantum Computing Inc. has the largest consensus upside on paper. D-Wave ranks second and has the widest and most bullish analyst coverage in the group.
D-Wave Is Down 39% While the S&P 500 Rises
D-Wave trades at $15.79, less than halfway to its $34.65 consensus target. The stock is down 39.62% year to date, while the S&P 500 is up 14.25%.
Shares have fallen 4.76% over the past month and trade below the 50-day average of $18.14 and 200-day average of $20.80. On trailing revenue of $12.425M, the stock trades at a price-to-sales ratio of 481.83.
D-Wave’s Fourth-Quarter Deliveries Will Test the 172% Call
The case for the stock gets stronger if both annealing systems ship in the fourth quarter, the backlog turns into revenue on schedule and Leap’s production customers like Optum and AT&T expand their work. That path could close much of the gap to the consensus target.
The bear case gains weight if fourth-quarter deliveries slip into 2027, spending keeps outpacing revenue and D-Wave issues more shares to fund a gate-model program that won’t produce significant revenue until 2032. In that case, today’s low price would be a value trap.
The production customers and backlog are real, and analysts are almost unanimously positive. The fourth quarter has to deliver before Rosenblatt’s $43.00 target looks realistic.
The post D-Wave Quantum Crashed in 2026: One Wall Street Pro Predicts 170% Returns by 2027 appeared first on 24/7 Wall St..
]]>Dividend-growth screens often flag a flat payout as a warning. That reaction can cost income investors money. A cut means the cash ran short. A freeze supported by earnings and free cash flow means management is sending money to debt paydown, a capital program or a cyclical recovery while the quarterly check still comes in.
One stock below has paid the same $0.40 per share every quarter since its 2019-03-07 ex-dividend date. None of these four companies has raised its dividend in years, and each still covers its payout. For each one, we also lay out what would turn the freeze into a cut (and if you want the opposite exercise, the red flags that say a big yield really is about to be cut, we put the seven of them in a free report here: Dividend Traps).
AT&T: Fiber Cash Flow Keeps a Frozen Payout Well Fed
AT&T (NYSE:T) yields 4.55% at a share price of $24.32. The quarterly dividend has held at $0.2775 since the 2022-04-13 ex-dividend date. That level came after AT&T reduced the payout from $0.52 around the WarnerMedia spin-off, and it has stayed flat ever since.
The freeze funds for a heavy build-out. AT&T plans $23 to $24 billion of capital investment this year and is aiming for 60M+ fiber locations by 2030. The EchoStar (NASDAQ:SATS) spectrum deal is plans to lift net leverage from 2.68 times to the 3.2 times range, with a return to about 2.5 times within around three years.
Coverage read: The annual dividend of $1.11 stands against full-year adjusted EPS guidance of $2.25 to $2.35. Second-quarter free cash flow came in at $4.7 billion, above management’s $4 to $4.5 billion guidance range. Full-year free cash flow guidance is $18B+. On the call, the CFO said buybacks plus dividends will total “approximately $18 billion this year, which is essentially 100% of our outlook for free cash flow.” Around $10 billion of that is buybacks, which management can scale back before it ever impacts the dividend.
Here is the bull case: the stock trades at a trailing P/E of 8 and a forward P/E of 10. Free cash flow guidance rises to $19B+ in 2027 and $21B+ in 2028. CEO John Stankey called the stock “incredibly undervalued” on the second-quarter call.
What turns the freeze into a cut: Free cash flow would have to fall well short of the $18B+ guide, and leverage would have to stay stuck near the 3.2 times range even after buybacks are cut back.
Risk: Legacy-segment EBITDA went down about 46% as AT&T phases out its copper network, and it is plans to turn negative after 2027.
Kraft Heinz: Ultra-High Yield With Free Cash Flow Doing the Heavy Lifting
Kraft Heinz (NASDAQ:KHC) is the only ultra-high-yield name here, yielding 7.04% at $22.21. It cut the quarterly dividend from $0.625 to $0.40 in 2019. It has paid exactly that amount on every listed dividend through the 2026-09-04 ex-date.
The freeze funds debt reduction and brand reinvestment. The company “paid down $1.9 billion of debt in the quarter” and phases out another $1 billion after the quarter closed, management said. It also added $100 million of brand investment, almost all of it in marketing.
Coverage read: The headline GAAP net loss of $5.46B came from a $7.4B non-cash impairment, so no cash left the building. Adjusted EPS guidance was raised to $2.03 to $2.09, against an annual dividend of $1.60. First-quarter free cash flow rose 58.9% to $766M, while cash dividends paid totaled $474M. Free cash flow conversion is plans at about 110% this year.
Here is the bull case: the stock trades at 0.783 times book value and a forward P/E of 11. Emerging Markets grew 10.4%. First-half market share loss narrowed to 30 bps, compared with 90 bps at the start of last year.
What turns the freeze into a cut: Quarterly free cash flow would need to slip below the around $474M quarterly dividend bill, with the new marketing spend failing to lift sales.
Risk: North America is weak. Segment adjusted operating income fell 15.8%, and the shares have lost 14.14% over the past month.
Dow: A Reset Dividend Now Backed by Self-Help Cash
Dow Inc. (NYSE:DOW) yields 5.07% at $27.98, which makes it a high-yield name. Dow paid $0.70 per quarter from 2019-05-30 through 2025-05-30 without a single raise. It then reduced the payout to $0.35 starting with the 2025-08-29 ex-date and has held it there through 2026-08-31. Dow has already been cut once. What matters for income investors now is whether the reset level holds.
The reason is the cyclical trough in commodity chemicals. Management has made debt reduction the first use of excess cash, ahead of buybacks.
Coverage read: Second-quarter free cash flow was $692M, compared with -$1.13B a year earlier. Dividends cost $253M in the quarter. Dow holds about $14 billion of available liquidity and has no substantial debt maturities until 2029. On the call, the CFO said the company will “continue to stay committed to” its investment-grade credit profile.
Bull case: Transform to Outperform is now plans to deliver more than $1.3B in self-help benefits this year. Management described those savings as largely independent of the economy. The shares are up 23.65% year to date and trade at a forward P/E of 14.
What turns the freeze into a cut: A return to negative free cash flow quarters like the year-ago -$1.13B, combined with self-help falling short, would put the investment-grade rating and the dividend in competition for the same cash.
Risk: Polyethylene pricing is volatile. Third-quarter EBITDA guidance of about $1.7 billion assumes a 10 cents per pound decline in integrated margins.
Hasbro: Magic Money Covers the Lowest Yield on the List
Hasbro (NASDAQ:HAS) yields 3.19% at $89.54. Its last raise took the quarterly dividend from $0.68 to $0.70 with the 2022-04-29 ex-date. Every payment since has been $0.70.
Hasbro has held the payout flat through a restructuring, debt paydown and a digital gaming push. Management plans digital investment to top out this year.
Coverage read: Trailing diluted EPS of $5.59 compares with an annual dividend of $2.80. First-half operating cash flow was $604 million. That funded $147 million of debt reduction and $239 million returned through dividends and buybacks. The buyback target also rose from $100 million to at least $200 million. CFO Gina Goetter said on the call: “we remain committed to our dividend.”
Bull case: Magic: The Gathering revenue reached $545.3M in the second quarter, up 32%. That was its first quarter above $500 million in more than 30 years. Full-year adjusted EBITDA guidance was raised to $1.45B to $1.50B, and the stock trades at a forward P/E of 13.
What turns the freeze into a cut: Magic growth would have to reverse during a weak holiday season for Consumer Products while digital spending is at its peak. Even then, the bigger buyback would likely be scaled back first.
Risk: Hasbro depends heavily on Magic. Wizards faces a tough fourth-quarter comparison, with about $40 million of revenue moving into next year’s first quarter.
Flat Payouts Still Backed by Cash Flow Heading Into the Next Earnings Reports
Each of the four companies has gone years without a raise, and all four still pay a dividend supported by earnings guidance or free cash flow. In each case, the cash a raise would have used is going to debt reduction, fiber, brand rebuilding or self-help programs. AT&T and Hasbro have the clearest coverage, Kraft Heinz pays the most income, and Dow has the most cyclical risk. Track free cash flow against the dividend bill, because that is where each cut trigger shows up first.
The post 4 Dividends That Have Not Been Raised in Years and Are Still Worth Owning appeared first on 24/7 Wall St..
]]>AT&T (NYSE:T) will pay its next $0.2775 quarterly dividend on November 2, 2026. That works out to $1.11 a year and a 4.53% yield. Its dividend has stayed flat since the April 13, 2022 ex-dividend date, when it dropped from $0.52. It has not been raised since. The cut came the same month AT&T spun WarnerMedia off and merged it with Discovery. So the company writing checks today is a different business, with different cash sources supporting the dividend.
Smaller Check, Wider Cushion
In 2021, dividends of $15.068 billion took about 59% of operating cash flow left after capex. In 2025, AT&T paid $8.18 billion, roughly 49% of its $16.586 billion in free cash flow. In Q2 2026, the $1.976 billion dividend used about 42% of the $4.67 billion in free cash flow.
Wireless and Fiber Now Carry the Load
The Advanced Connectivity segment brings in over 90% of service revenue and nearly all adjusted EBITDA. Last quarter AT&T added 432,000 postpaid phone subscribers, with churn at 0.86%. It also added 367,000 fiber customers, and 42.5% of its home internet customers now buy AT&T wireless as well. Management explained the logic on the earnings call:
“Our goal is not to maximize our crew of individual products, but instead to maximize total advanced connectivity service revenues in order to drive attractive returns on our investments in 5G and fiber.”
The old copper business is contracting quickly. Legacy service revenue fell 26%.
What Gets Paid Before Shareholders Do
Several bills come first. Capital spending is guided to $23 billion to $24 billion this year. Total debt stands at $144 billion, and interest expense rose 13.8%. Net leverage (net debt divided by adjusted EBITDA) is 2.68x, and management expects it to climb to about 3.2x after the EchoStar (NASDAQ:SATS) spectrum deal. Dividends plus buybacks will total about $18 billion in 2026, which management called “essentially 100%” of its free cash flow outlook. CEO John Stankey explained why buybacks got a bigger share:
“I probably have a bias that says I’d like to buy more of it back because I think it’s incredibly undervalued.”
How Verizon and T-Mobile Price the Same Business
Verizon Communications (NYSE:VZ) pays out more, at a 6.09% yield, but its quarterly revenue slid 0.7%. T-Mobile US (NASDAQ:TMUS) is the growth option. Its yield is just 2.5%, revenue grew 7.9%, and the stock trades at a forward P/E of 12. AT&T sits between the two, with 2.3% revenue growth and a forward P/E of about 10.
Answer for Investors Who Took the Cut
The $1.11 dividend is on stronger ground than the old $0.52 quarterly payout was. Coverage is wider, and the cash comes from subscription connectivity rather than debt-funded media assets. Management has committed to holding the payout steady through 2028, with free cash flow guidance of $19 billion+ in 2027 and $21 billion+ in 2028. Buybacks are the shock buffer: they can be scaled back before the dividend is cut. The stock is down 7.78% over the past year, which shows investors want to see the growth delivered first.
One risk could undo this view. If free cash flow growth stalls just as Legacy EBITDA turns negative after 2027, leverage could stay near 3.2x instead of returning to the 2.5x target. That would leave the dividend competing with debt repayment for the same cash. The fourth quarter’s expected free cash flow recovery is the next checkpoint.
The post AT&T’s Smaller Dividend Now Rests on Stronger Foundations appeared first on 24/7 Wall St..
]]>Income investors have a real alternative right now. The 10-year Treasury yielded 5.26% as of September 29, 2026, so any stock paying more has to earn that extra income with real cash. A headline yield only holds up if the company can keep funding it. Often a fat yield is the market signaling trouble the payout has not yet admitted.
Here is the test: a dividend is sustainable when the right earnings measure covers it, free cash flow pays for it after capital spending, and debt is not doing the heavy lifting. (We counted seven red flags that a fat yield is about to be cut in a free dividend trap guide, which is a useful checklist to run against the names below.)
Kraft Heinz (KHC): A Yield Built on a Falling Price
Kraft Heinz (NASDAQ:KHC) pays $1.6 per share a year, a dividend yield of 6.79%. The payout has not grown. The quarterly dividend has sat at $0.4 since 2020, down from $0.625 in 2018. Shares at $22.77 are down 59.24% over ten years. That marks a price-driven yield.
Earnings coverage is the second problem. A $7.4B impairment left trailing diluted EPS at -$2.88. Adjusted EPS guidance of $2.03 to $2.09 still covers the dividend, but organic sales are guided -0.5% to -2.0% and brand spending is rising $100M to ~$700M. Cash flow holds up for now: Q2 operating cash flow of $1.082B against capex of $189M and dividends of $475M. Hitting the ~110% FCF conversion target is what keeps this payout safe.
Verizon (VZ): Leverage Is Creeping Higher
Verizon (NYSE:VZ) yields 6.08% on a forward dividend of $2.83. Share price has worked in Verizon’s favor: shares are up 18.28% year to date, and the quarterly payout rose to $0.7075 from $0.69.
The warning sign is what the company owes. Total unsecured debt stands at $136.5B, and net unsecured debt to adjusted EBITDA rose to 2.5x from 2.2x at year-end 2025. Revenue slipped 0.7% and GAAP net income fell 22.9%, while a buyback target of up to $4.5B competes for the same cash. Cash flow offers support: Q2 free cash flow of $6.43B rose 27.1%.
Altria (MO): Raising the Payout on a Shrinking Base
Altria (NYSE:MO) just lifted its quarterly dividend to $1.11 from $1.06, a forward $4.44 on a $67.44 stock. Shares are up 22.63% year to date, so this yield reflects payout policy.
The danger is holding a dividend through structural stress. Stockholders’ equity is -$3.21B, cash fell 25% to $3.53B, and domestic cigarette volume dropped 5%. Marlboro share slipped to 39.7% and on! pouches lost 4.2 points. Adjusted EPS guidance of $5.56 to $5.72 covers the payout, but pricing power has to keep outpacing volume loss.
AT&T (T): A Cut Already on the Record
AT&T (NYSE:T) pays $1.11 a year, a yield near 5%, with shares down 9.29% over the past year. The quarterly dividend was $0.52 until it fell to $0.2775 in 2022, flat ever since.
Here the pressure is cash allocation plus debt. Q2 free cash flow of $4.67B fell 4.0%, while the quarter funded $1.976B in dividends and $2.194B in buybacks. Net debt to adjusted EBITDA is 2.68x, above the 2.5x target, and interest expense rose 13.8%. Buybacks give management a lever to pull before cutting the dividend, and FCF guidance of $18B+ supports the payout.
Pfizer (PFE): Free Cash Flow Trails the Dividend
Pfizer (NYSE:PFE) yields 5.99% on $1.72 a year, with shares down 13.48% over five years.
The sharpest warning is cash coverage: a free cash flow yield of 5.58% against a 6.01% dividend yield. Q2 operating cash flow was $835M against $2.451B in dividends, and trailing GAAP EPS of $0.76 sits below the payout. Net debt to EBITDA is 3.26. Adjusted EPS guidance of $2.80 to $3.00 covers it, and the chief executive said “even in the most stretched scenarios that we are running, we will be able to maintain our dividend.”
Medical Properties Trust: Expensive Debt Eats the Cushion
Medical Properties Trust pays $0.09 quarterly, a yield of roughly 7% to 8% on a stock that last filed at $4.70, after prior cuts. As a REIT, it should be judged on normalized FFO: $0.15 per share, a payout near 60%.
Debt is the threat. New secured notes carry a 9.25% coupon against a 5.37% weighted average rate, net debt to EBITDAre is 8.9x, and interest coverage is just 1.9x. Tenant HSA was paying 75% of agreed rent. Asset sales and no due dates until a roughly $600 million note in June 2028 buy time.
What to Watch Before the Next Declaration
Keep an eye on quarterly free cash flow against dividends paid, leverage ratios against stated targets, and whether buybacks decline first. When a cut comes, it usually pulls the share price down too, so the yield you locked in can cost principal. Yield by itself does not make a thesis.
The post 6 High-Yield Stocks Where the Market May Be Warning of a Dividend Cut appeared first on 24/7 Wall St..
]]>At the 24% bracket, a portfolio generating $50,000 in dividend income hands $12,000 to the IRS every year. What an investor actually keeps depends on where each stock sits.
In a taxable brokerage account, qualified dividends get long-term capital gains treatment. Nonqualified payouts, including most REIT distributions, are taxed as ordinary income at your marginal rate. Inside a Roth IRA, both arrive untaxed and qualified withdrawals stay tax-free.
Roth Versus Taxable: What You Keep on Each Position
A hypothetical $500,000 position yielding 8% produces $40,000 a year. At 24%, a taxable account keeps $30,400. A Roth keeps it all, a $9,600 annual advantage.
Apply that formula to six income names: Realty Income (NYSE:O), W. P. Carey (NYSE:WPC), Altria (NYSE:MO), Verizon (NYSE:VZ), AT&T (NYSE:T), and Chevron.
Realty Income
Realty Income yields 5.68%, paying monthly at $0.2715 per share. AFFO guidance of $4.44-$4.45 sits above the $3.258 forward dividend. REIT distributions face ordinary income rates, so a Roth shields the full payout.
W. P. Carey
W. P. Carey pays a $3.80 annualized dividend against a $64.15 share price, with its quarterly rate climbing from $0.86 in December 2023 to $0.95 in September 2026. AFFO guidance of $5.19-$5.27 covers the payout. Its distributions are mostly ordinary income, placing it beside Realty Income at the front of the Roth line.
Altria
Altria yields 6.13%, the highest here, after raising its quarterly dividend to $1.11 from $1.06. Adjusted EPS guidance of $5.56-$5.72 sits above the $4.44 forward rate. As yield rises, so do the dollars a taxable account generates each year.
Verizon
Verizon yields 6.08% on a $2.83 annualized dividend. Free cash flow guidance of $21.94 billion to $22.14 billion and adjusted EPS guidance of $4.99-$5.04 leave room above the payout. Its yield turns a low tax rate into a large annual dollar leak.
AT&T
AT&T yields 4.53% on a $1.11 annualized dividend held at $0.2775 quarterly since April 2022. Free cash flow guidance of $18 billion-plus and adjusted EPS guidance of $2.25-$2.35 cover it. With the payout flat, tax placement is one of the few ways to raise what an owner keeps.
Chevron
Chevron yields 3.18% on a $1.78 quarterly dividend, supported by $18.1 billion of Q2 free cash flow. Its dividends are generally qualified and taxed at capital gains rates, so it benefits least from a Roth in this group.
How Your Bracket Multiplies the Roth Advantage
Every dollar of ordinary dividend income costs your marginal rate in federal tax. The 2026 thresholds appear below:
| Bracket | Single Income Over | Joint Income Over | Tax per $1 of Ordinary Dividends |
|---|---|---|---|
| 22% | $50,400 | $100,800 | 22 cents |
| 24% | $105,700 | $211,400 | 24 cents |
| 32% | $201,775 | $403,550 | 32 cents |
| 37% | $640,600 | $768,700 | 37 cents |
A 37% filer can surrender up to 37 cents of every REIT dollar held outside tax-advantaged accounts. A 22% filer can surrender up to 22 cents. Placement decisions grow more urgent as the bracket rises.
Why the Gap Widens Every Year
The $9,600 from the example repeats annually. Inside a Roth, reinvested dividends buy shares whose future payouts are also untaxed. In a taxable account, tax trims each reinvestment first, so the shortfall compounds alongside the portfolio.
Limits That Slow the Move Into a Roth
Annual contribution limits cap new money, and income phase-outs bar higher earners from direct contributions. Conversions are the practical path for large balances but face ordinary income rates in the year of conversion. The five-year rule determines when earnings come out tax-free, so late-stage converters need a time. The cheapest years to convert are usually the quiet ones between your last paycheck and your first RMD, a window we sized up in a free Roth guide here.
Three Steps Before Your Next Tax Filing
- Pull your latest Form 1099-DIV and compare total ordinary dividends with the qualified portion for each holding. The nonqualified amount times your bracket is your annual Roth-avoidable cost.
- If Realty Income or W. P. Carey sits outside a tax-advantaged account, consider modeling how a phased Roth conversion of those ordinary-income REITs compares with Chevron.
- Run the conversion tax against the annual delta on your specific shares before assuming the upfront bill outweighs it.
The math tends to matter most for investors in the 24% bracket or higher who are at or near retirement, plan to hold income positions for decades, and can pay conversion taxes from funds outside the account.
The post A $500,000 Roth Portfolio Loaded With These Dividend Stocks Pays $40,000 a Year and the IRS Gets None of It appeared first on 24/7 Wall St..
]]>Income investors love a familiar name paying a fat check, and few names in the S&P 500 fit that description more comfortably than AT&T (NYSE:T). The stock traded around $25.21 on Sept. 28 with a 4.4% dividend yield, with a trailing P/E of 8 and a chart that has quietly returned 22.98% over five years. On the surface, this looks like the safest high-yield payer in telecom. The company’s own numbers say the payout has less breathing room than the headline coverage ratio suggests.
A dividend becomes unsustainable when the cash going out (payouts, CapEx, buybacks, interest) starts to press against the cash coming in, and management has to fund the shortfall with debt or asset sales. Coverage ratios on paper can look fine while the underlying free cash flow gets stretched thinner every quarter. That is the exact tension inside AT&T right now.
Why the Yield Reads as Safe
The optics are genuinely reassuring. AT&T pays a 27-cent quarterly dividend, or $1.11 annualized, and has held that rate steady across every ex-dividend date from January 2022 through July 2026. Full-year 2025 adjusted EPS came in at $2.12, and 2026 guidance sits at $2.25 to $2.35. Against that earnings base, the payout ratio on adjusted EPS lands near 52%, well inside what a mature telecom can carry.
Operating momentum is real. Second-quarter 2026 service revenue rose 2.7% year over year, adjusted EBITDA rose 5.2% and the company added 432,000 postpaid phone net adds and 646,000 internet net adds in the quarter. A MarketWatch analyst piece earlier this week even framed AT&T as the smartest bet in the wireless sector. So where is the warning?
Where the Coverage Gets Thin
The right lens for AT&T is free cash flow after capex, interest, and the competing shareholder-return commitments the company has already promised, rather than EPS. On the Q2 2026 call, CFO Pascal Desroches confirmed that planned share repurchases and dividend payments will total approximately $18 billion in 2026, against a full-year free-cash-flow outlook of $18 billion plus. Management itself called that “essentially 100% of our outlook for free cash flow.” There is very little slack for a miss.
That slack matters because capital investment is climbing, not falling. Second-quarter CapEx was $6.1 billion, versus $5.1 billion a year earlier, and full-year capital investment guidance stands at $23 billion to $24 billion annually through 2028 as fiber deployment accelerates toward 60 million locations by 2030. Buybacks are being pushed higher in parallel: the company now targets roughly $10 billion of repurchases in 2026, up from a prior $8 billion. Every dollar of buyback is a dollar not available to defend the dividend if free cash flow disappoints.
Balance Sheet Is Going the Wrong Way
Leverage is the second flashing light. On June 30, net debt to adjusted EBITDA sat at 2.68x, above the company’s stated 2.5x target. Total debt on the balance sheet stood at $162.888 billion, with total liabilities of $301.925 billion. Interest expense was up 13.8% year-over-year in Q2 2026.
Then comes the EchoStar spectrum purchase (roughly $23 billion) and the Lumen fiber acquisition ($5.75 billion). Desroches said net leverage will increase to the 3.2x range following the close of the EchoStar transaction, then return to a level consistent with the 2.5x target within approximately three years. Higher leverage during a period when the payout, the buyback, and the fiber build all need funding is the definition of a stretched capital plan.
A Yield That Is Elevated Because the Price Fell
The dividend rate itself has not grown. AT&T last reset the payout to 27 cents in January 2022, down from $0.52, and has held it flat since. Management guides to maintaining the $1.11 annualized dividend through 2028 with no raise attached, despite double-digit adjusted EPS growth. A dividend “held through stress” is a signal, not reassurance, and it is one of the classic warning signs we cataloged in a free report on dividend traps. The yield you see today is partly a function of price weakness: the stock is down 5.89% over the past year. Price-driven yield is a warning, not a feature.
The legacy business is the quiet accelerant. Legacy-segment service revenue fell 26% year over year, legacy EBITDA fell about 46% and AT&T expects legacy EBITDA to turn negative after 2027. That is a live cash-flow drag heading straight into the years when leverage is supposed to come back down.
What Would Have to Go Right
For the payout to hold comfortably, AT&T needs three things: free cash flow to reach the guided $19 billion in 2027 and $21 billion in 2028, cost savings to hit the promised $4 billion annual run rate by the end of 2028, and the EchoStar-driven leverage spike to reverse on schedule. Miss on any two of those and the board’s own words become relevant. CEO John Stankey told analysts, “This is a decision for the board. It’s not my decision to make exclusively.”
The single falsifiable metric to watch is quarterly free cash flow versus the combined dividend-plus-buyback run rate. If FCF trails the shareholder-return cadence for two consecutive quarters while capex stays elevated, the buyback gets cut first, and the dividend becomes the next lever the board can pull. A cut usually takes the share price with it, which is why yield alone is never a thesis. On the numbers AT&T itself publishes, this dividend is simply covered by less margin than the 52% payout ratio implies.
The post This Dividend Trap Is Yielding More Than 4% appeared first on 24/7 Wall St..
]]>Verizon (NYSE:VZ) pays a dividend yielding 6.01%. It now has two new growth drivers on top of that: the Frontier fiber network and early AI infrastructure revenue. Our 24/7 Wall St. price target for Verizon is $55.02 over the next 12 months.
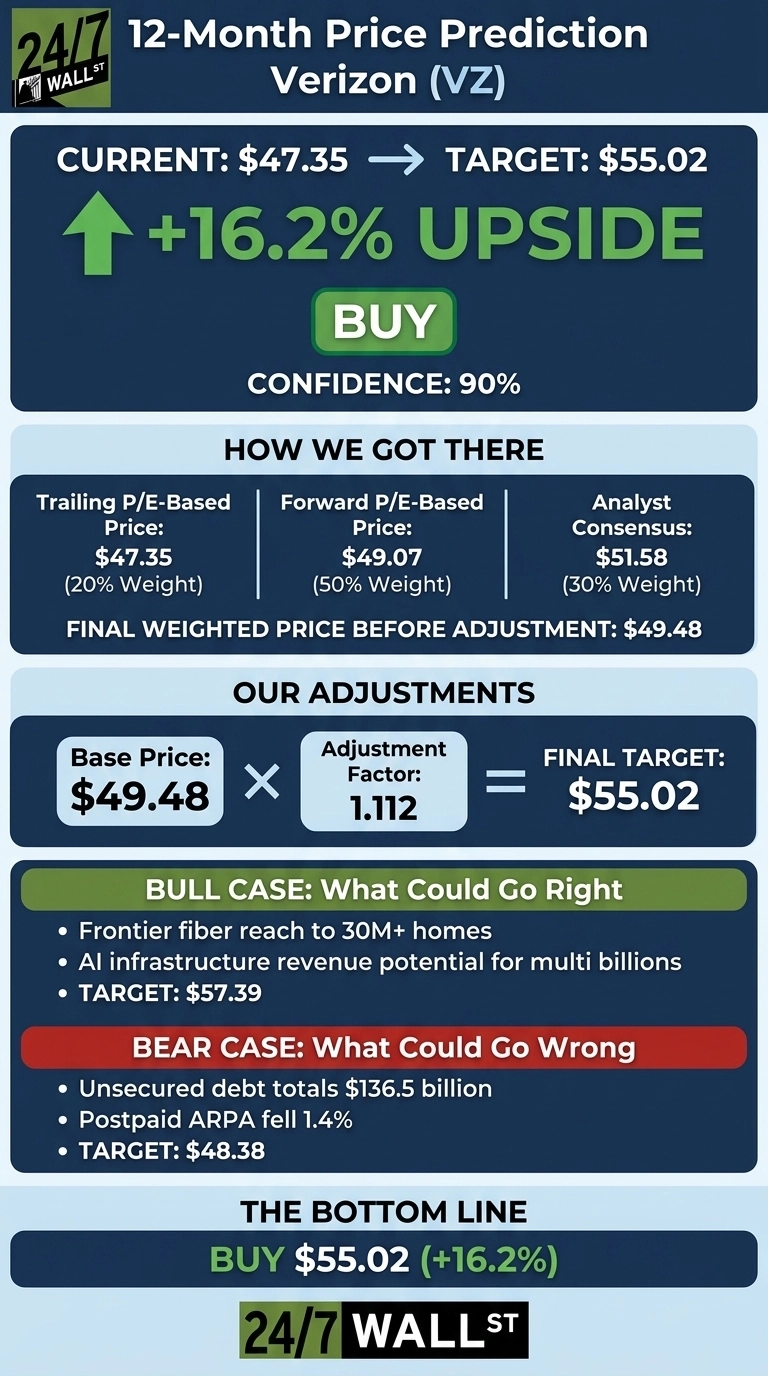
24/7 Wall St. Price Target Summary
| Metric | Value |
|---|---|
| Current Price | $47.35 |
| 24/7 Wall St. Price Target | $55.02 |
| Upside/Downside | 16.2% |
| Recommendation | BUY |
| Confidence Level | 90% |
Our model’s confidence is high. Verizon trades at about 9x forward earnings, and management raised full-year adjusted EPS guidance to $4.99 to $5.04. The yield pays shareholders while they wait for fiber and AI revenue to show up in the numbers.
Six Straight Beats, Yet Shares Cooled in September
VZ is up 21.46% year to date but has fallen 6.27% over the past month and 2.55% over the past week. It also lagged competitors on Tuesday (MarketWatch). Shares sit about 8.4% below the $51.67 52-week high and 29.5% above the $36.55 low.
Second-quarter adjusted EPS of $1.30 beat the $1.27 consensus, making it the sixth consecutive beat. Revenue fell 0.7% to $34.25 billion because Verizon by design pulled back on device subsidies. Service revenues rose 3.5%, and free cash flow grew 27.12%.
Why Bulls See $57 and Beyond
Verizon closed the Frontier deal on January 20, 2026, which extended its fiber reach to 30M+ homes and businesses. Management expects more than 32 million fiber passings by year-end and more than $1 billion in run-rate cost savings by 2028. Churn is almost 30% less on converged plans.
AI adds the second drivers. Earlier this year, management said hyperscaler talks carried “the potential for multi billions in revenues.” CEO Dan Schulman said in the second quarter that “with the emergence of AI infrastructure revenue, we are fundamentally reshaping Verizon’s growth trajectory.”
Among analysts, 2 rate the stock Strong Buy, 7 Buy and 16 Hold, with no Sell ratings. Our bull case is $57.39.
Debt and Softer ARPA Could Cap the Rally
Unsecured debt totals $136.5 billion, and leverage rose to 2.5x from 2.2x. Postpaid ARPA (average revenue per account) fell 1.4%, and GAAP net income dropped 21.07%.
That decline largely reflects $1.8 billion in pre-tax special items. Management also expects to repay substantially all of Frontier’s debt by the end of the year. Our bear case is $48.38.
Verizon Screens Cheaper Than AT&T and T-Mobile
| Company | Forward P/E | Dividend Yield |
|---|---|---|
| Verizon | 9x | 6.01% |
| AT&T | 10x | 4.39% |
| T-Mobile | 12x | 2.46% |
AT&T (NYSE:T) is Verizon’s closest rival in fiber-plus-wireless bundles. It added 432,000 postpaid phones last quarter, ahead of Verizon’s 184,000. The market pays a slightly higher multiple for that momentum and gets a lower yield in return.
T-Mobile (NASDAQ:TMUS) is the growth contrast, with service revenue up 9%. Our target implies about 11x forward EPS, which sits between AT&T and T-Mobile. That places the 24/7 Wall St. price target at a reasonable spot within the peer group.
Verizon Price Prediction 2026-2030
Our 24/7 Wall St. price target of $55.02 carries a buy rating at 90% confidence. What tips the scale for me is free cash flow guidance of $21.94 billion to $22.14 billion, which well funds the dividend.
The setup looks compelling to me if Verizon keeps paying down Frontier debt on schedule and puts numbers on AI deals. I’d grow conservative if ARPA keeps slipping while leverage stalls. On balance, I think the risk-reward favors shareholders.

| Year | 24/7 Wall St. Price Target |
|---|---|
| 2026 | $47.88 |
| 2027 | $55.07 |
| 2028 | $61.74 |
| 2029 | $66.79 |
| 2030 | $71.86 |
These projections assume Verizon keeps executing on convergence and cutting debt. AI infrastructure contracts could push results above this path, while pricing pressure from rivals could pull them below it.
The post The 6%-Yielding Blue Chip Has a New Catalyst appeared first on 24/7 Wall St..
]]>Clark Howard read a listener email on his September 23, 2026 podcast that will sound familiar to anyone who has tried to leave a wireless carrier. Luke in Virginia cancelled his T-Mobile cell and home internet after a price hike, moved his phone line to Visible at $29 a month, found a cheaper home internet option, and cut his bill by $30 a month. T-Mobile (NASDAQ:TMUS) then told him he still owed for the remainder of the billing cycle. The supervisor “wouldn’t budge.”
Howard’s verdict: “When you sign up for a technology service, they bill you starting that day, but when you cancel they say your service stays in effect till your next billing cycle. So they get you coming in, they get you going out.”
The stakes are small in any one month and large across a lifetime of switching. If you pay for four extra weeks every time you change providers on cell, home internet, streaming, and cloud storage, a typical household can give back $100 to $300 a year in service it never uses.
Clark’s Fix Is a Calendar
Howard is right, and the fix is timing. His guidance: “You can look and see when your billing cycle ends, then about four days before it, give yourself time to get the cutover done, switch your cell phone, that kind of thing, so you’re not double paying for any long period of time.”
Here is the math with round numbers. Say your current plan runs $80 a month and bills on the 15th. If you port your number to a new carrier on the 16th, the old carrier keeps the full $80 for the cycle that just started, and the new carrier begins charging you from day one. You have paid two providers for essentially the same 30 days. That is $80 gone.
Now run the same move on the 12th, four days before the cycle closes. The old carrier has already collected for the period you are using. The new plan starts, and by the 15th the old service simply lapses. The overlap is four days on a new $29 plan, roughly $4. You keep the other $76.
The mechanic is called an asymmetric billing period. Prorated cancellation credits used to be standard in wireless. The major carriers eliminated them years ago. AT&T (NYSE:T) and Verizon (NYSE:VZ) bill the same way T-Mobile does on this point. Howard’s claim that the practice is “pretty much universal” in tech services is accurate.
What Decides How Much You Save
Whether the four-day trick is enough depends on one thing: are you carrying a device installment balance?
Service only. Luke moved to a $29 Visible plan with no phone financing attached. His only exit cost is the leftover billing cycle. Timing the switch is the whole game, and Howard’s fix saves him almost the entire final month.
Phone on a 36-month installment plan. Say you took a $1,100 phone with a $30 monthly bill credit that only applies as long as you stay. Leave in month 12, and the remaining device balance accelerates onto your final bill. The unused-cycle charge is a rounding error next to that. Before you cancel, open the carrier app, find the “device payoff amount,” and add it to your exit math.
Carriers are steering exactly this way. On Verizon’s Q2 2026 call, chief executive Dan Schulman told analysts the industry has been “too dependent on free handsets being the solution for everything” and that “the era of just the free handset, that’s gone right now.” AT&T chief John Stankey has said the same thing in different words: converged wireless-plus-internet accounts produce “lower churn, outstanding brand affinity, higher lifetime values.” The subsidy is smaller than it used to be. The installment balance is real, and it is the number that will surprise you at the door.
What To Do Before You Cancel
- Find your billing cycle close date. It is printed on every bill and inside your carrier’s app under account details.
- Pull your device payoff figure. If it is more than a couple hundred dollars, decide whether to pay it, port to a carrier offering to cover it, or delay switching until the balance shrinks.
- Schedule the port about four days before cycle close. That leaves time for the number transfer and equipment return without paying two providers for the same weeks.
- Audit autopay after the switch. Confirm the old debit stops. Howard’s warning about the “inertia tax” applies double to canceled accounts that quietly keep charging.
The exit bill is a date on a calendar you can plan around.
The post ‘They Get You Coming In, They Get You Going Out’: Clark’s Fix for T-Mobile’s Exit Bill Trap appeared first on 24/7 Wall St..
]]>KeyBanc’s bearish turn on broadband is pulling Comcast Corporation (NASDAQ:CMCSA) lower, while the fiber carriers winning its customers barely shift. Comcast stock is down 2% to $21.66 as trading gets underway. That leaves Comcast stock down 20% year to date (YTD).
AT&T (NYSE:T) stock is at $25.39, down 0.2%, as the market shrugs off a thesis that frames the carrier as one of the rivals pulling broadband customers from Comcast. Similarly, Verizon Communications (NYSE:VZ) stock is down 0.2% to $47.24, holding steady as another fiber and fixed wireless competitor at the center of the downgrade.
The Communication Services Select Sector SPDR ETF (NYSEARCA:XLC) is down 0.1%, a small dip for a fund that held Comcast at a 4.7% weight as of June 30. Moreover, the SPDR S&P 500 ETF Trust (NYSEARCA:SPY) is up 0.3%, leaving Comcast stock falling against a rising broad market.
KeyBanc Cuts Comcast to Underweight
KeyBanc analyst Brandon Nispel downgraded Comcast to Underweight from Sector Weight with a price target of $18, citing broadband market share losses to fiber and fixed wireless competitors. Broadband is the larger of Comcast’s businesses, so erosion there hits the core of the investment case. Citi analyst Michael Rollins also cut his price target. He maintained a Buy rating, pointing to a more competitive broadband market and telecom fiber offers that have grown more promotional.

Rollins added that Comcast’s broadband share would take longer to reach equilibrium than he previously expected, and the Q2 2026 results show the pressure. Comcast reported 167,000 domestic broadband net losses in the quarter, while revenue from that business fell 5.5% to $6.28 billion. On the earnings call, Comcast Chief Financial Officer Jason Armstrong stated, “The broadband market remains highly competitive. Fiber continues to expand, fixed wireless remains aggressive, satellite is emerging as another alternative, and convergence-based promotional activity remains elevated across the industry.”
Fiber Rivals Hold Steady as Comcast Slides
AT&T and Verizon shares holding near their prior levels mark the selloff as a Comcast problem, concentrated in the one name whose largest business sits on the losing side of the broadband shift. Both carriers are on the winning side of the share movement Nispel described, and the same thesis that weighs on Comcast reinforces their fiber and fixed wireless pitch. That small dip in the sector fund fits the read, since Comcast is one of many holdings inside it.
Wall Street view on Comcast was already lukewarm before KeyBanc’s move, with 16 Hold ratings against 7 Buy ratings. KeyBanc’s Underweight joins a small bearish camp that includes 2 Sell ratings and 1 Strong Sell rating.

Comcast’s Spin-Off Anchors the Bull Case
The case against Comcast rests on broadband being the larger business while fiber competitors keep taking share in it, the concern behind both analyst actions. Comcast’s buyback is also paused through the separation process, removing one source of demand for Comcast stock while broadband losses continue. That combination leaves Comcast leaning on its media assets and wireless growth to offset a shrinking core.
Comcast’s supporters point to cash generation and the pending spin-off of NBCUniversal and Sky, which holders argue could value the separate pieces above what the combined company gets now. Comcast stock carries a low multiple. At a price-to-earnings (P/E) ratio of 7x and a forward P/E ratio of 6x, it trades cheaply for a business that still throws off substantial cash. Income adds some support, with Comcast paying an annual dividend of $1.32 per share ahead of its next ex-dividend date on October 7.
What to Watch Next
Comcast’s management has stated it expects modest improvement starting in Q3 2026, so the next broadband count gives the downgrade thesis a direct test. Any update on the NBCUniversal and Sky separation timeline is also worth watching, since that deal carries much of the bull case for Comcast.
Holders of CMCSA stock should keep positions moderate while the broadband question stays open. Comcast’s low multiple and dividend offer some cushion, but the share losses behind KeyBanc’s call could keep weighing on the stock until fiber pressure eases.
The post Comcast Slips as KeyBanc Cuts to Underweight on Broadband Share Losses; AT&T and Verizon Hold Steady appeared first on 24/7 Wall St..
]]>At the 24% federal bracket, ordinary dividend income from a foreign telecom or a stripped-yield name gets sheared harder than most investors realize. The yields in this sector are high enough that the annual tax drag in a taxable account is large and visible, and the Roth placement math stops being theoretical the moment you write it down against real tickers.
Telecom cash flows come in two tax flavors, and the difference decides who wins Roth space first. Qualified dividends from US C-corps get long-term capital gains treatment in a taxable account. Foreign-issuer distributions and any dividend paid out of return-of-capital or ordinary-income buckets do not.
Roth Versus Taxable on a $500,000 Telecom Sleeve
Anchor the math with the template case in the framework: a $500,000 position in a stock yielding 8% generates $40,000 annually. At the 24% bracket, that position in a taxable account produces $30,400 after tax. Inside a Roth it produces $40,000. The Roth advantage is $9,600 per year, every year, compounding permanently.
That yield is live for this peer set. Here is where each name sits right now:
| Company | Ticker | Current Yield | Distribution Character |
|---|---|---|---|
| Cogent Communications | CCOI | 11.6% | US qualified, coverage in question |
| BCE | BCE | 7.96% | Canadian, non-qualified for US LTCG |
| Verizon | VZ | 5.81% | US qualified |
| Comcast | CMCSA | 5.8% | US qualified |
| AT&T | T | 4.36% | US qualified |
| T-Mobile US | TMUS | 2.47% | US qualified |
BCE (NYSE:BCE) is the first name that belongs in a Roth, and it comes with a caveat most readers miss. BCE dividends to US holders are subject to a 15% Canadian nonresident withholding tax, and that withholding is generally not recoverable inside a Roth IRA, since there is no US tax liability against which to claim the foreign tax credit. You still keep the rest tax-free, but 15% is skimmed at the border. BCE’s quarterly payout was also reset lower, from the 0.695 to 0.7370871638 range during 2023 to 2024 down to the 0.311 to 0.319 range through 2026.
Cogent Communications (NASDAQ:CCOI) posts the fattest headline yield in the group, but the underlying cash payment collapsed from 1.015 per share on 2025-08-21 to 0.02 beginning with the record dated 2025-11-21. The 11.6% yield is a snapshot artifact of a fallen share price and prior payments. Net leverage sits at 6.75x with negative stockholders’ equity. Roth placement does not fix a payout coverage problem.
Verizon is the workhorse. CFO Tony Skiadas called it “ironclad” and noted “the 20th consecutive year of dividend increases.” Comcast has walked its quarterly from $0.27 in the 2022 payment cycle to $0.33 beginning with the 2025 payment cycle. AT&T held its payout flat at 0.2775 for every recorded payment from the ex-dividend date 2022-04-13 through the latest record dated 2026-07-10. T-Mobile is the low-yield growth outlier.
Bracket Multiplier
The higher your ordinary bracket, the more urgent the BCE-style ordinary-treatment placement decision. At the 22% bracket (single filers with incomes over $50,400 in tax year 2026) the drag is meaningful. At 32% (over $201,775) and 37% (over $640,600), non-qualified telecom income surrenders roughly a third to more than a third of gross before it ever reinvests. Qualified US telecom dividends face a 15% LTCG rate in most of these brackets, so the Roth savings on VZ, T, CMCSA and TMUS is smaller but still permanent.
Compounding Cost of Wrong Placement
Using the framework example, a $9,600 annual Roth advantage reinvested tax-free compounds meaningfully. Repeated across a decade, it is the difference between two very different terminal balances on the same underlying position. Extend it twenty years and the ordinary-treatment names dominate the Roth priority list even without projecting a single dollar of price appreciation.
Roth Priority Order and Next Steps
- Place BCE inside the Roth first among these six, accepting the 15% Canadian withholding as the cost of the highest ordinary-treatment yield in the group. If you already hold BCE in a taxable account, run the foreign tax credit math before converting.
- Verify CCOI coverage before assigning it any Roth space. A $0.02 quarterly payout does not merit prime tax-advantaged real estate.
- Sequence VZ, CMCSA, T and TMUS into the Roth in yield order once ordinary-treatment names are placed. The 2026 tax year brackets apply for planning through returns filed in 2027.
The post Telecom Dividends Get Taxed Hard: Here’s How Much More You Keep With a Roth Strategy appeared first on 24/7 Wall St..
]]>Blue-chip dividend-paying stocks don’t always demand blue-chip checks. Three of the largest dividend names on the New York Stock Exchange — AT&T (NYSE:T), Verizon Communications (NYSE:VZ) and Pfizer (NYSE:PFE) — all trade below $50 a share, which puts a meaningful position within reach of a $1,000 stake. Spread $1,000 across each name and a $3,000 outlay throws off roughly $160 in annual passive income at current yields.
Here is the framing readers deserve before the ticker profiles: A low share price speaks only to entry cost, while valuation is a separate question. A $25 stock is not inherently better value than a $250 stock, and share count alone tells you nothing about the underlying business. What earns these three a look in an income portfolio is cash-flow generation and the coverage sitting behind each payout.
Here is what a $1,000 stake in each of these 3 high-yield names would generate in annual income, running in countdown order by forward yield.
Stock #1: AT&T
- Yield: 4.42%
- Shares for $1,000: ~39.82 (at $25.11)
- Annual Passive Income: ~$44.20
AT&T is the wireline-and-wireless carrier rebuilt around its Advanced Connectivity segment, where service revenue grew 5.1% in Q2 2026 with operating income up 20.3% to $7.34 billion. The company reached 38.6 million fiber locations and is targeting 40 million by end of 2026 and more than 60 million by 2030. The yield sits at this level because a capital-intensive fiber buildout and $144B of debt cap the share price, while the payout itself remains covered.
Coverage looks solid. Full-year adjusted EPS guidance remained $2.25 to $2.35 against a $1.11 annualized payout, and CFO Pascal Desroches said “Our cash flow and liquidity provides us with flexibility to sustain our dividend and accelerate our planned buybacks.” MarketWatch flagged the stock as the smartest bet in the wireless sector on Sept. 21.
Stock #2: Verizon Communications
- Yield: 5.78%
- Shares for $1,000: ~21.55 (at $46.40)
- Annual Passive Income: ~$61
Verizon closed the Frontier acquisition on Jan. 20, pushing fiber connections to 10.9 million (+43.3%) and lifting total broadband to ~17.1 million (+34.5% YoY). Net unsecured leverage sits at 2.5x after that deal, which is the structural reason the yield trades this high on a business generating its “highest ever reported adjusted EBITDA performance.”
The payout is covered. 2026 adjusted EPS guidance was raised to $4.99 to $5.04 against a $2.83 annualized dividend, and free cash flow is guided to $21.94 billion to $22.14 billion. CEO Dan Schulman put it plainly: “The dividend is still ironclad for us, and we raised the dividend.” The January hike marked the 20th consecutive year of dividend increases.
Stock #3: Pfizer
- Yield: 6.16% (ultra-high-yield)
- Shares for $1,000: ~35.79 (at $27.94)
- Annual Passive Income: ~$61.60
Pfizer is the ultra-high-yielder in this group, and it earns the hardest coverage look. The patent-cliff overhang, COVID-19 revenue rolloff (Comirnaty -59%, Paxlovid -63%), and a weak share price have pushed the yield well above the pharma sector norm. Launched and acquired products carried the quarter, growing 18% operationally, with contributions from Eliquis, Padcev, the Vyndaqel family and Ibrance.
On the dividend, 2026 adjusted EPS guidance of $2.80 to $3.00 covers the $1.72 annualized payout on adjusted earnings, and management raised the revenue midpoint to $60.5 billion to $62.5 billion. Chairman and CEO Albert Bourla was blunt in the Q2 call: “We feel extremely confident that we will, even the most stretched scenarios that we are running, we will be able to maintain our dividend.” The reported GAAP EPS is thin, so this is an adjusted-earnings coverage story built on a GAAP-thin base.
Summary Table
| Name | Yield | Annual Dividend Income |
|---|---|---|
| AT&T | 4.42% | ~$44.20 |
| Verizon | 5.78% | ~$61 |
| Pfizer | 6.16% | ~$61.60 |
| Total | ~5.45% | ~$166.80 |
Putting the Cash Flow Together
Combined, these three positions generate roughly $166.80 in annual passive income on a $3,000 investment based on a blended yield of around 5.45%. AT&T contributes about $44.20, Verizon adds about $61 and Pfizer rounds out the group with about $61.60.
Reinvest the quarterly checks and the compounding effect from three payers dropping cash into the account on staggered calendars starts to show up inside a couple of years. Unlike rental property or private credit, any of these positions can be trimmed or exited on a single trading day, which is the flexibility income investors actually pay for.
The post 3 Dividend Stocks Trading Cheap Enough to Buy Meaningful Stakes for Under $1,000 appeared first on 24/7 Wall St..
]]>The Federal Reserve raised its target range on September 17, 2026, moving the upper bound from 3.75% to 4.00%. T-Mobile US (NASDAQ:TMUS) fell 5.57% to $166.45.
The tempting shortcut is to multiply the carrier’s $86.9 billion in total debt excluding tower obligations by the quarter-point hike to arrive at roughly $212 million of extra annual interest.
That number is a hypothetical exercise, not a company forecast or anything T-Mobile will actually pay. The real exposure sits in the debt note of the quarterly report, and it looks very different once you read it.
Why the $212 Million Hypothetical Falls Apart
Most of T-Mobile’s borrowings are senior notes with fixed coupons that do not reset when the Fed moves, so interest on that portion is contractually locked until maturity.
Only a $1 billion loan tied to SOFR is separately identified as floating, and the revolving credit facility carried no balance at quarter-end. Applying a 25 basis point move across the entire $86.9 billion ignores that structure.
Even the SOFR piece does not move point-for-point with the target rate. The 10-year sits at 4.94 and the 30-year at 5.29, which is where the real bill arrives when fixed-rate notes mature and refinance.
Cash Flow That Swallows the Difference
Quarterly interest expense was $1.012 billion in Q4 2025. T-Mobile absorbs this because operating cash is enormous. Management raised adjusted free cash flow guidance to between $18.4 and $18.8 billion for 2026.
CFO Peter Osvaldik called the Q2 result an “industry-leading free cash flow margin of 25%”, and the company generated $4.8 billion of free cash flow in the quarter. An incremental refinancing tick is a rounding issue against that base.
Rivals Verizon Communications (NYSE:VZ) and AT&T (NYSE:T) carry larger debt with similar fixed-rate, staggered-maturity structures, so the same arithmetic overstates their sensitivity too. T-Mobile grew Core Adjusted EBITDA 12% to $9.54 billion in Q2, while peers grind through slower service-revenue growth.
CEO Srini Gopalan, who took over from Mike Sievert in late 2025, called the quarter “another strong quarter of execution.” The relative earnings power makes T-Mobile’s leverage less menacing than the headline suggests.
Bull and Bear Case for TMUS Stock
The bull case rests on that cash engine and the $18.2 billion 2026 stockholder return authorization. The stock is down 28.61% over one year and trades at a forward P/E of 13x against an analyst target of $243.38.
The bear case is refinancing at today’s 5.29 thirty-year yield plus credit spread, plus integration costs and a maturity wall. The decisive variable is whether long-end yields stay elevated as T-Mobile’s fixed-rate notes come due, rather than the quarter-point move that prompted the math.

The post T-Mobile’s $85 Billion Debt Load Won’t Feel the Fed’s Rate Hike the Way Wall Street Thinks appeared first on 24/7 Wall St..
]]>Although income investors treat a dividend cut as the ultimate red flag, the historical record on Wall Street is more bifurcated than the reflex suggests. A slashed payout often marks the low point of an operational reset, the moment management concedes reality and begins deleveraging. But sometimes it marks only the first station on a longer decline. The difference matters right now, because VF Corporation (NYSE:VFC) holders are still living inside that experiment: the parent of The North Face and Vans took its quarterly dividend from roughly $0.51 to $0.09 starting with the December 2023 ex-date, and the payout has not budged since.
What’s particularly instructive is the peer set. The benchmark playbook of the past two decades gives us five clean historical mirrors, and they do not all rhyme.
Bank of America and the Financial-Crisis Template
Bank of America (NYSE:BAC) is the definitive precedent. The quarterly payout went from $0.64 through September 2008 to $0.32 that December and then to a token $0.01 beginning March 2009, where it stayed until 2014. A generation of income holders was wiped out. Yet the stock’s adjusted-price record shows a 371.26% ten-year change through Sept. 16, 2026, with the dividend rebuilt in eleven separate steps to a recent $0.32 declared for the Sept. 25, 2026 payment. The cut, painful as it was, marked a floor.
Wells Fargo: A Slower, More Faithful Restoration
Wells Fargo (NYSE:WFC) took its quarterly dividend from $0.51 to $0.10 in the summer of 2020 under Fed capital-return restrictions, an 80% haircut that stunned income holders. Six years later, the payout has climbed in six steps to $0.50 (ex-date Aug. 7, 2026), still narrowly below the pre-cut $0.51. The equity did not punish holders for waiting: WFC’s adjusted price is up 94.71% from Jan. 2, 2020 through Sept. 16, 2026. Under CEO Charlie Scharf, Q1 2026 diluted EPS reached $1.60 on revenue of $21.45B.
BP: The Cyclical Reset That Held
BP (NYSE:BP) delivered its first dividend cut in a decade in August 2020, slashing the quarterly amount from $0.63 to $0.315. Since then the payout has been raised in a slow, disciplined ladder to $0.5196 (ex-date Aug. 14, 2026). The stock has responded: BP is up 131.97% over five years through Sept. 16, 2026, aided by Q2 2026 EPS of $2.22 that beat the $1.78 estimate on Brent averaging $103.85/bbl.
GE: The Extreme Case
GE Aerospace (NYSE:GE) is the cautionary tale that eventually flipped. The dividend was chopped from $0.24 to $0.12 on Dec. 26, 2017, then to a symbolic $0.01 on Dec. 19, 2018, before the conglomerate broke itself apart. From Jan. 2, 2018 through Sept. 16, 2026, GE’s adjusted price rose 291.89%. The dividend has since been restored to $0.47 (ex-date July 6, 2026). Not without turbulence: Barron’s issued a Buy-to-Hold downgrade on Sept. 14, 2026, and the stock is down 13.86% over the past month. Recovery came on a long timeline.
AT&T: A Cut That Cleaned Up the Balance Sheet
AT&T (NYSE:T) trimmed its dividend from $0.52 to $0.2775 beginning with the April 13, 2022 ex-date alongside the WarnerMedia spin. Freed cash flow has since funded deleveraging and buybacks; management is targeting roughly $10B of repurchases in 2026, and Q2 2026 adjusted EPS of $0.65 beat the $0.59 estimate, per the company’s July 22 filing. The equity rewarded patience with an 80.67% rise from Jan. 3, 2022 through Sept. 16, 2026.
What Separated the Winners From the Losers
The pattern across BAC, WFC, BP, GE, and T is consistent: the cut worked when it accompanied a real deleveraging or portfolio reshuffle, and when management guided clearly about the new run-rate. VFC is where the jury remains out. Free cash flow was $405M in FY26 and CEO Bracken Darrell has guided FY27 revenue to +2% or better constant currency with net debt already down 20% YoY to $4.30B. The stock, though, is down 47.68% since Jan. 3, 2023 and 77.81% over five years. History says the tell is whether operating margin actually reaches the promised ~8%, and whether Vans stops shrinking after its -8% quarter. Long term, Wall Street still heads higher, and cut dividends have been restored more often than not. Spotting the cut before it lands is a separate discipline (we cataloged the seven warning signs in a free guide here: Dividend Traps). What income investors should watch, beyond the cut itself, are the two quarters that follow it: free cash flow direction, and net-debt trajectory. Those are the leading indicators the record actually validates.
The post VF Corporation Cut Its Dividend 82%. Five Historical Cases Show What Could Happen Next appeared first on 24/7 Wall St..
]]>For retirement-focused investors who lean on telecom dividends, the choice comes down to Verizon (NYSE:VZ) versus AT&T (NYSE:T), and the real question is which payout is actually safer. Headline yield is the trap. Payout coverage after enormous network capital spending, balance sheet leverage, and the direction of the underlying business decide whether the check keeps coming. Judged that way, one of these dividends has a clearly bigger cushion behind it.
Dividend Safety and Payout Coverage
Verizon carries the richer headline of the two. Its trailing dividend is $2.795 per share for a yield of 5.59%, backed by a raise streak the company describes as 19 consecutive annual increases and an annualized forward payout of $2.83. AT&T yields 4.34% on a $1.11 annualized dividend that has been held flat since the WBD spinoff reset, with management committed to holding that level through 2028.
Cash coverage is where the story flips. Verizon paid $11.481 billion in common dividends on $37.137 billion of operating cash flow against $17.011 billion of capex in its last fiscal year. AT&T paid only $8.18 billion in dividends on $40.284 billion of operating cash flow against $20.842 billion of capex. The reset cut AT&T’s payout obligation nearly in half from the $15.068 billion it distributed in fiscal 2021, and that cushion is precisely what a retiree wants sitting between the dividend and a bad quarter. Edge: AT&T.
Balance Sheet and Debt Load
Both carriers just closed transformative fiber deals that pushed leverage higher. Verizon reports net unsecured debt to adjusted EBITDA of 2.5x, with total unsecured debt of $136.5 billion and a plan to walk leverage back into the 2.0 to 2.25 times range during the 2027 timeframe. AT&T sits at 2.68x net debt to adjusted EBITDA on $144 billion of total debt, and CFO Pascal Desroches told investors leverage will climb further into the 3.2 times range after the EchoStar spectrum acquisition closes, then take roughly three years to return to target. Verizon is delevering. AT&T is about to relever. Edge: Verizon.
Growth Trajectory of the Underlying Business
Dividend safety over a retirement horizon depends on the business getting bigger. Verizon guides full-year adjusted EPS of $4.99 to $5.04, service revenue growth of 2.5 to 3.0%, and free cash flow of $21.94 to $22.14 billion. AT&T guides adjusted EPS of $2.25 to $2.35, EBITDA growth of 3 to 4% accelerating to 5%+ by 2028, and a double-digit adjusted EPS three-year CAGR through 2028, with free cash flow scaling to $21 billion+ in 2028. Operationally, AT&T posted 432,000 postpaid phone net adds in its latest quarter against Verizon’s 184,000, and advanced connectivity service revenue grew 5.1% year-over-year. AT&T is also pulling forward buybacks to roughly $10 billion, which Stankey framed against a “disparity between our operating fundamentals and the valuation of our stock.” Edge: AT&T.
The Verdict
For an income investor whose primary worry is that the dividend gets cut again, AT&T is the safer telecom payout. It wins two of the three dimensions that matter: the payout consumes a smaller share of free cash flow after capex, and the earnings power funding that payout is growing faster. Trading at a forward P/E of 10 against Verizon’s 9, you are not paying up for the extra safety by much. A 5%-plus yield still deserves a gut check either way, and we listed the seven warning signs that a big payout is about to be cut in a free dividend trap guide.
Verizon wins for one specific profile: the retiree who prioritizes a higher current yield and the psychological comfort of a long, unbroken raise streak, and who is willing to trust management’s delevering plan. What would flip the verdict to Verizon outright is a clean glide back to the 2.0 to 2.25 times leverage target on schedule while AT&T’s post-EchoStar leverage stalls above 3.2 times. Until then, AT&T is the dividend with the bigger margin of safety.
The post Two Telecom Giants, Two Big Dividends. Which One Can Investors Actually Count On? appeared first on 24/7 Wall St..
]]>High yields exist for reasons, and the promise of this roster is to name each reason out loud. Across telecom, tobacco and midstream energy, four of these five NYSE-listed dividend payers currently clear the 5% mark. But after AT&T’s 2022 payout reset, the stock has rallied enough this year that its yield now prints at 4.23%. We are flagging that clearly rather than dropping it, because the tradeoff story is exactly what income investors need to see.
Verizon Communications
Verizon (NYSE:VZ) traded around $50.67 on Friday, Sept. 11, with a dividend yield of 5.59% on a forward annualized payout of $2.83 per share. The Q2 2026 dividend was raised to 70 cents from 69 cents, extending a payout that has stepped higher every year in the visible modern record back through the mid-2000s.
Safety reads well on the cash-flow line. Q2 2026 free cash flow was $6.43 billion, up 27.1%, and management raised full-year 2026 free cash flow guidance to $21.94 to $22.14 billion against a buyback target of up to $4.5 billion. Trailing EPS of $3.79 comfortably covers the annual payout. The complication is leverage: total unsecured debt sits at $136.5 billion and net unsecured debt to adjusted EBITDA rose to 2.5x from 2.2x at year-end 2025 after the Frontier acquisition closed on Jan. 20.
The bull case: A Dow telecom yielding above 5% with rising fiber connections (roughly 10.9 million, up 43.3% YoY), a fresh multi-year fiber pact with Corning covering 80 million miles of fiber, improving postpaid churn of 0.92%, and a forward P/E of 9. What you trade for that yield is capital intensity and leverage. Wireless equipment revenue fell 20% YoY and ARPA slipped 1.4%, so pricing power is not the story here.
Altria Group
Altria (NYSE:MO) traded around $68.97 on Sept. 11 and yields 6.44%, putting it in ultra-high-yield territory. The next quarterly payment of $1.11 is scheduled for October 9, 2026, up from $1.06. The company disclosed its 60th dividend increase in the past 56 years, one of the longest raise streaks in the S&P 500.
Coverage math looks fine at the P&L: FY2026 adjusted diluted EPS guidance of $5.56 to $5.72 against a forward annualized payout of $4.44. FY2025 dividends paid were $7.0 billion, and the smokeable segment produced $2.68B in adjusted operating income at a 65.1% margin in Q1 2026. The balance sheet caveat is real: Altria carries negative stockholders’ equity of $3.2 billion after years of buybacks and impairments, with only $3.53B in cash.
The bull case: A defensive cash machine with a beta of 0.494 and a forward P/E of 12. What you trade for the yield is secular volume decline: domestic cigarette industry volume fell 5%, Marlboro retail share dropped 1.4 points to 39.7%, on! nicotine pouch share slipped 4.2 points to 13.4%, and NJOY ACE will not return in 2026. The risk you cannot hedge is regulatory.
AT&T
AT&T (NYSE:T) traded around $26.24 on Sept. 11. Editor flag: The current dividend yield is 4.23%, below the 5% headline threshold, because the stock has run 6.82% YTD while the payout has held at 27 cents per quarter since the WarnerMedia spin reset it from 52 cents per in 2022. Under a strict reading of the headline, this one should be flagged for substitution.
The safety picture is arguably the cleanest on the list. Q2 2026 free cash flow was $4.67 billion, and management is guiding FY2026 to free cash flow above $18 billion, rising to more than $19 billion in 2027 and more than $21 billion in 2028. Total shareholder returns are pegged at over $45 billion from 2026 to 2028, including roughly $24 billion in buybacks. Net debt to adjusted EBITDA sits at 2.68x against a 2.5x target.
The bull case: 432,000 postpaid phone net adds, 38.6 million fiber locations targeting 40M+ by year-end and a trailing P/E of 8. What you trade for the yield is legacy runoff: copper revenue fell 25.9% YoY, and legacy EBITDA is expected to turn negative after 2027. Investors buying today are also buying a smaller yield than the header advertises.
Energy Transfer
Energy Transfer (NYSE:ET) traded around $21.52 on Sept. 11 and yields an ultra-high 6.25%. The Q2 2026 distribution of 34 cents per unit marked the 19th consecutive quarterly distribution increase, with the payout tracking higher every quarter across the visible 2024 through 2026 record.
Tax structure warning: Energy Transfer is a Master Limited Partnership. It issues a Schedule K-1 rather than a Form 1099, and units held inside a retirement account can generate Unrelated Business Taxable Income. Read that twice before you buy ET in an IRA.
Coverage is the strongest on this list. Q1 2026 distributable cash flow was $2.7 billion, adjusted EBITDA hit $5.07 billion in Q2 2026, up 31%, and management raised FY2026 adjusted EBITDA guidance to $18.8 to $19.1 billion.
The bull case: Fee-based volume growth (NGL transport +13%, NGL exports +25%, crude transport +4%) plus emerging AI power demand via the Nexus Hubbard hyperscale project and Oklahoma power plants. What you trade for the yield is commodity exposure on non-fee margins, rising interest expense on an expanded capital structure, and the K-1 tax hassle.
Pembina Pipeline
Pembina Pipeline (NYSE:PBA) traded around $47.76 on Sept. 11. and yields 5.87%. Good news on structure: Pembina is a Canadian corporation, not a partnership, so U.S. shareholders receive a Form 1099 rather than a K-1. Bad news for planning: the dividend is declared in Canadian dollars (C 73 cents per share for Q3 2026, roughly U.S. 52 cents at a 0.7101 exchange rate) and Canada applies a withholding tax on dividends paid to U.S. investors.
Q2 2026 EPS came in at 82 cents, beating the 75-cent consensus, on revenue of $2.15 billion, up 20.1%. Operating cash flow was $897 million, up 13.5%, and management raised FY2026 adjusted EBITDA guidance to C$4.35 to C$4.55 billion. The balance sheet shows $12.4 billion of shareholders’ equity against $14.1 billion of liabilities, with a buyback authorization for up to 5% of shares.
The bull case: A Canadian midstream operator sanctioning roughly C$3 billion in net new projects, including the C$4.6 billion Greenlight Electricity Centre serving a Meta data centre and Cedar LNG on track for late 2028 first exports, all targeting 5% to 7% compound annual fee-based EBITDA per share growth through 2030. What you trade for the yield is FX volatility, cross-border tariff risk, and narrower NGL frac spreads pressuring the Marketing segment.
Tying the Roster Together
Four of these five names clear the 5% bar today, and each one asks the holder to accept a specific structural tradeoff: Verizon’s leverage after Frontier, Altria’s shrinking cigarette volumes, Energy Transfer’s K-1 and commodity mix, and Pembina’s currency and cross-border exposure. AT&T is the odd name out after this year’s rally, but it may still be the sturdiest cash-flow story on the list. Ranked purely on coverage and payout durability, ET and VZ lead, MO offers the deepest raise history, and PBA gives you the cleanest tax form. None of these five trip the classic distress signals, but if you are shopping further down the yield curve, there are seven warning signs that a big payout is about to be cut, and we listed all of them in a free report.
The post 5 Stocks Yielding More Than 5%. What You’re Actually Trading for That Income appeared first on 24/7 Wall St..
]]>Read almost any review of the new $1,999 iPhone Duo (that’s the base price). It’s just as good as, if not better than, the mini iPad, reviewers say. That opens the question of whether people will buy the Duo at the higher price.
The Duo will likely be bundled with three-year subscriptions from AT&T (NYSE: T), Verizon (NYSE: VZ), and T-Mobile. Verizon charges $33.33 for the iPhone 17 Pro Max. But that includes a three-year subscription to Verizon’s cellular network. The Duo will be sold the same way. The monthly price will probably be closer to $60, given the Duo’s retail price. Spread over 36 months, the deal may be a bargain for those desperate to own one.
The Duo has a 7.6-inch screen when open. The iPad mini is 8.3 inches measured as a rectangle. Cellular models with high storage capacity can push the mini’s price as high as $899. That means the Duo is more than twice as expensive.
Apple (NASDAQ: AAPL), of course, is selling the Duo as a product light-years ahead of anything else it has launched. “The largest iPhone display ever. Foldable, posable, standable. Featuring unique iOS experiences for ultimate versatility,” Apple said. Apple released the first iPad mini in 2012. Although it has been updated since then, in “Apple years” it is really old.
The Duo has two advantages over other products, even the new iPhone 18 Pro ($1,199 base price). It is, by Apple’s estimation, the largest iPhone advance since the first one was launched in 2007. And when Apple releases new products, people usually rush to buy them. Consumers cannot help themselves.
If the Duo takes some mini sales away, it may not be a problem. In the most recent quarter, iPhone revenue was $54.3 billion out of $109.4 billion. iPad revenue was $6.2 billion, and the mini is only part of that revenue.
Apple investors worry that, at some point, the company will launch an iPhone that won’t trigger an avalanche of buyers. Apple’s new iPhone lineup makes that less likely. So, a sacrifice of iPad sales may barely matter.
The post iPhone Duo Threatens iPad Sales appeared first on 24/7 Wall St..
]]>Wells Fargo’s Steven Cahall used a CNBC segment on September 8 to reframe SpaceX’s (NASDAQ:SPCX) wireless push. He argues that satellite-plus-spectrum architecture needs less ground infrastructure than a traditional fourth carrier, so the pain falls on incumbent telcos while tower REITs and cable operators quietly collect rent on whatever pieces SpaceX still has to lease.
Cahall told CNBC: “Telco just facing another competitor, a three player market going to a much smaller fourth player. That’s still a net negative for sure.”
The FCC just cleared SpaceX to absorb 65 MHz of EchoStar’s U.S. spectrum, and Starlink subscribers doubled year over year to 12.0 million as of Q2 2026. That makes the question urgent for anyone holding AT&T (NYSE:T), Verizon (NYSE:VZ), T-Mobile (NASDAQ:TMUS), American Tower (NYSE:AMT), Crown Castle (NYSE:CCI), SBA Communications (NASDAQ:SBAC), Charter Communications (NASDAQ:CHTR) or Comcast (NASDAQ:CMCSA).
What Cahall Said About the Fourth-Carrier Debate
Cahall broke from the standard fourth-carrier framing. He said, “We don’t think it’s because the economics of adding a fourth player to the U.S. wireless market is so compelling. It’s that there are ulterior long term technology motives.”
Those motives sit in plain view. SpaceX’s Q2 connectivity revenue reached $4.29 billion, up 66% year over year.
The EchoStar (NASDAQ:ECHO) transfer gives SpaceX a spectrum foundation it could not have assembled in time at auction. Management plans to integrate the 65 MHz “later next year” and build terrestrial hardware alongside the constellation.
Damage to carriers shows up first in pricing and margin pressure, with wholesale subscriber loss a slower, secondary risk. That matches what Verizon CEO Dan Schulman is telling investors.
Schulman said Verizon is “purposely shifting our mix towards durable recurring service revenues and away from low margin, highly promotional activity.” Carriers do that when they expect pricing to tighten.
Why the Satellite Architecture Changes the Math
Cahall put the mechanics simply: “They don’t need nearly the same amount of spectrum, the same amount of tower and signal projection. They have a big and growing satellite constellation.”
Spectrum is expensive because supply is fixed and FCC auctions clear for tens of billions of dollars. An MVNO, or mobile virtual network operator, rents capacity on somebody else’s network rather than buying spectrum and towers of its own, and Wi-Fi offload dumps phone traffic onto fixed broadband so cellular capacity stays free.
SpaceX itself described a network of “little femtocells” and rooftop Starlink dishes handling terrestrial handoffs. That is capital-light compared to macro-tower densification.
The thesis has a real hole. If SpaceX routes around U.S. towers entirely with its own rooftop equipment, the tower leasing bump never lands.
Crown Castle, asked directly on its Q2 call, would say only that its sites offer “space, power, backhaul” and would welcome satellite operators as tenants. No signed agreement exists yet.
Who Collects the Checks If He’s Right
Cahall gave the shopping list: “There would require towers. It would require a Wi-Fi offload MVNO with cable. So those could be two of the potential winners from a sector perspective.”
Tower REITs get paid regardless of which carrier wins the customer. American Tower yields about 3.93% with FY26 AFFO guided to $11.00 to $11.17 per share.
Crown Castle is the purer bet post-fiber divestiture, yielding around 5.5%, though AT&T contributes 28% of site rental revenue with a $774 million renewal cycle in 2028. SBA is the international grower, with international site leasing up 30.5% in Q2.
On the cable side, Charter’s Spectrum Mobile added 406,000 lines with mobile service revenue up 18.9% year over year to $1.095 billion. Comcast crossed 10 million wireless lines and offloads roughly 90% of traffic onto Wi-Fi.
The carriers face the opposite trend. Verizon’s fixed wireless net additions fell 30.6% year over year, the first visible mark of satellite broadband encroachment.
Is SPCX Stock a Buy?
Q2 revenue was $7.81 billion, with $3.54 billion of adjusted EBITDA and a $93.5 billion cash position. The stock trades at roughly 85 times trailing sales.
Among incumbents, T-Mobile is most exposed because its Direct-to-Cell partnership loses differentiation once SpaceX controls its own spectrum. TMUS shares are down 23.18% over the past year.
AT&T’s satellite-as-corner-case posture looks defensible, and CEO John Stankey argued the company can “get 98% of the traffic” without a wholesale satellite partner. Verizon’s 29.99% year-to-date rally already prices in the fiber pivot.
My read: infrastructure owners look like the cleaner exposure to this thesis, and Crown Castle offers the most direct tower exposure at a yield the carriers cannot match. SPCX carries the growth optionality for those comfortable with a triple-digit sales multiple, while CCI leans income-oriented at a materially lower valuation.
The post Wells Fargo Analyst: SpaceX Wireless Will Crush Carriers While Tower REITs “Quietly” Profit appeared first on 24/7 Wall St..
]]>AT&T (NYSE:T) said Tuesday it is the first major U.S. telecom to bundle Amazon Leo satellite broadband into a managed offer with its fiber and 5G, delivered on one bill through AT&T terminals for enterprise and public-sector customers. The deal makes AT&T the anchor telecom customer for Amazon‘s (NASDAQ:AMZN) low-earth-orbit constellation, escalating the fight against Starlink for carrier partnerships.
What the Deal Actually Covers
Amazon Leo is not broadly live, with no price and no launch date disclosed; AT&T said a phased rollout comes first, positioned as backup and rural coverage rather than direct satellite-to-phone service. Amazon CEO Andy Jassy told investors in July that “Amazon Leo has close to 400 satellites in orbit, enough to begin initial satellite internet service this year” and cited more than 20 partners extending the network globally. For AT&T, satellite plugs the “2%” of rural traffic CEO John Stankey has said fiber and 5G cannot economically reach.
Market Reaction and Profit Angle
AT&T traded near $25.32, down 1.11% intraday but up 6.43% over the past month. Amazon slipped 1.9% to $252.09, while SpaceX is privately held, but Starlink still owns the constellation lead with 12.0 million subscribers.

The angle: Amazon is buying distribution through AT&T’s 2.5 million business accounts instead of building its own enterprise sales force. Watch for competitive response from SpaceX on carrier pricing, and for AT&T’s Oct. 21 Q3 2026 earnings to gauge whether the Amazon Leo tie-in shows up in enterprise bookings. Stankey speaks at the Goldman Sachs Communacopia conference today, the likely next catalyst.
The post AT&T Becomes Amazon’s First Major Satellite Broadband Telecom Customer appeared first on 24/7 Wall St..
]]>Shares of Verizon (NYSE:VZ) have quietly become one of the year’s most interesting large-cap turnaround stories. The stock has climbed 29.5% year to date and sits within striking distance of its 52-week high.
Even so, our proprietary model still sees room to run. Our 24/7 Wall St. price target for Verizon is $56.60, implying 11.6% additional upside from the current $50.78 quote. The model rates this a buy with high confidence.
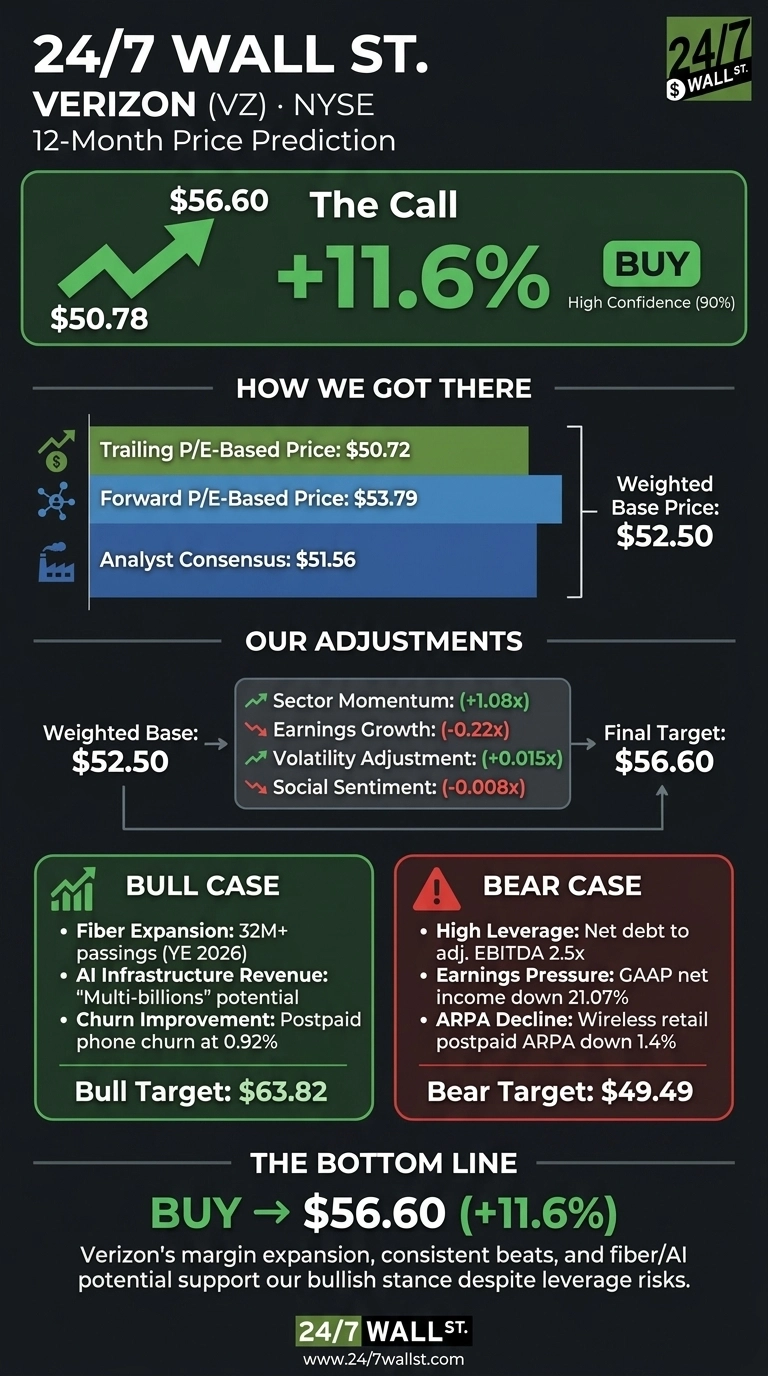
| Metric | Value |
|---|---|
| Current Price | $50.78 |
| 24/7 Wall St. Price Target | $56.60 |
| Upside | 11.6% |
| Recommendation | BUY |
| Confidence Level | 90% |
A Turnaround That Is Actually Working
Verizon’s Q2 2026 report, delivered on July 24, 2026, marked its sixth consecutive earnings beat. Adjusted EPS came in at $1.30 versus a $1.27 consensus, on revenue of $34.25 billion.
Adjusted EBITDA margin expanded to 40.1% from 37.1%, postpaid phone net adds swung to 184,000 from a loss of 9,000 a year earlier, and free cash flow jumped 27.12% to $6.426 billion.
Management raised FY26 adjusted EPS guidance to $4.99 to $5.04 and lifted the buyback target to $4.5 billion. CEO Dan Schulman called it “a structural inflection point across our entire business.”
Why Bulls See a Breakout Above $60
The bull case is grounded in three levers. First, fiber. Verizon expects to exceed 32 million fiber passings by year-end, with a medium-term goal of 40 to 50 million. Fiber-broadband connections already grew 43.3% YoY to 10.9 million.
Second, AI infrastructure. Schulman flagged discussions with hyperscalers around dark fiber, lit fiber, and 5G assets that could unlock “multi billions in revenues.” Carriers are only one slice of that buildout, and we profiled seven other companies powering, cooling, and connecting AI data centers in a free report here.
Third, churn. Postpaid phone churn improved to 0.92%, and every basis point compounds. If the AI-revenue narrative materializes, our bull-case path lands at $63.82.
What Could Go Wrong
Verizon carries $136.5 billion in unsecured debt and net leverage rose to 2.5x from 2.2x post-Frontier. GAAP net income fell 21.07% on $1.8 billion in special items, wireless retail postpaid ARPA slipped 1.4% to $168.35, and FWA net adds dropped 30.6%.
Bulls would counter that the special items are non-recurring and adjusted EBITDA still grew 7.2%. In a bear scenario, our model floor is $49.49.
How Verizon Stacks Up Against AT&T and T-Mobile
AT&T (NYSE:T) is the closest strategic analog. Its Q2 2026 adjusted EPS of $0.65 beat by 10.71%, with fiber reaching 38.6 million locations and postpaid phone net adds of 432,000.
AT&T’s $179 billion market cap trades at a modest discount to Verizon’s $210.98 billion, but AT&T is guiding to $45 billion+ in shareholder returns through 2028, roughly matching Verizon’s return profile on a smaller base.
T-Mobile US (NASDAQ:TMUS) is the growth benchmark. Q2 revenue rose 7.85% to $22.79 billion, with Core Adjusted EBITDA margin at 50.2%. Postpaid ARPA of $152.91 and a market cap of $202.7 billion imply investors pay a premium for growth.
That premium is exactly why Verizon’s yield-and-turnaround setup at a lower implied multiple makes the 24/7 Wall St. price target look reasonable rather than aggressive.
Verizon Price Prediction 2026-2030
The model’s verdict: Buy, with a 24/7 Wall St. price target of $56.60 and 90% confidence. Margin expansion, six straight beats, and a $2.83 forward dividend that funds patience.
The bull thesis strengthens if Verizon delivers Q3 service revenue growth near the guided 3% and continues repaying Frontier debt. The thesis weakens if leverage climbs above 2.7x or postpaid churn ticks back above 1%.
| Year | 24/7 Wall St. Price Target |
|---|---|
| 2026 | $52.17 |
| 2027 | $56.35 |
| 2028 | $61.67 |
| 2029 | $66.40 |
| 2030 | $70.53 |
These projections assume Verizon executes on its fiber build-out, extracts Frontier synergies, and captures early AI-infrastructure revenue. Meaningful upside or downside would come from either a hyperscaler-scale AI network deal or a resurgence in promotional wireless competition.
The post Verizon Stock Is Near a 52-Week High. Here’s Why I’m Still Bullish. appeared first on 24/7 Wall St..
]]>The 2026 telecom leaderboard flipped this year, and the margin is the story. Verizon Communications (NYSE:VZ), long treated as the group’s laggard, has become the year’s clear winner, while the name that spent years as the growth story sits at the bottom.
Verizon stock was up 29% year to date (YTD) through Friday’s close to $50.14, its strongest annual run in years. Meanwhile, AT&T (NYSE:T) stock had climbed 7% to $25.68, a modest gain. T-Mobile (NASDAQ:TMUS) stock was down 9% to $181.52, the group’s lone decliner.
To provide a read on the telecom sector and telecom-adjacent assets, the Communication Services Select Sector SPDR ETF (NYSE ARCA:XLC) is down 5% in 2026 so far. For the full-market context, the SPDR S&P 500 ETF Trust (NYSEARCA:SPY) was up 13% year to date. Only Verizon stock beat the broad tape in 2026, which frames the year as a reordering inside the sector.
Verizon’s Turnaround Finally Shows Up
Verizon stock’s rally reflects a real cost and subscriber turnaround under CEO Dan Schulman, layered on top of its wireline expansion. In Q2 2026, Verizon reported adjusted EPS of $1.30, ahead of the $1.27 consensus and its sixth straight beat. Its postpaid phone net additions reached 184,000, a swing from a year-ago loss of 9,000.
Moreover, Verizon raised its full-year adjusted EPS guidance to $4.99 to $5.04 and expanded its buyback plan to up to $4.5 billion. The company’s Frontier Communications acquisition, closed in January, pushed fiber broadband connections to 10.9 million, up 43.3% year over year (YoY). Schulman stated the results provide “clear, compelling evidence that this transformation is driving a structural inflection point across our entire business.”
Verizon’s adjusted EBITDA margin expanded to 40.1% from 37.1% a year ago, an unusually clean margin story for a legacy carrier. Its quarterly dividend also rose to $0.7075 per share, extending a long streak of annual increases.
AT&T’s Fiber Build Delivers a Steady Gain
AT&T’s advance is smaller and more incremental. The company’s Q2 2026 adjusted EPS of $0.65 beat the $0.5871 consensus by 10.7%, its fifth consecutive beat. The carrier added 432,000 postpaid phone subscribers and 646,000 internet subscribers, with fiber locations reaching 38.6 million.
AT&T accelerated its 2026 share buybacks to approximately $10 billion, up from a prior $8 billion plan, and reiterated full-year adjusted EPS guidance of $2.25 to $2.35. CEO John Stankey called AT&T stock’s valuation “very suppressed” on the July call, signaling a bias toward heavier repurchases. The carrier generated $4.67 billion in free cash flow during the quarter, with convergence and fiber execution driving the improvement.
T-Mobile Gives Back Its Growth Premium
T-Mobile’s operating results tell a different story than its stock chart. Its Q2 2026 revenue rose 7.9% to $22.79 billion, the highest growth rate of the three carriers, and Core Adjusted EBITDA climbed 12% to $9.54 billion. The carrier also raised its 2026 stockholder return authorization to $18.2 billion and lifted its full-year adjusted free cash flow guidance to $18.4 billion to $18.8 billion.
However, T-Mobile stock slipped as its subscriber growth advantage narrowed and competition intensified. Reuters reported this week that activist investor Elliott is urging Deutsche Telekom to drop a proposed merger with T-Mobile, adding fresh noise to the shareholder story. CEO Srini Gopalan stated, “We’re just getting started,” pointing to network quality and premium plans as growth drivers into 2027.
What to Watch Next
Q3 2026 reports could show whether Verizon can extend its subscriber momentum, AT&T can convert its fiber build into stronger free cash flow, and T-Mobile can defend premium plans against sharper competition. AT&T reports on October 21, with Verizon and T-Mobile typically following in the same window.
For investors sizing their positions in the group, the year’s lesson is that dividend yield and fiber execution have mattered more than 5G branding this year. Verizon and AT&T pair rising cash returns with visible operating leverage, and T-Mobile’s growth premium is being priced out of its shares even as its fundamentals hold. Traders may want to watch for signs the subscriber gap keeps closing before adding to their T-Mobile exposure.
A cautious approach makes sense across the sector. Position sizing should reflect that Verizon stock has already run hard, AT&T still has room if buybacks accelerate, and T-Mobile’s operating story remains intact even as its shareholder sentiment sours.
The post Which Telecom Stock Has Dominated in 2026: AT&T, Verizon, or T-Mobile? (It’s Not Even Close) appeared first on 24/7 Wall St..
]]>You have $930,000 and one question: Does an insurance company writing a lifetime check produce more monthly income than a dividend portfolio you control? Most of the confusion comes from comparing two numbers that do not measure the same thing.
Payout Rate Versus Yield: A Critical Distinction
A single premium immediate annuity quote is expressed as a payout rate, which blends interest with a scheduled return of your own principal. On a $930,000 contract for a 65-year-old, a prevailing 7.3% payout rate produces roughly $5,650 a month for life, but the insurer keeps the principal when you die.
A dividend portfolio works differently because the capital stays invested. That same $930,000 parked across high-yield stocks generates about $5,370 a month while preserving the underlying shares for your estate.
Dividend Lineup: 40% DUK, 30% PDI, 30% T
These three holdings span a wide risk range, and calling any of them “annuity-safe” would be misleading.
Duke Energy (NYSE:DUK) is the most defensible name. The regulated utility yields 3.5% at a recent price of $120 and just raised the quarterly dividend to $1.085 per share, payable September 16, 2026. Management reaffirmed 2026 adjusted EPS guidance of $6.55 to $6.80 and a 5% to 7% long-term EPS growth target through 2030. Rate cases and heavy capital spending are real risks, but the dividend has a long record of steady annual increases.
AT&T (NYSE:T) yields 4.3% at roughly $26. Readers need to know this: AT&T cut the quarterly dividend from $0.52 to $0.2775 per share in 2022 and has held it flat ever since. Free cash flow guidance of $18 billion or more in 2026 supports the current payout, but a telecom that already cut once is no substitute for a contractual lifetime payment.
PIMCO Dynamic Income Fund (NYSE:PDI) carries the most risk here. The leveraged multi-sector closed-end bond fund has paid a monthly $0.2205 distribution, largely unchanged since 2020, while shares fell 11% over the past year to $15. A flat distribution against a falling price is a pattern worth examining: check the fund’s distribution composition for return of capital before assuming the payout is all investment income. Closed-end funds also trade at premiums or discounts to net asset value. PDI has historically traded at a premium, and leverage magnifies both income and losses while making the fund highly rate-sensitive.
Annuity Side of the Ledger
Tradeoffs to weigh: payments are fixed and lose purchasing power to inflation across a 25- or 30-year retirement, the decision is irreversible, and you take on insurer credit risk backstopped only by your state guaranty association up to a coverage limit that varies by state. Riders such as period certain, joint life, or an inflation adjustment all reduce the monthly check.
Which Number Wins, and Which Decision Wins
On the pure monthly check comparison, the annuity edges ahead by delivering roughly $5,650 every month compared to $5,370 from the dividend lineup. The annuity wins the monthly income race because it actively spends down your principal.
The dividend portfolio produces slightly less cash each month, but leaves all $930,000 in underlying shares fully intact and available to your heirs. We walked through building that kind of paycheck-style income schedule from ordinary savings in a free guide here.
Three Actions Before You Commit
- Get three real SPIA quotes at your exact age and state, with and without an inflation rider, so you can see how much monthly income the rider actually costs.
- Pull PDI’s most recent Section 19 notice to see how much of the distribution is investment income versus return of capital, and check the fund’s current premium or discount to NAV before buying.
- Compare AT&T’s post-cut $0.2775 quarterly dividend against Duke’s rising $1.085 to decide which behavior you actually want in a lifetime-income holding.
The post Dividends vs. Annuity: Which Turns $930,000 Into More Monthly Income for Life? appeared first on 24/7 Wall St..
]]>Rivian’s finance chief is on her way out. Rivian (NASDAQ:RIVN) said on August 27, 2026, that CFO Claire McDonough will step down October 30, 2026, after almost six years, relocating to the East Coast for her new role. Derek Mulvey, a VP of Finance who joined Rivian in 2021 from J.P. Morgan, is expected to serve as interim CFO. The market reaction has been muted: shares are down 1.7% since the session before the announcement, closing at $16.06 on August 31.
Why the Timing Matters More Than the Exit
McDonough is leaving for a bigger job. GE Vernova (NYSE:GEV) named her its incoming CFO on August 27, 2026, which reads as a talent draw. She led Rivian’s $13.7 billion November 2021 IPO and built the capital stack now funding the R2 launch. That stack is substantial: roughly $5.3 billion in cash and short-term investments, a $4.5 billion Department of Energy loan for the Georgia plant, and over $14 billion in total available liquidity and targeted future capital. Q2 revenue reached $1.66 billion, up 27% year over year, with 2026 delivery guidance lifted to 65,000 to 70,000 vehicles. Losing a finance chief one quarter before the R2 production line ramps to two shifts is the key risk investors should scrutinize.
How Investors Reacted to Other CFO Transitions
AT&T (NYSE:T) said on June 16, 2026, that Jennifer Biry will become CFO in 2027, with Pascal Desroches retiring. Biry was named deputy CFO in the interim. Shares are up 12.6% since the session before the announcement.
Caterpillar (NYSE:CAT) announced on April 8, 2026, that Kyle Epley, a nearly 30-year company veteran, was elected CFO, with Andrew Bonfield retiring after eight years. Shares are up 10.5% since the session before the announcement.
Pfizer (NYSE:PFE) announced its transition on June 18, 2026. Dave Denton left in August 2026 and was subsequently named Nike’s next CFO. Albert Bourla said, “With Cecile’s leadership, I’m confident we are in very good hands.” Shares are up 11.72% since the session before the announcement.
What Separates Rivian From the Rest
AT&T, Caterpillar, and Pfizer each identified a permanent successor the day they disclosed the change. Rivian named an interim and has an executive search underway considering both internal and external candidates. That open search is the variable. With R2 already in customers’ hands and a Q4 second-shift production ramp defining Rivian’s year-end output, the permanent CFO hire is the announcement worth waiting for. The balance sheet buys time; the CFO search sets the tone.


The post CFO Turnover at AT&T, Caterpillar, and Pfizer Sparked Rallies. Here’s Why Rivian’s Didn’t. appeared first on 24/7 Wall St..
]]>Investors reaching for telecom-style income through the Communication Services Select Sector SPDR Fund (NYSEARCA:XLC) often discover a mismatch between the name and the portfolio. XLC sits inside the S&P 500’s communication services sector, and the label suggests dividend-paying phone companies. The portfolio tells a different story. XLC is dominated by mega-cap tech and media, with Meta at 19.9% and two Alphabet share classes together accounting for another roughly 23% of net assets. If you bought XLC for reliable telecom yield, you own something closer to a growth-and-advertising fund. There is a cleaner way to get the exposure you actually wanted.
Why XLC Disappoints Income Seekers
XLC holds legacy telecom names in modest sleeves: AT&T at 4.09%, Verizon at 4.14%, Comcast at 4.70%, and T-Mobile at 4.15%. The rest is Meta, Alphabet, Netflix, Electronic Arts, Take-Two, Disney, Warner Bros. Discovery, and media names. Those companies pay little or no dividend, which is why the fund’s distributable income is thin. It also explains XLC’s price action: shares are down 3.46% year to date as the ad-driven mega-caps have wobbled, while the telecom sleeve inside the fund has quietly done the heavy lifting.
For an investor who wants current yield, direct exposure to fiber and wireless convergence, and specific capital returns, the swap is straightforward: holding the three telecom-adjacent components directly isolates the yield without the tech ballast.
AT&T: Cash Flow Now Funding a Buyback Surge
AT&T (NYSE:T) trades at $26.01 with a 4.36% dividend yield, roughly five times what XLC’s underlying portfolio kicks off. The payout looks well covered. Q2 2026 free cash flow reached $4.7 billion, and management reiterated $18 billion-plus in full-year free cash flow.
The capital return pace stands out. CFO Pascal Desroches said “Together, our planned share repurchases and expected dividend payments will total approximately $18 billion this year, which is essentially 100% of our outlook for free cash flow.” The buyback was pulled forward to approximately $10 billion in 2026, up from a prior $8 billion target. At a trailing P/E of 8, every dollar of repurchase removes shares cheaply. That is the mechanism XLC cannot deliver: AT&T shareholders capture 100% of the buyback impact, while XLC holders see it diluted by a 4% weight.
Verizon: The Yield Anchor With Fiber Growth Attached
Verizon Communications (NYSE:VZ) offers the highest headline yield of the three at 5.65%, backed by 20 consecutive years of dividend increases. Shares are up 29.19% year to date, and the story behind that move matters. The Frontier deal closed January 20, 2026, and Verizon expects more than 32 million fiber passings by year-end. Management raised full-year adjusted EPS growth guidance to 5% to 6% and lifted the buyback authorization.
CFO Tony Skiadas said plainly, “The dividend is still ironclad for us, and we raised the dividend.” With $21.5 billion or more in full-year free cash flow guidance and a forward P/E of 10, Verizon skews toward yield first and modest growth second.
Comcast: A Cheaper Setup With an Optionality Kicker
Comcast (NASDAQ:CMCSA) trades at $26.67 and a forward P/E of 8, with a 5% dividend yield. Wireless net additions of 448,000 were the best quarter on record, and Peacock reached profitability with $189 million of EBITDA. Q2 free cash flow was $4.6 billion.
Comcast paused its buyback as of July 1 pending the NBCUniversal and Sky spin-off, and adjusted EBITDA fell 13.4% year over year. The dividend continues, and holders receive shares of the standalone media company when the separation closes in roughly a year. That is optionality XLC cannot replicate.
How to Think About the Swap
The three stocks together deliver a blended yield in the mid-5% range, versus the sub-1% distribution profile of XLC’s underlying holdings. You give up direct exposure to Meta, Alphabet, and Netflix, and you accept single-name risk on three balance sheets carrying meaningful debt: AT&T’s net leverage of 2.68 times is above its 2.5 times target, and Verizon sits at roughly 2.6 times. That blended yield is also close to what a mid six-figure balance needs to throw off a real monthly check (we sketched the full math for turning $250K into $1,500 a month in a free report: here). If you hold XLC in a taxable account, selling triggers capital gains. Redirecting new contributions into the three telecom names, rather than selling existing XLC shares, avoids triggering those gains.
Reading the Fit Before You Act
Investors who own XLC for mega-cap tech and media exposure with a modest income tilt are getting what the fund is built to deliver. If you bought it thinking it was a telecom income vehicle, this direct trio delivers materially more yield, cleaner exposure to fiber and wireless convergence, and specific capital-return programs you can track quarter by quarter. That is a different job, and it deserves a different tool.
The post Think You Bought a Telecom ETF? You Mostly Own Big Tech appeared first on 24/7 Wall St..
]]>Own Vanguard Dividend Appreciation ETF (NYSEARCA:VIG) for the income, and you are being quietly shortchanged by design. The S&P U.S. Dividend Growers Index that VIG tracks removes the top 25% highest-yielding eligible names before construction. At each annual reconstitution, the top 25% of eligible stocks ranked by dividend yield are excluded from new admission, while existing holdings get a buffer and can remain unless they climb into the top 15%. In other words, some of the biggest dividend payers are screened out by design before they can ever enter VIG.
What You’re Actually Paying
VIG’s expense ratio is not the problem. Vanguard charges just 0.04%, or roughly $4 annually for every $10,000 invested. Even compounded over 20 years, that fee has a minimal impact on long-term returns. The more important cost comes from the dividend income VIG’s methodology deliberately excludes.
Consider four names either screened out or nearly absent from VIG’s methodology. AT&T (NYSE:T) pays an annualized dividend of $1.11 at $24.90 a share. Verizon (NYSE:VZ) pays $2.83 annualized at $48.54. Altria pays $4.24 annualized at $65.19. Realty Income yields 4.95% and pays monthly. A dividend fund willing to include a slice of these names could throw off hundreds of extra dollars of annual income on a $10,000 stake. Compound that missed income across 10 or 20 years of reinvestment and the gap grows into thousands.
Realty Income’s monthly schedule is a perfect example. Investors who actually want checks arriving every 30 days, rather than quarterly, have options a rules-based growth screen won’t surface (we rounded up seven of our favorite monthly payers in a free report here: The 7 Monthly Dividend Stocks That Pay You Every 30 Days).
The Part the Factsheet Doesn’t Highlight
The methodology is clear, albeit tucked deep within the prospectus. Said methodology states that companies must show at least 10 consecutive years of dividend increases to qualify. Then S&P discards the top quartile by indicated yield. High yields sometimes flag distress, so the screen has some defensive logic. It also means the fund is engineered to underweight income, then marketed to investors who buy dividend ETFs precisely for income.
The performance argument has cracks too. Over the past five years, Altria has returned 99.44%, ahead of VIG’s own 66.57%. AT&T returned 59.83% over the same window. The high-yield-equals-danger heuristic screens out real winners alongside real losers.
The second hidden cost is overlap. VIG’s largest weights concentrate in the same mega-cap quality names that anchor every broad Vanguard equity fund. VIG held $124.6 billion in net assets as of April 30, 2026, and much of that book duplicates what a total-market indexer already owns. The dividend-growth label can obscure what functions as a large-cap quality tilt.
The Cheaper Mirror
Investors who want exposure to the yield VIG screens out have peers in the same category. Schwab US Dividend Equity ETF (NYSEARCA:SCHD) holds several high-yield names VIG excludes, with Verizon at 3.65% of the portfolio alongside energy and financial payers such as Chevron at 3.83%. SCHD closed May 2026 with $94.9 billion in net assets. iShares Core Dividend Growth (NASDAQ:DGRO) runs a fact-sheet expense ratio of 0.08% (still cheap) and skips the top-quartile yield cut. Over five years, VIG has returned 66.57% versus SCHD’s 60.82%, close enough that the recurring yield differential materially reshapes the total-return picture over time.
What This Means for You
The relevant question is what you bought VIG to accomplish. If steady growth of a dividend-tinted large-cap sleeve was the goal, VIG delivers. If income was the goal, ask why your rulebook throws away the top 25% of the yield curve before you ever see a check.
The post VIG’s Index Removes the Highest-Yielding 25% of Dividend Stocks Before Holders Ever Own Them appeared first on 24/7 Wall St..
]]>All the major Wall Street firms we cover here at 24/7 Wall St. have a list of the top stock picks for their institutional and retail clients to invest in. Typically, these are companies analysts have high conviction in and feel strongly about their fundamentals and forward-looking prospects. In addition, they often have strong upside to the assigned price target and are assigned a Buy or Overweight rating, depending on the company providing the coverage. After a furious rally off the late-March lows and with all major indices trading at or near all-time highs, many investors are treading carefully as we head toward September. With a very solid second-quarter earnings season about to wrap up, we were interested to see which stocks were on the August edition of J.P. Morgan’s Analyst Focus List.
No new companies were added to the August edition, and two energy companies were removed. We decided to screen the list for dividend stocks that J.P. Morgan analysts are very bullish on, and all five offer steady passive income and the potential to deliver solid total return.
The research team at J.P. Morgan updates its U.S. Analyst Focus List monthly, as the company describes:
The U.S. Analyst Focus List is updated monthly. Names may be removed mid-month when a valuation target has been largely or wholly achieved, or the original rationale is no longer valid. We may also add new ideas mid-month. Analysts will publish the explanation for all mid-month changes in a research note.
Why Do We Recommend J.P. Morgan’s Analyst Focus List Stocks?
J.P. Morgan is a leading investment firm on Wall Street and worldwide. The firm’s top-notch research department continues to provide institutional and high-net-worth clients with the best ideas across the investment spectrum and is likely to do so for years to come.
Here are the five highest-yielding J.P. Morgan Analyst Focus List stocks.
Annaly Capital
With a massive 12.20% dividend yield and trading right near the J.P. Morgan target price, this is a total passive-income play. Annaly Capital Management (NYSE: NLY) is a diversified capital manager with investment strategies across the mortgage finance sector.
The company owns a portfolio of real estate-related investments, including:
- Mortgage pass-through certificates
- Collateralized mortgage obligations
- Credit risk transfer (CRT) securities
- Securities representing interests in or obligations backed by pools of mortgage loans, residential mortgage loans, and mortgage servicing rights
Its investment groups include:
- Annaly Agency Group
- Annaly Residential Credit Group
- Annaly Mortgage Servicing Rights Group
Annaly Agency Group invests in agency mortgage-backed securities collateralized by residential mortgages, while Annaly Residential Credit Group invests in non-agency residential mortgage assets within residential and commercial markets. Annaly Mortgage Servicing Rights Group invests in MSR, which grants the right to service residential mortgage loans in exchange for a portion of the interest payments on those loans.
The J.P. Morgan price target of $24 is likely to go higher.
AT&T
AT&T (NYSE: T) is the world’s fourth-largest telecommunications company, measured by revenue. The legacy telecommunications company has undergone a lengthy restructuring process while maintaining a solid dividend yield of 4.52%. Thirteen analysts have assigned the stock a Buy rating, indicating broad Wall Street support. AT&T provides telecommunications, media, and technology services worldwide. Its Communications segment offers wireless voice and data communications services.
AT&T sells through its company-owned stores, agents, and third-party retail stores:
- Handsets
- Wireless data cards
- Wireless computing devices
- Carrying cases
- Hands-free devices
AT&T also provides:
- Data
- Voice
- SecuT
- Cloud solutions
- Outsourcing
- Managed and provided professional services
- Customer premises equipment for multinational corporations, small and mid-sized businesses, and governmental and wholesale customers
This segment also provides residential customers with fiber broadband and legacy voice telephony services.
The company markets its communications services and products under:
- AT&T
- Cricket
- AT&T PREPAID
- AT&T Fiber
The company’s Latin America segment provides wireless services in Mexico and video services throughout the region. This segment markets its services and products under the AT&T and Unefon brands.
J.P. Morgan has a $33 price target for the stock.
First Industrial Realty Trust
While off most people’s radar, this real estate investment trust (REIT) pays a solid 3% dividend and offers decent upside to JPMorgan’s target. First Industrial Realty Trust (NYSE: FR) is a self-administered and fully integrated real estate company. The company owns, operates, develops, and acquires logistics properties. Through its fully integrated operating and investing platform, it provides facilities and customer service to multinational corporations and regional firms essential to their supply chains.
In total, the company owns and is developing approximately 71.6 million square feet of industrial space concentrated in 15 target MSAs. Its tenants are engaged in a variety of businesses, including:
- E-commerce
- Third-party logistics and transportation
- Consumer and other manufactured products
- Retail and consumer services
- Food and beverage
- Lumber and building materials
- Wholesale goods
- Health services
- Governmental and other
Through a wholly owned TRS of the operating partnership, the operating partnership owns an equity interest in a joint venture. The company also provides various services to the joint venture.
J.P. Morgan’s target price is $74.
Digital Realty Trust
Digital Realty Trust (NYSE: DLR) owns, operates, and invests in carrier-neutral data centers worldwide and pays a solid 2.47% dividend. This industry leader is one of the best pure-play data center stocks for AI exposure. Digital Realty is a REIT that owns, acquires, develops, and operates data centers through its operating partnership subsidiary.
The company is focused on providing data center, colocation, and interconnection solutions for domestic and international customers across a variety of industry verticals, ranging from:
- Cloud and information technology services
- Communications and social networking in financial services
- Manufacturing
- Energy
- Healthcare
- Consumer products
Its portfolio includes over 308 data centers: 121 in the United States, 112 in Europe, 36 in Latin America, 16 in Africa, 16 in Asia, six in Australia, and three in Canada.
PlatformDIGITAL is a global data center platform designed to scale digital businesses, enabling customers to deploy their critical infrastructure with a trusted international data center provider.
J.P. Morgan has set a target price of $235 for the shares.
EPR Properties
This REIT invests in some of the most popular entertainment companies and was added to the JPMorgan Equity Analysts Focus List in July. EPR Properties (NYSE: EPR) is a leading experiential net-lease REIT specializing in select enduring experiential properties and pays a hefty 6.02% dividend.
EPR recently increased its monthly dividend by 5.1% and expects funds from operations (FFO) per share growth of more than 5% in 2026, supporting continued dividend increases. After suspending its dividend during COVID-19, EPR has recovered with five consecutive years of dividend increases. Its $6.9 billion property portfolio generates solid cash flow, and FFO well covers the $0.31 per share monthly dividend.
J.P. Morgan gave this brief reason for adding the shares in July: “High dividend yield that we see as safe and growing, with earnings growth likely to be toward the top of the net-lease REIT peer group.”
The company operates through two segments. The Experiential segment consists of approximately:
- 148 theater properties
- 59 eat and play properties
- 25 attraction properties
- 11 ski properties
- Four experiential lodging properties
- One gaming property
- One cultural property
- 22 fitness and wellness properties
The company’s Education segment comprises 46 early childhood education centers and nine private schools.
The investment portfolio includes ownership of and long-term mortgages on experiential and educational properties. The company has investments in approximately 44 states. All of its owned single-tenant properties are leased on long-term, triple-net terms.
J.P. Morgan’s price target is $62.
The post 5 of JP Morgan’s Top Stock Picks Pay Big Dividends and One Yields Over 12% appeared first on 24/7 Wall St..
]]>The S&P 500 index tracks the performance of the 500 biggest companies in the United States. It is considered a top indicator of the U.S. stock market’s health. The venerable index is market-capitalization-weighted and tracks the 500 leading publicly traded companies in the U.S. Typically, larger companies have a significant impact on the index. The roaring success of the mega-cap Magnificent 7 stocks over the past few years is a testament to that. While the equal-weighted index may make more sense now, some of its individual stocks are incredible back-to-school bargains.
We screened the S&P 500 for high-yielding dividend stocks trading at attractive valuations across metrics including price-to-earnings and free cash flow. Five stocks caught our attention as strong ideas for growth and income investors looking to enter the fall months with less risk in their portfolios, generate dependable passive income, and deliver solid total returns over the long haul. All five are rated Buy by the top Wall Street firms we cover.
Why Do We Cover the High-Yielding S&P 500 Dividend Stocks?
Since 1926, dividends have accounted for approximately 32% of the S&P 500’s total return, while capital appreciation has accounted for 68%. Therefore, sustainable dividend income and the potential for capital appreciation are essential to total return expectations. A study by Hartford Funds, in collaboration with Ned Davis Research, found that dividend stocks delivered an annualized return of 9.18% over the past 50 years (1973 to 2023). Over the same timeline, this was more than double the annualized return for non-payers (3.95%).
AT&T
AT&T (NYSE: T) is the world’s fourth-largest telecommunications company, measured by revenue. The legacy telecom has been undergoing a lengthy restructuring process while maintaining its core operations. Eleven analysts rate the stock a Buy, indicating broad support from Wall Street. With a forward P/E near 10x, a dividend yield of 4.52%, and a moderate payout ratio of 37.19%, it has room to keep paying.
AT&T was a long-time Dividend Aristocrat before structural corporate changes and spinoffs altered its payout strategy.
AT&T provides telecommunications, media, and technology services worldwide. Its Communications segment offers wireless voice and data communications services. Through its company-owned stores, agents, and third-party retail stores, it sells:
- Handsets
- Wireless data cards
- Wireless computing devices
- Carrying cases
- Hands-free devices
AT&T also provides:
- Data
- Voice
- Security
- Cloud solutions
- Outsourcing
- Managed and provided professional services
- Customer premises equipment for multinational corporations, small and mid-sized businesses, and governmental and wholesale customers
This segment also provides residential customers with fiber broadband and legacy voice telephony services. It markets its communications services and products under:
- AT&T
- Cricket
- AT&T PREPAID
- AT&T Fiber
The company’s Latin America segment provides wireless services in Mexico and video services throughout the region. This segment markets its services and products under the AT&T and Unefon brands.
Argus has a Buy rating with a $30 target price.
General Mills
With products that never go out of style and a strong 6.55% dividend yield, this is a rebound story that will reward patient investors. General Mills (NYSE: GIS) is a global manufacturer and marketer of branded consumer foods and has a P/E ratio of 9.23, suggesting it may be undervalued relative to the consumer staples sector average. The company generates strong free cash flow, typically over $2 billion annually, which supports the current dividend even amid softer sales.
Its segments include:
- North America Retail
- International
- North America Pet
- North America Foodservice
The North America Retail segment includes a variety of grocery stores, mass merchandisers, membership stores, natural food chains, drug, dollar, and discount chains, convenience stores, and e-commerce grocery providers.
The International segment consists of retail and foodservice businesses outside the United States and Canada. Its product categories include super-premium ice cream and frozen desserts, meal kits, salty snacks, snack bars, dessert and baking mixes, and shelf-stable vegetables.
The North America Pet segment includes pet food products sold in the United States and Canada in national pet superstore chains, e-commerce retailers, and grocery stores. The North America Foodservice segment product categories include ready-to-eat cereals, snacks, and baking mixes.
Piper Sandler has an Overweight rating and a $45 target price.


Kinder Morgan
Kinder Morgan (NYSE: KMI), one of North America’s largest energy infrastructure companies, has a solid 3.72% dividend yield. This is one of the top energy stocks and remains a Wall Street favorite, paying a solid, dependable dividend. This large-cap energy/midstream name is often grouped as a “cheap yield” pick, benefiting from steady pipeline cash flows rather than commodity price swings.
The company operates the largest natural gas transmission network in the U.S., with about 66,000 miles of pipeline that transport 40% of the country’s gas production. It serves 20% of U.S. power demand, positioning it to benefit from the projected 15% to 20% of electricity demand from AI data centers by 2030. The company’s extensive gas storage capacity (15% of U.S. total) and fee-based revenue model provide stability and growth potential as gas volumes rise.
Kinder Morgan operates through four segments. The Natural Gas Pipelines segment:
- Owns and operates the interstate and intrastate natural gas pipeline and underground storage systems
- Natural gas gathering systems and natural gas processing and treating facilities
- Natural gas liquids fractionation facilities and transportation systems
- Liquefied natural gas liquefaction and storage facilities
The Products Pipelines segment owns and operates refined petroleum products, crude oil, and condensate pipelines, associated product terminals, and petroleum OKE pipeline transmission facilities. The Terminals segment owns and operates liquids and bulk terminals that store and handle various commodities, including:
- Gasoline
- Diesel fuel
- Chemicals
- Ethanol
- Metals
- Petroleum coke
- Owns tankers
Lastly, the CO2 segment produces, transports, and markets CO2 to recover and produce crude oil from mature oil fields. It owns interests in/or operates oil fields, gasoline processing plants, and a natural gas pipeline system in West Texas. It owns and operates about 83,000 miles of pipelines and 144 terminals.
UBS has a Buy rating on the shares, with a $38 target price.


PepsiCo
This top consumer staples stock reported surprisingly solid second-quarter earnings and will continue supplying goods for upcoming football tailgates and parties. PepsiCo (NASDAQ: PEP) is a global food and beverage company that pays a notable 4.09% dividend yield. The company’s low volatility (beta of 0.375) makes it a steady, defensive holding, which makes it a perfect holding while waiting for a comeback.
Its Frito-Lay North America segment offers:
- Lays and Ruffles potato chips
- Doritos, Tostitos, and Santitas tortilla chips
- Cheetos cheese-flavored snacks, branded dips
- Fritos corn chips
The company’s Quaker Foods North America segment provides:
- Quaker Oatmeal
- Grits
- Rice cakes
- Natural granola and oat squares
- Pearl Milling mixes and syrups
- Quaker Chewy granola bars
- Cap’n Crunch cereal
- Life cereal
- Rice-A-Roni side dishes
PepsiCo’s North America Beverages segment offers beverage concentrates, fountain syrups, and finished goods under these brands:
- Pepsi
- Gatorade
- Mountain Dew
- Diet Pepsi
- Aquafina
- Diet Mountain Dew
- Tropicana Pure Premium
- Sierra Mist
- Mug


VICI Properties
VICI Properties (NYSE: VICI) is a New York City-based real estate investment trust that specializes in casino and entertainment properties. It offers a stellar dividend yield of 6.83% and is one of Wall Street’s top picks in the net lease group. It is ideal for more conservative investors seeking gaming exposure and a substantial dividend. The stock is frequently flagged, alongside other stocks in this post, in dividend screens as a “safer” S&P 500 dividend dog with an attractive yield backed by long-term triple-net leases.
VICI Properties has one of the largest portfolios of market-leading gaming, hospitality, and entertainment destinations, including three iconic entertainment facilities on the Las Vegas Strip:
- Caesars Palace Las Vegas
- MGM Grand
- The Venetian Resort Las Vegas
VICI Properties owns 93 experiential assets across a geographically diverse portfolio of 54 gaming properties and 39 other experiential properties across the United States and Canada. The portfolio comprises approximately 127 million square feet and features approximately 60,300 hotel rooms, as well as over 500 restaurants, bars, nightclubs, and sportsbooks. Gaming revenue has proven remarkably resilient in recent downturns, and its triple-net lease structure means it collects rent regardless of swings in tenant profitability.
VICI Properties has a growing array of real estate and financing partnerships with leading operators in other experiential sectors, including:
- Bowlero
- Cabot
- Canyon Ranch
- Chelsea Piers
- Great Wolf Resorts
- Homefield
- Kalahari Resorts
VICI Properties also owns four championship golf courses and 33 acres of undeveloped and underdeveloped land adjacent to the Las Vegas Strip.
Barclays has an Overweight rating with a $31 price objective.
The post It’s August and 5 High-Yield S&P 500 Dividend Stocks Are Back-to-School Bargains appeared first on 24/7 Wall St..
]]>Replacing a $75,000 salary with dividend income is a math problem before it is an investment problem. The equation is simple: income target divided by yield equals the capital you need. What changes is how much risk you take to move the required number down.
For context, the 10-year Treasury pays almost 5%, and the Fed Funds upper bound sits near 4%. Anything a dividend portfolio pays has to be judged against that risk-free bar.
The Conservative Tier: 3% to 4% Yield
At a blended 3.5% yield, replacing $75,000 requires roughly $2.1 million in capital. This is the dividend-growth zone: broad dividend ETFs and aristocrats where the payout compounds year after year.
Johnson & Johnson (NYSE:JNJ) just declared its 64th consecutive year of dividend increases, lifting the quarterly payout 3% to $1.34. Procter & Gamble (NYSE:PG) is on its 70th consecutive year of raises and plans ~$10 billion in dividends in FY2027. Schwab U.S. Dividend Equity ETF (NYSEARCA:SCHD) holds $94.9 billion in net assets across names like Qualcomm, Texas Instruments, and UnitedHealth.
The tradeoff is capital intensity. You need the most money upfront, but the income stream grows and the principal tends to appreciate.
The Moderate Tier: 5% to 7% Yield
At 5%, the requirement drops to $1.5 million. At 7%, it falls to roughly $1.1 million. This is REIT and high-dividend telecom territory.
Realty Income (NYSE:O) yields 4.93%, pays monthly, and just recorded its 115th consecutive quarterly dividend increase. AT&T pays $1.11 annualized, with a yield around 4.97% at recent prices and management guiding $18 billion+ in free cash flow for 2026.
Payouts here are higher but grow slowly. AT&T is a clean example: the current dividend has been flat since January 2022 after being cut from $0.52 quarterly.
The Aggressive Tier: 8% to 12%+ Yield
At 10%, the capital requirement drops to $750,000. At 12%, about $625,000. This is BDC and leveraged income-fund territory.
Main Street Capital (NYSE:MAIN) illustrates the model. Between $0.265 monthly regular dividends and $0.30 quarterly supplementals, the annualized payout runs about $4.38 per share, a yield near 7.8%. MAIN posted 19% annualized ROE in Q2 2026 and its 20th consecutive quarterly supplemental.
The catch: supplementals are variable, NAV can compress in credit stress, and per-share dividend growth is slower than dividend-growth blue chips.
What Most Readers Miss
Lower yields often win over time because the payout compounds. JNJ’s Q1 dividend was $0.75 in 2016 and is $1.34 today. SCHD returned 236% over the past decade, and JNJ 178%. MAIN returned 265% over the same 10 years, but per-share payout growth has been modest and shares are down about 5% over the past year.
As advisor Wes Moss put it on The Clark Howard Podcast, “dividends have grown at twice the rate on average of inflation… that really protects our purchasing power.” With CPI at 332.8 and drifting higher, a flat 10% payout loses ground; a growing 3.5% payout gains it.
Three Steps to Take Now
- Recalculate the target. A $75,000 gross salary translates to less in actual spending. Federal, state, and payroll taxes typically shrink the replacement need to $55,000 to $60,000. Average annual household expenditures were $78,535 in 2024, so anchor to your actual outlays.
- Blend the tiers. A 60% conservative, 30% moderate, 10% aggressive mix using names like JNJ or SCHD alongside Realty Income and MAIN can produce a blended yield near 5% while preserving dividend growth. That puts the target closer to $1.5 million than $2.1 million.
- Model the tax hit. Qualified dividends from JNJ, PG, and O’s operating partnership income are taxed differently than MAIN’s BDC distributions, which are largely ordinary income. In a high bracket, the after-tax yield gap can flip the ranking.

The post How Much Do You Really Need Invested to Replace a $75,000 Salary With Dividends? appeared first on 24/7 Wall St..
]]>The artificial intelligence-radio access network (AI-RAN) thesis is moving from presentations to real-world implementation, and Nokia (NYSE:NOK) is now at the center of this development. With Nvidia (NASDAQ:NVDA) Aerial platform pairing with Nokia radio software and T-Mobile (NASDAQ:TMUS) serving as a marquee field-trial partner, investors are trying to price a technology transition that has already lifted Nokia stock 149.3% over the past year.
Why the Nvidia and T-Mobile Trials Matter
Nokia’s tie-up with Nvidia, anchored by Nvidia’s roughly $1 billion investment and about a 2.9% stake, integrates Nvidia’s AI compute into Nokia’s radio access portfolio for AI-native 6G. T-Mobile is a lead trial partner, with work extending through Nokia’s AI-RAN Center in Dallas. Commercial availability is targeted for late 2027, so this is a multiyear build, not a next-quarter catalyst.
CEO Justin Hotard framed the launch pointedly on the Q2 call: “Last week we launched the industry’s first commercial AI-RAN platform, which will help customers unlock more from their networks, including more than 100% spectral efficiency gains by 2028.” A GPU-based AI-RAN targeting double spectrum capacity is the pitch operators like T-Mobile are stress-testing.
The Numbers Behind the Narrative
Q2 2026 results gave the thesis fundamental support. Nokia posted revenue of $5.48 billion (approx. €4.8 billion), up 5.92% year over year, and EPS of $0.08 versus $0.07 expected. The AI & Cloud line more than doubled, reaching €446 million ($508.96 million), with Q2 order intake of roughly $3.2 billion (€2.8 billion).
Hotard added: “Demand remains strong, while supply continues to be the main industry constraint, prompting our customers to place longer-term orders.” Optical Networks grew 19% and IP Networks 15%, both fueled by hyperscaler and telco buildouts adjacent to the AI-RAN story.
What Investors Are Paying For

At $10.32 a share, Nokia trades at roughly 24x forward earnings, with an analyst target price of $15.02. Full-year 2026 guidance calls for comparable operating profit of €2.1 billion to €2.6 billion, tracking above the midpoint.
The Risks
The bull case has some caveats. Ericsson (NASDAQ:ERIC) is running its own AI-in-RAN pilots with AT&T (NYSE:T) and T-Mobile, some without GPUs at all, which challenges Nokia’s compute-heavy architecture. Retail enthusiasm is already cooling, with Reddit sentiment sliding from 78 bullish on earnings day to 52 neutral this week. Free cash flow swung to negative €732 million ($835 million) in the quarter on restructuring charges. Shares are down 17.0% over the past month.
What to Watch Next
The signal for investors is order conversion. Hotard expects about half of Q2 orders to convert to revenue over the next 12 months. If the Nvidia and T-Mobile trials produce measurable spectral efficiency gains, Nokia’s AI-RAN pitch will gain proof points ahead of the commercialization window.

The post What the Coming 6G Trials With Nvidia, T-Mobile Could Mean for Nokia Investors appeared first on 24/7 Wall St..
]]>SpaceX (NASDAQ:SPCX) never ceases to be in the headlines, it seems. SPCX stock rallied Wednesday, closing up 9.65% to $146.15; the catalyst was a company town hall meeting in which SpaceX founder Elon Musk predicted that Starlink could eventually carry the vast majority of the world’s internet traffic.
The move in SPCX stock caps a bumpy summer, with the stock barely breaking even over the past month, pressured by post-IPO dilution and a massive 911.5 million share unlock on August 6. For investors, Musk’s bold prediction could prompt them to take a closer look at their SpaceX share positions.
The 90% Prediction Behind the Rally
In a company update posted to the official @SpaceX account on X, Musk told employees the Starlink team “brought from nothing an entire global Internet system… the first high-bandwidth global Internet system to ever exist.” The X posting with the full video can be viewed here. Musk added, “I actually think that down the road it will probably do the majority of the Internet. In fact, I think it might end up doing over 90% of all Internet traffic on Starlink.”
Musk noted that Starlink already has “almost 11,000 satellites in orbit… almost twice as many satellites as everyone else combined.” He added that “with Starlink V3 and beyond, we’ll go to 100,000 satellites.”
The scale that Musk envisions is already materializing. SpaceX’s Q2 2026 Connectivity revenue hit $4.29 billion, up 66% year over year, with Starlink subscribers doubling to 12 million and Enterprise and Government revenue up 108%. Furthermore, SpaceX’s total revenue jumped 92% to $7.81 billion, easily beating estimates.
Peers and Partners Face a Concentration Problem
SpaceX’s engineering achievement deserves credit: roughly twice as many satellites as the rest of the industry combined, on a path to 100,000, is a genuinely staggering build-out. However, Musk’s forecast, if even partially accurate, describes a market structure that global communications hasn’t really seen.
Wireless calling prices have collapsed for decades because rivals kept crowding into the pipe. One operator controlling 90% of internet traffic would flip that dynamic and hand a single company enormous pricing power in a historically fragmented industry. That’s the nightmare framing for SpaceX competitors. The concern centers on market concentration.
The most-funded direct rival is Amazon‘s (NASDAQ:AMZN) Project Kuiper. Beyond Kuiper, AST SpaceMobile (NASDAQ:ASTS), Globalstar (NASDAQ:GSAT), and Viasat (NASDAQ:VSAT) are all racing to build competing direct-to-device or broadband constellations.
Terrestrial incumbents like AT&T (NYSE:T) sit in a hybrid spot. They already partner with satellite operators for direct-to-cell coverage, so they’re as much partners as competitors here, but their fiber and 5G economics look different if orbital broadband ever dominates last-mile traffic.
What to Watch Now
For thematic exposure, the Procure Space ETF (NASDAQ:UFO) is a fitting vehicle. The UFO ETF is narrow and unleveraged, and heavy weightings in names like GSAT, ASTS, and VSAT mean sector concentration cuts both ways.
Irrespective of Musk’s predictions, SPCX stock is likely to remain volatile as the space-stock sector involves a multitude of unknowns. Investors can watch for whether the Musk narrative sticks through the pending $60 billion Cursor close and the next Starship V3 flight. If the 90% forecast starts to look even directionally credible, competitor multiples may compress well before Starlink actually gets there.
The post Elon Musk Predicts 90% of Internet Traffic Will Flow Through His Company. That Would Be a Nightmare. appeared first on 24/7 Wall St..
]]>Elon Musk used a recent SpaceX town hall, posted to the company’s X profile, to reset expectations for what Starlink is actually trying to become. His framing is transformational: “Almost 11,000 satellites in orbit. That’s almost twice as many satellites as everyone else combined. And with Starlink V3 and beyond, we’ll go to 100,000 satellites,” Musk said. He added that Starlink “might end up doing over 90% of all Internet traffic” and described the effort as rebuilding “the entire Internet in space.”
The 100,000 Number in Context
The scale gap between Starlink and public satellite competitors is now enormous. AST SpaceMobile (NASDAQ:ASTS), the closest publicly traded direct-to-device rival, has 13 spacecraft in orbit and is targeting approximately 45 satellites by early 2027. CEO Abel Avellan told analysts on the Q2 call that AST’s approach is deliberately different: “We are building the direct-to-device (D2D) network of the future today in partnership with, not in competition with, mobile network operators.”
AST reported $31.52 million in Q2 revenue and a $125.9 million loss tied to the BB7 launch incident. Shares are up roughly 50% over the past year but only 2% YTD.
Legacy operator Viasat (NASDAQ:VSAT) is being squeezed on the other end. CEO Mark Dankberg told investors “the combination of growth in the space market, and our business and technical progress is creating more opportunity for us than ever.” Yet fixed broadband services fell 27% year over year last quarter, even as the stock has run sharply year to date on defense backlog strength.
The Wireless Wedge
Musk’s Tesla earnings comments framing Starlink as a competitor to AT&T (NYSE:T) and Verizon (NYSE:VZ) land differently now. Both carriers are betting on AST SpaceMobile for their satellite-to-cell answer. AT&T CEO John Stankey argued “network performance and operating scale can’t be matched” with fiber locations at 38.6 million. Verizon CEO Dan Schulman is leaning on AI: “with the emergence of AI infrastructure revenue, we are fundamentally reshaping Verizon’s growth trajectory.” VZ stock is up 15.3% YTD while AT&T is down 2.4% over the same period.
T-Mobile US (NASDAQ:TMUS) took the opposite side, embedding Starlink directly into its consumer offer. CEO Srini Gopalan told investors “we see a tremendous runway for growth across both wireless and broadband, as well as new businesses. We’re just getting started.” Q2 postpaid service revenue rose 12.6% to $15.85 billion. The stock is down 12.8% YTD.
What Wall Street Is Pricing
SemiAnalysis projects that one gigawatt of SpaceX inference capacity could generate about $31 billion to $48 billion in annualized revenue under its Anthropic and Google deals. For comparison, AST reaffirmed 2026 revenue of $150 million to $200 million with a revenue backlog around $1.3 billion. If Musk delivers even a fraction of the 100,000-satellite plan, the addressable pie shifts fast, and the public tickers investors can actually own to play it remain a very short list.

The post Elon Musk Tells SpaceX Town Hall ‘We’re Going to 100,000 Satellites.’ As SpaceX ‘Rebuilds the Internet in Space.’ appeared first on 24/7 Wall St..
]]>There’s no denying it: the quantum-computing sector has been unwound. Over the past month, pure-play quantum stocks have sold off sharply as investors pulled capital out of high-multiple and often pre-profit tech. For example, IonQ (NYSE:IONQ) shares are down 39% over the trailing month, with the stock changing hands midday Wednesday at $32.86.
Rigetti Computing (NASDAQ:RGTI) shares are down 30% over the same stretch, and D-Wave Quantum (NYSE:QBTS) shares are also down 30%. Meanwhile, Quantum Computing (NASDAQ:QUBT) shares have slid 24% in a month. The pain has been broad, but not uniform.
Sector-Wide De-Risking Drives the Slide
The selloff in IonQ, Rigetti, D-Wave, and Quantum Computing shares looks less like a company-specific story and more like a sentiment reset across speculative tech. Investors have trimmed exposure to high-multiple, pre-profit names as AI-infrastructure and semiconductor valuations were re-priced. Quantum pure-plays sit at the far end of that risk spectrum.
The valuation setup makes the reaction easier to understand. IonQ stock carries a trailing 12-month P/E ratio of 84.26x, while Rigetti, D-Wave, and Quantum Computing stocks have no meaningful trailing 12-month P/E ratios because they were unprofitable during that time frame. When multiples reset, names anchored to future-scale narratives can take the biggest hit.
The fundamentals reinforce that story. IonQ posted Q1 2026 revenue of $64.67 million, up 755% year over year (YoY), but its adjusted EBITDA loss guide for the year sits at -$330 million to -$310 million. D-Wave reported Q1 2026 revenue of $2.86 million, down 81% YoY on lumpy system-sale timing, though bookings jumped 2,000% YoY. Rapid growth, deep losses, and heavy stock-based compensation are difficult for investors who want to see profits.
The Bull Case Hasn’t Vanished
Recent catalysts complicate the “more pain” thesis. IonQ received final regulatory approval to complete its acquisition of SkyWater Technology (NASDAQ:SKYT), a large U.S.-based semiconductor foundry, with closing expected Friday, July 31. IonQ frames the combination as a vertically integrated, full-stack quantum platform with a secured domestic chip supply.
D-Wave shares popped earlier in the month after AT&T (NYSE:T) agreed to expand use of D-Wave’s quantum computing technology across its network operations. Rigetti stock and peers rallied in sympathy. AT&T stock, for context, is up 10% over the past month, a reminder that defensive telecom is exactly what quantum is not.
Moreover, policy tailwinds remain in play for IonQ, Rigetti, D-Wave, and Quantum Computing. In May, the U.S. Department of Commerce signed letters of intent to provide more than $2 billion in federal incentives to nine quantum-related companies in exchange for minority equity stakes. That kind of federal support gives the sector a structural bid the broader market lacks.
The ETF Is Holding Up Better
The Defiance Quantum ETF (NASDAQ:QTUM) is down 16% over the past month, well less than the pure-plays. The QTUM ETF‘s basket spans quantum and adjacent computing names, so single-stock blowups get diluted. It’s not leveraged, and it carries an expense ratio of 0.4%, offering thematic exposure without single-name volatility.
Concentration risk cuts the other way for the pure-plays. The prediction markets on Polymarket peg IonQ’s odds of beating its next quarterly print at just 6.5%, even as Wall Street analysts hold an average price target of $68.41 on IonQ stock. That gap between crowd sentiment and sell-side optimism is where the next move gets decided.
What to Watch Next
Traders can watch for the SkyWater deal close on July 31, IonQ’s Q2 2026 earnings report on August 5, and D-Wave and Rigetti reports on August 6. Given the beta profile, investors may want to size their positions carefully.
The next two weeks could define whether this correction is a pause or the start of a deeper reset for IonQ, Rigetti, and D-Wave. You can monitor the QTUM ETF as a sector barometer, and pay close attention to guidance updates alongside the headline prints.
For now, the setup rewards patience over conviction. Traders chasing bounces should respect the volatility, while long-term believers may find better entries if the sector-wide de-risking continues into August.
The post IonQ, Rigetti, and D-Wave Quantum Are Down 30% in a Month. Is More Pain Coming for Quantum Computing Stocks? appeared first on 24/7 Wall St..
]]>Retirees rebuilding income streams amid the current interest rate environment need dividend payers with cash-flow durability, not yield traps. The five names below span tobacco, telecom, pharma, and asset management, and each brings a distinct income thesis backed by tool-verified payout data as of July 14, 2026. One caveat up front: Philip Morris International is domiciled in Switzerland, so US investors typically face a 15% Swiss withholding tax on dividends (usually recoverable in taxable accounts via the foreign tax credit, but not in IRAs).
Altria (MO)
Altria (NYSE:MO) yields 5.67% at a recent price of $74.82, with a most recent declared quarterly dividend of $1.06 per share, paid on July 10. The stock has climbed 27.42% over the past year.
The bull case is dividend durability paired with earnings momentum. Altria reaffirmed FY2026 adjusted diluted EPS guidance of $5.56 to $5.72, and Q1 2026 delivered adjusted diluted EPS of $1.32 on revenue of $5.43 billion. The smokeable segment still throws off 65.1% margins, funding $1.8 billion in Q1 dividends and buybacks. Forward P/E sits at just 13.
Risk: Marlboro retail share slipped 1.4 points to 39.7%, on! nicotine pouch share fell 4.2 points to 13.4%, and domestic cigarette volumes declined roughly 5%. Long-term volume erosion is the structural headwind pricing power must keep outrunning.
Philip Morris International (PM)

Philip Morris International (NYSE:PM) yields 2.94% — lower than the others on this list — but its dividend is compounding the fastest. The most recent declared quarterly payout is $1.47, paid on July 20, up from $1.35 in the first half of 2025.
The thesis is a growth-plus-income hybrid built on smoke-free products. PM guided FY2026 adjusted diluted EPS of $8.36 to $8.51, a 10.9%–12.9% jump, and targets a 9%–11% CAGR through 2028 ex-currency. IQOS reaches 108 markets, ZYN reaches 58 markets, and smoke-free is roughly 41.5% of revenue. Analyst target: $194.86.
Risk: Q1 ZYN shipments fell 23.5% on distributor destocking, and PM has paused buybacks to prioritize deleveraging. Add the Swiss withholding wrinkle for taxable-account investors.
AT&T (T)
AT&T (NYSE:T) just gave income investors a rare piece of good news: the quarterly dividend was raised to 33 cents per share, ex-date July 17, payable Aug. 3. That works out to an annualized forward rate of $1.3376, a 20.4% increase off the 27-cent rate that had held for 16 straight quarters.
The bull case is converged fiber-plus-5G economics finally translating to cash. AT&T reaffirmed FY2026 free cash flow of $18 billion or more, plans roughly $8 billion in 2026 buybacks, and targets $45 billion in total shareholder returns from 2026 to 2028. Q1 EPS came in at 57 cents, up 11.8% year-over-year, and the payout ratio remains conservative at roughly half of 2025 reported EPS of $2.11.
Risk: Total debt sits at $138.4 billion, with net debt/EBITDA expected to rise toward 3.2x after the EchoStar transaction. Shares are still down 16.35% over the past year.
Pfizer (PFE)
Pfizer (NYSE:PFE) is the ultra-high-yield pick here, sporting a 6.81% dividend yield at roughly $25.25. The most recent quarterly dividend of 43 cents went ex on July 24, and pays out on Sept. 1.
Q1 2026 showed the earnings recovery investors need to underwrite this yield: adjusted diluted EPS of 75 cents on revenue of $14.45 billion, up 5.4% year-over-year. Management reaffirmed FY2026 revenue of $59.5–$62.5 billion and adjusted EPS of $2.80–$3.00, which comfortably covers the $1.72 annualized dividend. Vyndamax U.S. exclusivity was extended to June 2031, and forward P/E of 8 discounts a lot of bad news.
Risk: COVID revenue is collapsing (Comirnaty down 59%, Paxlovid down 63%), and management flagged a $1.5 billion 2026 revenue headwind from loss of exclusivity. Most-Favored-Nation drug pricing remains an open policy risk.
T. Rowe Price (TROW)

T. Rowe Price (NASDAQ:TROW) yields 4.27%, with the current quarterly dividend at $1.30, last paid on June 29. Dividend history in the record shows increases in every calendar year going back to at least 1999, with no cuts across that span.
The bull case is a debt-free balance sheet with $3.73 billion in cash supporting a Dividend Aristocrat payout. Q1 2026 adjusted EPS beat expectations at $2.52 versus $2.35 estimated, a 7.234% surprise, with revenue of $1.86 billion and average AUM of $1.78 trillion, up 9.6% year-over-year. The company returned $629 million to shareholders in Q1.
Risk: Persistent net client outflows totaled $13.7 billion in Q1 2026 and $56.9 billion for FY2025, and fee rates compressed to 38.4 basis points. Analyst sentiment is cool: nine Hold ratings, one Sell rating and three Strong Sell ratings with a 12-month price target of $106.33 (notably below the current share price of $121.68). Retirees buying today are paying for durability, not near-term upside.
The post 5 High-Yielding Dividend Stocks for Retirees to Buy and Hold Forever appeared first on 24/7 Wall St..
]]>While many Baby Boomers have enjoyed a long bull market over the past 35 years, there is a point when income becomes more critical than stock appreciation. The reason is simple: those who leave their careers to enjoy a well-deserved retirement lose the benefits of a regular salary, such as 401(k) matching and company-paid healthcare. In addition, many Boomers use their retirement years to travel and enjoy the rewards they have worked hard to achieve throughout their lives. Choosing investments wisely is imperative, and at 24/7 Wall St., we continually seek the best ideas for Baby Boomers and retirees.
One concern many Boomers and retirees have is generating enough passive income to maintain the lifestyle to which they were accustomed during their working days. One of the best ideas, and one we have championed here at 24/7 Wall St. for years, is quality high-yield dividend stocks. The problem is that many of our favorite companies have traded higher over the past few years, and the risk-reward for many has diminished. We screened our 24/7 Wall St. high-yield stocks database for well-known companies that, for various reasons, are trading far below what many on Wall Street consider fair value.
We found five companies that most investors are very familiar with, all paying substantial and reliable dividends, and all rated Buy by the top Wall Street firms we cover.
Why Do We Cover the High-Yielding Dividend Stocks?
Since 1926, dividends have accounted for approximately 32% of the S&P 500’s total return, while capital appreciation has accounted for 68%. Therefore, sustainable dividend income and the potential for capital appreciation are essential to total return expectations. A study by Hartford Funds, in collaboration with Ned Davis Research, found that dividend stocks delivered an annualized return of 9.18% over the past 50 years (1973 to 2023). Over the same timeline, this was more than double the annualized return for non-payers (3.95%).
AT&T
AT&T (NYSE: T) is the world’s fourth-largest telecommunications company, measured by revenue. The legacy telecom has been undergoing a lengthy restructuring process while maintaining a solid 4.55% dividend yield. Thirteen analysts have given the stock a Buy rating, indicating broad support from Wall Street. The stock was hit on concerns that Starlink was taking internet share. Still, strong earnings, along with the addition of 432,000 net postpaid phone subscribers and 646,000 high-speed internet customers, both above estimates, have helped quell that argument.
The company provides a range of telecommunications, media, and technology services worldwide. Its Communications segment offers wireless voice and data communications services. Through its company-owned stores, agents, and third-party retail stores, it sells:
- Handsets
- Wireless data cards
- Wireless computing devices
- Carrying cases
- Hands-free devices
AT&T also provides:
- Data
- Voice
- Security
- Cloud solutions
- Outsourcing
- Managed and provided professional services
- Customer premises equipment for multinational corporations, small and mid-sized businesses, and governmental and wholesale customers
Additionally, this segment provides residential customers with fiber broadband and legacy voice telephony services. It markets its communications services and products under:
- AT&T
- Cricket
- AT&T PREPAID
- AT&T Fiber
The company’s Latin America segment provides wireless services in Mexico and video services throughout the region. This segment markets its services and products under the AT&T and Unefon brands.
J.P. Morgan has a $34 price target for the stock.
Energy Transfer
Energy Transfer (NYSE: ET) is one of North America’s largest and most diversified midstream energy companies. This top master limited partnership is a safe option for investors seeking energy exposure and income, as the company pays a 6.71% distribution yield. Energy Transfer owns and operates one of the largest and most diversified portfolios of energy assets in the United States, with a strategic footprint across all major domestic production basins. The company has raised its 2026 EBITDA guidance and is well-positioned to benefit from surging natural gas demand driven by AI-powered data centers. This tailwind, combined with its attractive high yield, has been a key bullish catalyst.
The company is a publicly traded limited partnership with core operations that include:
- Complementary natural gas midstream, intrastate, and interstate transportation and storage assets
- Crude oil, natural gas liquids (NGL), and refined product transportation and terminalling assets
- NGL fractionation
- Various acquisition and marketing assets
Following the acquisition of Enable Partners in December 2021, Energy Transfer owns and operates over 114,000 miles of pipelines and related assets in 41 states, spanning all major U.S. producing regions and markets. This further solidifies its leadership position in the midstream sector.
Through its ownership of Energy Transfer Operating, formerly known as Energy Transfer Partners, the company also owns Lake Charles LNG; the general partner interests, the incentive distribution rights, and 28.5 million standard units of Sunoco (NYSE: SUN); and the public partner interests and 39.7 million standard units of USA Compression Partners (NYSE: USAC).
Jefferies has a Buy rating with a $23 target price.

Pfizer
This pharma giant’s recovery story is gaining traction, with blockbuster non-COVID drugs delivering strong growth. The company is reportedly actively working on experimental GLP-1 treatments and has recently acquired assets, such as ecnoglutide (currently in development), to build a new obesity pipeline. Pfizer (NYSE: PFE) discovers, develops, manufactures, markets, distributes, and sells biopharmaceutical products worldwide. It pays a dependable 6.97% dividend, which has increased annually for the past 16 years.
The company offers medicines and vaccines in various therapeutic areas, including:
- Cardiovascular, metabolic, and women’s health under the Premarin family and Eliquis brands
- Biologics, small molecules, immunotherapies, and biosimilars under the Ibrance, Xtandi, Sutent, Inlyta, Retacrit, Lorbrena, and Braftovi brands
- Sterile injectable and anti-infective medicines and oral COVID-19 treatment under the Sulperazon, Medrol, Zavicefta, Zithromax, Vfend, Panzyga, and Paxlovid brands
Pfizer also provides medicines and vaccines in various therapeutic areas, such as:
- Pneumococcal disease, meningococcal disease, and tick-borne encephalitis
- COVID-19 under the Comirnaty/BNT162b2, Nimenrix, FSME/IMMUN-TicoVac, Trumenba, and the Prevnar family brands
- Biosimilars for chronic immune and inflammatory diseases under the Xeljanz, Enbrel, Inflectra, Eucrisa/Staquis, and Cibinqo brands
- Amyloidosis, hemophilia, and endocrine diseases under the Vyndaqel/Vyndamax, BeneFIX, and Genotropin brands
Argus has a Buy rating and a $35 target price.
Realty Income
This real estate investment trust has paid monthly dividends consistently for years. Top-rated Realty Income (NYSE:O) owns over 15,500 properties with a 98.9% occupancy rate across 1,761 tenants in 92 industries, many in strong categories like grocery stores and dollar stores. Occupancy has never fallen below 96.6% this century, even during the Great Recession and the COVID-19 pandemic. With a 5% dividend yield, this is an ideal stock for growth and income investors seeking a safer contrarian idea for the rest of 2026. Realty Income is an S&P 500 company that acquires and manages freestanding commercial properties that generate rental revenue under long-term net lease agreements with its commercial clients.
It is engaged in a single business activity: leasing property to clients, generally on a net basis. This business activity spans various geographic boundaries and encompasses a range of property types and clients across multiple industries. Widely considered the gold standard of monthly dividend stocks, Realty Income has been paying dividends since 1969. It has paid 667 consecutive monthly dividends as of early 2026 and increased its dividend 132 times since its 1994 IPO.
The company owns or holds interests in approximately 15,621 properties in all 50 states:
- United Kingdom
- France
- Germany
- Ireland
- Italy
- Portugal
- Spain
With clients operating in 89 industries, its property types include retail, industrial, gaming, and other categories such as agriculture and office.
Its primary industry concentrations include:
- Grocery stores
- Convenience stores
- Dollar stores
- Drug stores
- Home improvement stores
- Restaurants
- Quick service
UBS has a Buy rating with a $72 target price.
VICI Properties
Vici Properties (NYSE: VICI) is a real estate investment trust based in New York City that specializes in casino and entertainment properties, paying a stellar dividend yield of 6.67%. This is one of the top picks across Wall Street in the net lease group and is ideal for more conservative investors seeking gaming exposure and a substantial dividend. It is an S&P 500 experiential REIT with one of the largest portfolios of market-leading gaming, hospitality, and entertainment destinations, including three iconic entertainment facilities on the Las Vegas Strip:
- Caesars Palace Las Vegas
- MGM Grand
- The Venetian Resort Las Vegas
Long-term master leases protect the company, with roughly 40 years remaining, and it just reported 4.5% adjusted funds from operations (AFFO) per share growth while raising 2026 guidance. It carries an investment-grade credit rating and an AFFO payout ratio of around 74%.
VICI Properties owns 93 experiential assets across a geographically diverse portfolio of 54 gaming properties and 39 other experiential properties across the United States and Canada. The portfolio comprises approximately 127 million square feet and features approximately 60,300 hotel rooms, as well as over 500 restaurants, bars, nightclubs, and sportsbooks. Gaming revenue has proven remarkably resilient in recent downturns, and its triple-net lease structure means it collects rent regardless of tenant profitability swings.
Its properties are occupied by industry-leading gaming, leisure, and hospitality operators under these long-term, triple-net lease agreements.
VICI Properties has a growing array of real estate and financing partnerships with leading operators in other experiential sectors, including:
- Bowlero
- Cabot
- Canyon Ranch
- Chelsea Piers
- Great Wolf Resorts
- Homefield
- Kalahari Resorts
VICI Properties also owns four championship golf courses and 33 acres of undeveloped and underdeveloped land adjacent to the Las Vegas Strip.
The Bank of America price target is $34.
The post Boomers Are Buying 5 Quality High-Yield Stocks at Big Discounts Hand Over Fist appeared first on 24/7 Wall St..
]]>D-Wave Quantum (NYSE:QBTS) shares are up 7% to $19.29 in Monday morning trading after the company announced an expanded agreement with AT&T (NYSE:T) to deploy its annealing quantum systems across network operations.
The catalyst is company-specific, yet the reaction is sector-wide. D-Wave Quantum stock is leading the tape by name recognition, but the sympathy names are actually outrunning it. IonQ (NYSE:IONQ) shares are up 12% to $36.67, Rigetti Computing (NASDAQ:RGTI) stock is up 12% to $15.88, and Quantum Computing (NASDAQ:QUBT) shares are up 8% to $8.06.
The Defiance Quantum ETF (NYSEARCA:QTUM) is up 1% to $141.12, a milder move that reflects its broader compute exposure. Today’s rally comes inside a sharp drawdown for the pure-play names, giving traders a bounce within a longer-term drawdown.
Expanded AT&T Deal Fuels the Rally
D-Wave and AT&T signed an expanded agreement covering network operations, with an early application cutting a network optimization workload from about one hour to under 15 seconds, a 240x speedup using D-Wave’s annealing technology. AT&T plans to extend the work to outage detection, technician routing, network build planning, and traffic management.
AT&T is also evaluating D-Wave’s forthcoming gate-model systems for quantum security and communications. This is a concrete enterprise deployment tied to hard metrics, which is the piece the sector has been missing.
Benchmark added fuel by initiating D-Wave Quantum stock at Buy with a $30 price target. CEO Alan Baratz has framed AT&T’s expansion as evidence that annealing is moving from proof-of-concept into production workloads.
Rigetti Gets Its Own HPE Catalyst
Rigetti Computing shares are running with a second, name-specific catalyst. The company is expanding its collaboration with Hewlett Packard Enterprise and the Pittsburgh Supercomputing Center to build “TangleLab,” a hybrid quantum-classical supercomputing testbed funded by a $5 million National Science Foundation grant.
Rigetti will deliver a 9-qubit Novera quantum system integrated with classical high-performance computing. Construction is expected to begin September 1 at PSC’s new data center, with full operations expected in 2027. That timeline underlines both the opportunity and the wait involved in this thesis.
Peers Rally on Enterprise Adoption Sentiment
The read-through is straightforward. One credible enterprise deal is lifting the entire complex on adoption sentiment, and the sympathy names are outrunning the actual beneficiary. That’s classic thematic momentum trading.
The bounce comes inside deep drawdowns. D-Wave Quantum stock is down 27% year to date, IonQ stock is down 16% year to date, Rigetti Computing stock is down 29% year to date, and Quantum Computing stock is down 22% year to date. The Defiance Quantum ETF, which spreads exposure across broader compute names, remains up 29% year to date.
Bull Case, Bear Case, and What to Watch
The bull case rests on real customer traction. AT&T’s 240x speedup is a hard number, Benchmark’s Buy rating gives sell-side cover, and Rigetti’s NSF-funded HPE testbed shows federal research dollars flowing into hybrid architectures. D-Wave’s own $588.4 million cash position and $33.4 million in bookings from Q1 FY2026 support a runway argument.
The bear case is the valuation and the wait. D-Wave stock carries a price-to-sales ratio of 482.56 against TTM revenue of $12.44 million. TangleLab doesn’t reach full operations until 2027, and prediction markets currently price only a 25.5% probability that the U.S. federal government takes an equity stake in IonQ by year-end 2026.
Investors sizing their exposure here can keep their positions modest given a beta of 2.1 on D-Wave stock and the QTUM ETF’s narrow thematic concentration. The next cues are whether today’s gains hold into the close and whether other carriers follow AT&T’s lead with their own commercial announcements.
The post D-Wave Quantum Rises 7% on Expanded AT&T Deal, Lifting IonQ, Rigetti, Quantum Computing Inc. appeared first on 24/7 Wall St..
]]>While it remains a mystery exactly why certain companies are removed from the venerable Dow Jones Industrial Average, even after years on the legacy index, we decided to ask Anthropic’s Claude chatbot for an answer on how those decisions are made. These were the results we got:
S&P Dow Jones Indices manages the Dow Jones Industrial Average, and changes to its composition are determined by an index committee—not by any fixed formula or automatic screening process. This is a key difference from many other indices (like the S&P 500), which use largely rules-based, quantitative criteria for additions and removals.
Who decides:
The S&P Dow Jones Indices Averages Committee, made up of full-time S&P Dow Jones Indices employees (analysts and economists), meets periodically and can also convene on an as-needed basis when a change seems warranted. The committee’s decisions are essentially editorial judgment calls rather than mechanical rule-following.
Criteria/factors considered for removal:
Since there’s no strict quantitative threshold, the committee weighs a mix of factors, including:
- Reputation decline — A company falling out of favor, facing major controversy, or losing standing as a leading representative of American industry.
- Slower growth or shrinking relevance — A company no longer reflecting the sector or economy it’s meant to represent.
- Sector balance — The committee tries to maintain reasonable representation across major sectors of the economy. If a sector becomes overrepresented or underrepresented, a swap may follow.
- Stock price distortions — Because the DJIA is price-weighted (not market-cap weighted), a stock with an unusually high or low price can distort the index’s calculations. Extreme price divergence, or a stock split that significantly changes a company’s weighting, can be a trigger for a change.
- Corporate actions — Mergers, acquisitions, bankruptcy, or a company being acquired can force removal, since the company effectively stops existing as an independent public entity.
- Overall fit — Whether the company remains a widely held, financially sound, and historically significant “blue chip” that meaningfully represents the U.S. economy.
When a company is removed, it’s simultaneously replaced by another company chosen to maintain balance across the 30-stock index. Because these decisions are subjective and infrequent, they tend to draw significant market attention when announced, and the S&P Dow Jones Indices typically announces changes a few days before they take effect.
With all that in mind, we decided to screen the stocks that had been removed over the past few decades and see whether the committee of analysts and economists is making the right removal decisions. Interestingly, some of the companies that were kicked out have soared and, in many cases, continued to pay big, dependable dividends. One thing we did note is that, over the past decade, technology companies have been replacing the stocks they remove.
Here are five dividend-paying giants that were all removed from the Dow.
Altria
Altria (NYSE: MO) is one of the world’s largest producers and marketers of cigarettes and other tobacco-related products. This tobacco stock offers value investors a solid entry point and a 5.66% dividend. Altria manufactures and sells smokable and oral tobacco products in the United States primarily to wholesalers, including distributors and large retail organizations, such as chain stores.
Kiplinger notes that after it was removed in 2008, shareholders who held through the transition saw their shares surge by more than 150% in the years following, excluding dividends.
The company primarily sells cigarettes under the Marlboro brand, as well as:
- Cigars and pipe tobacco, principally under the Black & Mild and Middleton brands
- Moist smokeless tobacco and snus products under the Copenhagen, Skoal, Red Seal, and Husky brands
- on! Oral nicotine pouches
- e-vapor products under the NJOY ACE brand
Altria used to own over 10% of Anheuser-Busch InBev (NYSE: BUD), the world’s largest brewer. In March of 2024, the company sold 35 million of its 197 million shares through a global secondary offering. That represents 18% of its holdings but still leaves 8% of the outstanding shares in its back pocket. Altria also announced a $2.4 billion stock repurchase plan partially funded by the sale.
Altria increased its quarterly dividend in the fall of 2025 by 3.9%, from $1.02 to $1.06 per share, marking its 57th consecutive dividend increase.
AT&T
AT&T (NYSE: T) is the world’s fourth-largest telecommunications company, measured by revenue. The legacy telecom has been undergoing a lengthy restructuring process while maintaining a solid dividend of 5.06%. Thirteen analysts have given the stock a Buy rating, indicating broad Wall Street support.
It was removed from the index in 2015 to clear space for Apple (NASDAQ: AAPL). AT&T was a long-time Dividend Aristocrat before structural corporate changes and spinoffs altered its payout strategy.
AT&T provides a range of telecommunications, media, and technology services worldwide. Its Communications segment offers wireless voice and data communications services. Through its company-owned stores, agents, and third-party retail stores, it sells:
- Handsets
- Wireless data cards
- Wireless computing devices
- Carrying cases
- Hands-free devices
AT&T also provides:
- Data
- Voice
- Security
- Cloud solutions
- Outsourcing
- Managed and provided professional services
- Customer premises equipment for multinational corporations, small and mid-sized businesses, and governmental and wholesale customers
Additionally, this segment provides residential customers with fiber broadband and legacy voice telephony services. It markets its communications services and products under:
- AT&T
- Cricket
- AT&T PREPAID
- AT&T Fiber
The company’s Latin America segment provides wireless services in Mexico and video services throughout the region. This segment markets its services and products under the AT&T and Unefon brands.
Exxon Mobil
Exxon Mobil (NYSE: XOM) manages an industry-leading portfolio of resources and is one of the world’s largest integrated fuels, lubricants, and chemical companies. Despite the rise in oil prices, investors still have an excellent entry point to secure a strong 2.66% dividend yield. Exxon is the world’s largest international integrated oil and gas company, exploring for and producing crude oil and natural gas in North and South America, Europe, Africa, Asia, and elsewhere.
The legacy energy behemoth was removed in August 2020 after a 92-year run to make room for Salesforce (NYSE: CRM). Despite its removal, Exxon continued to raise its dividend payout annually and has delivered strong total returns for investors.
Exxon also manufactures and markets commodity petrochemicals, including olefins, aromatics, polyethylene, and polypropylene plastics, as well as specialty products. Additionally, the company transports and sells crude oil, natural gas, and petroleum products.
Top Wall Street analysts expect the company to remain a key beneficiary in a higher oil price environment, and most remain optimistic about the company’s sharp positive inflection in capital allocation strategy. The upstream portfolio offers leverage to a further demand recovery, and Exxon offers greater Downstream/Chemicals exposure than its peers.
Exxon completed its purchase of oil shale giant Pioneer Natural Resources in 2024 in an all-stock transaction valued at $59.5 billion. The deal created the largest U.S. oilfield producer and guarantees a decade of low-cost production.

International Paper
With a rich 5.09% dividend and a product that remains in demand, this top stock is still incredibly attractive. International Paper (NYSE: IP) provides sustainable packaging solutions. The company produces renewable fiber-based packaging products and operates manufacturing facilities in North America, Latin America, Europe, and North Africa. Kiplinger said the company was kicked out of the Dow in April 2004, and that the stock rebounded by approximately 25% and delivered a total return of over 100% when dividends are factored in.
Its segments include:
- Packaging Solutions North America
- Packaging Solutions EMEA
The company’s products and services include Packaging, Packaging Services, and Recycling. It provides corrugated packaging, solid fiber, corrugated sheets, retail displays, bulk packaging, and more.
International Paper also offers related services such as design and fulfillment to support these solutions. It provides a range of packaging and display services, from design and testing to fulfillment, including structural and graphic design, printing, testing, mechanical assembly, and packaging.
The company offers recycling solutions and services to manage fiber recovery programs for retailers, grocers, e-commerce companies, distribution centers, manufacturers, and its own box plants.

Pfizer
Pfizer (NYSE: PFE) was established in 1849 in New York by two German entrepreneurs. This top pharmaceutical stock was a major winner in the COVID-19 vaccine race, but has declined significantly as booster uptake has slowed. However, Pfizer’s recovery story is gaining traction, with blockbuster non-COVID drugs delivering strong growth and a potential GLP-1 product launch on the horizon. It pays a dependable 6.93% dividend, which has increased annually for the past 15 years.
Booted in the August 2020 reshuffle to accommodate Amgen (NASDAQ: AMGN), Pfizer remains a staple for income investors seeking pharmaceutical exposure.
Pfizer discovers, develops, manufactures, markets, distributes, and sells biopharmaceutical products worldwide in various therapeutic areas, including:
- Cardiovascular, metabolic, and women’s health under the Premarin family and Eliquis brands
- Biologics, small molecules, immunotherapies, and biosimilars under the Ibrance, Xtandi, Sutent, Inlyta, Retacrit, Lorbrena, and Braftovi brands
- Sterile injectable and anti-infective medicines and oral COVID-19 treatment under the Sulperazon, Medrol, Zavicefta, Zithromax, Vfend, Panzyga, and Paxlovid brands
Pfizer also provides medicines and vaccines in other therapeutic areas, such as:
- Pneumococcal disease, meningococcal disease, and tick-borne encephalitis
- COVID-19 under the Comirnaty/BNT162b2, Nimenrix, FSME/IMMUN-TicoVac, Trumenba, and the Prevnar family brands
- Biosimilars for chronic immune and inflammatory diseases under the Xeljanz, Enbrel, Inflectra, Eucrisa/Staquis, and Cibinqo brands
- Amyloidosis, hemophilia, and endocrine diseases under the Vyndaqel/Vyndamax, BeneFIX, and Genotropin brands
Pfizer anticipates full-year 2026 revenues to be in the range of $59.5 billion to $62.5 billion. This outlook reflects an expected $1.5 billion decline in COVID-19 product sales (forecasted at approximately $5.0 billion for 2026, compared to $6.5 billion in 2025), alongside an additional $1.5 billion headwind from upcoming drug patent expirations.
The post Verizon Was Booted From the Dow – 5 Dividend Giants Got the Same Treatment and Eventually Soared appeared first on 24/7 Wall St..
]]>Pre-Market Stock Futures:
Futures are trading lower as more big earnings excitement ran into rising oil prices and geopolitical worries. When the final bell rang on Wednesday, all of the major indices finished the day lower, except the Dow Jones Industrial Average, which essientially closed flat at 52,239. The other three indices closed lower, with the small-cap Russell 2000 taking the biggest hit, closing down 1% at 2,957. At the same time, the tech-heavy Nasdaq finished the session at 25,690, down 0.57%. The S&P 500 closed the day at 7,498, down just 0.14%. The big news after the close was the second-quarter earnings from technology giant Alphabet (NASDAQ: GOOGL), and while they blew past analysts’ estimates, the shares were under pressure in the after-market, and are trading lower this morning in the pre-market action.
Treasury Bonds:
The song remains the same in the Treasury complex, as yields were higher across the entire curve once again, and the same reasons for the weakness persist. Higher oil prices are fueling worries about a resurgence of inflation, which took a summer holiday in June and looks set to return when the July inflation numbers come out in the month. The 30-year long bond closed the session at 5.15%, while the ten-year note closed at 4.66%. BTIG pointed out yesterday that 4.65% was a key area for the benchmark bond, and a “decisive close above that level could trigger a move higher”. Investors looking to buy the 10-year should focus on the 4.75% level.
Oil and Gas:
In what is becoming a daily story, oil prices moved higher once again. Despite assurances from Secretary of State Rubio that tankers will be able to pass, buyers continue to launch bullish energy bets. When the dust settled on Wednesday, Brent Crude was up 3.05% at $93.79, while West Texas Intermediate finished the day at $86.44, higher by 2.49%. Natural gas joined in, and was last seen at $2.95, up 2.79%.
Gold:
Geopolitical worries and rising yields were all it took to keep precious metals on their recent upward trend, where prices hit a 2-week high on Wednesday. Some traders pointed to next week’s meeting of the Federal Reserve governors and said that some of the move higher is positioning ahead of it. Gold closed Wednesday’s session at $4,134, up 1.38%, while Silver closed at $59.62, up 1.68%.
Crypto:
The global cryptocurrency market ended slightly lower on Wednesday, with total market capitalization holding steady around $2.24 trillion. Bitcoin traded near $65,900 after climbing to an intraday high of $67,000 earlier in the session. The mild pullback appeared driven mainly by investors locking in profits, alongside a broader shift toward safe-haven assets. Rising crude oil prices and escalating tensions in the Middle East added to the cautious sentiment across risk assets. At 8 AM EDT, Bitcoin was trading at $65,520, while Ethereum was quoted at $1,926.
24/7 Wall St. reviews dozens of analyst research reports every day to identify fresh investment ideas for investors and traders alike. These daily analyst notes include recommendations on stocks to buy, sell, or avoid, as well as new coverage initiations. I would like to remind you that no single analyst report should ever be the sole basis for buying or selling a stock.
Here are some of the top Wall Street analyst upgrades, downgrades, and initiations seen on Thursday, July 23, 2026.
Upgrades:
- Ameren (NYSE: AEE) was upgraded to Overweight from Sector Weight at KeryBanc, with a $122 target price.
- AT&T (NYSE: T) was upgraded to Outperform from Peer Perform at Wolfe Research, with a $29 target price.
- Duke Energy (NYSE: DUK) was raised to Overweight from Sector Weight at KeyBanc, with a $139 target price objective.
- JPMorgan Chase & Company (NYSE: JPM) was upgraded to Buy from Hold at Deutsche Bank, which moved the target price to $375 from $345.
- Verisk Analytics (NASDAQ: VRSK) was upgraded to Buy from Hold at Jefferies, which raised the target price on the shares to $235 from $192.
Downgrades:
- Pegasystems (NASDAQ: PEGA) was downgraded to Loop Capital, which slashed the target price to $25 from $55.
- PNC Financial Services Group (NYSE: PNC) was downgraded to Hold from Buy at Deutsche Bank, with a $265 price target.
- Northern Trust (NASDAQ: NTRS) was downgraded to Sector Perform from Outperform at RBC Capital, with a $178 target price.
- Norwegian Cruise Line Holdings (NYSE: NCLH) was downgraded to Hold from Buy at Truist Financial, with a $20 target price.
- Southern Company (NYSE: SO) was cut to Underweight from Sector Weight at KeyBanc, with a $79 target price.
Initiations:
- Applied Digital (NASDAQ: APLD) was initiated with an Equal Weight at Morgan Stanley, with a $36.50 target price.
- Autodesk (NASDAQ: ADSK) was initiated with a Buy rating at Guggenheim, with a $245 target price.
- Exxon Mobil (NYSE: XOM) was assumed with a Neutral rating at Piper Sandler, which has a $158 target for the integrated oil giant.
- LiveNation Entertainment (NYSE: LYV) was initiated with a Buy rating at BTIG, with a $215 target price.
- Tyler Technologies (NYSE: TYL) was started with a Buy rating at Guggenheim, which has a $440 target price for the stock.
The post Here Are Thursday’s Top Wall Street Analyst Research Calls: AT&T, Applied Digital, Autodesk, Duke Energy, Exxon Mobil, JPMorgan Chase & Company, Live Nation Entertainment, and More appeared first on 24/7 Wall St..
]]>AT&T (NYSE: T) just posted its fifth consecutive earnings beat, with management accelerating buybacks to roughly $10 billion for the year.
Our 24/7 Wall St. price target for the next 12 months is $27.91, implying 21.81% upside from the current $22.91 quote. Confidence in this call is high at 90%, and the recommendation is a buy.

24/7 Wall St. Price Target Summary
| Metric | Value |
|---|---|
| Current Price | $22.91 |
| 24/7 Wall St. Price Target | $27.91 |
| Upside | 21.81% |
| Recommendation | BUY |
| Confidence Level | 90% |
A Record Quarter Sets the Stage
AT&T reported Q2 2026 adjusted EPS of $0.65 against a $0.5871 consensus, a 10.71% beat. Revenue of $31.56 billion came in 0.79% light of estimates but grew 2.3% year over year. Operating income climbed 7.45% and net income rose 11.96% to $5.04 billion. Subscriber trends were strong: 432,000 postpaid phone net adds, 367,000 fiber net adds, and postpaid phone churn of just 0.86%.
Shares are up 6.21% over the past week and 4.04% over one month, though T remains down 5.76% year to date. The stock sits well below its 52-week high of $28.75 and above the $19.63 low.
The Case for $30 and Above
The bull scenario points to $30.20, a 31.8% total return. Advanced Connectivity service revenue is up 5.1% with operating income surging 20.3% to $7.34 billion. Fiber locations reached 38.6 million, tracking a 40 million year-end target and 60 million by 2030. Fixed wireless subscribers jumped 77.4% to 2.611 million.
CEO John Stankey told investors, “We are accelerating the pace of our planned share repurchases this year to approximately $10 billion, reflecting our confidence in our market position.” Combined with $45 billion+ in total shareholder returns targeted through 2028, this supports a re-rating toward the $29.03 analyst consensus and beyond.
The Risks Worth Watching
The bear scenario lands at $24.84. Legacy copper revenue fell 25.9%, net debt to EBITDA of 2.68x exceeds the 2.5x target, and interest expense rose 13.8%.
Regulatory delays on the pending EchoStar spectrum deal could weigh on sentiment. Bulls counter that capex jumped 16.4% to $5.70 billion to fund fiber and spectrum investments driving out-year free cash flow to $21 billion+ by 2028.
How AT&T Compares to Verizon and T-Mobile
Verizon (NYSE: VZ) trades at a forward P/E of 9x with a 6.36% dividend yield and an analyst target of $51.12. AT&T’s forward P/E of 10x is slightly richer, but T’s fiber footprint and stronger EPS growth trajectory justify the premium.
T-Mobile US (NASDAQ: TMUS) trades at a forward P/E of 19x with an analyst target of $252.73, reflecting faster subscriber growth. Against that peer, AT&T’s implied 12x forward multiple at our target leaves substantial room, making our 24/7 Wall St. price target look conservative.
| Company | Forward P/E | Dividend Yield |
|---|---|---|
| AT&T | 10x | 5.06% |
| Verizon | 9x | 6.36% |
| T-Mobile | 19x | 2.01% |
Our Bottom Line
The 24/7 Wall St. price target of $27.91 and buy rating, backed by 90% confidence, reflects a business generating record profits at an attractive multiple. The setup remains constructive so long as the fiber build stays on pace toward 40 million locations by year-end.
The thesis weakens if net debt to EBITDA drifts further above 2.5x or the EchoStar spectrum deal stalls. On balance, the risk-reward at $22.91 skews positive.
| Year | 24/7 Wall St. Price Target |
|---|---|
| 2026 | $27.91 |
| 2027 | $31.50 |
| 2028 | $35.00 |
| 2029 | $38.25 |
| 2030 | $41.54 |
These projections assume AT&T executes on its 60 million+ fiber location target by 2030 and its double-digit EPS CAGR guidance holds. Upside or downside could come from EchoStar spectrum integration, copper decommissioning by 2029, or interest rate shifts affecting the $144 billion debt load.
The post Prediction: After a Record Quarter, Here’s Where AT&T Will End The Year appeared first on 24/7 Wall St..
]]>AT&T Chairman and CEO John Stankey appeared on a Wednesday, July 22, CNBC interview tied to the company’s Q2 earnings call to push back against the narrative that satellite operators like SpaceX’s Starlink pose an existential threat to legacy telecom carriers.
He believes that decades of terrestrial infrastructure investment, combined with a fiber-plus-wireless convergence strategy, have built a moat that a satellite entrant cannot economically replicate.
AT&T Beats Earnings as Fiber and Wireless Add 1 Million Accounts
AT&T (NYSE:T) delivered adjusted EPS of $0.65 against a $0.5871 consensus, a 10.71% beat and the company’s fifth consecutive quarterly earnings beat. Revenue reached $31.558 billion, up 2.3% year over year, slightly below the $31.81 billion estimate. Net income climbed 11.96% to $5.038 billion.
Stankey cited over a million new strategic accounts, the most in three years, alongside nearly 370,000 new fiber additions and 430,000 postpaid voice additions. Fixed wireless subscribers via AT&T Internet Air grew 77.4% year over year to 2.611 million connections, and consumer wireline broadband revenue rose 27.3% to $2.926 billion. Full-year guidance was reiterated at $2.25 to $2.35 adjusted EPS, with EBITDA and EPS lifted to the upper end of the range.
AT&T’s CEO Says Starlink Cannot Replicate Its Infrastructure Moat
On the product itself, Stankey said: “We have the best broadband product that’s out there that’s built on a foundation of fiber. Our wireless business gets stronger and stronger. We bolstered the performance of that business with some really important and strategic spectrum acquisitions.”
On Starlink’s positioning, he argued: “They’re coming to the game very late, after this industry has been established. They have to catch up with substantial amounts of infrastructure investment that’s been going on for decades inside hospitals, on university campuses, in stadiums, in tall buildings.” He added that AT&T “handles 98%+ of the traffic on a converged customer” already today, with partnerships expected to cover remaining edge cases by next year.
Rather than pursuing a wholesale Starlink deal, AT&T is co-buying satellite capacity through a JV consortium alongside T-Mobile and Verizon for coverage gaps. As Stankey framed it: “I don’t feel a need right now that I need to have a satellite partner as a main distribution vehicle for me, because I don’t think it addresses a part of the market that I can’t get to on my own.“
AT&T’s CEO Says Its Current Multiple Is Too Cheap
Stankey acknowledged the disconnect between operating momentum and share price: “I do believe our multiple right now is probably suppressed based on what this business is going to do and perform moving forward. When the cash shows up, eventually the valuation dynamic takes care of itself.“
The stock is up 55% over three years but down 16% over the past year. $T trades at a trailing P/E of 7 and a forward P/E of 9, with an EV/EBITDA of 5 and an average analyst price target of $29.03, slightly above the stock’s current price of $22.81.
AT&T is accelerating repurchases to approximately $10 billion in 2026, part of a $45+ billion capital return plan through 2028. Free cash flow is guided to $18 billion in 2026, $19 billion in 2027, and $21 billion in 2028. Fiber locations reached 38.6 million, targeting 40 million by year-end 2026 and 60 million by 2030.
Wall Street Still Sees Starlink and Cash Flow Risks
CEO Stankey’s confidence collides with skepticism from parts of the Street. Bernstein and Scotiabank have cut price targets citing Starlink competition, and TechStock² flagged that AT&T needs to generate $11.0 to $11.5 billion in free cash flow in the second half to hit guidance.
Jim Cramer has said he does not want to own AT&T or Verizon (NYSE:VZ) due to Starlink. Verizon is up 10.09% over the past year, having closed its Frontier fiber acquisition in January.
The next test will be whether AT&T can meet its second-half-of-the-year cash flow targets and convince investors that satellite competition does not threaten its long-term growth.
The post AT&T CEO Dismisses the Starlink Threat: “They’re Coming to the Game Very Late” appeared first on 24/7 Wall St..
]]>Vanguard High Dividend Yield ETF (NYSEARCA:VYM) has become one of the largest income vehicles in the market, with $94.6 billion in net assets per its most recent NPORT filing. VYM tracks the FTSE High Dividend Yield Index, screening large-cap U.S. stocks with above-average forecast yields and weighting them by market cap. With the 10-year Treasury near 4.62%, the question is whether VYM’s distribution stream still earns its equity risk premium. The short answer: mostly yes, with two holdings worth watching.
How VYM Generates Income
VYM owns roughly 550 U.S. stocks and passes through their cash dividends, minus a thin expense ratio. There are no options, leverage, or bond exposure, so the distribution is only as safe as the underlying payouts. The index rebalances annually, pruning dividend-cutters and adding higher-yielders, giving the fund self-cleaning ability but no immunity to a bad quarter.
Concentration is meaningful at the top. Broadcom alone sits at about 8% of assets, followed by JPMorgan near 3%, Exxon near 3%, and Johnson & Johnson near 2%. The next tier includes Caterpillar, AbbVie, Bank of America, Home Depot, Chevron, and Cisco. That top ten drives the majority of VYM’s cash yield.
The Blue-Chip Core Is Doing Its Job
Johnson & Johnson (NYSE:JNJ) raised its quarterly payout from $1.30 to $1.34 in Q2 2026, extending its Dividend King streak. With trailing EPS of $8.63 against an annualized dividend near $5.36, coverage is comfortable, and management raised full-year adjusted EPS guidance despite biosimilar erosion in Stelara. This dividend would survive a recession.
Procter & Gamble (NYSE:PG) lifted its quarterly dividend to $1.0885, marking another consecutive annual raise. Free cash flow of roughly $3 billion a quarter easily funds the payout, with $6.84 in diluted TTM EPS supporting $4.23 in dividends.
Coca-Cola (NYSE:KO) raised its dividend to $0.53 for 2026, a 63-plus-year streak. Q1 free cash flow jumped 131.9% year over year, and management guides to about $12.2 billion in 2026 FCF. This payout faces no realistic near-term risk.
AbbVie (NYSE:ABBV) is more interesting. Humira revenue fell 38.6% to $688 million last quarter, but Skyrizi and Rinvoq now generate a combined $6.6 billion per quarter with strong double-digit growth. Full-year adjusted EPS guidance was raised to $14.08 to $14.28, giving roughly 2x coverage on the $6.92 annualized dividend. The GAAP payout ratio looks stressed because of IPR&D charges, but the cash story is fine. (For investors thinking about high-yield warning signs elsewhere in their portfolios, our dividend traps briefing is worth a look.)
Two Positions Worth Watching
AT&T (NYSE:T) has held its quarterly dividend at $0.2775 for four consecutive years, and the stock is down about 18% over the past year. Management guides to $18 billion or more in 2026 FCF, but net debt/EBITDA at 2.71x remains above the 2.5x target. The dividend is safe. Dividend growth is not.
American Electric Power (NASDAQ:AEP) nudged its quarterly payout to $0.95, but the story is a $78 billion five-year capex plan and a $2.6 billion equity offering to fund it. Data-center load growth supports the plan, but dilution keeps per-share dividend growth in the low single digits.
Total Return and Verdict
VYM has delivered a 21.6% total return over the past year and 76.6% over five years, so investors have not sacrificed capital appreciation for yield. The distribution is well-supported: the top holdings are Dividend Kings with strong free cash flow, and even weaker names can cover their current payouts. The realistic risk is stagnant dividend growth from a few holdings. VYM makes sense for investors who want a diversified, low-fee income stream backed by real cash earnings. Yield-chasers looking for higher headline payouts should look elsewhere, because VYM is built for durability.
The post VYM’s $94.6 Billion Portfolio Beats Treasury Yields with Dividend Kings Leading the Way appeared first on 24/7 Wall St..
]]>Investors love dividend stocks because they provide dependable passive income streams and an excellent opportunity for solid total return. Total return includes interest, capital gains, dividends, and distributions realized over time. In other words, the total return on an investment or portfolio consists of income and stock appreciation. At 24/7 Wall St., we have focused on dividend stocks for over 15 years because, despite the stock market’s ups and downs, many people need reliable passive income streams to supplement their income from employment or other sources such as Social Security and pensions.
With the stock market on shaky ground, inflation roaring higher, and multiple worrisome geopolitical issues at play, no one wants to be the last one at the party should a 20% bear-market sell-off occur. Smart investors are already rotating out of artificial intelligence and data center memory trades into safer areas. We decided to screen our 24/7 Wall St. research database, looking for quality stocks trading at or near 52-week lows. We were not looking for tech burnouts that could surprise with a dead-cat bounce, but for quality large-cap stocks that, for various reasons, are trading at their lowest levels, in some cases for years. All are rated Buy by the top Wall Street firms we cover.
AT&T
AT&T (NYSE: T) is the world’s fourth-largest telecommunications company, measured by revenue. The legacy telecom has been undergoing a lengthy restructuring while maintaining a solid dividend of 5.42%. Twelve analysts have given the stock a Buy rating, indicating broad support from Wall Street.
AT&T recently hit a fresh 52-week low, making it one of the higher-yielding income plays for investors who are comfortable trading slower growth for dependable cash flow. Worries over competition from Starlink have weighed on the shares, but at current levels, it looks like a bargain.
The company provides a range of telecommunications, media, and technology services worldwide. Its Communications segment offers wireless voice and data communications services.
Through its company-owned stores, agents, and third-party retail stores, it sells:
- Handsets
- Wireless data cards
- Wireless computing devices
- Carrying cases
- Hands-free devices
AT&T also provides:
- Data
- Voice
- SecuT
- Cloud solutions
- Outsourcing
- Managed and provided professional services
- Customer premises equipment for multinational corporations, small and mid-sized businesses, and governmental and wholesale customers
Additionally, this segment provides residential customers with fiber broadband and legacy voice telephony services. It markets its communications services and products under:
- AT&T
- Cricket
- AT&T PREPAID
- AT&T Fiber
The company’s Latin America segment provides wireless services in Mexico and video services throughout the region. This segment markets its services and products under the AT&T and Unefon brands.
J.P. Morgan has a $33 price target for the stock.
General Mills
With products that never go out of style and a strong 6.49% dividend yield, this is a rebound story that will reward patient investors. General Mills (NYSE: GIS) is a global manufacturer and marketer of branded consumer foods, and trades at a cheap 10.4 times estimated 2026 earnings. Its segments include:
- North America Retail
- International
- North America Pet
- North America Foodservice
The North America Retail segment reflects business with a variety of grocery stores, mass merchandisers, membership stores, natural food chains, drug, dollar, and discount chains; convenience stores; and e-commerce grocery providers.
The International segment consists of retail and foodservice businesses outside the United States and Canada. Its product categories include super-premium ice cream and frozen desserts, meal kits, salty snacks, snack bars, dessert and baking mixes, and shelf-stable vegetables.
The North America Pet segment includes pet food products sold in the United States and Canada in national pet superstore chains, e-commerce retailers, and grocery stores.
The North America Foodservice segment product categories include ready-to-eat cereals, snacks, and baking mixes.
Piper Sandler has an Overweight rating and a $41 target price.
McDonald’s
McDonald’s (NYSE: MCD) is a solid pick whether the economy heads south or north, and it’s among the safest large-cap restaurant ideas. The legacy fast-food heavyweight is approaching the 50-year mark of dividend increases and is widely seen as a likely entrant to the Dividend Kings, given its consistent dividend growth and durable business model. And it pays a solid 2.59% dividend yield.
The company operates and franchises McDonald’s restaurants in the United States and internationally. Approximately 95% of McDonald’s roughly 13,500 U.S. restaurants are owned and operated by independent business owners. The company’s restaurants offer:
- Hamburgers and cheeseburgers
- Chicken sandwiches and nuggets
- Fries
- Salads
- Shakes
- Frozen desserts
- Sundaes
- Soft serve cones
- Bakery items
- Soft drinks
- Coffee
- Muffins
- Sausages
- Biscuit and bagel sandwiches
- Oatmeal
- Hash browns
- Breakfast burritos
- Hotcakes
Wells Fargo has an Overweight rating with a $320 target price for the shares.
PepsiCo
This top consumer staples stock reported solid second-quarter earnings and will continue to supply all the goods for summer picnics and parties. PepsiCo (NYSE: PEP) is a global food and beverage company with a solid 3.95% dividend yield. Activist investor Elliott Investment Management recently took a $4 billion stake in PepsiCo, revealing a strategy to unlock value within the company’s iconic brand by focusing on core strengths, such as innovation and brand marketing, rather than its capital-intensive bottling operations. This move caused PepsiCo’s stock to surge, with Elliott believing the company could see over 50% upside if its proposed strategic changes were implemented. However, these changes would involve a long-term transformation.
Its Frito-Lay North America segment offers:
- Lays and Ruffles potato chips
- Doritos, Tostitos, and Santitas tortilla chips
- Cheetos cheese-flavored snacks, branded dips
- Fritos corn chips
The company’s Quaker Foods North America segment provides:
- Quaker Oatmeal
- Grits
- Rice cakes
- Natural granola and oat squares
- Pearl Milling mixes and syrups
- Quaker Chewy granola bars
- Cap’n Crunch cereal
- Life cereal
- Rice-A-Roni side dishes
PepsiCo’s North America Beverages segment offers beverage concentrates, fountain syrups, and finished goods under these brands:
- Pepsi
- Gatorade
- Mountain Dew
- Diet Pepsi
- Aquafina
- Diet Mountain Dew
- Tropicana Pure Premium
- Sierra Mist
- Mug
Goldman Sachs has a Buy rating with a $183 target price.
Unilever
This is a great consumer staples company for more conservative accounts to consider. Unilever (NYSE: UL) is a fast-moving consumer goods company operating across Asia Pacific, Africa, the Americas, and Europe. Unilever is trading near its 52-week lows with an attractive valuation. It currently yields 3.65% and trades at a P/E of just over 19, making it a compelling income stock at its depressed price.
It operates through five segments:
- Beauty & Wellbeing
- Personal Care
- Home Care
- Foods
- Ice Cream
The Beauty & Wellbeing segment sells hair care products, such as shampoo, conditioner, and styling products; skin care products, including face, hand, and body moisturizers; and prestige beauty and health & wellbeing products, including vitamins, minerals, and supplements.
The Personal Care segment offers a range of skin-cleansing products, including soaps and shower gels, deodorants, and oral care products such as toothpaste, toothbrushes, and mouthwash. The Home Care segment sells fabric care products, including washing powders and liquids, rinse conditioners, and fabric enhancers, as well as home and hygiene products.
The Foods segment offers cooking aids and mini meals, including soups, bouillons, and seasonings, as well as condiments such as mayonnaise and ketchup, and food solutions. The Ice Cream segment offers a range of ice cream products, including both in-home and out-of-home options.
The company provides its products under these well-known brands:
- AXE
- Ben & Jerry’s
- Clear
- Cif
- Closeup
- Comfort
- Cornetto
- Dermalogica
- Domestos
- Dove
- Dove Men+Care
- Hellmann’s
- Horlicks
- Knorr
- LUX
- Lifebuoy
- Liquid I.V.
- Magnum
- Nutrafol
- OMO
- Pond’s
- Paula’s Choice
- Pepsodent
- Radiant
- Rexona
- Sunlight
- Sunsilk
- Surf
- TRESemmé
- Vaseline
- Wall’s
- Breyers
- Yasso
DZ Bank has a Strong Buy rating and a $70 target price.
The post Wall Street Is Sleeping on These 5 Quality Dividend Stocks: Grab Them Now Before It’s Too Late appeared first on 24/7 Wall St..
]]>Jim Cramer used his CNBC Mad Dash segment on Monday to warn viewers away from major telecom names after Bernstein published a research note tying valuation risk directly to SpaceX’s Starlink. “This is a Bernstein piece today. Cuts price target, T-Mobile, AT&T, Verizon, Comcast, Charter all because of Space Exploration,” Cramer said, framing the report as a sector-wide reset on how satellite broadband could reshape the competitive map.
The central debate is whether Starlink can expand beyond rural areas and become a serious broadband competitor in the suburbs. Longtime telecom analyst Craig Moffett argues the suburban leap will not happen. Bernstein cut price targets across the group anyway, and Cramer’s takeaway was blunt: “I don’t want to own AT&T or Verizon.”
AT&T’s Improving Business Cannot Shake the Starlink Threat
AT&T (NYSE:T) has borne the brunt of the sentiment shift. Shares are down 7.77% over the past month and 19.91% over the past year, with a market cap around $149.1 billion. That drawdown comes despite operational momentum.
AT&T reported Q1 2026 adjusted EPS of $0.57 on revenue of $31.51 billion, with 584,000 internet net adds and advanced home internet revenue up 27.3% to $2.80 billion after closing the Lumen Mass Markets fiber deal on February 2, 2026. CEO John Stankey framed the quarter as “our best first quarter ever for Advanced Connectivity internet customer net additions.”
Verizon’s Turnaround Is Colliding With a New Competitive Risk
Verizon (NYSE:VZ) shares slipped 8.78% in the past month, though the stock remains up 8.61% year to date. New CEO Dan Schulman delivered the first positive Q1 postpaid phone net adds since 2013, and the closed acquisition of Frontier pushed fiber connections up 41.9% year over year to roughly 10.8 million.
Comcast and Charter Have the Most to Lose From Starlink
Comcast (NASDAQ:CMCSA) is down 21.24% over the past year. Domestic broadband losses narrowed to 65,000 in Q1 2026 from 183,000 a year earlier, and wireless lines reached 9.7 million, with wireless revenue up 15.0%. Morgan Stanley recently initiated at Equal Weight, calling broadband competition a “structural overhang.”
Charter Communications (NASDAQ:CHTR) is the most exposed name in the group. Shares have fallen 67.45% over the past year and 37.37% year to date. Internet customer losses accelerated to 120,000 in Q1 2026 from 59,000 a year earlier, and Q1 EPS of $9.17 missed the $10.08 consensus. Charter carries roughly $94.3 billion in principal debt while spending toward a 2027 network evolution completion.
T-Mobile Is Both a Starlink Partner and a Potential Victim
T-Mobile US (NASDAQ:TMUS) sits in a strange spot on this note. The company already partners with SpaceX on direct-to-cell service, which implies Starlink won’t be a pure competitive threat. Shares are down 16.23% over the past year but rallied 5.68% last week. The stock closed at $188.41 on Monday, while analysts still carry a target price of $254.85 with 9 Strong Buys, 15 Buys, and no Sells. Q4 2025 EPS of $1.88 missed the $2.42 consensus, and 2026 core adjusted EBITDA guidance sits at $37.0 to $37.5 billion.
Key Takeaways
The Bernstein call rests on whether Starlink’s economics stay stuck in rural geographies, where cable and fiber are thin, or whether capacity permits meaningful suburban share gains. Moffett argues Starlink won’t expand meaningfully into the suburbs, while Cramer is worried about traditional telecoms.
Q2 earnings reports from AT&T and Verizon in late July will be a test of whether operational execution can outrun the satellite narrative.
The post Jim Cramer Warns “I Don’t Want to Own AT&T or Verizon” as Starlink Threatens Telecom Stocks appeared first on 24/7 Wall St..
]]>CNBC’s America’s Top States for Business 2026, the 20th edition of the annual study by Scott Cohn published July 9, 2026, scored all 50 states across 138 metrics in 10 weighted categories. For the first time in the study’s history, Ohio claimed the overall top spot. North Carolina finished second overall but ranked first in the all-important Economy category. Texas ranked second in Economy and fourth overall, held back by a 49th-place Quality of Life score. The sections below focus on the Economy sub-ranking, where the contest was effectively a two-state race.
Ohio Takes the Overall Crown
Ohio is a state, not a publicly traded company, but its ascent in the rankings is worth framing before diving into the economy leaders. Ohio climbed from fifth in 2025 to first in 2026, capping five straight years of improvement and a rise of 33 spots since 2010, when the Buckeye State ranked 34th. The win rested on two pillars: the best infrastructure score in the nation and the lowest cost of doing business among all 50 states. More than 143 million people live within a day’s drive of Ohio, a logistics advantage no other state can match. Ohio also holds a Triple-A bond rating from all three major credit agencies, a status it first achieved in 2023, reflecting a decade-plus of fiscal discipline.
Infrastructure displaced Economy as the top-weighted category in 2026, accounting for 17.6% of each state’s total score. CNBC also added ease of permitting as a brand-new metric this year, a direct response to corporate frustration with regulatory delays on data center and advanced manufacturing projects.
North Carolina: Best Economy in the Nation
North Carolina ranked first in the Economy category despite its legislature failing to pass a budget for more than a year. The state ran on its prior spending plan until Governor Josh Stein signed the new budget in early July 2026. The economic numbers underneath that political dysfunction are hard to argue with: 2025 GDP of $682.4 billion, up 2.7% from the prior year, a Moody’s Aaa credit rating, $5.26 billion in foreign direct investment in 2024, and a net gain of 84,100 residents in 2025, the most of any state in the country. The Tar Heel State has now finished first or second in CNBC’s overall rankings for six consecutive years, missing a repeat overall win in 2026 by just nine points out of a possible 2,500.
The corporate anchors are defensive and cash-generative. Bank of America (NYSE:BAC), Duke Energy, and Labcorp are all headquartered in Charlotte or the Research Triangle. The one visible soft spot is federal dependency: nearly 40% of state spending comes from federal funding, the 12th-highest exposure in the country. That reliance takes on added weight as Washington trims its budget footprint. North Carolina ranked 34th for Quality of Life and 35th for Cost of Living, a sign that the state’s economic success has pushed costs higher for everyday residents even as it continues drawing business investment.
Texas: The Economic Juggernaut With a Housing Problem
CNBC called Texas “an economic juggernaut year after year.” The state posted 2025 real GDP of $2.28 trillion, up 2.5% from 2024, and pulled in $22.1 billion in foreign direct investment during the same period, the largest haul of any top-10 state and roughly four times North Carolina’s total. Texas leads the nation in workforce quality, ranking first in that category, and second in both Economy and Access to Capital. The headquarters roster keeps growing: Oracle (NYSE:ORCL) in Austin, Tesla (NASDAQ:TSLA) at Gigafactory Texas, and AT&T (NYSE:T) in Dallas. On June 16, 2026, NVIDIA CEO Jensen Huang attended the groundbreaking of Coherent’s expanded semiconductor manufacturing campus in Sherman, Texas, as part of NVIDIA’s $2 billion investment partnership with the optical networking company, adding another marquee connection to the state’s growing industrial corridor.
The housing market tells a different story. Texas prices posted year-over-year declines for 12 consecutive months through mid-2026, according to the Texas Real Estate Research Center, as inventory climbed well above balanced-market norms and homes sat on the market for an average of 82 days. Austin and Dallas-Fort Worth have seen the sharpest corrections, though the Texas Real Estate Research Center characterizes the overall dynamic as normalization rather than distress. Tariff exposure adds another layer of risk: international goods trade equals 29.3% of Texas’s nominal GDP, the highest share among top-10 economy states, at roughly $850 billion still subject to contested duties. Quality of Life ranked 49th out of 50, which is the primary reason Texas finished fourth overall despite holding the second-ranked economy.
The Actual Top 10 Overall
The full CNBC overall rankings tell a story quite different from the economy sub-ranking. Virginia finished third overall, though federal budget and personnel cuts pushed its Economy score down to 23rd from 14th the year before. Minnesota rounded out the top five, earning fourth place in Quality of Life thanks to strong healthcare, worker protections, and inclusive state laws, even as its high taxes weighed on business-cost scores. Michigan came in sixth, Georgia seventh, Florida eighth, Tennessee ninth, and Indiana tenth. California, New York, and Washington all fell outside the top 10 in the overall study, even though California holds the nation’s largest GDP. The most improved state award went to Arkansas, which rose 13 spots to 28th overall.
What to Do With It
The macro backdrop is more supportive than a year ago. BofA Global Research’s December 2025 outlook projected US real GDP growth of 2.4% on a fourth-quarter-over-fourth-quarter basis for 2026, above consensus at the time of publication. A year earlier, more than half of the economists surveyed in the CNBC Fed Survey had predicted a recession that never materialized. The shift of Infrastructure to the top-weighted category in 2026 reflects corporate demand for power, water, and shovel-ready sites to support data centers and advanced manufacturing plants.
For businesses weighing a state, Texas remains the strongest pure economic case: a $2.28 trillion GDP, Aaa credit, no state income tax, and the most foreign investment of any state in the study. For real estate owners in Texas, the current buyer’s market and persistent price softness mark a meaningful shift from the prior decade’s pattern. For anyone considering relocation, North Carolina offers the top-ranked economy in the country, an Aaa credit rating, and the largest net in-migration of any state. Ohio’s first-ever overall win signals that infrastructure capacity and business-cost discipline, not just GDP size, are now the decisive variables in where companies choose to put down roots.
Editor’s note: This pass corrects the description of the NVIDIA-related Sherman, Texas groundbreaking: the facility belongs to Coherent, an optical semiconductor manufacturer, with Jensen Huang attending the June 16, 2026 ceremony as part of NVIDIA’s $2 billion investment partnership. Texas’s 2025 real GDP figure has been updated to $2.28 trillion per Bureau of Economic Analysis data, and Ohio’s Triple-A bond rating is noted as first achieved in 2023.
The post New Study Reveals Strongest State Economies, Only 1 State Was Better Than Texas appeared first on 24/7 Wall St..
]]>Shares of Vodafone Group (NASDAQ:VOD) are up 12.7% in Friday midday trading, changing hands near $14.74 after opening from a prior close of $13.08. The surge comes on confirmed news of a major shareholder change and marks the ADR’s sharpest single-day gain in months.
Niel Family’s Vega Takes 16.2% Stake From e&
The catalyst is a governance shake-up. French telecoms billionaire Xavier Niel, via his acquisition vehicle Vega, is buying Emirates Telecommunications Group’s (e&) entire 16.2% shareholding in Vodafone for £4.4 billion. The purchase makes Niel the largest shareholder in Vodafone, with Vega positioning the position as a long-term, strategic minority holding.
Vodafone confirmed the transaction in a same-day response, noting that the relationship agreement between Vodafone and e& has been terminated and that Hatem Dowidar has resigned from Vodafone’s Board of Directors. Niel has also signaled he intends to engage with the UK government and pointed to his track record as a minority investor in listed telecom operators. Sentiment across news coverage skewed bullish, with Proactive Investors carrying a bullish ticker sentiment score of 0.4 on VOD.
FY26 results filed May 12, 2026 showed organic service revenue growth of 5.4%, Adjusted EBITDAaL of $13.23 billion, and a 2.5% dividend increase. CEO Margherita Della Valle said Vodafone is now “a simpler company with a stronger growth outlook” after three years of restructuring, which frames why a strategic minority investor would step in at this level.
Peers Barely Move as VOD Trades on Its Own Story
Large-cap US telecom peers are trading mostly flat, reinforcing that today’s action is company-specific. T-Mobile US (NASDAQ:TMUS) is up 2% near $185.90, Verizon (NYSE:VZ) is essentially flat, up 0.17% at $42.31, and AT&T (NYSE:T) is up 0.5% at $21.15. All three peers are trailing VOD’s double-digit jump by a wide margin.
Zooming out, VOD had been under pressure heading into today. The stock was down 11% over the prior month and roughly flat year to date before Friday. It still trades below its 52-week high of $16.30, and the ADR carries a price-to-book ratio of 0.5 and a forward P/E of 29. A new anchor shareholder of Niel’s profile arriving after that pullback is why the stock is reacting so sharply. Options positioning had been light on downside, with a full-chain put/call ratio of 0.16, suggesting few traders were braced for a governance jolt in either direction.
What to Watch Next
Two forward events matter. Vodafone reports Q2 2026 results on July 27, 2026, before market open, giving investors their first look at how the VodafoneThree integration and Germany’s return to growth are tracking against FY27 guidance of €11.9 to €12.2 billion in Adjusted EBITDAaL. Before that, watch for any UK government commentary on Niel’s stated intention to engage, along with follow-through disclosures on board composition after Dowidar’s departure. The final FY26 dividend of $0.0275 per share is scheduled to pay July 30, 2026, a separate cash event that could keep holders engaged into month-end. I would keep an eye on whether VOD holds above the $14.78 50-day moving average into the close, since reclaiming that level would be the cleanest technical confirmation of today’s move.
The post Vodafone Group Spikes 13%: Here’s the Story appeared first on 24/7 Wall St..
]]>Income investors watching the calendar have a narrow window this week. Three of the market’s most widely held high-yield names are about to lock their next payment rosters, and the buy-by deadlines are close enough that a delayed brokerage order could push readers a full quarter down the line before the next check clears. The trio in focus, Verizon (NYSE:VZ), AT&T (NYSE:T), and Pfizer (NYSE:PFE), pair yields above the broad market average with coverage profiles that separate them from typical yield traps.
Here is the at-a-glance calendar, followed by a coverage read for each name using the metric that actually matters for its business model.
The Buy-By Calendar
| Stock | Ex-Dividend Date | Payment Date | Quarterly Dividend | Yield |
|---|---|---|---|---|
| Verizon (VZ) | July 10, 2026 | August 3, 2026 | $0.7075 | 6.57% |
| AT&T (T) | July 10, 2026 | August 3, 2026 | $0.2775 | 5.39% |
| Pfizer (PFE) | July 24, 2026 | September 1, 2026 | $0.43 | 7.07% |
To qualify for any of these payments, shares must be owned by the day BEFORE the ex-dividend date, which for Verizon and AT&T means settling a trade by the close on Thursday, July 9th, 2026. (That’s tomorrow.) Pfizer offers a longer runway, with a buy-by date roughly two weeks out (July 23rd).
Verizon: Free Cash Flow Doing The Heavy Lifting
Verizon trades at $42.82 with a market cap of $177.83 billion, and the stock has slipped 6.13% over the past month, pushing the yield toward the top of its historical range. The quarterly payment of $0.7075 was raised from $0.69 earlier this year, extending a streak that Wells Fargo recently flagged as 21 consecutive years of dividend increases.
For a capital-heavy telecom, free cash flow is the right coverage lens. Management is guiding to free cash flow of $21.5 billion or more in 2026 alongside $3.0 billion-plus in share repurchases, comfortably above dividend commitments. Q1 2026 adjusted EPS came in at $1.28, up 7.6% year over year, on revenue of $34.44 billion. Leverage is the offset: net debt-to-EBITDA sits at 2.6x following the Frontier acquisition that closed January 20, 2026. At a forward multiple of 8, the market is already pricing in that debt load.
AT&T: A Fixed Payout Backed By Rising Cash
AT&T shares last changed hands at $21.27, down 22.53% over the past year. The dividend has held at $0.2775 per quarter for eight consecutive quarters, and management has publicly committed to maintaining that payout through 2028.
Coverage here also runs through free cash flow. Guidance calls for $18 billion-plus in FCF against the dividend plus $8 billion in planned 2026 buybacks, part of a $45 billion-plus shareholder-return program through 2028. Q1 2026 adjusted EPS of $0.57 rose 11.8% year over year, and the company added 584,000 internet subscribers alongside 294,000 postpaid phone net adds. Net debt-to-EBITDA of 2.71x is elevated but trending in the right direction. Wall Street’s average price target sits at $30.24, well above the current quote.
Pfizer: Earnings Coverage With A Patent-Cliff Overhang
Pfizer offers the fattest headline yield of the three at 7.07%, with shares at $24.22 after a 7.57% monthly pullback. For a large-cap pharma, coverage is best measured against adjusted EPS rather than free cash flow, given the lumpiness of R&D and legal outflows. Full-year 2026 guidance of $2.80 to $3.00 in adjusted EPS against an annual dividend of $1.72 leaves the payout ratio in a workable range, even after the company paid $2.4 billion in dividends in Q1 alone.
Growth is coming from the newer portfolio. Padcev rose 39%, Nurtec ODT/Vydura climbed 41%, and the recently launched or acquired basket grew 22% operationally. The pushback is COVID-related revenue rolling off (Comirnaty down 59%, Paxlovid down 63%) plus a $1.5 billion loss-of-exclusivity headwind this year.
What To Watch Next
All three names carry institutional ownership above 69%, which typically muffles the mechanical price drop that follows an ex-dividend date. Verizon and AT&T both offer forward multiples in the single digits (8x and 9x respectively), a rare combination alongside yields north of 5%. Pfizer, at a forward multiple of 8, prices in the patent-cliff drag, so the coverage read matters more than the headline yield. The clock is the shorter-term variable: miss the buy-by deadline, and the next opportunity is roughly three months out.
The post 3 High-Yield Dividends That Pay You Soon (But You Must Act Quickly) appeared first on 24/7 Wall St..
]]>The S&P 500 keeps climbing, up nearly 9% year to date, and yet a handful of large-cap dividend payers are trading like the bull market forgot they exist. That is exactly where opportunity hides in July. If you have $1,000 to put to work, three NYSE-listed names stand out on valuation, cash flow, and payout durability. Each carries a forward earnings multiple well below the broader market, each throws off real income, and each has a specific catalyst that could re-rate the stock over the next 12 to 18 months.
The premise is simple. When investors crowd into AI and momentum, cash-generative businesses get orphaned. That is the setup here.
Pfizer (NYSE: PFE)
Pfizer (NYSE:PFE) is the cleanest “absurdly cheap” name on this list. Shares trade around $24 with a forward P/E of 8, roughly a third of the S&P 500’s multiple. The trailing dividend yield sits at 7.1%, backed by a 43-cent quarterly payout that has been paid consistently through 2026, with the next ex-dividend date on July 24, and payment on Sept. 1.
The bull case is that COVID revenue has already normalized and the growth engine is now new products. Q1 2026 revenue came in at $14.45 billion, up 5.4% year over year, with launched and acquired products growing 22% operationally. Padcev rose 39% and Nurtec ODT/Vydura jumped 41%. The Vyndamax patent settlement extending US exclusivity to June 2031 pushes out a major revenue cliff, and management reaffirmed FY2026 adjusted EPS guidance of $2.80 to $3.00. CEO Albert Bourla said Pfizer is “off to a strong start in 2026…positioned to lead” in oncology and obesity.
Risk: Legacy COVID franchises are still in free fall, with Comirnaty down 59% and Paxlovid down 63%, and management flagged a $1.5 billion loss-of-exclusivity headwind in 2026. Analysts still see upside, with a consensus target of $29.15.
CVS Health (NYSE: CVS)
CVS Health (NYSE:CVS) is a different kind of cheap: a turnaround that is already working, but that’s still priced like it isn’t. Shares changed hands at $104.81, up nearly 57% over the past year, yet the forward P/E is still only 14, well under the S&P 500. Against management’s raised FY2026 adjusted EPS guide of $7.30 to $7.50, that math looks fair even after the run.
Q1 2026 was the proof point. Revenue reached $100.43 billion, up 6.2% year over year, and adjusted EPS of $2.57 beat the $2.21 consensus by 16.47%. The Health Care Benefits segment, the one that scared investors two years ago, delivered adjusted operating income of $3.04B, up 52.6%, with the medical benefit ratio improving to 84.6% from 87.3%. Full-year revenue guidance was raised to at least $405B with operating cash flow of $9.5 billion or more. CEO David Joyner pointed to “strong execution across our enterprise”, serving nearly 185 million people.
Yield here is thinner at 2.54%, so this is more about earnings recovery than income. Risks include elevated medical cost trends, pharmacy reimbursement pressure, and the Omnicare Chapter 11 filing in September 2025. Still, 24 of 28 analysts rate CVS a Buy or a Strong Buy.

AT&T (NYSE: T)
AT&T (NYSE:T) is the pure income idea. At $21.24, the stock is down nearly 14% year to date, and that pullback has pushed the yield to 5.23% on the 27-cent quarterly payout that has held steady for at least eight consecutive quarters. The forward P/E of 9 is again a fraction of the market. The next ex-dividend date is July 10.
The story is convergence. Q1 2026 revenue was $31.51 billion, up 2.9%, with 584,000 internet net adds, the best first quarter ever, and 294,000 postpaid phone net adds at churn of 0.89%. Advanced home internet revenue climbed 27.3% to $2.80 billion. Management guided FY2026 adjusted EPS of $2.25 to $2.35, free cash flow of $18 billion or more, and committed to more than $45 billion in shareholder returns through 2028, including roughly $8 billion of buybacks in 2026. CEO John Stankey called it the “best first quarter ever for Advanced Connectivity internet customer net additions”.
Risk: The balance sheet. Total debt is $138.4 billion, and net leverage will rise toward 3.2x post-EchoStar. Reddit sentiment reflected the anxiety, with wallstreetbets activity turning bearish in late June (scores of 33–38) before neutralizing in early July. Analysts still see upside to $30.24.
The Setup for July
Three names, three flavors of cheap. Pfizer offers the highest yield and the biggest valuation gap. CVS offers the strongest earnings momentum against a still-modest multiple. AT&T offers durable free cash flow and a covered payout in a market that keeps paying up for growth. Split $1,000 across all three and you get income, optionality, and a starting valuation that requires very little to go right.
The post 3 Absurdly Cheap Dividend Stocks to Buy With $1,000 in July appeared first on 24/7 Wall St..
]]>Retirement portfolios need beaten-down stocks with a survival plan, not just a low price tag. Before ranking three names, it helps to draw a sharp line between two conditions that are often confused.
Oversold is a technical condition. It means a stock has been sold hard and fast, its Relative Strength Index (RSI) is pinned below 40, and it trades near the low end of its recent range. Undervalued is a fundamental condition. The share price reflects a reasonable estimate of intrinsic worth, often shown in a low forward price-to-earnings ratio and analyst targets meaningfully above the current quote. The best retirement-fit setups live in the overlap. They are stocks that are both oversold and undervalued, backed by durable cash flow and (ideally) a dependable dividend.
All three names below meet that overlap test. Here we rank them by suitability for a retirement portfolio, weighting income durability, valuation discipline, and volatility. These three span software, consumer staples, and telecom. (Also check out three other stocks in the retirement portfolio sweet spot.)
3. Adobe (The Growth Wildcard)
Adobe (NASDAQ:ADBE) is the spiciest pick here. Shares have fallen 41.2% over the past year and 36.7% year to date, with the weekly RSI at 36.22. That checks the oversold box. On valuation, Adobe trades at a forward P/E of 9x, with a PEG ratio of 0.6. Its $272.48 consensus analyst target is well above the recent price of $221.54.
Operationally, Adobe is compounding. Q2 FY2026 delivered record revenue of $6.62 billion, up 13% year over year, non-GAAP EPS of $5.96 (a fifth consecutive beat), and AI-first ARR that tripled to more than $500 million. The catch for retirees: Adobe pays no dividend and carries a beta of 1.43. Great business, wrong risk profile for income-first portfolios, hence the third-place finish.


2. General Mills (Defensive Income Play)
General Mills (NYSE:GIS) is the textbook defensive name. The stock is down 28.4% over the past year, and touched an RSI low of 22.52 on May 15, 2026, with the most recent weekly reading at 46.40. Valuation is friendly: a forward P/E of 12x, a dividend yield of 6.49%, and a near-zero beta of −0.05.
Fundamentals are stabilizing. Fiscal Q4 2026 delivered revenue of $4.61 billion, up 1.2%, and adjusted EPS of $0.95 versus a $0.82 estimate, a 15.85% beat. Management guided FY2027 adjusted EPS to $3.00 to $3.20 and is targeting $3 billion in cumulative cost savings by FY2030. The $0.61 quarterly dividend was just declared. A low beta plus a 6.6% yield makes this a strong retirement fit, though category weakness and prior Pet-segment impairments keep it just shy of the top spot.
Income investors may also want to review the free 24/7 Wall St. report Dividend Traps as a due-diligence checklist.
1. AT&T (The Sweet-Spot Winner)
AT&T (NYSE:T) hits every box on the retirement checklist. Shares are down 25.8% over the past year and 15.1% year to date, with a weekly RSI of 35.17. That is textbook oversold. Valuation is genuinely cheap: a trailing P/E of 7x, a forward P/E of 9x, a dividend yield of 5.3%, and an analyst target of $30.02 against a recent quote of $21.09. A beta of 0.42 keeps portfolio drawdowns contained.
The operating story is quietly accelerating. Q1 2026 revenue was $31.51 billion, up 2.9%, and adjusted EPS came in at $0.57, up 11.8%. The company added 584,000 net internet subscribers with churn of 0.89%. Management reaffirmed FY2026 adjusted EPS of $2.25 to $2.35 and free cash flow of over $18 billion, with $8 billion in buybacks planned and the $0.2775 quarterly dividend. That combination of income durability, a cheap forward multiple, low beta, and improving fiber-plus-5G economics is exactly what a retirement investor wants from a beaten-down stock.
Tying It Back Together
The overlap of oversold and undervalued is where retirement capital does its best work, provided the business behind the discount is durable. Adobe is oversold and cheap, but the missing dividend and higher beta push it down the list. General Mills brings a fortress-grade yield and near-zero beta, ideal for capital preservation. AT&T carries the cleanest mix of technical washout, single-digit forward earnings multiple, committed dividend, and improving free cash flow. This makes it the top pick for retirement portfolios today. Size positions to your own income needs and time horizon.
The post Where Oversold Meets Undervalued: 3 Dividend and Growth Plays for Income Investors appeared first on 24/7 Wall St..
]]>All the major Wall Street firms we cover here at 24/7 Wall St. have a list of the top stock picks for their institutional and retail clients to invest in. Typically, these are companies that analysts have a high level of conviction in and feel strongly about their fundamentals and forward-looking prospects. In addition, they often have strong upside to the assigned price target and are assigned a Buy or Overweight rating, depending on the company providing the coverage. After a furious rally off the February lows and with all major indices trading at or near all-time highs, many investors are treading carefully as we start the third quarter of 2026. With earnings season right around the corner, we were very interested to see which stocks were on the July edition of J.P. Morgan’s Analyst Focus List. All will provide investors with steady passive income and have the potential to deliver solid total returns.
The research team at J.P. Morgan updates its U.S. Analyst Focus List monthly, as the company describes:
The U.S. Analyst Focus List is updated monthly. Names may be removed mid-month when a valuation target has been largely or wholly achieved, or the original rationale is no longer valid. New ideas can also be added mid-month. Analysts will publish the explanation for all mid-month changes in a research note.
We screened the July Analyst Focus List, and to our surprise, one of our favorite dividend stocks was added this month. We cover the new addition and found four more companies on the list that pay dependable dividends, and in some cases, big ones.
Why do we recommend J.P. Morgan’s Analyst Focus List stocks?
J.P. Morgan is one of the acknowledged leaders in the investment landscape on Wall Street and worldwide. The firm’s top-notch research department continues to provide institutional and high-net-worth clients with the best ideas across the investment spectrum and is likely to do so for years to come.
EPR Properties
This real estate investment trust (REIT) invests in some of the most popular entertainment companies and is the newest addition to the J.P. Morgan Equity Analysts Focus List. EPR Properties (NYSE: EPR) is a leading experiential net-lease real estate investment trust specializing in select enduring experiential properties and pays a 6.02% dividend. EPR recently increased its monthly dividend by 5.1% and expects FFO per share growth of more than 5% in 2026, supporting continued dividend increases. After suspending its dividend during COVID, it has recovered with five consecutive years of increases. Its $6.9 billion property portfolio generates solid cash flow, and the monthly dividend of $0.31 per share is well-covered by funds from operations.
J.P. Morgan gave this brief reason for adding the shares: “High dividend yield >6% that we see as safe and growing, with earnings growth likely to be toward the top of the net-lease REIT peer group.”
The company operates through two segments. The Experiential segment consists of approximately:
- 148 theater properties
- 59 eat and play properties
- 25 attraction properties
- 11 ski properties
- Four experiential lodging properties
- One gaming property
- One cultural property
- 22 fitness and wellness properties
The Education segment comprises 46 early childhood education centers and nine private schools.
EPR Properties’ investment portfolio includes ownership of and long-term mortgages on experiential and educational properties. The company has investments in approximately 44 states. All the company’s owned single-tenant properties are leased on long-term, triple-net terms.
The J.P. Morgan price target is $62.
And More
Here are four additional companies on the list that are steady dividend-paying stocks trading at reasonable valuations.
Annaly Capital
With a massive 1240% dividend yield and trading right near the J.P. Morgan target price, Annaly Capital Management (NYSE: NLY) is a total passive-income play. The company is a diversified capital manager with investment strategies across the mortgage finance sector.
It owns a portfolio of real estate-related investments, including:
- Mortgage pass-through certificates
- Collateralized mortgage obligations
- Credit risk transfer (CRT) securities
- Securities representing interests in or obligations backed by pools of mortgage loans, residential mortgage loans, and mortgage servicing rights
Its investment groups include:
- Annaly Agency Group, which invests in agency mortgage-backed securities collateralized by residential mortgages.
- Annaly Residential Credit Group invests in non-agency residential mortgage assets within residential and commercial markets.
- Annaly Mortgage Servicing Rights Group invests in MSR, which grants the right to service residential mortgage loans in exchange for a portion of the interest payments on those loans.
The $24 J.P. Morgan price target is likely to go higher.
AT&T
AT&T (NYSE: T) is the world’s fourth-largest telecommunications company, measured by revenue. The legacy telecommunications company has undergone a lengthy restructuring process while maintaining a solid dividend yield of 5.42%. Thirteen analysts have given the stock a Buy rating, reflecting broad Wall Street support. AT&T provides a range of telecommunications, media, and technology services worldwide. Its Communications segment offers wireless voice and data communications services.
AT&T sells through its company-owned stores, agents, and third-party retail stores:
- Handsets
- Wireless data cards
- Wireless computing devices
- Carrying cases
- Hands-free devices
AT&T also provides:
- Data
- Voice
- SecuT
- Cloud solutions
- Outsourcing
- Managed and provided professional services
- Customer premises equipment for multinational corporations, small and mid-sized businesses, and governmental and wholesale customers
Additionally, this segment provides residential customers with fiber broadband and legacy voice telephony services.
It markets its communications services and products under:
- AT&T
- Cricket
- AT&T Prepaid
- AT&T Fiber
The company’s Latin America segment provides wireless services in Mexico and video services throughout the region. This segment markets its services and products under the AT&T and Unefon brands.
J.P. Morgan has a $34 price target for the stock.
First Industrial Realty Trust
While off most people’s radar, this REIT pays a solid 2.94% dividend and offers decent upside to J.P. Morgan’s target. First Industrial Realty Trust (NYSE: FR) is a self-administered and fully integrated real estate company. The company is an owner, operator, developer, and acquirer of logistics properties. Through its fully integrated operating and investing platform, it provides facilities and customer service to multinational corporations and regional firms that are essential for their supply chains.
In total, the company owns and has under development approximately 71.6 million square feet of industrial space concentrated in 15 target MSAs. Its tenants are engaged in a variety of businesses, including:
- E-commerce
- Third-party logistics and transportation
- Consumer and other manufactured products
- Retail and consumer services
- Food and beverage
- Lumber and building materials
- Wholesale goods
- Health services
- Governmental and other
Through a wholly owned taxable REIT subsidiary of the operating partnership, the operating partnership owns an equity interest in a joint venture. The company also provides various services to the joint venture.
The J.P. Morgan target price is $70.
Kontoor Brands
While another off-the-radar stock, Kontoor Brands (NYSE: KTB), has tremendous upside and well-known brands, it pays a reasonable 2.47% dividend. The global lifestyle apparel company designs, manufactures, procures, sells, and licenses apparel, footwear, and accessories. Its lifestyle, outdoor, and workwear brands include Wrangler, Lee, and Helly Hansen.
The Wrangler brand offers multiple sub-brands, collections, and product lines within the Wrangler brand to target specific consumer demographics and consumer end-users, including:
- 20X
- Aura from the Women at Wrangler
- Cowboy Cut
- Premium Patch
- Riggs Workwear
- Rock 47
- Rustler
- Wrangler Retro
- Wrangler Rugged Wear
- Wrangler All Terrain Gear
The Lee segment offers denim, apparel, footwear, and accessories for adults and children. The Lee brand offers multiple sub-brands, collections, and product lines, including:
- Lee101
- Riders
- Storm Rider
- Lee MVP
- Lee X
The Helly Hansen brand is an outdoor and workwear brand. Sub-brands include Helly Hansen Sport and Helly Hansen Workwear.
J.P. Morgan has set a price target of $90.
The post JP Morgan Adds One of Our Favorite Dividend Stocks to the July US Equity Analyst Focus List appeared first on 24/7 Wall St..
]]>AT&T (NYSE:T) and Verizon (NYSE:VZ) both closed transformative fiber acquisitions early this year and just delivered Q1 2026 results that show two telecom giants racing toward the same convergence prize from very different starting points.
AT&T is running an established playbook. Verizon is executing a turnaround under a brand new CEO. The quarter makes their choices unusually easy to compare.
Fiber Momentum Carries One. A Turnaround Story Carries the Other.
AT&T posted $31.51 billion in revenue and adjusted EPS of $0.57, with consumer wireline broadband revenue jumping 27.3% to $2.80 billion after closing the Lumen Mass Markets fiber deal on February 2, 2026.
John Stankey told investors AT&T saw “our best first quarter ever for Advanced Connectivity internet customer net additions.” The numbers back him up: 584,000 internet net adds and 294,000 postpaid phone adds at a tight 0.89% churn. That is a well-oiled machine.
Verizon looks different. New CEO Dan Schulman inherited a franchise losing share, and Q1 delivered the first positive Q1 postpaid phone net adds since 2013, a swing of over 340,000 year over year. Revenue reached $34.44 billion with adjusted EPS of $1.28.
Fiber broadband connections climbed 41.9% to roughly 10.8 million after the Frontier deal closed January 20, 2026. Schulman called it a “turnaround” that is “gaining momentum.” A January network outage still cost 80 basis points of wireless service revenue growth, so this is momentum with scars.
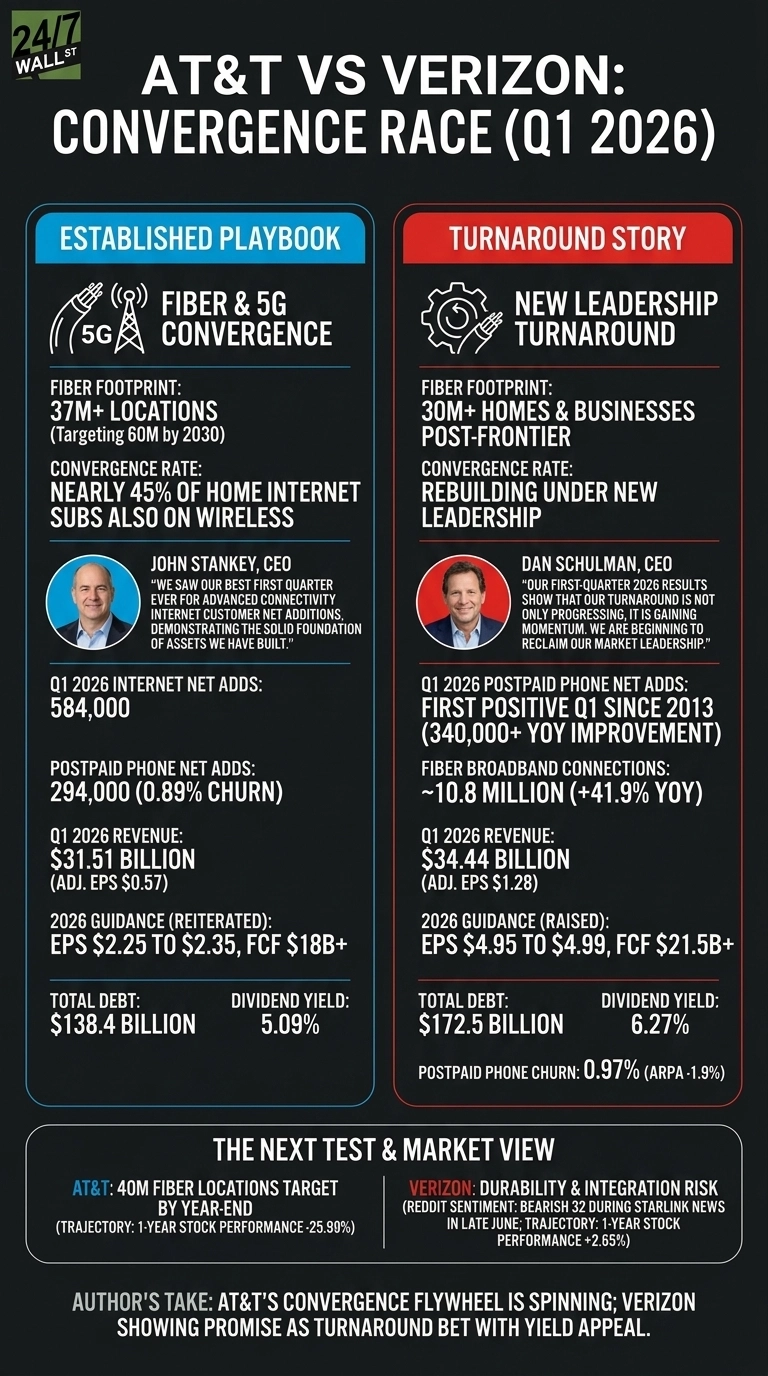
Convergence Leader vs Turnaround Bet
| Lens | AT&T | Verizon |
| Fiber footprint | 37M+ locations, targeting 60M by 2030 | 30M+ homes and businesses post-Frontier |
| Convergence rate | Nearly 45% of home internet subs also on wireless | Rebuilding under new leadership |
| 2026 guidance | Reiterated: EPS $2.25 to $2.35, FCF $18B+ | Raised: EPS $4.95 to $4.99, FCF $21.5B+ |
| Total debt | $138.4B | $172.5B |
| Dividend yield | 5.09% | 6.27% |
Stankey is doubling down on bundling fiber and 5G through the AT&T Guarantee. Schulman is stripping friction, cutting SG&A by 3.1%, and pushing business EBITDA margins to 26.5% from 23.1%.
Verizon still carries higher leverage and softer wireless economics: postpaid phone churn rose to 0.97% and ARPA slipped 1.9%.
The Next Test Is Whether Verizon Can Hold Its Gains
I will be watching whether AT&T hits its 40 million fiber locations target by year-end while keeping churn under one point. For Verizon, the question is durability.
One clean quarter of phone adds is not a trend, and the Starlink mobile narrative already spooked retail traders, dragging Reddit sentiment to a bearish 32 in late June. You should also keep an eye on integration costs from Frontier and whether Verizon repays that debt on schedule.
Why I Lean Toward AT&T Today, With a Caveat
Personally, I find AT&T’s story easier to trust right now. The convergence flywheel is already spinning, the fiber lead is real, and shares trade at just 7x trailing earnings after falling 25.99% over the past year.
For yield-focused investors, Verizon’s 6.27% dividend and raised guidance frame it as the turnaround story to watch, especially if Schulman keeps delivering. If input costs, Starlink pressure, or another outage rattle the group, I would rather own the operator already executing than the one still proving it can.
The post AT&T vs Verizon: The Better Dividend Stock For 2026 appeared first on 24/7 Wall St..
]]>When a former Dividend Aristocrat slashes its payout, the market’s memory is long. But four years on, AT&T (NYSE:T) has built a cash flow machine that, in my view, makes its current distribution one of the safer high yields in the large-cap universe. With shares trading at a sub-8x forward earnings multiple and a yield approaching 5%, the question for retirees is simple: can this $1.11 payout hold?
The Dividend at a Glance
| Metric | Value |
|---|---|
| Annual Dividend | $1.11 per share |
| Dividend Yield | 4.95% |
| Consecutive Years of Increases | 0 (since 2022 reset) |
| Quarterly Rate Stability | 16+ consecutive quarters at $0.2775 |
| Aristocrat/King Status | No (lost in 2022) |
Cash Flow Covers the Dividend Nearly 2.4 Times Over
AT&T generated $19.4 billion in free cash flow during FY 2025 against just $8.18 billion in common dividends. With trailing EPS of $2.97 against the $1.11 payout, only about 37% of profits go out the door.
| Metric | Value | Assessment |
|---|---|---|
| Earnings Payout Ratio | 37% | Healthy |
| FCF Payout Ratio | 42% | Healthy |
| Operating Cash Flow Coverage | 4.9x | Strong |
Management has guided $18 billion-plus in free cash flow for 2026, leaving ample cushion even with $8 billion in planned buybacks.
Debt Is Heavy, but Leverage Is Manageable
| Metric | Value | Assessment |
|---|---|---|
| Total Debt | $138.4B | Elevated |
| Debt-to-Equity | 1.10x | Moderate |
| Net Debt-to-EBITDA | 2.71x | Manageable |
| Cash on Hand | $12B | Solid buffer |
Leverage will tick up to roughly 3.2x after the EchoStar spectrum deal closes, then drift back toward 2.5x within three years. That trajectory protects the dividend.
The Track Record: Still Haunted by 2022
AT&T cut its quarterly payout from $0.52 to $0.2775 in early 2022 after the WarnerMedia spin to Discovery, ending a 35-plus year streak of increases. The current rate has held flat for 16 straight quarters. No growth, but no further cuts.
What Stankey Is Telling Shareholders
CEO John Stankey on the Q1 2026 call: “We returned $4.3 billion to shareholders in the first quarter through dividends and share repurchases. We continue to expect to repurchase stock this year and to maintain a consistent pace of buybacks through 2028 as we execute against our plans to return $45 billion plus to shareholders over this time period.”
That language tells me the $1.11 floor is secure, with buybacks serving as the flex variable.
The Verdict: This Dividend Is Safe
Dividend Safety Rating: Safe. A 42% FCF payout ratio, a 0.395 beta, and predictable wireless subscription cash flows give this distribution a wide margin of safety. I’d be comfortable owning AT&T for income if you believe the fiber buildout pays off and net leverage drifts back below 2.7x by 2027. I’d be cautious if integration costs from Lumen and EchoStar push capex higher than guided and FCF dips below $17 billion. On balance, the math works. For retirees seeking a near-5% yield from a defensive cash generator, this one clears the bar.
The post This Cash-Rich Telecom Anchor Is an Unbeatable Haven for Retirees appeared first on 24/7 Wall St..
]]>Volatility can lower the cost of entry into businesses that throw off real cash, even as investors recognize that a low share price alone is no guarantee of a bargain. Heading into the back half of 2026, three blue-chip names trading well below the $45 mark stand out for the same reason: predictable cash flows, defensive betas, and dividend yields that make Treasury bills look pedestrian. For retail investors scanning headlines and watching their screens flicker red and green, these are the kinds of stocks worth pulling up a chair for.
With that in mind, here are three stocks trading under $45 that combine cheap valuations, durable income, and entrenched competitive moats heading into a choppier market.
Pfizer (NYSE: PFE)
Pfizer (NYSE:PFE) is the global pharmaceutical giant behind blockbusters across oncology, vaccines, primary care, and specialty medicines. At a recent $24.29, well under the $45 ceiling, the stock sits roughly mid-range of its 52-week band of $21.97 to $28.28, giving income-focused buyers an accessible entry into a mega-cap dividend payer.
The fundamentals make the case. Pfizer trades at a trailing P/E of 19 and a forward P/E of 8, with a dividend yield of 7.27% backed by a quarterly payout of $0.43 that has been raised every year for more than a decade. Wall Street’s average price target of $29.15 implies meaningful upside from current levels, with 11 buy or strong buy ratings against 15 holds and three sell-side bears. Q1 2026 results showed revenue of $14.45 billion, up 5.4% year over year, and adjusted EPS of $0.75, marking a fifth consecutive earnings beat.
The bull case rests on three pillars. First, the Vyndamax patent settlement extends U.S. exclusivity to June 2031, defusing the loudest patent cliff fears. Second, launched and acquired products grew 22% operationally in Q1, led by Padcev (+39%), Nurtec ODT (+41%), and Abrysvo (+37%). Third, CEO Albert Bourla pointed to roughly 20 pivotal study starts planned for 2026, including 10 obesity assets from the Metsera acquisition, saying the company is “particularly encouraged by what we’re seeing in oncology and obesity.”
The risk worth respecting is COVID-related revenue erosion, with Comirnaty down 59% and Paxlovid off 62%, plus a $1.5 billion loss-of-exclusivity headwind baked into 2026. Even Jim Cramer recently quipped on Mad Money that with Pfizer, “you’re just buying on that dividend yield.” For value and income investors, that may be exactly the point.
AT&T (NYSE: T)
AT&T (NYSE:T) is the converged fiber and 5G wireless operator quietly executing one of the cleaner turnaround stories in large-cap telecom. Shares recently traded at $22.72, down 6.5% year to date, which has compressed the valuation to a level rarely seen in dominant U.S. infrastructure plays.
On the numbers, AT&T trades at a trailing P/E of 8 and a forward P/E of 10, with a dividend yield of 4.95% on a $0.2775 quarterly payout that has held steady since 2022. Analysts carry an average price target of $30.25 with 15 buy or strong buy ratings, 10 holds, and zero sell ratings. Q1 2026 brought revenue of $31.51 billion (+2.9% YoY) and adjusted EPS of $0.57, up 11.8% YoY, including the best Q1 ever for Advanced Connectivity internet net adds at 584,000.
The bull case is operational momentum colliding with capital returns. CEO John Stankey called out the “best first quarter ever for Advanced Connectivity internet customer net additions.” The closed Lumen Mass Markets fiber acquisition on February 2, 2026 pushed reach to 37 million-plus fiber locations, with a target of 60 million by 2030. Management reiterated free cash flow of $18 billion-plus in 2026, $19 billion-plus in 2027, and $21 billion-plus in 2028, and committed to $45 billion-plus in shareholder returns from 2026 through 2028, including roughly $8 billion in buybacks this year.
The risk: leverage. Net debt-to-EBITDA sits at 2.71x and rises toward 3.2x post-EchoStar and Lumen, and legacy wireline revenue is still declining 20%+. Reddit sentiment recently flipped, with r/wallstreetbets discussion turning bearish at scores of 33 to 38 on June 26-27 after running bullish earlier in the month on a congressional trade signal flagged on r/stockmarket. For investors who can stomach the leverage, the fiber flywheel and capital returns make the math interesting.
Kinder Morgan (NYSE: KMI)
Kinder Morgan (NYSE:KMI) operates one of the largest natural gas pipeline, products pipeline, terminal, and CO2 networks in North America. Shares recently changed hands at $33.19, up 25.37% year to date and 143.8% over the past five years, but still comfortably under the $45 ceiling and within reach of retail-sized positions.
The setup is rare in midstream: real growth tied to secular demand. KMI trades at a trailing P/E of 22 and a forward P/E of 24, with a dividend yield of 3.56% on a $1.19 annualized payout (+2% YoY). Q1 2026 revenue rose to $4.83 billion (+13.5% YoY), adjusted EPS came in at $0.48 versus the $0.39 estimate, a 22.11% beat, and adjusted EBITDA expanded 18% to $2.54 billion. Wall Street’s average price target of $35.33 and 11 buy ratings to 12 holds and zero sells reflect the durability of the cash flow.
The bull case is direct exposure to two of the most-watched demand curves on the planet: LNG exports and U.S. data center power. Management noted long-term contracts to move 8 Bcf/d to LNG facilities today, growing to 12 Bcf/d by end of 2028, with roughly 70% of future data center power demand sitting in KMI-served states. The project backlog stands at $10.1 billion, with about 92% in natural gas, and Moody’s recently upgraded KMI to Baa1, putting all three agencies at BBB+. CEO Kim Dang attributed Q1 to “record-setting performance in our Natural Gas Pipelines business segment.”
The risk worth tracking is commodity and policy exposure: refined products volumes fell 2% and crude/condensate dropped 12%, and tariff or permitting timing can move the needle on the backlog. But with leverage at a manageable 3.6x net debt-to-EBITDA and natural gas demand projected to grow 17% through 2030, KMI looks like the cleanest pure-play infrastructure beneficiary on the list.
The Bottom Line
A share price under $45 does not, on its own, make a stock cheap or safe. What earns these three names a spot on a watch list right now is the combination of betas well below 1.0, durable dividend streams, and entrenched moats that historically hold up when the broader market gets choppy. Before adding any of them to a portfolio, readers should weigh their own time horizon, income needs, and tolerance for sector-specific risk, and do their own research on how each business fits the rest of their holdings.
The post 3 Dirt-Cheap Stocks Under $45 Built to Outperform in a Volatile Market appeared first on 24/7 Wall St..
]]>About $85,000 a year is what a comfortable middle-class retirement costs in most U.S. metros after Social Security benefits fill part of the gap. It is also close to the median household income in the country. For investors who think in terms of replacing a paycheck through dividends, the question is simple: How much capital does it take, and which stocks get you there?
The engine is one equation. Income target divided by yield equals capital required. Run it at three yield levels and the tradeoffs reveal themselves.
The Conservative Tier: 3% to 4% Yield
At a 3% blended yield, $85,000 in annual income requires roughly $2.83 million in capital. At 3.5%, the number drops to about $2.43 million. At 4%, around $2.13 million. This is the largest check, and for good reason. You are buying dividend growth on top of dividend size.
Coca-Cola (NYSE:KO) anchors this tier. The current yield sits at 3%, just below the band, but the trajectory is the story. The quarterly dividend has stepped from $0.485 in 2024 to $0.51 in 2025 to $0.53 in 2026, extending a streak that already covers 63 consecutive years of annual increases. Q1 2026 revenue grew 12% year over year, and the company expects comparable EPS growth of 8% to 9% for the full year. KO trades at a 25 trailing P/E with a beta of 0.35, which is the textbook sleep-at-night profile.
Other names that round out this tier carry similar profiles: long histories of annual raises, durable cash generation, modest payout ratios. The portfolio compounds. The check is bigger up front because the math demands it.
The Moderate Tier: 5% to 7% Yield
At 6%, $85,000 requires about $1.42 million. At 7%, roughly $1.21 million. The capital requirement drops sharply, and three of our four named stocks live here.
AT&T (NYSE:T) yields 5% at a current price of $20.82. The quarterly payout has been frozen at 27 cents since the WarnerMedia spinoff reset in 2022, and management has guided to holding that $1.11 annualized rate through 2028. Free cash flow is expected to scale from $18 billion in 2026 to $21 billion by 2028, but the dividend itself is not moving.
Enterprise Products Partners (NYSE:EPD) yields 6% and has raised its distribution for 27 consecutive years. Q1 2026 adjusted EBITDA grew 10%. Important caveat: EPD is a limited partnership, so investors receive a Schedule K-1 instead of a 1099, which complicates tax filing and creates state-level filing obligations.
Realty Income (NYSE:O), the monthly dividend REIT, yields 5%. The June 2026 monthly distribution was 27 cents, extending a streak of 670 consecutive monthly dividends and 114 consecutive quarterly increases. REIT distributions are generally taxed as ordinary income rather than qualified dividends, which matters in taxable accounts.
The Aggressive Tier: 8% to 14% Yield
At 10%, $85,000 requires $850,000. At 12%, about $708,333. The capital math looks attractive. The risk profile does the talking.
This tier is populated by business development companies, mortgage REITs and high-yield energy names. The categories carry elevated balance sheet leverage, sensitivity to short-term rates, and a history of cuts during cycles. Stock prices in these names often erode while the headline yield stays advertised. The investor is choosing current income over total return and over inflation protection.
The Insight Most Retirees Get Wrong
Compare the two paths. KO has raised its dividend every year through multiple recessions, with the quarterly rate climbing from $0.485 to $0.53 in three years. T’s payout has been static since 2022, and the prior cut took the dividend from 52 cents to 27 cents per quarter, which equates to a roughly 47% reduction. Over a 20-year retirement, a steady grower will likely overtake a frozen high-yielder on income, with the principal still intact. The high yield looks larger on day one. The compounding grower looks larger on day 3,000.
The price tape reinforces it. KO is up more than 15% over the past year. T is down more than 28% in the same window. Yield without growth is just a number; growth is what makes it a strategy.
What to Do
- Pull the current yield on every name before sizing a position. Yields move with price, and the same ticker can shift tiers in a single quarter.
- Model a 25% dividend cut from your single highest-yielding holding and check what that does to monthly income. If the answer is uncomfortable, your concentration is the problem.
- If retirement is within five years, stress-test the aggressive tier against the last two cut cycles in BDCs and mortgage REITs. The yield on the screen can diverge meaningfully from the yield you actually receive.
The post This Dividend Strategy Generates $85,000 a Year for Retirees appeared first on 24/7 Wall St..
]]>U.S. telecom and media giants are moving in opposite directions in midday trading. Comcast (NASDAQ:CMCSA) stock is up 7% to $24.76, while AT&T (NYSE:T) stock is down 5% to $21.52, and Verizon (NYSE:VZ) stock is down 7% to $43.29.
The split reflects three distinct catalysts hitting the sector at once. Comcast is rallying on a corporate breakup plan, AT&T faces a CFO transition plus satellite-broadband downgrade pressure, and Verizon is being removed from the Dow Jones Industrial Average.
Comcast Splits Into Two Companies
Comcast announced Monday that it intends to split into two standalone public companies, separating media from its technology and connectivity business through a tax-free spin-off of NBCUniversal and Sky. The separation is expected to take approximately one year, with current holders receiving stakes in both entities.
Co-CEO Mike Cavanagh will become CEO of NBCUniversal, former CFO Michael Angelakis will become CEO of Comcast, and Brian Roberts remains chairman over both. Cavanagh stated that NBCUniversal with Sky will have “the scale, brands, content and financial resources to compete as a premier global media and entertainment company.”
The move follows a brutal stretch for Comcast stock, which was down 22% over the past 12 months heading into today. Shares trade at a trailing P/E ratio of 5x with an analyst target price of $32.36. Reddit chatter on r/stocks tagged the breakup as “The Bull Catalyst the Sleeping Giant Has Been Waiting For.”
AT&T Hit by CFO Exit and Starlink Downgrade
AT&T disclosed that CFO Pascal Desroches will retire, effective December 31. Jennifer Biry, former CFO/COO of McAfee and former WarnerMedia CFO, was appointed Deputy CFO effective July 6, and steps into the CFO role on January 1, 2027.
Separately, AT&T stock was downgraded by a major Wall Street analyst citing rising broadband competition from satellite providers, with the upcoming SpaceX IPO drawing fresh attention to Starlink as a long-term threat. AT&T was also removed from the Russell Top 50 Index in the latest reconstitution.
The valuation debate cuts both ways. AT&T trades at a P/E ratio of 7x versus a telecom average near 17x and well below the analyst target of $30.25, paired with a 4.95% dividend yield. Reddit sentiment on r/WallStreetBets ran consistently bearish into today’s session.
Verizon Loses Its Dow Seat
S&P Dow Jones Indices is replacing Verizon with Alphabet (NASDAQ:GOOGL) in the Dow Jones Industrial Average, effective prior to the opening of trading on June 29. The index committee cited Verizon’s relatively low share price, which made it a small contributor to the price-weighted benchmark.
Verizon stock had been a relative bright spot, up 18% over the past year before today’s drop, supported by a 6% dividend yield and an analyst target price of $51.9. The Dow removal is largely mechanical, but it compounds community concerns around satellite-broadband competition, a high debt load, and dividend sustainability.
The dominant Reddit thread driving bearish Verizon chatter was titled “SpaceX Reportedly Eyes U.S. Starlink Mobile Push: All Your Phone Bills Are Belong to us!”, echoing the same Starlink narrative pressuring AT&T. The cross-ticker overlap suggests investors are pricing in shared satellite-broadband risk across both wireless incumbents.
What to Watch Next
The common thread linking AT&T and Verizon weakness is satellite-broadband disruption fears, while Comcast’s spinoff offers a different value-unlocking thesis. Index removals are passive-flow events, and a planned CFO transition is not inherently negative, so today’s selling pressure on AT&T and Verizon may invite contrarian interest given the dividend profiles.
Stock traders can watch for whether Comcast holds its gains into the close as arbitrage desks model the NBCUniversal stub. For AT&T and Verizon, the next signal points are Q2 2026 earnings and any follow-on analyst notes addressing Starlink exposure. Ultimately, investors should consider keeping their position sizes modest while the catalysts settle.
The post Telecom Turmoil: Comcast Rises 7% on Media Spinoff, AT&T Falls 5% on CFO Exit and Starlink Threat, Verizon Sinks 7% on Dow Exit appeared first on 24/7 Wall St..
]]>Today’s widely discussed smart-money signal on a SpaceX (NASDAQ:SPCX)-T-Mobile (NASDAQ:TMUS) tie-up comes from a single TD Cowen analyst, not consensus. Meanwhile, Wall Street’s broader view on T-Mobile remains bullish on fundamentals rather than takeover speculation. A TD Cowen analyst, as reported via TheFly and StockTwits, floated the scenario that SpaceX’s Starlink unit could need to acquire a major U.S. wireless carrier and T-Mobile “seems to us the clear choice.”
This remains speculation at the analyst level. SpaceX hasn’t announced or been reported to be pursuing T-Mobile, and the market reflects that. SPCX stock traded near $153 in Thursday’s afternoon session, down 1%, while T-Mobile stock rose 1% to $182 and change; neither move was consistent with a real bid catalyst.
For institutional investors, the operative read is straightforward: treat the TD Cowen note as a strategic thought experiment about Starlink’s terrestrial network gap, not a deal in progress. The note explores a hypothetical path rather than signaling imminent corporate action.
What the TD Cowen Analyst Actually Argued
The analyst’s reasoning rests on SpaceX’s prospectus filings, which point to explicit ambitions for Starlink to compete directly in high-density urban and suburban markets, segments demanding a far larger terrestrial footprint than the rural and isolated areas Starlink has historically served. Next-generation Starlink Mobile satellites would require a massive terrestrial footprint to deliver on those ambitions.
The analyst noted that the “Big Three” U.S. wireless carriers have reportedly refused to lease network capacity to SpaceX via mobile virtual network operator (MVNO) agreements, leaving acquisition as the apparent strategic path. T-Mobile’s momentum, “maverick” culture, position as a pure-play wireless provider, and existing Starlink partnership made it the analyst’s preferred candidate, with AT&T (NYSE:T) floated as “another thought.”
What the Data Says About TMUS and SPCX
On T-Mobile, consensus is decisively bullish independent of M&A talk. Alpha Vantage shows an analyst target price of $259.08, with 9 Strong Buy, 15 Buy, 4 Hold, and zero Sell or Strong Sell ratings against T-Mobile stock’s current $182.76. T-Mobile’s trailing P/E ratio is 20x, the forward P/E ratio is 18x, and the beta sits at 0.3.
Operationally, T-Mobile posted Q4 2025 revenue of $24.33 billion, up 11% year over year (YoY), free cash flow of $4.19 billion, and 962,000 postpaid phone net adds in the quarter. Management guided FY2026 core adjusted EBITDA of $37 billion to $37.5 billion and authorized a $14.6 billion stockholder return program through December.
SpaceX has no public analyst coverage, no consensus price target, and no institutional positioning data. SPCX carries a market cap of roughly $1.16 trillion. SpaceX stock IPO’d June 15 at $135, surged to a peak around $225 before sharp volatility, and has dropped in five of its first eight sessions, with a one-week change of around -20%.
The Gap Between the Story and the Tape
Wall Street’s consensus target of $259.08 on T-Mobile stock sits well above the current share price, a gap unrelated to SpaceX speculation. TMUS stock is down 10% year to date, even as analysts maintain their constructive stance on fundamentals.
For SpaceX, the absence of any prediction market on a wireless-carrier acquisition signals skepticism. Polymarket hosted active SpaceX M&A markets, with the Cursor/Anysphere acquisition question settling at a last trade price of 0.999, yet no carrier-acquisition contracts exist on the platform. So far, traders generally aren’t pricing in the T-Mobile scenario.
Retail sentiment on Stocktwits was reportedly bearish on both SPCX and TMUS this week, a notable divergence from the institutional bull case. That split is a useful indicator of speculative-versus-fundamental cross-currents in both names.
Is the Smart Money Right, and Should You Act on It?
On T-Mobile, institutional consensus rests on documented cash-flow growth, broadband subscriber leadership, and a multi-billion-dollar capital return program, not takeover speculation. The TD Cowen scenario is internally logical given SpaceX’s stated urban broadband ambitions, but it remains one analyst’s hypothetical without corporate confirmation from either company.
A SpaceX acquisition of T-Mobile would face significant regulatory, antitrust, financing, and integration hurdles. Besides, SpaceX is already digesting its $60 billion Anysphere acquisition announced June 16.
Investors can monitor Starlink’s terrestrial buildout disclosures and any official carrier commentary from SpaceX as real signals worth tracking. It makes sense to keep one’s position sizes modest given how speculative the M&A premise remains. For now, the smart money’s verifiable view rests on T-Mobile’s fundamentals, not takeover talk.
The post Could SpaceX Buy T-Mobile? A TD Cowen Analyst Floats the Idea appeared first on 24/7 Wall St..
]]>A panel discussion on episode 1,089 of This Week in Tech (TWiT) debated sky-high AI valuations and capital allocation, with host Leo Laporte and guests Ian Thompson, Owen Thomas, and Doc Rock. They argued that today’s AI leaders face the same capital-allocation challenge that confronted earlier technology giants.
Their warning centered on Intel (NASDAQ:INTC), which Thompson described as a company that spent heavily on share buybacks while falling behind in manufacturing technology. With Anthropic reportedly approaching a $1 trillion valuation and OpenAI valued at more than $850 billion, the panel argued that how AI companies deploy capital may matter just as much as how quickly they grow.
Ian Thompson’s Warning About Share Buybacks and Innovation
Thompson’s argument: AI giants risk repeating what he framed as Intel’s defining error. He said Intel “spent billions buying back its own shares to support the share price and let chip manufacturing technology just lie useless. And now they’re paying the price for it.” Thompson added that share buybacks were illegal until Reagan-era reforms in the 1980s.
The market has repriced that thesis in real time. Intel shares closed at $133.99 on June 18, with the stock up 263.12% year to date and 523.5% over the trailing year. CEO Lip-Bu Tan told investors on the Q1 FY2026 call that “the next wave of AI will bring intelligence closer to the end user, moving from foundational models to inference to agentic. This shift is significantly increasing the need for Intel’s CPUs and wafer and advanced packaging offerings.”
Intel’s Q1 FY2026 earnings release showed revenue of $13.58 billion, up 7.2% year over year, with Data Center & AI revenue of $5.05 billion (+22% YoY) and Intel Foundry revenue of $5.42 billion (+16% YoY).
Why Anthropic’s $1 Trillion Valuation Matters
According to the panel, Anthropic has edged past OpenAI to nearly a $1 trillion valuation as a privately held company, a milestone a guest called “unprecedented.” The reporter noted that OpenAI counts 1 billion weekly active users and raised financing at an $852 billion valuation, while cautioning that OpenAI’s reported losses are complicated by its nonprofit-to-for-profit conversion and non-cash stock compensation. The guest also said OpenAI has reportedly confidentially filed to go public but may delay the IPO.
How Executive Incentives Can Distort Capital Allocation
Doc Rock connected the buyback debate to executive compensation, citing former AT&T (NYSE:T) CEO Randall Stephenson as an example of misaligned incentives. Stephenson received roughly $48 million in annual salary, while AT&T nearly tanked. Doc Rock and host Leo Laporte argued that buybacks can sometimes reward executives and drive the share price higher without necessarily improving a company’s long-term competitive position.
AT&T, under CEO John Stankey, has pivoted toward fiber and wireless. AT&T’s Q1 FY2026 adjusted EPS came in at $0.57 on revenue of $31.51 billion (+2.9% YoY), with 584,000 internet net adds in the quarter. Management reiterated full-year 2026 guidance for adjusted EPS of $2.25 to $2.35 and free cash flow of $18 billion-plus. The shares closed at $22.01 on June 18, down 9.42% year-to-date and 16.95% over the trailing year. AT&T trades at a trailing P/E of 7 with a dividend yield of 4.95%.

What Investors Should Watch Next
The panel closed skeptical over how much of the headline AI valuations reflects real value rather than “funny money.” The practical question today is whether AI infrastructure leaders are reinvesting in manufacturing capacity, talent, and intellectual property at a pace that justifies private-market valuations, or whether they tilt toward managing shareholder returns before the technology cycle matures. Intel’s foundry buildout and AT&T’s fiber capex offer investors two case studies in how large-scale capital allocation decisions can affect a stock’s long-term returns and competitive position.
The post As Anthropic Nears $1 Trillion Valuation, Tech Veterans Warn Against Repeating Intel’s Biggest Mistake appeared first on 24/7 Wall St..
]]>Earned income disappears the moment you stop showing up. Dividend income does not. That asymmetry is why so many investors over the past two years have shifted serious capital into companies that mail a check every 90 days regardless of layoffs, headlines, or a University of Michigan Consumer Sentiment reading of 49.8 that sits firmly in recessionary territory.
The appeal sharpens when you compare alternatives. Rental property locks up capital and demands midnight phone calls. Private credit funds gate your money for years. High-yield dividend stocks pay you in cash, settle in two days, and let you walk away anytime. With the 10-Year Treasury at 4.48%, any equity yield above that bar earns its keep, and the three names below clear it by a wide margin.
The market routinely mispriced mature cash-cow businesses whenever growth narratives dominate. We screened our 24/7 Wall St. dividend equity research database, looking for stocks that pay massive dividends, and we found a collection of companies that, combined, can generate over $1,100 a year in passive annual income if you invest just $6,667 in each stock at the time of this writing.
AT&T
- Stock #3: AT&T
- Yield: 4.83%
- Shares for $6,667: ~286
- Annual Passive Income: ~$322
AT&T (NYSE:T) has become a focused converged-connectivity operator after years of media misadventures. The $23.29 share price reflects the market’s lukewarm view of a slow-growth telecom carrying $138.4 billion in total debt, but the cash machine underneath is humming. Q1 2026 produced $31.51 billion in revenue and adjusted EPS of $0.57, with management guiding to $18 billion-plus in free cash flow this year.
The yield is elevated because AT&T cut its payout after the Warner spin-off and the market has yet to forgive the move. The quarterly dividend has held steady at $0.2775 per share since 2022, and CEO John Stankey is funneling capital into roughly $8 billion of buybacks planned for 2026. Institutions own 69.3% of the float, with Vanguard and BlackRock leading the register.
Altria
- Stock #2: Altria
- Yield: 5.88%
- Shares for $6,667: ~96
- Annual Passive Income: ~$406
Altria (NYSE:MO) is the Marlboro parent and a textbook example of a melting ice cube that still throws off enormous cash. Cigarette volumes shrink every year, yet pricing power keeps the profit pool intact. Q1 2026 delivered $5.43 billion in revenue and adjusted diluted EPS of $1.32, with smokeable products carrying a 65.1% adjusted OCI margin.
The dividend payout drives the entire return profile. Altria just raised its quarterly payout to $1.06 per share and paid out $1.8 billion in Q1 2026 alone. Years of returning nearly every dollar to shareholders have produced negative shareholders’ equity of $3.2 billion, which is unusual but functionally irrelevant as long as the cash keeps flowing. Institutions hold 63.5% of the stock.
Verizon
- Stock #1: Verizon
- Yield: 5.89%
- Shares for $6,667: ~142
- Annual Passive Income: ~$401
Verizon (NYSE:VZ) just closed the Frontier Communications acquisition on January 20, 2026, pushing fiber connections to roughly 10.8 million. Q1 produced its first positive Q1 postpaid phone net adds since 2013, and adjusted EBITDA grew 6.7% to $13.39 billion.
The yield is structurally high because Verizon carries $172.5 billion in total debt and trades at a discount to slower-growing utilities. The payoff is one of the most reliable dividends in the S&P 500: 19 consecutive years of increases, most recently to $0.7075 per quarter. Institutional ownership sits at 70.4%.
The Combined Income Picture
Combined, these 3 positions generate $1,129 in annual passive income on a $20,001 investment, a blended yield of 5.6%. Altria contributes $406, Verizon adds $401, and AT&T rounds out the portfolio with $322.
| Ticker | Annual Income | Share of Total |
|---|---|---|
| MO | $406 | 36% |
| VZ | $401 | 36% |
| T | $322 | 28% |
The quiet magic of a portfolio like this is what happens when you flip the dividend reinvestment switch on. Every quarterly check buys fractional shares at whatever price the market offers that day, which means down moves accelerate your share count instead of scaring you out of the position. Five years of that mechanic, applied to yields north of 5%, can quietly double the income stream without a single additional dollar of fresh capital.
The post The Exact Passive Income $20,000 Generates in High-Yield Dividend Stocks appeared first on 24/7 Wall St..
]]>At $46.95 for Verizon (NYSE:VZ) and $23.21 for AT&T (NYSE:T), both telecom giants screen as range-bound. VZ sits just below its $50.91 52-week high, while T actually trades closer to its $22.32 52-week low after a recent downgrade.
Both companies are mid-execution on aggressive fiber rollouts. Verizon closed its Frontier deal in January 2026 and now serves approximately 16.8 million broadband connections under new CEO Dan Schulman.
AT&T closed its Lumen Mass Markets fiber acquisition in February 2026, lifting its footprint to over 37 million fiber locations with a target of 60 million by 2030. Same playbook, very different stock reactions.
The Bull Case: Convergence Is Working
Verizon raised 2026 adjusted EPS guidance to $4.95 to $4.99 and posted its first positive Q1 postpaid phone net additions since 2013. Free cash flow guidance of $21.5 billion or more funds a $3.0 billion buyback and the dividend.
AT&T trades at a forward multiple of 10x against guided EPS of $2.25 to $2.35 with a double-digit three-year CAGR. Management is targeting $45 billion in shareholder returns through 2028 and an $8 billion repurchase in 2026 alone. Advanced home internet revenue jumped 27.3%.
The Bear Case: Debt, Downgrades, and Soft Performance
Verizon carries $172.5 billion in total debt post-Frontier, with interest expense up 18.9% YoY. Postpaid ARPA slipped 1.9% and churn ticked to 0.97%.
AT&T was just downgraded by Oppenheimer from Outperform to Perform on low-earth-orbit satellite competition concerns, with the stock hitting a fresh 52-week low. Net leverage is expected to peak near 3.2x post-EchoStar, and legacy revenues are guided to fall 20%+ in 2026.
The Case for Patience
Verizon’s turnaround is real but already priced. AT&T’s discount is real but the downgrade narrative needs to clear. Investors collecting Verizon’s 6.08% yield and AT&T’s 4.93% yield are paid to wait for the next two earnings reports to resolve the divergence.
What the Data Shows
Verizon is up 19.07% year to date against an analyst target of $51.85 from 25 covering analysts (3 Strong Buy, 8 Buy, 14 Hold, 0 Sell), implying roughly 10% upside on a trailing P/E of 11x.
AT&T is down 4.48% YTD, trades at a trailing P/E of 7x, and carries an analyst target of $30.30 (3 Strong Buy, 12 Buy, 10 Hold, 0 Sell) for implied upside near 31%. For context, the S&P 500 is up roughly 7% year to date, so Verizon is meaningfully ahead of the index while AT&T is trailing it. Analyst targets are one input among many.
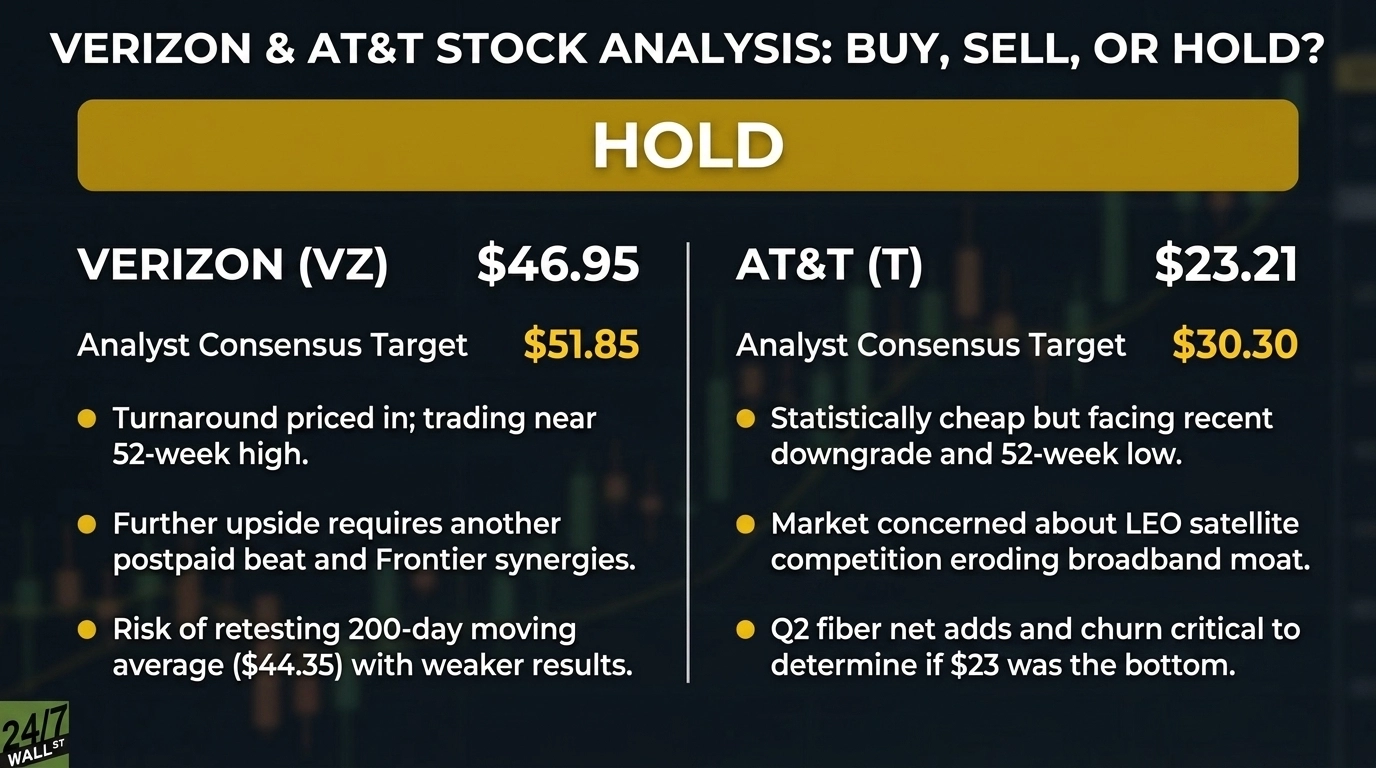
The Verdict: Hold Both Until the Next Earnings Report
At $46.95 for Verizon and $23.21 for AT&T, both stocks look range-bound. Here is why.
Verizon has done the work, but at 11x earnings near a 52-week high, the easy money from the Schulman turnaround narrative is already in the price. The path to $55 runs through another postpaid beat and visible Frontier synergies. Anything less and the stock retests the 200-day at $44.35.
AT&T looks statistically cheap, but the Oppenheimer downgrade and fresh 52-week low signal the market wants proof that LEO satellite migration is not eroding the broadband moat. Q2 fiber net adds and churn will decide whether $23 was the bottom or a waypoint.
Shareholders are paid handsomely to wait through one more quarter before reassessing positioning at these prices.
The post Verizon Communications at $46 And AT&T at $23: Buy, Sell or Hold? appeared first on 24/7 Wall St..
]]>The average retired worker receives roughly $23,700 per year from Social Security. A $750,000 portfolio dedicated to income generation can surpass that figure at virtually any reasonable yield level. The question is not whether the portfolio can outproduce the average Social Security benefit. The question is how much risk must be taken to achieve that income and how reliable the income stream will remain over time.
The Math is Straightforward
Multiply the portfolio value by the yield to estimate annual income. At a 3.5% yield, a $750,000 portfolio generates approximately $26,250 per year. At 6%, the income rises to $45,000. At 9%, it reaches $67,500. Each of those figures exceeds the average Social Security benefit, but the tradeoffs become increasingly important as yield rises.
Higher yields often come with greater risks to both income stability and principal preservation. A lower-yielding portfolio may produce less income today but offer stronger dividend growth and a greater margin of safety. A higher-yielding portfolio may generate substantially more cash flow in the short term, but it can also face a higher likelihood of dividend cuts or capital erosion. The real decision is not how to generate income from $750,000. It is deciding what balance of income, growth, and risk best supports the retirement you want to fund.
The Conservative Tier: 3% to 4%
This is the dividend-growth lane. Names like Johnson & Johnson (NYSE:JNJ), Procter & Gamble (NYSE:PG), and Lowe’s yield closer to 2.3% to 3% on their own, but blended with broad dividend ETFs and a slug of Treasuries currently paying almost 5% at the 10-year, a 3.5% portfolio yield is realistic.
At 3.5%, $750,000 throws off about $26,250. That is roughly $2,190 a month, which already tops the average Social Security check. The real payoff sits underneath the headline yield. JNJ has raised its payout for 64 consecutive years and most recently lifted its quarterly dividend to $1.34. P&G has paid a dividend every year since 1890 and just notched its 70th consecutive annual increase. Lowe’s has compounded its payout for decades alongside a 219% ten-year share gain.
The Moderate Tier: 5% to 7%
Step up to net-lease REITs, telecom, and high-yield equity funds and the same $750,000 can generate $37,500 to $52,500 a year. Realty Income (NYSE:O) currently yields about 5.4%, pays monthly, and has now delivered 670 consecutive monthly dividends. AT&T (NYSE:T) yields close to 4.9% on a $1.11 annualized payout, with management guiding to $18 billion or more of free cash flow in 2026.
The tradeoff is honest. AT&T cut its dividend from $0.52 to $0.2775 per quarter in 2022 and has held it flat since. Higher current yield, slower compounding.
The Aggressive Tier: 8% and Up
Leveraged covered-call funds, mortgage REITs, BDCs, and certain MLPs can push the headline yield into the 8% to 12% range. At 9%, $750,000 generates $67,500, nearly triple the average Social Security benefit.
Energy Transfer sits at the friendlier end of this tier, yielding around 6.8% with a distribution that has climbed for nine straight quarters, most recently to $0.3375. ET also issues a K-1 rather than the standard 1099, which complicates tax filing. Move further up the yield curve and principal erosion becomes routine. At that point you are spending the asset itself.
The Detail Most Income Investors Underweight
Social Security benefits receive annual cost-of-living adjustments tied to inflation, helping retirees maintain purchasing power over time. Many dividend-growth companies have historically increased their payouts at rates that exceed inflation. For example, Johnson & Johnson’s quarterly dividend rose from $1.01 in 2020 to $1.34 in 2026, while Procter & Gamble increased its annual dividend from $3.17 to $4.29 over the same period.
Over long periods, that difference can become significant. A portfolio generating roughly $2,200 per month today with dividend growth of 7% to 8% annually could potentially double its income within about a decade. By contrast, a portfolio built around a high yield with little or no distribution growth may provide more income initially but see its purchasing power gradually eroded by inflation. The most important number is not today’s yield. It is how much income the portfolio is likely to produce ten or twenty years from now.
What To Do With This
- Map your actual retirement spending against your projected Social Security check. The gap between those two numbers is what the portfolio needs to cover.
- Compare a 10-year total return on a 3.5% dividend growth fund against a 10% high-yield fund. Look at distributions plus NAV change together, because that is what your purchasing power actually depends on.
- If you are inside five years of retirement, model the after-tax income at each tier. Qualified dividends and long-term gains are taxed below ordinary income, and MLP K-1s carry their own bookkeeping.
Social Security is the floor. A $750,000 portfolio, even at a sleep-at-night yield, can quietly become the larger paycheck.
The post A $750,000 Portfolio That Quietly Pays You More Than the Average Social Security Check appeared first on 24/7 Wall St..
]]>Income investors have piled into Verizon Communications (NYSE:VZ) this year, sending the stock up 21.4% year to date as the crowd chases a 5.78% dividend yield and the company’s old “premium network” reputation.
But here’s what you should actually be watching.
Verizon is the textbook telecom value trap. The stock now carries a $199.3 billion market cap, yet its own 2025 guidance called for free cash flow of $17.5 billion to $18.5 billion, a step down from the $19.82 billion it generated in 2024. Management is guiding adjusted EPS growth of just 0% to 3%, wireline revenue fell 8.0% year over year in the most recent comparable quarter, and the pending Frontier deal piles fresh integration risk onto a balance sheet that already carries roughly $144 billion in debt. The premium that long-term holders paid for the “best network” story is now being recycled by fresh buyers chasing yield on a shrinking cash flow base. That is exactly how value traps work.
Meanwhile, AT&T (NYSE:T) is up just 1.41% year to date, sits at a smaller $170.58 billion market cap, and is quietly executing the better business. Three reasons retirement-focused investors should redirect here.
1. Free cash flow is accelerating. AT&T reiterated full-year 2026 free cash flow guidance of $18 billion+, with a multi-year ramp to $19 billion+ in 2027 and $21 billion+ in 2028. Q1 2026 alone produced $2.506 billion in free cash flow on $31.506 billion of revenue, up 2.9% year over year, with adjusted EPS of $0.57, a 11.8% jump. Verizon’s own outlook is going the other direction.
2. The convergence playbook is working in real time. AT&T booked 584,000 internet net additions in Q1, split evenly between fiber and fixed wireless, alongside 294,000 postpaid phone net adds at a churn rate of 0.89%. Nearly 45% of home internet customers also carry AT&T wireless service. Consumer wireline broadband revenue climbed 27.3% year over year. The fiber footprint sits at over 37 million locations after the Lumen Mass Markets fiber acquisition closed on February 2, 2026, with a target of more than 60 million by 2030. CEO John Stankey called Q1 “our best first quarter ever for Advanced Connectivity internet customer net additions.”
3. The capital return commitment is enormous. AT&T plans to return $45 billion+ to shareholders during 2026 through 2028, including roughly $8 billion of buybacks this year alone ($2.3 billion already executed in Q1) on top of the $1.11 annualized dividend. Shares trade at just 8x trailing earnings and 11x forward earnings, with analysts carrying an average price target of $30.37 against a $24.64 close. That is a company buying back its own discount.
Verizon delivers a fatter current yield, but it is funding that yield from a cash flow base management itself says is contracting, while carrying more debt and a heavier acquisition to digest. AT&T is in the opposite position: organic postpaid subscriber growth, a high-margin fiber footprint expanding into 2030, accelerating free cash flow, and a shrinking share count.
For investors focused on the underlying free cash flow story, AT&T’s setup looks more compelling than Verizon’s right now.
The post Forget Wall Street’s Ultimate Telecom Value Trap and Buy the Real Free Cash Flow King appeared first on 24/7 Wall St..
]]>At the 24% federal bracket, a portfolio throwing off $40,000 in high-yield dividend income hands roughly $9,600 to the IRS every year when those shares sit in a taxable account treated as ordinary income. For investors in the gap years between retirement and RMD age 73, that drag compounds quietly until required minimum distributions force the math into the open.
The Closing Window Before RMDs
Under SECURE 2.0, the RMD age sits at 73 for taxpayers born between 1951 and 1959 and steps up to 75 for those born in 1960 or later. The years between retiring and that first forced distribution are the cleanest window to convert traditional IRA assets into a Roth, harvest qualified dividends at the 0% long-term capital gains rate (available up to roughly $96,000 of taxable income for joint filers in 2026) and relocate the highest-yielding positions before ordinary-income withdrawals take over. Roth IRAs carry no RMD for the original owner, which is the entire point of the relocation.
The Tax Delta: Roth Versus Taxable at 24%
Take a $500,000 high-yield position generating $40,000 in annual dividends. If those payouts were treated as ordinary income at the 24% bracket, the net drops to $30,400. Inside a Roth, it stays at $40,000. The annual delta is $9,600, and it repeats every year the position is held. Qualified dividends from the blue chips below get preferential LTCG treatment, so the realized gap is smaller than the ordinary-rate worst case, but it widens fast once household income climbs above the 0% LTCG threshold or if Congress lets current rates rise.
The Portfolio
Five NYSE-listed dividend payers, ranked by current yield. The higher-yield names carry the strongest case for Roth placement during the gap-year window.
- Altria (NYSE:MO): current yield 6%, quarterly dividend $1.06. The largest absolute income stream in the group and the position where Roth shelter saves the most dollars per year.
- Verizon Communications (NYSE:VZ): current yield 6%, with 26+ consecutive years of annual dividend increases. Same logic as MO: large income, large tax footprint outside a Roth.
- AT&T (NYSE:T): current yield 4%, annualized dividend $1.11. Stable at the current rate for four-plus years after the 2022 reset.
- Procter & Gamble (NYSE:PG): current yield 3%, with 70+ consecutive years of increases. Lower starting yield, but compounded raises make the Roth shelter pay off across a 20-year horizon.
- Johnson & Johnson (NYSE:JNJ): current yield 2%, after a Q2 2026 raise to $1.34 per quarter and 64 consecutive years of hikes. The dividend growth builds the Roth case here, even with a modest starting yield.
The Bracket Multiplier
The 24% number is the middle of the band. Federal brackets for 2026 sit at 22%, 24%, 32%, and 37%. Apply each to the same $40,000 in dividends treated as ordinary income, and the annual Roth advantage scales linearly: a 22% household trims less than a 37% household to the IRS, but every bracket pays. The higher the bracket, the more urgent the asset-location decision becomes during the gap years, when conversion taxes are still cheap.
The Insight Most Readers Miss
The real Roth advantage is that $9,600 delta reinvested tax-free, every year, with no future RMD pulling capital back out. Average Baby Boomer 401(k) balances of $267,900 and IRA balances of $257,002 mean millions of pre-retirees are about to start RMDs on accounts large enough that asset location drives the next decade of after-tax income more than stock selection. Held outside a Roth, the tax cost on a $40,000 dividend stream is permanent and recurring. Held inside, it is zero.
What to Do
- If your highest-yielding names sit in a taxable account, calculate your annual tax cost at your bracket before the next filing and rank positions by absolute dollar drag.
- Model a phased Roth conversion across the gap years, starting with the highest-yielders (MO, VZ, T in this group) before RMDs raise your marginal bracket.
- If your 2026 taxable income will land below the $96,000 MFJ threshold, harvest qualified dividends or convert at the 0% LTCG rate while the window is open.
The post How to Maximize Dividend Income in Retirement Before RMDs Change the Math appeared first on 24/7 Wall St..
]]>All the major Wall Street firms we cover here at 24/7 Wall St. have a list of the top stock picks for their institutional and retail clients to invest in. Typically, these are companies that analysts have a high level of conviction in and feel strongly about their fundamentals and forward-looking prospects. In addition, they often have strong upside to the assigned price target and a Buy or Overweight rating, depending on the company providing the coverage. After a furious rally off the February lows, and with all the major indices trading at all-time highs, many investors are treading carefully in front of the third quarter of 2026, so we were very interested to see which stocks were on the June edition of J.P. Morgan’s Analyst Focus List. All will provide investors with steady passive income and have the potential to deliver solid total returns.
The research team at J.P. Morgan updates its U.S. Analyst Focus List monthly, as the company describes:
The U.S. Analyst Focus List is updated monthly. Names may be removed mid-month when a valuation target has been largely or wholly achieved, or the original rationale is no longer valid. New ideas can also be added mid-month. Analysts will publish the explanation for all mid-month changes in a research note.
We screened the June Analyst Focus List looking for J.P. Morgan’s top high-yield stock picks, and five of our favorite companies made the list. These picks make sense for growth and income investors looking for top ideas from leading Wall Street firms.
Why do we recommend J.P. Morgan’s Analyst Focus List stocks?
J.P. Morgan is one of the acknowledged leaders in the investment landscape on Wall Street and worldwide. The firm’s top-notch research department continues to provide institutional and high-net-worth clients with the best ideas across the investment spectrum and is likely to do so for years to come.
Annaly Capital
With a massive 13% dividend yield and trading right near the J.P. Morgan target price, this is a total passive-income play. Annaly Capital Management (NYSE:NLY) is a diversified capital manager with investment strategies across mortgage finance.
The company owns a portfolio of real estate-related investments that includes:
- Mortgage pass-through certificates
- Collateralized mortgage obligations
- Credit risk transfer (CRT) securities
- Securities representing interests in or obligations backed by pools of mortgage loans, residential mortgage loans, and mortgage servicing rights
Its investment groups include:
- Annaly Agency Group, which invests in agency mortgage-backed securities collateralized by residential mortgages
- Annaly Residential Credit Group, which invests in non-agency residential mortgage assets within residential and commercial markets
- Annaly Mortgage Servicing Rights Group, which invests in MSR that grants the right to service residential mortgage loans in exchange for a portion of the interest payments on those loans
The $24 J.P. Morgan price target is likely to go higher.
AT&T
AT&T (NYSE:T) is the world’s fourth-largest telecommunications company, measured by revenue. The legacy telecom has been undergoing a lengthy restructuring process while maintaining a solid dividend of 4.52%. Thirteen analysts have given the stock a Buy rating, indicating comprehensive Wall Street support.
AT&T provides a range of telecommunications, media, and technology services worldwide. Its Communications segment offers wireless voice and data communications services. Through its company-owned stores, agents, and third-party retail stores, it sells:
- Handsets
- Wireless data cards
- Wireless computing devices
- Carrying cases
- Hands-free devices
AT&T also provides:
- Data
- Voice
- SecuT
- Cloud solutions
- Outsourcing
- Managed and professional services
- Customer premises equipment for multinational corporations, small and mid-sized businesses, and governmental and wholesale customers
Additionally, this segment provides residential customers with fiber broadband and legacy voice telephony services. It markets its communications services and products under:
- AT&T
- Cricket
- AT&T PREPAID
- AT&T Fiber
The company’s Latin America segment provides wireless services in Mexico and video services throughout the region. This segment markets its services and products under the AT&T and Unefon brands.
J.P. Morgan has a $33 price target for the stock.
Broadstone Net Lease
With a substantial 5.86% dividend yield and a robust portfolio, this real estate investment trust (REIT) is a compelling investment option, especially given the expectation that interest rates will likely remain where they are indefinitely. Broadstone Net Lease (NYSE:BNL) is an industrial-focused, diversified net lease REIT). The company invests primarily in single-tenant commercial real estate properties that are net leased to a diversified group of tenants on a long-term basis. It is mainly diversified across industrial and retail property types.
Under the industrial property type, it includes
- Manufacturing
- Distribution and warehouse
- Food processing
- Flex
- Research and development
- Cold storage
- Services
Under the retail property type, it includes:
- General merchandise
- Casual dining
- Quick-service restaurants
- Automotive
- Animal services
- Home furnishings
- Healthcare services
- Education
Under Other property type, it includes offices and clinical/surgical facilities.
The company’s portfolio comprises approximately 766 properties, including 759 located in 44 U.S. states and seven in four Canadian provinces.
The J.P. Morgan price target for the stock is $23.
Entergy
This energy company is engaged primarily in electric power production and retail distribution operations in the Deep South of the United States. Entergy (NYSE:ETR) stock makes sense for conservative investors and comes with a dependable 2.36% dividend.
It produces and distributes electricity to 3 million customers in the United States and operates in two segments. The Utility segment generates, transmits, distributes, and sells electric power in the City of New Orleans and in:
- Arkansas
- Louisiana
- Mississippi
- Texas
The company also distributes natural gas.
Entergy’s Wholesale Commodities segment is involved in:
- The ownership, operation, and decommissioning of nuclear power plants located in the northern United States
- Sale of electric power to wholesale customers
- Provision of services to other nuclear power plant owners
- Ownership of interests in non-nuclear power plants that sell electric power to wholesale customers
The company generates electricity from various sources, including gas, nuclear, coal, hydro, and solar. It sells energy to retail power providers, utilities, electric power co-operatives, power trading organizations, and other power generation companies.
Its power plants have approximately 24,000 megawatts (MW) of electric generating capacity, which includes 5,000 MW of nuclear power.
The J.P. Morgan price target for the shares is $129.
McCormick
Any cook is familiar with this company’s products, and investors also enjoy a tasty 3.93% dividend. McCormick (NYSE:MKC) manufactures, markets, and distributes herbs, spices, seasonings, condiments, and flavors to the entire food and beverage industry, including retailers, food manufacturers, and foodservice businesses.
It operates through two segments. The Consumer segment sells to retail channels, including grocery, mass merchandise, warehouse clubs, discount and drug stores, and e-commerce under the McCormick brand and a variety of brands around the world, including:
- French’s
- Frank’s RedHot
- Lawry’s
- Zatarain’s
- Simply Asia
- Thai Kitchen
- Ducros
- Vahine
- Cholula
- Schwartz
- Club House
- Kamis
- DaQiao
- La Drogheria
- Stubb’s
- OLD BAY
- Gourmet Garden
Its Flavor Solutions segment provides a range of products to multinational food manufacturers and foodservice customers. Foodservice customers are supplied with branded, packaged products, both directly by the company and indirectly through distributors.
J.P. Morgan has a $64 target price for the shares.
The post JP Morgan’s Analyst Focus List for June Has 5 Top Passive Income Dividend Picks appeared first on 24/7 Wall St..
]]>A combined household income of $110,000 is close to the national norm for a two-earner household. For a 56-year-old couple hoping to retire at age 60 and fund their lifestyle entirely through dividend income, that annual amount becomes the income target their portfolio must replace. The basic calculation is straightforward: divide the desired income by the portfolio’s yield to estimate the capital required. The more challenging decision is determining what level of yield is appropriate.
That choice generally falls into three broad categories, each offering a different balance between current income, preservation of principal, and long-term protection against inflation. With the 10-year Treasury yielding around 4.5%, investors have a meaningful benchmark against which to compare dividend strategies. At the same time, inflation remains an important consideration, underscoring the value of dividend growth alongside initial yield. A portfolio that generates attractive income today may still struggle over time if its distributions fail to keep pace with rising living costs.
The Conservative Tier: 3% to 4% Yield
At a blended 3.5% yield, $110,000 divided by 0.035 equals roughly $3,142,857 in capital. That is the price of buying America’s most reliable dividend franchises.
Johnson & Johnson (NYSE:JNJ) yields about 2.3% after 64 consecutive years of increases and a recent raise to $1.34 quarterly. Procter & Gamble (NYSE:PG) yields 2.9% on the back of 70 consecutive annual increases. PepsiCo (NASDAQ:PEP) yields 3.9% after a recent reset lower in the stock, and Exxon Mobil pays 2.8% with a 40-plus year growth streak.
The tradeoff is capital intensity. You need the most money upfront. In exchange, principal tends to appreciate, payouts grow, and income keeps pace with inflation. Dividends paid by S&P 500 companies have grown at roughly 150% of CPI since 1960, which is the entire case for accepting a lower starting yield.
The Moderate Tier: 5% to 7% Yield
At 6%, $110,000 divided by 0.06 equals roughly $1,833,333. The capital requirement drops by $1.3 million, but the growth profile flattens.
AT&T (NYSE:T) yields 4.5% on a $0.2775 quarterly payout that has stayed flat since the 2022 WarnerMedia spin-off cut it from $0.52. Cash flow is strong: free cash flow covered the dividend 2.38 times in 2025. But shareholders are sitting on a static check four years on, with management prioritizing buybacks over raises.
Verizon (NYSE:VZ) yields 5.8% with a more honest growth track record, recently raising the quarterly to $0.7075. Operating cash flow of $37.1 billion covers the $11.5 billion dividend more than three times over, though a $144 billion debt load consumes capital that could otherwise fund faster raises.
The Aggressive Tier: 8% and Above
At 10%, $110,000 divided by 0.10 equals exactly $1,100,000. This is the math that makes early retirement look possible on a normal nest egg. It is also where the trouble lives.
Altria (NYSE:MO) now yields 5.8%, down from the 7% to 8% range that defined it for years, after the stock ran up 25% over the past year. The dividend remains covered: operating cash flow of $9.29 billion against $6.96 billion in 2025 dividends, a 1.30x ratio. The structural issue is cigarette volume, which declines roughly 5% per year. To reach a true 8% to 10% blended yield, you move beyond names like Altria into business development companies, mortgage REITs, and high-yield bond funds. Capital required is lowest. So is the probability that your income, or your principal, survives the next decade intact.
Why Lower Yields Often Win the Decade
A 3.5% yield growing at 5% per year turns $110,000 into roughly $140,000 of annual income inside five years, with no rebalancing. The same $2.6 million parked in a static 6% payer produces $156,000 in year one and $156,000 in year ten. The dividend grower wins the next thirty years.
For this couple, four years from retirement, that compounding gap is the entire argument for accepting a higher capital target.
What This Couple Should Actually Do
- Replace spending, not salary. A $110,000 gross income often translates to $75,000 to $85,000 of actual annual spending once payroll taxes, 401(k) contributions, and work-related costs disappear. Recalculating the target on real spending can cut the capital requirement by a quarter.
- Screen for payout ratios under 65% before yield. Sustainability beats headline yield every time. AT&T’s 2022 cut from $0.52 to $0.2775 erased 47% of annual income for holders who bought for the yield alone.
- Model the tax bracket. Qualified dividends in a taxable account are taxed at 15% to 20%, well below ordinary income rates. A blended 4.25% yield across 15 dividend aristocrats, held in taxable, often nets more spendable cash than a 6% yield held in a tax-deferred account drawn down at ordinary rates.
The post Can Pure Dividend Stocks Replace a $110,000 Dual-Income Household Income? Here’s What It Would Take appeared first on 24/7 Wall St..
]]>Holding a high-yield dividend portfolio in a taxable account at the 24% federal bracket means writing the IRS a $14,400 check every year on $60,000 of income that should have been yours. It repeats annually, forever, on the same dollars you already earned.
This series exists because most readers know what a Roth IRA is but have never run the actual dollar delta on the specific high-yield names they own. The basket below is built from ten tickers that pay mostly ordinary-income distributions, which is exactly where Roth placement matters most.
The Tax Delta: Roth Versus Taxable on a $60,000 Income Portfolio
Assume a roughly $1 million portfolio split evenly across ten high-yield names. Current yields pulled from each company’s most recent dividend declarations:
| Stock | Current Yield | Tax Character |
|---|---|---|
| British American Tobacco (NYSE:BTI) | 5% | Qualified dividend; subject to 15% UK withholding tax that a Roth cannot recover |
| Altria (NYSE:MO) | 6% | Qualified |
| AbbVie (NYSE:ABBV) | 3% | Qualified |
| Verizon (NYSE:VZ) | 6% | Qualified |
| AT&T (NYSE:T) | 4% | Ordinary income |
| Realty Income (NYSE:O) | 5% | Ordinary (REIT) |
| Ares Capital (NASDAQ:ARCC) | 10% | Ordinary (BDC) |
| Main Street Capital (NYSE:MAIN) | 8% | Ordinary (BDC) |
| Enterprise Products Partners (NYSE:EPD) | 6% | K-1, ordinary plus return of capital; UBTI considerations apply inside an IRA above $1,000 annually |
| JPMorgan Equity Premium Income ETF (NYSEARCA:JEPI) | 8% | Largely ordinary (option premium) |
Ares Capital declared $0.48 quarterly, Main Street pays $0.26 monthly plus a $0.30 quarterly supplemental, and EPD distributes $0.55 per unit quarterly. Blended together the basket produces roughly $60,000 in gross annual income on $1 million invested.
Inside a Roth, that $60,000 lands in the account untouched. In a taxable account at the 24% bracket, $14,400 leaves for the IRS and the investor nets $45,600. Over a flat 10 years with no growth assumed, that is $144,000 of permanent tax cost.
The Bracket Multiplier
The Roth advantage scales directly with marginal rate. Same basket, same $60,000 gross, different bracket:
| Federal Bracket | Annual Tax | Taxable Net | Roth Net | Annual Roth Advantage |
|---|---|---|---|---|
| 22% | $13,200 | $46,800 | $60,000 | $13,200 |
| 24% | $14,400 | $45,600 | $60,000 | $14,400 |
| 32% | $19,200 | $40,800 | $60,000 | $19,200 |
| 37% | $22,200 | $37,800 | $60,000 | $22,200 |
State income tax is not included. Add it on top and the gap widens further.
Why These Names Specifically
Most S&P 500 dividends are qualified and taxed at preferential rates. The basket above is different. BDCs like Ares Capital and Main Street Capital are required to distribute substantially all taxable income to shareholders, taxed at ordinary rates. REIT dividends from Realty Income are characterized as ordinary income. JEPI’s covered-call premium income flows through as non-qualified. AT&T’s distribution is treated as ordinary income for many holders.
Even qualified payers like Altria, with a $1.06 quarterly dividend, and AbbVie at $1.73 per quarter, generate enough yield that the tax drag in a taxable account is meaningful.
The Compounding Cost Most Readers Miss
The Roth advantage compounds well beyond the annual delta. Reinvest the $14,400 tax savings each year at a conservative 5% 10-year Treasury yield and the gap widens with every passing year. Over 20 years of reinvestment, the same basket inside a Roth versus a taxable account at the 24% bracket produces a six-figure income gap, with no stock price appreciation assumed. That is the permanent cost of wrong-account placement.
Risks and Caveats
- BDC distributions vary with credit cycles. Ares Capital’s Q1 2026 core EPS of $0.47 came in just below its $0.48 dividend, though $0.15 per share in net realized gains brought total coverage well above the distribution. The gap between core EPS and the dividend is a trend worth monitoring as rates compress NII. Non-accruals rose to 2.1% in Q1 2026 from 1.8% at year-end 2025.
- EPD issues a K-1 with UBTI considerations inside an IRA depending on custodian and ownership levels.
- JEPI’s covered-call overlay caps upside in strong equity rallies.
- This is general education on placement of existing Roth dollars, not personal tax advice.
What to Do
- If you hold any BDC, REIT, or covered-call ETF in a taxable account, calculate the annual tax cost at your bracket before next April.
- Run the conversion math on ordinary-income payers first. They benefit more from Roth placement than qualified-dividend names.
- Model a phased Roth conversion starting with ARCC, MAIN, O, and JEPI before touching qualified payers.
The post The Dividend Stocks That Generate $60,000 Tax-Free Inside a Roth (And What They Cost You in a Taxable Account) appeared first on 24/7 Wall St..
]]>Replacing a real paycheck with dividends is the cleanest version of financial independence. The income target here is $65,000 per year, roughly the US median individual wage, and the question is whether a $650,000 portfolio can actually produce it. The honest answer up front: only by reaching past pure blue chips into higher-yield categories. Here is what that looks like at three yield tiers, using verified current yields on real, named stocks.
The Core Math
Income target divided by yield equals capital required. To pull $65,000 a year:
- At a 3% blended yield, capital required is roughly $2.17 million.
- At a 6% blended yield, capital required is roughly $1.08 million.
- At a 10% blended yield, capital required is roughly $650,000.
The headline number only works at the aggressive end. That is the tradeoff the rest of this article makes concrete.
Conservative Tier: 2% to 3% Yield
These are the sleep-at-night anchors. Coca-Cola (NYSE:KO) yields 3% with a Q2 2026 dividend of $0.53 and a streak of consecutive annual raises stretching back decades. Johnson & Johnson (NYSE:JNJ) yields 2% after raising its quarterly to $1.34, its 64th consecutive year of increases. Procter & Gamble (NYSE:PG) yields 3% with payments that have continued for over 130 years. AbbVie (NYSE:ABBV) yields 3% with a recently raised $1.73 quarterly payout backed by 1.53x EPS coverage. Exxon Mobil (NYSE:XOM) yields 2% at a current dividend of $1.03 per quarter.
Filling a $650,000 portfolio with names like these produces a blended yield in the 3% range, generating roughly $19,500 a year. Quality and dividend growth compound over time, but the starting income is well below a real salary.
Moderate Tier: 4% to 6% Yield
Altria (NYSE:MO) yields 6% with 2026 EPS guidance of $5.56 to $5.72 against a $4.24 annualized payout. Verizon (NYSE:VZ) yields 6% after raising its quarterly to $0.7075. British American Tobacco (NYSE:BTI) yields 5%. AT&T (NYSE:T) yields 4% at a stable $1.11 annualized rate. Realty Income (NYSE:O) yields 5% and just declared its 114th consecutive quarterly increase and 670th consecutive monthly dividend. Enterprise Products Partners (NYSE:EPD) pays $0.55 quarterly ($2.20 annualized) after a 3% increase, with last quarter’s distribution covered by $2.7 billion of DCF.
This tier pushes the blended portfolio yield closer to 5% or 6%, but dividend growth here generally trails the conservative tier. EPD also issues a K-1, which complicates tax filing for many investors.
Aggressive Tier: 8% to 10% Yield
Main Street Capital (NYSE:MAIN) pays a monthly $0.26 plus a $0.30 quarterly supplemental, now its 19th consecutive. Ares Capital (NASDAQ:ARCC) yields 10% at a $0.48 quarterly rate, although Q1 2026 core EPS of $0.47 came in $0.01 short of the dividend for the first time recently.
A $650,000 portfolio loaded entirely into 8% to 10% yielders gets you to the $65,000 line. The cost is real: BDC dividends can be cut and the 10-year Treasury yielding 5% sets a competitive risk-free benchmark.
The Insight Most Readers Miss
A 3% yielder growing the dividend 8% a year roughly doubles the income in nine years. A 10% yielder with a frozen or shrinking payout may produce less income a decade out than the lower-yield blue chip that compounded quietly. KO has lifted its quarterly from $0.485 in 2024 to $0.53 in 2026. AT&T’s dividend has sat at $0.2775 per quarter since 2022. Same headline of “dividend payer,” very different futures.
What To Do
- Pull the live yield on each name before sizing positions. Yields move with price, and several of these stocks have rallied sharply (XOM is up 54% over one year).
- Model what a 25% cut from your highest-yield holding does to monthly income before building around it. ARCC’s $0.01 coverage shortfall is the kind of signal to watch.
- If you are within five years of needing this income, separate the K-1 filers (EPD) and non-qualified dividend payers (REITs, BDCs) from your taxable account plan.
A $650,000 dividend portfolio paying a real salary is possible. It just requires owning the tradeoffs as clearly as you own the shares.
The post The Dividend Stocks That Can Replace a $65,000 Income and What They’ll Cost You appeared first on 24/7 Wall St..
]]>NVIDIA (NASDAQ:NVDA) is the stock everyone is talking about, riding a $5.34 trillion market cap on the back of an AI capex wave that has lifted shares 62.77% over the past year.
The contrarian case against NVIDIA writes itself. The stock trades at a trailing P/E of 45 and a price-to-sales ratio of 25, levels that demand flawless execution from a company already guiding Q1 FY2027 revenue near $78 billion while explicitly excluding any China data center compute revenue. Management has flagged $95.2 billion in supply-related commitments and another $27 billion in multi-year cloud service agreements, locking in costs regardless of demand. Data Center now accounts for 91.5% of revenue, hyperscaler concentration sits near 50%, and starting next quarter NVIDIA folds stock-based comp into its non-GAAP results, muddying year-over-year comparability.
Prediction markets agree the easy money has been made. Polymarket traders assign just a 17% chance NVIDIA closes above $240 by week’s end and a 6.5% chance above $230 on earnings day. The crowd is pricing exhaustion, not a breakout. Semiconductor history is consistent on what follows extreme demand spikes: inventory normalization and supply gluts, and the kind of margin compression that humbles consensus darlings.
Now turn to AT&T (NYSE:T), the beaten-down high-yield leader the headlines have forgotten. Shares are down 6.96% over the past year, trading at $24.98 with a P/E of 8, forward P/E of 11, and a defensive beta of 0.42 against NVIDIA’s 2.24.
1. A retirement income story with real commitment
AT&T pays a $0.2775 quarterly dividend, $1.11 annualized, held steady for 18 consecutive quarters and explicitly committed through 2028. That equates to a 4.62% yield. CEO John Stankey is backing it with roughly $8 billion in 2026 share buybacks and a $45 billion-plus total shareholder return plan through 2028. That is exactly what a retirement portfolio needs.
2. Operational momentum the market is mispricing
Q1 2026 brought adjusted EPS of $0.57, up 11.8% year over year, revenue of $31.51 billion, and 584,000 internet net adds. Advanced home internet revenue grew 27.3%, and nearly 45% of those subscribers also carry AT&T wireless. The Lumen Mass Markets fiber acquisition closed February 2, 2026, and fiber now reaches over 37 million locations. Stankey called it “our best first quarter ever for Advanced Connectivity internet customer net additions.”
3. Visible cash flow growth and unified insider buying
Free cash flow is guided at $18 billion-plus in 2026, $19 billion-plus in 2027, and $21 billion-plus by 2028, underpinning a double-digit adjusted EPS CAGR through 2028. On April 30, 2026, CEO Stankey, CFO Pascal Desroches, COO Jeff McElfresh, and 11 directors bought shares together at $26.13. Desroches alone added 121,297 shares in March at $28.99. That is unified C-suite conviction with personal capital on the line.
Wall Street is positioned the wrong way around: 15 of 25 covering analysts rate AT&T a Buy or Strong Buy with an average target of $30.37, while NVIDIA is universally owned and priced for an AI cycle that never deflates. For patient retirement investors, AT&T looks attractively positioned while the crowd is still distracted by the headline ticker.
The post Forget Nvidia: This Beaten-Down High-Yield Leader Is a Far Smarter Buy for Patient Investors appeared first on 24/7 Wall St..
]]>With Treasury yields sliding and the broader market trading near record highs, retail investors hunting for reliable passive income are getting squeezed. That makes brand-name dividend payers trading under $40 a share unusually interesting right now: you get household-name stability, room to compound shares, and yields that comfortably top what a savings account is paying. A $5,000 starter position in each of the three names below puts roughly $15,000 to work and turns into a meaningful quarterly paycheck.
With that in mind, here are three blue-chip dividend stocks trading under $40 that income investors should have on their radar today.
AT&T (NYSE: T)
AT&T (NYSE:T) is the converged telecom giant pairing nationwide 5G wireless with one of the fastest-growing fiber footprints in the country. At $24.98, a $5,000 allocation buys roughly 200 shares, an accessible entry point for almost any retail portfolio.
The fundamentals back up the income thesis. Q1 2026 adjusted EPS came in at $0.57, up 11.8% year over year, on revenue of $31.51 billion, while management guided 2026 adjusted EPS to $2.25 to $2.35 with free cash flow above $18 billion. The quarterly dividend sits at $0.2775, or $1.11 annualized, a payout AT&T has held steady for eight straight quarters and has committed to maintain through 2028. That works out to roughly a roughly 4.4% yield, or about about $222 a year on a $5,000 stake.
The bull case is simple: 584,000 fiber net adds in Q1, a path to 60 million fiber locations by 2030, and $8 billion in buybacks planned for 2026. The clear risk is the balance sheet: $138.4 billion in total debt and net debt/EBITDA of 2.71x leave little margin for error. For income investors who can stomach that, AT&T remains a credible long-duration paycheck.
Kinder Morgan (NYSE: KMI)
Kinder Morgan (NYSE:KMI) operates the largest natural gas pipeline network in the United States, a toll-road business model that throws off remarkably steady cash. Shares trade at $34.31, up 27.2% year to date, so a $5,000 stake gets you roughly 145 shares.
Q4 2025 adjusted EPS of $0.39 beat the $0.37 consensus, capping a year of 12.4% revenue growth and a 17% jump in net income. Management is guiding 2026 adjusted EPS to $1.36 and just raised the dividend target to $1.19 per share, a 2% bump. At the current price that is roughly a roughly 3.4% yield, or about about $170 a year on $5,000.
The bull case is structural. Kinder Morgan touches roughly 70% of the markets driving future data-center power demand, carries a $10 billion project backlog, and just earned an S&P upgrade to BBB+ in January 2026. The risk is leverage of 3.8x net debt to EBITDA and permit timing on new builds. For investors who want infrastructure-grade dividend income tied to the AI power buildout, KMI fits the bill.
KeyCorp (NYSE: KEY)
KeyCorp (NYSE:KEY) is the Cleveland-based regional bank behind KeyBank and KeyBanc Capital Markets. At $20.92, a $5,000 investment buys roughly 239 shares, the largest share count of the three.
Q1 2026 EPS of $0.44 beat the $0.41 estimate and grew 33% year over year, with net interest margin expanding 29 basis points to 2.87%. Tangible book value per share rose 18% YoY to $13.77, and management is targeting $1.30 billion or more in buybacks for 2026. The $0.205 quarterly dividend, or $0.82 annualized, yields about roughly 3.9%, generating roughly roughly $196 a year on $5,000.
The bull case is leverage to a steeper yield curve, with KeyCorp guiding 2026 revenue up around 7% and net interest income up 9% to 10%. The risk is credit: nonperforming assets ticked up to 63 basis points from 59, and consumer loan balances are still shrinking. For investors comfortable owning a regional bank, KeyCorp offers a strong yield plus capital return.
Each of these names carries real business risk, and a high yield can mask balance-sheet stress if you do not look closely. Use this list as a starting point for your own research into payout coverage, debt loads, and sector outlook before putting $5,000 to work.
The post Want Super Safe Dividend Income? Invest $5k Into These 3 Under $40 Stocks appeared first on 24/7 Wall St..
]]>Leaving behind a $135,000 senior software engineer salary at age 52 may sound straightforward until the income-replacement math becomes real. Because most retirement accounts remain difficult or costly to access before age 59½, the burden shifts heavily toward taxable brokerage assets. That constraint changes both the structure of the portfolio and the amount of capital required to make early retirement sustainable.
The core equation is simple but demanding: target income divided by portfolio yield equals the capital needed to generate that income. The chosen yield level dramatically affects the outcome. A conservative portfolio yielding around 3.5% may require more than $3.8 million to replace a $135,000 salary, while a higher-yield strategy near 12% could reduce the required capital closer to $1.1 million. Those differences come with substantial tradeoffs in growth potential, principal stability, dividend durability, and long-term purchasing power.
The Conservative Math: 3% to 4% Yields
At a 3.5% blended yield typical of broad dividend-equity funds, $135,000 in annual income requires roughly $3.86 million in capital. At 4%, it drops to $3.38 million. That is the price of safety.
Funds in this tier, Schwab U.S. Dividend Equity ETF (NYSEARCA:SCHD) being the archetype, lean on diversified large-cap dividend growers. SCHD charges a 0.06% expense ratio and holds names like Bristol-Myers Squibb, Merck, Chevron, and Verizon. The fund has returned 237% over the past decade, which is the conservative tier’s real argument: lower current yield, but the principal grows and the distribution grows with it.
The catch at 52? You need almost $4 million sitting in a taxable account. Most FAANG engineers, even after a decade of vesting, are not there.
The Moderate Math: 5% to 7% Yields
This is where the realistic plan lives. At 5.5% sustainable yield, $135,000 needs roughly $2.45 million in taxable assets. At 6%, about $2,250,000. At 7%, roughly $1,928,571.
Three real-world anchors sit in this band:
- Realty Income (NYSE:O), the monthly-dividend REIT, currently yields 5.2% at around $62. It has paid 670 consecutive monthly dividends and just raised for the 114th straight quarter, with $0.2705 in April 2026 up from $0.264 a year earlier.
- Verizon (NYSE:VZ) yields 6.0% at roughly $47, with quarterly payments lifted to $0.7075 in Q2 2026. It trades at 11x earnings, with a defensible cash flow profile.
- AT&T (NYSE:T) yields 4.6% at roughly $25, paying $0.2775 quarterly. The dividend has been flat for eight quarters following the 2022 cut from $0.52, a reminder that high telecom yield can coexist with stagnant dividend growth.
A blended 5.5% portfolio (roughly 30% dividend-growth ETFs, 25% broad dividend equity, 15% Realty Income, 15% covered-call income fund, 15% telecom blend) produces the $135,000 target on $2.45 million. After qualified-dividend tax of 15% to 20%, the net lands near $115,000, which is likely more than this engineer’s actual post-tax take-home today.
The Aggressive Math: 8% to 12% Yields
At 8%, the requirement falls to about $1.69 million. At 10%, $1.35 million. At 12%, just $1.13 million. The vehicles here are covered-call ETFs, business development companies, mortgage REITs, and high-yield credit funds.
Two problems stack at 52. First, most covered-call distributions are ordinary income, not qualified, which wrecks the tax math in a taxable account. Second, double-digit yields without dividend growth lose ground to inflation across a 30-year horizon. With the 10-year Treasury at 4.6%, a 12% yield is paying you roughly 7 points of compensation for credit, prepayment, and principal-erosion risk.
The Compounding Trap Most People Miss
A 3.5% yield growing at 8% annually can double its income stream in roughly nine years. By contrast, a flat 10% yield may maintain its payout rate for a time, but the underlying principal often declines over the long run. Over the 13 years between age 52 and a traditional retirement age of 65, a lower-yield portfolio with consistent dividend growth can ultimately produce more cumulative income while preserving far more capital.
Realty Income offers a good example of the middle-ground approach. Its dividend growth rate has averaged roughly 2.9% annually on top of a starting yield above 5%. That combination may appear less exciting than double-digit yields at first glance, but the gradual growth compounds over time and can materially strengthen long-term income durability.
Three Things to Do Before You Quit
- Pull your actual annual spending, not your $135,000 gross. After payroll taxes, 401(k) contributions, and commuting, the replacement number is often $90K to $105K.
- Run a 10-year total-return comparison between a dividend-growth ETF and a 10% covered-call fund. Reinvest distributions in both. The chart usually settles the debate.
- Model the 0% long-term capital gains bracket up to $48,350 for single filers in 2026 and the 15% bracket above it. Qualified-dividend treatment can mean keeping nearly all of the moderate-tier income; a tool like SmartAsset’s calculator gets you a quick estimate before you talk to a CPA.
The Real Goal Is Staying Retired
The seductive part of high-yield investing is how quickly the required capital falls. At 12%, the dream suddenly looks reachable. But early retirement at 52 is not about producing income for one good year. It is about building an income stream durable enough to survive recessions, inflation, dividend cuts, and another three decades of life.
That reality pushes most sustainable plans toward the middle. Moderate-yield portfolios may require more upfront capital, but they usually offer a healthier balance between current income, dividend growth, tax efficiency, and principal preservation. A portfolio that grows its income slowly over time often ends up providing more financial security than one chasing the highest payout available today. The real challenge is not escaping work. It is constructing a portfolio that still works long after the excitement of leaving fades.
The post How Much Do You Really Need Invested to Replace a $135,000 Tech Salary Without Touching Principal at 52? appeared first on 24/7 Wall St..
]]>AT&T (NYSE:T) and Verizon Communications (NYSE:VZ) both posted 2.9% revenue growth in Q1 2026, yet the businesses behind those identical top lines look very different.
AT&T is digesting the Lumen fiber acquisition that closed in early February 2026, while Verizon is now run by Daniel Schulman and absorbing Frontier, which closed January 20, 2026. Two convergence stories, two very different execution styles.
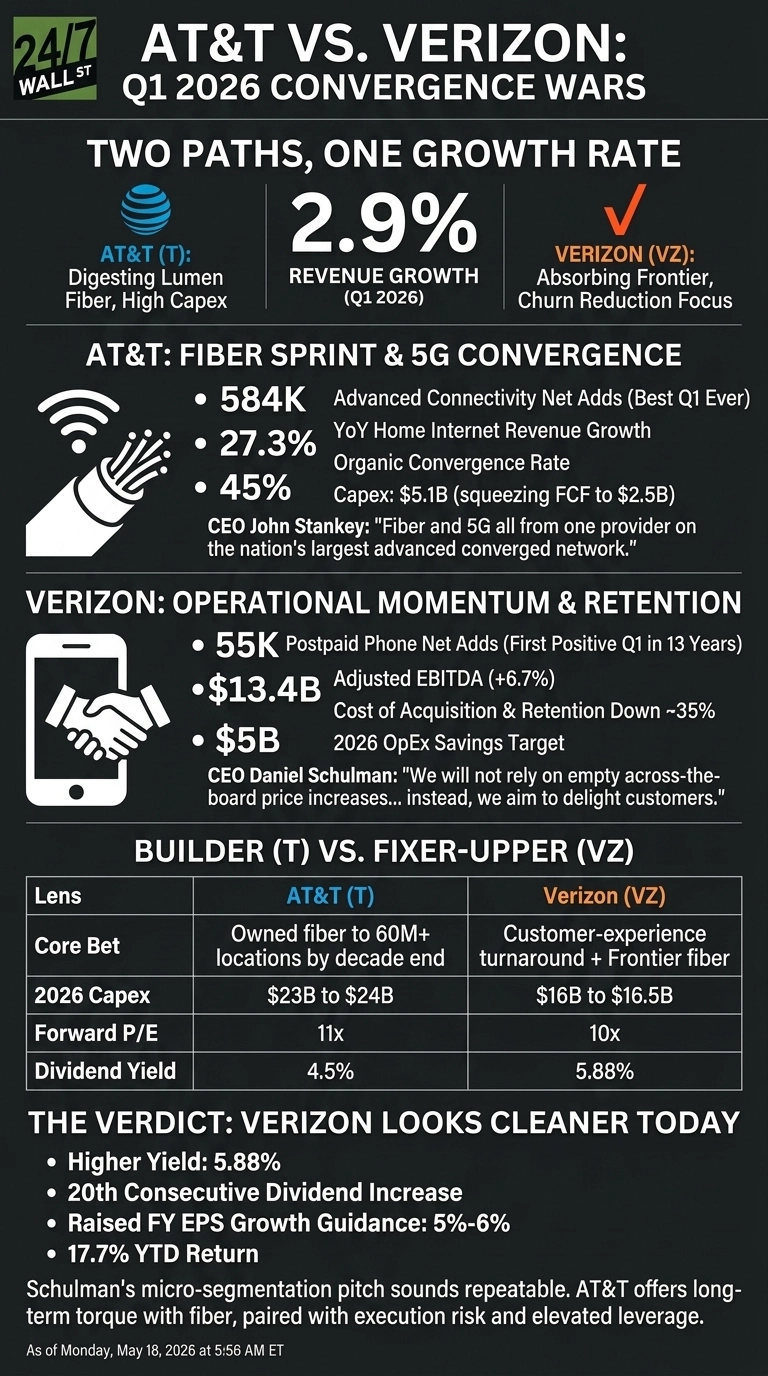
Fiber Sprints for AT&T, Phones Finally Click for Verizon
AT&T leaned hard on broadband. The quarter brought 584,000 advanced connectivity net adds, the company’s best Q1 ever, with advanced home internet revenue up 27.3% year over year. Adjusted EPS landed at $0.57, up nearly 12%, on revenue of $31.51B.
CEO John Stankey framed the strategy plainly: “fiber and 5G all from one provider on the nation’s largest advanced converged network.” The catch is capex. AT&T spent $5.1 billion in the quarter, squeezing free cash flow to $2.5 billion.
Verizon’s headline was retention. Postpaid phone net adds came in at 55,000, the first positive Q1 in 13 years, and adjusted EBITDA hit $13.4 billion, up 6.7%. Adjusted EPS of $1.28 beat the $1.21 consensus by 5.8%.
Schulman is unapologetic about the new tone: “We will not rely on empty across-the-board price increases that create short-term financial gains that erode the long-term trust of our customers.” Management raised full-year EPS growth guidance to 5% to 6%.
Builder vs. Fixer-Upper
| Lens | AT&T | Verizon |
| Core Bet | Owned fiber to 60M+ locations by decade end | Customer-experience turnaround plus Frontier fiber |
| 2026 CapEx | $23B to $24B | $16B to $16.5B |
| Forward P/E | 11x | 10x |
| Dividend Yield | 4.5% | 5.88% |
Stankey is pouring capital into the ground. Verizon is pouring it into churn reduction. Schulman cited cost of acquisition and retention down roughly 35% since December, with consumer postpaid churn at 0.90% and trending lower.
AT&T’s organic convergence rate of 45% is the more structural metric, but the EchoStar spectrum deal will push net debt to EBITDA to roughly 3.2x before settling.
The Next Test Is Cash Flow
I will be watching whether AT&T can hold its $18B+ free cash flow guide while funding fiber and integrating Lumen. The Q1 FCF dip is explainable, but investors are clearly nervous. The stock fell 4.5% last week, with Stankey’s May 19 J.P. Morgan conference appearance looming as a credibility checkpoint.
For Verizon, the watchpoint is whether the $5 billion 2026 OpEx savings target actually flows through, and whether the Frontier integration produces the promised $1 billion+ run-rate synergies by 2028.
Where Verizon’s Story Looks Cleaner Right Now
Between these two, Verizon’s setup looks cleaner today. The 5.88% yield, 20th consecutive dividend increase, raised EPS guide, and 17.7% YTD return tell a coherent story of operational momentum at a cheap multiple. Schulman’s micro-segmentation pitch sounds repeatable in a way that promotional carpet-bombing never was.
AT&T may offer more long-term torque if the fiber math works out, and the 8x trailing P/E bakes in real skepticism. AT&T offers more long-term torque if the fiber math works out, paired with execution risk and elevated leverage. Verizon’s quarter, by contrast, was operationally cleaner with fewer surprises.
The post AT&T vs Verizon. One of These Telecoms Has Raised Its Dividend 20 Straight Times and the Market Is Finally Noticing appeared first on 24/7 Wall St..
]]>With markets at elevated multiples in May 2026, low share prices can mislead investors into thinking quality is out of reach. Stocks trading below $30 with strong balance sheets offer income, deleveraging stories, or growth at valuations that build in a margin of safety.
Here are five stocks trading under $30 that pair solid books with a credible upside case.
Pfizer (NYSE: PFE)
Pfizer (NYSE:PFE) is a global biopharma whose portfolio spans immunology, oncology, cardiology, and vaccines, anchored by Eliquis, Prevnar, and the Comirnaty/Paxlovid COVID franchise.
Shares last traded at $25.33, below the 52-week high of $28.28, with a 6.68% dividend yield and a forward P/E of 9x. Q4 2025 adjusted EPS of $0.66 beat the $0.57 estimate, and the consensus analyst target sits at $29.19.
The bull case rests on 9% operational lift in the non-COVID portfolio, the Metsera-driven obesity pipeline, and insider conviction: CEO Albert Bourla and 11 directors acquired phantom stock units at $26.67 on April 23, 2026.
Key risk is a $1.5B revenue headwind from 2026 loss of exclusivity combined with MFN drug pricing pressure. The yield-supported setup has management backing the thesis.
AT&T (NYSE: T)
AT&T (NYSE:T) is the second-largest US wireless carrier, pairing 5G with a rapidly expanding fiber footprint.
At $24.43, shares carry a forward P/E of 11x and a 4.5% dividend yield. Q1 2026 adjusted EPS came in at $0.57 (+11.8% YoY) on revenue of $31.51B. Analyst target: $30.37.
The bull case is execution and cash. AT&T added 584,000 internet customers in Q1 2026, plans $45B in shareholder returns through 2028, and lifted cash to $18.2B at year-end 2025 from $3.3B a year earlier.
Risks include total debt of $173.99B and legacy wireline declines exceeding 20% in 2026. Converged connectivity plus growing free cash flow makes the dividend durable.
SoFi Technologies (NASDAQ: SOFI)
SoFi Technologies (NASDAQ:SOFI) is a digital financial services company holding a national bank charter and the Galileo technology platform.
At $15.71, shares are down 39.99% YTD, even after Q1 2026 produced net income of $166.7M (+134% YoY) and record originations of $12.18B (+68% YoY). Forward P/E is 26x; analyst target $21.10.
The bull case: shareholder equity reached $10.81B while total debt fell from $3.2B to $1.8B over the prior year. CEO Anthony Noto bought 15,545 shares at $16.00 on May 11, 2026 after purchasing 56,000 shares at $17.88 on March 2, 2026.
Risks include personal loan charge-offs at 3.03% and a 27% decline in Technology Platform revenue after a large client departure. The pullback has reset expectations into the growth runway.
Kinross Gold (NYSE: KGC)
Kinross Gold (NYSE:KGC) operates gold mines across the US, Brazil, Chile, and Mauritania.
Shares slipped under $30 to $28.51 after an 18.4% one-month pullback, even as the stock remains up 109.22% over one year. Forward P/E sits at 11x against an analyst target of $40.55. Q1 2026 adjusted EPS hit $0.71 on revenue of $2.41B (+61% YoY), with free cash flow of $837.5M.
The balance sheet is pristine: $2.19B in cash against only $3.66B in total liabilities, plus record 2025 FCF of $2.47B and $255.1M of Q1 buybacks.
Primary risk is gold price volatility and geopolitical exposure. The recent pullback creates a window for investors seeking operating leverage to bullion.
KeyCorp (NYSE: KEY)
KeyCorp (NYSE:KEY) is a Cleveland-based regional bank serving consumer and commercial clients alongside KeyBanc Capital Markets.
At $21.07, KEY trades at a forward P/E of 12x with a 3.89% dividend yield. Q1 2026 EPS of $0.44 beat the $0.4073 estimate, NIM expanded 29 basis points YoY to 2.87%, and ROTCE topped 13%. Analyst target: $24.97.
Management raised 2026 net interest income guidance to 9-10%, plans $1.3B+ in buybacks, and targets 15%+ ROTCE by year-end 2027.
Watch item: nonperforming assets ticked up to 63 bps from 59 bps. A rising-margin franchise returning capital at scale supports the thesis here.
Bottom Line
A share price below $30 is no substitute for diligence. Each name carries identifiable risks alongside balance sheet strengths. Investors should size positions to their risk tolerance and verify the latest disclosures before acting.
The post The SoFi CEO Just Bought 70,000 Shares With His Own Money. Here Are Four More Under $30 Worth a Closer Look appeared first on 24/7 Wall St..
]]>The Pacer US Cash Cows 100 ETF (NYSEARCA:COWZ) and the Fundstrat Granny Shots US Large Cap ETF (NYSEARCA:GRNY) sit on opposite ends of how quality gets defined in a large-cap portfolio. COWZ ranks the Russell 1000 by free cash flow yield and takes the top 100 names, a rules-based screen with no human override. GRNY is Tom Lee’s actively managed expression of stocks that show up in multiple Fundstrat thematic baskets, a conviction screen built on analyst overlap. The strategies should produce sharply different portfolios. The trailing 12-month returns show why they have not.
What each fund is actually betting on
COWZ buys companies whose current cash generation looks cheap relative to enterprise value. That bet leans into mature, capital-returning businesses. The fund’s top sector weights are Health Care at 22.01%, Information Technology at 18.47%, and Energy at 16.06%, with ConocoPhillips at a 2.25% top position and Qualcomm at 1.99%. Pfizer, AT&T, Verizon, and Altria round out the cash-rich roster.
GRNY bets that stocks sitting at the intersection of several long-duration themes (AI, electrification, energy security, millennial spending) will compound faster than the index. That tilts the portfolio toward names like NVIDIA and GE Vernova, which would never clear a strict FCF-yield screen. NVIDIA trades at a trailing PE of 46; GE Vernova at a trailing PE of 31.
Where the difference shows up, and where it doesn’t
Over the past year, GRNY returned 29.35% versus COWZ at 17.84%, with the S&P 500 at 26.49%. ConocoPhillips is up 27.29% YTD, Qualcomm up 25.43% YTD, and GE Vernova up 62.8% YTD. Qualcomm shows up in both funds. The cash-flow screen and the conviction screen are arriving at some of the same names through different doors, which is why the divergence is narrower than the methodologies suggest.
The March 2026 volatility spike (VIX peaked at 31.05 on March 27) favored GRNY’s thematic conviction. The current VIX of 17.99 and elevated 10-year Treasury at 4.46% normally favor COWZ-style near-term cash.
The practical comparison
| Factor | COWZ | GRNY |
|---|---|---|
| Expense ratio | 0.49% | Not disclosed in fund snapshot |
| Inception | December 16, 2016 | November 2024 |
| Construction | Rules-based FCF yield rank | Active thematic overlap |
| Dividend yield | 1.7% | Negligible |
| 1-year return | 17.84% | 29.35% |
The verdict
COWZ fits an investor who wants a transparent, low-turnover way to own the cheapest cash generators in the Russell 1000 and is willing to underweight the AI complex to get it. GRNY fits an investor who trusts active thematic conviction and wants exposure to NVIDIA and GE Vernova that an FCF screen will never buy at current valuations. If oil holds above $100 and rates stay near 4.5%, COWZ catches up quickly. If AI capex and electrification orders keep compounding, GRNY keeps its lead.
The post GRNY Beat COWZ by 11 Points This Year. Oil Prices and Interest Rates Will Decide Who Wins Next appeared first on 24/7 Wall St..
]]>CounterPoint, the well-regarded electronics research firm, shows that, study after study, in China, the US, and globally, sales of the iPhone continue to outpace those of all competitors. The most recent data comes from a survey of smartphone buyers from the major wireless carriers.
The carriers include Verizon (NYSE: VZ), AT&T (NYSE: T), and T-Mobile. It is based on CounterPoint’s US Monthly Smartphone Channel Share Tracker. The figures cover the first quarter of the year.
Apple’s (NASDAQ: AAPL) share of sales among the “Big Three” was 75% in the first quarter of this year, compared with 72% for the same period a year ago. Any competition of consequence came from Samsung, which launched its Galaxy S26 late in the quarter, and Motorola.
This news is particularly bad for Google. It has hoped its Android OS would best the iOS that runs the iPhone. In some countries around the world, Android does well, but not in the US. Counterpoint pointed out that “Apple’s share of volume grew by 4% YoY, as Android device sales declined 14.4% YoY.” The late introduction of the Galaxy S26 would not have helped the Android figures.
Ultimately, however, the figures show the extent to which Apple’s lead cannot be dented. This is important to its earnings. In the quarter that ended March 28, iPhone sales in the “Americas” rose to $45.1 billion from $40.3 billion in the same quarter the year before. And “Americas” sales are 41% of the iPhone total.
Less than a year ago, there was anxiety among investors that the launch of the iPhone 17 without advanced AI features would undermine success. That did not happen, even though the situation persisted through early 2026 and will continue until after mid-year. At that point, Apple will team up with Google to upgrade Apple Intelligence and Siri. Apple will have dodged the massive costs to get an edge in AI data centers.
So far, the market has cheered Apple’s decision on AI. Its shares recently hit an all-time high. Yahoo reported yesterday that “Apple stock closed at a record high on Wednesday as tech stocks rebounded from a sell-off the previous day.” At $300, it is up 40% in the last year, compared to 27% for the S&P. That makes it the third most valuable company in the world with a market cap of $4.4 billion. And most of that run-up is on the back of the success of the iPhone.
The post Apple iPhone Sales Appear Unstoppable appeared first on 24/7 Wall St..
]]>AST SpaceMobile (NASDAQ:ASTS) has been continuously surging. A satellite unfolds in orbit, a regulator signs off, a carrier signs a contract, and investors keep going back to the buy button. The stock has handed a 161% gain over the last year and the position still feels early, which is evidence that the market has not finished pricing in what this company is building.
ASTS stock is down significantly from its peak, but the momentum is there and it has recovered in earnest from every downturn in the past.
What the company is building
A cell tower floating in low Earth orbit that talks directly to the phone in your pocket. It works without a satellite phone or a special antenna. The phone you bought from Verizon (NYSE:VZ), working in the middle of nowhere, at broadband speeds. If that vision compiles into reality, the addressable market is the roughly 5 billion mobile subscribers globally who live with connectivity gaps. The partner roster reads like the global carrier rolodex, with over 50 mobile network operators representing nearly 3 billion subscribers, including Verizon, AT&T (NYSE:T), Vodafone, Rakuten, Orange, Telefonica, and stc Group.
The contracted backlog is already in the door
AST SpaceMobile has $1.2 billion in aggregate contracted partner commitments, a $175 million prepayment already in the door from stc Group on a 10-year regional agreement, eight U.S. Government contracts including a prime position on the Missile Defense Agency SHIELD Program and a $30 million Space Development Agency prime contract.
Moreover, Q4 2025 revenue came in at $54.30 million, a 28.56% beat against the $42,241,500 consensus, with year-over-year growth of 2,731.3%. That is the first quarter where the income statement started looking like a real business.
The moat is the spectrum and the carriers
The second reason is the moat, which lives in spectrum and carrier contracts rather than in the satellites themselves. AST holds 1,150 MHz of low and mid-band tunable MNO spectrum globally, 45 MHz of MSS mid-band in North America, and 60 MHz of S-band priority rights globally, sitting behind over 3,700 patent and patent pending claims. Manufacturing footprint now sits above 500,000 square feet across multiple sites at 95% vertical integration. Competitors can launch satellites. Recreating the global spectrum portfolio and the definitive carrier deals is the part that does not bend to capital.
The balance sheet pays for the plan
The third reason is the balance sheet. Cash and equivalents ended Q4 at $2.34 billion, and pro forma liquidity after the $1.07 billion convertible notes offering exceeds $3.9 billion. Capital expenditures hit $1.06 billion in the quarter. The plan is 45 to 60 satellites in orbit by year-end 2026 at a launch cadence of every one to two months. They have the money to do that.

The risk I am willing to underwrite
FY2025 net loss came in at $341.94 million. Q2 2025 revenue missed by 95.29%, Q3 missed by 33.13%, and BlueBird 7 was placed into a lower-than-planned orbit in April. Hiroshi Mikitani, a 10% owner, disposed of 3,040,000 shares across two days in April at $86.22 and $91.42. The stock has put together five 40-55% drawdowns since January 2025. Every one of those reservations is fair. The thesis still holds because space-based reliable internet connections to unmodified phones is a utility once it works, and the company that controls the spectrum and the carrier deals captures it. Mikitani trimming at $90 does not unspectrum the company.
Why the buy button stays active
AT&T and Verizon trade like mature utilities because they sell connectivity where copper and fiber already run. AST is selling connectivity where neither does, to the same phones, through the same carriers, on premium global spectrum it already controls. At a market cap of roughly $27.8 billion against carriers measured in hundreds of billions, the math for a 5x outcome is a plausible re-rating.
The post Easy 5X? AST Spacemobile Could Be Bigger Than Verizon and AT&T appeared first on 24/7 Wall St..
]]>Two Aristocrats That Stumbled Off the Pedestal
For decades, AT&T (NYSE: T) and 3M (NYSE: MMM) were the kind of stocks retirees built portfolios around. Both raised dividends every year for decades. Both lost their crowns through messy corporate breakups.
AT&T’s media detour ended badly. After buying DirecTV and Time Warner, the company spun WarnerMedia into Warner Bros. Discovery in April 2022 and cut the quarterly dividend from $0.52 to $0.2775, a 46.6% reduction. CEO John Stankey has since refocused AT&T on converged 5G and fiber, closing the Lumen Mass Markets fiber acquisition in February 2026.
3M’s fall was slower and more painful. Mounting liabilities from Combat Arms Earplugs lawsuits and PFAS “forever chemicals” dragged the stock down for years. The April 2024 spin-off of healthcare unit Solventum brought a dividend reset and ended one of the longest aristocrat streaks on record. New CEO William Brown’s 3M eXcellence turnaround has produced four straight EPS beats.
What $1,000 Actually Became
AT&T Total Return
| Horizon | Ending Value | Total Return | S&P 500 |
|---|---|---|---|
| 1 Year | $998 | −0.23% | $1,292 (29.20%) |
| 5 Year | $1,477 | 47.65% | $1,694 (69.43%) |
| 10 Year | $1,598 | 59.76% | $3,449 (244.93%) |
Price-adjusted return. Includes the WarnerMedia spin distribution.
3M Total Return
| Horizon | Ending Value | Total Return | S&P 500 |
|---|---|---|---|
| 1 Year | $1,079 | 7.85% | $1,292 (29.20%) |
| 5 Year | $1,042 | 4.18% | $1,694 (69.43%) |
| 10 Year | $1,435 | 43.53% | $3,449 (244.93%) |
Price-adjusted return. Includes the Solventum distribution.
Both stocks underperformed the S&P 500 dramatically over a decade. Reinvested dividends would meaningfully improve AT&T’s tally given its long stretch as a high-yielder, but neither comes close to the index. Holding through the 2018 to 2023 grind required patience most investors do not have.
What to Do Today
Putting $1,000 into AT&T today would be the choice for income and stability. The Q1 2026 earnings report — $31.51 billion in revenue and $0.57 adjusted EPS — plus the $45 billion shareholder return commitment through 2028 and a 4.24% yield at an 8 P/E, make this a credible cash-return story. Investors may want to avoid it if rising leverage from the $23 billion EchoStar spectrum deal pushes net debt past management’s comfort zone.
3M looks attractive for investors who trust Brown’s margin expansion, with 2026 guidance of $8.50 to $8.70 adjusted EPS, and PFAS manufacturing finally exited. The residual $10.3 billion PFAS settlement obligations and the risk that Combat Arms tail liabilities turn into fresh charges would be reasons for investors to step away.
The verdict: AT&T’s risk/reward looks tighter and more visible. 3M is the higher-variance bet on an industrial turnaround that is working but not finished. Neither owes long-term holders a comeback, and that is the lesson. Aristocrat status describes the past.
The post A $1,000 Investment in These Former Dividend Aristocrats 10 Years Ago Is Worth How Much Today? appeared first on 24/7 Wall St..
]]>Dividend income keeps flowing whether you are working, sleeping, or on vacation. For investors building a portfolio that pays whether the market is open or closed, high-yield equities offer instant liquidity and zero operational headaches that rental property and private credit cannot match.
With the 10-year Treasury yielding 4.31%, the bar for risk assets in an income portfolio has risen. The five blue-chip dividend payers below all clear that bar, with three clearing it by a wide margin. Each has paid uninterrupted dividends for decades through recessions, rate shocks, and inflation cycles, the consistency income investors demand.
We screened our 24/7 Wall St. dividend equity research database for stocks that pay massive dividends. Combined, these five companies can generate over $2,000 a year in passive annual income on a $10,000 investment in each stock at current prices.

Coca-Cola
- Yield: 2.66%
- Shares for $10,000: 132.56
- Annual Passive Income: $266
Coca-Cola (NYSE:KO) sells concentrate and finished beverages globally under Coca-Cola, Sprite, Fanta, smartwater, BODYARMOR, Powerade, Costa, and fairlife. Shares trade at $75.44, up 8.65% year-to-date, with a trailing P/E near 25.
KO
KO raised its quarterly payout to $0.53 in Q1 2026, marking the 63rd consecutive annual increase and cementing Dividend King status. Full-year 2025 dividends totaled $8.8 billion. Institutions own 66.6% of shares, with Berkshire Hathaway, Vanguard, and BlackRock among the largest holders.
Procter & Gamble
- Yield: 2.85%
- Shares for $10,000: 67.39
- Annual Passive Income: $285
P&G (NYSE:PG) owns Tide, Pampers, Gillette, Crest, Olay, and Charmin across consumer staples. Fiscal Q3 2026 revenue rose 7.4% year-over-year, with management planning roughly $10 billion in dividends and $5 billion in buybacks for FY26.
PG raised its quarterly dividend to $1.088 with the April 24, 2026 ex-date, extending the 70th consecutive annual increase and the longest U.S. payment streak at 136 years since 1890.
AT&T
- Yield: 4.17%
- Shares for $10,000: 391.85
- Annual Passive Income: $417
AT&T (NYSE:T) operates Mobility, Consumer Wireline, and Business Wireline. Q1 2026 revenue hit $31.51 billion with adjusted EPS of $0.57, up 11.8% year-over-year. The Lumen Mass Markets fiber acquisition closed in February 2026, pushing total reach above 37 million fiber locations.
The dividend reset to $0.2775 per quarter after the WarnerMedia spinoff and has held flat for 17 straight quarters. 2026 free cash flow is guided to $18 billion+ against roughly $4.4 billion in dividend obligations, with another $8 billion earmarked for buybacks.
Verizon
- Yield: 5.79%
- Shares for $10,000: 212.31
- Annual Passive Income: $579
Verizon (NYSE:VZ) offers income investors a yield that meaningfully exceeds Treasuries. Shares trade at roughly 9 times forward earnings, reflecting capital intensity and market skepticism on wireless growth. The Q1 2026 dividend stepped up to $0.7075, the latest in an unbroken quarterly streak spanning over two decades.
Capital-intensive telecoms generate mature, predictable cash flow supporting above-average payout ratios. Verizon delivered $19.8 billion in 2024 free cash flow and guided 2025 FCF to $17.5 billion to $18.5 billion as Frontier integration begins.
Altria
- Yield: 6.20%
- Shares for $10,000: 151.52
- Annual Passive Income: $620
Altria (NYSE:MO) sells Marlboro, Black & Mild, Copenhagen, Skoal, on!, and NJOY. Cigarette volumes fell 10% for full-year 2025, but pricing power and a 64.4% smokeable margin offset unit declines. Q4 2025 revenue rose 29.4% to $5.85 billion.
Tobacco generates excess cash with limited reinvestment runway in a shrinking primary market, so management routes nearly all of it back to shareholders. Altria raised the quarterly dividend to $1.06 in Q1 2026, the 60th increase in 56 years.
Full-year 2025 dividends paid totaled $7 billion, with another $1 billion remaining on the buyback authorization through year-end 2026.
The Bottom Line
Combined, these five positions generate $2,167 in annual passive income on a $50,000 investment, a blended yield of 4.33%. Altria contributes $620, Verizon adds $579, AT&T delivers $417, P&G generates $285, and Coca-Cola rounds out the portfolio with $266.
| Ticker | Annual Income | Share of Portfolio Income |
|---|---|---|
| MO | $620 | 28.6% |
| VZ | $579 | 26.7% |
| T | $417 | 19.2% |
| PG | $285 | 13.2% |
| KO | $266 | 12.3% |
Reinvesting quarterly checks compounds position size automatically. The underlying companies have lifted payouts through nearly every economic environment of the past half-century. That combination of intraday liquidity and durable cash flow separates a dividend portfolio from every other passive income vehicle on the market.
The post Stocks That Pay You While You Sleep appeared first on 24/7 Wall St..
]]>Market volatility has rattled portfolios in 2026, with broad equity indexes absorbing sharp swings tied to tariff uncertainty and shifting rate expectations. For investors who have watched their growth positions whipsaw, the appeal of dividend income has never been sharper. A stock that pays you $1,200 a year does so whether the market is up or down, and that cash hits your account on a schedule you can plan around.
The challenge is finding yield that is both meaningful and durable. Treasury yields remain competitive, but dividend stocks offer something bonds cannot: the potential for price appreciation alongside the income stream. And unlike rental real estate, high-yield equities are liquid. You can exit a position in seconds, not months.
We screened our 24/7 Wall St. dividend equity research database, looking for stocks that pay massive dividends, and we found a collection of companies that, combined, can generate over $4,200 a year in passive annual income if you invest just $30,000 in each stock at the time of this writing.
AT&T
- Stock #3: AT&T (NYSE:T)
- Yield: 4%
- Shares for $30,000: ~1,134
- Annual Passive Income: ~$1,200
AT&T is the largest U.S. telecommunications company by subscriber base, operating a converging 5G wireless and fiber broadband network across the country. The company closed 2025 with a current price of $25.47 and has delivered steady operational progress, including 10.4 million fiber connections and more than 1 million fiber net adds for the eighth consecutive year.
The dividend has held at $0.2775 per quarter ($1.11 annualized) since mid-2022 and is explicitly confirmed through 2028 per company guidance. Free cash flow supports the payout comfortably: AT&T generated $16.586 billion in FCF in 2025 and guided for $18 billion or more in 2026. Management also approved a new $10 billion share buyback authorization, signaling confidence in the balance sheet. Institutional investors hold roughly 68% of shares outstanding.
TotalEnergies
- Stock #2: TotalEnergies (NYSE:TTE)
- Yield: 4%
- Shares for $30,000: ~324
- Annual Passive Income: ~$1,200
TotalEnergies is a Paris-based integrated energy major with operations spanning exploration and production, liquefied natural gas, integrated power, refining, and retail marketing. The company produced 2,529 thousand barrels of oil equivalent per day in full-year 2025, up roughly 4% year over year, and is guiding for 5% overall energy production growth in 2026, including electricity production rising 25% to more than 60 TWh.
TotalEnergies raised its annual dividend by 6% for FY2025 to €3.40 per share, paid in four quarterly installments. At current exchange rates, €3.40 converts to approximately $3.97 in USD, and the Alpha Vantage data shows a reported dividend per share of $3.99. The company completed $7.5 billion in share buybacks in full-year 2025 and authorized a new repurchase program covering up to 169.76 million shares. Institutions own approximately 57% of the float.
Pfizer
- Stock #1: Pfizer (NYSE:PFE)
- Yield: 6%
- Shares for $30,000: ~1,176
- Annual Passive Income: ~$1,800
Pfizer is one of the world’s largest pharmaceutical companies, with a portfolio anchored by blockbuster franchises including Eliquis, Prevnar, the Vyndaqel family, Paxlovid, and Ibrance. The non-COVID portfolio grew 9% operationally in Q4 2025, and the company is investing aggressively in its pipeline with approximately 20 pivotal trial starts planned for 2026 and a roughly $7 billion acquisition of Metsera to build out an obesity and GLP-1 drug platform.
The quarterly dividend has increased by $0.01 per share every year since 2021, reaching $0.43 per quarter ($1.72 annualized). At a current price of $27.08, that produces a yield of 6%, the highest in this group. Institutional ownership stands at approximately 68%, and the analyst consensus target sits at $28.58.
Combined, these three positions generate $4,200 in annual passive income on a $90,000 investment, a blended yield of approximately 6%. AT&T contributes $1,200, TotalEnergies adds $1,200 and Pfizer rounds out the portfolio with $1,800.
| Ticker | Annual Income | Share of Total |
|---|---|---|
| T | $1,200 | 22% |
| TTE | $1,200 | 22% |
| PFE | $1,800 | 33% |
What makes this portfolio structurally interesting is the diversification across three distinct sectors: telecom, energy, and pharmaceuticals. Each dividend is funded by a different underlying cash flow engine, which reduces the risk that a single industry downturn cuts the income stream. Reinvesting even a portion of these quarterly payments accelerates compounding in a way that a fixed-rate instrument simply cannot replicate over time.
The post Want $4,200 in Passive Income? Invest $90,000 ($30,000 Each) Into These 3 High-Yield Dividend Stocks appeared first on 24/7 Wall St..
]]>Earned income has a ceiling. Passive income from dividend stocks operates differently: cash flows in whether markets are up or down, whether you’re working or sleeping. With core inflation still grinding higher, the Core PCE index at 128.86 as of February 2026, and the 10-year Treasury yielding 4.32%, income investors need yield that keeps pace with rising costs without illiquid assets.
High-yield dividend stocks solve that problem. Unlike rental real estate, they require no property management or maintenance. You can add to a position Tuesday morning and sell by Thursday afternoon. That liquidity, combined with quarterly or monthly cash distributions, makes dividend equities one of the most practical income vehicles for individual investors.
We screened our 24/7 Wall St. dividend equity research database and found five companies that combined can generate over $1,100 annually in passive income on a $5,000 investment in each stock.
Johnson & Johnson
- Yield: 2.22%
- Shares for $5,000: 21.35 shares at $234.18
- Annual Passive Income: $111
Johnson & Johnson (NYSE:JNJ) operates Innovative Medicine, covering oncology and immunology drugs, and MedTech, spanning cardiovascular devices, orthopaedics, surgery, and vision. The company holds one of only two AAA credit ratings among U.S.-based corporations, a financial bedrock supporting its uninterrupted dividend growth.
JNJ has raised its dividend for 64 consecutive years, making it a Dividend King. The most recent increase, from $1.30 to $1.34 per quarter declared in April 2026, reflects commitment to income shareholders. Institutional investors hold 75.8% of shares outstanding, underscoring its role as a core holding across large portfolios.

Coca-Cola
- Yield: 2.71%
- Shares for $5,000: 66.02 shares at $75.74
- Annual Passive Income: $136
Coca-Cola (NYSE:KO) is a global beverage franchise earning revenue from selling concentrates and syrups to bottling partners worldwide, a capital-light model generating durable free cash flow. The company has raised its dividend for 63 consecutive years, and the most recent quarterly payment stands at $0.53 per share as of Q1 2026, up from $0.51 in each quarter of 2025.
The brand portfolio includes Coca-Cola Zero Sugar, Sprite, Fanta, Powerade, Dasani, smartwater, fairlife, and Minute Maid. Institutional investors control 66.7% of shares, and the analyst community skews constructive, with 12 Buy ratings and 7 Strong Buy ratings against zero Sell calls.
Procter & Gamble
- Yield: 2.92%
- Shares for $5,000: 34.03 shares at $146.93
- Annual Passive Income: $146
Procter & Gamble (NYSE:PG) sells everyday products consumers buy regardless of economic conditions: Tide, Pampers, Gillette, Oral-B, Crest, Head & Shoulders, Febreze, Bounty, and Charmin. That defensive revenue profile anchors one of the most reliable dividend records in the market.
PG raised its quarterly dividend to $1.088 for Q2 2026, up from $1.056 the prior quarter, extending a multi-decade streak of consecutive annual increases. The company plans approximately $10 billion in dividends and $5 billion in share repurchases in fiscal 2026. Institutions own 70.4% of shares, and the stock carries a beta of 0.403, making it one of the lower-volatility names in any dividend portfolio.
AT&T
- Yield: 4.20%
- Shares for $5,000: 188.61 shares at $26.51
- Annual Passive Income: $210
AT&T (NYSE:T) generates revenue from wireless mobility, AT&T Fiber broadband, and business wireline services. The fiber buildout is the growth engine, with 10.4 million fiber connections representing 11.5% year-over-year growth.
The dividend has held at $0.2775 per quarter since 2022, and management committed to maintaining the $1.11 annualized rate through 2028. That stability, combined with a new $10 billion share buyback authorization, signals focus on returning capital to shareholders.

Realty Income
- Yield: 4.98%
- Shares for $5,000: 76.82 shares at $65.09
- Annual Passive Income: $249
Realty Income (NYSE:O) is a net lease REIT owning more than 15,000 commercial properties leased to tenants who pay property taxes, insurance, and maintenance costs directly. As a REIT, it must distribute at least 90% of taxable income to shareholders, structurally driving elevated yield.
The company earns its nickname “The Monthly Dividend Company” by paying shareholders monthly rather than quarterly. The most recent monthly dividend is $0.2705 per share, and the company has recorded 113 consecutive quarterly dividend increases and 133 total increases since its NYSE listing in 1994. Institutional investors own 80% of shares, the highest concentration among all five names in this portfolio.
The bottom line
Combined, these five positions generate passive income on a $25,000 investment. Realty Income adds $249, AT&T provides $210, Procter & Gamble delivers $146, Coca-Cola generates $136, and Johnson & Johnson rounds out the portfolio with $111.
The Dividend Kings (JNJ, KO, PG) anchor the portfolio with decades of uninterrupted growth, while AT&T and Realty Income push the blended yield well above current Treasury rates. Reinvesting those distributions compounds the income base over time, growing the annual income base with each reinvestment cycle.
The post Put $5,000 In These Dividend Giants and Earn Passive Income Every Quarter appeared first on 24/7 Wall St..
]]>