Advertise with Googlier.com Anamind https://www.anamind.com/ The company behind Planamind Thu, 15 Oct 2026 03:49:03 +0000 en-US hourly 1 https://wordpress.org/?v=7.1.4 https://www.anamind.com/wp-content/uploads/2023/03/Favicon-circle-blue-150x150.png Anamind https://www.anamind.com/ 32 32 Planning as a Service: Rethinking How Supply Chain Planning Gets Done https://www.anamind.com/anamind-blog/planning-as-a-service-rethinking-supply-chain-planning/ Thu, 15 Oct 2026 03:48:59 +0000 https://www.anamind.com/?p=998564 A specialist provider runs the analytical engine of planning; the client keeps the decisions. Five reasons Planning as a Service beats in-house, GCC and BPO models.

The post Planning as a Service: Rethinking How Supply Chain Planning Gets Done appeared first on Anamind.

]]>

Supply chain planning is now too important, too volatile and too dependent on technology to be run the way most companies run it today: as a fixed in-house team tied to a large, multi-year software implementation. Planning as a Service (PaaS) offers another model. A specialist provider runs the analytical engine of planning on the client’s behalf, with its people, its methods and its technology. The client keeps ownership of decisions and of the business process.

The pressures are familiar. Planning talent is expensive and scarce. Tariffs, geopolitics and demand shocks keep plans in flux. Many firms are also carrying large planning platforms that cost more each year to renew and maintain. And AI is changing what good planning technology looks like faster than any internal team can keep up.

This article sets out what PaaS is, the advantages it offers, and what to get right when adopting it.

What Planning as a Service is

Under PaaS, the client buys a planning outcome, not a software licence or a headcount. The provider delivers an agreed set of outputs: statistical forecasts, supply plans, inventory targets, scenario runs and S&OP-ready analysis. It delivers them on an agreed cadence and to agreed quality levels.

The provider brings three things together under one fee:

  • People: trained demand, supply and inventory analysts, often working across time zones.
  • Process: proven planning methods, calendars, exception rules and quality checks.
  • Technology: the planning platform, data pipelines and analytical models, including AI and machine learning, chosen, run and upgraded by the provider.

The client’s planners and business leaders stay in charge of judgement: market intelligence, overrides, trade-offs and sign-off in the S&OP cycle.

1. Opex instead of capex

PaaS turns planning from a large up-front investment into a predictable operating cost that tracks the value delivered.

A traditional planning transformation is front-loaded. Licences, implementation partners, data integration, testing, change management and internal project teams are all paid for before the first plan comes out. Benefits arrive later, if the project lands. The investment usually needs board-level approval and competes with every other capital request.

Under PaaS, the client pays a recurring service fee. This has several practical effects:

  • Cash is preserved. Capital stays available for capacity, acquisitions or debt reduction. This matters more when interest rates make capital expensive.
  • Cost follows scope. Fees can be tied to the number of SKUs, regions or planning cycles covered. A company can start with one region or business unit and scale up as results prove out.
  • Payback starts sooner. Because the provider’s platform and methods already exist, useful outputs typically arrive in weeks or a few months rather than after a long build.
  • Budgeting is simpler. Finance gets one line item with a known run-rate, not a tangle of licence, hosting, partner and internal costs.
  • The balance sheet stays lighter. There are no large capitalised software assets to amortise or write down if the strategy changes.

The treatment of a specific contract depends on its terms and the applicable accounting standards, so finance teams should confirm it with their auditors. The economic point holds regardless: the client pays for planning as it consumes it.

2. Attrition risk moves to the provider

When a planner leaves an in-house team, the knowledge often leaves too. Under PaaS, continuity is the provider’s contractual problem, not the client’s operational one.

Planning roles are hard to fill. Experienced demand and supply planners are in short supply, and those who know a particular planning platform well are poached often. The cost of losing one goes well beyond recruitment fees:

  • Months of vacancy, during which forecasts go stale or are maintained by overstretched colleagues.
  • Months more for a new hire to learn the products, customers, data quirks and system configuration.
  • Undocumented know-how lost, such as why a model was tuned a certain way or which data feed cannot be trusted.
  • A key-person risk that small teams often cannot cover at all.

A PaaS provider is built to absorb this. It runs a bench of trained analysts, documents methods and client specifics as standard practice, and rotates people across accounts so that more than one person knows each client. When someone leaves, a replacement steps in without the client seeing a gap in output.

The contract makes this enforceable. Service levels on timeliness and accuracy hold whatever happens to the provider’s staff. Recruitment, training, retention and wage inflation in a tight labour market become the provider’s cost and risk.

3. Splitting number crunching from business process

PaaS lets a company split planning into two layers: the analytical engine, which the provider runs, and the business process, which the client owns. Each layer can then be done by the people best suited to it.

In many in-house teams, expensive and experienced planners spend most of their week on data work. They clean history, rerun models, chase missing inputs, reconcile spreadsheets and build reports. Little time is left for what only they can do: talking to sales, understanding customers, weighing trade-offs and driving decisions in the S&OP meeting.

PaaS separates the two.

Analytical engine (provider)Business process (client)
Data collection, cleansing and validationMarket intelligence and commercial input
Statistical and ML forecasting, model tuningForecast overrides and their ownership
Supply, inventory and capacity calculationsTrade-off decisions on service, cost and working capital
Scenario and what-if runsChoosing which scenarios to act on
Forecast accuracy and bias trackingAccountability for plan outcomes
Exception flags and S&OP pre-readsRunning the S&OP and executive review meetings

This split has several benefits:

  • Better use of scarce talent. The client’s planners become business partners rather than data processors. A smaller, more senior team can cover more of the business.
  • Clear accountability. The provider is accountable for the quality and timeliness of the numbers. The client is accountable for decisions. Disputes about whose fault a bad plan was become easier to settle.
  • Decisions stay inside the business. Commercial judgement, customer relationships and final sign-off never leave the company. Overrides remain the client’s call; the provider simply loads and tracks them.
  • A consistent baseline. A specialist running the engine applies the same method every cycle, which makes the statistical baseline a stable reference against which human judgement can be measured.

4. De-risking the fast-moving AI landscape

AI in planning is changing faster than any company can safely commit to a single bet. PaaS hands the job of choosing, testing and switching technology to a provider whose business depends on getting it right.

In only a few years, planning technology has moved from classical statistical models to machine-learning forecasts, demand sensing, probabilistic planning, and now generative and agentic AI that can explain plans, draft S&OP narratives and act on exceptions. New models and tools arrive every few months. Some will last; many will not.

For a company buying its own platform, this creates real risks:

  • Betting on the wrong tool. A multi-year commitment to one vendor’s AI roadmap may be overtaken within a year or two.
  • Paying for hype. AI modules are often sold as costly add-ons whose value is hard to prove before buying.
  • Skills that do not exist in-house. Data science, model monitoring and AI governance are rare skills. They are expensive to hire and hard to keep.
  • Model risk. AI models drift, fail silently on unusual data and need constant monitoring.

Under PaaS, the provider carries these risks. It can test new methods across many clients and datasets, keep what works and drop what does not. The client is judged on outcomes such as forecast accuracy, bias, service level and inventory, not on which algorithm was used. When a better method appears, the provider can adopt it without the client running a new selection, contract and implementation.

PaaS also gives a safer path to adoption. AI can be introduced one category or region at a time and measured against the existing baseline, with humans still reviewing the output. The client gains from progress in AI while keeping clear, auditable control over the decisions that follow.

5. Escaping costly renewal and maintenance lock-in

Large planning implementations often become a fixed cost that keeps rising while the business around it changes. PaaS replaces that lock-in with a flexible service that can grow, shrink or change direction.

Many companies installed major planning suites five to fifteen years ago. The original project may have succeeded, but the running costs have grown quietly:

  • Rising renewals. Licence and subscription fees tend to rise at each renewal, and vendors’ moves to cloud-only editions often bring higher prices and forced migrations.
  • Maintenance and upgrades. Patches, version upgrades, integration fixes and regression testing need a standing internal team or an expensive partner contract.
  • Customisation debt. Years of custom code make each upgrade harder and each change slower.
  • Underuse. Much of the functionality paid for is never used, or is used only by one or two experts.
  • High switching costs. Data, processes and skills are built around one platform, which weakens the client’s position at renewal time.

In uncertain times this rigidity is a real cost. A company facing tariff changes, a divestment, a merger, a supply base shift or a demand downturn needs planning costs that can flex. A long, fixed commitment to a platform sized for yesterday’s business does the opposite.

PaaS changes the terms. The provider owns platform licensing, hosting, upgrades and integration upkeep. The client’s commitment is to a service, usually with defined scope and notice periods, rather than to a technology stack. Companies can use PaaS to retire or shrink a legacy platform at its next renewal, run the service in parallel during transition, and avoid the next large re-implementation altogether.

Why a GCC or a general BPO is not the same answer

Moving planning to a captive global capability centre (GCC) or a general-purpose BPO changes where the work is done and what it costs per head. It does not remove the risks that make in-house planning hard.

Many companies have moved finance, accounting, HR and IT work to GCCs or large outsourcing firms, often with good results. It is tempting to treat planning the same way. On closer look, the comparison breaks down.

The same risks, in a new location

  • A GCC is still an in-house team. It carries the same attrition and key-person risk, often more, because GCC hubs are crowded talent markets where skilled planners are hired away quickly.
  • The technology burden stays with the company. Platform licences, renewals, upgrades and AI choices remain the client’s problem. The capex, the lock-in and the risk of betting on the wrong AI tool do not move.
  • Building takes time and money. A GCC planning team needs hiring, training, process design and senior attention before it delivers, which is the very investment PaaS avoids.
  • A general BPO sells capacity, not outcomes. It staffs to headcount and process service levels. It rarely commits to forecast accuracy, bias, service or inventory results, and when its people leave, the planning know-how leaves with them.

Planning is not a transactional process

Accounting and similar functions suit shared services because they are rule-based and standard: the same steps, controls and outputs every month. Planning is different in kind.

  • It is judgement-heavy and shifts with markets, portfolios, promotions and supply disruptions.
  • It depends on real depth in statistics, machine learning and supply chain trade-offs, not just following process steps.
  • Leading planning platforms are now AI-native. Getting value from them means knowing how to configure, tune, monitor and challenge machine-learning and agentic models, and knowing when not to trust them.
  • That skill set is scarce and changes fast. It is hard to build and keep where planning is one function among many, as it is in most GCCs and generalist BPOs.

How the three models compare

In-house or GCCGeneral BPOSpecialist PaaS
Attrition and key-person riskClientProvider replaces people, but expertise resetsProvider, backed by a planning-trained bench
Technology and AI choicesClientClientProvider
Platform renewals and upkeepClientClientProvider
Depth in planning and AI-native toolsBuilt slowly, hard to keepGeneralistCore business
What the contract measuresHeadcount and budgetProcess service levelsPlanning outcomes

The real question is not where planning work is done, but who is accountable for doing it well. Of the three models, only a specialist provider makes planning its whole business.

Further advantages

Beyond the five core arguments, PaaS offers benefits that matter most where talent is costly and markets move fast.

Elastic capacity for volatile times

Planning workload is uneven. Product launches, network redesigns, M&A integration, supply crises and annual budgeting all bring peaks. An in-house team sized for the peak sits idle in quiet months; one sized for the average is overwhelmed when it matters most. A PaaS provider can add analysts and computing power for a peak and scale back afterwards, so the client pays for capacity when it needs it.

A response to demographic and labour-cost pressure

Ageing workforces, retiring experienced planners and high wage costs make it harder each year to build deep planning teams. PaaS gives access to a larger, global talent pool through a single contract. The client gets specialist depth without the cost of building every skill locally.

Speed to value

Because the provider’s methods, templates and platform already exist, a PaaS engagement can produce useful plans within weeks. A new platform implementation often takes many months before the first plan runs.

Focus on core business

Manufacturers, distributors and brand owners compete on products, customers and operations, not on running planning software. PaaS lets leadership put management attention and capital where the company competes.

Built-in resilience and security

An established provider brings business continuity plans, backup teams, and certified information-security controls such as ISO 27001. A single in-house team or small IT function often cannot match these on its own.

What to get right

PaaS works when roles, measures and exit terms are clear from the start. Companies weighing the model should settle these points:

  1. Decision rights. Write down what the provider does and what the client decides. Overrides, final plans and S&OP sign-off should stay with the client.
  2. Outcome-based service levels. Measure the provider on timeliness, forecast accuracy and bias, data quality, and the business results the plans support, not on hours worked.
  3. Data ownership and security. The client should own its data, models’ outputs and planning history. Check the provider’s security certifications, data residency, and compliance with regimes such as GDPR.
  4. Transparency. Insist on explainable methods and access to the underlying numbers, so the client can always see why a plan says what it says.
  5. Exit and portability. Agree up front how data, documentation and configurations are handed back if the contract ends, so PaaS does not become a new form of lock-in.
  6. A phased start. Begin with one region, business unit or planning layer, prove the results against a clear baseline, then expand.
  7. Retained capability. Keep a small internal team that understands planning well enough to challenge the provider and to own the business process.

Conclusion

Planning as a Service gives companies a way to make planning better, cheaper and more resilient at the same time.

It turns a capital-heavy, fixed-cost function into a flexible operating expense. It moves attrition and key-person risk to a provider built to absorb them. It frees scarce planners to focus on judgement and business process while specialists run the numbers. It shields the business from betting on the wrong AI technology. And it offers a way out of the rising renewal and maintenance costs of large legacy implementations.

The question for leadership is no longer whether planning matters, but which parts of it the company must own. For most firms, the answer is the decisions, not the data processing. PaaS lets them keep the first and hand over the second.

The post Planning as a Service: Rethinking How Supply Chain Planning Gets Done appeared first on Anamind.

]]>
Driver-based demand planning: why demand is constructed, not predicted https://www.anamind.com/anamind-blog/demand-is-constructed-not-predicted/ Fri, 09 Oct 2026 10:58:20 +0000 https://www.anamind.com/?p=998553 History plus a planner's correction is no longer a forecast. How leading teams build demand from explicit, owned and measurable drivers.

The post Driver-based demand planning: why demand is constructed, not predicted appeared first on Anamind.

]]>

A best-practice note on modern demand planning

Short answer: driver-based demand planning builds the forecast from a statistical baseline plus a separate, owned layer for each known driver, such as sales opportunities, promotions, launches and external signals, instead of one number a planner corrects by hand.

History plus judgement is no longer a forecast

For decades demand planning rested on two inputs: a statistical model run on sales history, and a planner who corrected it. That worked while history was a fair guide to the future.

It is a poor guide now. Much of what moves demand next quarter is not in last year’s numbers: a promotion that did not run before, a listing the sales team is still negotiating, a launch that will take volume from an existing line, a hotter season, a shift in consumer spending, a surge of interest that shows up in search before it shows up in sales.

When a planning system has only two inputs, all of this lands in the manual override. One typed number carries six different reasons. Nobody can audit it, nobody can measure it, and it is lost at the next cycle.

The principle: build demand from its drivers

Leading planning teams no longer treat the forecast as a prediction to be corrected. They treat it as a construction. The baseline says what would happen if nothing changed, and each known driver is then added as its own explicit, owned and measurable layer.

The drivers fall into two groups. Internal drivers are decisions the business makes. External drivers are conditions it must respond to.

DriverTypeTypical ownerThe question it answers
Statistical baselineFoundationDemand planningWhat does history alone suggest?
Sales opportunitiesInternalSalesWhich deals are not yet in history, and how likely are they?
PromotionsInternalMarketing and tradeWhat uplift is planned, and on which dates?
New product launchesInternalProduct and categoryWhat will the new item sell, and what will it take from existing lines?
WeatherExternalPlanning, automatedWill the season run hotter, colder or wetter than normal?
Macroeconomic indicatorsExternalPlanning, automatedIs consumer spending leading demand up or down?
Market and search trendsExternalPlanning, automatedIs interest rising before sales show it?
Planner judgementInternalDemand plannerWhat does the planner know that no data source does?

What constructed demand looks like

The illustration below shows the Demand view in Planamind for a demonstration company selling beverages and snacks. Each driver has its own row between the baseline and the final forecast.
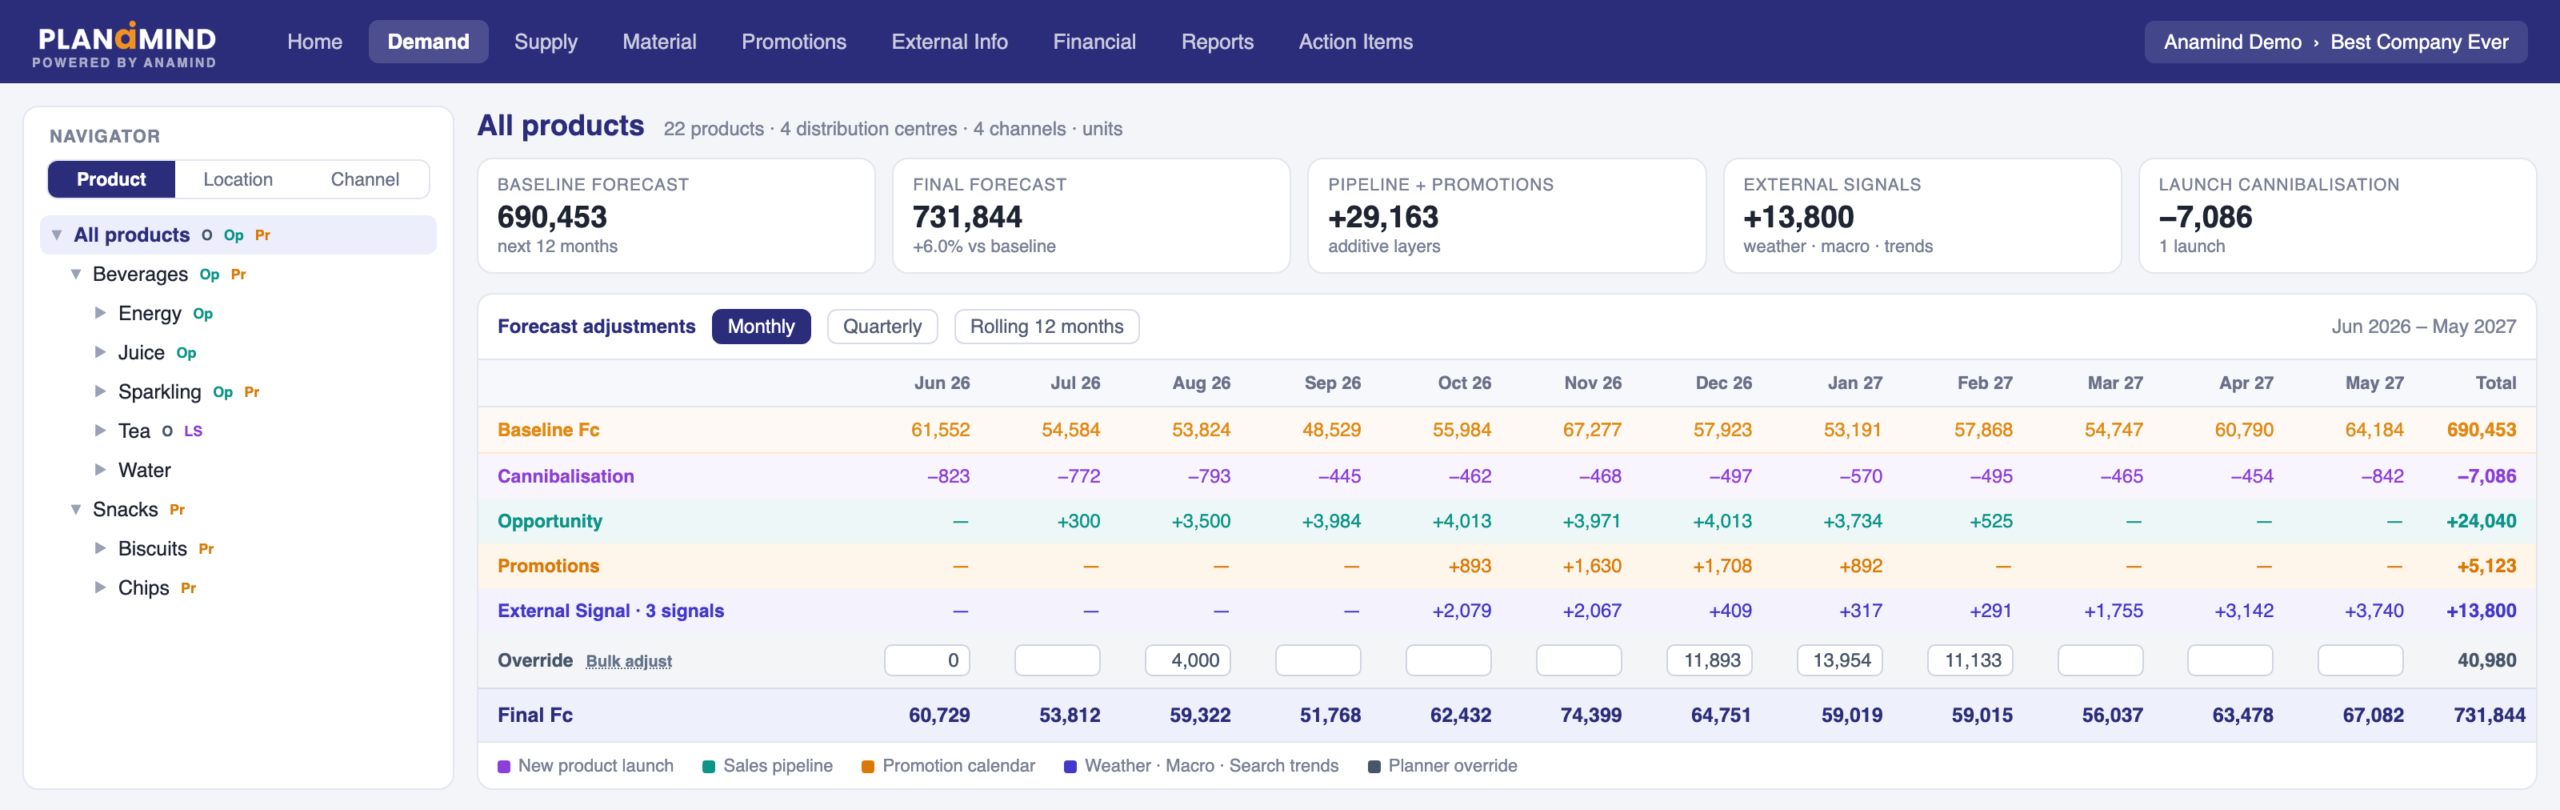
Illustration of the Planamind Demand view showing Baseline, Cannibalisation, Opportunity, Promotions, External Signal, Override and Final forecast rows by month

Illustration of the Planamind Demand view at the top of the hierarchy, using demonstration data.

Take November. The baseline is 67,277 units and the final forecast is 74,399. The grid shows where the difference comes from: 3,971 units from the sales pipeline, 1,630 from a Diwali promotion, 2,067 from three external signals, and a reduction of 468 where a new launch takes volume from an existing product.

The forecast is the same single number the supply plan needs. The difference is that every part of it has a name and an owner.

Six practices that separate constructed demand from corrected demand

  1. Give every driver its own line, in units. If a promotion and a planner’s judgement share one cell, neither can be reviewed. A driver that cannot be seen cannot be challenged or improved.
  2. Separate what adds from what replaces. A deal or a promotion adds volume on top of the forecast. A signal adjustment or an override restates it. Keeping the two apart lets them stack, so an overridden month still carries its promotion.
  3. Hold drivers at the lowest level and read them at the highest. Store each one by product, location, channel and month. The same lines should then appear at a category, a region and the whole business, because that is where forecasts are questioned.
  4. Let the owner of the driver own the input. Sales maintains deals and their stage. Marketing maintains the promotion calendar. When a date or a probability changes, the forecast should move with it, without a planner retyping anything.
  5. Protect human judgement from automation. An automated adjustment should never overwrite a number a planner entered. Every override should record who made it, when and why.
  6. Measure each layer and retire what does not earn its place. Compare the accuracy of the statistical forecast with the final one. Compare each promotion’s planned lift with what it delivered. A layer that does not improve the forecast is noise with a label.

A five-minute self-assessment

Ask these of your current planning process:

  • If next month’s forecast rose 10%, can you say in units how much came from each cause?
  • When a promotion date moves, does the forecast move with it?
  • Does a launch automatically reduce the forecast of the product it replaces?
  • Can an automated adjustment overwrite a planner’s number?
  • Do you know whether last quarter’s overrides made the forecast more accurate or less?

If two or more answers are uncomfortable, demand is still being predicted and corrected, not constructed.

See it in practice

Planamind is built on this model. Its Demand view shows the baseline, sales opportunities, promotions, launch effects, external signals and planner overrides as separate rows, from a single SKU up to the whole business. Planner overrides always take precedence over automated adjustments, and each carries its author and reason.

The quickest way to judge the approach is to see a forecast built this way. Request a demo through our contact form and we will walk you through constructed demand on a portfolio like yours.

The post Driver-based demand planning: why demand is constructed, not predicted appeared first on Anamind.

]]>
What a Demand Planner Does, and How to Make Forecasting a Team Sport https://www.anamind.com/anamind-blog/what-a-demand-planner-does/ Tue, 22 Sep 2026 00:16:38 +0000 https://www.anamind.com/?p=997976 The demand planner's role, how to sell your forecast in S&OP, each function's part in collaborative forecasting, and how to measure forecast value added.

The post What a Demand Planner Does, and How to Make Forecasting a Team Sport appeared first on Anamind.

]]>

Short answer: a demand planner builds the most accurate unbiased view of future demand the business can produce, then gets sales, marketing, supply chain, operations, finance and management to improve it and commit to one number. The best planners do more than predict. They tell leadership what to do about the forecast. Forecasting becomes a team sport when every function adds what it knows, at the right level, in the right order, and each input is measured against the statistical baseline.

What does a demand planner actually do?

Demand planning is the one function that works directly on the company’s objective of selling, and it is usually the first to spot when demand is moving away from the plan. Yet in many companies it still sits as a sub-function under supply chain, sales or finance, and rarely gets a seat at the top table.

History offers a clue as to why. In ancient courts the forecaster sat next to the king. The Bible tells how Joseph forecast seven years of plenty followed by seven years of famine for Pharaoh, perhaps the first recorded long-range forecast. What earned him his place was not the prediction alone. It was the advice that came with it: store grain in the good years and sell it in the lean ones. Egypt came through the famine. Had he simply predicted the famine and trimmed inventory to match, he would have been a good forecaster, but never put in charge of Egypt.

That is the distinction every planner needs to understand:

  • Forecasting is the prediction of demand: an honest, unbiased estimate of what customers will buy.
  • Planning is the proposal for changing that prediction: how to shape demand favourably, close a gap or avoid a loss.

The two are sequential, and a good professional does both. The day-to-day work of the role includes:

  • Cleaning sales history, correcting outliers and marking events such as promotions, stockouts and one-off orders.
  • Building a robust statistical baseline for every product and location.
  • Adding known business information as overrides, with a reason for each one.
  • Running the demand review and bringing each function’s input into one consensus forecast.
  • Tracking accuracy and bias, and explaining why the forecast missed.
  • Presenting the risks and opportunities to leadership, along with options for acting on them.

Where does the planner add value?

When demand planning is hosted inside supply chain, it tends to inherit supply chain thinking. If the forecast shows a decline, the instinctive response is to cut production and freight to match. That is the right reaction for supply chain, whose job is to meet demand at the lowest cost. It is not how a chief executive thinks. A CEO facing a forecast decline wants to know how to recover the volume, and the planner should already have the options in the forecast presentation: a promotion, a channel push, a price move or a product substitution.

The planner’s value shows up in three places.

Better service and less stock at the same time

Safety stock exists to cover two kinds of uncertainty: variation in supplier lead time and error in the demand forecast. Most companies move up and down a fixed trade-off curve, adding inventory to lift customer service or cutting service to free cash. Reducing forecast error shifts the whole curve. The company can hold the same stock and serve customers better, or hold service steady and release working capital. It needs no new capital, only knowledge the organisation already has.

An early warning for the business

The planner sees demand moving first, so they can flag a gap to the annual plan while there is still time to act.

Proposals, not just numbers

Every forecast that points to a shortfall should come with a recommendation. That is what turns the planner from a number-cruncher into an adviser to management.

Collaboration and S&OP: selling your forecast

Ask any group of planners what makes sales and operations planning succeed and the first answer is always management support. That matters, but planners cannot control it beyond a point. They can control how well they sell their forecast inside the business. Round-table conversations among practitioners keep returning to the same practical tactics:

  • Show sales what is in it for them. Once the sales team sees the planning team as the people who help them hit their targets, the dynamic flips. Planners stop chasing sales for review meetings, and sales start chasing planners. It takes several cycles, but it lasts.
  • Put accuracy in money terms. A planner with a finance background presented forecast error as notional financial gain or loss. Sales challenged the numbers, which was the point: it brought them into the room and forced the discussion.
  • Frame risks positively. Describing a risk in terms of what can be protected or won holds an audience better than a list of what might go wrong. Soft skills are part of the job.
  • Bring finance into the consensus. When financial inputs are part of the consensus process, S&OP moves towards integrated business planning, whatever the company calls it.

Making forecasting a team sport

Collaborative forecasting is talked about far more than it is practised. It works when each function knows its position on the team: what it contributes, at what level of the product hierarchy, and whether it should consider supply constraints.

  1. Demand planning opens the play. The planner makes the statistical baseline as strong as possible at SKU level, cleans the history and adds known business information.
  2. Sales validate unconstrained demand. The key word is unconstrained. Sales people naturally forecast what they expect to sell given the stock available. What planning needs is what customers want. If the front line constrains demand to match supply, supply planners never see the real demand for future periods. Sales can adjust at any level of the hierarchy, usually customer, product or region.
  3. Marketing adds strategic information. Planned promotions, category growth and competitor activity, usually at product or region level rather than SKU. Marketing can reduce the forecast for external factors such as a competitor launch, but not for internal supply limits. Marketing is also the team that helps close the gap between forecast and plan by shaping demand.
  4. Supply chain checks logistics constraints. Can the stock be moved to where the demand is? This is typically assessed at product and region level.
  5. Operations confirm product availability. Usually for future periods and at SKU level. It gives sales an early warning to plan substitutions and manage customers.
  6. Finance sees the forecast in value. Finance flags budget constraints and, more importantly, explains why forecast revenue differs from the annual plan.
  7. Management has the final word. Its changes come out of the executive S&OP meeting. Planning should bring a summary of every change made by each collaborator, with the reason, alongside the forecast itself.

A few rules keep the team playing well together:

  • Override by exception. Sales should not be asked to re-enter every number. If they are, the purpose of a statistical forecast is lost. A strong baseline frees the field team from spreadsheets so they only step in where they have genuine additional information.
  • Take turns. Run inputs in sequence so that two functions are not changing the same numbers at once.
  • Make every input visible. All collaborators should be able to see what others changed and why. Transparency is the hallmark of a good consensus process.
  • Allow input at any level. The system has to accept changes at a high level and split them down to SKU sensibly.
  • Train the planners. Business schools rarely teach demand planning beyond a chapter in an operations course. The role needs training in both statistical techniques and process practice. Anamind’s Academy is one place to start.

Measuring the value planners add: forecast value added

Every override is a hypothesis: that the person making it knows something the model does not. Forecast value added (FVA) tests that hypothesis. For each step in the process, compare the error of the forecast before and after the change. For example, if the statistical baseline had a MAPE of 30% on an item and the sales override moved it to 25%, sales added value. If it moved to 35%, the override made the forecast worse.

Many companies have no idea whether their planners and collaborators are improving or degrading the forecast. Measuring FVA answers that question and changes behaviour:

  • Track forecast accuracy and error at each stage: statistical baseline, planner, sales, marketing and final consensus. The forecast accuracy template is a simple way to begin.
  • Watch forecast bias as well as error. Persistent over-forecasting by one contributor builds excess stock, and persistent under-forecasting causes stockouts.
  • Look for consistency. A collaborator who adds value most months deserves more weight. One who usually degrades the forecast needs coaching, or a smaller role.
  • Share the results openly in the demand review.

How Planamind supports planners

Planamind, Anamind’s AI planning platform, is built around this way of working:

  • A strong baseline: 12 forecasting models, with the best fit selected automatically for each item, so collaborators only need to override by exception.
  • Collaboration in one place: comment threads, @mentions, tasks, reason codes and a full override history, so everyone sees who changed what and why.
  • Forecast value added: an FVA report compares each override against the statistical baseline, with MAPE before and after, and flags collaborators whose changes tend to degrade the forecast.
  • Accuracy and bias: FA%, WAPE, MAPE and bias tracked on the forecast accuracy report.
  • The financial view: a gross-profit P&L from the plan and a revenue bridge against AOP, so finance and management see the forecast in value.
  • Commentary: Ana, the AI planning assistant, writes the Monthly Review commentary, including where to intervene.

See how it works on the demand planning page. If you need extra planning capacity or expertise, Planning as a Service puts Anamind’s analysts alongside your team.

Frequently asked questions

What is the difference between forecasting and demand planning?

Forecasting predicts what customers will buy. Demand planning takes that prediction and proposes how to change it, for example through promotions, channel programmes or substitutions, and turns it into an agreed plan that supply and finance can act on.

Why should sales give an unconstrained forecast?

Because supply planners need to see real demand. If sales reduce their forecast to match the stock available, the shortfall disappears from view and supply never plans to meet it. Constraints should be applied later in the process by supply chain, operations and finance.

Should sales review every number in the forecast?

No. A good statistical baseline should cover most items. Sales should override by exception, where they have information the model cannot know, such as a new customer, a lost listing or a large order.

What is forecast value added?

Forecast value added measures whether each step in the forecasting process makes the forecast more or less accurate. You compare the error before and after each override, typically against the statistical baseline, and keep the steps that improve it.

Where should demand planning sit in the organisation?

Wherever it sits, it should give an unbiased view of unconstrained demand and have direct access to leadership through S&OP. When it reports into supply chain, planners need to guard against thinking only about cutting supply to match demand rather than finding ways to shape it.

The post What a Demand Planner Does, and How to Make Forecasting a Team Sport appeared first on Anamind.

]]>
Forecasts that use market signals and show their working https://www.anamind.com/anamind-blog/forecasts-market-signals-show-working/ Tue, 22 Sep 2026 00:16:20 +0000 https://www.anamind.com/?p=997972 Internal-only forecasts miss market shifts, and unexplained ones lose trust. How to add external signals and show the working behind every number.

The post Forecasts that use market signals and show their working appeared first on Anamind.

]]>

Short answer: a forecast built only on your own sales history can’t see what’s happening outside the business, and a forecast nobody can explain won’t be trusted when it matters. The fix has two parts. First, add a small number of external signals that genuinely lead your demand, such as weather, economic indicators, search interest or tenders, and apply them as a visible adjustment on top of the statistical baseline. Second, make every forecast show its working: which model was used, how accurate it has been, what was changed by hand and why, and why the last forecast missed.

Why internal-only forecasts leave you exposed

Most forecasts draw on the same inputs: past sales, targets and internal trends. That can look thorough, because there’s a lot of data and the spreadsheets are detailed. But none of it describes what’s happening outside the business. Competitors change prices, the weather turns, the economy slows, a large tender is published. None of that is in last year’s sales.

The result is a forecast that looks steady right up until the market moves. Its past accuracy builds trust, so teams act on it with confidence. When conditions change quickly, the forecast carries on repeating yesterday’s assumptions. Stock drifts out of line, service levels slip, and the problems seem to come from nowhere, because the numbers gave no warning.

There is a human cost too. When forecasts miss, the usual response is to work harder: more checks, more reviews, more late evenings. Planners end up blaming themselves for misses that were never visible in the data they were given. Working harder doesn’t help if the inputs can’t see what caused the miss.

Why unexplained forecasts lose trust

The opposite problem is just as damaging. A forecast from a model that gives a number with no explanation is hard to defend in a review. A spreadsheet whose formulas have been copied from month to month, with nobody quite sure of the rules behind them, isn’t much better.

In both cases the same things happen:

  • Planners hesitate over whether to trust the number or override it on instinct.
  • When the forecast misses, nobody can tell whether the cause was the data, the model or a change in the business.
  • Reviews become defensive, with planners asked to explain numbers they didn’t produce and can’t take apart.
  • People quietly work around the tool instead of improving it.

Automation doesn’t fix this on its own. Faster runs and less data entry are useful, but if planners can’t question or adjust the logic, they can’t adapt the forecast to new conditions or explain it to the business.

Which market signals are worth adding

Not every external data series belongs in your forecast. The useful ones have a plausible reason to affect your demand, and ideally move before it does. Common candidates:

  • Weather: temperature and rainfall for seasonal and weather-sensitive categories such as drinks, paints, garden products and cold remedies.
  • Economic indicators: leading indicators, energy prices and official statistics on retail or industrial activity, for categories that follow the economic cycle.
  • Consumer interest: search trends and online attention as an early read on awareness and intent.
  • Trade flows: import and export data where your supply or your customers’ demand crosses borders.
  • Tenders and public contracts: for businesses that sell into government or large institutional buyers.
  • News: competitor launches, regulatory changes and supply disruptions that call for a planning response.

Start with two or three signals you can explain to a sales director in a sentence each. A signal nobody can explain is just another black box.

How to add signals without losing the plot

  1. Get the baseline right first. Clean the history of stockouts, one-off orders and promotions so the statistical forecast reflects underlying demand. External signals can’t fix a baseline that’s wrong.
  2. Write down the hypothesis. For each signal, say which products it should affect, in which direction and roughly how far ahead. “A hot spell lifts soft drink sales in the following two weeks” is testable. “Macro matters” isn’t.
  3. Test it against history. Check whether the signal would have improved past forecasts on a holdout period. If it doesn’t help, drop it, however intuitive it seemed.
  4. Apply signals as a scenario, not an overwrite. Keep the statistical baseline and show the external adjustment as a separate, labelled layer. Everyone can then see how much of the forecast comes from history and how much from the market view.
  5. Record who changed what, and why. Every adjustment, whether from a signal or a planner’s judgement, should carry a reason code and a comment.
  6. Review the signal after the fact. At each monthly review, check whether the adjustment helped. Keep what works and retire what doesn’t.

Show the working: what a transparent forecast includes

A forecast you can defend shows at least the following:

  • The model and why it was chosen. Which method produced the baseline, and how it performed against the alternatives on recent history.
  • Accuracy and bias. Forecast accuracy and error measures such as WAPE and MAPE, plus bias, so you can see whether the forecast runs consistently high or low. Our guide on how to measure forecast bias covers the maths.
  • The value of each override. A forecast value added (FVA) view compares each manual change with the statistical baseline, so you can see which overrides help and which hurt.
  • External adjustments as their own layer. The market signal applied, how big the effect is and which items it affects.
  • Why the last forecast missed. A plain-language explanation of the main causes of the latest miss, so the review is about learning rather than blame.

When all of this sits alongside the number, more people can take part. Finance, sales and supply can challenge an assumption instead of arguing about a total, and accountability becomes clearer, because you can see whether a miss came from the data, the model or a judgement call.

Checklist: does your forecast use market signals and show its working?

  • Is the statistical baseline cleaned of stockouts, one-offs and promotions?
  • Do you use at least one external signal with a written, tested hypothesis?
  • Are external adjustments kept separate from the baseline?
  • Can a planner see which model produced the baseline, and why?
  • Do you report accuracy and bias every month, by product group?
  • Do you measure whether manual overrides improve the forecast?
  • Does every override carry a reason code and an owner?
  • After a miss, can you explain the main causes in a paragraph?

How Planamind helps

Planamind, from Anamind, runs 12 forecasting models and picks the best fit automatically as the baseline (see demand planning). The Intelligence Hub brings in external data, including Open-Meteo weather, the OECD composite leading indicator, World Bank, US EIA, US Census and India MOSPI statistics, Google Trends, Wikipedia pageviews, UN Comtrade trade data, SAM.gov tenders and AI-summarised news. You can apply their impact to the forecast as a scenario. Forecast accuracy (FA%, WAPE, MAPE and bias), the FVA report and a “Why the forecast missed” summary show the working. Reason codes, comments and override history record who changed what. For more on running the review itself, see S&OP collaboration and reporting.

Frequently asked questions

What are market signals in demand forecasting?

They are data from outside the business that can affect or anticipate your demand, such as weather, economic indicators, search trends, trade flows, public tenders and news. They add to your sales history rather than replace it.

Will adding external data always make the forecast more accurate?

No. A signal only helps if it genuinely relates to your demand. Test each one against past data on a holdout period and keep it only if it improves the forecast. Too many weak signals add noise.

Why should an external adjustment be a scenario rather than a change to the baseline?

Keeping it separate shows everyone how much of the forecast comes from history and how much from the market view. It also makes it easy to check afterwards whether the adjustment helped, and to remove it if it didn’t.

How do we stop the blame game when a forecast misses?

Make the forecast show its working. When the model choice, accuracy, bias, overrides and external adjustments are all visible, a review can pin down whether the miss came from the data, the model or a judgement call, and fix that instead of blaming the planner.

The post Forecasts that use market signals and show their working appeared first on Anamind.

]]>
Fragmented planning data: one plan for demand, supply and finance https://www.anamind.com/anamind-blog/fragmented-planning-data/ Tue, 22 Sep 2026 00:16:12 +0000 https://www.anamind.com/?p=997968 When demand, supply and finance each keep their own numbers, decisions suffer. How to spot fragmented planning data and get to one plan.

The post Fragmented planning data: one plan for demand, supply and finance appeared first on Anamind.

]]>

Short answer: fragmented planning data means demand, supply and finance each work from their own version of the plan. The cost isn’t the extra spreadsheet work. It’s the decisions that get made late, or made on numbers nobody fully trusts. The fix is to agree one current plan that every function reads from and changes in, with every change and its reason recorded. Getting there doesn’t take a big-bang project. Start with one product family and one monthly cycle, show the value early, then widen it.

What fragmented planning data looks like

You’ll feel it in the week before the monthly review. Demand has a forecast, supply has a view of available stock and finance has a budget snapshot, and each team presents its numbers with confidence. Each is right about its own piece. They just don’t match.

The common signs:

  • The first part of every alignment meeting is spent working out whose number is current.
  • Finance’s revenue view is built on last month’s forecast, not this month’s.
  • Supply plans against a demand figure that sales has already changed.
  • Someone keeps a “master” spreadsheet that only they fully understand.
  • When a target is missed, nobody can say which assumption changed, or when.

None of this means people aren’t working hard. Usually they’re working very hard to make up for data that doesn’t join up.

Why it costs more than time

The obvious cost is hours spent linking files and reconciling versions. The bigger cost is what happens to decisions.

Decisions drift away from what is actually happening

As a plan passes from demand to supply to finance, each team adds its best estimate based on what it has in front of it. Small differences slip through. A price change goes in late, or stock drifts out of line. Nobody notices until results miss the target or inventory swings, and by then the original assumptions are buried under changes that no single sheet shows.

Finance sees the problem last

When revenue, margin and inventory are tracked in separate places, each figure can look precise on its own while the overall picture is incomplete. A budget move meant to protect margin shifts inventory timing. A supply problem quietly ties up more working capital. Finance owns the P&L but often finds these links only at month-end, after the decision has been made. See demand planning and working capital for how the forecast feeds through to stock and cash.

Accountability gets blurry

If every team has its own numbers, every miss can be put down to “the data”. Teams hedge with their own buffers and meetings become debates about data instead of decisions.

Why more checks and workarounds make it worse

The natural response to data you don’t trust is to add a check: another sign-off, another reconciliation, another person who has to confirm the figures before the meeting. Together they make the cycle longer, and the plan is out of date before it is agreed.

Workarounds do the same thing over a longer period. A one-off report built to fill a gap this quarter becomes part of the process next quarter. New joiners learn the fixes, not the process. Before long, firefighting is simply how planning gets done, and the manual copying between files leaves a weak audit trail.

How to fix it: practical steps

  1. Map where the plan lives today. List every file, system and report that holds a piece of the plan: forecast, orders, stock, supply parameters, budget. Note who owns each and how often it changes.
  2. Find the handoffs. Mark each point where data is exported, copied or rekeyed between teams. Those are your main sources of drift and lost audit trail.
  3. Agree one set of master data. Product, location and customer hierarchies should be the same for every function. If demand plans by brand and finance reports by category, agree how the two map to each other before anything else.
  4. Put the plan in one place, with one version as the current one. Every function reads and changes the plan in the same place. Scenarios are fine if each is clearly labelled and everyone knows which version is live.
  5. Record changes where they are made. Every override should carry a reason code and a comment, and the history should be kept. Questions should go to a named person as a comment or task, not into a separate email thread.
  6. Link volume to value. Turn the supply plan into revenue, cost of goods and gross profit automatically, and compare it with the annual operating plan (AOP). Finance then sees what an operational change does to margin in the same cycle, not a month later.
  7. Measure the forecast, and the edits made to it. Track forecast accuracy and bias, and check whether manual changes improve the statistical baseline or make it worse. See how to measure forecast bias.
  8. Remove checks that are no longer needed. Once everyone works from one plan, some reconciliation steps have nothing left to do. Drop them deliberately, or habit will keep them.

If you are still in spreadsheets, our free planning template is a practical way to agree the structure before moving to a platform.

Show value early without skipping governance

It’s tempting to wait until every integration is designed and every requirement signed off. But long projects carry their own risks: requirements move on, business users lose patience, and parallel spreadsheets creep back because people still need to plan in the meantime.

A better approach is to get value early and build from there:

  • Start narrow. Pick one business unit or product family with a clear owner and a real planning pain.
  • Use the data you already have. Sales history, stock, open orders and the budget usually exist as extracts. Start with those. A full system integration can follow once the process has proved itself.
  • Keep checks short and clear. Agree up front what “good” looks like, for example forecast accuracy against a holdout period, one reconciled revenue figure and one agreed plan by a set date. Check against those criteria, not an open-ended list.
  • Involve IT early, on the parts that matter. Access control, single sign-on, data residency and audit logs are proper governance questions. Settle them at the start, not at the end.

Checklist: is your planning data fragmented?

  • Can demand, supply and finance each name the same current forecast version?
  • Do all functions use the same product, location and customer hierarchies?
  • Is every manual override recorded with a reason and an owner?
  • Can you see the gross-profit effect of a supply plan change in the same cycle?
  • Can you explain the gap between the forecast and the AOP by volume, price and mix?
  • Do you track forecast accuracy and bias every month?
  • Do you know whether planner overrides improve the forecast?
  • Could an auditor trace how this month’s plan was built?
  • Does your S&OP meeting spend most of its time on decisions rather than reconciling numbers?

More than two or three “no” answers means fragmentation is costing you decisions, not just time.

How Planamind helps

Planamind, from Anamind, puts demand, supply and finance in one plan. The demand planning engine runs 12 forecasting models and picks the best fit automatically. Forecast accuracy (FA%, WAPE, MAPE and bias) and a forecast value added (FVA) report show where overrides help and where they hurt. The supply plan flows into a gross-profit P&L, and a revenue bridge explains the gap to the AOP. Comments, @mentions, tasks, reason codes and override history keep the discussion attached to the numbers (see S&OP collaboration and reporting). Uploads are Excel-shaped, and teams typically go from their data to a first live plan in 48 hours, with full production by Day 30.

Frequently asked questions

What is fragmented planning data?

It’s when the pieces of a business plan, such as the forecast, stock, supply parameters and budget, sit in separate files or systems that are updated at different times by different teams. Each function ends up working from its own version, so decisions are based on numbers that don’t match.

Do we need to replace our ERP to unify planning data?

No. The ERP stays the system of record for transactions. Unified planning means one shared plan built on top of it. Many teams start from regular extracts of sales, stock and orders, and add deeper integration once the process is working.

How do we get finance to trust the operational plan?

Show finance the plan in their terms. Turn volumes into revenue, cost of goods and gross profit, compare them with the AOP, and explain the gap by volume, price and mix. Once finance can trace a margin figure back to the plan behind it, trust comes much more easily.

Where should we start?

Start with one product family and one monthly cycle. Map where the plan lives today, agree shared hierarchies, bring the data into one place and run a live S&OP meeting from it. Then widen the scope based on what you learn.

The post Fragmented planning data: one plan for demand, supply and finance appeared first on Anamind.

]]>
Your Supply Chain Thinks It’s Ready for AI. But Is It Really?  https://www.anamind.com/anamind-blog/ai-readiness-supply-chain-five-questions/ Tue, 07 Apr 2026 04:17:52 +0000 https://www.anamind.com/?p=996930 Before you spend a dollar on any AI platform, answer these five questions. Be brutally honest. Because your score on these five determines whether AI will transform your supply chain — or just drain your budget.  The AI Supply Chain Gold Rush — And Who Gets Left Behind  There’s a very specific kind of meeting happening in boardrooms across...

The post Your Supply Chain Thinks It’s Ready for AI. But Is It Really?  appeared first on Anamind.

]]>

Before you spend a dollar on any AI platform, answer these five questions. Be brutally honest. Because your score on these five determines whether AI will transform your supply chain — or just drain your budget. 

The AI Supply Chain Gold Rush — And Who Gets Left Behind 

There’s a very specific kind of meeting happening in boardrooms across the US right now. The slides say “AI-Powered Supply Chain.” The timeline is aggressive. The vendor has been selected. Everyone’s excited. 

And eighteen months later, the system is live, the invoice is paid, and the planner in seat 3B is still spending his mornings untangling spreadsheets. Nothing moved. 

This isn’t a rare story. It’s the dominant one. According to Grand View Research, the global AI in supply chain market is growing from $5 billion in 2023 toward over $51 billion by 2030. North America leads with the largest share of that investment. Yet across dozens of implementations, the failure pattern is almost always the same: companies bought AI-readiness they didn’t have. Technology wasn’t a problem. The foundation was. 

At Anamind, we’ve spent years sitting inside planning teams — at pharma companies, consumer goods manufacturers, automotive aftermarket leaders, fashion retailers, and Fortune 500 operations — watching what happens when AI meets an unprepared supply chain. We built our AI-powered planning platform and our Planning-as-a-Service model specifically because we saw what was missing long before anyone plugged in an algorithm. 

So, here’s what we want you to do before you book another AI demo: answer five questions. Be honest with it. 

38.9% CAGR of AI in supply chain market through 2030 38% North America’s share of global AI supply chain investment 2023 32.5% Revenue share held by supply chain planning — largest AI segment 
Q1 DATA FOUNDATION 
Can your data actually feed an AI model? 
AI needs clean, granular, consistently structured transactional history: sales orders, shipments, returns, promotions, and inventory movements — all time-stamped, all at the SKU and location level, all free of gaps and duplicates. It also means real-time connectivity, not weekly file dumps. 
Anamind’s Demand Planning solution integrates directly with major ERPs (SAP, Oracle, Microsoft Dynamics) creating a single source of truth. But integration alone isn’t enough if the data flowing through it is unclean. That’s why we always begin with a data readiness audit before any platform conversation. 
THE HARD TRUTH: Most companies don’t have data. They have spreadsheets, legacy ERP exports, manual corrections nobody documented, and “best guesses” baked into planning templates from 2017. AI can only work with what it’s given. If what it’s given is not trustworthy, you don’t get smarter decisions — you get faster wrong ones. Garbage in, garbage out. Just at machine speed. ⚠  If your planners spend more than 30% of their time cleaning data before they can use it — you are not AI-ready, regardless of what your tech stack looks like. That number is the norm at most mid-market manufacturers we talk to, not the exception. 
✓  FIX IT FIRST Invest in data governance, master data hygiene, and real-time ERP/WMS integration BEFORE buying any AI platform. If you don’t, you’ll spend the first year of your AI contract cleaning data by hand. 
Q2 FORECASTING MATURITY 
Do you know exactly where your forecast is wrong? 
Here’s a question we ask every new prospect: “What’s your forecast accuracy?” Most teams answer, “around 75%.” Then we ask: “Which SKUs are driving the 25% miss?” Silence. That silence costs millions every month. 
You need SKU-level tracking of both MAPE (Mean Absolute Percentage Error) and BIAS — because a model that consistently over-forecasts and one that consistently under-forecasts can have identical MAPE scores while creating completely different operational problems. 
Anamind’s platform includes built-in AI/ML forecasting with event marking, outlier correction, and regression analysis. The system surfaces your top error drivers automatically, so planners spend their time where it matters. 
THE HARD TRUTH: Most planning organizations track forecast performance at the aggregate level — a blended number that feels reassuring but tells you almost nothing actionable. AI doesn’t operate at the aggregate level. It works at the intersection of SKU, location, and time-period. If you can’t measure error at that granularity, you have no baseline to improve against. ⚠  If your team reports a blended accuracy number but can’t tell you which product families, geographies, or time horizons are driving your worst errors — you don’t have a forecasting process. You have a reporting process dressed up as one. 
✓  FIX IT FIRST Establish SKU × location × week forecast error tracking using MAPE + BIAS. Identify your top 20 error drivers before deploying any ML model. This exercise will tell you more about your planning health than any dashboard you’ve ever seen. 
Q3 HUMAN + AI ALIGNMENT 
Will your planning team actually trust what the AI tells them? 
This isn’t a criticism of experienced planners. Their intuition carries real value — they know the promotions that skew history, the seasonal dynamics the model hasn’t seen enough cycles to learn. The goal isn’t to replace that expertise. It’s to make it auditable and data driven. 
The solution is an ‘informed override’ culture. Planners should absolutely override AI recommendations — but they should log the reason every time they do. That log creates accountability for leadership and becomes training data that makes the model smarter over time. 
Anamind’s S&OP Collaboration platform makes the AI’s reasoning transparent. Planners can see why the system is recommending what it’s recommended — a fundamentally different experience from a black-box output that arrives without context. 
THE HARD TRUTH: The biggest reason AI supply chain implementations fail isn’t the algorithm. It’s the planner with fifteen years of experience who overrides every recommendation the system makes — not because the AI is wrong, but because they were never given a reason to trust it. Without deliberate change management, AI becomes an expensive decoration. ⚠  If your planners are overriding AI recommendations more than 40% of the time and can’t document why — your AI investment is producing zero business value, regardless of how sophisticated the model is. 
✓  FIX IT FIRST Build an ‘informed override’ culture before you deploy AI. Require planners to log override reasons. Run a change management program that involves planners in model validation — not as passengers but as co-authors of the AI’s learning process. 
Q4 PROCESS READINESS 
Is your S&OP process fast enough to absorb AI insights? 
If your consensus meeting happens monthly and cascading the output into procurement schedules takes another three weeks, you’ve built a 30-day lag into a system that generates fresh intelligence every day. The AI is sprinting. Your process is walking. 
Companies that fail to compress their planning cycles to match the speed of AI-generated insight will systematically underperform those that do. In 2025, tariff volatility from the US trade environment forced companies into replanning scenarios their monthly S&OP processes simply couldn’t accommodate in time. 
Anamind’s S&OP Collaboration tools surface exceptions, prioritize decisions by business impact, and create a shared workspace where cross-functional teams can align quickly — not after a three-week cascade. 
THE HARD TRUTH: AI can generate a fresh demand signal in minutes. Modern AI forecasting tools are continuously recalibrating based on POS data, weather, economic indicators, order patterns, and promotional calendars. The insight is almost always ready before anyone has acted on the last one. The bottleneck is the process around the AI. ⚠  A monthly S&OP cycle is a structural 30-day lag. In the volatile supply chain environment of 2026 — with tariff shocks, geopolitical disruption, and demand signals shifting week-to-week — that lag translates directly into lost sales, excess inventory, or both. Every single month. 
✓  FIX IT FIRST Redesign your S&OP cycle around weekly exception-based reviews before deploying AI. AI only creates value when your process can absorb and act on its outputs at the speed they are generated. Otherwise, you are paying for intelligence you are not using. 
Q5 ROI CLARITY 
Have you defined what “good” actually looks like after AI? 
This isn’t just about accountability after the fact. It’s about making better investment decisions upfront. When you know your current MAPE is 28% at the SKU level, you can set a meaningful target of 20% and understand what that improvement is worth in dollar terms. 
When you know your current inventory days-on-hand is 72, you can model what getting to 58 would do to working capital. These numbers change how you prioritize, what you implement first, and how you evaluate vendors. 
Our ROI Calculator is available at anamind.com/resources/roi-calculator/ — it’s the first conversation we want to have, not the last. Use it before you evaluate any platform. 
THE HARD TRUTH: Companies rush into implementation because the technology is compelling and competitive pressure is real. Twelve months later, the system is live. The vendor celebrates. Then someone in the CFO’s office asks: “What did this actually do for us?” Nobody has a clean answer — because nobody established a baseline before they started. No baseline = no ROI story. ⚠  If your AI proposal doesn’t include a specific forecast accuracy improvement target, a concrete inventory reduction goal, and a service level benchmark — it is a science project, not a business case. Enthusiasm is not a KPI. 
✓  FIX IT FIRST Baseline your current metrics today: MAPE, BIAS, inventory days-on-hand, service fill rate, planning cycle time, override rate. These numbers are your before photo. Anamind benchmarks target 10–20% inventory reduction + 5–20% forecast accuracy improvement within 12 months. 

Your AI Readiness Score 

Score yourself honestly on each of the five questions. One point if your organization has genuinely addressed the readiness requirement — zero if you haven’t, or if you’re not sure. Total your score and find your profile below. 

Score Profile What It Means Next Step 
0–1 Not Ready Foundational gaps in data and process. Any AI investment will fail without fixing this first. anamind.com/contact/ 
2–3 Partially Ready Some pieces in place but critical gaps remain. Fix-it program before platform selection. anamind.com/planning-as-a-service/ 
4 Almost There Strong foundation — the main risk is adoption and culture. Focus on change management now. anamind.com/solutions/ 
5 AI-Ready 🚀 Genuinely positioned to extract value from AI. Every month of delay is competitive disadvantage. anamind.com/contact/ 

“AI doesn’t fail because the algorithm is wrong. It fails because the organization wasn’t ready to use it right.” 

How Anamind Actually Gets You There 

We’re not a software company that hands you a platform and wishes you luck. Anamind was built — by practitioners, for practitioners — around one conviction: the gap between data and decision-making is a capability gap, not just a technology gap. Closing it requires the right tools, the right process design, and the right people alongside yours. 

Demand Planning & AI Forecasting AI/ML automatic forecasting with event marking, outlier correction, regression, and what-if analysis at SKU × location × week granularity with ERP integration built in. → Explore Demand Planning Stock Replenishment Planning Discrete event simulation of your supply chain. Dynamic inventory optimization. Expiration management. Safety stocks calibrated to actual demand variability. → Explore Replenishment Planning 
S&OP Collaboration & Reporting Compress your planning cycle without losing alignment. Exception-based review of workflows, shared planning boards, and real-time visibility that replaces the monthly marathon with weekly precision. → Explore S&OP Tools Planning-as-a-Service (PaaS) Not ready to build an internal AI planning capability from scratch? Our PaaS model gives you Anamind’s expert team as your extended planning arm — without IT capex or the risk of team attrition unraveling your investment. → Explore PaaS 
MRP & Procurement Planning BOM mapping, multi-supplier management, container capacity optimization — so purchasing decisions flow from the same demand signal driving your forecast. → Explore MRP Planning ROI Calculator & Assessment Before any platform conversation, we baseline your current metrics. Our free ROI Calculator shows the dollar impact of closing your specific readiness gaps — grounded in benchmarks from real implementations. → Use the ROI Calculator 

Industries We Serve 

Anamind works with companies across pharma and healthcare, consumer goods, fashion and retail, food and beverage, automotive aftermarket, chemicals and paints, home interiors, and industrial products. From startups building their first planning capability to Fortune 500 operations redesigning theirs, the engagement model is always the same: we start with your problem, not our product. 

Our case studies include a North American pharmaceutical manufacturer that cut inventory by nearly 50% within months of implementation — starting from a place of “perfect storm” chaos involving DSCSA compliance, tariff exposure, and cold-chain complexity. That result wasn’t magical. It was a structured readiness program followed by the right tools deployed in the right sequence. 

Browse our planning templates and research papers to start building your foundation before we talk. Or join one of our webinars — we run them regularly with industry leaders across sectors. 

The 2026 Reality Check 

Supply chain leaders going into 2026 are navigating a genuinely difficult environment: tariff uncertainty forcing constant network replanning, AI tools moving from pilot programs into daily operational use, and a widening gap between organizations that have built planning capability and those still reacting to disruptions after the fact. 

The companies winning right now aren’t the ones who bought the most sophisticated AI. They’re the ones who built the strongest planning foundation first — and then used AI to multiply the capability they’d already built. That’s what we help companies do. Not just selling software but building the capability that makes the software worth buying. 

If your score on the five questions above left, you uncomfortable — good. That discomfort is information. Use it. 

Not Sure Where You Stand? 

Book a free 30-minute readiness assessment with the Anamind team.  Just an honest look at where your supply chain is today — and what it will take to get it AI-ready. 

→  Book Free Assessment  |  anamind.com/contact/ 

→  Try the ROI Calculator  |  anamind.com/resources/roi-calculator/ 

About Anamind 

Anamind is an Advanced Analytical Planning company helping businesses build AI-powered supply chain capabilities across demand planning, inventory optimization, MRP, procurement, and S&OP. We work with manufacturers, retailers, and distributors across pharma, FMCG, automotive, fashion, and industrial sectors globally. Learn more → 

The post Your Supply Chain Thinks It’s Ready for AI. But Is It Really?  appeared first on Anamind.

]]>
How Pharma Supply Chain Planning in India Can Cut Inventory by 50% Before the DSCSA 2025 Deadline https://www.anamind.com/anamind-blog/pharma-supply-chain-dscsa-2025-inventory-optimization/ Thu, 20 Nov 2025 10:10:08 +0000 https://www.anamind.com/?p=996374 If you are managing pharma supply chain planning in India in 2025, you are navigating a ‘perfect storm. Between the looming November 2025 DSCSA compliance deadline, rising tariffs on imported APIs, and the explosion of cold-chain requirements for biologics, the margin for error has vanished. The era of managing multi-million dollar drug inventories on Excel...

The post How Pharma Supply Chain Planning in India Can Cut Inventory by 50% Before the DSCSA 2025 Deadline appeared first on Anamind.

]]>

If you are managing pharma supply chain planning in India in 2025, you are navigating a ‘perfect storm.

Between the looming November 2025 DSCSA compliance deadline, rising tariffs on imported APIs, and the explosion of cold-chain requirements for biologics, the margin for error has vanished. The era of managing multi-million dollar drug inventories on Excel spreadsheets isn’t just inefficient anymore—it’s a liability. 

At Anamind, we’ve seen firsthand how legacy planning models are buckling under these new pressures. But we’ve also seen the other side. We recently helped a leading North American pharmaceutical manufacturer transform their chaotic supply chain into a lean, compliant powerhouse cutting their inventory by nearly half in just months. 

Here is the reality of the market today, and the exact blueprint used to survive it. 

The New Rules of Pharma Supply Chain Planning in 2025

Before we look at the solution, we have to be honest about the problem. 
Three massive shifts are rewriting the playbook for pharma supply chain planning this year:”
“Companies that invest in pharma supply chain planning tools today will be the ones that survive compliance, tariffs, and cold-chain complexity.”


1. The “Track or Die” Mandate (DSCSA) 

The countdown is effectively over. By November 27, 2025, full interoperable tracking at the package level is mandatory for all dispensers and trading partners. 

    • The Risk: If your digital data doesn’t match your physical product, your shipments will be “quarantined” or rejected outright. 

    • The Reality: You can no longer separate inventory planning from data compliance. They are now the same thing. 

2. The Tariff Squeeze on Margins 

New tariffs of up to 25% on machinery and APIs imported from key hubs like China and India are inflating production costs. You cannot afford to hold “safety stock” just because you aren’t sure of your demand. Every unit of excess inventory now carries a significantly higher carrying cost. 

3. The Cold Chain Boom 

With the rise of cell and gene therapies, logistics have become temperature-critical. Real-time IoT tracking is no longer a luxury; it is a baseline requirement to prevent spoilage and ensure patient safety. 

So, how do you stay profitable in this environment? You stop guessing and start optimizing. 

We recently partnered with a major North American manufacturer of pharmaceutical and personal care products. Despite being a market leader with a presence in 18 countries, their backend was struggling. 

The Challenge 

    • Bloated Inventory: They were sitting on massive piles of excess stock, tying up millions in working capital. 

    • Shelf-Life Risks: Managing expiration dates for perishable drugs across different regions was a manual nightmare. 

    • The “Gut Feeling” Trap: Their purchase orders were largely based on the intuition of individual planners using non-standardized Excel sheets. 

How Anamind’s Pharma Supply Chain Planning Tools Solved It

We deployed a comprehensive Supply Planning re-engineering project using our Streamline solution, integrated directly with their SAP ERP. We moved them away from manual “ForecastPro” methods to a unified AI-driven system. 

The Results (In Just 5 Months) 

The transformation was fast and quantifiable: 

    • 40-50% Reduction in Inventory: Within 4–6 months, the client freed up nearly half of their trapped capital. 

    • Service Levels Maintained: They slashed stock without missing shipments—actually improving customer service by having the right stock available. 

    • Full Visibility: The new system provided instant visibility into stockouts and excess inventory, flagging issues before they became crises. 

How to Replicate This Success for Your Business 

This success wasn’t a fluke. It was a result of applying Anamind’s core methodologies to a complex problem. Here is how you can do the same. 

1. Ditch the Spreadsheets for AI 

Manual planning cannot account for the variables of 2025. Anamind’s AI & Machine Learning-based forecasting detects hidden trends and corrects outliers in real-time. This allows you to predict demand with precision, ensuring you only order what you need. 

Explore Solution: Anamind Demand Planning & Forecasting 

2. Integrate Compliance with Planning 

To meet the DSCSA 2025 deadline, your inventory data must be impeccable. Our solutions integrate directly with major ERPs (like SAP, Oracle, and Microsoft Dynamics), ensuring that your planning data acts as a “Single Source of Truth”. This prevents the data mismatches that lead to costly shipment quarantines. 

3. Optimize for Shelf-Life, Not Just Volume 

For pharma, “First-In-First-Out” isn’t enough. You need Expirations Management built into your replenishment logic. Our inventory optimization tools simulate supply chain events to minimize write-offs from expired goods. 

Explore Solution: Anamind Inventory Optimization 

4. Lack a Team? Use Ours. 

Talent gaps are real. If you don’t have an in-house team of data scientists, don’t worry. With our Planning-as-a-Service model, Anamind’s experts act as your extended planning arm, using our best-in-class algorithms to manage your supply chain for you. 

The Bottom Line 

The year 2025 will separate the agile from the obsolete. The companies that continue to rely on manual inputs and “safety stock” buffers will be crushed by compliance costs and tariffs. The ones that pivot to data-driven, automated planning will thrive. 

Smart pharma supply chain planning is no longer optional — it is the difference between growth and costly compliance failure.

Ready to future-proof your supply chain? 

See how much capital you can unlock today. 👉 Schedule a Demo with Anamind’s Supply Chain Experts 

The post How Pharma Supply Chain Planning in India Can Cut Inventory by 50% Before the DSCSA 2025 Deadline appeared first on Anamind.

]]>
Automotive Aftermarket Supply Chain Planning: How Indian Companies Are Reinventing Operations 2025  https://www.anamind.com/anamind-blog/automotive-aftermarket-supply-chain-challenges-2025/ Mon, 17 Nov 2025 11:17:53 +0000 https://www.anamind.com/?p=996361 Introduction: When a Broken Chain Costs More Than a Broken Part  A few years ago, when a car broke down, the biggest worry was the repair bill. Today, the real nightmare for automotive aftermarket businesses is not finding the part on time.  From long lead times to supplier delays, the global automotive aftermarket industry is...

The post Automotive Aftermarket Supply Chain Planning: How Indian Companies Are Reinventing Operations 2025  appeared first on Anamind.

]]>


Introduction: When a Broken Chain Costs More Than a Broken Part 

A few years ago, when a car broke down, the biggest worry was the repair bill. Today, the real nightmare for automotive aftermarket businesses is not finding the part on time. 

From long lead times to supplier delays, the global automotive aftermarket industry is facing unprecedented supply chain challenges — and 2025 is shaping up to be the year of transformation. 

According to recent industry reports, the global automotive aftermarket industry is facing unprecedented supply chain challenges — and 2025 is the year that automotive aftermarket supply chain planning has gone from a back-office function to a boardroom priority.
Container port with stacked shipping containers and cranes

The Automotive Aftermarket Supply Chain Planning Reality in 2025 

1. The Ripple Effect of Supplier Delays 

Most aftermarket players depend heavily on tier-2 and tier-3 suppliers across Asia. The result? Even a minor delay in one link causes a ripple effect across warehouses and dealerships. 

Lead times that were once 2–3 weeks have now stretched to 8–12 weeks, forcing planners to make blind forecasts and overstock safety inventory. 

The outcome: increased carrying costs, blocked capital, and poor service levels. 

Engine cylinder head with valves and rocker arms

2. Demand Forecasting: The Biggest Gap in Automotive Aftermarket Supply Chain Planning

Demand in the aftermarket sector has become unpredictable. Replacement parts, seasonal repairs, and regional demand patterns differ widely — making traditional forecasting methods unreliable. 

Companies still relying on spreadsheets or static ERP reports are missing the agility to adjust to real-time market shifts. 

What’s trending now is the move toward AI and ML-driven demand forecasting, enabling planners to detect patterns, account for seasonality, and simulate “what-if” demand scenarios. 

One such transformation is detailed in Anamind’s Automotive Case Studies — where an aftermarket company improved forecast accuracy by 25% and reduced backorders through data-driven planning. 
→ Read now

Pile of vintage car hubcaps and wheel parts

3. Inventory Optimization — The Silent Profit Lever 

The biggest irony? Most automotive distributors suffer both stockouts and overstock simultaneously. 
Without proper multi-location visibility, planners struggle to balance service levels and working capital. 

By implementing dynamic inventory optimization, businesses can identify slow movers, rationalize SKUs, and prioritize high-velocity parts. 

Companies using planning-as-a-service (PaaS) models from Anamind have achieved measurable improvements in fill rates and inventory turnover — without heavy system investment. 

To help professionals build similar strategies, the Automotive Supply Chain Guide and Planning Template Toolkit in Anamind’s resources section provide step-by-step frameworks to optimize stock levels and align inventory with demand. 
→ Read Now 

Trucks on a highway, seen from the driver's seat of a car

The Roadblocks — And the Breakthroughs 

Supplier Risk Diversification 

Many companies are now investing in dual sourcing and local vendor development to reduce dependency on a single region. Digitally mapping supplier networks has become standard practice, allowing planners to simulate risk and recovery times before disruptions occur. 

Abstract network of connected data points

Digital Twins for Supply Chains 

Another emerging trend is the creation of digital twins — virtual replicas of supply chains that model real-world behavior. 
This helps planners evaluate alternate routes, assess the impact of lead time changes, and preempt disruptions before they cascade into production losses. 

Team planning around a table with notes, charts and a laptop

Integrated Business Planning (IBP) 

The most mature companies have realized that planning can’t live in silos. Integrating demand, inventory, procurement, and financial planning ensure all departments align around one version of truth. 

Anamind’s IBP approach helps organizations transition from fragmented Excel-based decision-making to unified, data-driven planning systems. 

For companies serious about automotive aftermarket supply chain planning, this isn’t just operational anymore — it’s strategic

Mechanic working under a car in a workshop

How Leading Aftermarket Brands Are Adapting 

In the last year, several Indian and global players in the automotive aftermarket have taken bold steps: 

  • Uno Minda improved forecasting accuracy by blending machine learning models with planner expertise, resulting in higher service levels. 
  • Bosch Automotive invested in regional warehousing to reduce shipping delays and transportation costs. 
  • TVS Automotive Solutions implemented AI-based planning to manage multi-brand part distribution efficiently. 

Each of these examples highlights one common realization — resilience comes from visibility and intelligence, not guesswork. 

Laptop showing sales charts and analytics

The Way Forward — Data Intelligence as a Competitive Advantage 

What sets the winners apart isn’t luck — it’s the ability to see disruptions before they hit. 

This is where forward-looking planning powered by data, simulation, and human expertise comes in. 

As the automotive aftermarket evolves, the next wave of growth will depend on: 

  • Smarter demand planning 
  • Real-time data visibility 
  • Collaborative supplier networks 
  • Predictive analytics for proactive decision-making 

For deeper insights, explore Anamind’s Research Papers covering AI-driven forecasting models, simulation-based planning, and automation in aftermarket supply chains. 
→Read now

Frequently Asked Questions (FAQs) 

Q1. What’s causing the biggest supply chain disruption in the automotive aftermarket? 
Global supplier dependencies, fluctuating raw material costs, and transport delays — all of which extend lead times and reduce visibility. 

Q2. How can companies predict aftermarket demand better? 
By adopting AI/ML forecasting models and integrating external factors like seasonality, macroeconomic data, and vehicle lifecycle patterns into planning systems. 

Q3. What’s the role of Anamind in solving these challenges? 
Anamind provides automotive aftermarket supply chain planning through its Planning-as-a-Service (PaaS) model — combining trained planning analysts with advanced AI forecasting tools to help spare parts companies achieve accurate, real-time planning.

Q4: What is automotive aftermarket supply chain planning and why does it matter?
Automotive aftermarket supply chain planning is the process of forecasting spare part demand, optimizing inventory across warehouses, and coordinating supplier networks to ensure the right part is available at the right location at the right time. For aftermarket distributors and OEM parts suppliers, poor planning directly results in stockouts, delayed repairs, and lost revenue.

Q5: How much can AI improve forecast accuracy for automotive spare parts companies?
Based on real implementations, companies using AI-based demand planning for automotive spare parts have improved forecast accuracy by 5–20%, significantly reducing both stockouts and excess inventory simultaneously.

The post Automotive Aftermarket Supply Chain Planning: How Indian Companies Are Reinventing Operations 2025  appeared first on Anamind.

]]>
How Indian Pharma Companies Are Protecting Supply Chains from Global Shocks and US Tariff Disruptions (2025) https://www.anamind.com/anamind-blog/pharma-supply-chain-planning-against-global-shocks/ Thu, 09 Oct 2025 06:17:07 +0000 https://www.anamind.com/?p=996323 When the US announced potential tariffs on imported drugs, the tremors were felt across India’s pharma ecosystem. The headlines screamed ‘US Tariff Threats Push Indian Pharma to Diversify Beyond Generics,’ and beneath that lay a deeper warning — India’s pharma supply chain disruption risk is real, and most companies are dangerously underprepared. For years, the...

The post How Indian Pharma Companies Are Protecting Supply Chains from Global Shocks and US Tariff Disruptions (2025) appeared first on Anamind.

]]>

When the US announced potential tariffs on imported drugs, the tremors were felt across India’s pharma ecosystem. The headlines screamed ‘US Tariff Threats Push Indian Pharma to Diversify Beyond Generics,’ and beneath that lay a deeper warning — India’s pharma supply chain disruption risk is real, and most companies are dangerously underprepared.

For years, the Indian pharmaceutical sector has been the world’s generic powerhouse. Nearly 90% of chronic care drugs in the US — from amlodipine to gabapentin — come from Indian manufacturers. But the same success has created a single-point dependency. One trade policy, one disruption, and the ripple hits every plant, every warehouse, every hospital shelf.

For a deeper look at how one manufacturer solved this, read our guide on [pharma supply chain planning and the DSCSA 2025 deadline].”

🧩 The Hidden Weak Links in India’s Pharma Supply Chain

Let’s be honest: pharma isn’t struggling because it can’t manufacture — it’s struggling because it can’t plan.

  • Long lead times create a lag between demand and response.
  • Strict regulations add layers of approval before every shipment.
  • Cold-chain logistics amplify risk — one temperature slip, and you lose millions in product.
  • Forecasting blind spots make it impossible to match production to real market needs.
  • And finally, expiry management — the silent killer of profitability.

Every expired batch is not just lost revenue; it’s a planning failure.

🌍 The Tariff Wake-Up Call: Why Indian Pharma Supply Chain Disruption Is Now a Boardroom Issue

When the US administration threatened 100% tariffs on imported pharma products, Indian companies realized something: the problem wasn’t tariffs — it was overdependence.

Indian pharma firms like Sun Pharma and Dr. Reddy’s wield enormous influence in the global generic market, but a large share of their exports goes to the US. That’s too much exposure for a sector that runs on tight regulatory margins and complex supply chains.

So, diversification became the buzzword — Latin America, Africa, Eastern Europe — all new markets. But here’s the catch: entering new markets with the same old planning systems won’t work.

For Indian pharma companies navigating this pharma supply chain disruption, the solution isn’t just geography — it’s planning intelligence. Without strong forecasting intelligence, inventory optimization, and integrated supply planning, diversification is just shifting risk — not reducing it.

🧠 “How Smarter Planning Reduces Pharma Supply Chain Disruption in India

Traditional ERP systems tell you what happened.
Smarter Planning systems tell you what will happen — and what to do about it.

Pharma companies today need planning platforms that can:

  • Sense demand volatility in real time.
  • Factor in expiry-driven production constraints.
  • Simulate “what-if” tariff or regulatory scenarios.
  • Optimize cold-chain logistics across temperature zones.
  • Enable better collaboration between R&D, manufacturing, and distribution.

This is where Planning Intelligence changes the game.

💡 From Forecasting to Foresight

Forecasting accuracy in pharma isn’t just about algorithms; it’s about context. For Indian manufacturers particularly, where pharma supply chain disruption can cascade from a single API import delay, scenario-based forecasting is no longer optional.

That’s exactly where Anamind’s consulting approach comes in — integrating domain expertise, data modeling, and planning tools that adapt as fast as the market does.

Because in pharma, reactive planning is expensive, but proactive planning is powerful.

🚀 The Way Forward for Pharma Supply Chain Leaders

The next decade of pharma competitiveness won’t be driven by who manufactures faster — but by who plans smarter.

Indian pharma companies that modernize their supply chain planning today will be the ones to withstand future pharma supply chain disruptions — whether tariffs, pandemics, or raw material shortages.

If your Indian pharma supply chain is still running on spreadsheets or siloed systems, the next disruption — tariff, pandemic, or regulatory shock — won’t wait for you to be ready.

📞 Ready to Build a Resilient Pharma Supply Chain?

Discover how Anamind’s Planning Intelligence framework helps pharma leaders improve forecasting accuracy, reduce expiries, and optimize end-to-end planning.

Frequently Asked Questions: Pharma Supply Chain Disruption in India

Q1: Why are Indian pharma supply chains so vulnerable to US tariff changes? A: India supplies a large share of the generic drugs consumed in the US market. This heavy export concentration means any US trade policy shift — tariffs, import restrictions, or FDA regulatory changes — creates immediate pressure on Indian manufacturers’ production schedules, API procurement costs, and inventory levels.

Q2: What is the biggest planning mistake Indian pharma companies make during supply chain disruptions? A: Reactive planning. Most companies increase safety stock after a disruption hits rather than using scenario-based forecasting to anticipate it. By the time the spreadsheet is updated, the window to act has closed. Proactive planning systems that model “what-if” scenarios give planners early warning, so they can adjust procurement and production before the disruption reaches their stock.

Q3: How does expiry management factor into pharma supply chain resilience? A: Expired inventory is one of the most expensive planning failures in pharma. A resilient pharma supply chain uses First-Expiry-First-Out (FEFO) logic built directly into replenishment planning — ensuring that batches closest to expiry are prioritized for dispatch, reducing write-offs significantly.

Q4: How can Indian pharma companies start improving supply chain resilience quickly? A: Three immediate actions make the biggest difference: replacing Excel-based planning with AI-driven demand forecasting, integrating inventory data across manufacturing sites and warehouses into a single dashboard, and establishing a formal S&OP process that connects demand signals to procurement decisions every month.


The post How Indian Pharma Companies Are Protecting Supply Chains from Global Shocks and US Tariff Disruptions (2025) appeared first on Anamind.

]]>
QSR Supply Chain Planning in India: How Fast Food Chains Are Tackling Demand Volatility (2025) https://www.anamind.com/anamind-blog/qsr-supply-chain-freshness-efficiency/ Tue, 16 Sep 2025 10:45:21 +0000 https://www.anamind.com/?p=996246 Quick Service Restaurants (QSRs) are at a crossroads. With global demand expected to surge from USD 1.05 trillion in 2025 to nearly USD 1.93 trillion by 2032, brands are scaling faster than ever. But beneath this rapid expansion lie pressing challenges—rising input costs, unpredictable demand, supply disruptions, and regulatory hurdles—that can erode profits and customer...

The post QSR Supply Chain Planning in India: How Fast Food Chains Are Tackling Demand Volatility (2025) appeared first on Anamind.

]]>

Quick Service Restaurants (QSRs) are at a crossroads. With global demand expected to surge from USD 1.05 trillion in 2025 to nearly USD 1.93 trillion by 2032, brands are scaling faster than ever. But beneath this rapid expansion lie pressing challenges—rising input costs, unpredictable demand, supply disruptions, and regulatory hurdles—that can erode profits and customer trust.

As someone who has

 spent two decades helping supply chain leaders navigate complexity, I understand that growth without operational resilience is a risky path. Inventory mismanagement, cold chain failures, and inaccurate forecasts are quietly draining margins, while sustainability pressures and evolving consumer expectations demand smarter, data-driven planning.

This isn’t about buzzwords or expensive overhauls. It’s about applying proven supply chain strategies that balance efficiency, compliance, and customer experience. At Anamind, we’ve worked closely with QSR brands globally to turn these challenges into competitive advantages—helping them reduce waste, unlock working capital, and scale sustainably.

In this blog, I’ll share the insights, trends, and practical strategies that are helping QSRs not only survive but thrive in today’s market.

The Real Challenges Facing QSR Supply Chains

QSRs operate in a fast-paced environment where a small error in inventory planning or a delay in replenishment can lead to wasted resources, lost customers, or compliance issues. Here’s what most supply chain teams are grappling with:

1. Perishable Inventory Risks

Fresh produce, dairy, and meats come with short shelf lives. In regions like India, cold chain failures result in up to 20% spoilage, affecting both costs and customer trust.

2. Demand Volatility

Seasonal demand, promotions, or unforeseen disruptions can cause swings in customer orders. Overestimating demand leads to waste, while underestimating it results in stockouts and lost revenue.

3. Regulatory Compliance

From FSSAI in India to global labeling and packaging requirements, traceability is non-negotiable. QSRs need systems that ensure safe, compliant operations without adding complexity.

4. Rising Costs

Inflation in raw materials, labor shortages, and high rent are squeezing margins. Many brands find it hard to invest in technology without clear ROI models.

5. Sustainability Expectations

Consumers are demanding healthier, plant-based options and eco-friendly packaging. Waste reduction and energy optimization are no longer optional—they’re expectations.

How Data-Driven Planning Makes the Difference

With the right planning framework, these challenges can be addressed without reinventing the wheel. Anamind’s approach focuses on delivering real-world, actionable solutions rather than theoretical models.

AI-Powered Demand Forecasting

Using advanced analytics, we help brands forecast demand with remarkable accuracy—improving baseline predictions from 76% to 90% in many cases. This allows QSRs to manage stock levels proactively, reducing both waste and shortages.

Shelf-Life Aware Inventory Management

Our systems factor in product expiry and shelf-life constraints, optimizing distribution to ensure outlets receive supplies that remain fresh and compliant with local standards.

Cold Chain Optimization

For temperature-sensitive products, we integrate real-time tracking and logistics planning to avoid spoilage, cutting down losses and enhancing customer satisfaction.

Compliance Made Simple

Through traceability models that map each product from farm to fork, we ensure regulatory reporting is accurate, efficient, and audit-ready.

Sustainability at the Core

Lean planning doesn’t just save money—it supports environmental goals. Our solutions help reduce food waste by 10 to 50 tons per USD 1 million in stock value, contributing to greener operations.

Real-World Results That Speak for Themselves

In our partnerships with global QSR leaders, we’ve achieved:

✔ Zero expiry losses, even during volatile demand periods
✔ Over 25% reduction in inventory holding costs
✔ 20% optimization in distribution center space
✔ 30%+ increase in sales efficiency
✔ Faster recovery during crises like the COVID-19 pandemic, outperforming industry averages

These results aren’t hypothetical—they’re the outcome of applying technology, data, and best practices to real supply chain problems.

Where the Industry is Headed

The next wave of supply chain transformation will be driven by:

  • AI-driven dynamic pricing and forecasting, adjusting in real-time to external factors
  • Hybrid kitchen models, blending dine-in, delivery, and pickup services
  • Sustainable packaging innovations, reducing plastic and enhancing brand trust
  • Local sourcing strategies, reducing lead times and freight costs
  • Integrated loyalty systems, offering personalized customer experiences without operational inefficiencies

QSRs that invest in planning today will be the ones that set new standards tomorrow.

Wrapping Up: Planning for Profit, Purpose, and Performance

If you’re in charge of supply chain or operations in the QSR space, the path forward is clear: operational excellence built on data-driven decision-making, strategic forecasting, and sustainable practices. It’s not just about reducing waste—it’s about building a resilient system that supports growth, customer satisfaction, and compliance at every turn.

At Anamind, we’re committed to helping QSR brands turn planning into a strategic advantage. Whether you’re looking to enhance forecasting accuracy, reduce costs, or meet new regulatory standards, we’re here to partner with you.

✅ Take the Next Step

📥 Download the QSR Guide
Gain actionable insights, best practices, and proven strategies tailored to the unique supply chain challenges of QSRs.
👉 Download the Guide Now

📅 Join Our QSR Event in Mumbai
Learn from industry experts, network with peers, and discover how to optimize your supply chain for efficiency and growth.
🗓 26 September 2025 | Ginger Airport, Mumbai
👉 Register for the Event

FAQ: QSR Supply Chain Planning in India

Q: What are the biggest supply chain challenges for QSR brands in India? A: The main challenges include cold chain infrastructure gaps, inconsistent supplier quality across regions, high demand volatility driven by promotional campaigns, and the difficulty of forecasting demand in new Tier 2/3 city markets where historical data is limited.

Q: How do QSR companies forecast demand accurately? A: Most leading QSR chains use demand planning software that combines historical sales data, promotional calendars, weather patterns, and local event data. At least two years of sales history helps a model separate seasonal patterns from trend, which makes the forecast more reliable.

Q: What is the difference between FMCG and QSR supply chain planning? A: FMCG supply chains typically involve longer lead times and wholesale distribution, while QSR supply chains require near-real-time replenishment, fresher inventory cycles, and tighter integration between outlets and regional distribution centers.

Q: How can Indian QSR brands reduce food waste in their supply chains? A: Better demand forecasting directly reduces food waste by aligning ordering quantities with actual consumption. AI-powered planning tools help reduce food waste by improving forecast accuracy at the SKU and outlet level, so fresh stock is ordered closer to what each outlet will actually sell.

Q: Is outsourced supply chain planning suitable for QSR companies? A: Yes. Planning-as-a-Service (PaaS) models work well for mid-sized QSR brands that lack in-house planning expertise. It gives them enterprise-grade forecasting without building a full planning team in-house.

The post QSR Supply Chain Planning in India: How Fast Food Chains Are Tackling Demand Volatility (2025) appeared first on Anamind.

]]>