At $4.08 per share against $5.85 in trailing 12-month EPS, Exxon runs a 69.74% earnings payout ratio. Fiscal year 2025 free cash flow of $26.13 billion easily covered the dividend, and interest coverage of 56.28x is extraordinary by any measure. CEO Darren Woods highlighted “an industry-leading balance sheet that gives us unmatched flexibility.” Rating: Very Safe.
Five companies in five different industries pay these dividends: drugs, oil, pipelines, private credit and nicotine. Each one is supported by cash flow that covers the payout today and a track record that shows how management handles it. Forward yields run from 2.63% to 10.18%, and the most recent sign of confidence came days ago, when Philip Morris International (NYSE:PM) raised its quarterly dividend to $1.60 from $1.47. That is an 8.8% increase. A look at each payout’s cash flow and balance sheet shows how they hold up.
AbbVie: Immunology Growth Is Paying for a Rising Dividend
AbbVie (NYSE:ABBV) pays an annualized forward dividend of $6.92. At the latest price of $262.90, that works out to a 2.63% forward yield. The next ex-dividend date is October 15, 2026, and payment follows on November 16, 2026. Its yield is the lowest on this list. AbbVie earns its place through dividend growth and coverage.
Dividend safety: AbbVie’s GAAP trailing EPS of $3.54 sits below the dividend because acquired research charges drag on reported earnings. That drives the trailing P/E to about 74x. Adjusted earnings give a better picture of cash. Management’s adjusted EPS guidance of $13.87 to $14.07 puts the forward dividend at about 50% of the center. The free cash flow yield of 3.83% is higher than the dividend yield. Net debt stands at 2.26x EBITDA, and interest coverage is 6.94x. The dividend history shows a higher quarterly payment every year since AbbVie began trading as a standalone company in 2013. The payment has gone from $0.40 in 2013 to $1.73 in 2026.
Bull case: AbbVie has replaced most of what it lost when Humira’s patent protection ended. Second-quarter results showed Skyrizi sales rising 24.4% to $5.505 billion and Rinvoq sales climbing 24.5% to $2.525 billion. Humira fell to just $756 million. Neuroscience grew 20.3% to $3.23 billion, and total revenue reached $16.99 billion, up 10.2% from a year earlier. The stock trades at about 16x forward earnings. The average analyst target is $278.86, with 8 strong buy and 16 buy ratings.
Risk: Acquisitions keep moving earnings guidance around. A pending $10.9 billion deal knocked $0.14 off the 2026 outlook. Meanwhile, Imbruvica sales fell 29.4%, so the immunology drugs have to keep growing quickly to make up the difference.
Chevron: Record Output and a 39-Year Raise Streak
Chevron (NYSE:CVX) pays $1.78 per quarter, an annualized $7.12. That is a 3.44% forward yield at $206.79. The yield has come down this year because the stock is up 39.38% year to date.
Dividend safety: Chevron generated $18.095 billion in second-quarter free cash flow. Based on the current share count, one quarter’s dividend costs about $3.49 billion. The dividend matches about 69% of trailing EPS of $10.38. The balance sheet is conservative. Net debt is 1.08x EBITDA, debt-to-equity is 0.25, and interest coverage is 13.7x. Chevron also paid down $8.41 billion of debt during the quarter. The company called its most recent increase its 39th consecutive annual raise, and the dividend history supports the recent run: $1.51 in 2023, $1.63 in 2024, $1.71 in 2025 and $1.78 in 2026.
Bull case: The Hess acquisition is paying off. Worldwide production rose 20% to 4,070 MBOED, and U.S. upstream output hit a record 2,077 MBOED. Chevron reached $3 billion in annual structural cost savings six months early and captured $1.5 billion in Hess synergies within a year of closing. It also signed a 20-year, 2.67 GW agreement to supply power to an AI data center in Texas. CEO Mike Wirth said the quarter delivered “record U.S. upstream production, record crude throughput in our U.S. refineries, and exceptional reliability across key assets.” The stock trades at about 15x forward earnings, and analysts’ average target is $224.62.
Risk: High oil prices drove much of the second-quarter result. Brent averaged $104 per barrel, compared with $68 a year earlier. In the first quarter, free cash flow was negative $1.549 billion, so cash generation can swing sharply from one quarter to the next.
MPLX: Ultra-High-Yield Distributions With 12.5% Raises Planned
MPLX (NYSE:MPLX) pays $1.0765 per unit each quarter, or $4.306 a year. At $56.39, that is a 7.64% forward yield, which puts MPLX firmly in ultra-high-yield territory. The units are down 4.42% over the past month. MPLX is a master limited partnership, so unitholders get a K-1 tax form instead of a 1099.
Dividend safety: Second-quarter distributable cash flow of $1.45 billion covered the distribution with room to spare. Management is aiming a 1.3 coverage ratio for 2026, 2027 and beyond. Leverage is 3.7x, below the partnership’s 4.0x target. The payout went from $0.85 in 2024 to $0.9565 and then $1.0765, which matches two straight raises of 12.5%. Management said on the call that it does not need acquisitions to hit its 2027 coverage goal.
Bull case: Natural gas volumes are driving growth. Operated gathering throughput rose 15% to 6,859 MMcf/d, and Natural Gas and NGL Services adjusted EBITDA increased 11% to $614 million. Harmon Creek III started operating in August. The Blackcomb pipeline should be in full service in the fourth quarter, and BANGL volumes are expected to reach 300,000 barrels per day by year-end. CEO Maryann Mannen said MPLX “anticipate[s] growing our distribution at this rate again in 2026 and in 2027.” Analysts’ average target is $62.85.
Risk: MPLX depends heavily on its parent refiner, which is its primary customer. It is also spending more: 2026 growth capital rose by $500 million to $2.9 billion, interest expense is going up, and crude pipeline throughput fell 5%.
Ares Capital: A 10% Yield Backed by $1.38 Per Share in Spillover Income
Ares Capital (NASDAQ:ARCC) pays $0.48 per quarter, or $1.92 a year. At $18.86, that is an ultra-high 10.18% forward yield. The shares trade just below net asset value (NAV) per share of $19.35, at a price-to-book ratio of 0.99.
Dividend safety: Second-quarter core EPS of $0.47 came in a cent below the dividend. Management pointed to the longer record: “Over the last 12 months, core earnings have exceeded our regular dividend.” Ares Capital also has an estimated $988 million of spillover income, or $1.38 per share. That is taxable income it earned in the past and can still pay out, which gives it a buffer. Leverage is 1.12x debt-to-equity net of cash. Liquidity is about $6 billion, and no more unsecured notes mature in 2026. The company has paid a steady or higher regular dividend for 68 consecutive quarters, and the payout has been $0.48 every quarter since March 2023.
Bull case: Ares Capital is the largest publicly traded business development company (BDC). Its portfolio totals $29.35 billion across 619 companies, and 71% of it is floating rate. The weighted average yield on its debt investments is 10.3%. New senior loan spreads were 20 basis points wider than in late 2025. A new commercial paper program could cut funding costs by 50 to 100 basis points compared with secured borrowings. Analysts’ average target is $20.77.
Risk: Credit quality is slipping. Non-accrual loans rose from 2.1% to 2.4% at cost during the quarter. NAV per share fell to $19.35 from $19.94 at the end of 2025, and $183 million in unrealized losses cut GAAP EPS to $0.24.
Philip Morris International: A Fresh Raise Funded by Smoke-Free Growth
Philip Morris’s new annualized dividend of $6.40 works out to a 3.41% forward yield at $187.50. The stock went ex-dividend on October 2, 2026, so anyone buying now will first collect the higher payment in January.
Dividend safety: The new payout matches about 77% of the center of 2026 adjusted EPS guidance, which is $8.26 to $8.41. That level is steep for a typical company but manageable for a tobacco cash machine. Philip Morris expects about $13.5 billion of operating cash flow this year against $1.4 billion to $1.6 billion of capex, and it is buying back no shares. Net debt is $43.1 billion, or 2.35x adjusted EBITDA, and the company is aiming for around 2.0x by year-end. Quarterly payments have continued without a break since 2008, and the payment has risen from $1.17 in 2020 to $1.60 now.
Bull case: Second-quarter revenue grew 10.4% to $11.19 billion, and adjusted EPS of $2.20 beat the $2.05 estimate. International smoke-free revenue rose 14.2%, and VEEV vape shipments jumped 55.1%. The FDA authorized 20 ZYN variants as modified-risk tobacco products, which lets them be marketed as lower risk. Operating cash flow rose 61.0% to $5.49 billion. CEO Jacek Olczak said the company drove “net revenues to over $11 billion for the first time.” Analysts’ average target is $208.13.
Risk: More competition in U.S. oral nicotine is weighing on ZYN sales. Philip Morris also took a $511 million non-cash impairment, and Poland’s flavor ban hits its heated tobacco business.
Five Payouts Backed by Cash Flow
All five payouts are supported by a clear source of cash: AbbVie’s immunology drugs, Chevron’s balance sheet, MPLX’s target of 1.3x coverage, Ares Capital’s spillover income and Philip Morris’s growing smoke-free business. Together, they offer a mix of growing dividends and high current income from five different sectors. For the rest of the year, keep an eye on Ares Capital’s non-accruals and MPLX’s second-half project ramp.
The post 5 High-Yield Dividend Stocks to Buy for October Income with Cash Flow to Spare appeared first on 24/7 Wall St..
]]>A $160,000 salary puts a 58-year-old near peak earnings and within a decade of Social Security’s full retirement age of 67. To replace that paycheck with portfolio income, start with one equation: divide the income target by the portfolio yield to get the required capital. Run the math at three yield levels, then test it on a six-holding sample portfolio, and you’ll likely get a result similar to the figures below.
Capital Required at Every Yield Level
| Tier | Yield | Capital Needed for $160,000 |
|---|---|---|
| Conservative | 3.5% to 4% | $4.57 million to $4.0 million |
| Moderate | 6% to 7% | $2.67 million to $2.29 million |
| Aggressive | 10% to 12% | $1.6 million to $1.33 million |
Conservative Tier Demands the Most Capital and Grows Income
Start by taking $160,000 and dividing by 0.035 is about $4,571,000. This tier holds dividend growth funds, broad high-dividend ETFs, and blue chips. WisdomTree U.S. Quality Dividend Growth Fund (NASDAQ:DGRW) yields about 1.2% on a trailing basis. iShares Core High Dividend ETF (NYSEARCA:HDV) yields roughly 3% and charges 0.08%.
Income growth is the return for investors in this tier. AbbVie (NYSE:ABBV) lifted its quarterly dividend from $1.64 to $1.73, a raise of about 5%, and yields about 2.7%. Chevron (NYSE:CVX) went from $1.71 to $1.78 and yields about 3.5%.
Moderate Tier Cuts the Requirement but Slows Growth
Another option is to take $160,000 and divide by 0.06, which is about $2,667,000. REITs, preferred shares, and covered call strategies live here. Dividend growth slows, and income may trail inflation over a 30-year retirement.
The REIT VICI Properties (NYSE:VICI) now yields about 8% because its shares fell 26% over the past year, even as it raised its quarterly payout to $0.46. Its leases carry roughly 2% annual escalators. The 10-year Treasury sets the benchmark: at 5.3%, it gives moderate-tier income without equity risk.
Aggressive Tier Pays Now and Erodes Principal
The third option is to take $160,000 and divide by 0.12, which results in about $1,333,000. Business development companies, mortgage REITs, and option-income funds dominate. Global X S&P 500 Covered Call ETF (NYSEARCA:XYLD) yields about 10.4% trailing. Over the past decade, its share price slid about 7%, and its total return of about 126% trailed DGRW’s 267%.
Testing a Six-Holding Income Portfolio
Take this mix: DGRW 15%, HDV 20%, XYLD 20%, VICI 15%, AbbVie 15%, and Chevron 15%. Its combined yield is about 5%, meaning roughly $3.2 million to produce $160,000.
The covered call and REIT positions supply current cash. The dividend growers supply the increases, which help offset the flat payouts on the high-yield side (we laid out this mix-the-paycheck approach, with the payout calendar and withdrawal order, in a free guide here: The Paycheck Portfolio Method).
Why Lower Yields Can Out-Earn Higher Ones
A $4.57 million portfolio at 3.5% pays $160,000 in year one. If those dividends grow 8% a year, income makes about $320,000 in nine years, when this investor turns 67. A $1.33 million portfolio at 12% with no growth still pays $160,000, and inflation cuts what that buys.
At 58, a 25-year to 35-year horizon gives compounding time to work. Sequence-of-returns risk (the danger that poor returns arrive just as withdrawals begin) is highest in the years just before and after retirement, so a heavy aggressive allocation leaves less room to recover from early losses.
Three Steps to Take Before Choosing a Tier
- Measure actual spending. After payroll taxes, retirement contributions, and a paid-off mortgage, the real target may sit well below $160,000, which moves you into a lower row of the table.
- Compare 10-year total returns. Compare a dividend growth fund with a covered call fund over the same period. The gap between DGRW and XYLD shows how high payouts can trade away long-term wealth.
- Model taxes by account. Qualified dividends from AbbVie and Chevron receive lower rates, while REIT distributions and covered-call distributions are often taxed as ordinary income. At peak-bracket earnings, holding VICI and XYLD in IRAs can raise after-tax income.
The post How Much Does a 58-Year-Old Need Invested to Replace a $160,000 Salary With Dividends? appeared first on 24/7 Wall St..
]]>Energy dividends are paid out of oil and gas sales, and the companies don’t control the price of either. When crude is high, every payout looks safe. When crude falls, a weak balance sheet shows up fast. Right now prices are working in shareholders’ favor: Brent averaged $103.85 per barrel in the second quarter, and the big producers are using that cash to pay down debt, buy back stock and raise dividends. For an income investor, the real question is which payouts would still hold when oil falls. Below, Exxon Mobil (NYSE:XOM), Chevron (NYSE:CVX), BP (NYSE:BP) and Occidental Petroleum (NYSE:OXY) are compared on coverage, free cash flow, debt and dividend history, starting with the safest.
Exxon Mobil: 43 Straight Years of Raises Backed by a Fortress Balance Sheet
Exxon yields 2.56%. It is a fully integrated major. It pumps oil and gas in the Permian Basin, Guyana and its LNG projects, then processes that output and turns it into chemicals. Those best assets made up 59% of 2025 production, and total output reached a new high of 4.7M boe/d. Having refining and chemicals helps when crude prices fall, because cheaper oil brings down the cost of their raw material.
Dividend safety: This is the strongest income profile in the group. The forward annual dividend is $4.12 per share, compared with trailing diluted EPS of $7.81. The free cash flow yield of 3.50% is higher than the dividend yield, so the payout is covered by cash the business actually brings in. Exxon generated $26.13B of free cash flow in 2025. Debt is low: the debt-equity ratio is 0.168, net debt to EBITDA is 0.548, and earnings cover interest costs 56.3x. Exxon says it has grown annual dividend per share for 43 consecutive years. The quarterly payout went from $0.95 in 2024 to $0.99 in 2025 and is now $1.03.
Bull case: Exxon has cut $15.6B in structural costs since 2019 and is aiming for $20B by 2030. It also plans $20B of share repurchases this year. Fewer shares outstanding makes each future raise cheaper to fund. The stock trades at 21 and 15 times trailing and forward earnings, respectively. The CEO, Darren Woods, said “ExxonMobil is a fundamentally stronger company than it was just a few years ago,” and called it a “durable platform to grow earnings, cash flow, and shareholder value through 2030 and beyond.”
Risk: Reported earnings can swing a lot. In the first quarter, net income fell to $4.18B after a $3.88B mark-to-market timing charge and $706M in losses from Middle East supply disruptions. The effective tax rate also rose to 40%.
Chevron: Bigger After Hess and Generating Cash Fast
Chevron yields 3.14%, which is the most income of the two US majors. It is also integrated, with production, processes, chemicals and now power generation. After buying Hess, it is much larger: worldwide production grew 20% from a year earlier to 4,070 MBOED in the second quarter, and US refineries ran at 97% utilization.
Dividend safety: The forward annual dividend is $7.12, compared with trailing diluted EPS of $10.38. The free cash flow yield of 4.08% is above the dividend yield. Second-quarter operating cash flow was $22.63B against capex of $4.54B, leaving $18.10B of free cash flow. Chevron used part of that to repay $8.41B of debt. The debt-equity ratio is 0.251 and interest coverage is 13.7x. The dividend has gone up in every year of the recent record: from $1.12 a quarter in 2018 to $1.29 in 2020, $1.71 in 2025 and $1.78 now. That includes a raise during 2020, when oil prices fell.
Bull case: The Hess deal is already paying off. Chevron reached a $3B annual run rate of cost savings six months ahead of plan and captured $1.5B in Hess synergies within a year. It has now returned over $5 billion to shareholders for the 16th consecutive quarter. It also signed a 20-year power deal for a 2.67 GW West Texas AI data center project, which adds a source of income that doesn’t depend on oil prices. The forward P/E is 15.
Risk: Hess added debt. Net debt to EBITDA is 1.08, compared with Exxon’s 0.548. That gives Chevron less of a cushion if a long oil downturn hits while it is still integrating the deal.
BP: The Biggest Yield, With a Turnaround Attached
BP yields 4.59%, the highest in this group. US investors own it through an American Depositary Share (ADS), which trades on the NYSE in dollars and represents a set number of BP’s London-listed ordinary shares. BP announces its dividend in cents per ordinary share and then converts it to a per-ADS amount. The latest payout was 8.660 cents per ordinary share, or $0.5196 per ADS. BP is an integrated major with a large processes business, which helped this year: its refining margin indicator was $29.6/bbl versus $11.9/bbl a year earlier.
Dividend safety: Coverage is fine at current oil prices. Second-quarter operating cash flow was $10.86B against capex of $3.09B. Its finances are weaker. Net debt was $25.3B at the end of the first quarter, up from $22.2B at year end. The dividend history includes a cut: the ADR payout fell from $0.63 to $0.315 in 2020. It has been raised steadily since then and recently went from $0.4992 to $0.5196.
Bull case: On forward earnings, BP is the cheapest stock here at 10 times. Management expects $8 to $9B in divestment proceeds this year, including the roughly $6B Castrol sale, and has raised its cost-cutting target to $6.5 to $7.5B by 2027. The CEO, Meg O’Neill, has been direct about BP’s problems: “Our performance over the past few years has not met our own expectations… we have written off too much value; and our costs and liabilities are not resilient enough in a low price environment.”
Risk: BP carries liabilities its US peers don’t. It still has $6.9B in Gulf of America oil spill provisions on the books, it expects about $1.6B in settlement payments this year, and its UK operations pay an Energy Profits Levy with a 78% headline rate through March 2030.
Occidental Petroleum: A Fast-Growing Dividend Tied Directly to Crude
Occidental yields 1.82%, and it is a different kind of company from the other three. It is classified as an Oil & Gas E&P company, meaning exploration and production. It has no large refining business to absorb a drop in crude, and it has sold its OxyChem chemicals unit. Its cash flow therefore rises and falls almost directly with the price of oil. Its realized crude price was $96.78/bbl in the second quarter.
Dividend safety: The current payout is easy to cover. The forward annual dividend is $1.12, compared with trailing diluted EPS of $3.39, and second-quarter free cash flow was $3.02B. The company is still paying down debt. Principal debt fell to $13.3B in the first quarter and to $11.8B in the second, and the next target is $10.0B. Its dividend record is the weakest of the four. In 2020 the quarterly payout went from $0.79 to $0.01. It has since been rebuilt to $0.28.
Bull case: Dividend growth is the main appeal here. The payout has been increased 8% this year, and the next payment is on October 15. Operations are improving: production of 1,433 Mboed beat guidance, and operating costs fell to $8.70/BOE. Goldman Sachs (NYSE:GS) is getting more positive, with Barron’s reporting a Goldman upgrade this week.
Risk: Occidental has the most to lose if oil prices fall. In its May outlook, the EIA forecast OPEC output recovering from 20.90 million barrels per day in the second quarter of 2026 to 28.28 million in the fourth quarter. More supply would brings down the prices that are currently funding Occidental’s debt paydown.
Where Big Oil Income Lands Now
Exxon Mobil and Chevron are the most reliable income in this group: both cover their dividends with free cash flow, both carry little debt, and both kept raising the payout through the 2020 oil crash. BP offers the highest yield, but that yield depends on its recovery and on paying down debt. Occidental cut its dividend in 2020 and is now growing it quickly, which makes it a payout to keep an eye on in a downturn more than a foundation for an income portfolio. When oil prices fall, the dividends with strong balance sheets behind them are the ones most likely to hold.
The post 4 Big Oil Dividends Ranked by What Matters When Crude Falls appeared first on 24/7 Wall St..
]]>On October 1, 2026, Brent crude, the global benchmark, closed at $102.31 a barrel, up $4.28, and US crude at $92.87, up $2.45. Two separate supply shocks hit on the same day, and energy funds rose.
United States Oil Fund (NYSEARCA:USO) rose 3.00% to $150.03. Energy Select Sector SPDR Fund (NYSEARCA:XLE) gained 1.93%, and Chevron (NYSE:CVX) added 1.45% to $207.18.
USO is up 116.92% year to date. The latest gain, though, depends more on headlines than on physical supply changes.
What Moved on October 1 and What Is Only Reported, according to Reuters
Talks with Iran broke down. Secretary of State Marco Rubio ordered Iran’s delegation out of the country, saying “They had overstayed their welcome.” Iran says the departure was already scheduled.
President Donald Trump called Iran’s latest offer “not good enough.” Asked about escalation, he answered: “Possible. We have a lot of weapons. You know, we’ve been stocking up for the last six months.”
The Wall Street Journal reported that the USS Theodore Roosevelt left San Diego for the Middle East, making it the third US carrier in the region, with 9,000 to 10,000 more troops due by November 30, 2026. No official confirmation was available.
Brent is above $100 while US crude is below it. That gap points to stress in seaborne international supply rather than in US oil.
China’s Fuel Export Halt Hits Diesel First
PetroChina canceled October gasoline and jet fuel shipments as Chinese refiners suspended fuel exports. A crude shock pressures refiner margins, but a product shock immediately removes finished fuel from the market.
Diesel prices show the strain most clearly: AAA put regular gasoline at $4.41 and diesel at $6.39, against a record $6.53 set September 22, 2026. Because diesel moves freight, higher diesel prices tend to feed into the cost of everyday goods.
How USO, XLE and Chevron Differ
USO owns oil futures and must roll them forward as they expire. When later contracts cost more than nearer ones, every roll costs money. The fund fell 2.01% over the past week.
XLE owns companies. Exxon Mobil (NYSE:XOM) made up 22.67% of its assets and Chevron 16.09% as of June 30, 2026.
Chevron listed Brent at $104/BBL vs $68/BBL a year earlier. It pays $1.78 a quarter, trades at 15x forward earnings, and said the Middle East conflict affected about 1% of second-quarter total production.
Nothing confirmed here has removed a barrel of crude. The carrier is reported, escalation is only “possible,” and the export stop covers one month.
Risk premiums fall quickly. Weekly Brent fell from 124.61 in April to 69.7 by July 3. Federal forecasters projected Brent would average $89/b in 4Q26. Restarted talks, a Chinese export restart, or an OPEC response would each pull prices back.
Why USO Behaves Differently Over Longer Holding Periods
USO tracks oil closely over days, but over longer holding periods it faces roll costs and the risk that headlines reverse.
Chevron offers a different kind of oil exposure because it owns reserves and pays a quarterly dividend, and it avoids the monthly roll costs that a futures fund pays.
If talks resume or Chinese refiners restart exports before October 31, 2026, Brent should drop back below $100, and its gap to US crude should narrow. If Brent holds above $100 through that date without either event, this view is wrong.
The post Brent Oil Is Back Above $100 as a Third Aircraft Carrier Heads to the Middle East appeared first on 24/7 Wall St..
]]>Refining stocks are breaking away from the integrated oil majors, and the gap places the bid directly on fuel margins. Marathon Petroleum (NYSE:MPC) stock has risen 5% to $413.75 this afternoon. Also, Valero Energy (NYSE:VLO) shares are climbing 4% to $403.25, moving in step with the other large independent refiner.
Exxon Mobil (NYSE:XOM) stock is practically unchanged at $162.85, up 0.1%, which leaves the integrated major out of the refiners’ advance. Meanwhile, the Energy Select Sector SPDR ETF (NYSEARCA:XLE) is up 1% to $62.22. That broad energy-sector portfolio counts Exxon Mobil and Chevron (NYSE:CVX) as the fund’s two largest disclosed positions, giving XLE far more integrated-major weight than refining exposure.


How a Refiner’s Economics Differ From an Integrated Producer’s
Marathon Petroleum and Valero Energy are refiners, and each company’s economics rest on the margin between what crude costs and what gasoline, diesel and other refined products sell for. Crude is an input cost for Marathon Petroleum, so the company’s refining margin expands whenever product prices pull away from that input cost. The move arrives with no company announcement from Marathon Petroleum, and two large independent refiners rising together while Exxon Mobil stock holds near unchanged places the demand in refining specifically.
For Exxon Mobil and Chevron, a crude oil price move reaches each integrated company from both directions at once, with higher crude lifting what the production side at Exxon Mobil and Chevron makes while raising the input cost each company’s refining side pays. That two-way exposure explains how a single trading day can separate the integrated majors from the pure refiners.
What the Peer and Fund Figures Show
Reading the Energy Select Sector SPDR ETF takes more care. With Exxon Mobil and Chevron as the fund’s two largest disclosed positions, the fund’s gain leans heavily on the integrated majors and offers little independent confirmation of what Marathon Petroleum and Valero Energy are doing. Refining holds a much smaller share of the portfolio, so even a strong refining day can lift XLE only slightly.
Bull and Bear Cases for a Pure Refiner
The case for Marathon Petroleum in a market like this rests on what a refiner owns, since when product prices pull away from crude, Marathon Petroleum keeps all of the wider refining margin, with no production business to net that gain against. Valero Energy runs on the same structure, which helps explain why both stocks are moving in step.
However, the same structure cuts the other way. Marathon Petroleum has no upstream barrels to cushion the company’s results when crude rises faster than product prices, and that squeeze is the risk the integrated model at Exxon Mobil and Chevron exists to smooth. A refiner’s upside and downside both arrive in full.
What the Divergence Means for Investors
Marathon Petroleum stock and Valero Energy stock are both sending a refining signal, and the fund’s gain adds little to that read given XLE’s tilt toward the majors. Traders can watch for whether Exxon Mobil stock stays near unchanged while the two refiners’ gains hold, since a lasting gap would reinforce the refining-specific story.
Shareholders may want to keep an eye on whether product prices continue pulling away from crude, because that relationship drives both Marathon Petroleum’s refining margin and Valero Energy’s. A reversal in that spread would hit both refiners directly, with no production income at either company to offset the damage.
Marathon Petroleum and Valero Energy lack an upstream cushion. If crude oil climbs faster than product prices, moderate positions in both refiners fit a bullish margin setup, while Exxon Mobil and Chevron offer firmer exposure that nets both sides of the barrel.
The post Marathon Petroleum Climbs 5%, Valero Energy Gains 4% as Refiners Outrun Integrated Majors; Exxon Mobil Stays Flat appeared first on 24/7 Wall St..
]]>At the 24% bracket, a portfolio generating $50,000 in dividend income hands $12,000 to the IRS every year. What an investor actually keeps depends on where each stock sits.
In a taxable brokerage account, qualified dividends get long-term capital gains treatment. Nonqualified payouts, including most REIT distributions, are taxed as ordinary income at your marginal rate. Inside a Roth IRA, both arrive untaxed and qualified withdrawals stay tax-free.
Roth Versus Taxable: What You Keep on Each Position
A hypothetical $500,000 position yielding 8% produces $40,000 a year. At 24%, a taxable account keeps $30,400. A Roth keeps it all, a $9,600 annual advantage.
Apply that formula to six income names: Realty Income (NYSE:O), W. P. Carey (NYSE:WPC), Altria (NYSE:MO), Verizon (NYSE:VZ), AT&T (NYSE:T), and Chevron.
Realty Income
Realty Income yields 5.68%, paying monthly at $0.2715 per share. AFFO guidance of $4.44-$4.45 sits above the $3.258 forward dividend. REIT distributions face ordinary income rates, so a Roth shields the full payout.
W. P. Carey
W. P. Carey pays a $3.80 annualized dividend against a $64.15 share price, with its quarterly rate climbing from $0.86 in December 2023 to $0.95 in September 2026. AFFO guidance of $5.19-$5.27 covers the payout. Its distributions are mostly ordinary income, placing it beside Realty Income at the front of the Roth line.
Altria
Altria yields 6.13%, the highest here, after raising its quarterly dividend to $1.11 from $1.06. Adjusted EPS guidance of $5.56-$5.72 sits above the $4.44 forward rate. As yield rises, so do the dollars a taxable account generates each year.
Verizon
Verizon yields 6.08% on a $2.83 annualized dividend. Free cash flow guidance of $21.94 billion to $22.14 billion and adjusted EPS guidance of $4.99-$5.04 leave room above the payout. Its yield turns a low tax rate into a large annual dollar leak.
AT&T
AT&T yields 4.53% on a $1.11 annualized dividend held at $0.2775 quarterly since April 2022. Free cash flow guidance of $18 billion-plus and adjusted EPS guidance of $2.25-$2.35 cover it. With the payout flat, tax placement is one of the few ways to raise what an owner keeps.
Chevron
Chevron yields 3.18% on a $1.78 quarterly dividend, supported by $18.1 billion of Q2 free cash flow. Its dividends are generally qualified and taxed at capital gains rates, so it benefits least from a Roth in this group.
How Your Bracket Multiplies the Roth Advantage
Every dollar of ordinary dividend income costs your marginal rate in federal tax. The 2026 thresholds appear below:
| Bracket | Single Income Over | Joint Income Over | Tax per $1 of Ordinary Dividends |
|---|---|---|---|
| 22% | $50,400 | $100,800 | 22 cents |
| 24% | $105,700 | $211,400 | 24 cents |
| 32% | $201,775 | $403,550 | 32 cents |
| 37% | $640,600 | $768,700 | 37 cents |
A 37% filer can surrender up to 37 cents of every REIT dollar held outside tax-advantaged accounts. A 22% filer can surrender up to 22 cents. Placement decisions grow more urgent as the bracket rises.
Why the Gap Widens Every Year
The $9,600 from the example repeats annually. Inside a Roth, reinvested dividends buy shares whose future payouts are also untaxed. In a taxable account, tax trims each reinvestment first, so the shortfall compounds alongside the portfolio.
Limits That Slow the Move Into a Roth
Annual contribution limits cap new money, and income phase-outs bar higher earners from direct contributions. Conversions are the practical path for large balances but face ordinary income rates in the year of conversion. The five-year rule determines when earnings come out tax-free, so late-stage converters need a time. The cheapest years to convert are usually the quiet ones between your last paycheck and your first RMD, a window we sized up in a free Roth guide here.
Three Steps Before Your Next Tax Filing
- Pull your latest Form 1099-DIV and compare total ordinary dividends with the qualified portion for each holding. The nonqualified amount times your bracket is your annual Roth-avoidable cost.
- If Realty Income or W. P. Carey sits outside a tax-advantaged account, consider modeling how a phased Roth conversion of those ordinary-income REITs compares with Chevron.
- Run the conversion tax against the annual delta on your specific shares before assuming the upfront bill outweighs it.
The math tends to matter most for investors in the 24% bracket or higher who are at or near retirement, plan to hold income positions for decades, and can pay conversion taxes from funds outside the account.
The post A $500,000 Roth Portfolio Loaded With These Dividend Stocks Pays $40,000 a Year and the IRS Gets None of It appeared first on 24/7 Wall St..
]]>In Chevron’s second quarter, every part of the business ran strong at once. Chevron (NYSE:CVX) set a U.S. upstream production record of 2,077 MBOED, ran its U.S. refineries at 97% capacity, and captured $1.5 billion in Hess savings within a year of closing. That savings figure beat the original target by 50%.
CEO Mike Wirth credited “disciplined investment and strong execution that drove record U.S. upstream production, record crude throughput in our U.S. refineries, and exceptional reliability across key assets.”
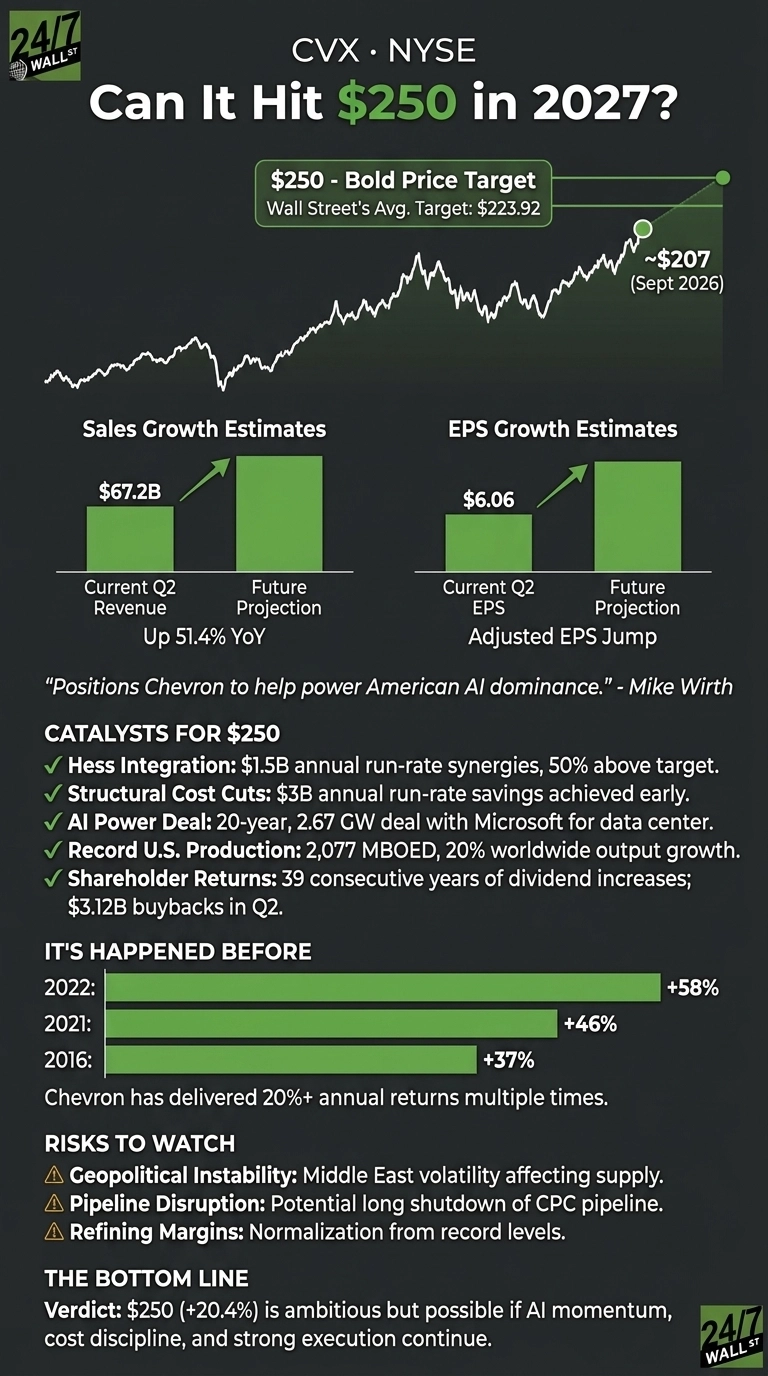
Shares are up 40.02% year-to-date and 152.16% over five years. Brent averaged $104 in Q2, but cost cuts, Guyana, and a new AI power business give this rally more runway. Here’s how Chevron could hit $250 per share in 2027.
Analysts See Modest Upside While Chevron Keeps Beating Them
Wall Street’s average price target of $223.92 implies 7.8% upside from $207.63. Sentiment leans bullish, with 6 Strong Buy and 14 Buy ratings against one Sell.

Chevron has exceeded consensus EPS for seven consecutive quarters. Q1 EPS was $1.41 versus a $0.9687 estimate. Q2 adjusted EPS jumped to $6.06 as revenue rose 51.4% to $67.20 billion. Such a run suggests current forecasts are conservative.

Here’s What It Takes for Chevron to Reach $250
Chevron trades at 15x forward earnings, cheaper than the S&P 500’s roughly 21x to 23x. A move to $250 would be a 20.4% gain, raising the multiple to about 18x forward earnings, still below the market.
Management’s 2030 plan calls for adjusted free cash flow growth averaging greater than 10% annually, assuming flat oil prices below today’s levels. For that growth, 18x is reasonable.

What Could Push Chevron to $250?
- Built-in savings: Chevron reached $3 billion in annual run-rate cost cuts six months early. CFO Eimear Bonner said the savings are “built into the business.”
- AI power: Project Kilby is a 20-year take-or-pay deal to supply Microsoft (NASDAQ:MSFT) with 2.67 gigawatts of power. It targets mid-teens returns from cash flows that don’t depend on commodity prices. Management calls it a repeatable model and says talks for more deals are advanced.
- Guyana: Free cash flow from the Hess assets has been “roughly double the incremental dividends,” and Guyana should keep high-margin oil growing into the 2030s.
- Refining: Downstream earnings reached $4.87 billion, up from $737 million a year ago. Management said “products are tighter than crude around the world.”
- Capital efficiency: Chevron expects to spend 25% less capex per barrel in 2026.
- Shareholder returns: Chevron bought back $3.12B of stock in Q2 and pays a $1.78 quarterly dividend. It has raised that dividend for 39 consecutive years.
- Growth options: These include Iraq’s West Qurna 2, Venezuela and Argentina, where management wants to grow the business 3x by 2035.
Chevron is one piece of a broader shift: the AI expansion runs on power, cooling, and networking, not just chips. We highlighted seven of those non-chipmaker suppliers in a free report you can grab here.

There are real risks. A long shutdown of the CPC pipeline, which carries Chevron’s Kazakhstan oil to market, conflict in the Middle East, and a return to normal refining margins could all slow progress.
Chevron’s History Says a 20% Year Is Well Within Reach
On a dividend-adjusted basis, Chevron has exceeded a 20.4% gain in eight calendar years since 2000. Total return reached 58% in 2022, 46% in 2021, 37% in 2016 and 35% in 2003.
Back-to-back big years have happened too, with 34% in 2006 followed by 31% in 2007.
$250 Is a Stretch, and Chevron Has the Tools to Get There
Reaching $250 requires a 20.4% gain, above the Street’s target. A seven-quarter beat run, $18.10B of Q2 free cash flow, commodity-proof power contracts, and a valuation below the market support it. Chevron has the tools to deliver outsized returns in 2027.
The post Chevron Has More Going for It Than Higher Oil Prices appeared first on 24/7 Wall St..
]]>
Oil markets are operating with little room for error. West Texas Intermediate crude trades above $91 a barrel this morning, while the Iran conflict, disrupted shipping, and tight diesel supplies continue putting a geopolitical premium on energy prices. Now America’s insurance policy against another supply shock is getting thinner, too.
The Strategic Petroleum Reserve has fallen to levels not seen since Ronald Reagan’s first term. And the Trump administration is releasing another 40 million barrels from it into the global market. Although the release is supposed to help temper the increase in prices by putting more oil in circulation, investors should pay attention to what it leaves behind.
The SPR Is Approaching Empty-Tank Territory
U.S. Department of Energy data show the SPR fell by roughly 800,000 barrels last week to 283.8 million barrels — its lowest level since October 1982. That represents the 27th consecutive weekly decline and leaves the reserve more than 132 million barrels below its recent peak.
Now the Energy Department is soliciting another 40 million barrels for delivery in November and December, the final installment of Washington’s commitment to a 400-million-barrel coordinated International Energy Agency release. The U.S. pledged 172 million barrels of that total.
If all 40 million barrels leave before meaningful quantities are returned, the SPR could temporarily sink below 250 million barrels.
That is important because strategic reserves are essentially catastrophe insurance. Having less oil stored does not create a shortage, but it gives Washington less flexibility if war, hurricanes, sanctions, or infrastructure failures suddenly remove supply.
It Isn’t Really a 40-Million-Barrel Giveaway
There is an important caveat. The government isn’t selling these barrels and then walking away. The DOE structured the transaction as an exchange. Companies borrow crude now and must return it later with additional barrels as a premium. Previous 2026 exchanges generated premiums of roughly 24% to 26%, according to DOE, potentially allowing the SPR eventually to receive more oil than it released.
The catch is timing. Reuters reports the oil may not be completely returned until late 2028, well beyond any near-term crises that may arise. So, although the long-term accounting could work,. the cupboard today is getting considerably and dangerously barer.
Could Venezuela Refill the Tank?
President Trump has proposed using Venezuela’s enormous oil resources to help rebuild the SPR. The White House says its August agreement provides access to low-cost Venezuelan crude, while Energy Secretary Chris Wright has discussed exchanging that heavy Venezuelan oil for lighter U.S. crude better suited to SPR storage.
That could eventually reduce replenishment costs, but it is hardly an overnight solution. Venezuelan production requires investment, its heavy crude needs specialized refining, and rebuilding hundreds of millions of SPR barrels would take years.
For investors, that keeps the energy-security premium alive. ExxonMobil (NYSE:XOM), Chevron (NYSE:CVX), and the State Street Energy Select Sector SPDR Fund (NYSEARCA:XLE) offer different ways to maintain exposure if oil stays elevated.
Key Takeaway
America isn’t permanently losing another 40 million barrels, but it is borrowing against its emergency cushion at a time when crude markets remain vulnerable.
Sharp investors shouldn’t chase oil simply because the SPR is shrinking. But with reserves at a 44-year low and geopolitical supply risks still elevated, keeping profitable oil producers represented in a diversified portfolio looks increasingly like insurance of its own.
The post America’s Strategic Oil Reserves Are at 44-Year Lows — And Trump Just Gave Away Another 40 Million Barrels appeared first on 24/7 Wall St..
]]>The SPDR S&P 500 ETF Trust (NYSEARCA:SPY) is the default core holding for millions of investors, and for good reason. SPY delivers the entire S&P 500 in one trade for an expense ratio of 0.0945%. Income is SPY’s weak spot. State Street, the same firm behind SPY, runs a second fund built from the same index for investors who want a bigger check: the SPDR Portfolio S&P 500 High Dividend ETF (NYSEARCA:SPYD). Most SPY owners have never looked at it.
Same Index, Radically Different Weighting
SPY weights every member by company size, so a handful of giants dominate. As of September 28, 2026, NVIDIA (NASDAQ:NVDA) alone made up 8.07% of the fund.
SPYD keeps only the highest-yielding S&P 500 members and weights them roughly equally. As of September 28, 2026, no position makes up more than 2% of the portfolio.
What Each Fund Actually Paid Per Share
SPY’s most recent quarterly distribution was $1.888834 per share, with $7.582717 paid over the trailing twelve months. Shares traded at $766.19 during the September 28 session.
SPYD paid $0.517794 per share with an ex-dividend date of September 21, 2026, down from the prior quarter’s $0.542849. Its trailing twelve-month total reached $2.059958, and the forward annualized run rate is $2.071176. Shares traded at $45.88 as of September 28, 2026.
Real Estate, Utilities, and Oil Replace Megacap Tech
The yield screen changes what you own. SPYD’s June 30 holdings leaned on real estate investment trusts such as Iron Mountain, apartment owners and shopping-center landlords, plus electric utilities, regional banks, tobacco and packaged-food makers, and energy names such as Chevron (NYSE:CVX). The chipmakers and software platforms that drive SPY barely register.
That single fact explains both the higher income and the weaker returns. Mature, slower-growing businesses pay out more cash because they reinvest less.
Performance Price Tag Every Holder Must See
SPYD trailed SPY over every window below.
And the figures arrive on different bases: SPY’s are unadjusted price changes that exclude distributions, while SPYD’s are adjusted and include reinvested distributions. This is noteworthy because that difference benefits SPYD, and it still lost over every time period.
| Period | SPYD | SPY |
|---|---|---|
| One week | -2.53% | 0.59% |
| One month | -8.04% | 0.01% |
| Year to date | 9.58% | 12.36% |
| One year | 10.79% | 16.43% |
| Five years | 45.45% | 72.6% |
| Ten years | 115.77% | 255.43% |
The one-month slide stands out. The 10-year Treasury yield rose from 4.73% on August 28 to 5.18% on September 24, its highest reading in a year. Rate-sensitive REITs and utilities take that pressure directly. Meanwhile, the VIX read a calm 14.21 on September 22, pointing to sector pain rather than marketwide panic. With Treasuries paying that much, investors can demand more from a dividend fund before accepting stock risk.
A Fee Edge SPY Cannot Match
SPYD charges 0.07%, below SPY’s 0.0945%. That is notably cheap for a screened product. SPYD reported net assets of $7.37 billion as of June 30, 2026, a good size for tight trading.
How to Move Money Without a Tax Surprise
Selling SPY outside a tax-advantaged account can trigger capital gains, especially on shares held through the long bull run. Consider sending new contributions to SPYD instead, or making the swap in a retirement account. SPYD’s REIT-heavy income also includes a meaningful share of dividends taxed as ordinary income, which makes tax-deferred accounts a natural home. A partial position keeps SPY’s growth engine while raising cash flow.
Who Should Own SPYD, and Who Should Stay With SPY
SPYD suits retirees and income investors drawing cash today who accept slower growth and rate sensitivity in exchange for larger quarterly checks and a lower fee. Investors still building wealth, or anyone who plans to reinvest every dividend anyway, may find SPY the better fit. Its ten-year record and technology exposure remain the stronger vehicle for compounding. A sustained drop in Treasury yields would strengthen SPYD’s case; further dividend cuts like this quarter’s would weaken it.
The post Forget SPY’s Dividend. Here Is What $100,000 in State Street’s High-Dividend Version Pays appeared first on 24/7 Wall St..
]]>A $250,000 salary puts a household near the top of the U.S. pay scale, and this kind of pay usually goes with senior roles. Examples include a practicing specialist, a law firm partner, or an engineering director. Replacing it with dividends comes down to one formula: income target divided by yield is capital required. Depending on the yield you choose, the answer runs from about $1.8 million to more than $8.3 million.
Before looking at stocks, check the baseline. The 10-year Treasury yields 5.2%, which is its highest level in a year. Roughly $4.8 million in government bonds would produce $250,000 a year. At that rate, every dividend strategy below must measure up to that figure.
Paying $7 Million for Dividends That Grow
The math: $250,000 at a 0.035 rate works out to about $7.1 million. Across the full 3% to 4% range, the requirement falls from $8.3 million to $6.25 million. Chevron (NYSE:CVX) fits this level with a 3.2% yield. Its quarterly dividend rose from $1.42 in 2022 to $1.78 this year. The iShares Core Dividend Growth ETF (NYSEARCA:DGRO) yields about 2% on trailing payouts, giving up current income in exchange for payout growth. The iShares Core High Dividend ETF (NYSEARCA:HDV) has historically yielded around 3.5% to 4.5%. Both funds charge 0.08% a year.
This level needs the most capital, but in return, holdings are diversified, principal tends to rise over time, and the income is the least likely to be cut.
Moderate Yields Cut the Bill to About $4 Million
A $250,000 portfolio at 0.06 produces about $4.2 million. At the 5% and 7% ends of the range, the figure is $5 million and $3.6 million. W. P. Carey (NYSE:WPC) yields 5.6% and has raised its dividend every quarter since late 2023. It also cut the payout that year, from $1.065 to $0.86. Enterprise Products Partners (NYSE:EPD) yields 5.9% with distribution coverage of 1.9x. Its payout grew 3% over the past year.
The Goldman Sachs S&P 500 Core Premium Income ETF sells call options on S&P 500 stocks and pays out the premiums monthly. That cash flow comes at the cost of giving up part of the market’s gains in strong rallies, and at this level, income increases more slowly and has a harder time keeping up with inflation.
Aggressive Income Needs Only About $2 Million
A $250,000 portfolio at 0.12 returns about $2.1 million. At 8% the requirement is $3.1 million, and at 14% it falls to $1.8 million. Business development companies, mortgage REITs, leveraged covered call funds, and high-yield bond funds fill this level. Principal erosion is common here, distributions get cut, and the investor ends up slowly spending down the asset.
Running the Numbers on a Six-Fund Blend
Here is one sample mix worth considering for most investors: HDV 25%, DGRO 15%, GPIX 20%, WPC 15%, CVX 10%, and EPD 15%. Assume typical yields of 4% for HDV and 7% for the covered call fund, and use current yields for the other four. The blend comes to about 4.7%, which requires roughly $5.3 million. That puts it between conservative and moderate, with some growth and some higher income.
Why the $7 Million Portfolio Can Pull Ahead
Picture a $7.1 million portfolio yielding 3.5% whose payout increases 8% a year. The $250,000 it pays in year one rises to about $500,000 by year nine and roughly $793,000 by year 15. A 12% payer with flat distributions still pays $250,000 in year 15, and inflation has cut into its buying power every year along the way. Chevron’s dividend history shows how regular increases add up over time.
Three Moves Before Choosing a Yield Tier
- Focus on spending. Replace that, not your salary. Part of a $250,000 salary goes to payroll taxes and retirement contributions, and neither continues once you’re living on portfolio income. Your actual annual spending could lower the target by seven figures.
- Check each holding. Then match it to the right account. REIT dividends are usually taxed as ordinary income, which makes them a better fit for tax-deferred accounts. MLPs like Enterprise issue K-1 tax forms and can create tax problems inside an IRA.
- Check the Treasury yield. Then compare every level against it. With 10-year notes at 5.2%, a moderate-tier portfolio has to earn its extra risk through income growth or price appreciation.
The post How Much Do You Really Need Invested to Replace a $250,000 Salary With Dividends? appeared first on 24/7 Wall St..
]]>For a retirement-focused investor looking at oil majors today, the choice comes down to Chevron (NYSE:CVX) versus ExxonMobil (NYSE:XOM), and the question is simple: Which one deserves the closer look right now for durable oil-patch income? Both are Dividend Aristocrats. Both are throwing off record cash. The differences matter for a retiree who needs the check to keep arriving through the next commodity cycle.
Yield and the Dividend Streak: A Split Round With a Clear Winner
Chevron pays more today. At $206.24 a share on Sept. 25, Chevron yields 3.45% on a $1.78 quarterly payout, with an annualized forward dividend of $7.12. Exxon, at $161.67, yields 2.55% on a $1.03 quarterly check and $4.12 annualized.
Exxon owns the longer raise record: 43 consecutive years of annual dividend growth versus Chevron’s 39 consecutive annual increases. Both hiked roughly 4% in their latest raises, which puts both firmly in the Dividend Kings conversation (we ranked ten of them by valuation in a free report here). If your priority is the fattest current yield, Chevron wins this round. If your priority is the longest unbroken chain of raises through oil busts, Exxon wins. For a retiree writing checks in 2026, the higher cash yield today edges it: Chevron takes the income round.
Valuation: Where Exxon Pulls Ahead
Chevron trades at a P/E of 32, a P/B of 2.13, and a P/FCF of 24. Exxon trades at a P/E of 23, a P/B of 2.52, and a P/FCF of 28. Exxon’s earnings yield of 4.42% comfortably beats Chevron’s 3.10%, and Exxon posts a higher ROE of 11.03% against Chevron’s 7.26%. Chevron has run harder recently, up 38.84% year to date versus Exxon’s 36.72%, and now trades at a richer multiple as it digests the Hess deal. On the numbers that decide what a retiree is paying per dollar of earnings, Exxon wins valuation.
Balance Sheet and Production: The Dividend Durability Test

Dividend durability sits in the balance sheet, and the gap here is wide. Exxon carries a debt/equity of 0.17, net debt/EBITDA of 0.55, and interest coverage of 56.3x. Chevron’s figures: debt/equity 0.25, net debt/EBITDA 1.08, and interest coverage 13.7x. Chevron did cut $8.41 billion in total debt in Q2 2026, and management flagged net debt to CFFO of 0.6 times. Exxon’s is simply stronger.
Production tells the same story. Exxon hit record full-year production of 4.7 million oil-equivalent barrels per day, the highest in more than 40 years, with Guyana at roughly 900,000 barrels per day and a fifth FPSO on track for startup by year end. CFO Neil Hansen called Guyana “very much an inflection into free cash flow” and guided to “two times the level of free cash flow in 2030 than we saw in 2025.” Chevron’s record 4,070 MBOED is impressive, but it was driven by the Hess acquisition, which lifted leverage and DD&A. Exxon wins on durability.

Verdict: Exxon for the Retiree, Chevron for the Yield Chaser
Exxon Mobil fits the income-focused retiree profile. You get a lower P/E, a fortress balance sheet, a longer 43-year raise record, and a Guyana ramp that materially raises the odds that the dividend keeps growing through the next down cycle. The starting yield is lower, but the check is more likely to be there in 2035.
Chevron suits a different profile: the retiree who explicitly wants the highest current yield in the pair and is willing to accept a richer multiple and higher leverage after the Hess deal. If you need 3.45% today and trust management’s 2030 targets of 2% to 3% production growth and greater than 10% adjusted free cash flow growth, Chevron is defensible. For everyone else planning to draw income for the next two decades, Exxon screens as the cleaner setup.
The post For Retirees Who Want Oil Income: Chevron vs. ExxonMobil appeared first on 24/7 Wall St..
]]>Chevron (NYSE:CVX) is one of the clearest income math setups in the market right now: a dividend growth blue chip with a live yield in the low-3s and a payout history that spans nearly four decades. The headline number is the anchor. At the current forward annualized dividend of $7.12 per share, roughly 141 shares of Chevron throws off approximately $1,000 in annual dividend income, paid in four quarterly installments.
Share Count and What It Costs Today
Chevron’s most recent declared quarterly dividend is $1.78 per share, paid on Sept. 10 to holders of record on Aug. 19. That rate has been confirmed on the three 2026 payments to date. The share count in the headline assumes that per-share payout remains in place; if Chevron raises again on its normal January cadence, the share count needed for $1,000 falls slightly.
Cost of the position matters as much as the yield. Chevron traded at $206.32 on Sept. 24. That is a stock that has moved up 32.34% year to date and 31.06% over the past year, so income buyers today are stepping in near the upper end of the 52-week range of $142.51 to $217.78. The current yield is 3.21%, well below where CVX yielded when the stock sat in the $140s a year ago.
What Actually Backs the Dividend
Chevron is oil-linked, and earnings swing with crude. What supports the payout through cycles is cash generation, coverage, and balance sheet capacity, and the Q2 2026 numbers spoke to all three.
- Cash flow from operations excluding working capital was $19.7 billion in the quarter.
- Adjusted free cash flow came in at $15.4 billion in Q2 2026.
- Management reduced debt by more than $8 billion in the quarter, taking net debt to CFFO to 0.6 times.
- Organic capex was $4.4 billion, with full-year 2026 spending tracking to the lower end of the $18 to $19 billion guide.
The Hess assets are pulling their weight. CEO Mike Wirth told analysts the acquired portfolio is generating “strong free cash flow, which has been roughly double the incremental dividends and accretive to shareholders on a per share basis.” Chevron also captured $1.5 billion in Hess synergies six months ahead of schedule and hit its $3 billion structural cost reduction target early.
Streak and What It Really Proves
Chevron’s Q4 2025 dividend was raised 4%, marking its 39th consecutive annual dividend increase. The dividend record in the data feed extends back to 1999 and shows an unbroken march higher in the quarterly rate from $1.29 in 2020 to $1.78 in 2026, which spans the 2020 crude collapse.
That streak shows commitment rather than a contractual guarantee. Chevron is still an integrated oil and gas major, and a sustained crude price decline pressures both earnings and coverage. The EIA’s May 2026 Short-Term Energy Outlook models world oil production climbing to 109.50 million barrels per day in 2027, a supply picture that puts a ceiling on how much room prices have to run if demand softens.
What to Do Before Sizing a Position
- Refresh the quarterly dividend and share price before you place the trade. The 141-share figure is tied to a $7.12 forward annualized payout; a January increase would lower the count required for $1,000.
- Model a 25% dividend cut against your monthly income line before you build around this yield. Chevron has not cut recently, but every oil-linked payout is a function of crude realizations.
- Compare the entry yield you get today near $206 against the yield history. Buying a dividend growth name near a 52-week high locks in a lower starting yield than the same stock offered nine months ago.
For an investor building a diversified income book, Chevron at the current forward payout remains a credible core position for the conservative sleeve. Coverage, balance sheet, and the 2030 target of greater than 10% per year adjusted free cash flow growth support the dividend through a normal cycle. The starting yield is the tradeoff, and it is the tradeoff every buyer accepts here (if the goal is living off the checks without selling shares, we walked through how to build that kind of ladder in a free dividend income guide).
The post Own 141 Shares of Chevron (CVX) and Collect $1,000 a Year in Dividends appeared first on 24/7 Wall St..
]]>When Chevron (NYSE:CVX) and IBM (NYSE:IBM) reported second-quarter results this summer, the former rode record barrels from its Hess deal, while the latter leaned on software as mainframe sales declined. Capital spending shows which dividend is harder to fund.
Record Barrels for Chevron, a Mainframe Trough for IBM
Chevron’s production rose 20% to a record 4,070 thousand barrels of oil equivalent per day (MBOED) in its July 31, 2026, report, proof the Hess assets are pulling weight. Downstream earnings hit $4.87 billion versus $737 million a year earlier, a refining boom. Brent crude averaging $104 per barrel flattered both figures.
IBM’s July 22, 2026, report missed the $2.97 EPS consensus with $2.93, as IBM Z revenue fell 42% between mainframe cycles. Red Hat grew 11%, demonstrating that recurring software revenue continues to expand. IBM’s CFO called free cash flow “one of the two key leading indicators” of its investment thesis.

Chevron Owes $17 Billion to Its Oil Fields First
Fiscal 2025 operating cash flow reached $33.94 billion, but capital expenditures took $17.35 billion before any shareholder got paid. The trend makes the load greater:
| Fiscal Year | Net Income | Capex | Dividends Paid |
|---|---|---|---|
| 2023 | $21.37B | $15.83B | $11.34B |
| 2024 | $17.66B | $16.45B | $11.80B |
| 2025 | $12.30B | $17.35B | $12.75B |
Net income fell each year while capex and dividends both rose. Greater spending comes with the territory: integrated producers must reinvest to replace pumped reserves. Despite these pressures, operating cash flow still covered the $12.75 billion dividend obligation.
IBM’s Low Capex Comes With a Rising Interest Bill
| Fiscal Year | Operating Cash Flow | Capex | Dividends Paid | Interest Expense |
|---|---|---|---|---|
| 2023 | $13.93B | $1.25B | $6.04B | $1.61B |
| 2024 | $13.45B | $1.05B | $6.15B | $1.71B |
| 2025 | $13.19B | $1.09B | $6.26B | $1.94B |
Operating cash flow held about flat and capex fell, while net income jumped to $10.59 billion in 2025 from $6.02 billion in 2024. Interest expense rose every year, a growing claim on the same cash.
AI Power Deals and IBM’s Cash Target Set the Next Test
Chevron’s 20-year, 2.67 GW power deal with Microsoft (NASDAQ:MSFT) for a West Texas data center, which ties an oil major to the AI build-out IBM sells into, is worth watching. IBM must deliver the approximately $1 billion free cash flow increase it is targeting for 2026. Reaching it would widen the dividend margin further.
Why IBM’s Dividend Looks Easier to Fund, Debt and All
As of September 25, 2026, premarket trading, Chevron stood at $203.35, up 37.1% year to date with a yield near 3.4%, while IBM traded at $228.27, down 21.4%. Momentum favors Chevron.

Funding tells a different story. IBM needs far less capital to operate, so more cash reaches shareholders. Chevron suits income investors who are comfortable tying payouts to oil prices.
The post Chevron or IBM: One of These Dividends Costs $17 Billion a Year to Protect appeared first on 24/7 Wall St..
]]>What separates the S&P 500’s most reliable dividend payers from the rest of the index comes down to one thing: each payment is covered many times over by cash the business actually produces. These five names, spread across technology, retail, energy, financial data, and defense, all share that trait. The proof is on the balance sheets and in the cash flow statements. As one anchor for the theme, Microsoft alone generated $182.94B in operating cash flow in fiscal 2026 while paying a dividend that consumed a tiny fraction of it.
Microsoft
Microsoft (NASDAQ:MSFT) yields just 0.72%, and the coverage story is what matters. The company’s board declared a raised quarterly payout of $0.98 per share on September 14, 2026, extending a payment history that runs continuously back to February 2003. Coverage is overwhelming here: full-year fiscal 2026 diluted EPS came in at $18.02 against an annualized forward dividend of $3.92, and free cash flow of $66.99B comfortably funds both the dividend and buybacks. The balance sheet is fortress-grade, with interest coverage of 50.9x and net debt/EBITDA of 0.57.
The bull case for income buyers is simple. Azure just cleared $100B in annual revenue, commercial RPO sits at $678B, up 84%, and Microsoft 365 Copilot has surpassed 30 million paid seats. That is the growth funding double-digit dividend hikes. The risk: an AI capex ramp of $115.95B in FY26 is compressing free cash flow growth even as the top line accelerates.
Lowe’s Companies
Lowe’s Companies (NYSE:LOW) yields 2.49%, and after a 20.59% year-to-date decline, the shares trade at a P/E of 17 on trailing earnings of $11.54. The payout was lifted to $1.25 per share from $1.20 with the July ex-dividend date, and the payment record in the dataset stretches unbroken back to 1999, with progressive annual increases visible across the entire span. Coverage is strong: earnings cover the annualized forward dividend of $5.00 multiple times, and free cash flow yield sits at 7.23%.
The bull case is a durable, cash-generative retailer buying back stock aggressively while comps have turned positive for five straight quarters. Fiscal Q2 2026 revenue rose 8.3% to $25.96B with adjusted EPS of $4.40. The caveat is the flip side of the buyback story: aggressive repurchases have driven shareholders’ equity negative at -$7.44B, so traditional leverage ratios are not meaningful, and DIY demand remains tied to a soft housing cycle.
Chevron
Chevron (NYSE:CVX) is the highest-yielding name in the bundle at 3.16%, which still keeps it firmly in high-yield territory rather than ultra-high-yield. The quarterly dividend has stepped up steadily in the payment record, from $1.51 in 2023 to $1.63 in 2024, $1.71 in 2025, and $1.78 in 2026. Coverage is the story: Q2 2026 free cash flow was $18.10B against operating cash flow of $22.63B, and the company still cut $8.41B off total debt and repurchased $3.12B of stock in the same quarter. Interest coverage of 13.7x and net debt/EBITDA of 1.08 mark this as one of the more conservative balance sheets in integrated energy.
The bull case blends commodity leverage with a shift toward long-duration cash flows, including a 20-year power deal with Microsoft for a 2.67 GW West Texas data center. Post-Hess, Q2 revenue jumped 51.4% to $67.20B. Shares are up 38.63% year to date. The risk is unchanged: oil price volatility remains the swing factor for reported earnings and, over time, the pace of future dividend increases.
S&P Global
S&P Global (NYSE:SPGI) yields 0.96%, low on the surface but backed by one of the widest moats in the S&P 500. The board has raised the regular quarterly dividend from $0.90 in 2023 to $0.97 in 2026, and the payment history in the dataset runs back to 2001 with a consistent February, May, August, November cadence. Coverage is overwhelming: TTM diluted EPS of $16.59 against an annualized forward dividend of $3.88, and Q2 2026 free cash flow of $1.33B in a single quarter. The company has authorized more than $7B in share buybacks for 2026.
The bull case is a capital-light franchise with pricing power across Ratings, Indices, Market Intelligence, and Energy, following the July 1, 2026 spin-off of Mobility. Ratings Q2 revenue grew 17% and Indices asset-linked fees rose 22%. The share price has cooled, off 18.36% year to date, which pulls the forward P/E to 20, comfortably below the trailing multiple. The risk: Ratings transaction revenue is tied to debt issuance cyclicality, and Q2 adjusted EPS of $4.83 missed the $5.00 estimate.
Lockheed Martin
Lockheed Martin (NYSE:LMT) yields 2.61% at $523.71. The quarterly payment has stepped up in a clean annual cadence in the dataset, from $0.75 in November 2010 to $3.45 in 2026, with no reduction visible across the record. Coverage is a wide moat unto itself: management guided full-year 2026 free cash flow to more than $7.0 to $7.2B, against Q1 dividends paid of $816M. Q2 2026 delivered revenue of $20.06B, up 10.5%, EPS of $7.94, and free cash flow of $2.92B.
The bull case is a record backlog of $230.4B, boosted by a $35B multi-year THAAD contract, that offers rare multi-year revenue visibility funding both the dividend and buybacks. Missiles and Fire Control revenue was up 19% in Q2. Management raised FY26 EPS guidance to $29.95 to $30.65. The risk is program-specific: fixed-price contracts including F-16, C-130, and CH-53K have produced reach-forward losses in prior periods, and continuing resolution uncertainty remains a wildcard for Pentagon procurement timing.
What Ties These Five Together
Look past the yield column and each of these names hits the same mark: earnings and free cash flow cover the dividend by a wide margin, leverage is manageable, and the payment record shows an unbroken series of increases across many years. Microsoft and S&P Global barely feel like income stocks on yield alone, yet their coverage math is arguably the strongest in the group. Chevron and Lowe’s deliver more current income while still leaning on real cash generation, and Lockheed’s backlog turns near-term payout capacity into a multi-year visibility story. That is the one thing the S&P 500’s best dividend payers share.
The post The S&P 500’s Best Dividend Stocks Share One Powerful Advantage appeared first on 24/7 Wall St..
]]>For a Dow-focused retirement investor at the 24% federal bracket, the tax code treats qualified dividends favorably at the 15% long-term capital gains rate rather than the marginal rate. That still means a taxable portfolio throwing off $50,000 in qualified Dow dividend income hands $7,500 to the IRS every year, permanently, while the same holdings inside a Roth IRA keep every dollar.
Roth Versus Taxable on Six Dow Blue Chips
Every stock below is a current Dow Jones Industrial Average component, ranked by dividend yield. Prices and yields are as of the September 24, 2026 session.
| Stock | Price | Annualized Dividend | Yield |
|---|---|---|---|
| Chevron (NYSE:CVX) | $206.40 | $7.12 | 3.45% |
| IBM (NYSE:IBM) | $231.75 | $6.76 | 2.91% |
| Amgen (NASDAQ:AMGN) | $407.59 | $10.08 | 2.39% |
| Merck (NYSE:MRK) | $149.48 | $3.40 | 2.20% |
| Goldman Sachs (GS) | $932.33 | $20.00 | 1.79% |
| JPMorgan Chase (JPM) | $338.07 | $6.60 | 1.70% |
Chevron leads the group after raising its quarterly payout from $1.71 to $1.78, backed by $22.6B in Q2 2026 operating cash flow. IBM’s unbroken quarterly dividend streak dating to 1916 makes it a Roth staple. Amgen just stepped its quarterly payout to $2.52, extending a decade of increases from $0.28 in 2011. Goldman is the most aggressive grower, lifting its dividend from $3 in early 2025 to $5 in 2026, and JPMorgan followed with a bump to $1.65 quarterly.
Sizing the Delta at 24%
The framing case in this series: a $500,000 position yielding 8% generates $40,000 annually; at the 24% bracket the taxable account keeps $30,400, while the Roth keeps the full $40,000, a $9,600 annual advantage. Dow blue chips yield less, so the delta scales down accordingly. On a $500,000 equally weighted basket of the six names above, the blended yield sits in the low-2% range, producing roughly $12,500 in annual qualified dividends. At the 15% qualified rate, the taxable account surrenders about $1,875 per year; the Roth keeps it.
Bracket Multiplier on the Same $12,500 Income Stream
| Ordinary Bracket | Qualified Rate | Annual Roth Advantage |
|---|---|---|
| 22% | 15% | $1,875 |
| 24% | 15% | $1,875 |
| 32% | 15% or 20% | $1,875 to $2,500 |
| 37% | 20% plus 3.8% NIIT | $2,975 |
The top-bracket investor loses the most, because qualified rates step to 20% and the net investment income surtax layers on. The higher the bracket, the more urgent the Roth placement decision.
Compounding Cost of Leaving Them Taxable
Reinvested inside a Roth at a conservative 4% yield-on-cost, the recurring $1,875 annual advantage on this Dow basket compounds to roughly $22,500 over 10 years and $55,000 over 20 years in tax-free income that a taxable account would have surrendered. That is the permanent cost of Roth exclusion, before any share-price appreciation on names that have already returned 594% over 10 years for Goldman and 553% over 10 years for JPMorgan.
Action Items Before Year-End
- Pull last year’s 1099-DIV and identify which Dow payers sit in your taxable account. Multiply the qualified dividend total by 15% (or 20% if you cross the LTCG threshold) to see your annual tax cost.
- Run the Roth conversion math on your highest-yielders first. On this list, Chevron and IBM produce the largest income drag in a taxable account and the largest Roth benefit.
- If a full conversion is off the table, direct new Roth contributions and dividend reinvestments toward the two highest-yielding names above rather than the sub-2% payers.
The post How a Roth IRA Can Keep Thousands More of Your DJIA Dividend Income Compounding appeared first on 24/7 Wall St..
]]>Starting a dividend portfolio comes down to one good decision. For a beginner with $2,000 to put to work, that decision can be a single fund: the Schwab U.S. Dividend Equity ETF (NYSEARCA:SCHD). One ticker, one trade and a diversified position across roughly 102 U.S. large-cap dividend payers.
Here is the core math, using inputs pulled at generation rather than any hand calculation. SCHD closed at $33.74 on Sept. 22. The fund pays quarterly, with an annualized forward dividend of $1.01 per share and a trailing 12-month total of $1.048. A $2,000 stake at that price builds a starter position that throws off modest but real cash flow, paid four times a year. Setting the expectation clearly matters here: a $2,000 position generates a small dollar figure at any realistic dividend yield. The value lies in the habit and the compounding.
Why SCHD Instead of the Highest Yield You Can Find
SCHD’s argument is methodology. The fund tracks a rules-based index that screens for dividend quality and consistency rather than raw yield. That approach filters out the two most common traps beginners walk into: Shrinking payers dressed up as bargains, and single-stock blowups where a double-digit yield signals distress. The screen leans toward companies with durable cash flows, a long record of paying, and financial strength to keep paying.
The tradeoff is that SCHD’s headline yield sits below what a mortgage REIT or leveraged closed-end fund would show. With the 10-Year Treasury yielding around 5% as of Sept. 22, SCHD’s distribution rate looks unspectacular in isolation. The reason to accept that is total return and growth of income over time. SCHD has returned 27.89% over the past year, 61.56% over five years and 234.82% over 10 years on a price basis. The dividend has stepped higher over that same window, with quarterly amounts rising from the 12-cent range in late 2011 to the 25-cent to 28-cent range in 2025 and 2026.
What You Actually Own
SCHD holds a broad mix of large, cash-generative US companies. Based on the May 31, 2026 NPORT snapshot, the top positions include:
- QUALCOMM at 6.74% of net assets
- Texas Instruments at 5.90%
- UnitedHealth Group at 5.09%
- Coca-Cola at 3.96%
- Merck at 3.86%
- Chevron at 3.83%
From there the roster reads like a dividend playbook: Verizon, Procter & Gamble, ConocoPhillips, Amgen, PepsiCo, Home Depot, Abbott Laboratories, Altria, Bristol-Myers Squibb, Accenture, Lockheed Martin and Blackstone. Sector exposure spans consumer staples, healthcare, energy, financials, semiconductors, communications, and industrials. Total net assets stand at roughly $94.9 billion, which keeps trading costs low and spreads tight.
Limits Worth Knowing Before You Buy
One fund is a starting point on the way to a finished portfolio. SCHD is entirely US large-cap dividend equity. There is no bond allocation, no international exposure, no small-cap or growth tilt. When the value factor lags, SCHD lags. It also holds cyclical weight in energy, financials, and semiconductors, so it moves with the economy. Recent trading reflects that: SCHD is down 4.17% over the past month but remains up nearly 22% year to date.
For a first dividend position, that profile is a feature. A beginner gets diversified ownership of quality payers, an income stream that has grown over more than a decade, and a single-line brokerage entry that can be added to over time. Later positions can layer in bonds, international stocks, or higher-yield vehicles once the base is in place. The point of the first $2,000 is to start the compounding clock, and SCHD is a straightforward way to do it.
The post You Only Need $2,000 and 1 Fund to Start Building a Dividend Portfolio. Here’s the ETF to Use appeared first on 24/7 Wall St..
]]>If any investor has stood the test of time, it’s Warren Buffett, and with good reason. For 60 years, the “Oracle of Omaha” has had a rock-star presence in the investing world, and his annual Berkshire Hathaway shareholder meetings have drawn thousands of loyal investors. They were stunned at last year’s meeting when Buffett announced he would step down as CEO of the investment giant at year’s end. While he remains board chair and vows to come to the office every day, he still has a voice in day-to-day operations. His pre-announced successor and long-time lieutenant, Greg Abel, has assumed the CEO position and is likely directing or having a say in most, if not all, new investments, public or private.
One major difference between Berkshire Hathaway (NYSE:BRK-B) and many similar large funds is that, despite years of calls from Wall Street and shareholders, the fund does not pay a dividend. We found that Berkshire Hathaway does not pay dividends because its leadership believes that retaining earnings creates superior long-term value for shareholders. Buffett and Abel maintain that the company can compound capital more effectively by reinvesting profits in acquisitions, its operating businesses, and strategic share repurchases. In addition, investors shouldn’t expect it to start paying one anytime soon, despite a record cash balance.
One thing is for sure: Buffett and Abel love stocks that pay dividends. In fact, the 2025 Berkshire Hathaway annual report showed the company earned a stunning $5.086 billion in dividend income. A large portion comes from five top holdings that not only pay dependable, and in some cases, outsized dividends, but also have been raising them year in and year out.
Why Do We Cover Berkshire Hathaway Stocks?
Few investors have the results and reputation that Buffett has garnered over the past 60 years. Though he has stepped away from the CEO chair, his impact and investment guidelines are likely to remain in place long after he is gone. While investing has evolved since Buffett took control of Berkshire Hathaway in 1965, and now that Abel is in charge and vowing to stay the course, buying good companies with products and services recognized worldwide and paying dividends will remain a timeless approach and never go out of style. Here are the five portfolio stocks that have raised their dividends over the past year. All are rated Buy at top Wall Street firms.
American Express
American Express (NYSE:AXP) is a bank holding company and multinational financial services corporation specializing in payment cards. The globally integrated payments company operates card-issuing, merchant-acquiring, and card-network businesses, and pays a 0.98% dividend. The company raised its quarterly dividend from $0.82 to $0.95 between January and April 2026.
The company offers products and services to customers worldwide, including consumers, small businesses, mid-sized companies, and large corporations. Its segments include:
- U.S. Consumer Services, which offers travel and lifestyle services, as well as banking and non-card financing products.
- Commercial Services offers payment, expense management, banking, and non-card financing products.
- International Card Services provides services to international customers, including travel and lifestyle services, and manages certain international joint ventures and its loyalty coalition business.
- Global Merchant and Network Services operates a payments network that processes and settles card transactions, acquires merchants, and provides multichannel marketing programs, capabilities, services, and data analytics.
Berkshire Hathaway owns 151,610,700 shares, 22.2% of American Express’s float, and 14.8% of the portfolio.
J.P. Morgan has an Overweight rating with a $400 target price.


Bank of America
While Warren Buffett has trimmed his position over the past two years and sold a whopping 50 million shares in the fourth quarter of 2025, this quality financial giant remains an exceptional long-term holding with a solid 1.83% dividend yield. The dividend was raised from $0.26 to $0.28, then to $0.32 per quarter, with two increases over the past 12 months. Bank of America (NYSE:BAC) is a bank holding company that reported impressive Q2 results. Berkshire Hathaway owns 513,624,165 shares, which is 9.1% of the portfolio and 7.3% of the float.
Its segments include:
- Consumer Banking offers a range of credit, banking, and investment products and services to consumers and small businesses.
- Global Wealth & Investment Management (GWIM) comprises two businesses: Merrill Wealth Management, which offers tailored solutions to meet clients’ needs through a comprehensive suite of investment management, brokerage, banking, and retirement products. Bank of America Private Bank provides comprehensive wealth management solutions.
- Global Banking offers a range of lending-related products and services, including integrated working capital management and treasury solutions, as well as underwriting and advisory services.
- Global Markets offers sales and trading services, as well as research services, to institutional clients across fixed income, credit, currency, commodity, and equity markets.
The Jefferies target price for the shares is $75.


Chevron
This American multinational energy company primarily focuses on oil and gas. Chevron (NYSE:CVX) is a safer option for investors looking to position themselves in the energy sector. It pays a substantial 3.58% dividend, which was raised by 5% earlier this year, and has a 39-year streak of dividend increases. The company operates integrated energy and chemicals businesses worldwide. Berkshire Hathaway holds 84,375,856 shares, representing 4.2% of the float and 4.7% of the portfolio.
The company operates in two segments. The Upstream segment is involved in:
- Exploration, development, production, and transportation of crude oil and natural gas
- Processing, liquefaction, transportation, and regasification associated with liquefied natural gas
- Transportation of crude oil through pipelines, and transportation and storage
- Marketing of natural gas, as well as operating a gas-to-liquids plant
The Downstream segment engages in:
- Refining crude oil into petroleum products
- Marketing crude oil, refined products, and lubricants
- Manufacturing and marketing renewable fuels
- Transporting crude oil and refined products by pipeline, marine vessel, motor equipment, and rail car
- Manufacturing and marketing of commodity petrochemicals, plastics for industrial uses, and fuel and lubricant additives
It also involves cash management, debt financing, insurance operations, real estate, and technology businesses.
Mizuho has a Buy rating with a $230 target price.
Coca-Cola
Coca-Cola (NYSE:KO) is an American multinational corporation founded in 1892. This company remains one of Buffett’s longest-held positions. Berkshire owns a massive 400 million shares, which is 9.3% of the float and 9.3% of the portfolio. The stock pays a dependable 2.51% dividend, which was raised to $0.53 per share in May 2026, marking the 64th straight year of dividend increases.
Coca-Cola is the world’s largest beverage company, offering consumers more than 500 sparkling and still brands. Led by Coca-Cola, one of the world’s most valuable and recognizable brands, the portfolio features 20 billion-dollar brands, including:
- Diet Coke
- Coca-Cola Light
- Coca-Cola Zero Sugar
- Caffeine-free Diet Coke
- Cherry Coke
- Fanta Orange
- Fanta Zero Orange
- Fanta Zero Sugar
- Fanta Apple
- Sprite
- Sprite Zero Sugar
- Simply Orange
- Simply Apple
- Simply Grapefruit
- Fresca
- Schweppes
- Dasani
- Fuze Tea
- Glacéau Smartwater
- Glacéau Vitaminwater
- Gold Peak
- Ice Dew
- Powerade
- Topo Chico
- Minute Maid
Globally, it is the top provider of sparkling beverages, ready-to-drink coffees, juices, and juice drinks. Through the world’s most extensive beverage distribution system, consumers in more than 200 countries enjoy the company’s beverages at a rate of over 1.9 billion servings per day. The company also owns 19.5% of Monster Beverage (NASDAQ:MNST), which continues to deliver strong financial results.
UBS has a Buy rating and a target price of $98.


Occidental Petroleum
After years of building this position, Buffett and Berkshire Hathaway are finally in the money on this company, which pays a 1.70% dividend. Occidental Petroleum (NYSE:OXY) is an international energy company with assets primarily in the United States, the Middle East, and North Africa. The company is an oil and gas producer in the United States, including the Permian and D.J. basins and offshore Gulf of America. Occidental’s most recent dividend increase was on February 19, 2026. The board raised the quarterly dividend by more than 5%, from $0.24 to $0.26 per share (bumping the annualized rate from $0.96 to $1.04).
Berkshire Hathaway has a large position in the company, owning 264,941,431 shares, representing 26.6% of the float and 4.3% of the portfolio.
Occidental’s oil and gas segment explores for, develops, and produces oil (including condensate), natural gas liquids (NGLs), and natural gas. The midstream and marketing segment purchases, markets, gathers, processes, transports, and stores oil (including condensate), NGLs, natural gas, carbon dioxide (CO2), and power. This segment provides flow assurance, maximizes the value of its oil and gas, and optimizes the company’s transportation and storage capacity. It also invests in entities that conduct similar activities, including low-carbon venture businesses.
A notable recent development was Occidental’s decision to sell its OxyChem subsidiary to Berkshire Hathaway, with the bulk of the proceeds expected to strengthen the company’s balance sheet and further concentrate its business on oil and gas. The move was notable because Buffett had reportedly long been interested in OxyChem, and Berkshire now owns the business outright. Berkshire Hathaway completed its purchase of OxyChem from Occidental on January 2, 2026, giving Berkshire full ownership of the chemicals business while providing Occidental with $9.7 billion in cash to reduce debt and sharpen its focus on energy.
Mizuho has an Overweight rating and a $75 price objective.


The post 5 of Warren Buffett’s Largest Berkshire Hathaway Stocks Are Raising Their Dividends Every Year appeared first on 24/7 Wall St..
]]>The Energy Select Sector SPDR Fund (NYSEARCA:XLE) is the default ticker most investors punch in when they want “energy” in a portfolio, and the label does a lot of quiet work. The fund holds 25 positions pulled from the energy slice of the S&P 500, with Exxon Mobil (NYSE:XOM) at 23% of net assets and Chevron (NYSE:CVX) at 16%. Two integrated majors alone drive the fund’s returns.
Utilities, solar developers, wind operators, and nuclear utilities are excluded because they live in separate S&P sectors or fall outside the large-cap benchmark. The everyday meaning of “energy” and the index definition don’t match.
With WTI crude at $107 per barrel and XLE up 46% year to date, the concentration is paying off. That is precisely why the mechanics deserve a closer look before you buy more.
What XLE Really Owns
The portfolio is a concentrated bet on integrated oil, exploration and production, refining, oilfield services, and midstream with no meaningful renewable exposure.
Beyond the two majors, the next tier includes ConocoPhillips (NYSE:COP) at 7%, Williams Cos (NYSE:WMB) at 5%, Valero (NYSE:VLO) at 5%, and Marathon Petroleum (NYSE:MPC) at 5%. Oilfield service names like SLB (NYSE:SLB) at 4% and Halliburton (NYSE:HAL) at 2% sit alongside pipelines like Kinder Morgan (NYSE:KMI) at 4%.
Total net assets stand at roughly $35.7 billion as of the June 30 filing. The fund is liquid, cheap, and tightly focused on American large-cap fossil fuels.
Because it draws only from S&P 500 energy constituents, XLE excludes small and mid-cap producers, foreign majors, and every clean-energy pure play trading in the U.S. Owning “energy” through this ticker means owning American large-cap fossil fuels.
Different Businesses, Different Return Drivers
Integrated majors care about crude and gas realizations, plus capital-return discipline. Refiners like Valero and Marathon live on the crack spread, which can widen when crude falls. Midstream operators such as Williams and Kinder Morgan earn fee-based cash flow tied to throughput volumes, so their earnings are far less directly linked to spot prices.
WTI has traveled from a low of $55.44 in December 2025 to a high of $114.58 in April 2026, with a 27% jump in the past month. That volatility flows unevenly across XLE’s buckets.
The important caveat: XLE does not track crude. Company-level costs, hedging programs, buybacks, and dividend policy can pull its stocks away from the barrel in either direction.
How It Stacks Against the Alternatives
Vanguard’s VDE tracks a broader U.S. energy index with similar oil-heavy composition at a lower expense ratio. For genuine energy transition exposure, clean-energy ETFs own solar, wind, and clean-tech names that XLE does not touch. A utility ETF adds regulated power generation, including nuclear and grid operators that will supply AI data centers (we profiled seven of the power, cooling, and networking suppliers behind that buildout in a free report).
A global energy fund widens the lens to include Shell (NYSE:SHEL), BP (NYSE:BP), and TotalEnergies (NYSE:TTE), which broadens geopolitical and refining diversification. None of these replaces XLE. Each fills a different hole.
The five-year total return of 213% shows XLE has delivered on its narrow promise during a fossil-fuel bull cycle. The one-year gain of 48% is entirely a crude-price story.
Bull and Bear Case for XLE ETF
The bull case is straightforward. With WTI in the guide’s high-price zone above the $100 threshold, integrated majors and E&Ps are generating cash that flows to shareholders through buybacks and dividends, and XLE captures that concentrated payout without dilution from non-fossil businesses.
The bear case is the same sentence read backward. The fund’s 46% year-to-date advance already prices in strength, and a return of WTI to the $60 to $80 band would compress cash returns quickly given how top-heavy the fund is in Exxon and Chevron.
Crude is the deciding variable, but refining margins, midstream volumes, and OPEC supply decisions each pull the underlying businesses in different directions. XLE works as a concentrated sector allocation that behaves differently from a crude-oil proxy or a broad “energy” fund.
It fits investors who want a tactical inflation and commodity tilt with a real income stream and accept the concentration. Anyone shopping for the energy transition should look at clean-energy or utility funds instead.
The post XLE Is 91% Oil and Gas. Investors Buying “Energy” May Own Less Than They Think appeared first on 24/7 Wall St..
]]>
U.S. imports of Venezuelan crude jumped by 183,000 barrels per day in the week ended Sept. 11, reaching 782,000 barrels per day, according to the U.S. Energy Information Administration. That was the highest weekly total since August 2017.
The bigger trend is even more striking. Over the past six months, Venezuelan imports have increased by 550,000 barrels per day, or 237%, while the three-month average reached 626,000 barrels per day.
That is a long way from Venezuela’s historical peak, when U.S. imports reached roughly 1.5 million barrels per day in 1997 and routinely exceeded 1 million barrels per day between 1995 and 2007. Still, the direction is unmistakable: American refiners are consuming more Venezuelan oil again.
And that creates an unusually direct opportunity for Chevron (NYSE:CVX).
Chevron Has a Front-Row Seat
Chevron isn’t merely watching Venezuela’s oil industry recover. It is helping drive the recovery.
On Sept. 2, Chevron announced updated agreements covering its Venezuelan joint ventures, including additional acreage in the Orinoco Belt. The company plans to invest more than $7 billion over the next five years and expects production from its Venezuelan ventures to more than double to approximately 600,000 barrels per day. Chevron says total production costs are below $20 per barrel.
That puts Chevron’s Venezuela opportunity alongside its broader financial strength. The oil and gas giant reported total revenue of $70 billion in the second quarter, up 56% from the year-ago figure, generating earnings of $12 billion, or $6.06 per share on an adjusted basis, more than quadruple the $1.45 per share it earned last year. Adjusted free cash flow was $15.4 billion while reducing debt by a record $8.4 billion.
Chevron’s board also declared a quarterly dividend of $1.78 per share, equal to a roughly 3.4% annualized yield at the Sept. 18 closing price.
The Refining Angle Matters, Too
Venezuelan crude is generally heavier than the crude produced in many U.S. shale fields, making refinery configuration important. Chevron has another advantage here: its U.S. refineries processed a record 1.07 million barrels per day of crude in the second quarter, operating at more than 97% utilization.
That creates a potentially valuable combination. Chevron can participate in Venezuela’s upstream production while its downstream business benefits from access to crude suited to sophisticated U.S. refining infrastructure.
U.S. markets have historically been the most attractive for Venezuela’s crude due to the short distance across the Gulf of America and the Gulf Coast refineries there are designed to process it.
Granted, Venezuela remains a geopolitical and regulatory risk. The U.S. Treasury continues to regulate activities involving Venezuelan entities, but the Sept. 11 Federal Register lists Chevron among companies authorized to conduct specified Venezuela-related activities.
Still, that means investors shouldn’t treat 600,000 barrels a day as guaranteed future production.
Key Takeaway
In short, Venezuela’s return to the U.S. oil supply chain is becoming a measurable trend, with imports reaching 782,000 barrels per day and a three-month average of 626,000 barrels per day. President Trump has said he will use Venezuelan oil to help refill the U.S.’s Strategic Petroleum Reserve that are near depletion levels.
Chevron has the clearest direct connection to that growth. Its Venezuelan production could more than double, while its U.S. refining system is already operating at record throughput. With $15.4 billion of quarterly adjusted free cash flow, a 3.4% dividend yield, and a plan to invest $7 billion in Venezuela, Chevron gives investors a way to participate in Venezuela’s oil revival without making a pure bet on Venezuela itself.
That makes Chevron stock worth putting on the watch list for investors seeking energy exposure with a growing Venezuelan catalyst.
The post U.S. Oil Imports From Venezuela Just Exploded to a 9-Year High — Chevron Could Be the Biggest Winner appeared first on 24/7 Wall St..
]]>For a retirement investor deciding between Chevron (NYSE:CVX) and Exxon Mobil (NYSE:XOM) as an income holding today, the question is simple: which oil major writes the more durable dividend check through the next commodity cycle? Both raised again this year, both sit on multi-decade streaks of annual increases, and both are flush with cash and WTI hovering near $100 a barrel. The comparison that matters is what happens when crude falls again.
Round 1: Current Yield and Raw Income
Chevron pays a $1.78 quarterly dividend, or $7.12 annualized, for a yield of 3.07%. Exxon pays $1.03 quarterly, or $4.12 annualized, for a yield of 2.57%. On $100,000 invested, that is roughly $3,070 versus $2,570 in year-one cash. Chevron also trades at a richer earnings multiple (P/E 34 versus Exxon’s P/E 23), but for the income-first buyer the raw cash yield is what funds the grocery bill.
Winner: Chevron. More income per dollar deployed, full stop.
Round 2: Durability Through the Cycle
This is where the verdict is decided, and Exxon wins it decisively. Start with the balance sheet. Exxon carries net debt/EBITDA of 0.548 and interest coverage of 56x. Chevron sits at net debt/EBITDA of 1.08 and interest coverage of 13.7x, with debt/equity of 0.251 against Exxon’s 0.168. Chevron’s net debt ratio climbed to 15.6% from 10.4% financing the Hess deal, and while it just paid down more than $8 billion in the quarter, the leverage gap is real.
Cash coverage tells the same story. Exxon generated more than $17 billion of free cash flow in Q2 2026 and returned more than $9 billion to shareholders while cutting net debt by more than $7 billion. Chevron posted $18.1 billion in free cash flow, but management flagged $1.4 billion in favorable timing effects, and Q1 2026 free cash flow was actually negative $1.55 billion. Structurally, Exxon’s business is more integrated: advantaged assets like Permian, Guyana and LNG were 59% of production in 2025, up seven points from 2024, and Guyana has hit a free cash flow inflection now that the $55 billion investment is fully recovered. When Brent falls, integrated refining and chemicals cushion earnings, and Exxon’s mix is deeper.
Winner: Exxon. Lower leverage, higher coverage, and a cash-generative Guyana curve that only accelerates from here.
Round 3: Dividend Growth and Track Record
Exxon has a 43-year streak of annual dividend increases; Chevron has 39. The most recent raises were comparable, with Chevron lifting the quarterly from $1.71 to $1.78 and Exxon from $0.99 to $1.03. What separates them is behavior in stress: Exxon’s quarterly dividend held flat at $0.87 across 2019 and 2020 but never cut, and it kept raising through every downturn since 1982. Chevron’s history is comparably clean, but the shorter streak crossed fewer commodity troughs at today’s scale.
Winner: Exxon. Longer runway of tested increases.
Verdict
For the retirement investor who needs the check to arrive in every crude environment, Exxon Mobil is the more durable dividend. The lower leverage, the 56x interest coverage, the integrated refining and chemicals ballast, and the Guyana free-cash-flow ramp all point the same direction. Chevron wins if the priority is maximum current income and the buyer is comfortable with the Hess-related leverage bump; its 3.07% yield is a genuine advantage. But for durability, which is the criterion that matters when you are living off the payout, Exxon takes it.
The post Chevron vs. Exxon: Which Dividend Survives the Downturn appeared first on 24/7 Wall St..
]]>Exxon Mobil (NYSE:XOM) is moving toward a return to a country it walked away from nearly two decades ago. The Wall Street Journal reported on September 16, 2026 that Exxon is nearing a deal to invest in Venezuelan oil fields, and WTVB reported on September 17, 2026 that Exxon is advancing talks to return to Venezuela’s Orinoco Belt, according to sources. According to finance.biggo.com, ExxonMobil is eyeing a return to Venezuela after 19 years, weighing an investment in fields that carry very large geological estimates.
On CNBC, Becky Quick said ExxonMobil is reportedly nearing a deal to invest in a number of Venezuela’s developed and undeveloped oil fields, and that those fields collectively contain more than 50 billion barrels of oil. Separately, Becky Quick said Harold Hamm’s Continental Resources signed a memorandum of understanding with Venezuela’s state oil company to develop an area with an estimated 30 billion barrels of oil reserves. The Wall Street Journal characterized the Continental agreement, signed on September 16, 2026, as a preliminary oil deal. According to energynewsbeat.co, Continental’s memorandum of understanding with Petroleos de Venezuela covers the Ayacucho 2 Block in the Orinoco Belt and marks the Oklahoma independent’s first move into the country.
What the Barrel Figures Actually Describe
The fields “contain” these volumes. That is a geological estimate of oil in the reservoir. It is not Exxon’s booked reserves, not Continental’s booked reserves, and not production. A memorandum of understanding is not a signed contract, and the preliminary label matters.
The two deal figures also do not add up to any headline number. The article title references Trump saying the United States secured a 65 billion barrel agreement with Venezuela. That claim comes from a different source, describes something different, and does not reconcile with either company disclosure. The barrel figures circulating around Venezuela right now come from different claims about different things.
Why Exxon Left in the First Place
Exxon operated the Cerro Negro heavy oil project in the Orinoco Belt until Hugo Chavez’s government nationalized foreign oil assets in 2007. Exxon pursued arbitration against PDVSA and Venezuela for more than a decade over that seizure. Venezuela holds the world’s largest proven oil reserves, which is why Western majors keep coming back to the conversation, and why the country’s history of expropriating foreign oil assets keeps hanging over it. Any company returning today faces that history directly.
Exxon’s current international negotiating posture leans on execution credibility built elsewhere. On the Q1 2026 8-K filing, the company detailed a portfolio anchored by Guyana and the Permian. On the Q2 2026 call, chief executive Darren Woods addressed Venezuela indirectly, noting Exxon has “a large chunk of acreage which is in force majeure waiting for the ultimate ruling from the International Court of Justice on the Venezuela dispute”.
Stock Reaction: Flat Today, Strong Behind It
Exxon shares are not rallying on the news. The stock traded at $162.01 as of 12:10 p.m. ET on September 17, 2026, down 0.80% on the session, according to WTVB. The longer trend is much stronger. Exxon is up 37.31% year to date and up 45.33% over the past year.
Context Worth Keeping in Mind
Two pieces of prior 24/7 Wall St. reporting are worth reading alongside this news. Gulf Coast refiners poured cold water on the 65 billion barrel framing that has followed Trump’s statement. A former Chevron executive has separately warned that Venezuela’s oil opportunity comes with a major catch. Both point to the same reality for readers: large reserve numbers and actual production are separated by years, significant capital commitment, and considerable political risk. The MOU stage, where Continental sits today, is a long way from a barrel of oil moving through a pipeline.
The post Exxon Nears Venezuelan Oil Deal, After Trump Says U.S. Secured 65 Billion Barrel Agreement With Country appeared first on 24/7 Wall St..
]]>Ten thousand six hundred dollars a month equals $127,200 a year, roughly the take-home of a dual-income professional household or a comfortable retirement in a coastal metro area. Replacing that check with investment yield is a math problem before it is a portfolio problem, and the answer swings by more than $2 million depending on the income tier you choose. Here is the core equation: annual income divided by portfolio yield equals capital required. Everything else is tradeoff analysis.
Sleep-at-Night Math: The 3% to 4% Tier
At a 3.5% blended yield, $127,200 divided by 0.035 equals roughly $3.63 million. At 4%, the number drops to $3.18 million. This is the range where dividend growth stocks and broad equity income funds live, and it is where the check keeps rising every year.
AbbVie (NYSE:ABBV) is the textbook example. The stock yields about 2.6%, but the quarterly payout climbed from $1.48 in 2023 to $1.73 in 2026, and the shares have returned 194% over five years. Skyrizi grew 24.4% and Rinvoq 24.5% last quarter, funding the growth. Chevron (NYSE:CVX) rounds out the tier at a 3.2% yield, with quarterly free cash flow of $18.1 billion in Q2 and 16 consecutive quarters of returning more than $5 billion to shareholders.
You need the most capital here, but you also get the most durable income stream.
Moderate Middle Ground: 5% to 7% Yields
Push the yield to 6%, and the capital requirement collapses to $2.12 million. This is net lease REIT and preferred equity territory. W. P. Carey (NYSE:WPC) yields around 5.4% with a $3.76 annualized dividend, up 4.4% year over year. The portfolio runs at 98.5% occupancy, with 47.8% of annual base rent tied to CPI escalators. That inflation link matters when the goal is a real income stream. The risks are real too: the shares have slipped nearly 7% over the past month, and Q2 included $79.4 million in impairment charges tied to tenant credit issues.
Cash Now, Growth Later: The 8% to 14% Bucket
At a 10% yield, $127,200 requires only $1.27 million. That is where business development companies, mortgage REITs, and leveraged covered call funds sit. Hercules Capital (NYSE:HTGC) yields about 9.1% with a $0.47 quarterly distribution and a portfolio that is 97.8% floating rate. It also illustrates the aggressive-tier catch. The distribution ran $0.48 across 2024 before stepping down to $0.47, non-accruals doubled from one loan to two, and the first-lien mix fell from 91.0% to 86.8%. High current yield and high total return are two different things.
Why the Low-Yield Portfolio Often Wins
An AbbVie holder in 2023 collected $1.48 per share per quarter. Three years later, that same share pays $1.73. Meanwhile, a fixed 10% distribution paid the same dollar in year one and year ten, and often less as principal eroded. The Chevron dividend has stepped up every year of the record, from $1.29 in 2020 to $1.78 in 2026. That is the compounding case for accepting a lower headline yield.
A blended approach threads the needle. A portfolio spread across broad dividend equity, high-yield equity, a net lease REIT, a BDC, pharma, energy, and a short-duration cash-plus sleeve can land near a 4.9% blended yield, requiring roughly $2.6 million to hit $10,600 a month (we mapped the full mix, the payment calendar, and the withdrawal order in a free Paycheck Portfolio guide if you want the template).
Three Moves Worth Making This Week
- Back into your actual number. Pull your last 12 months of spending, subtract Social Security or pension income you already have coming, and apply the equation to the gap. Most people need less than they assume.
- Stress test the aggressive sleeve. Model what happens to your income if a 10% yielder cuts its distribution 20% and the price falls 15%. If the resulting income still covers essentials, the allocation is defensible. If not, shift weight toward the growth tier.
- Compare 10-year total returns, not yields. A 282% ten-year total return in HTGC against a 528% ten-year total return in ABBV is the argument for owning both rather than picking one on yield alone.
The post How Large Does Your Portfolio Need to Be to Generate $10,600 a Month? appeared first on 24/7 Wall St..
]]>US retail diesel prices hit a record this week, and Washington is openly debating a tool it has never used before: an export ban on a refined petroleum product. The reported national average sat at roughly $6.31 per gallon on September 16, 2026, per AAA-sourced data cited in press coverage, according to Forbes. Against that backdrop, Colorado Politics reported on September 15, 2026 that Senate Majority Leader John Thune said he is open to exploring a diesel export ban, telling reporters, “If the United States has the supply and is exporting it, that might be one way of getting at it.”
Squeeze From Three Directions
The price move reflects three compounding supply shocks. Continued war-related disruption to Iranian and Middle East oil flows has tightened crude available to global refiners. Ukrainian drone strikes on Russian refineries have taken meaningful volumes of Russian diesel production offline, in a country responsible for roughly one in nine barrels of global diesel output. US distillate exports ran at a record pace in early August 2026, draining domestic tanks. OilPrice.com reported that US distillate stockpiles fell to their lowest seasonal level since 1996. US retail regular gasoline averaged $4.32 per gallon nationally for the week ending September 14, 2026, up $0.31 from a month earlier.
Burgum Pushes Back on the Mechanics
Speaking at the G20 Energy Ministerial in Houston, per Colorado Politics, Interior Secretary Doug Burgum said, “We would consider an export ban if we thought that actually might lower prices, but that’s not the case.” He warned a ban could invite retaliation from trading partners and hurt consumers in states like California that rely partly on foreign fuel imports.
The technical objection is sharper. The Center for Strategic and International Studies estimates roughly 70% of US refining capacity is built to process heavy, sour crude imported from abroad, not the light, sweet crude from American shale fields. Most US refineries are tuned to thicker, higher-sulfur oil they buy overseas. A ban that trapped US-produced light crude at home would not automatically yield more diesel, because the refineries best suited to make it cannot easily process what is available. CSIS argues an export ban would not deliver “sustained fuel price relief,” and warns refiners running at a loss could simply cut activity, deepening the shortage, according to Center for Strategic and International Studies.
White House Keeps Its Options Open
The administration’s response has been notably non-committal. White House spokeswoman Taylor Rogers said, “President Trump remains committed to unleashing American energy dominance, cutting costs, and putting more money back in the pockets of hardworking American families. As the U.S. continues to maintain full control of the Strait of Hormuz, oil and gas prices will fall back to pre-conflict levels.” That statement neither endorses nor rules out an export ban, according to The White House. It marks a shift from an earlier position in which the U.S. Department of the Interior said the “Trump administration has no plan to implement restrictions on oil and gas exports.”
Trump’s recent commentary has focused on producers. On August 3, 2026, Donald Trump posted on Truth Social that without his administration “the Oil Industry, and our Country itself, would be DEAD!” and accused ExxonMobil (NYSE:XOM) and Chevron (NYSE:CVX) of “making too much money.”
A Tool Washington Has Never Used
The United States banned crude oil exports beginning in 1975 and lifted that ban in 2015. Refined products like diesel and gasoline have never been subject to a comparable export ban in the modern era. Whatever Thune is willing to explore, it would be genuinely new policy.
The post Senate Majority Leader John Thune Floats a Diesel Export Ban as Prices Hit $6.31 a Gallon. Trump Team Not Convinced It Would Work appeared first on 24/7 Wall St..
]]>A commercial index provider spent 15 years watching active dividend managers try to beat its benchmark, and the scoreboard is unflattering. S&P Dow Jones Indices’ anniversary study, posted September 1, 2026, found the Dow Jones U.S. Dividend 100 Index outperformed 226 of 237 active dividend funds from August 31, 2011 through June 30, 2026.
That is the benchmark tracked by Schwab U.S. Dividend Equity ETF (NYSEARCA:SCHD), the fund most retail investors reach for when they want a screened basket of American dividend payers at a rock-bottom fee.
The S&P Dow Jones Indices paper does not identify the eleven winners or spell out fee treatment across share classes, and the index reflects gross returns rather than an investable product. Treat it as a marketing document rather than a verified ranking of SCHD itself. Still, the direction is unmistakable, and it matters because Charles Schwab Asset Management charges 0.06% annually to run this strategy. The question worth asking is whether SCHD’s recipe belongs in your income sleeve today.
And even the 11 outperformers are unlikely to keep outperforming in the next decade and a half, as active ETFs are usually inconsistent performers.
What You Actually Own
SCHD’s index screens U.S. companies with 10 or more years of dividend payments, then ranks survivors on cash-flow-to-debt, return on equity, dividend yield, and five-year dividend growth. The result tilts toward mature cash generators rather than the highest yielders.
The current book reads that way. Top positions include Qualcomm (NASDAQ:QCOM) at 6.7%, Texas Instruments (NASDAQ:TXN) at 5.9%, UnitedHealth (NYSE:UNH) at 5.1%, and Coca-Cola (NYSE:KO) near 4%, with energy majors Chevron (NYSE:CVX) and ConocoPhillips (NYSE:COP) filling out the top ten.
The fund pays quarterly. Trailing 12-month distributions totaled $1.048 per share, versus an annualized forward run rate of $1.01, pointing to a yield in the low 3% range against a recent price near $34.
What the Index Beat, and What It Did Not
The 226-of-237 figure is compelling because active dividend funds carry higher expenses and turnover, which compound against them across a 15-year window. Fee drag alone explains much of the gap.
But don’t mistake the benchmark’s record for SCHD’s. The ETF launched in October 2011, and quality-and-yield screening tends to lag growth-led markets. Over the past year, SCHD returned 30.2%, ahead of Vanguard High Dividend Yield ETF (NYSEARCA:VYM) at 17.3% and Vanguard Dividend Appreciation ETF (NYSEARCA:VIG) at 11.9%.
Zoom out five years and the picture inverts. SCHD returned 62%, VYM 76.9%, and VIG 63%. The screened-quality approach earned its keep in some periods and paid for itself in others.
Where the Strategy Pinches
SCHD carries no international exposure, so it delivers a concentrated bet on U.S. dividend payers. If the next decade favors ex-U.S. equities, this fund cannot help you.
The sector tilt runs heavy toward financials, health care, consumer staples, and energy, and light on the mega-cap technology names that have led index returns for years. iShares Core Dividend Growth ETF (NYSEARCA:DGRO), at a 0.08% expense ratio, serves a similar role with a softer value tilt.
Distribution volatility is the other quiet cost. The latest payment came in at $0.2525, down from $0.2569, a reminder that these are not fixed coupons.
Bull and Bear Case for SCHD
The bull case is that a rules-based screen focused on cash-flow quality and dividend durability has already outrun the median active manager for 15 years, and the fee it charges is essentially a rounding error. For an investor building a durable income sleeve, that combination is hard to replicate through security selection.
The bear case is that SCHD’s methodology bakes in a value and old-economy tilt that structurally underweights the market’s fastest-compounding businesses. A retiree who does not need capital appreciation may accept that trade willingly; a 40-year-old dollar-cost averaging for growth probably should not.
Which case wins depends on the next market regime. If leadership broadens beyond mega-cap tech, SCHD looks like a very good core holding. If it doesn’t, a 5% to 10% income sleeve is a reasonable ceiling for this fund in most portfolios.
The post Only 11 of 237 Active Dividend Funds Beat SCHD’s Index appeared first on 24/7 Wall St..
]]>Chevron (NYSE:CVX) has spent the past year quietly rewriting its story. The Microsoft (NASDAQ:MSFT) power deal, the Hess integration, and downstream margins doing the heavy lifting have all changed the pitch.
Our 24/7 Wall St. price target for Chevron is $227.15, roughly 4.31% above where CVX trades today at $217.77. That points to a hold, with high model confidence at 90%. The stock is near fair value after a strong run.
24/7 Wall St. Price Target Summary
| Metric | Value |
|---|---|
| Current Price | $217.77 |
| 24/7 Wall St. Price Target | $227.15 |
| Upside | 4.31% |
| Recommendation | HOLD |
| Confidence Level | 90% |
Why Chevron Is Trading Near 52-Week Highs
CVX is up 3.8% in the past week, 9.83% in a month, and 46.85% year to date, brushing the 52-week high of $217.65.
Q2 2026 was the catalyst: adjusted EPS of $6.06 on revenue of $67.20 billion, up 51.4% year over year, with downstream earnings jumping to $4.87 billion from $737 million.
Management hit $3 billion of structural cost cuts six months early and captured $1.5 billion of Hess synergies, 50% above the initial target. Debt fell $8.41 billion in the quarter alone.
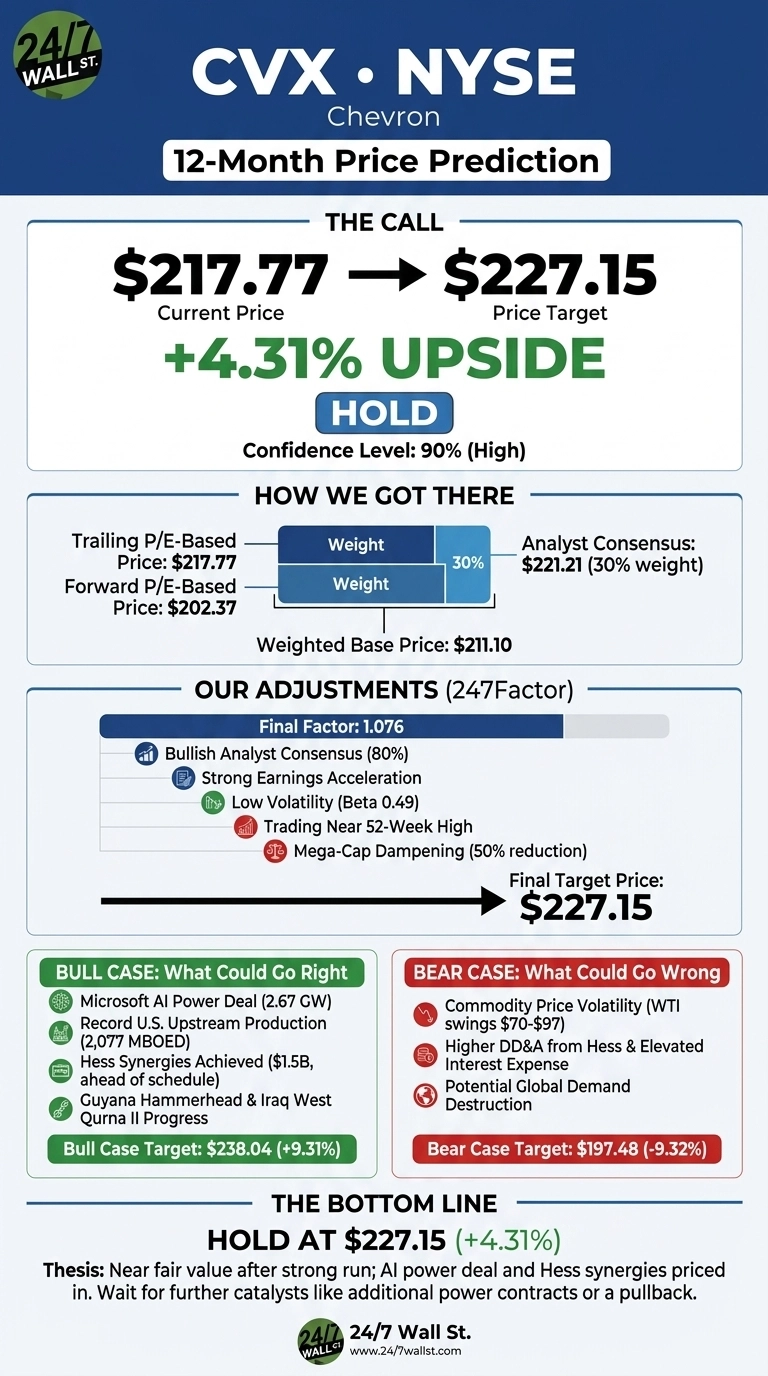
Why Bulls See a Breakout Ahead
The bull case now hinges less on Brent than on power. Chevron’s 20-year take-or-pay power purchase agreement with Microsoft for 2.67 GW of behind-the-meter capacity in West Texas, branded Project Kilby, is designed to deliver “mid-teens returns and long duration contracted cash flows that are independent of commodity price cycles.”
Management called it a “repeatable model,” with advanced discussions on more sites underway. Layer in record U.S. upstream production of 2,077 MBOED, 97% refinery utilization, Guyana’s Hammerhead FID, and Iraq’s West Qurna II negotiations, and the setup gets richer. A bull scenario supports $238 within a year.
What Could Go Wrong
Chevron carries commodity risk regardless of the AI narrative. WTI has swung from the $70s in early July to over $97 in September, and a slip back would compress upstream cash flow fast. Higher DD&A from Hess and elevated interest expense are also lingering drags.
Bears would counter that the CEO has stated Chevron’s 2030 objectives already assume flat, lower commodity prices, and the $3 billion cost program gives the company a wider margin buffer than in past cycles. Still, the model’s bear path lands around $197.48.
How Chevron Compares to ExxonMobil and ConocoPhillips
ExxonMobil (NYSE:XOM) is the closest integrated peer. XOM trades at a trailing P/E of 24 versus Chevron’s 20, with a market cap of $696 billion. Exxon delivered Q1 2026 revenue of $85.14 billion and adjusted EPS of $1.16. Chevron’s cheaper multiple and larger downstream swing this year make our target look reasonable rather than aggressive.
ConocoPhillips (NYSE:COP) is the pure U.S.-focused upstream counterpoint. COP posted Q2 2026 revenue of $19.16 billion, adjusted EPS of $3.24, and doubled buybacks to $2 billion. Without downstream or a Microsoft-scale power deal, COP is more price-sensitive. That contrast supports Chevron’s premium and reinforces our hold.
Chevron Price Prediction 2026-2030
The 24/7 Wall St. price target of $227.15 and hold rating reflect a stock that has already priced in the good news, backed by 90% confidence. The tipping factor is Project Kilby: if a second data-center power contract lands, the multiple rerates.
The setup would strengthen on any additional Microsoft-style deal or a pullback to the mid-$200s. It would weaken if Brent slides under $70 and refining cracks roll over into winter.
| Year | 24/7 Wall St. Price Target |
|---|---|
| 2026 | $220.01 |
| 2027 | $226.85 |
| 2028 | $236.56 |
| 2029 | $247.02 |
| 2030 | $259.25 |
These projections assume Chevron holds its 2-3% production growth objective and delivers Project Kilby on schedule. Meaningful upside or downside will come from Brent trajectory, additional AI power contracts (we profiled seven companies feeding the AI data-center buildout, from power to cooling, in a free report you can grab here), and Iraq’s West Qurna II terms.
The post Chevron Doesn’t Need Oil to Hit New Highs. Here’s What Could Drive the Stock Instead appeared first on 24/7 Wall St..
]]>Warren Buffett stepped down as CEO of Berkshire Hathaway on December 31, 2025, after six decades leading the conglomerate he transformed from a struggling textile mill into a $1 trillion empire. The “Oracle of Omaha” left his successor, Greg Abel, with a very concentrated portfolio: more than 71% of Berkshire’s $365.5 billion portfolio is invested in just seven stocks. Abel, who has served as vice chair overseeing non-insurance operations, officially took over as CEO on January 1, 2026. At 96, Buffett isn’t fully retiring. He remains board chair and comes to the Omaha headquarters as much as before. However, he has stated he will be “going quiet” and leaving all decision-making to Abel.
One thing that Abel has been careful about, as he has started some rearrangement of the Berkshire Hathaway (NYSE: BRK-B) portfolio, is to carefully maintain some of the longest-held stocks at Berkshire Hathaway, and with good reason. Some key holdings have not only been outstanding performers this year, but also pay dependable dividends, which are often reinvested or added to the gigantic $365 billion cash pile Buffett has been accumulating over the last five years. Berkshire Hathaway generates a stunning $4.37 billion in dividend income each year, and an additional $12 to $16 billion in risk-free interest income.
While Buffett and Abel patiently wait to put some of the cash to work, they may not have to wait long, as the stock market could be poised for a 10% to 20% correction, and it could be coming right around the corner. With the potential for higher interest rates, a massive $40 trillion national debt, a tired and overbought stock market, and fading artificial intelligence momentum, all the ingredients for a big correction are lining up. Toss in the potential for more geopolitical fallout, especially if the fighting in the Middle East expands, the sellers, and especially the short sellers, could have their fingers on the sell button.
Five of Berkshire Hathaway’s premier holdings are a good place to shift capital now, and all pay reliable dividends that, in some cases, are raised every year. Top Wall Street firms rate all as Buys, and they make sense for worried investors now.
Why Do We Cover Berkshire Hathaway Stocks?
Few investors have the results and reputation Buffett has earned over the past 60 years. Though he has stepped away from the CEO chair, his impact and investment guidelines are likely to remain in place long after he is gone. While investing has evolved since Buffett took control of Berkshire Hathaway in 1965, buying good companies with globally recognized products and services that pay dividends will remain a timeless approach.
American Express
American Express (NYSE:AXP) is a bank holding company and multinational financial services corporation specializing in payment cards, and it pays a 1.09% dividend. This globally integrated payments company operates card-issuing, merchant-acquiring, and card-network businesses. The company raised its quarterly dividend from $0.82 to $0.95 between January and April 2026.
The company offers products and services to customers worldwide, including consumers, small businesses, midsized companies, and large corporations. Its segments include:
- U.S. Consumer Services, which offers travel and lifestyle services, as well as banking and non-card financing products.
- Commercial Services offers payment, expense management, banking, and non-card financing products.
- International Card Services provides services to international customers, including travel and lifestyle services, and manages certain international joint ventures and its loyalty coalition business.
- Global Merchant and Network Services operates a payments network that processes and settles card transactions, acquires merchants, and provides multichannel marketing programs, capabilities, services, and data analytics.
Berkshire Hathaway owns 151,610,700 shares, 22.2% of American Express’s float, and 14.1% of the portfolio.
Piper Sandler has an Overweight rating with a $405 target price.
Bank of America
Buffett has trimmed his Bank of America (NYSE:BAC) position over the past two years, selling a whopping 50 million shares in the fourth quarter of 2025 and another 30 million shares in Q2 of 2026. This quality financial giant remains an exceptional long-term holding with a solid 1.79% dividend yield. The dividend was raised from $0.26 to $0.28, then to $0.32 per quarter, with two increases over the past 12 months. Bank of America is a bank holding company and financial holding company that reported impressive Q2 results. Berkshire Hathaway still owns 483,394,015 shares, or 7.9% of the portfolio and 6.9% of the float, despite the massive sales.
Its Consumer Banking segment offers a range of credit, banking, and investment products and services to consumers and small businesses. The Global Wealth & Investment Management segment comprises two businesses:
- Merrill Wealth Management offers tailored solutions to meet clients’ needs through a comprehensive suite of investment management, brokerage, banking, and retirement products.
- Private Bank provides comprehensive wealth management solutions.
Its Global Banking segment offers a range of lending-related products and services, including integrated working capital management and treasury solutions, as well as underwriting and advisory services. The Global Markets segment offers sales and trading services, as well as research services, to institutional clients across fixed income, credit, currency, commodity, and equity markets.
Jefferies has a Buy rating with a $75 target price.
Chevron
Chevron (NYSE:CVX) is an American multinational energy company primarily focused on oil and gas. This integrated giant is a safer option for investors seeking a position in the energy sector. It pays a substantial 3.26% dividend, which was raised by 5% earlier this year, and has a 39-year streak of dividend increases. Chevron operates integrated energy and chemicals businesses worldwide through its subsidiaries. Berkshire Hathaway owns 84,375,856 shares, which equals 4.2% of the float and 4.7% of the portfolio.
The company operates in two segments. The Upstream segment is involved in:
- Exploration, development, production, and transportation of crude oil and natural gas
- Processing, liquefaction, transportation, and regasification associated with liquefied natural gas
- Transportation of crude oil through pipelines, and transportation and storage
- Marketing of natural gas, as well as operating a gas-to-liquids plant
The Downstream segment engages in:
- Refining crude oil into petroleum products
- Marketing crude oil, refined products, and lubricants
- Manufacturing and marketing renewable fuels
- Transporting crude oil and refined products by pipeline, marine vessel, motor equipment, and rail car
- Manufacturing and marketing of commodity petrochemicals, plastics for industrial uses, and fuel and lubricant additives
It also involves cash management, debt financing, insurance operations, real estate, and technology businesses.
Piper Sandler has an Overweight rating with a $243 target price.
Coca-Cola
Coca-Cola (NYSE:KO) is an American multinational corporation founded in 1892. It remains one of Buffett’s longest-held holdings. Berkshire owns 400 million shares, which represent 9.3% of the float and 9.3% of the portfolio. The stock pays a dependable 2.36% dividend. The raised to $0.53 per share in May 2026, marked the 64th straight year of dividend increases.
Coca-Cola is the world’s largest beverage company, offering consumers more than 500 sparkling and still brands. Led by Coca-Cola, one of the world’s most valuable and recognizable brands, the company’s portfolio features 20 billion-dollar brands, including:
- Diet Coke
- Coca-Cola Light
- Coca-Cola Zero Sugar
- Caffeine-free Diet Coke
- Cherry Coke
- Fanta Orange
- Fanta Zero Orange
- Fanta Zero Sugar
- Fanta Apple
- Sprite
- Sprite Zero Sugar
- Simply Orange
- Simply Apple
- Simply Grapefruit
- Fresca
- Schweppes
- Dasani
- Fuze Tea
- Glacéau Smartwater
- Glacéau Vitaminwater
- Gold Peak
- Ice Dew
- Powerade
- Topo Chico
- Minute Maid
Globally, it is the top provider of sparkling beverages, ready-to-drink coffees, juices, and juice drinks. Through the world’s most extensive beverage distribution system, consumers in more than 200 countries enjoy the company’s beverages at a rate of over 1.9 billion servings per day. And the company owns 19.5% of Monster Beverage (NASDAQ:MNST), which continues to deliver strong financial results.
UBS has a Buy rating and set a target price of $104.
Occidental Petroleum
After years of building this position, Buffett and Berkshire Hathaway are finally in the money on this company, which pays a 1.63% dividend. Occidental Petroleum (NYSE:OXY) is an international energy company with assets primarily in the United States, the Middle East, and North Africa. The company is an oil and gas producer in the United States, including the Permian and D.J. basins and the offshore Gulf of America. Occidental’s most recent dividend increase was on February 19, 2026. The board raised the quarterly dividend by more than 5%, from $0.24 to $0.26 per share. That bumped the annualized rate from $0.96 to $1.04.
Berkshire Hathaway has a large position in the company, owning 264,941,431 shares, representing 26.6% of the float and 4.3% of the portfolio.
Occidental’s oil and gas segment explores for, develops, and produces oil (including condensate), natural gas liquids (NGLs), and natural gas. The midstream and marketing segment purchases, markets, gathers, processes, transports, and stores oil (including condensate), NGLs, natural gas, carbon dioxide (CO2), and power. This segment provides flow assurance, maximizes the value of its oil and gas, and optimizes the company’s transportation and storage capacity. It also invests in companies that do similar activities, including low-carbon ventures.
A notable development was Occidental’s decision to sell its OxyChem subsidiary to Berkshire Hathaway, with the bulk of the proceeds expected to strengthen the company’s balance sheet and further concentrate its business on oil and gas. The move was notable because Buffett had reportedly long coveted OxyChem, and Berkshire now owns the business outright. Berkshire Hathaway completed its purchase of OxyChem from Occidental on January 2, 2026. That gives Buffett full ownership of the chemicals business while providing Occidental with $9.7 billion in cash to reduce debt and sharpen its focus on energy.
Wells Fargo has an Overweight rating on this stock and an $82 price objective.
The post Red October Sell-Off Could Be Coming: 5 Warren Buffett Dividend Stocks Are Safe Havens appeared first on 24/7 Wall St..
]]>Chevron (NYSE:CVX) CEO Mike Wirth said that the emergency oil buffers that softened the market after the Iran conflict began have been largely depleted. He argues those cushions cannot be repeated indefinitely, which leaves crude vulnerable to any fresh disruption.
He is backing that view with real money. Chevron has proposed a Venezuela expansion aimed at more than doubling output there by early next decade, and the project will be funded entirely with cash generated by its existing Venezuelan joint ventures.
That self-funding structure matters because it limits capital diverted from the Permian, Guyana, or the Gulf. You get an option on Venezuelan barrels without shrinking the buyback pool.
Wirth’s Shortage Call
Wirth’s supply case rests on more than one lever. He noted that strategic reserve releases and eased restrictions on some sanctioned oil inventories helped balance the market, but those actions cannot be repeated.
Prices agree for now. Brent settled at $109.51 on September 9, 2026, well above the $61.35 close on December 31, 2025.
On the earnings call, Wirth added that “demand destruction is not obvious to me at any significant scale”. Thin buffers plus resilient demand is the setup he is underwriting.
Depleted cushions are a real condition, but not a guarantee of sustained triple-digit crude. OPEC+ discipline and Chinese consumption remain the swing variables.
Numbers Behind the Bet
The Q2 results show why Chevron can lean forward. Adjusted EPS was $6.06, revenue $67.20 billion, up 51.43% year over year, and free cash flow $18.10 billion.
Worldwide production hit a record 4,070 MBOED, up 20% year over year, with U.S. upstream at a record 2,077 MBOED. Wirth credited “disciplined investment and strong execution”.
Hess integration is running ahead of schedule, with $1.5 billion in annual run-rate synergies inside one year and the $3 billion structural cost target hit six months early.
Venezuela’s Real Risk
Wirth said “we’re in negotiations right now to try to improve the fiscal terms and enable more investment in Venezuela”, and confirmed debt recovery should be complete by early 2027.
Moreover, output across the three joint ventures has climbed from 40,000 to 250,000 barrels per day. That trajectory is the empirical basis for the expansion pitch.
The risks here are principally political. Sanctions policy has shifted before, and Caracas contract enforcement is not the Permian, so you should treat elevated prices and future output as scenarios rather than guarantees.
Because the plan draws on Venezuelan cash already in hand, a policy reversal caps the loss instead of opening a new one.
Is CVX Stock a Buy?
CVX trades at $214.04, up 44.35% year to date, on a forward earnings multiple of 16x with a 3.28% dividend yield and a 39th consecutive annual dividend increase.
Analysts carry an average target of $221.21, with 6 strong buy and 14 buy ratings against 4 holds and 1 sell. Given the cash engine, Hess synergies, and self-funded Venezuela optionality, the setup screens favorably on fundamentals.
Venezuela offers adequate compensation for exceptional risk, while the Permian, Guyana, and refining remain Chevron’s most lucrative barrels. The core thesis remains the Permian, Guyana, and refining, with Caracas a low-cost call option on Wirth being right about spare capacity. I’d tag CVX stock a Buy due to oil prices remaining high. Even if the situation in the Middle East calms down, oil will stay high for longer due to all the infrastructure damage and all the oil reserve stockpiles that would have to be replenished.
The post Chevron’s CEO Thinks the World Is Out of Spare Oil. He Is Betting $7 Billion on Being Right. appeared first on 24/7 Wall St..
]]>Warren Buffett doesn’t chase yield, but his disclosed equity book at Berkshire Hathaway still throws off a steady stream of quarterly checks. Three of those names — Chevron (NYSE:CVX), Coca-Cola (NYSE:KO) and Occidental Petroleum (NYSE:OXY) — pay dividends on a quarterly cadence that anyone with a brokerage account can plug into. That is the practical hook for readers at or near retirement: the same routine income, from the same routine payers, sitting inside one of the most watched portfolios on Wall Street.
The positions discussed here come from Berkshire’s 13F for the period ended June 30 filed on Aug. 14 (SEC filing). A 13F covers U.S.-listed long equity only, so this is Berkshire’s disclosed common-stock book, not its cash, wholly owned businesses, private stakes, or fixed-income holdings. Positions are disclosed roughly 45 days after quarter end and may have changed since. Nothing here should be read as what Berkshire owns today.
What stands out across all three names is stillness. Share counts were unchanged from the prior quarter in every case. No trims, no adds, no exits. For income-focused readers, that is arguably the more interesting signal: these are the payers Berkshire left alone while collecting the checks.
Coca-Cola: The 400 Million Share Anchor
Berkshire disclosed 400 million shares of Coca-Cola, representing 10.86% of the disclosed portfolio, with the share count unchanged from the prior filing. Coca-Cola is the beverage concentrate and syrup business famous for its namesake brand and a global bottling network.
The dividend is the whole story for holders. Coca-Cola pays a quarterly dividend of $0.53 per share, with the next payment dated Oct. 1 following a Sept. 15 ex-dividend date. The annualized forward amount is $2.12, and the payment stepped up from $0.51 in 2025 to $0.53 in 2026, extending a long streak of annual increases. Current yield sits at 2.32%.
Fundamentals under the payout look sturdy. Q2 FY2026 delivered adjusted EPS of $0.97, revenue of $13.38B (up 6.7% year over year), and net income of $4.43 billion (up 16.1%), and management raised full-year guidance to organic revenue growth of about 5% and comparable EPS growth of 9% to 10%. Trailing P/E of 26 and forward P/E of 25 reflect defensive-consumer premium, not a bargain. Analyst consensus target is $94.70, with the rating breakdown showing seven Strong Buy ratings, 12 Buy ratings, four Hold ratings, zero Sell ratings and one Strong Sell rating. Shares are up 27.69% YTD.
Chevron: The Integrated Oil Dividend
Berkshire disclosed 84,375,856 shares of Chevron, representing 4.67% of the disclosed portfolio, with the share count unchanged. Chevron is an integrated energy company covering exploration, production, refining, marketing, and chemicals.
The dividend picture is straightforward. Chevron paid $1.78 per share on September 10, 2026, matching the prior two quarterly payments and stepping up from $1.71 through 2025. The annualized forward amount is $7.12, and the yield runs at 3.05%. The dividend history file shows steady quarterly cadence stretching back over two decades.
Q2 FY2026 was a stronger quarter than the ratios suggest. Chevron reported adjusted EPS of $6.06, revenue of $67.20B (up 51.4% year over year), and free cash flow of $18.10B (up 272%), with worldwide net oil-equivalent production hitting 4,070 MBOED, up 20% year over year on the Hess Corporation acquisition. The company also cut total debt by $8.41B in the quarter and signed a 20-year 2.67 GW power purchase agreement with Microsoft for a West Texas AI data center. Trailing P/E is 21 with a forward P/E of 16. The consensus target is $221.21, with six Strong Buy ratings, 14 Buy ratings, four Hold ratings, one Sell rating and zero Strong Sell ratings. Shares are up 37.45% YTD.
Occidental Petroleum: The Smaller E&P Slice
Berkshire disclosed 264,941,431 shares of Occidental, representing 4.30% of the disclosed portfolio, with the share count unchanged. Berkshire also holds Occidental preferred stock and warrants that do not appear in the 13F common-stock row, so the common position understates the full relationship. Occidental is a hydrocarbon exploration and production company with petrochemical operations across the Americas.
The common-stock dividend was 28 cents per share with a Sept. 10 ex-dividend date and an Oct. 15 payment date, up from 26 cents earlier in 2026 and 24 cents across 2025. Annualized forward runs to $1.12, with a yield of 1.65%. The company describes the increase as 8% higher this year.
Q2 FY2026 came in hot, with adjusted EPS of $2.40, beating consensus of $1.85, revenue of $8.33 billion (up 31.8% YoY), and free cash flow of $3.02 billion (up 214% YoY). Occidental retired $1.90 billion of debt in the quarter, bringing principal debt to $11.8 billion against a $10 billion target. Trailing P/E is 18 with a forward P/E of 16. The consensus target is $67.08, and analyst posture is more cautious: Two Strong Buy ratings, seven Buy ratings, 15 Hold ratings, zero Sell ratings and zero Strong Sell ratings. Shares are up 44.05% YTD.
What the Steady Hand Says About Berkshire’s Approach
Three dividend payers, three unchanged share counts. Coca-Cola sits at 10.86% of the disclosed portfolio, dwarfing Chevron at 4.67% and Occidental at 4.30%, with the beverage stake serving as the long-duration anchor and the two energy names as a paired bet on production, cash returns, and deleveraging. The disclosed book here leans consumer defensive at the top and layered energy below, and the through-line across all three is a payout backed by real free cash flow generation.
Doing nothing was the decision of the quarter. For income-focused readers, that inaction is instructive. For a dividend book, the compounding math works when share counts stay put and the payments keep landing. Coca-Cola raised its dividend in 2026, Chevron raised its dividend in 2026, and Occidental raised its dividend in 2026. Three payers, three raises, zero trades.
What Readers Can Actually Take From This
The takeaway is that the same quarterly checks are available on the same schedule to any investor willing to buy the same tickers, rather than mirroring Berkshire’s weightings. The next visible catalysts are Coca-Cola’s Oct. 1 payment, Occidental’s Oct. 15 payment and Berkshire’s next 13F filing, which will show whether these steady positions stayed steady through the September quarter. 13F disclosures are backward looking, price targets and forecasts are projections rather than guarantees, and none of this is investment advice.
The post Warren Buffett Collects Quarterly Dividends From These 3 Stocks. Should You? appeared first on 24/7 Wall St..
]]>Brent crude vaulted back above $100 a barrel this week after CNBC reported that US Central Command destroyed five Iranian crude oil tankers Tuesday in retaliation for attempted attacks on an American warship, the latest escalation in a Middle East conflict that has already scrambled global supply. This is a supply-shock story, and the distinction matters because it changes which energy names actually benefit. Below are five US-listed stocks in the line of fire, ranked by the directness of their exposure, with a clear read on the mechanism for each, according to CNBC.
1. ConocoPhillips (COP)
ConocoPhillips (NYSE:COP) is the purest upstream leverage on this list. Q2 2026 revenue jumped to $19.16 billion, up 37.1% year over year, and adjusted EPS of $3.24 beat the $2.96 consensus as Brent averaged $104.52 versus $67.82 a year earlier. Net income roughly doubled to $3.93 billion.
Analysts appear to have taken the hint. The 2026 full-year EPS estimate has moved to $10.4435, with 14 upward revisions against 2 downward in the trailing 30 days. Shares are up 49.35% year to date to $136.85. CEO Ryan Lance is not chasing the price signal with capex, telling investors ConocoPhillips remains “firmly on track to deliver our $7 billion free cash flow inflection by 2029” and that free-cash-flow breakevens should fall from the mid-40s WTI today to the low 30s by 2029. New Kirkuk and Syria positions add growth optionality and geopolitical risk in equal measure.
2. Exxon Mobil (XOM)
Exxon Mobil (NYSE:XOM) is the largest single beneficiary in absolute dollar terms, with a $675.3 billion market cap and upstream production of 4.6 million oil-equivalent bpd. Q2 delivered “industry-leading earnings of $14.5 billion” and $23.6 billion in cash flow from operations, even as CEO Darren Woods disclosed “the temporary loss of approximately 10% of our upstream production” tied to Middle East disruption.
The setup for Q3 gets more interesting with this news. Guyana is producing approximately 900,000 gross bpd, and CFO Neil Hansen said Exxon has now “fully recovered the $55 billion of investment”, an inflection that shifts more revenue into free cash flow. Golden Pass LNG shipped its first cargo in April 2026, and the Permian hit more than 1.8 million oil equivalent barrels per day. Shares are up 40.04% year to date to $165.23, essentially at the analyst target of $170.91.
3. Chevron (CVX)
Chevron (NYSE:CVX) is the double-barreled play: upstream torque plus a refining segment already firing. Q2 revenue reached $67.20 billion, up 51.4% year over year, with net income of $12.07 billion and downstream earnings rocketing to $4.87 billion from $737 million a year earlier. Worldwide production hit 4,070 MBOED, up 20% on the Hess deal.
CEO Mike Wirth flagged “Products are tighter than crude around the world, and that’s why cracks have widened out” and expects “some upward pressure on product pricing here into the third quarter and perhaps beyond that.” Chevron reduced debt by $8.41 billion in Q2 alone and hit its $3 billion structural cost savings target six months ahead of schedule. Shares trade at $213.95, up 44.28% year to date, with 2026 EPS estimates lifted to $16.0382 on 19 upward revisions in 30 days.
4. Valero Energy (VLO)
Valero Energy (NYSE:VLO) is the double-edged case out of this group. Refining margin per barrel of throughput nearly doubled to $23.62 versus $12.35 a year earlier, US Gulf Coast ULS diesel margin surged to $43.52/bbl from $14.79, and adjusted EPS of $12.54 beat estimates by 23.84%. Renewable Diesel swung to $717 million operating income from a $79 million loss. Shares have exploded 141.89% year to date to $387.93.
Here’s the catch: sustained $100+ crude eventually compresses gasoline demand and squeezes downstream. COO Gary Simmons cited approximately 5 million bpd of global refining capacity offline and 1.7 to 1.9 million bpd of Russian capacity down, supporting a bullish mid-cycle margin view. That thesis works until it does not. Valero already has California regulatory overhang and shut refining ops at Benicia.
5. Schlumberger (SLB)
Schlumberger (NYSE:SLB) is the paradox on this list. Higher crude typically pulls customer capex, but SLB’s most profitable region is the exact geography being disrupted. Middle East & Asia revenue fell to $2.57 billion, down 14% year over year, with force majeure in Qatar, shut-ins in Iraq and security demobilizations. Net income slid 22.5%.
CEO Olivier Le Peuch is framing this as a delayed setup. He said “The market is starting to exhibit the characteristics of an upcycle” and cited third-party data pointing to FIDs for long-cycle projects rising approximately 30% year-on-year in 2026. Shares are up 47.96% year to date to $55.89 but slipped 3.85% over the past week as tanker headlines rekindled Middle East risk. Analyst target sits at $62.24.
Caveat Investors Should Not Ignore
A geopolitical risk premium can unwind as fast as it was priced in. WTI was at $91.48 on September 1 after touching $114.58 on April 7, and the one-year band has run from $55.44 to $114.58. Buying an energy name on this move means buying part of that geopolitical premium rather than a durable shift in the underlying supply picture. Upstream-heavy names get the cleanest earnings lift; a refiner rides crack spreads until demand cracks; and the services giant needs the shooting to stop before its highest-margin region can rebuild.
The post Oil Just Blew Past $100 a Barrel and These 5 Energy Stocks Are in the Line of Fire. appeared first on 24/7 Wall St..
]]>Five diesel pumps in California have run out of digits. The dispensers are showing $9.999 a gallon, the highest figure their hardware can display, according to a September 10, 2026 post from GasBuddy head of petroleum analysis Patrick De Haan, who cited the fuel-price app’s real-time crowdsourced data. As of this writing, no other outlet has independently corroborated the count or identified the stations, and GasBuddy’s real-time feed is the sole source. We are not naming stations, cities, or brands because that information is not in the sourcing, and we are not alleging any retailer chose the number on the display.
A Hardware Ceiling on the Display
The $9.999 figure is almost certainly a physical limit rather than a posted rate. The precedent is well known. During the 2008 oil spike, older mechanical pumps installed decades earlier could not show a price above $3.99 a gallon because their displays had a fixed number of digits. Retrofitting or replacing those units cost an estimated $10,000 to $15,000 per pump, a bill many small operators could not absorb. A ceiling at $9.999 today is the same category of constraint with one additional digit of headroom.
Record Prices Behind the Maxed-Out Pumps
Those five displays are the extreme edge of a genuine record. The U.S. Energy Information Administration put California’s average diesel price at $7.76 a gallon as of September 9, 55 cents higher than a week earlier and $2.81 higher than a year earlier. AAA’s figure for the same date was $7.87.
Nationally, diesel just set a fresh all-time high. The U.S. Energy Information Administration reported an average U.S. retail diesel price of $5.97, up 3.7 cents on the week and $1.97 higher than a year earlier, surpassing the U.S. Energy Information Administration’s previous record of $5.81 set in June 2022. AAA showed a record $5.94 on the same date.
A California Pattern in 2026
The state has produced outlier prints all year. In March 2026, a Chevron (NYSE:CVX) station in the remote desert stop of Fenner was reported charging $9.69 a gallon for regular gasoline. In early May 2026, a Downtown Los Angeles Chevron was reported at $8.29 for regular and $8.89 for diesel, with drivers describing fill-ups of $100 to $110. Those were separate earlier incidents at different stations preceding today’s report.
Regulators Are Already Watching
California’s Division of Petroleum Market Oversight, led by director Tai Milder, issued an enforcement bulletin and consumer advisory on March 19, 2026 and opened an investigation into outlier pricing in the Los Angeles and San Bernardino areas. The agency subpoenaed data from the state’s five major refiners under Senate Bill X1-2, the price-gouging law enacted in a 2023 special session. The probe is active and unresolved. No allegations have been proven.
Why Diesel, Why Now
The pressure is coming from several directions at once. The U.S. Department of Energy has said U.S. refineries are running at about 98% of capacity. Heavy Duty Trucking reports that since the U.S. attacked Iran in February, Iran’s control of the Strait of Hormuz has scrambled regional oil logistics. Heavy Duty Trucking also cites Ukrainian drone strikes cutting Russian refinery output and falling Chinese refiner output. Crude sits in the upper end of its recent band, with Heavy Duty Trucking placing prices between $90 and $100 per barrel.
Where the Cost Actually Lands
Diesel moves freight, tractors, and food. A record at the rack shows up in grocery aisles, restaurant menus, and the price of anything trucked across the country. Households already feel it: the national average for regular gasoline reached $4.157 a gallon the week of September 7, and the University of Michigan consumer sentiment index stood at 55.2 in July, still below the 60 threshold the survey associates with recessionary conditions. The maxed-out pumps GasBuddy is describing are the visible edge of a real crisis in the state with the country’s highest fuel prices, and the regulator with subpoena power is already inside the market.
The post “Maxed Out!” GasBuddy Says 5 California Gas Stations Hit $9.999 For A Gallon Of Diesel, The Highest Price Their Systems Allow appeared first on 24/7 Wall St..
]]>ExxonMobil (NYSE:XOM) stock is climbing Wednesday afternoon, extending a strong year for U.S. oil majors. ExxonMobil shares are up 3% in the current session to $164.83, carrying a 40% year-to-date gain. WTI crude oil has done much of the heavy lifting, and today it’s up 3.29% over the past 24 hours to $96.09 per barrel.
The question posed in the title is whether that momentum carries ExxonMobil stock to $200. That path exists, but it runs through crude prices rather than anything ExxonMobil directly controls.
Oil Prices and Refining Margins Do the Heavy Lifting
The rise of the WTI crude oil price reflects Middle East supply disruptions and tight product markets, and has a direct impact on energy majors’ financials. BP (NYSE:BP) reported a Q2 refining indicator margin of $29.6 per barrel versus $11.9 a year ago, a spread that flowed into downstream results across the group.
ExxonMobil’s Q2 2026 results delivered $14.5 billion in earnings, more than $17 billion of free cash flow, and a more than $7 billion reduction in net debt. Guyana production ran at roughly 900,000 barrels per day, and Permian output hit a record 1.8 million oil-equivalent barrels per day. The company’s cumulative structural cost savings reached $16.3 billion since 2019, part of a $20 billion target by 2030.
Sector Rally Left the Biggest Major Behind
Chevron (NYSE:CVX) stock has gained 44% year to date, outpacing ExxonMobil. Meanwhile, the Energy Select Sector SPDR ETF (NYSEARCA:XLE) has advanced 48% year to date to $65.39. ExxonMobil is the XLE ETF’s largest position at 22.7% of net assets, so the rest of the energy complex has run harder than the biggest U.S. major.
The European ADRs land lower on the leaderboard. Shell (NYSE:SHEL) stock has climbed 33% year to date. Additionally, BP stock has risen 35% year to date, leaving ExxonMobil ahead of both and confirming that the ranking depends entirely on the comparison chosen.
XOM Stock’s Path to $200

Getting ExxonMobil stock to $200 likely requires WTI crude oil to hold near its current levels and refining spreads to stay wide. With the oil price already up in recent sessions, the fade risk shouldn’t be overlooked.
ExxonMobil’s own contribution is real but incremental. Guyana is transitioning from investment recovery to free cash flow, with management guiding to twice the 2025 level by 2030. A 2026 buyback plan of $20 billion, with $4.9 billion already completed in Q1, provides a per-share tailwind even if crude softens.
What to Watch
The next WTI crude oil price move and any change in Middle East shipping conditions could matter just as much as the next ExxonMobil filing. Investors may want to keep an eye on whether the oil price holds above the mid-$90s into the fourth quarter, with refining cracks likely to stay wide as European capacity remains constrained.
The $200 level implied by the title is achievable, but it depends on macro conditions rather than company execution. Position sizing in ExxonMobil stock should reflect that this is a commodity-price story wrapped around a well-run operator, and their exposure should scale accordingly.
The post ExxonMobil Is Up 40% in 2026: Can Rising Oil Prices and Strong Earnings Boost XOM Stock to $200? appeared first on 24/7 Wall St..
]]>Chevron has ripped higher through 2026, and the rally has pushed shares within reach of a fresh record. The question I want to answer is whether the 24/7 Wall St. price target still sees room to run, or whether the market has already priced in the good news.
Chevron (NYSE:CVX) trades at $212.26, up 42.82% year to date and 36% over the past year. Our 24/7 Wall St. price target for Chevron is $204.67, implying downside of 3.81% over the next twelve months. Our recommendation is hold, with high model confidence of 90%.
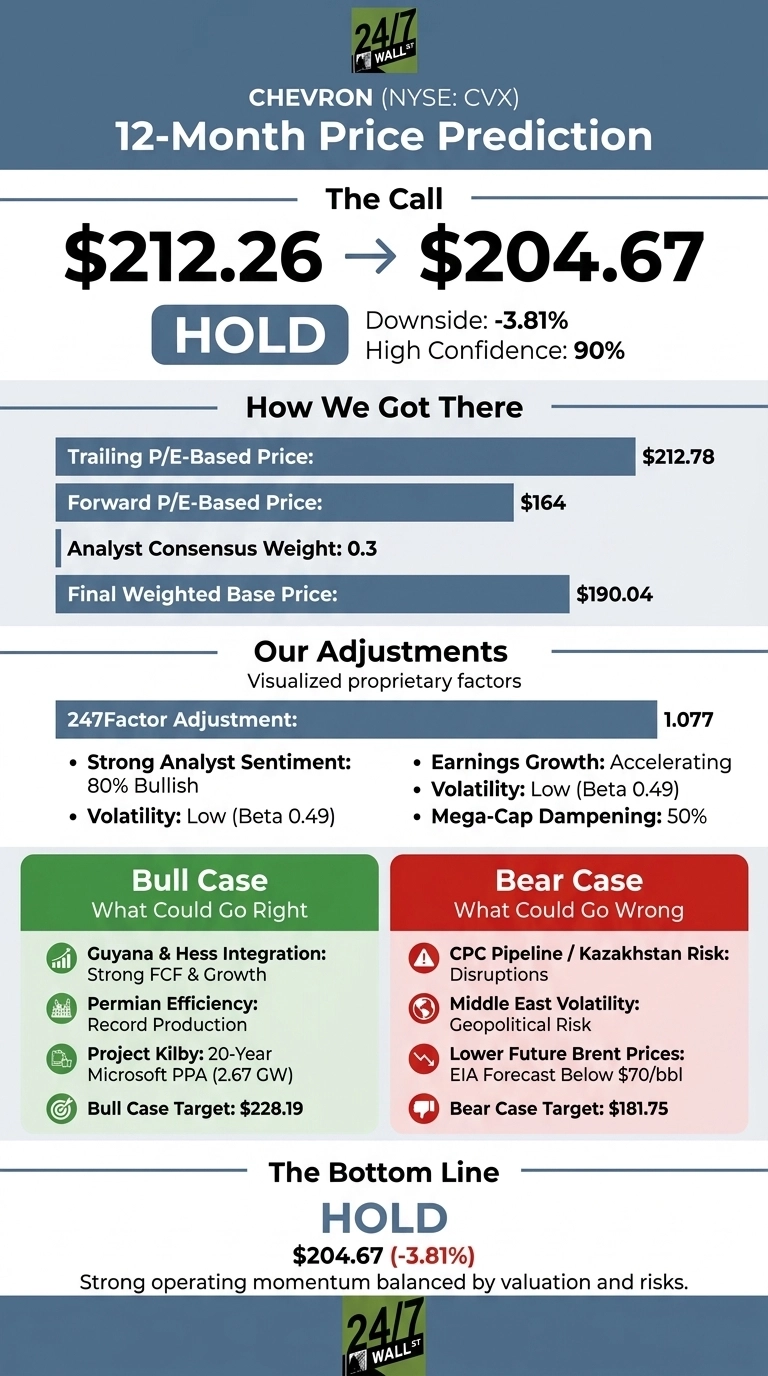
| Metric | Value |
|---|---|
| Current Price | $212.26 |
| 24/7 Wall St. Price Target | $204.67 |
| Upside/Downside | -3.81% |
| Recommendation | HOLD |
| Confidence Level | 90% |
Why We Could Be Wrong
Our 24/7 Wall St. price target sits just below where Chevron trades today.
Bull scenarios exist: the 20-year Microsoft (NASDAQ:MSFT) power purchase agreement covering 2.67 gigawatts at Project Kilby could unlock a new commodity-independent cash flow stream, and Brent staying elevated on Strait of Hormuz tightness could easily push earnings past current estimates. Consider the target one datapoint. A full bull case follows below.
A Rally Built on Real Numbers
Chevron is up 10.58% over the past month and 5.78% over the past week, brushing against a 52-week high of $212.79.
Q2 FY26 was the fuel: adjusted EPS of $6.06, revenue of $67.20B (+51.43% YoY), and worldwide production of 4,070 MBOED (+20% YoY), marking a seventh straight EPS beat. Chevron also cut total debt by $8.41B in the quarter. WTI has cooperated too, climbing to $91.48 on September 1 from the mid-$70s a month earlier.
Why Bulls See a Breakout Above $228
The bull case rests on four legs: Guyana, Permian efficiency, Kilby, and cash returns. Mike Wirth called Chevron’s opportunity set “the largest and highest quality opportunity set that we’ve had in years,” and the company delivered $15.4 billion in adjusted free cash flow in the quarter with net debt to CFFO of just 0.6 times.
Chevron captured 50% more Hess synergies than initially targeted and is targeting 2-3% annual production growth and 10%+ adjusted free cash flow growth through 2030.
Our bull-case one-year price is $228.19, and Wall Street’s consensus target sits at $218.29 with 20 buy or strong-buy ratings.
Risks Worth Watching Before Chasing the Rally
Chevron trades at a P/E of 34, well above peers, and the model’s bear case lands at $181.75. Brent averaging $104/BBL lifted Q2, but the EIA sees Brent below $70 per barrel in real 2025 dollars through 2030. CPC pipeline risk in Kazakhstan and Middle East volatility remain live.
A counterpoint: the elevated trailing P/E reflects prior-year charges rather than structural weakness, and Chevron already hit its $3B structural cost reduction run-rate six months ahead of schedule.
How Chevron Compares to Exxon and ConocoPhillips
Exxon Mobil (NYSE:XOM) is the natural integrated benchmark and trades at a P/E of 23 with a return on equity of 11.03%, versus Chevron’s ROE of 7.26%. Exxon’s $20 billion 2026 buyback and Guyana leadership justify a premium, and its cheaper multiple makes Chevron’s valuation look stretched.
ConocoPhillips (NYSE:COP) is the pure-play upstream counterpoint. COP delivered Q2 26 adjusted EPS of $3.24 on $19.16 billion in revenue (+37.07% YoY) and is targeting 45% of cash from operations returned to shareholders in 2026. Its capital-return intensity exceeds Chevron’s, reinforcing my view that CVX’s premium is fair rather than cheap.
| Company | P/E | Dividend Yield |
|---|---|---|
| Chevron | 34 | 3.07% |
| Exxon Mobil | 23 | 2.55% |
| ConocoPhillips | N/A | N/A |
Chevron Price Prediction 2026-2030
My verdict is hold, with 90% confidence and a 24/7 Wall St. price target of $204.67. The key factor tipping the scale: the stock is up more than 42% YTD and now sits at 52-week highs while forward multiples price in perfect execution.
The bullish setup strengthens if Brent holds above $95 and Project Kilby reaches final investment decision this year. The setup weakens if WTI slips back toward the July low of $69.60 or if CPC disruptions escalate.
Looking further out, here is where our model projects Chevron could trade, assuming current growth trajectories hold.
| Year | 24/7 Wall St. Price Target |
|---|---|
| 2026 | $204.67 |
| 2027 | $202.79 |
| 2028 | $204.09 |
| 2029 | $209.02 |
| 2030 | $214.57 |
These projections assume Chevron continues executing on Hess integration, Permian efficiency, and Project Kilby. Significant upside could come from sustained Brent above $100, while a demand slowdown could push shares toward the bear case of $184 by 2030.
The post Chevron Stock Is Near a Record High. Here’s Why the Rally May Not Be Over appeared first on 24/7 Wall St..
]]>Replacing a $95,000 salary with dividends is a capital problem before it is an investment problem. At a blended portfolio yield near 4%, you need about $2.4 million. At 5%, roughly $1.9 million. At 6%, closer to $1.6 million. The lineup below, built around VYM at 30%, CVX at 30%, and UTG at 40%, is designed to sit somewhere in that middle band while paying you monthly and quarterly in real cash.
Three-Holding Income Lineup: VYM, CVX, UTG
The conservative anchor is Vanguard High Dividend Yield ETF (NYSEARCA:VYM), a broad basket of large-cap dividend payers whose top exposures include Broadcom, JPMorgan Chase, Exxon Mobil, Johnson & Johnson, and AbbVie. VYM pays quarterly, with an annualized forward dividend of $3.92 per share against a recent price near $164. Typical distribution yield sits in the low-3% range.
The dividend-growth sleeve is Chevron (NYSE:CVX). The company just paid a $1.78 quarterly dividend, up from $1.71 in 2025 and $1.63 in 2024. Trailing yield sits near 3.1%, supported by $18.10 billion of free cash flow in Q2 FY26 and a 20-year West Texas power purchase agreement with Microsoft.
The income engine is Reaves Utility Income Fund (NYSE:UTG), a closed-end fund that pays monthly. Its monthly distribution recently increased to $0.21 from $0.20, giving an annualized forward of $2.52 per share at a price near $38. That places UTG’s headline yield in the mid-to-high single digits, well above the two equity holdings.
Why a Rising Chevron Makes Your Plan More Expensive
Chevron is up 41% year-to-date and 37% over the past year, with news of a $7 billion Venezuela expansion plan pushing shares toward record highs. That is good if you already own it. It is bad if you are still buying, because yield is the dividend divided by the price. As CVX climbs, its yield compresses, which drags the blended portfolio yield lower and raises the capital you need to hit $95,000. A stock going up makes an income plan more expensive, which is counterintuitive, and it is exactly why the entry price matters as much as security selection.
UTG Is Doing the Heavy Lifting. Read the Fine Print.
The utility fund UTG is a closed-end fund, which means it trades at a market price that can drift above or below the actual value of its underlying holdings. Buying when it trades at a premium is a permanent headwind, while buying at a discount gives you a lasting advantage. Make it a point to check that before you buy.
Closed-end funds often use leverage to boost their distributions. That borrowed money lifts income when markets are strong but magnifies losses when they turn, and it makes the fund more sensitive to interest rates than an unlevered utility ETF. UTG’s distributions can also include a return of capital, which lowers your cost basis rather than paying you out of actual earnings. Pull the fund’s Section 19 notices and verify the composition.
Then there is the concentration issue. This lineup is 30% energy and 40% utilities. You are making a focused bet on regulated power, infrastructure, and integrated oil, with VYM providing the only real spread across financials, health care, and consumer staples.
Tax Layer Most Pre-Retirees Underweight
VYM and CVX distributions are generally qualified dividends, taxed at long-term capital gains rates (0%, 15%, or 20% federal, depending on bracket). UTG’s distributions vary in character: portions may be qualified, ordinary, or a return of capital. Two portfolios paying identical headline yields can leave you with very different after-tax income.
Account location changes the answer materially. In a Roth or traditional IRA, character does not matter; in a taxable brokerage, it dictates how much capital you actually need to net $95,000. Model both.
What You Are Really Signing Up For
To replace a $95,000 salary with this lineup, plan on somewhere in the neighborhood of $1.6 to $2.0 million invested, depending on where blended yield lands the day you build the position. If you want the full mix, payment calendar, and withdrawal order for turning a lump sum into monthly income, we laid the whole method out in a free guide. A few actions before you commit capital:
- Target your spending rather than your gross salary. Payroll taxes and retirement contributions are gone in retirement, so the target income is usually lower than the paycheck.
- Check UTG’s premium or discount to net asset value on the day you buy, and review the most recent Section 19 notice for return-of-capital content.
- Stress-test the plan for a Chevron dividend cut and a UTG distribution reduction at the same time, and confirm the surviving income still covers essential expenses. Dividend streams can fluctuate, and inflation over a 30-year retirement will erode any fixed stream that does not grow.
The post How Much Do You Really Need Invested to Replace a $95,000 Salary With Dividends? appeared first on 24/7 Wall St..
]]>Chevron (NYSE:CVX) shareholders are set to collect another $1.78 per share quarterly payment on September 10, 2026, extending a streak most oil majors envy. The check is the third at the current rate, which reflects a 4% raise announced at the start of 2026, marking the 39th consecutive annual increase. With shares at $212.21 and up 42.32% year to date, the current yield sits at roughly 3.08%.
For a commodity-linked payer, the check looks easy with Brent at $104. The real question is what happens when crude rolls over. That answer is where Chevron earns its scorecard.
Dividend Scorecard: A Grade, With an Asterisk
Q2 2026 delivered adjusted EPS of $6.06 on revenue of $67.20 billion, up 51.43% year-over-year. Free cash flow hit $18.095 billion against a quarterly dividend outlay near $3.504 billion. Full-year 2025 produced $33.94 billion in operating cash flow versus $12.75 billion in dividend payout. Balance sheet: net debt to cash flow from operations of 0.6 times after more than $8 billion in debt reduction last quarter.
FY2025 EPS came in at $6.63 while the annualized forward dividend runs $7.12. On trailing earnings, that reads over 100%. On free cash flow, it clears comfortably. Grade: A minus. Elite streak, elite coverage in a good tape, but the ratio compresses fast when crude cracks.
2020 Stress Test You Should Actually Care About
When WTI collapsed to $36.97 in November 2020, Chevron generated only $10.6 billion of operating cash flow for the full year and paid out $9.7 billion in dividends. Q2 2020 operating cash flow was just $80 million against a $2.394 billion dividend. Chevron leaned on the balance sheet, protected the payment, and kept the streak alive. That is the resilience the current management team is being paid to replicate.
What Actually Changes the Math This Cycle
The Hess integration delivered $1.5 billion in synergies six months ahead of schedule, and management called Hess free cash flow “roughly double the incremental dividends”. Also, Project Kilby, a 20-year take-or-pay power purchase agreement with Microsoft covering 2.67 gigawatts, is designed to throw off “long duration contracted cash flows that are independent of commodity price cycles.”
Mike Wirth summarized the philosophy plainly: “We’ll always focus on value over growth.” For dividend investors, the read is straightforward. The payment is safer than the ratio suggests, but only because Chevron has, again and again, chosen the check over almost everything else. Streaks like this one are the whole reason we built a free Dividend Kings screen ranking the longest-running raisers by valuation today.
The post Chevron’s Dividend Looks Great at $104 Oil—What Happens When Oil Falls? appeared first on 24/7 Wall St..
]]>Although Chevron (NYSE:CVX) shares have climbed to a 52-week high on the back of a $7 billion Venezuela expansion, to above $214 per share, Wall Street’s memory tends to be shorter than the deals it finances. The stock closed at $211.78, up 38.8% year to date, and traders appear to be treating its Venezuela Orinoco Belt agreement as a straightforward production add.
But Bloomberg Economics’ Chris Kennedy went on air September 2 and framed the arrangement in language that should give any long-term holder pause. Kennedy said “this was all about oil,” comparing the U.S. and Venezuela structure to the 1953 US-backed coup against Iran’s democratically elected Mohammad Mosaddegh, which reversed his nationalization of the Anglo-Iranian Oil Company, later BP.
The parallel is uncomfortably clean. As Kennedy described it during the Bloomberg Businessweek segment, the current arrangement involves a Pentagon equity stake in a private company granted a 100-year lease to develop nearly 17 strategic oil fields. The U.S. also receives the right to purchase 20% of the joint venture’s production at cost, below market price. Chevron CEO Mike Wirth has called it the largest financial commitment from a major oil company since Nicolás Maduro’s ouster and said the development is expected to double Chevron’s operations in the country. Marketplace’s Kimberly Adams reported that the plan targets roughly 600,000 barrels a day within five years.
What 1953 Actually Bought, and What It Cost
Operation Ajax worked, at first. The 1953 coup restored the Shah, reversed Mosaddegh’s nationalization, and gave Western majors decades of favorable Iranian crude. For 25 years the arrangement looked like a geopolitical bargain. Then 1979 arrived. The Islamic Revolution swept out the Shah, renationalized Iranian oil, and expropriated Western assets. Anti-American sentiment cemented into state policy, and the U.S. lost one of its largest imported-crude suppliers almost overnight. The lesson Wall Street has never fully absorbed is that oil concessions tied to unpopular regimes tend to expire when the regime does, not when the lease says they do.
Bloomberg’s Kennedy’s warning tracks that history closely. He argued the Venezuela structure “could rekindle nationalist and anti-American sentiment” and called a democratic transition in Caracas “a matter of when, not if.” A 100-year lease is a long time to bet against that pattern.
Why the Market Is Ignoring the Precedent
The market has plenty of reasons to focus on the immediate payoff. CVX has climbed 42.82% year to date, 36% over one year, and 165.4% over five years amid extraordinary near-term fundamentals. Chevron’s Q2 2026 report, filed July 31, 2026, showed adjusted EPS of $6.06, revenue of $67.20 billion (+51.4% YoY), and net income of $12.07 billion (+384.8% YoY).
Free cash flow hit $18.10 billion, an increase of 272%. Worldwide production reached 4.07 million barrels of oil equivalent per day, while U.S. upstream production set a record at 2.08 million barrels of oil equivalent per day. Brent averaged $104 per barrel, versus $68 a year earlier, and WTI stood at $91.48 per barrel on September 1.
Chevron has also put its cash to work aggressively: $3.117 billion in buybacks in Q2 2026, a 39th consecutive annual dividend increase (the kind of multi-decade streak we screened for in our free Dividend Kings guide, here), and $8.41 billion in debt reduction inside the quarter. The Hess acquisition, closed in 2025, is producing $1.5 billion in synergies within one year of closing. Nothing in that scorecard reads like a company priced for expropriation risk. You can see the Q2 disclosure directly in the company’s SEC filing.
Valuation Gut Check Meets Political Half-Life
Here, the historical mirror becomes sharper. Chevron trades at a P/E of 28.9, a P/FCF of 25, and a free cash flow yield of 3.99%, with a market cap of $414.9 billion. Integrated majors historically trade closer to the low-teens on earnings during comparable oil-price regimes.
Investors are paying a premium multiple for a company whose largest new development sits under a lease that, if the Iran comparison holds, has a shelf life measured by the political durability of the counterparty. Chris Kennedy noted Venezuela currently averages 1.1 million barrels per day, well below its peak of 3.5 million barrels from nearly three decades ago. The upside case requires the current arrangement to last.
Markers to Watch as the 100-Year Lease Ages
Three signals will show how much weight that century-long promise can bear. First, whether Caracas ratifies the lease through any body a successor government would recognize as legitimate. Second, whether the 20%-at-cost offtake clause survives scrutiny inside Venezuela, where subsidized exports to the U.S. read very differently on Caracas television than on a Bloomberg terminal. Third, whether Chevron’s next 10-Q quantifies the Venezuela commitment as a discrete asset, which would let analysts model an impairment scenario. The Q2 filing already flags “geopolitical uncertainty in Venezuela operations” as a named risk.
Over the long term, the benchmark S&P 500 has absorbed oil-sector expropriations before and headed higher in the decades that followed, and Chevron’s record on dividends, buybacks, and structural cost reductions is genuinely elite. The open question for CVX shareholders paying a 52-week-high price is whether they are being compensated for a risk the 1953 Iran playbook says typically arrives on someone else’s schedule.
The post Bloomberg Economist: ‘This Was All About Oil’ and Compares Chevron’s Venezuela Deal to 1953 Iran Coup appeared first on 24/7 Wall St..
]]>Venezuela reportedly lays claim to over 300 billion barrels of proven oil reserves, and the U.S. has set its sights on more of them.
Bloomberg News correspondent Tyler Kendall reported from Caracas this week that the headline prize of Washington’s Venezuela deal, a 100-year lease on 17 strategic oil fields holding a claimed 65 billion barrels, went to a private, non-supermajor bidder: North American Blue Energy Partners, a private company that cannot develop the fields alone and has yet to sign on producing partners. Meanwhile, Chevron (NYSE:CVX) stock just printed a fresh 52-week high at $212.79 on a separate, parallel Venezuela commitment. The two developments deserve to be evaluated separately.
What Washington Actually Signed
Kendall’s on-the-ground reporting laid out the mechanics. The US government is taking an equity stake in the private joint venture and securing the right to purchase 20% of the offtake at cost, below market, through a swap mechanism designed to help refill the Strategic Petroleum Reserve. US Energy Secretary Chris Wright told Bloomberg that Venezuelan production, already up 25%, with exports up 50%, could double by the end of this decade from the current 1.1 million barrels per day; that output is still far below the 3.5 million peak from nearly three decades ago.
The catch is that North American Blue Energy Partners cannot develop the 17 fields alone. It must bring in other producers, including some fields previously operated by Russian, Chinese, or smaller local companies. Constitutional questions surrounding Venezuela’s competitive-bidding requirements remain unresolved, although the State Department says the deal was fully vetted.
Chevron’s Separate Lane
Chevron is executing a distinct, older track, separate from the 65-billion-barrel lease. On the Q2 2026 call, CEO Mike Wirth described Venezuela as one of Chevron’s “special situations,” revealing, “We’re in negotiations right now to try to improve the fiscal terms and enable more investment in Venezuela.”
Management also said the company operates three Venezuelan joint ventures and has bolstered production from those agreements from 40,000 to 250,000 barrels per day, with full debt recovery expected by early 2027. Chevron’s Q1 2026 growth-initiative slate specifically listed an agreement to expand its heavy oil interest in Petroindependencia and develop the adjacent Ayacucho 8 area, alongside its long-running Petropiar operations with PDVSA.
Wirth’s framing in the Q4 2025 8-K: “We have been a part of Venezuela’s past for more than a century. We remain committed to its present.” That century of ground presence is what separates Chevron’s exposure from the newer, splashier lease.
Economist Parallel Investors Should Weigh
Not everyone is convinced. Bloomberg Economics’ Chris Kennedy compared the deal structure to the 1953 US-backed coup in Iran, warning it could rekindle nationalist and anti-American sentiment and affirming the view that “this was all about oil.” Iran’s oil was nationalized in 1979. Kennedy called a democratic transition in Venezuela “a matter of when, not if,” raising real questions about the durability of a 100-year lease under a future elected government. Wirth has emphasized contractual protections including dispute resolution and tax and royalty regime guarantees, though those provisions face a hostile-precedent problem.
What The Market Is Actually Pricing
CVX is up 39.5% year to date and 35% over one year, backed by tangible Q2 2026 numbers: adjusted EPS of 6.06, revenue of $67.2 billion up 51.43% year over year, and free cash flow of $18.1 billion. The stock trades at a forward P/E of 15 with a 3.4% dividend yield backed by 39 consecutive annual increases.
Hess synergies, Permian scale, Guyana’s Stabroek block, and a 20-year Microsoft (NASDAQ:MSFT) power purchase agreement for 2.67 GW in West Texas are doing the heavy lifting. Venezuela is optionality on top of the core thesis. Investors pricing the 52-week high should separate the 65-billion-barrel headline from what Chevron actually holds itself.
The post Who Really Got Rights to Venezuela’s 65 Billion Barrels Of Oil Prize? appeared first on 24/7 Wall St..
]]>Dividend Aristocrats get lumped together as if they are one defensive blob of consumer staples names, but the label actually spans wildly different business models. The three companies below sit in payroll processing, supplemental insurance and integrated energy, and each has stacked annual dividend increases well past the 25-year bar the headline demands.
The CEO of Aflac (NYSE:AFL) explicitly cited “43 consecutive years of dividend increases” on the company’s Q2 2026 call, and the payment histories for the other two on this list reach back to 1999 with step-ups nearly every year since.
That is the point: Aristocrat status is a discipline that cuts across sectors.
Automatic Data Processing: Payroll’s Compounding Machine
Automatic Data Processing (NASDAQ:ADP) currently yields 2.42% at a share price of $281.16. The forward annualized dividend sits at $6.80 after the quarterly rate stepped up from $1.54 to $1.70 earlier this year. The dividend history file shows a clean progression of annual increases in the regular quarterly rate from $0.07625 in 1999 to $1.70 in 2026, which comfortably clears the 25-year threshold.
Coverage is the reason income investors keep buying it. FY2026 diluted EPS came in at $11.04 against a $6.64 trailing dividend, and operating cash flow was $5.44 billion against just $196.6 million of capex. The balance sheet is investment-grade quiet, return on equity runs at 72.2%, and management funds buybacks on top of the dividend. CFO Peter Hadley described capital return this way: “this deliberate return of capital to shareholders comes in addition to our longstanding commitment to growing our dividend and to the levels of investment that we are making in our business.”
The bull case: Boring in the best way. ADP is guiding FY2027 to 5% to 6% revenue growth and 9% to 11% adjusted EPS growth, with client retention already at 92.1% and Retirement Services crossing $1 billion in annual revenue for the first time. That is the profile of a compounder that funds larger dividends year after year.
The risk: valuation. At 26 times trailing earnings and 23 times forward, ADP is priced as a premium compounder, and any slip in bookings growth or margin cadence would compress the multiple faster than the dividend can grow.
Aflac: Supplemental Insurance With a 43-Year Increase Streak
Aflac trades at $117.24 and yields 2.08% on a quarterly dividend of 61 cents, with an annualized forward rate of $2.44. The recent step-up from 58 cents to 61 cents per quarter is the increase that extends the record in 2026. CEO Dan Amos was direct on the Q2 call: “We treasure our 43 consecutive years of dividend increases and remain committed to extending this record in 2026.”
Dividend safety here starts with capital. TTM diluted EPS is $9.27 against a $2.38 dividend per share, so payout coverage is roughly a quarter of earnings. Aflac Japan reported a pre-tax margin of 34.3% in the quarter, holding-company unencumbered liquidity was $3.3 billion, adjusted leverage stayed 21.8% within the 20 to 25% target, and regulatory capital was an estimated ESR of 226% in Japan and combined RBC slightly above 600%. That is a capital fortress by any insurance standard.
The bull case: Aflac converts capital strength into steady buybacks and dividend hikes. CFO Max Broden confirmed “we’ve repurchased $983 million of our own stock and paid dividends of $309 million in Q2.” Combined shareholder returns reached $1.3 billion in the second quarter and $2.6 billion for the first six months. Adjusted ROE ex-currency was 16.6%, and dental and vision inside the US group business grew 47% in the second quarter.
The risk: The yen. Aflac’s largest earnings engine reports in yen, so a stronger dollar directly compresses reported revenue and EPS, and US group disability claims have been running hotter than plan, pressuring the segment’s margin.
Chevron: Integrated Energy With the Highest Yield in the Bundle
Chevron (NYSE:CVX) is the higher-yielding piece of this trio at 3.36%, with a quarterly dividend of $1.78 (annualized forward $7.12) and shares at $211.78. The payment history shows a clear climb in the quarterly rate from 65 cents in 2000 to $1.78 in 2026, with successive annual step-ups more than sufficient to clear the 25-year bar.
Coverage in the current cycle looks excellent. Q2 2026 delivered adjusted earnings of $12 billion, or $6.06 per share, with adjusted free cash flow of $15.4 billion and cash flow from operations excluding working capital of nearly $20 billion. Chevron reduced debt by more than $8 billion in the quarter, taking net debt to CFFO to 0.6x. Interest coverage on the trailing basis is 13.7x, and structural cost cuts hit $3 billion of annual run-rate savings, achieved six months early.
The bull case: Chevron has bolted contracted cash flow onto its commodity base. Project Kilby is a 20-year take-or-pay power purchase agreement with Microsoft for 2.67 gigawatts of firm behind-the-meter capacity, and management describes it as delivering “mid-teens returns and long duration contracted cash flows that are independent of commodity price cycles.” Wirth added: “Consistent with our longstanding financial priorities, we intend to reward our shareholders today tomorrow and long into the future.” Chevron has now returned more than $5 billion to shareholders for 16 consecutive quarters.
The risk: Commodity cycles. This is where CVX diverges sharply from ADP and AFL. Chevron’s cash flow rides Brent, and the EIA’s May 2026 Short-Term Energy Outlook shows OPEC surplus capacity and non-OPEC supply growth that can cap prices even as demand climbs. Management set 2030 targets “at flat commodity prices that are lower than today,” which acknowledges that softer oil prices would slow buybacks before slowing the dividend.
3 Streaks, 3 Different Cash Engines
The Dividend Aristocrat badge means the same thing at all three companies: management has raised the dividend every year for at least 25 years and treats that record as untouchable. What backs the checks is completely different. ADP compounds off recurring payroll fees and 92%+ client retention. Aflac funds the payout with a fortress-capital insurance book and yen-denominated earnings. Chevron underwrites the highest yield in the bundle with integrated oil cash flow, now supplemented by contracted cash flows independent of commodity price cycles.
Owning all three is how an income portfolio gets diversification inside the Aristocrat label rather than three flavors of the same defensive name (for readers who want to push the streak even further, we ranked ten companies with 50-plus years of consecutive raises by valuation in a free Dividend Kings report).
The post 3 of Wall Street’s Safest High-Yield Dividend Stocks With Over 25-Year Increase Streaks appeared first on 24/7 Wall St..
]]>CNBC’s Becky Quick reported on Wednesday, September 2, that Chevron (NYSE:CVX) is expanding its position in Venezuela through joint ventures, with the deal landing within days of the U.S.-Venezuela reserve arrangement that Washington disclosed last week.
According to Quick, “[Chevron is] saying that it is expanding its position in Venezuela with joint ventures. As part of the agreements, it will gain existing acreage where it’s established a position.” She added: “Its joint venture will invest more than $7 billion over the next five years, and it plans to double production to approximately 600,000 barrels a day.“
This investment plan targets production over a five-year horizon. Announced targets remain subject to execution risk, political developments, and the physical realities of restarting output in a country whose oil sector has been effectively closed to Western majors.
Chevron Is Moving Faster Than One Former Executive Expected
On August 28, former Chevron Africa and Latin America president Ali Moshiri argued that Venezuelan oil is a good solution for American energy security because it avoids the Strait of Hormuz, the Red Sea, and the Black Sea chokepoints. He advocated for public-private partnership because heavy and extra-heavy crude requires specialized technology the country lost after 15 years outside global markets.
Moshiri predicted the majors would move slowly on entry protocols while smaller and midsize firms moved faster. A more than $7 billion commitment from a supermajor within days of the reserve announcement cuts against that timeline.
On August 31, CNBC’s Brian Sullivan reported that Venezuelan national production has fallen from roughly 3.2 million barrels per day in 1997 to about 1.2 million today, said infrastructure is dilapidated, and cautioned that meaningful extraction is years away. Sullivan also flagged that majors would likely demand multi-year security guarantees before committing billions.
Chevron Is the First Major to Put Real Money Behind the Venezuela Deal

On August 28, President Trump announced a reported deal involving a 25-year lease of 65 billion barrels of proven reserves, with the U.S. controlling 55% and reportedly $100 billion-plus in U.S. energy company investment, with Chevron, Exxon and ConocoPhillips named as prospective participants. Sullivan noted the physical and legal structure was still unknown. Chevron’s announcement today is the first concrete corporate commitment towards that $100 billion number.
Venezuela is familiar territory for Chevron.
In the Q4 2025 earnings release, CEO Mike Wirth said Chevron had “been a part of Venezuela’s past for more than a century” and stood ready to help the country “build a better future while strengthening U.S. energy and regional security.”
Key Takeaways
Chevron’s $7 billion commitment gives Venezuela’s oil reopening its first major corporate backing. But doubling production will require much more than capital, with deteriorated infrastructure, security guarantees and execution risk standing between today’s announcement and 600,000 barrels per day.
The post Chevron Commits $7 Billion to Venezuela to Double Production to 600,000 Barrels a Day appeared first on 24/7 Wall St..
]]>BlackRock (NYSE:BLK) Investment Institute strategist Ben Powell discussed in a Bloomberg interview on September 2 that he sees a major shift underway in Gulf spending as more of the Middle East’s oil wealth is expected to continue to be invested domestically.
Powell’s argument is that the marginal dollar of Gulf Cooperation Council surplus will increasingly stay inside the region rather than being recycled into global equities, Treasuries and trophy real estate.
A $2.1 Trillion Signal: Why More Gulf Money Is Being Invested Domestically
Ben Powell told Bloomberg, “We’re gonna see upwards of $2 trillion US dollars of strategic capex here in the GCC over the next several years. And I think the change, the marginal change, is gonna be more of the money is gonna stay here in the GCC.”
Powell’s main point is that sovereign wealth funds, including PIF, Saudi Arabia’s sovereign wealth fund, have already been pivoting more domestically in recent years, and the current conflict has sharpened that trend. In Powell’s view, “It’s an accelerant to, obviously, the preexisting plans for diversification. Oil and gas is still very important. That’s not gonna change. It’s a significant generator of cash, and that’s great. But at the margin, the urgency of deploying that cash into societal and economic diversification, which was already there, I think the urgency is even greater.”
Basically, if the rest of the world beefs up its energy independence, that could hurt the Gulf’s exports over the long term and increase the importance of the Middle East investing in domestic industries outside of oil and gas.
AI, Energy and Defense Are Becoming One Investment Theme
Powell’s second idea is that energy and defense will need investment alongside data centers. Powell said, “Data centers need defense. They need energy. So clearly there are distinctions, but there is an overlap. And I think it’s hard in this very complicated world to neatly parse security from the economy, from AI. They all kind of overlap.”
AI infrastructure increasingly overlaps with energy and national security. Data centers need enormous amounts of power, while the Pentagon is spending more on AI, microelectronics and advanced energy technologies. The GAO estimates data centers could account for up to 12% of U.S. electricity demand by 2028, while the Pentagon’s FY 2027 science and technology budget request is nearly 26% higher than the prior request.
Global Chokepoints Are Accelerating the Push for Self-Reliance
Powell talked about how the Strait of Hormuz and other conflicts have highlighted the importance of domestic investment: “We can rely less, sadly, on these strategic chokepoints. We can rely less on global trading partners, so we’re gonna have to do more here at home in the region. The good news is we’ve got the funding. We’ve got the talent. We’ve got the energy to do that.”
The same morning, Treasury Secretary Scott Bessent told the G20 that the Strait of Hormuz will be “a worthless piece of water” in two years as oil moves to land pipelines, and Bloomberg’s Jon Herskovitz reported that Iran has signaled it may target energy infrastructure in neighboring countries.
Reuters this week has separately cataloged Gulf pipeline and port investment spurred by the Iran war. On August 28, former Chevron (NYSE:CVX) Latin America president Ali Moshiri argued for tying U.S. energy security to its Western Hemisphere energy supply, so the U.S. could avoid chokepoints like Hormuz, the Red Sea and the Black Sea.
Key Takeaways
Ben Powell closed by saying, “We’re gonna see more partnership between government driving societal goals and capital markets, because simply put, capital markets is where the money is. So we’re seeing a need for more funding, be that in old-fashioned infrastructure, schools, hospitals, and roads, or all the new fun stuff around AI.”
Powell’s thesis is that Gulf capital is becoming more domestic, strategic, and interconnected across AI, energy, and defense. If that shift continues, the $2.1 trillion buildout could reshape global capital flows as well.
The post BlackRock Says $2.1 Trillion Gulf Spending Boom Could Reshape Global Capital Flows appeared first on 24/7 Wall St..
]]>Treasury Secretary Scott Bessent, speaking at the G20 finance chiefs meeting, offered a two-year forecast in which he predicted the Strait of Hormuz would stop mattering to global oil. Meanwhile, Bloomberg’s Jon Herskovitz described how a fresh round of U.S.-Iran strikes is happening now.
Bessent Says Pipelines Will Make Hormuz “Worthless” in 2 Years
Bessent had an optimistic forecast for oil over the medium-term: “In two years, the Strait of Hormuz will be, like, a worthless piece of water, as the oil will be going on pipelines across land,” he said. He explained that the current disruption hurts other countries far more than it hurts the U.S.: “It’s not a choke point for the US, but it is a choke point for many, many other countries.”
Land pipeline capacity at the scale required to remove Hormuz from the global oil map demands construction, financing, host-country agreements, and physical security. Pipeline projects of that scale rarely are completely built on a two-year timeline, and the segment offered no detail on routes, capital sources, or throughput.
Recently, CNBC’s Brian Sullivan detailed why the announced Venezuela arrangement will likely not relieve near-term supply, citing production that has fallen from roughly 3.2 million barrels per day in 1997 to about 1.2 million with dilapidated infrastructure. Energy security proposals keep hitting the same timeline problem.
Hormuz Matters Far More to Asia Than the United States
The United States is a net exporter of crude and refined products, and its marginal barrels do not transit through Hormuz. For allied economies in Asia and parts of Europe, the Strait remains central for their oil imports. The Strait of Hormuz has more drastic consequences for oil importers, which is why global oil markets and allied economies absorb the risk even when U.S. domestic supply does not.
That framing echoes remarks from former Chevron (NYSE:CVX) Latin America president Ali Moshiri on August 28, who argued U.S. energy security depends on sources avoiding Hormuz, Red Sea, and Black Sea chokepoints, with Western Hemisphere supply from Brazil, Venezuela, and Argentina as the answer.
Iran Is Threatening Energy Infrastructure Beyond Hormuz
Against that two-year horizon, Herskovitz described events on a compressed timeline. “The US has escalated its round of strikes. The first strikes, which got it started, were at two launchers, artillery rocket launchers, which were suspected of being able to place mines in Hormuz. The latest attacks were broader,” he said.
“Iran has changed its strategy. It said that it’s looking to a longer-range battle where it can go after its neighbors in the region. If Iran sees its infrastructure attacked, it’s looking to go after infrastructure in the region of its neighbors, energy infrastructure, which could damage the economies of these regions and also really affect global oil supplies,” Herskovitz said. Attacks on neighboring energy infrastructure would move supply regardless of the Strait’s status.
Oil Is Back Near $90 as the Conflict Escalates
WTI opened at over $90 per barrel on September 2, down nearly 10% from a month earlier but well above the $55.44 low from December 16, 2025. U.S. regular gasoline sat at $4.07 per gallon on August 31, 2026. Overnight, CNBC reported Iran said two tankers hit Hormuz naval mines while it attacked regional targets in retaliation.
Key Takeaways
Bessent may ultimately be right that pipelines and alternative supply routes will reduce the world’s dependence on Hormuz. But with U.S.-Iran strikes escalating, regional energy assets under threat, and crude back around $90 per barrel, the oil market’s immediate problem remains the conflict happening today.
The post Strait of Hormuz Will Be a “Worthless Piece of Water” in Two Years. Why Oil Just Crossed $90/Barrel Anways appeared first on 24/7 Wall St..
]]>Jim Cramer opened Squawk on the Street on the first trading day of September with a market backdrop he described in blunt terms. Two ships had been fired on in the Strait of Hormuz, Treasury yields were pushing higher across the curve, and diesel prices were climbing amid a supply picture already strained by Ukrainian strikes on Russian refining capacity and U.S. refiners operating near full utilization. Cramer called the combination “unholy” and said the AI trade had gone nowhere for about a year. Then he offered a single actionable idea.
“Chevron over 200 is just it’s a steal here david,” he told David Faber, framing it around a distinction worth holding onto: “We are in a situation where the prism is negative, the noise is negative, the signal is positive.” That is the analytical spine of this piece. The question for an investor is whether Chevron (NYSE:CVX) deserves a bid because refining margins are widening on a disruption, or because the underlying business generates cash regardless of where crude settles next week.
What Actually Happened at Chevron Last Quarter
Chevron’s Q2 earnings report was the strongest the company has delivered in years. Adjusted EPS came in at $6.06 on revenue of $67.20 billion, with net income up 384.82% year over year and free cash flow of $18.095 billion. Worldwide production climbed 20% year over year to 4,070 MBOED.
Downstream is where the disruption thesis intersects the fundamentals. U.S. refinery utilization hit 97%, and downstream earnings jumped to $4.87 billion from $737 million a year earlier. Chevron booked $1.4 billion in favorable timing effects and cut total debt by $8.41 billion in the quarter alone.
The Hess integration is running ahead of plan. Management reached its $3 billion structural cost reduction target six months ahead of schedule and captured $1.5 billion in Hess-related synergies, roughly 50% above the initial target. CFO Eimear Bonner said the savings are durable because they are “built into the business.”
Mike Wirth’s read on refining aligns with what Faber flagged on air. He said “Products are tighter than crude around the world, and that’s why cracks have widened out,” and expected “upward pressure on product pricing here into the third quarter and perhaps beyond that.” Full detail sits in Chevron’s 8-K filing with the SEC.
The 20-year, 2.67-gigawatt power purchase agreement with Microsoft (NASDAQ:MSFT) for a West Texas data center reframes Chevron as more than a pure crude call, because contracted power cash flows are insulated from Brent curve swings.
Where the Disruption Case Gets Uncomfortable
Cramer’s positive signal rests partly on refined-product tightness that could reverse quickly. WTI has been swinging hard: from $114.58 on April 7 to $83.90 on August 25, down 8.5% in a month. Geopolitical crack spreads unwind the moment shipping lanes clear.
September seasonality is real but overrated as a standalone reason to avoid energy. Refinery turnaround season can tighten distillate further, and EIA data show refinery utilization near 0.92-0.95 in recent months, leaving little slack.
The stock has already moved. CVX is up 42.32% year-to-date and 8.15% over the past month, closing at $211.05. Buying above $200 means paying up for a quarter that has already been rewarded.
The dividend is what makes the wait tolerable. The next payment is $1.78 on September 10, with an annualized forward of $7.12. Chevron has raised the quarterly payout every year since 2024.
Cramer’s own hedge, that “the AI trade… has not been a good one for quite some time”, is why an integrated major with a Microsoft power contract is a rotation candidate rather than a defensive parking spot.
Is CVX Stock a Buy?
Chevron trades at a market cap of around $414 billion with a P/E near 34x, richer than Exxon Mobil (NYSE:XOM), which trades at a P/E of roughly 23x and a market cap of $676.62 billion. Exxon’s Guyana ramp and 43 consecutive years of dividend growth arguably make it the cleaner compounder.
ConocoPhillips (NYSE:COP) is the higher-beta upstream play, up 48.63% YTD, targeting a $7 billion free cash flow inflection by 2029. It offers more torque to crude and less downstream ballast.
Shell (NYSE:SHEL) missed Q2 EPS badly at $1.92 due to Qatar disruption, even as refinery utilization ran at 102%. Its LNG optionality is real; its earnings volatility is, too.
Chevron sits in the middle: less commodity-beta than Conoco, richer than Exxon, and more integrated than Shell right now. The Hess synergies, contracted Microsoft cash flows, and cost program give it a signal that outlasts any tanker headline. Cramer’s framing that the noise is negative and the signal positive holds up under scrutiny, but the entry price matters and CVX has already run hard.
The setup looks constructive, with the understanding that the near-term catalyst is disruption-driven and the long-term case rests on Hess, cost discipline, and power. Those seeking pure crude beta may find more torque in Conoco.
The post Cramer Called the September Open Unholy and Then Named the One Stock He Would Still Buy appeared first on 24/7 Wall St..
]]>Jim Cramer likes what he sees in Chevron (NYSE:CVX). The stock closed at $211.05 on September 1, a fresh 52-week high, and is up 42.32% year to date. On Tuesday morning, CEO Mike Wirth walked onto CNBC’s Squawk Box and gave shareholders a fresh reason to cheer: a headline Venezuela expansion. Cramer’s endorsement of the stock, however, sits next to a very specific question, one the same broadcast raised within minutes. Can Venezuela actually double its output on Chevron’s schedule?
What Chevron Just Told the Market
Chevron said its Venezuelan joint venture will invest more than $7 billion over the next five years, with plans to roughly double production to about 600,000 barrels a day. The joint venture will pick up existing acreage in the Cocoa Belt, where Chevron already has an operating footprint through Petroindependencia and Petropiar. Wirth framed the plan as additive rather than competitive with U.S. barrels, according to comments he made on CNBC.
On the July earnings call, Wirth had already told analysts Chevron is “actively working with the government to look at other opportunities” and that any additional spend has to “compete in our portfolio for capital.” Management also said existing Venezuelan JV output has grown from 40,000 to 250,000 barrels in recent years, and that Chevron expects its Venezuelan debt to be fully recovered by early 2027.
Why Analysts Are Flagging the Timeline
Kpler’s Amena Bakr has been public about her skepticism. In earlier commentary, she wrote that the barrels capable of moving U.S. pump prices are “5 to 15 years out.” Michelle Caruso-Cabrera of MCC Global has also flagged contract-sanctity risk on Venezuelan deals under the current political framework. Chevron’s five-year clock diverges from the independent view of a decade-plus ramp, and the gap matters for anyone paying a peak price today.
Financial Firepower Behind the Bet
The Q2 earnings report gives Chevron room to spend without stretching the balance sheet. Chevron reported adjusted EPS of $6.06 on revenue of $67.2 billion, up 51.43% year over year, per its 8-K filing. Free cash flow was $18.10 billion, and Chevron reduced debt by $8.41 billion in the quarter alone. Worldwide production hit 4,070 MBOED, up 20% year over year, with a record 2,077 MBOED from U.S. upstream and refineries running at 97% utilization.
Wirth summarized the quarter this way: “Our strong second quarter performance is a result of disciplined investment and strong execution that drove record U.S. upstream production, record crude throughput in our U.S. refineries, and exceptional reliability across key assets.” Chevron returned capital aggressively too, with $3.117 billion in Q2 buybacks and a $1.78 quarterly dividend.
Valuation Reality Check
CVX now trades at $211.73, with a trailing P/E near 34. Against a 2026 consensus EPS of $15.87, the forward multiple is roughly 13x. The 2027 EPS consensus, however, slips to $13.20, reflecting analyst caution about oil prices normalizing from spring highs. WTI ran to $105.67 on April 3 and has since settled at $87.35 as of August 21, still well above the $57.54 print on January 2 that anchored the year.
What CVX Shareholders Are Actually Paying For
Cramer is right that Chevron is flying. The Q2 execution, the balance-sheet strength, the Microsoft AI power deal, and the Iraq and Guyana pipelines all justify the run. The Venezuela leg is the one to watch. If Chevron hits 600,000 barrels a day within five years, shareholders paying a 52-week high are getting a compounding growth option on top of the base business. If Bakr’s decade timeline is closer to the truth, the market is already paying for barrels that arrive well after this cycle. The next catalysts to monitor are Q3 earnings on September 30, TCO affiliate distributions at higher Brent, and any confirmation of Venezuelan JV terms that would allow Chevron to book incremental reserves.
The post Chevron Is Really Flying, Jim Cramer Says, But Can Venezuela Double Output? appeared first on 24/7 Wall St..
]]>Chevron CEO Mike Wirth flew to Caracas and committed real capital, then told American drivers cheaper gas is not coming from this deal. That split screen is the story.
In a CNBC interview Tuesday, Wirth said Chevron (NYSE:CVX) will spend $7 billion across three joint ventures over five years to triple Venezuelan production from roughly 300,000 barrels per day to over 600,000 barrels per day by 2031, at a cost per barrel of less than $20. Wirth framed the economics as accretive to free cash flow, made viable by renegotiated fiscal terms, royalties, legal framework, and dispute resolution provisions.
What Wirth Told Drivers
Asked whether Venezuelan crude would bring down U.S. gasoline prices, Wirth called it “a long term add to supply globally” and said a new refinery would take “5 to 7 years” to build. He pointed to the Middle East and Russia-Ukraine as drivers of tight product markets, noting the only faster fix is routing more product to existing refineries.
The national average price of regular gas sat at $4.071 per gallon on August 31, 2026, above the $4.00 “painful for budgets” threshold. That is up from $2.779 on January 12, with a 2026 peak of $4.50 on May 11. On the Q2 call, Wirth said diesel is the tightest spot, warning of “upward pressure on product pricing here into the third quarter and perhaps beyond that.”
Pump Versus Portfolio
The same tightness squeezing drivers is a tailwind for the stock. CVX traded at $211.66 Wednesday morning, up 42.32% year to date and 5.58% in the past week. Q2 delivered adjusted EPS of $6.06, revenue of $67.20 billion, and downstream earnings of $4.87 billion versus $737 million a year ago. Debt fell by more than $8 billion in the quarter.
Long Game Wirth Is Playing
On the Q2 call, Wirth previewed the Venezuela pivot: “We are going to work it to create value, not for a year or two, not growth for a year or two, but value long, long, long into the future.” He noted debt recovery from Caracas would be “fully recovered” by early 2027.
U.S. production hit a record 2.1 million barrels per day last quarter, more than 50% of global output, and Kazakhstan and the Black Sea pipeline are running at full capacity. Shareholders got the answer. Drivers got a timeline measured in years.
The post $7 Billion for Venezuelan Oil, and Chevron’s CEO Just Told Drivers When Gas Gets Cheaper appeared first on 24/7 Wall St..
]]>A $5,700 monthly paycheck works out to $68,400 a year, roughly what a comfortable retirement runs for a debt-free 64-year-old in most of the country. The goal here is to hit that number using five individual dividend stocks, one per sector, all paying qualified dividends. No covered call ETFs, no BDCs, no monthly-pay closed-end funds.
The five-stock blueprint is straightforward: Verizon (NYSE:VZ) for telecom, Chevron (NYSE:CVX) for energy, AbbVie (NYSE:ABBV) for pharma, Philip Morris International (NYSE:PM) for tobacco and smoke-free, and Southern Company (NYSE:SO) for regulated utilities. Equal 20% weights across the five.
Where the Yields Actually Sit Today
At current prices, the forward yields shake out like this. The telecom name pays about 5.6% on a $2.83 annualized payout. The energy major yields roughly 3.4% on $7.12. The pharmaceutical company sits near 2.7% of $6.92. The tobacco giant comes in around 3.1% on $5.88. And the utility pays about 3.5% on $3.04. If you weight them equally, the basket lands at a blended yield near 3.7%. To generate $68,400 of income at that average, you need roughly $1.87 million in capital, split $374,000 across each of the five positions.
That is a meaningful sum, no question. But it is still less than what a Treasury-only strategy would require at the current 4.75% yield on the 10-year, once you factor in what these companies do that Treasuries do not. They raise the payout over time.
Three Ways to Size the Portfolio
The core math is $68,400 divided by yield. Three tiers illustrate the tradeoff:
- Conservative tier (3% to 4%): Run the math at 3.5%, and $68,400 a year requires $1,954,000 in capital. That is where the five-stock basket lands if you lean heavier into the energy major, the pharmaceutical company, and the utility. You are putting up the most money upfront, but the principal keeps compounding over time. The drug company’s quarterly payout has climbed from $1.07 in 2019 to $1.73 in 2026, and the oil giant has gone from $1.29 in 2020 to $1.78 in 2026. That is sleep-at-night income that actually grows.
- Moderate tier (5% to 7%): At a 5.5% yield, that same $68,400 annual target calls for $1,244,000. You get there by overweighting the telecom name and mixing in preferred shares, REITs, or high-dividend equity funds. The telecom company just marked its 20th consecutive year of dividend increases, though the latest raise was only 2.5%. Payout growth has flattened, and total return leans more on the coupon than on price appreciation.
- Aggressive tier (8% to 14%): $68,400 divided by 0.10 equals $684,000. Leveraged covered call funds, mortgage REITs, and high-yield bond funds live here. Distributions frequently get cut, and the principal often erodes. You are spending the asset, not living off its growth.
Why the Lower Yield Often Wins
A 3.7% yield that grows 6% to 8% annually doubles your income in roughly nine to twelve years. A 10% yield with a flat or shrinking payout stays put or slides. In this basket, Chevron has raised its dividend for more than two decades, Southern’s quarterly payout has ticked up from $0.56 in 2017 to $0.76 today, and Philip Morris has moved from $1.00 per quarter in 2015 to $1.47 in 2026.
That growth is why AbbVie is up 512% over 10 years, and Chevron is up 219%, with the yield reinvested along the way. The whole point of a ladder like this is never having to sell a share to pay a bill, and we walked through how to build one in a free guide here.
The catch: concentration. Five stocks in five sectors are diversified relative to owning one, but a Humira-style patent cliff, an oil-price collapse, or an FDA action on nicotine pouches can each hit 20% of the income stream at once. AbbVie’s $10.9 billion Apogee acquisition and 14-cent EPS dilution illustrate the reinvestment risk baked into the pharma slot.
Three Steps to Take This Week
- Price out your real number. Pull last year’s actual spending, not your pre-retirement salary. If you can live on $54,000, your capital target drops by roughly $400,000 at a 3.7% blended yield.
- Stress-test the growth assumption. Model each holding at half its recent five-year dividend growth rate. If the math still works, the plan is durable. If it does not, add a sixth or seventh position rather than reach for yield.
- Run the tax layer. All five names pay qualified dividends, taxed at 0%, 15%, or 20% federally depending on the bracket. In a state like California or New York, layer state tax on top before deciding how much of the portfolio belongs in a taxable account versus an IRA.
The post No ETFs Required: How a 64-Year-Old Built a $5,700 Monthly Paycheck From Five Dividend Stocks appeared first on 24/7 Wall St..
]]>President Trump took a historic victory lap Saturday, announcing 100-year concessions on 17 Venezuelan oil fields covering roughly 65 billion barrels of proven reserves.
Sixty-five. Billion. Barrels.
For perspective, the entire United States had about 46 billion barrels of proven reserves at the end of 2024. Washington now claims access to more petroleum in South America than exists beneath all 50 states combined.
So, cheap gas for everybody?
America’s Gulf Coast refiners would like a word.
Because while 65 billion barrels makes for one heck of a victory lap, the people responsible for turning crude oil into something you can actually pump into a Ford F-150 have a considerably less exciting story to tell.
For drivers and energy investors, the important number isn’t how much oil exists underground. It’s how much can be extracted, transported, refined, and eventually pumped into a vehicle.
Preferably sometime before your grandchildren retire.
And on that score, Venezuela’s 65-billion-barrel bonanza runs directly into industrial reality.
Under the reported framework, the fields go to a joint venture between Washington and North American Blue Energy Partners (NABEP), Venezuela’s second-largest private producer, run by Alejandro Betancourt Lopez. The Pentagon’s Office of Strategic Capital takes a 35% equity stake in NABEP’s corporate parent.
The U.S. receives a guaranteed 20% of production at cost and right of first refusal on the remaining 80%. NABEP plans up to $100 billion in new infrastructure and $200 billion in royalties and taxes over 25 years.
Those are gigantic numbers.
Unfortunately, none of them are gallons of gasoline.
Venezuela Has an Ocean of Oil. It Just Doesn’t Produce Much of It.
Here is the inconvenient thing about oil reserves:
Reserves are oil in the ground. Production is oil coming out of a pipe.
Venezuela is spectacular at the first one.
It is currently terrible at the second.
Despite sitting on the world’s largest petroleum reserves, Venezuela produces only about 1% of global oil output after two decades of state mismanagement, decaying infrastructure, and U.S. sanctions dating to 2005.
Signing a historic agreement does not cause 65 billion barrels of crude to obediently march toward the nearest tanker.
Somebody has to get it out.
And that’s going to take a while.
Rystad Energy estimates full production from existing fields may not arrive until the mid-2030s. The Council on Foreign Relations estimates repairing and modernizing Venezuela’s crippled infrastructure could cost $10 billion to $20 billion.
Developing new fields could take more than a decade and require at least $100 billion in fresh capital.
And after spending all that money and waiting all those years, you encounter another minor inconvenience:
Now you have to refine the stuff.
The Gulf Coast Refining Wall
Not all oil is created equal.
Venezuelan crude is extra-heavy and loaded with sulfur. You don’t simply pour it into any refinery and wait for gasoline to come out the other end.
It requires specialized, high-complexity coking refineries.
Fortunately, the U.S. Gulf Coast has some of the best facilities in the world for processing exactly this kind of crude.
Unfortunately, they’re already busy.
Valero Energy (NYSE), the premier processor of heavy crude, told analysts on July 30 that “we’ve been the largest U.S. consumer of Venezuelan crude over the last several years” and expects processing rates to exceed its historical maximum.
That’s not exactly an industry saying:
PLEASE SEND US 65 BILLION MORE BARRELS.
Valero management also flagged roughly 5 million barrels per day of global refining capacity offline and light-product inventories about 130 million barrels below normal seasonal levels.
So imagine Venezuela somehow manages to dramatically increase production tomorrow.
Wonderful.
Where does all that extra heavy crude go?
Finding 65 billion barrels of Venezuelan oil does not magically build more Gulf Coast distillation towers or coking units.
You can have all the oil in the world underground.
If you can’t process it fast enough, your gas tank remains unimpressed.
Your Gas Pump Does Not Care About Press Releases
The national average for regular gasoline stood at $4.08 per gallon as of August 24, up 2.1% from a month earlier.
WTI crude closed at $83.90 on August 25, well below its $114.58 April peak but still elevated amid the Iran conflict and disruption in the Strait of Hormuz.
Those are the things your gas pump cares about.
Benchmark crude prices.
Refinery capacity.
Product inventories.
Shipping routes.
Actual barrels of actual oil moving through actual infrastructure.
Oil that might emerge from Venezuela a decade from now doesn’t do much for someone filling up on Tuesday.
The market cannot pour a press release into a refinery.
And announcing another 65 billion barrels underground does not reopen a tanker route through the Strait of Hormuz.
So if you’re waiting for this deal to knock 50 cents off the gas station sign next week, you may want to bring a chair.
Possibly snacks.
Then There’s the Small Matter of Whether the Deal Survives
Let’s assume Venezuela rebuilds its infrastructure.
Let’s assume investors provide the capital.
Let’s assume production ramps.
Let’s assume Gulf Coast refiners find room for the crude.
We’re home free!
Well…
There’s still politics.
Energy lawyers have questioned the deal’s legality and called for contract transparency. Protests erupted in Caracas over the weekend. Chavismo factions have objected on sovereignty grounds, while independent U.S. producers are wary of competing against a Pentagon-backed joint venture.
Then there’s Venezuela’s rather memorable history with foreign oil companies.
Venezuela nationalized foreign oil assets in 2007, seizing billions in Western equipment.
And while this contract spans 100 years, American presidential terms famously do not.
A future administration taking office in 2029 could attempt to unwind the framework, and reports have noted that NABEP’s leadership has faced past regulatory scrutiny.
So the investment proposition looks something like this:
Spend tens of billions rebuilding Venezuela’s oil industry.
Wait perhaps a decade for major new production.
Navigate Venezuelan politics.
Navigate American politics.
Navigate legal challenges.
Find enough specialized refining capacity.
Then sell the oil.
Simple!
What This Actually Means for CVX, XOM, VLO, and XLE
For investors, the trick is separating companies that could eventually benefit from Venezuela from companies whose stocks have already moved for entirely different reasons.
Chevron (NYSE) is the essential corporate player to watch.
Chevron is the only U.S. major that remained in Venezuela through the 2007 nationalization. CEO Mike Wirth confirmed on July 31 that the company is “in negotiations right now to try to improve the fiscal terms and enable more investment in Venezuela,” with full debt recovery expected by early 2027.
Chevron shares are up 39.01% year to date.
Exxon Mobil (NYSE), up 36.41%, has no role in the Venezuelan deal and remains locked in a territorial border dispute with Caracas at the International Court of Justice.
Valero has surged a staggering 123.8%.
The Energy Select Sector SPDR Fund (NYSEARCA) is up 45%.
Those are enormous moves.
But don’t give Venezuela the credit.
The energy sector has repriced because of acute global shocks to crude supplies and refined-product bottlenecks.
Venezuela had nothing to do with it.
The Bottom Line
Sixty-five billion barrels makes for an unforgettable political victory lap.
It is also, for the moment, mostly a very impressive number on a piece of paper.
Gulf Coast refiners care about a much smaller and considerably less glamorous number:
How many barrels are actually leaving the Orinoco Belt and entering a U.S. refinery today?
Watch the export volumes.
Watch the infrastructure spending.
Watch the contracts and legal challenges.
And above all, watch how much Venezuelan crude Gulf Coast refineries actually process.
When those numbers start moving, this becomes a supply story.
Until then, Washington has acquired rights to an enormous ocean of oil that is continuing to perform the job Venezuelan crude has mastered over the past two decades:
Sitting quietly underground.
The post Gulf Coast Refineries Pour Cold Water on Trump’s 65-Billion-Barrel Venezuelan Victory Lap appeared first on 24/7 Wall St..
]]>Energy stocks led the market higher Monday morning as two major oil catalysts hit at once. CNBC’s Dominic Chu framed the setup on the network’s opening segment on Monday: “Oil prices did jump by about 3% on the resumption of those attacks, and that sent energy stocks higher.”
He added that “Chevron, Exxon Mobil, Halliburton, and Occidental Petroleum all in the green this morning after getting another boost on Friday, when President Trump said the U.S. had a deal with Venezuela to control more than 65 billion barrels of its oil reserves.” The Venezuela announcement won’t impact today’s supply, but it adds a long-horizon reserves story.
The U.S. and Iran traded strikes over the weekend, the first time in more than a month, which adds a supply-risk premium to energy prices.
Iran Strikes Send Oil Prices Up 3%
Chevron (NYSE:CVX) opened higher, trading at $208.18 Tuesday morning, up 1.00% on the session and 36.13% year-to-date. On the Q2 call, CEO Mike Wirth flagged the region directly, saying “the impact from the Middle East conflict remained isolated to the partition zone representing about 1% of second quarter total production.” Chevron still delivered $12.1 billion in earnings, or $6.11 per share, and cut debt by more than $8 billion in the quarter.
Exxon Mobil (NYSE:XOM) trades at $162.91 on Tuesday, up 1.20% intraday. Exxon’s Q1 report disclosed $706 million in losses tied to Middle East supply disruptions, and CEO Darren Woods said: “Events in the Middle East tested that strength with the safety of our people remaining our top priority.”
Halliburton (NYSE:HAL) added 1.53% to $36.74, extending a 16% one-month rally. Middle East and Asia revenue was down 2% sequentially in Q2 on activity disruptions in Kuwait, Iraq, and Qatar.
Occidental Petroleum (NYSE:OXY) rose 0.76% to $59.55. CEO Richard Jackson said on the Q2 call that Occidental “fully offset the disruptions of our production in the Middle East” through Permian and Gulf of America volumes.
Trump’s 65 Billion-Barrel Venezuela Deal Is a Very Different Catalyst
President Trump announced Friday that the U.S. had a deal with Venezuela to control more than 65 billion barrels of its oil reserves. Chevron is the most direct beneficiary given its three producing joint ventures with PDVSA.
Chevron CEO Mike Wirth told analysts Chevron has grown production from those three JVs “from 40,000 to 250,000” barrels per day and that “we’re in negotiations right now to try to improve the fiscal terms and enable more investment in Venezuela.” CFO Eimear Bonner said on debt recovery, “we expect that by early 2027, that will be fully recovered.”
The reserves headline is a long-horizon story: Venezuelan infrastructure has been degraded by years of sanctions and disinvestment, and heavy and extra-heavy crude requires specialized handling that takes time to rebuild. Retail investors have zeroed in on that gap. Reddit’s most-discussed Chevron thread over the weekend was titled “Trump announced a deal for 65 billion barrels of Venezuelan oil. How much of that is actually investable?” with sentiment scores clustering in a neutral 49 to 58 range.
Key Takeaways
Iran and Venezuela are giving energy investors two very different catalysts. Renewed Middle East fighting can move oil prices immediately, while Venezuela’s 65 billion barrels could take years to translate into meaningful production.
The post Chevron, Exxon and Other Oil Stocks Jump as Two Huge Energy Stories Collide appeared first on 24/7 Wall St..
]]>CNBC’s Brian Sullivan walked viewers through the announced U.S.-Venezuela oil arrangement Monday, delivering a simple message for investors: the headline reserve number is enormous, and the timeline to real production might not be as long as some would expect.
“Venezuela, 65 billion barrels proven reserves on the part of this deal. Venezuela obviously has more. The U.S. under this would control 55% of that,” Sullivan said, framing a reported 25-year lease structure valued at $100 billion-plus in investment by U.S. energy companies.
The announcement, covered Monday morning on CNBC, names three U.S. majors as prospective participants: Chevron (NYSE:CVX), Exxon Mobil (NYSE:XOM) and ConocoPhillips (NYSE:COP). Sullivan emphasized the physical and legal structure remains unsettled. “The report is that this is going to be 55% controlled by the United States, and private companies are going to be a part of that. We don’t know the exact physical structure, legal structure,” he said.
65 Billion Barrels in the Ground, but Only 1.2 Million Produced per Day
Venezuela holds more than 300 billion barrels in total proven reserves, and this agreement carves out just 65 billion. Yet the country’s ability to lift, transport, and sell that oil has eroded for decades.
“Venezuela has been in a rolling 30-year production collapse. Venezuela was one of the biggest oil producers in the world. It was the richest country in Latin America 30 years ago, not even close. 1997, they peaked out at about 3.2 million barrels per day on average of production. Right now, doing about 1.2,” Sullivan said. EIA’s most recent Short-Term Energy Outlook shows Venezuelan output in a similar range, with recent quarterly figures near 1.0 million barrels per day.
Sullivan had a blunt message on the feasibility of getting usage from the oil: “This oil is going to sit under the ground if there’s no capital and expertise to pull it out.“ On timing: “If this deal does happen, if this progresses, you’re talking years before we extract any significant volume of oil from Venezuela. Everything is dilapidated.”
The U.S. Could Control 55% Under a 25-Year Deal
Under the announced structure, U.S. entities would control 55% of the 65 billion-barrel carveout under a 25-year lease. Venezuela’s interim president, Delcy Rodriguez, said Venezuelans would receive around $200 billion in sales tax revenue.
Sullivan raised broader questions about who controls the Venezuelan counterparty and legal complications that could weigh on implementation. Any operator would demand multi-year security and legal guarantees before committing capital, and why such guarantees can be fragile across leadership changes.
Former Chevron Executive Warned About This Exact Problem
Sullivan’s reporting arrives three days after CNBC’s August 28 interview with Ali Moshiri, CEO of Amos Global Energy and former President of Chevron Africa and Latin America. Moshiri backed the strategic logic, arguing Venezuelan barrels bypass the Strait of Hormuz, Red Sea, and Black Sea choke points.
He advocated a public-private partnership because Venezuela’s heavy and extra-heavy crude requires specialized technology the country has lost after roughly 15 years outside global markets. He thinks: “the idea is great, the challenge is going to be implementation,” with majors likely to move slowly on entry protocols while smaller firms move faster.
What the Venezuela Deal Means for Chevron, Exxon and ConocoPhillips
The 65 billion-barrel headline makes the Venezuela deal look transformative, but with production still around 1.2 million barrels per day and infrastructure badly degraded, those reserves could take years and enormous amounts of capital to reach global markets. For Chevron, Exxon, and ConocoPhillips investors, the story now shifts to whether the deal can be implemented and when.
The post Energy Expert Warns Venezuela’s 65 Billion-Barrel Oil Deal Won’t Fix Supply Anytime Soon appeared first on 24/7 Wall St..
]]>
Oil markets have spent the past six months learning to live with an uncomfortable reality: The U.S.-Iran conflict can flare up quickly without necessarily becoming a full-scale war. That distinction matters because the Strait of Hormuz remains one of the world’s most important oil chokepoints, and even the threat of disruption can add a premium to crude prices.
This morning, that premium returned. Brent crude jumped 3.5% to $91.30 a barrel while West Texas Intermediate climbed 3.7% to $86.49 after the U.S. and Iran once again exchanged strikes.
Another Round Around The Strait
The latest escalation began when U.S. forces struck two Iranian missile launchers on Larak Island near the Strait of Hormuz. U.S. Central Command said the launchers were being prepared to fire rockets carrying sea mines into the waterway. Iran then retaliated with ballistic missiles and drones targeting two U.S. military installations in Jordan. Jordanian forces said eight missiles were intercepted.
The timing is important. Just last week, the White House said U.S. forces had cleared mines from the Strait and warned that any ship or boat attempting to lay new ones would be “immediately and systematically destroyed.” Iran, meanwhile, has warned it would “forcefully respond” to further attacks.
That leaves investors watching the same question they have faced repeatedly since the war began: Is this another tit-for-tat exchange, or the start of something larger?
The Conflict Still Has No Exit
Unfortunately, there is little evidence of a diplomatic off-ramp as there were no talks between Washington and Tehran aimed at ending the six-month conflict. The June agreement that established a 60-day framework for negotiations has expired.
Instead, Washington has shifted toward economic pressure. Last week, the U.S. Treasury launched “Operation Economic Outcast,” which Secretary Scott Bessent described as an economic campaign designed to sever Iran’s financial lifelines. Trump has called the effort an “Economic D-Day.”
The problem for oil investors is that economic pressure does not eliminate Iran’s ability to threaten the Strait. Traffic through the waterway had fallen to roughly five ships per day over the weekend, while the U.S. said it was continuing efforts to keep Gulf oil moving.
Big Oil Is Treating This Differently
Brent and WTI are back above $90 and $86, respectively, but both benchmarks fell more than 4% last week. That suggests markets are treating this morning’s strikes as another escalation — not yet a fundamental change in the war’s trajectory.
Big oil stocks are reflecting that cautious optimism. Exxon Mobil (NYSE:XOM) is rising about 2% in premarket trading, while Chevron (NYSE:CVX) is up 2.2%.Both BP (NYSE:BP) and Shell (NYSE:SHEL) were, respectively, 1.7% and 1.3% higher
Exxon generated $14.5 billion of second-quarter earnings, $23.6 billion of operating cash flow and $17.2 billion of free cash flow. Yet its 30.2% gain this year trails the 40.2% advance of the State Street Energy Select Sector SPDR Fund (NYSEARCA:XLE).
Chevron has an additional catalyst. Its second-quarter earnings reached $12.1 billion, while production increased 20% year-over-year. The company is also positioned to benefit from the emerging U.S.-Venezuela oil agreement because it remains the only major U.S. oil company with a significant Venezuelan presence.
Key Takeaway
In short, investors should respect the risk without assuming the new strikes automatically signal a wider war.
The market has seen this movie repeatedly over six months. Unless Iran successfully closes the Strait or attacks produce sustained damage to Gulf oil infrastructure, crude’s latest jump looks more like another geopolitical risk premium than the beginning of a new oil shock.
That said, the absence of negotiations raises the stakes. For energy investors, Chevron looks particularly interesting because it combines direct exposure to higher oil prices with a potential long-term Venezuelan growth opportunity. Exxon offers stronger cash generation but has lagged the broader energy sector.
The smart move is to watch the physical oil flows through Hormuz, not just the headlines. If ships keep moving, today’s oil spike may prove temporary. If they stop, $90 crude could look cheap surprisingly quickly.
The post Oil Prices Jump Above $90 As U.S. and Iran Trade Strikes. Is $100 Next? appeared first on 24/7 Wall St..
]]>Shares of Chevron (NYSE:CVX) and Exxon Mobil (NYSE:XOM) are climbing in Monday morning trading after the United States and Iran resumed military strikes over the weekend, with shipping through the Strait of Hormuz still constrained. Chevron stock is up 3% to $207.80; Exxon Mobil stock is rising 3% to $161.31.
The energy complex is repricing supply risk in real time. WTI crude oil is at $86.06 per barrel, up 3% over the past 24 hours, while Brent has topped $90. Crude trades nearly around the clock, so that 24-hour figure captures weekend headlines across venues open beyond U.S. equity hours.
Energy is the standout group this morning. The Energy Select Sector SPDR ETF (NYSEARCA:XLE) is up 2% to $64.18. Broad benchmarks are moving the other way, with the SPDR S&P 500 ETF Trust (NYSEARCA:SPY) down 0.4% to $766.13, while Exxon Mobil and Chevron together sit at the top of the XLE weighting, so the fund is tracking crude prices almost tick for tick today.
Hormuz Risk Repricing Fuels the Bid
The driver here is geopolitical. Both Chevron and Exxon Mobil have stayed quiet on the newswires today, leaving the weekend escalation between Washington and Tehran as the sole catalyst. Traders are pricing supply optionality across the crude curve as headline sentiment shifts.
Hormuz matters for the pair because a large share of seaborne crude and LNG passes through the strait. A supply-risk premium builds quickly when tanker transit is uncertain, and it fades just as quickly once flows resume. That two-way sensitivity marks today’s move as a repricing of headline risk, with limited implications for the majors’ long-term earnings power.
WTI crude oil’s recent path adds context to today’s bid in Chevron and Exxon Mobil. The daily FRED spot series had crude near $83.90 on August 25, after touching $89.75 on August 20, so today’s bounce retraces part of last week’s slide before the weekend headlines hit. That level sits above the $60 to $80 range the EIA classifies as moderate, and beneath the year’s high of $114.58 on April 7.
Commentary from both CEOs foreshadowed this backdrop. Chevron CEO Mike Wirth cited “geopolitical uncertainty and market volatility” on the company’s most recent call. Exxon Mobil CEO Darren Woods struck a similar note, saying “Events in the Middle East tested that strength… those events also underscored the importance of reliable, affordable energy products.”
One Move, Two Different Businesses
Chevron and Exxon Mobil are both up roughly 3%, and that’s an observation worth flagging. The market is treating the pair as a single crude-beta position, glossing over how differently their segments respond to a crude spike.
Both are integrated majors, each spanning upstream production, where a higher crude price lifts realizations on every barrel produced, and downstream refining and chemicals, where crude functions as an input cost. A jump in oil therefore lands unevenly across an integrated major’s segments. Pure exploration and production companies feel that lift more uniformly across revenue and margin lines.
Scale reinforces the herd trade in Chevron and Exxon Mobil. Chevron’s Hess integration has broadened its reserve base, while Exxon Mobil’s Guyana ramp and Permian footprint anchor its upstream mix. Both names also carry sizable refining capacity, which cushions the earnings mix when crude runs and can absorb some of the upside if the risk premium sticks.
Both stocks have run hard heading into today, with Chevron stock up 36% year to date (YTD) through Friday’s close. Exxon Mobil stock was up 33% year to date through that same tag. That momentum leaves less valuation cushion in Chevron and Exxon Mobil if the geopolitical premium unwinds and crude retraces toward the summer trend.
What to Watch
The next share-price move in Chevron and Exxon Mobil depends on Hormuz traffic and OPEC’s posture. Investors can watch for whether tanker transit normalizes and for whether the cartel signals any production response as WTI crude oil holds above $85. Peer strength across the energy patch, including refiners and services names inside the XLE ETF, will provide a read on how broadly the risk premium is being priced across the value chain.
Position sizing deserves emphasis for investors of Chevron and Exxon Mobil today. A geopolitical risk premium is among the most reversible moves in energy, and it can unwind as quickly as it appeared if the conflict de-escalates or Hormuz transit normalizes. Traders sizing their exposure here can stage entries and avoid chasing the current level, since headline risk cuts in both directions and today’s bid in these two names could reverse on a single wire story.
The post Chevron and Exxon Mobil Rise 3% as U.S. Strikes on Iran Push WTI Crude Oil to $86 appeared first on 24/7 Wall St..
]]>Ali Moshiri, CEO of Amos Global Energy and former President of Chevron Africa and Latin America, recently appeared on CNBC to weigh in on what an ownership stake in Venezuelan oil fields could mean for the U.S. He believes that one of the biggest advantages of the deal will be that Venezuelan oil can reach U.S. refiners without passing through shipping corridors such as the Strait of Hormuz.
“I think it comes down to energy security for the United States. If you consider that Venezuela has the largest resource and it doesn’t have the choke point that we have seen in the Strait of Hormuz, Red Sea, and Black Sea,” he said. Venezuela holds the world’s largest proven oil reserves, and unlike Gulf barrels, they reach U.S. refiners without transiting maritime corridors that can be impacted by conflict in the Middle East.
“The Ideas Is Great.” Producing the Oil Is the Hard Part
The challenge with Venezuelan oil is the operational complexity: “The idea is great. The challenge is going to be implementation, human capacity, operational experience, and so forth, and how all of this is going to come together,” Moshiri said.
Venezuelan crude is heavy and extra-heavy, requiring specialized technology and experience. Heavy oil is less valuable and much harder to transport than lighter oil, because lighter oil can easily flow through a pipeline while heavy oil might have a viscosity closer to peanut butter. It would be very difficult to send peanut butter through a pipeline, which is what makes heavy oil more costly and difficult to transport. Heavy oil requires diluents, upgraders, coking capacity, and refineries configured for high-sulfur, high-viscosity feedstock. Reservoirs need steam or solvent techniques to move barrels to the surface.
Layered on top, Venezuela has been absent from global energy markets for the past 15 years. In Moshiri’s view, that gap erodes local operational capacity and skilled labor in ways money alone can’t quickly rebuild. “Venezuela’s oil is very complicated. It’s a heavy and extra heavy. It requires technology. It requires experience that you’ve got to come together to make that a reality. I think that’s the reason it’s very essential to be a private and public partnership,” he said.
Why Small Operators Could Move Before Big Oil
Moshiri guessed which companies might benefit from this early: “The majors, they’ve got a different protocol to entering in the country, usually takes longer than normal time frame. The smaller company, midsize company, they react much faster in the short term,” he said. Large integrated producers might move cautiously due to compliance protocols and memories of prior capital losses in Venezuela. Independents and midsize operators can commit crews and capital more quickly.
For context, Chevron (NYSE:CVX) carries a market capitalization near $393 billion, with trailing revenue of roughly $209 billion and a forward P/E of 13. Chevron’s long footprint in Venezuela was central to its Latin America business during Moshiri’s tenure and lends weight to his operating perspective.
The Western Hempisphere Is An Energy Security Play
Moshiri believes energy supply disruptions will likely happen again in the future, but Venezuela will help the U.S. achieve energy security: “I think from the energy security point of view, this is not going to be the last time this is going to happen. And we got to be ready for it. And I think we’ve got to look at the alternative for energy security. And an alternative for us is our own hemisphere. You look at Brazil, you look at Venezuela, you look at Argentina,” he said. OPEC’s current production is around 22-25 million barrels per day out of a 32 million barrel capacity, and Venezuela also holds significant critical mineral reserves alongside oil, which could help the U.S. build supply-chain sovereignty.
WTI closed at $83.40 per barrel on August 28, 2026, down 8.5% from a month earlier and off a 52-week high of $114.58 reached on April 7, 2026. At the pump, the U.S. regular gasoline average was $4.08 per gallon on August 30, 2026, above the $4.00 threshold the EIA describes as painful for household budgets.
Key Takeaways
The announced agreement puts Venezuela’s oil potential back in focus, but Moshiri’s argument turns on execution. Heavy crude, infrastructure needs, and shortages of experienced workers make production difficult to scale. Smaller operators may move first, while investors should judge progress by investment and actual output.
The post Former Chevron Executive: Venezuela’s Oil Opportunity Comes With a Major Catch appeared first on 24/7 Wall St..
]]>
Oil markets have spent 2026 wrestling with supply disruptions, Strategic Petroleum Reserve drawdowns to multi-decade lows, and stubborn pump prices that refuse to cooperate with political calendars.
That makes President Trump’s new energy agreement with Venezuela genuinely good news for long-term American energy security. It hands U.S. interests majority control of more than 65 billion barrels of proven Venezuelan reserves — roughly one-fifth of the OPEC nation’s world-leading 303 billion-barrel total — while unlocking private investment aimed at rebuilding a battered industry.
The U.S. currently holds about 46 billion barrels of proven crude oil and lease condensate reserves. Add the 65 billion barrels covered by the agreement, and the combined figure reaches roughly 111 billion barrels. That represents about 7.1% of the world’s 1.57 trillion barrels of proven crude reserves reported by OPEC at the end of 2025 (Venezuela is considering leaving OPEC). The total sits almost exactly in line with the United Arab Emirates’ 113 billion barrels and exceeds Kuwait’s 101.5 billion.
In short, the arrangement expands U.S. access to a meaningful slice of global supply without adding a single new domestic well.
What the Deal Actually Delivers
The agreement, negotiated with Venezuela’s interim leadership, grants American companies long-term access to 17 strategic fields spanning the Orinoco Belt and Lake Maracaibo. Venezuelan officials project more than $100 billion in private investment and $209 billion in eventual tax revenue. Production rights are expected to flow primarily to U.S. operators, with resulting crude directed toward American markets.
Chevron (NYSE:CVX) already operates the largest U.S. footprint in the country and accounts for a substantial share of current Venezuelan output near 1.25 million barrels per day. The company is finalizing contract migrations under the new hydrocarbons framework and is positioned to expand into additional heavy-oil blocks. Service providers such as SLB (NYSE:SLB) have also secured early contracts for technology and equipment. These moves convert political headlines into tangible capital spending and potential production growth over the next several years.
Why Gas Prices Won’t Fall Overnight
Venezuela’s oil is predominantly extra-heavy crude that requires diluents, specialized refining, and major infrastructure repairs after years of underinvestment. Current output sits at roughly 1.2 million to 1.25 million barrels per day — its highest level since 2019 — yet remains a fraction of the country’s historic peaks above 3 million barrels. Even with rapid investment, meaningful incremental supply will take time to reach global markets.
U.S. Gulf Coast refiners like Marathon Petroleum (NYSE:MPC) and Valero Energy (NYSE: VLO) already process a large share of Venezuelan crude and stand to benefit from more reliable volumes. That improves energy security and supports refining margins. It does not, however, create an immediate flood of light sweet crude that would pressure gasoline prices lower in the next few months. Global balances still reflect other disruptions, and the deal’s full production impact will unfold over years rather than quarters.
The Investing Angle for Smart Shareholders
For investors, the clearest near-term opportunity sits with companies that already have skin in the game and balance sheets strong enough to fund expansion. Chevron’s existing joint ventures and operational knowledge give it a first-mover edge. Its diversified global portfolio and consistent free-cash-flow generation provide a buffer while Venezuelan projects ramp. Service companies with early contracts stand to book incremental revenue as drilling and facility work accelerates.
Granted, political and legal risks remain. Infrastructure bottlenecks and the heavy nature of the crude could temper the pace of growth. That said, the combination of U.S. policy support, sanctions relief through updated Office of Foreign Assets Control licenses, and private capital creates a clearer path than the sector has seen in more than a decade.
Investors focused on energy security and multi-year production growth now have a concrete set of assets to watch.
Key Takeaway
The Venezuela agreement strengthens America’s long-term oil position and opens a multi-billion-dollar investment runway for U.S. energy companies. It does not deliver an overnight drop at the pump. Smart investors should treat the news as a structural positive for firms already active in the country — particularly Chevron — while recognizing that the real production and cash-flow benefits will arrive gradually.
The post Trump’s New Oil Deal With Venezuela Is Insane — U.S. Now Controls 7.1% of Proven Global Reserves appeared first on 24/7 Wall St..
]]>Chevron (NYSE:CVX) and PepsiCo (NASDAQ:PEP) both reported Q2 2026 results and raised dividends this year. Chevron carries a 39-year streak. PepsiCo, at 54 consecutive annual increases, is classified as a Dividend King. The pressures on each payout differ sharply for income-focused owners.
Gushing Cash at Chevron, Grinding Margins at PepsiCo
Chevron’s Q2 2026, reported July 31, 2026, delivered adjusted EPS of $6.06, revenue of $67.2 billion, and quarterly operating cash flow of $22.63 billion. Free cash flow reached $15.4 billion. CEO Mike Wirth noted the Hess assets are generating cash that has been “roughly double the incremental dividends and accretive to shareholders on a per share basis.” Debt fell by more than $8 billion in the quarter, showing the cycle working as intended.
PepsiCo’s Q2 2026, reported July 9, 2026, showed core EPS of $2.20 on revenue of $24.18 billion, with core operating margin contracting 40 basis points. CEO Ramon Laguarta described the North American consumer environment as “worse than what we had anticipated and driven mainly by gas prices.” CFO Steve Schmitt said full-year EPS “may be towards the low end” of guidance. International is outperforming while Frito-Lay volumes soften.

Cyclical Cushion Versus Structural Squeeze
| Dividend Durability Lens | Chevron (FY2025) | PepsiCo (FY2025) |
| Operating cash flow | $33.9B | $12.1B |
| Capital expenditures | $17.3B | $4.4B |
| Dividends paid | $12.8B | $7.6B |
| Net income | $12.3B | $8.2B |
| Yield | 3.5% | 4.1% |
Chevron’s fiscal 2025 dividend outlay exceeded reported net income; buybacks added another $12.1 billion in shareholder returns. That coverage gap reflects the cycle. Q2 2026 confirmed recovery, with net debt to CFFO at 0.6 times and debt/equity at 0.2.
PepsiCo’s problem is structural. The gap between operating cash flow and capex plus dividends is thin, net income has flattened, and shares are down 5.4% over one year and 9.8% lower over five years. Debt/equity is 2.4. The 4% yield partly rewards patience and partly signals a repricing for lower growth. (For investors who want streaks measured in half-centuries rather than years, we ranked 10 Dividend Kings by valuation in a free report here).
Triggers That Would Change the Verdict
For Chevron, watch Brent. The EIA’s May 2026 outlook pegged Brent averaging $79.39 in 2026. A sustained slide below $60 paired with continued buybacks would compress cushion fast. For PepsiCo, watch whether North American Foods volumes turn and operating cash flow reclaims its 2023 level of $13.44 billion.
Why PepsiCo’s Payout Looks Tighter Today
Chevron’s dividend looks safer than FY2025 headlines suggest. Q2 2026 free cash flow of $15.4 billion and rapid deleveraging restore clear headroom. The risk here is variance in cash flow through the cycle. PepsiCo’s payout is structurally tighter: coverage is intact, but the cushion is narrow, earnings have flattened, and the yield climbs as the share price stalls. The view on PepsiCo would change if two consecutive years show operating cash flow comfortably above capex plus dividends with Frito-Lay volumes reaccelerating. The view on Chevron changes if Brent parks below $60 while buybacks continue. Both dividends remain funded. The nature of the stresses each company faces, however, is distinct.

The post Chevron or PepsiCo: Whose Dividend Is Standing on Thinner Ice? appeared first on 24/7 Wall St..
]]>
Oil markets are being reshaped by geopolitics as much as geology. Venezuela, home to the world’s largest proven crude reserves, is now moving closer to the U.S. after years of isolation, while OPEC’s influence over global supply appears to be weakening.
Venezuela produced only about 1.16 million barrels of oil a day in July, according to Bloomberg, less than half its output a decade ago. That means a Venezuelan exit from OPEC would have little immediate effect on crude prices. The bigger implication is what comes next: another crack in OPEC’s foundation and a potentially massive reopening of Venezuela’s oil industry to U.S. companies. And that puts Chevron (NYSE:CVX) in a particularly attractive position.
OPEC Could Lose Another Piece
Bloomberg reported Thursday that Venezuela is closely examining plans to leave OPEC, although no final decision has been made. The development would follow the United Arab Emirates’ decision to leave the cartel, giving OPEC another high-profile departure in only months.
To be clear, there would likely be little immediate impact to OPEC. Venezuela already isn’t subject to production limits because its output has fallen so far. So an exit wouldn’t suddenly unleash millions of additional barrels.
The longer-term risk for OPEC is credibility. Venezuela’s departure could encourage other members to prioritize production and market share over coordinated supply restrictions. Bloomberg notes that a broader breakdown could recreate the 2020-style battle for market share. For investors, that could mean more downward pressure on crude prices over time — a mixed outcome for oil producers but potentially beneficial for refiners and consumers.
Chevron Already Has a Head Start
The more compelling opportunity is Venezuela itself. Since U.S. forces removed Nicolas Maduro from power on Jan. 3, Washington has assumed far greater influence over Venezuela’s oil industry. Reuters reports that the U.S. is negotiating long-term access to a group of Venezuelan fields that American companies could develop, with 17 fields under consideration across the Orinoco Belt and Lake Maracaibo. One structure being discussed would involve leases followed by auctions or tenders for individual fields.
Chevron isn’t waiting for the starting gun. In April, the oil and gas giant increased its working interest in the Petroindependencia joint venture to 49% by acquiring an additional 13.21% stake. It also received rights to develop the adjacent Ayacucho 8 area in the Orinoco Oil Belt through its 30%-owned Petropiar JV.
That positioning is important because Venezuela’s oil is predominantly heavy and extra-heavy crude, requiring specialized infrastructure and expertise. Chevron already has both.
The company’s financial strength gives it another advantage. Chevron generated $12 billion in adjusted earnings and $15.4 billion in adjusted free cash flow during the second quarter, while production reached a record 4.07 million barrels of oil equivalent per day. Venezuela therefore represents an opportunity to add potentially valuable long-life production without betting the company on a turnaround that hasn’t happened yet.
More Than One Winner
Chevron may have the clearest head start, but it won’t have Venezuela to itself. Exxon Mobil (NYSE:XOM) and ConocoPhillips (NYSE:COP) could compete for field-development opportunities if Washington opens the door wider. ConocoPhillips generated $7.4 billion in second-quarter operating cash flow and returned $3 billion to shareholders, giving it substantial financial firepower for new projects.
Oilfield-service companies could be even more direct beneficiaries. SLB (NYSE:SLB) already signed a long-term framework agreement with Venezuela’s PDVSA covering exploration, field development, production, digital technology, and workforce development. Halliburton (NYSE:HAL) could benefit as drilling and completion activity expands.
And then there’s Valero Energy (NYSE:VLO). Venezuela’s heavy crude fits its complex Gulf Coast refineries particularly well. During its second-quarter earnings call, Valero said Venezuelan supply was increasing and expected its processing of Venezuelan heavy crude to exceed historical maximums in coming months. Similarly, Marathon Petroleum (NYSE:MPC) is one of the world’s largest heavy crude processors and its facilities are situated on the Gulf of America.
Key Takeaway
In short, Venezuela leaving OPEC isn’t the investment catalyst by itself. The bigger prize is the potential dismantling of barriers that have kept much of the country’s enormous oil resource underdeveloped.
Chevron is best positioned to capture that opportunity today because it already operates in Venezuela, just expanded its Orinoco footprint, and has the balance sheet to invest. Granted, legal challenges, political uncertainty and the possibility of lower oil prices remain real risks. Reuters notes that proposed leases could face constitutional and legal challenges under Venezuela’s existing framework.
But if Washington and Caracas turn today’s negotiations into a durable investment framework, Chevron could be one of the first — and potentially biggest — corporate winners.
The post Chevron Could Be Big Winner If Venezuela Pulls Out of OPEC appeared first on 24/7 Wall St..
]]>Wall Street has spent the last several years discounting a handful of famous dividend names on fears of patent cliffs, volume declines, and commodity swings. But the checks keep clearing. Pfizer (NYSE:PFE) still trades 20.8% below where it was five years ago, even as management just reaffirmed its payout in front of a looming loss-of-exclusivity window. Two other names, one industrial and one energy major, are in the same conversation. Here is where the yields sit, and whether the coverage supports them.
Pfizer: A 6% Yield With Management Drawing a Line in the Sand
Pfizer currently yields 6.15% on an annualized forward dividend of $1.72 per share, paid as a $0.43 quarterly distribution. The dividend was $0.42 in 2024 and has stepped up every year in the recent record, from $0.36 in 2019 to today.
Pfizer reaffirmed adjusted diluted EPS guidance of $2.80 to $3.00 for 2026, comfortably above the $1.72 annual payout. Second-quarter operating cash flow was $3.45 billion, and the company returned $4.9 billion to shareholders via the dividend in the first half. CEO Albert Bourla said flatly, “We feel extremely confident that, even in the most stretched scenarios we are running, we will be able to maintain our dividend.” Leverage ended the quarter at 2.7 times, and management now expects $6.7 billion in net cost savings through 2029.
In terms of the bull case, Pfizer’s launched and acquired products grew 18% operationally, and the pharma giant sees a path to high single-digit revenue growth after the LOE period ends in 2028. However, the implied risk is the same LOE cliff. Pfizer’s own guidance absorbs a meaningful headwind, and any acceleration of generic entry would pressure the coverage cushion.
UPS: Yield Above 6% After a Multiyear Reset
UPS (NYSE:UPS) yields 6.39% on an annualized forward dividend of $6.56 per share, or $1.64 quarterly. That payout has held steady across the seven most recent quarters, after a large step-up from $1.02 in 2021 to $1.52 in 2022. The stock is still 30.79% below its price five years ago.
Management guided full-year adjusted EPS of approximately $7.22, against a planned dividend payout of around $5.4 billion. Expected 2026 free cash flow is approximately $5.5 billion, essentially matching the dividend. Cash on the balance sheet stood at $4.7 billion with no commercial paper outstanding. CEO Carol Tomé framed the turnaround directly: “Incremental volume today carries materially better economics than before because of the structural changes we’ve made.”
The bull case is the completed Amazon glide-down, roughly $3 billion of savings landing in 2026, and U.S. domestic operating margin already back to 9.2%. The risk remains that free cash flow barely covers the dividend, and U.S. average daily volume still fell 3.3% year-over-year. Any macro air pocket makes that math a little uncomfortable.
Chevron: Lower Yield, but the Coverage Is a Fortress
Chevron (NYSE:CVX) rounds out the group as a high-yield income name rather than an ultra-high-yield one. The stock yields 3.44% on a $1.78 quarterly payout, with an annualized forward dividend of $7.12 per share. The per-share amount has stepped up every year in the record shown, from $1.29 in 2020 to $1.78 in 2026. Skepticism here is less about the payout and more about long-term oil demand.
Recent Q2 adjusted earnings came in at $6.06 per share, adjusted free cash flow was $15.4 billion, and Chevron cut debt by more than $8 billion in the quarter. Net debt to cash flow from operations sits at 0.6 times. Management hit $3 billion of structural cost reductions six months ahead of schedule and reaffirmed a long-term target of adjusted free cash flow growth averaging greater than 10% per year through 2030.
The record U.S. upstream production of nearly 2.1 million barrels of oil equivalent per day makes a solid bull case for the stock, along with Hess assets producing free cash flow roughly double the incremental dividends, and forward P/E holding at 13. However, earnings are still tethered to Brent, and CEO Mike Wirth’s $6 billion affiliate distribution guidance is set at $70 Brent.
What Ties These Three Payouts Together
These three names share a pattern the market keeps missing: durable cash flow, explicit CEO commitments to the payout, and multiyear cost programs that widen the coverage cushion each quarter. A 6%+ yield usually means the market suspects a cut is coming, and sometimes it is right (we walked through the seven warning signs that separate a real trap from a discounted payer in a free report here). Pfizer and UPS clear those tests while their businesses reset. Chevron pays less but backs it with the strongest balance sheet of the three. For income investors, the group offers a rare combination of skepticism-driven pricing and management teams putting the dividend first.
The post Wall Street Is Sleeping on These 3 Ultra-High-Yield Dividend Stocks appeared first on 24/7 Wall St..
]]>Building a monthly income stream from quarterly dividend payers requires just a little scheduling. Three blue chips, staggered on different quarterly calendars, can deliver a paycheck in every month of the year. Altria (NYSE:MO) pays in January, April, July, and October. AbbVie (NYSE:ABBV) pays in February, May, August, and November. Chevron (NYSE:CVX) pays in March, June, September, and December. Together, these three tickers cover all 12 months while offering attractive dividends along the way.
Here is what each leg of the ladder actually pays, how it has grown, and where the risks sit.
Altria: January, April, July, October
Altria just paid investors $1.06 per share on July 10, 2026, holding the level from the two prior quarters. The tobacco maker trades at $68.08 and carries a dividend yield of 6.19%, the highest of the three. Trailing 12-month payouts total $4.24, with the annualized forward at the same level.
The growth track record is proven. Altria has stepped the payout higher every year in this dataset, from $0.86 in 2020 to the current $1.06. Fundamentals are cooperating: management guided 2026 adjusted EPS to $5.56 to $5.72, and the Q1 earnings report of $1.32 beat the $1.25 estimate on revenue of $5.43 billion. Shares are up 23.72% year to date.
The risk to watch is regulatory and legal. Several third-party securities investigation notices have circulated in recent weeks, including a August 24, 2026 notice from Schall, Brown & Schwartz. These are not company announcements, and they do not change the dividend. They do reinforce why Altria trades at a forward multiple of just 12x.
AbbVie: February, May, August, November
AbbVie just paid investors $1.73 per share on August 14, 2026, the third payment at that level after a step up from $1.64. The trailing 12-month total sits at $6.83, with the annualized forward at $6.92. At the recent $259.76 quote, the yield is 2.58%.
The cash-flow story is the point. On the Q2 call, CFO Scott Reents told analysts AbbVie has “strong cash flows, balance sheet, and business outlook” and “substantial financial flexibility to pursue additional innovative business development.” Skyrizi hit $5.5 billion in the quarter, up 24% operationally, and Rinvoq cleared $2.5 billion, up 23.7%. Management lifted full-year adjusted EPS guidance to $13.87 to $14.07.
Here’s the catch: the reported profitability was depressed by acquisition accounting, which pushes the trailing PE to 75x even though forward PE is 19x. Investors that are seriously relying on the payout should track leverage after the Apogee deal closes. Management committed to a net leverage ratio of two times within two to three years following the deal close. Shares have run 30.1% over the past year.
Chevron: March, June, September, December
Chevron declared its latest $1.78 quarterly payout on July 29, 2026, with a record date of August 19, 2026 and payment on September 10, 2026. That marks a step up from $1.71 in 2025 and $1.63 in 2024. Trailing 12-month payouts total $7.05, with the annualized forward at $7.12. Yield sits at 3.44%.
The Q2 report gave dividend investors what they wanted: adjusted earnings of $12 billion, or $6.06 per share, adjusted free cash flow of $15.4 billion, and debt reduction of more than $8 billion in the quarter. Net debt to cash flow from operations closed at 0.6 times. CEO Mike Wirth told the call, “Consistent with our longstanding financial priorities, we intend to reward our shareholders today tomorrow and long into the future.” The Hess assets are generating strong free cash flow, which has been roughly double the incremental dividends and accretive to shareholders on a per share basis.
Chevron shares are up 35.01% year to date and 32.22% over the past year. Forward PE is 13x.
Putting the Ladder Together
Equal-weighted, these three names blend to a yield around 4%, with concentrated exposures worth noting: tobacco regulation for Altria, biosimilar and pipeline execution for AbbVie, and commodity prices for Chevron. That mix is the reason the ladder works. When crude cracks widen, Chevron benefits. When defensive consumer names catch a bid, Altria carries the load. AbbVie sits in the middle as a healthcare hedge with a growing payout. If a three-stock stagger still feels too rough, there is another route: funds and stocks that cut a check every 30 days on their own, seven of which we lined up in a free report here: The 7 Monthly Dividend Stocks That Pay You Every 30 Days. The next event on the calendar: Chevron pays on September 10, 2026. Keep an eye on the stock and the ex-date if you want to be included in the next round.
The post 3 Rock Solid Dividend That Pay You Every Month appeared first on 24/7 Wall St..
]]>The recent personal consumption expenditures (PCE) report confirmed what most of Wall Street already suspected. The core PCE was flat month-over-month, but the headline annual inflation rate edged higher to 3.7% from 3.6%. That may not be enough to tip the scales and force the Federal Reserve to raise rates in September, but if the August jobs report and the consumer and producer price index readings due early next month come in hot, that could be the final straw. One thing is for sure: in a world of economic reports and mind-numbing data, all you have to do is visit the grocery store and check the price of meat, where two T-bone steaks now cost $40.
With the prospect of continued “sticky inflation,” at the very least for the foreseeable future, we researched which sectors fare best during persistent inflation. Energy, consumer staples, real estate, and healthcare tend to perform well during periods of inflation. Five Dividend Aristocrats are exceptionally well-equipped to withstand persistent inflation. With decades of uninterrupted dividend growth, these companies have the pricing power and hard-asset backing to pass rising input costs on to consumers.
Investors seeking defensive companies that pay substantial dividends are drawn to the Dividend Aristocrats, and with good reason. The 69 companies that made the cut for the 2026 S&P 500 Dividend Aristocrats list have increased their dividends (not just maintained the same level) for 25 consecutive years. But the requirements go even further, with the following attributes also mandatory for membership on the Dividend Aristocrats list:
- Companies must be worth at least $3 billion for each quarterly rebalancing.
- Their average daily volume must be at least $5 million in transactions for every trailing three-month period at every quarterly rebalancing date.
- They must be members of the S&P 500.
We reviewed the list and identified five companies that could perform well for investors during inflationary times, and they make sense for growth and income investors now. All are rated Buy at top Wall Street firms we cover.
Why Do We Cover the Dividend Aristocrats?
S&P 500 companies that have paid and raised dividends for 25 years or longer are the types of investments growth and income investors want to buy and hold in their portfolios for the long term. These stocks are mostly conservative, and if we see a dramatic market correction, they will likely hold up much better than volatile technology and momentum names.
AbbVie
AbbVie (NYSE:ABBV) is ranked sixth among the largest biomedical companies by revenue. This stock is one of Wall Street’s top pharmaceutical picks and an excellent choice for long-term ownership, offering a reliable 2.58% dividend yield. Few dividend stories in the market match what AbbVie has delivered since spinning off from Abbott Laboratories in 2013. The dividend has grown from $1.60 per share to a projected $6.92 in 2026, more than a fourfold increase in roughly a decade, compounding at better than 15% annually. That kind of dividend growth doesn’t just keep pace with inflation; it outpaces it.
AbbVie discovers, develops, manufactures, and sells pharmaceuticals worldwide. It offers:
- Humira, an injection for autoimmune and intestinal Behçet’s diseases and pyoderma gangrenosum
- Skyrizi to treat moderate to severe plaque psoriasis, psoriatic disease, and Crohn’s disease
- Rinvoq to treat rheumatoid and psoriatic arthritis, ankylosing spondylitis, atopic dermatitis, axial spondyloarthropathy, ulcerative colitis, and Crohn’s disease
Imbruvica for the treatment of adult patients with blood cancers; Epkinly to treat lymphoma - Elahere to treat cancer
- Venclexta/Venclyxto to treat blood cancers
It also provides:
- Facial injectables, plastics and regenerative medicine, body contouring, and skin care products
- Duopa and Duodopa to treat advanced Parkinson’s disease
- Ubrelvy for the acute treatment of migraine in adults
- Qulipta for episodic and chronic migraine
- Botox is therapeutic for depressive disorder
The company also offers Ozurdex for eye diseases, as well as Lumigan/Ganfort and Alphagan/Combigan to reduce elevated intraocular pressure in patients with open-angle glaucoma or ocular hypertension. AbbVie also offers Restasis to increase tear production, along with other eye care products.
Further, it provides:
- Mavyret/Maviret to treat chronic hepatitis C virus genotype 1-6 infection
- Creon, a pancreatic enzyme therapy
- Lupron to treat advanced prostate cancer, endometriosis, and central precocious puberty, and patients with anemia caused by uterine fibroids
- Linzess/Constella to treat irritable bowel syndrome with constipation and chronic idiopathic constipation
- Synthroid for hypothyroidism
Piper Sandler has an Overweight rating and a $303 price target.


Chevron
Chevron (NYSE:CVX) is an American multinational energy company primarily focused on oil and gas. This integrated giant is a safer option for investors looking to gain exposure to the energy sector and pays a substantial 3.44% dividend yield, which was raised by 5% earlier this year.
Chevron operates integrated energy and chemicals businesses worldwide through two segments. The Upstream segment is involved in the following:
- Exploration, development, production, and transportation of crude oil and natural gas
- Processing, liquefaction, transportation, and regasification associated with liquefied natural gas
- Transportation of crude oil through pipelines, and transportation and storage
- Marketing of natural gas, as well as operating a gas-to-liquids plant
The Downstream segment engages in:
- Refining crude oil into petroleum products
- Marketing crude oil, refined products, and lubricants
- Manufacturing and marketing renewable fuels
- Transporting crude oil and refined products by pipeline, marine vessel, motor equipment, and rail car
- Manufacturing and marketing of commodity petrochemicals, plastics for industrial uses, and fuel and lubricant additives
It also involves cash management, debt financing, insurance operations, real estate, and technology businesses.
Chevron completed its $53 billion acquisition of Hess in July 2025. The merger proceeded after a favorable arbitration ruling against Exxon over Hess’s lucrative offshore oil assets in Guyana. The purchase has strengthened an already solid balance sheet and earnings.
Bank of America has a Buy rating and a price target of $227.
PepsiCo
This top consumer staples stock reported surprisingly solid second-quarter earnings and will continue supplying goods for upcoming football tailgates and parties. PepsiCo (NASDAQ:PEP) is a global food and beverage company that pays a notable 4.16% dividend yield. The company’s low volatility (beta of 0.375) makes it a steady, defensive holding perfect while waiting for a comeback.
Its Frito-Lay North America segment offers:
- Lays and Ruffles potato chips
- Doritos, Tostitos, and Santitas tortilla chips
- Cheetos cheese-flavored snacks, branded dips
- Fritos corn chips
The Quaker Foods North America segment provides:
- Quaker Oatmeal
- Grits
- Rice cakes
- Natural granola and oat squares
- Pearl Milling mixes and syrups
- Quaker Chewy granola bars
- Cap’n Crunch cereal
- Life cereal
- Rice-A-Roni side dishes
The North America Beverages segment offers beverage concentrates, fountain syrups, and finished goods under these brands:
- Pepsi
- Gatorade
- Mountain Dew
- Diet Pepsi
- Aquafina
- Diet Mountain Dew
- Tropicana Pure Premium
- Sierra Mist
- Mug
J.P. Morgan has an Overweight rating with a $170 target price.

Procter & Gamble
Procter & Gamble (NYSE:PG) was founded more than 185 years ago as a soap and candle company. It has paid dividends to shareholders since 1891, raised them for 70 straight years, and currently pays a 2.98% dividend. The company is focused on providing branded consumer packaged goods to consumers worldwide and has operations in approximately 70 countries.
Procter & Gamble segments include:
- Beauty
- Grooming
- Health Care
- Fabric & Home Care
- Baby
- Feminine & Family Care
The company’s products are sold in approximately 180 countries and territories primarily through mass merchandisers, e-commerce, including social commerce channels, grocery stores, membership club stores, drug stores, department stores, distributors, wholesalers, specialty beauty stores, including airport duty-free stores, high-frequency stores, pharmacies, electronics stores, and professional channels. It also sells directly to individual consumers.
Procter & Gamble offers products under such brands as:
- Head & Shoulders
- Herbal Essences
- Pantene
- Rejoice
- Olay
- Old Spice
- Safeguard
- Secret
- SK-II
- Braun
- Gillette
- Venus
- Crest
- Oral-B
- Ariel
- Downy
- Gain
- Tide
- Always
- Always Discreet
- Tampax
- Bounty
Citigroup has a Buy rating and a $170 target price.


Target
This American retail corporation with a chain of discount department stores and hypermarkets has rebounded strongly this year after a difficult 2025. Target (NYSE:TGT) is a general merchandise retailer in the United States and pays a 2.68% dividend. It offers apparel for women, men, boys, girls, toddlers, infants, and newborns, as well as jewelry, accessories, and shoes. The company also offers beauty and personal care products, baby gear, cleaning supplies, paper products, and pet care products.
Target also provides:
- Dry grocery, dairy, frozen food, beverages, candy, snacks, deli, bakery, meat, and food service
- Electronics, which includes video game hardware and software
- Toys, entertainment, sporting goods, and luggage
- Furniture, lighting, storage, kitchenware, small appliances, home décor, bed, and bath
- Home Improvement
- School/office supplies
- Greeting cards, party supplies, and other seasonal merchandise
The company also sells merchandise through periodic design and creative partnerships, shop-in-shop experiences, and in-store amenities. It also sells its products through its stores and digital channels, including Target.com.
UBS has a Buy rating with a $185 price target.


The post When Inflation Is Sticky, 5 Dividend Aristocrats Are the Stocks to Own Now and Forever appeared first on 24/7 Wall St..
]]>Oil markets have spent 2026 learning an expensive lesson: barrels matter most when they suddenly disappear. The conflict with Iran and disruption of the Strait of Hormuz forced the U.S. and its allies to tap emergency inventories to keep crude flowing and limit the damage to consumers and refiners.
That strategy worked, but the bill is becoming clearer. U.S. Strategic Petroleum Reserve inventories fell another 3.7 million barrels last week to 289.7 million, their lowest level since November 1982, according to the Energy Dept.
The Emergency Cushion Is Getting Thin
The SPR has about 714 million barrels of authorized capacity, meaning today’s inventory represents roughly 41% of that total. The latest draw is part of a planned 172-million-barrel U.S. contribution to a broader International Energy Agency release. If the authorized U.S. releases are completed, inventories could fall toward 243 million barrels.
That number matters because the SPR is not simply a giant underground gas station. The Government Accountability Office found in 2026 that current effective drawdown capacity was already about 2.7 million barrels per day versus a 4.4-million-barrel design rate, with low cavern inventories contributing to some limitations. Federal law also restricts limited drawdowns below 252 million barrels.
In other words, every additional barrel removed doesn’t just shrink the inventory. It reduces the U.S.’s flexibility.
The Next Shock Could Hit Harder
Assuming the Strait of Hormuz situation normalizes, the U.S. Energy Information Administration expects Middle Eastern production to return closer to pre-conflict levels in early 2027, although it still expects about 600,000 barrels per day of disruption through the end of next year. That is the bullish case for rebuilding the buffer.
The problem is that oil has plenty of other ways to surprise investors. EIA data show the Strait of Malacca carried 23.2 million barrels per day in the first half of 2025, more than Hormuz’s 20.9 million barrels per day. Bab el-Mandeb handled 4.2 million barrels per day, while the Turkish Straits moved 3.7 million.
A major attack on Persian Gulf infrastructure, disruption in the Black Sea, another Red Sea escalation, or a hurricane shutting U.S. production and refining could therefore arrive when America’s strategic buffer is already depleted.
That’s the key investment thesis: the SPR has reduced today’s oil-price risk by increasing tomorrow’s sensitivity to supply disruptions.
Oil Producers Have the Better Setup
The U.S. is in a stronger position than it was in the 1980s because domestic production provides an important supply offset. But American production cannot instantly replace a global shipping disruption.
For investors, that makes upstream producers such as Exxon Mobil (NYSE:XOM) and Chevron (NYSE:CVX) potentially important beneficiaries if tighter physical markets push crude prices higher. The effect is even more significant if the government eventually begins rebuilding the SPR.
Refilling 200 million barrels would create a large buyer in the market. At $70 per barrel, that represents $14 billion of crude purchases. At $90, it becomes $18 billion. That is future demand sitting on the other side of today’s drawdown.
Key Takeaway
In short, the SPR did its job. Its releases helped moderate the price impact of the 2026 supply shock and supported refinery operations while global oil flows were disrupted. But investors should not mistake temporary relief for restored energy security. At 289.7 million barrels, the reserve is already at a 44-year low, while operational constraints make the remaining barrels less useful as inventory falls.
If the Strait of Hormuz normalizes, rebuilding can begin. If another major disruption arrives first, the U.S. will have fewer barrels to deploy and fewer days to buy time.
For investors, that argues for watching physical oil markets — not just headline crude prices. A thinner SPR makes supply shocks more valuable to producers, more expensive for consumers, and potentially more consequential for the broader economy.
The post America’s Strategic Petroleum Reserve Is Running on Fumes. What Happens When the Next Supply Shock Hits? appeared first on 24/7 Wall St..
]]>ExxonMobil (NYSE:XOM) and Chevron (NYSE:CVX) both reported blockbuster quarters this summer, and both raised dividends yet again in 2026. That makes this the right moment to look past a single earnings report and ask a harder question: over a full decade, which oil major has actually treated dividend investors better?
Two Very Different Quarters Under the Hood
Chevron’s Q2 was the louder headline. Revenue hit $67.20B, worldwide production reached a record 4,070 MBOED, and adjusted EPS came in at $6.06, a seventh straight beat. CEO Mike Wirth credited “disciplined investment and strong execution”, and it shows: US refinery throughput ran at 97% utilization, and downstream earnings jumped to $4.87B from $737M a year earlier.
ExxonMobil’s Q2 was quieter on the surface but arguably more impressive. The company posted industry-leading earnings of $14.5 billion and $23.6 billion in operating cash flow despite losing “approximately 10% of our upstream production” to Middle East disruption. Guyana alone contributed roughly 900,000 barrels per day, and Permian output topped 1.8 million oil equivalent barrels per day.

Ten Years of Dividend Checks, Side by Side
Now the payout question. Both companies have been quietly compounding for a decade, but the paths look different.
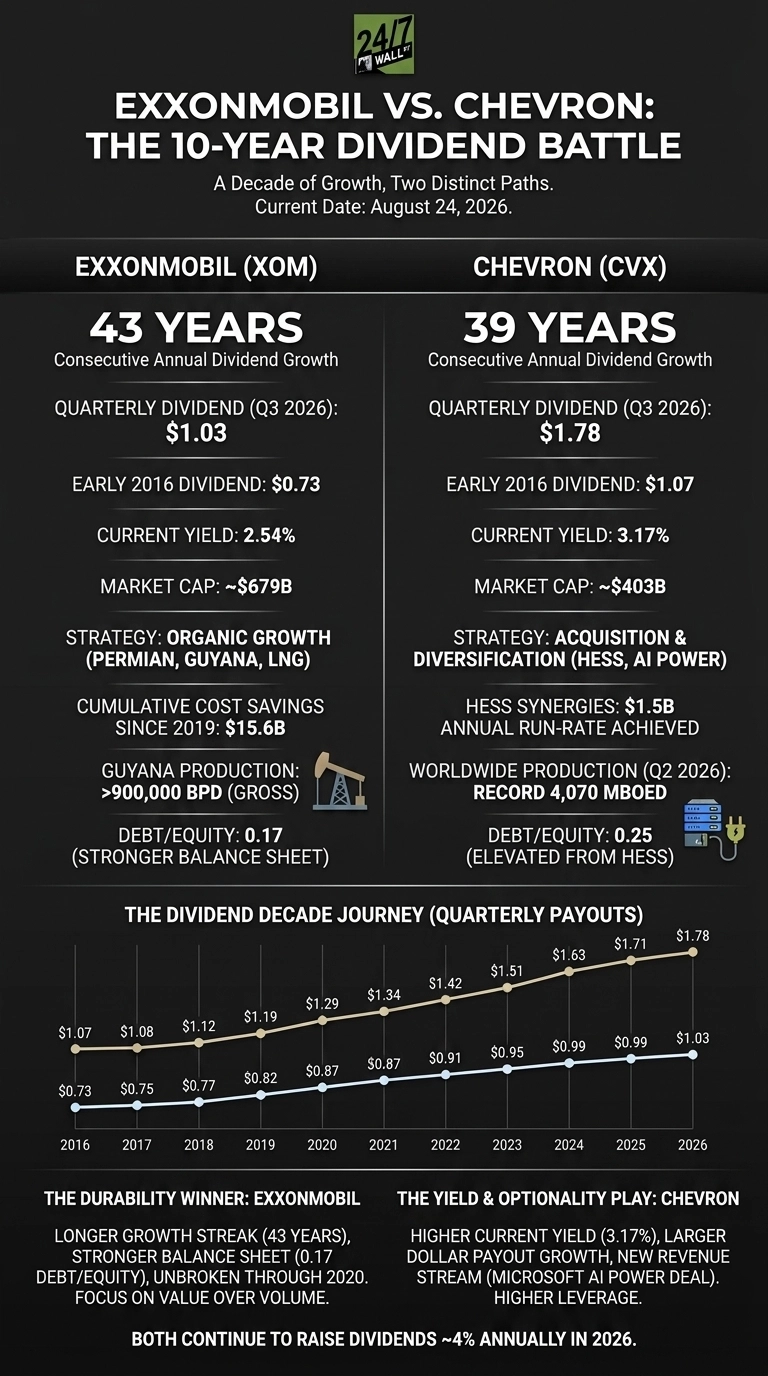
| Dividend Lens | ExxonMobil | Chevron |
| Quarterly div, early 2016 | $0.73 | $1.07 |
| Quarterly div, 2026 | $1.03 | $1.78 |
| Consecutive annual raises | 43 years | 39 years |
| Current yield | 2.46% | 3.39% |
Chevron grew its per-share payout by a larger dollar amount over the decade, and its yield today is meaningfully higher. But Exxon never blinked through the 2020 crash, when many peers cut, and now sits on 43 consecutive annual increases. On pure streak length and defensiveness, Exxon wins.
Organic Growth Vs. Buy-and-Build
The strategies funding those checks have diverged sharply. Exxon is riding organic firepower: Permian, Guyana, Golden Pass LNG, and $16.3 billion of cumulative structural cost savings since 2019. CFO Neil Hansen described Guyana as “very much an inflection into free cash flow” after full recovery of the $55 billion investment.
Chevron went the acquisition route. Hess synergies hit a $1.5 billion annual run-rate six months ahead of schedule, and Chevron cut more than $8 billion of debt in Q2 alone. Then came Project Kilby, a 20-year take-or-pay deal with Microsoft (NASDAQ:MSFT) for 2.67 gigawatts of behind-the-meter power for AI data centers. That is a genuinely new revenue stream for a Big Oil dividend.
What Decides the Next Ten Years
I will be watching whether Guyana’s cash-flow inflection lets Exxon accelerate its raises past the current roughly 4% annual pace. You should keep an eye on whether Chevron’s Microsoft deal actually clears FID later in 2026, because mid-teens returns on contracted power would change the dividend math.
Why I Give the Decade to Exxon, But Own Chevron for Yield
If someone made me pick a ten-year dividend winner based on durability, I lean Exxon. The 0.17 debt-to-equity balance sheet and unbroken streak through 2020 tell me the check keeps clearing in the ugliest markets (we ranked ten companies with the longest raise streaks by valuation in a free Dividend Kings report).
If I wanted more current income and did not mind Hess integration risk, Chevron’s 3.39% yield and Kilby optionality look more interesting. Both can work. Neither is broken. I just view them as meaningfully different investments.
The post ExxonMobil vs. Chevron: We Compared 10 Years of Dividend Growth And Here’s the Winner appeared first on 24/7 Wall St..
]]>Petrobras (NYSE:PBR) has quietly become the best-performing supermajor of 2026. The Brazilian state-controlled producer’s ADRs are up 62.64% year to date through August 20, well ahead of Exxon Mobil (NYSE:XOM) at 40.81% and Chevron (NYSE:CVX) at 38.76%. Yet the payout that made PBR a fixture in yield portfolios has shrunk sharply.
Petrobras’ trailing twelve-month distribution now stands at $0.707311 per ADS, versus roughly $1.89 across 2024’s payments. The two 2026 ex-dividend payments so far have been $0.124094 (April 24) and $0.142639 (June 3), with the next payment scheduled for September 28, 2026. The preferred ADR, Petrobras (NYSE:PBR-A), tracks the same schedule and is up 53.53% year to date.

Record First Half, Smaller Check
The 6-K filed August 20, 2026 showed a first half that any oil investor would take: revenue up 35.7% to $57.14 billion, net income attributable to shareholders up 55.3% to $16.63 billion, production up 15.1% to a record 3,281 mboed, adjusted EBITDA up 52.2% to $29.96 billion, and free cash flow of $11.51 billion. Petrobras still paid $3.74 billion in H1 shareholder dividends, but the per-share slice is down because the pie is being sliced differently.
Where the Cash Went
Two forces are absorbing the incremental cash. First, debt. Petrobras ended Q2 2026 with gross debt of $70.8 billion and net debt of $60.4 billion, and management wants gross debt steered toward $65 billion, with a $75 billion ceiling. On the Q2 call, executives said the $65 billion target was being pulled forward: “the ambition we had in our strategic planning which was supposed to take place in the end of this five-year period ending in 2030 so the idea is to bring that slightly forward”. On extraordinary dividends, they were blunt: “That’s very unlikely now because first Brent is expected to stay at the same level for quite a while.”
Second, taxes. Brazil’s new 12% crude and 50% diesel export tax under Provisional Measure No. 1,340/2026 added $1,087 million in tax expense in H1 2026, and while the regime expired in July 2026, it remains in effect pending reassessment. The controlling shareholder that sets the payout also levied the tax.
What Investors Should Watch
The Q2 earnings report was messier than the headline suggests: GAAP EPS of $0.81 missed the $1.40 consensus by 42.24% even as quarterly net income nearly doubled to $10.44 billion. With PBR trading at a forward P/E near 4 and a $22.01 analyst target, the debate for income investors is simple: capital return has been redirected to the balance sheet, and management has signaled that stance is unlikely to reverse until Brent cooperates. A double-digit trailing yield that quietly halves is exactly the pattern we mapped in a free guide to dividend trap warning signs.

The post This Oil Stock Beat Exxon and Chevron in 2026. Its Dividend Shrank appeared first on 24/7 Wall St..
]]>Brent crude traded at $95.40 a barrel in early trading this morning, up from $67.21 a year ago, after the expired US-Iran ceasefire and Strait of Hormuz disruption pushed the oil complex back into crisis mode. That matters for retirees because July CPI came in mild at a 3.4% annual rate with a 0.1% monthly gain, extending a cooling trend after annual CPI ran 4.2% in May 2026. August CPI is not published until September, so this crude spike has not yet shown up in an official inflation print. It remains a threat to the cooldown that has not yet broken the trend. The three names below convert every dollar of Brent strength into cash returns, whether the Fed likes it or not.
Chevron Turns $95 Brent Crude Into Record Cash
Chevron (NYSE:CVX) pays a quarterly dividend of $1.78 per share, raised from $1.71 and declared January 30, 2026, for a forward annualized payout of $7.12 and a current yield of 3.16%. The next check hits accounts on September 10, 2026.
Dividend safety here is the real story. Chevron generated $19.7 billion of cash flow from operations excluding working capital and $15.4 billion of adjusted free cash flow in the second quarter, while cutting debt by more than $8 billion in the quarter alone. Net debt to CFFO ended the period at 0.6 times, interest coverage sits at 13.7x, and the company reached $3 billion of structural cost reductions six months ahead of schedule. The historical dividend record is a long, steady march of quarterly hikes: $1.63 in the 2024 payments, $1.71 through 2025, and $1.78 starting with the February 2026 ex-date.
The bull case is simple. Chevron produced a record 2,077 MBOED in the US upstream and grew worldwide output by 20% year over year to 4,070 MBOED, so every $10 move on Brent lands on a much bigger production base than it did a year ago. Hess synergies of $1.5 billion have been captured within a year, and Guyana pushes high-margin barrels into the 2030s. For color, Berkshire Hathaway’s June 30, 2026 13F disclosed 84,375,856 CVX shares worth $13.99 billion, or 4.67% of the portfolio, held unchanged during the quarter. That disclosure reflects a mid-year position rather than fresh buying.
The caveat: CPC pipeline flows out of Kazakhstan and the Strait of Hormuz situation can flip from tailwind to headwind fast, and higher DD&A from the Hess deal will keep pressure on reported earnings.
Exxon Mobil Has the Balance Sheet, and the Next Raise Is Pending
Exxon Mobil (NYSE:XOM) pays a quarterly dividend of $1.03 per share, raised from $0.99 and declared October 31, 2025. All three 2026 payments have held at $1.03, so treat the next hike as still pending. Forward annualized comes to $4.12, a yield of 2.54%, with the next payment on September 10, 2026.
The safety read is arguably the strongest in Big Oil. Exxon’s second quarter delivered industry-leading earnings of $14.5 billion, cash flow from operations of $23.6 billion, more than $17 billion of free cash flow, and a more than $7 billion reduction in net debt, all while absorbing the temporary loss of approximately 10% of upstream production from Middle East disruption. Debt to equity is 0.17, net debt to EBITDA is 0.55, and interest coverage is 56.3x. Cumulative structural cost savings hit $16.3 billion since 2019. The dividend history moved from $0.95 across 2024, to $0.99 in early 2025, to $1.03 starting with the November 2025 ex-date. CEO Darren Woods told investors this is a “fundamentally stronger company than it was just a few years ago.”
The bull case for retirees is that Exxon has decoupled cash returns from crude prices. It returned more than $9 billion to shareholders through dividends and share repurchases in the quarter, is executing a $20 billion share repurchase plan for 2026, and just achieved a Guyana milestone that management called an inflection: Neil Hansen told analysts “we’ve fully recovered the $55 billion of investment along with all the operating costs” and projected two times the level of free cash flow in 2030 than we saw in 2025. Permian output hit a record 1.8 million oil equivalent barrels per day, and Golden Pass LNG Train 1 shipped its first cargo in April 2026.
The caveat: reported Q1 net income of $4.18 billion was dragged by $3.88 billion of mark-to-market timing and $706 million in Middle East disruption losses, so quarterly headlines will remain lumpy while the Strait remains contested.
Enterprise Products Partners Pays You a Toll on Every Barrel
Enterprise Products Partners (NYSE:EPD) declared a quarterly distribution of $0.56 per unit, raised from $0.55 on July 7, 2026, for a forward annualized payout of $2.24 per unit. At a unit price near $38.20, that is a high-yield income stream backed by fee-based midstream volumes rather than crude prices themselves. One important structural note for retirement accounts: EPD is a master limited partnership that pays distributions, issues a Schedule K-1 rather than a 1099, and can generate unrelated business taxable income (UBTI) inside an IRA. That is not a reason to avoid it, but it belongs on the checklist before you buy it in a Roth.
Coverage is the headline safety number. Management reported record $2.8 billion of EBITDA, a 17% increase over the second quarter of last year, and adjusted cash flow from operations up 19% to a record $2.5 billion. Distribution coverage from operational distributable cash flow was 1.9x. Consolidated leverage sits at the company’s 3.0 target on a net basis, weighted average cost of debt is 4.7%, and 97% of debt is fixed rate with a 17-year weighted average life. Distributions have climbed steadily from $0.515 in early 2024 to $0.56 in July 2026.
The bull case is that Enterprise gets paid to move the barrels the world is fighting over. Pipeline volumes rose 8% year over year to 14.7 million barrels a day of oil equivalent, marine terminal volumes jumped 33%, and Permian gas processing hit 4.3 billion cubic feet a day, up 14%. The April-May demand surge added roughly $200 million in the quarter. Management returned $1.2 billion in cash distributions plus $159 million in unit buybacks, retaining $1.1 billion for growth and repurchases. Co-CEO Jim Teague said Enterprise posted “record earnings and cash flow in the second quarter of 2026.”
The caveat: growth capex is stepping up to the $3 billion area in 2027, and NGL prices still swing with the commodity cycle, so distribution growth is more likely to keep its slow-and-steady cadence than to accelerate on the oil spike.
Bottom Line for Income Investors
Chevron gives you a delivered 2026 raise, record US production, and a fortress balance sheet. Exxon gives you the strongest balance sheet in the industry, a Guyana free cash flow inflection, and a pending raise that its cash generation clearly supports. Enterprise gives you a toll booth on the entire US export machine with 1.9x coverage and a fresh distribution bump. If Brent settles in the mid-$90s, all three keep growing payouts; if oil rolls back to the $80s, coverage on all three still holds, which is exactly the point for a retiree portfolio. Building a lineup like this so you can live off the checks without selling shares is the whole exercise in our free dividend ladder guide.
The post Crude Hits $95 and Threatens the Inflation Cooldown: 3 Energy Stocks Turning the Oil Spike Into Bigger Shareholder Payouts appeared first on 24/7 Wall St..
]]>Exxon Mobil (NYSE:XOM) and Chevron (NYSE:CVX) both reported second quarter results on July 31, 2026, and the two supermajors are steering through the same tight oil market with very different playbooks.
Exxon leaned on Guyana, the Permian, and integrated refining. Chevron leaned on a freshly digested Hess deal and a new bet on powering AI data centers.
Guyana Cash Machine Meets a Hess-Powered Chevron
Exxon delivered $14.5 billion in quarterly earnings and $23.6 billion in operating cash flow even after losing roughly 10% of upstream production to disruptions.
Guyana hit 900,000 gross barrels per day, and the company said it has fully recovered its $55 billion of investment there, tipping the asset into what CFO Neil Hansen called an “inflection into free cash flow.” The Permian set another record at 1.8 million oil equivalent barrels per day, powered by 83 four-mile wells drilled year to date.
Chevron told a different story: scale bought and quickly monetized. Global upstream grew more than 5% quarter over quarter, U.S. upstream hit a record nearly 2.1 million barrels of oil equivalent per day, and adjusted free cash flow reached $15.4 billion.
CEO Mike Wirth said the Hess integration captured “50% more synergies than initially targeted, with $1.5 billion realized six months ahead of schedule.” Debt fell by more than $8 billion in the quarter.
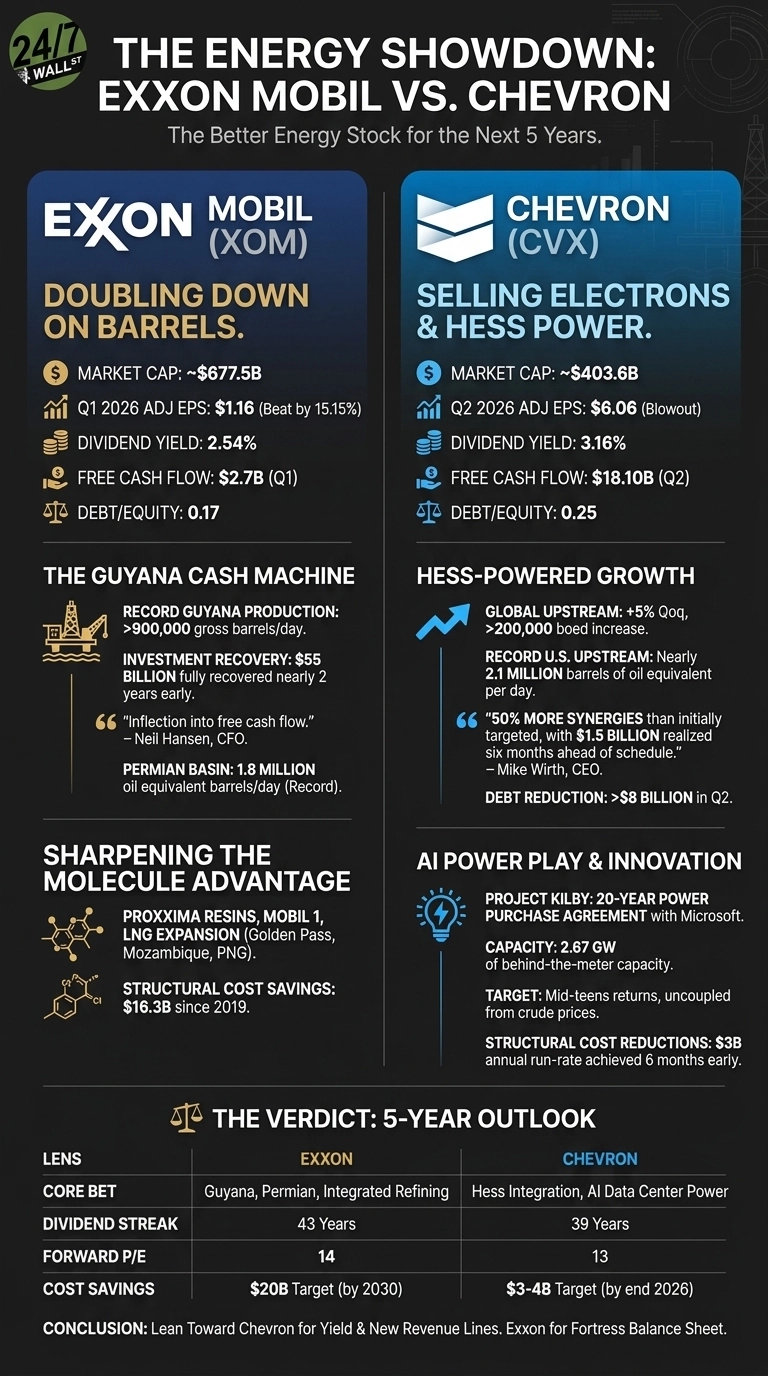
One Doubles Down on Barrels. One Sells Electrons.
| Lens | Exxon | Chevron |
| Core bet | Guyana, Permian, LNG, chemicals | Hess integration, AI data center power |
| Cost program | $16.3B saved since 2019 | $3B run-rate, hit six months early |
| Dividend yield | 2.53% | 3.44% |
| Forward P/E | 14 | 13 |
Chevron’s most eye-catching move is Project Kilby, a 20-year take-or-pay power purchase agreement with Microsoft (NASDAQ:MSFT) for 2.67 gigawatts of behind-the-meter capacity, targeting mid-teens returns uncoupled from crude prices. It is a reminder that the AI buildout runs on power as much as silicon, and we pulled together seven non-chipmaker suppliers riding that same wave in a free report here.
Exxon is going the opposite direction, sharpening its molecule advantage through Proxxima resins, Mobil 1, and expanded LNG at Golden Pass, Mozambique, and Papua New Guinea.
Next Test: Guyana Cash and Kilby Returns
I will be watching whether Exxon’s Guyana free cash flow really doubles by 2030 versus 2025, as management promised. That is the linchpin of the buyback story behind the $20 billion repurchase plan.
For Chevron, the tell will be Project Kilby’s final investment decision later this year and whether Iraq’s West Qurna II converts into competitive terms. CPC pipeline exposure and OPEC+ discipline sit uncomfortably in the background of both stories.
Why I Lean Toward Chevron for the Next Five Years
Both stocks have run hard. XOM is up 57.79% over the past year; CVX is up 40.68%. If you want the fortress balance sheet, a 43-year dividend streak, and the deepest well of long-cycle projects, Exxon is the cleaner choice. Its integrated chemical and specialty margins give it ballast that Chevron simply cannot match today.
Personally, I lean toward Chevron for the next five years. The Hess synergies are landing faster than promised, the Microsoft power deal opens a genuinely new revenue line, and the 3.44% yield pays me to wait.
My view flips if Brent collapses back below $70 and Kilby slips, because Chevron carries higher post-Hess leverage. CVX fits a yield-focused profile; XOM fits investors prioritizing the sturdier compounder.
The post Chevron vs. Exxon Mobil: The Better Energy Stock for the Next 5 Years appeared first on 24/7 Wall St..
]]>Dividend investors have had plenty to cheer in 2026. Pfizer (NYSE:PFE) is up 19.3% year to date, Chevron (NYSE:CVX) has surged 38.76%, and AbbVie (NYSE:ABBV) has added 19.16%.
With all three throwing off healthy yields and beating estimates, I want to lay out how Pfizer could reach $35, Chevron $250, and AbbVie $325 in 2027.
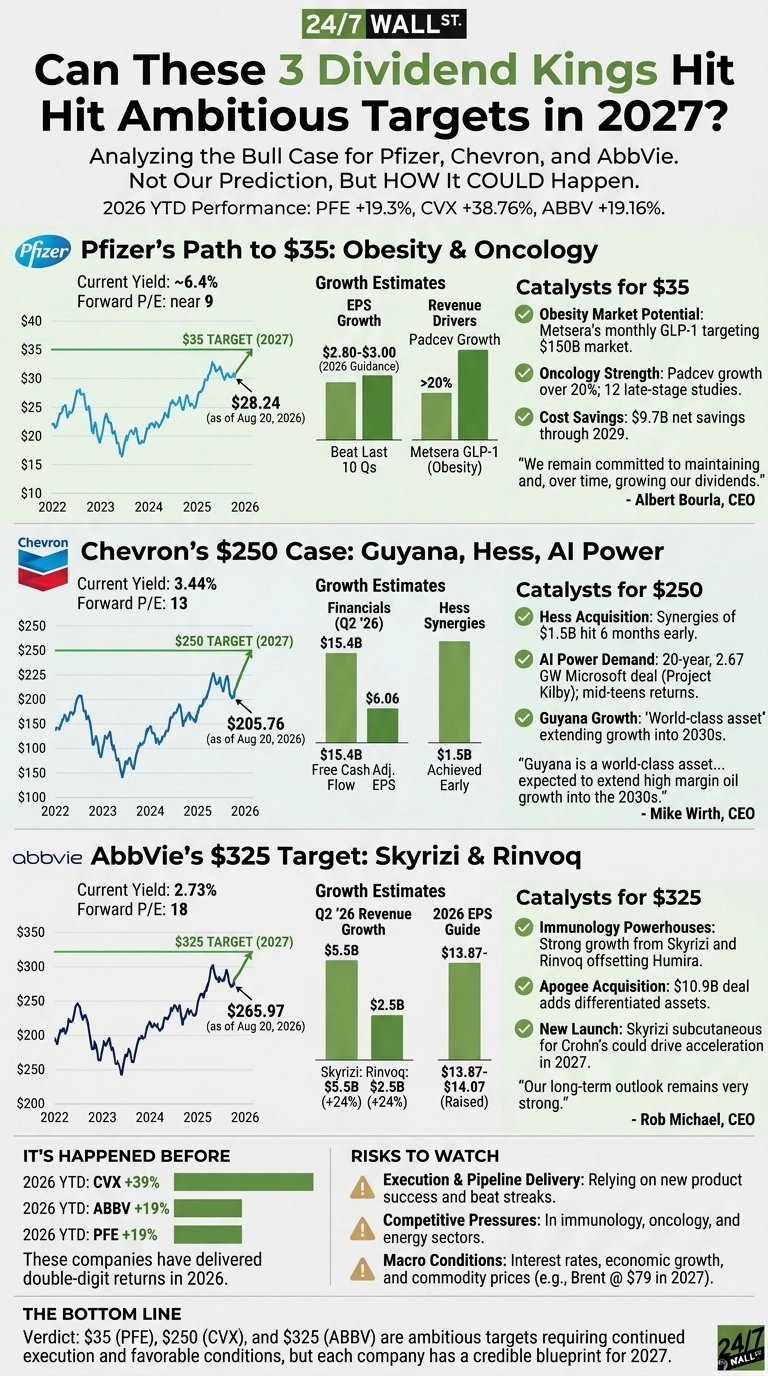
Pfizer’s Path to $35 Runs Through Obesity and Oncology
Pfizer trades at a forward P/E near 9 while paying a $1.72 annualized dividend yielding roughly 6.4%. At $35, shares would still trade under 12x the midpoint of 2026 guidance of $2.80 to $3. CEO Albert Bourla told investors, “we remain committed to maintaining and, over time, growing our dividends.”
Pfizer has beaten EPS expectations in all ten of the last ten quarters. Catalysts for a re-rating include Metsera’s monthly GLP-1 targeting a $150 billion obesity market, Padcev growth over 20%, and $9.7 billion in cost savings through 2029.

Chevron’s $250 Case Rests on Guyana, Hess, and AI Power
Chevron just delivered $6.06 in adjusted Q2 EPS and $15.4 billion in free cash flow, with debt cut by more than $8 billion. The $7.12 annualized dividend is comfortably covered. At forward P/E of 13, $250 would push the multiple toward 16, reasonable given Hess synergies of $1.5 billion hit six months early.
The Microsoft 20-year, 2.67 gigawatt Project Kilby offers mid-teens returns uncorrelated to oil. CEO Mike Wirth described Guyana as a “world-class asset” extending growth into the 2030s. EIA sees Brent averaging $79/b in 2027, a headwind Chevron has already stress-tested.
AbbVie’s $325 Target Hinges on Skyrizi and Rinvoq
AbbVie posted Q2 revenue of nearly $17 billion, up 10.2%, with Skyrizi at $5.5 billion (+24%) and Rinvoq topping $2.5 billion (+23.7%). Management raised full-year EPS to $13.87 to $14.07. On forward P/E of 18, $325 implies roughly 23x, in line with the S&P 500. Piper Sandler raised the firm’s price target on AbbVie to $303 from $298 and keeps an Overweight rating on the shares.
CEO Rob Michael said AbbVie’s “long-term outlook remains very strong.” The $10.9 billion Apogee deal and Skyrizi subcutaneous Crohn’s launch could “drive a meaningful acceleration” in 2027. The $6.92 annualized dividend keeps growing, up from $1.64 quarterly in 2025 to $1.73 today.

Bottom Line on Three Dividend Bull Cases
Wall Street’s consensus targets sit at $28.61 for Pfizer, $216.83 for Chevron, and $276.41 for AbbVie. My stretch targets of $35, $250, and $325 require beat streaks to continue, pipelines to deliver, and macro conditions to cooperate.
Returns like these carry execution risk each year, yet each name has laid out a credible blueprint for 2027 (for investors who want the longest-running dividend growers screened by valuation, we ranked ten of them in a free Dividend Kings report).
The post Dividend Giants Pfizer, Chevron, AbbVie: Bold 2027 Price Targets Ahead appeared first on 24/7 Wall St..
]]>
Oil has become one of the clearest financial beneficiaries of the Iran war — and one of the biggest headaches for American drivers. The Strait of Hormuz, a critical artery for global energy shipments, remains effectively closed, with little tanker traffic moving through the waterway.
West Texas Intermediate (WTI) crude is above $82 a barrel and Brent is above $88, compared with roughly $73 Brent before the war. The result has been a windfall for Big Oil. Bloomberg reported in July that combined earnings for the five supermajors were on track to be the third-highest in history, while several companies have already reported profits more than double a year ago.
Exxon And Chevron Are Already Cashing In
Exxon Mobil (NYSE:XOM) reported $14.5 billion of second-quarter profit, up from $7.1 billion a year earlier. Chevron (NYSE:CVX) reported $12.1 billion, compared with $3.1 billion. Together, they generated roughly $26.6 billion in quarterly earnings.
Both companies are integrated — meaning they produce crude, refine it into gasoline and diesel, and market those products. That matters when a geopolitical shock disrupts the entire energy chain.
Chevron’s upstream earnings jumped to $8.2 billion, while downstream earnings reached $4.9 billion. Exxon generated $17.2 billion of free cash flow and returned $9.4 billion to shareholders through dividends and buybacks.
Their stocks reflect that strength, with Exxon and Chevron both up 33% year-to-date. Neither, though, is at its March peak, leaving room for further gains if crude prices remain elevated.
War Escalation Could Raise Gas Prices Further
Trump has repeatedly accused oil companies of gouging consumers, singling out Exxon, Chevron, BP (NYSE:BP), and Shell (NYSE:SHEL), and demanding lower prices. In June, he said gasoline should be $2.25 a gallon and ordered a Justice Department investigation into potential price gouging.
However, Exxon and Chevron don’t simply choose the price posted at every gas station. Local competition, regional supply, refining margins, transportation costs, and crude prices all influence what motorists pay.
AAA’s national average was about $4.06 a gallon this morning, versus $3.98 a month earlier and $3.11 a year ago. Gasoline had been below $3 before the Iran war began. Notably, widening the war could make Trump’s price problem worse.
Trump has repeatedly extended the truce to give negotiations with Iran more time. Yet Iran continues threatening shipping through Hormuz, and Reuters reported today that Tehran is considering a shift to a “fully offensive” posture if diplomacy fails.
Now Trump has threatened to bomb Oman if it “gets in the way” of peace talks. Oman is a U.S. ally and has been mediating between Washington and Tehran.
The Bigger Risk For Investors
An attack on Oman would introduce another Middle Eastern country into the conflict. If other Gulf states that have so far remained outside the fighting begin choosing sides, the market could price an even larger supply disruption.
That would be bullish for Exxon and Chevron’s upstream businesses and potentially their refining operations. But investors shouldn’t assume every additional $10 in crude translates directly into another $10 billion of profit. Demand can weaken, refining margins can reverse, and a peace deal reopening Hormuz could send oil prices sharply lower. Brent crude is already well below its $126 wartime peak.
Key Takeaway
In short, Exxon and Chevron are unusually well positioned for a prolonged oil shock because their integrated businesses can capture profits from production through refining and marketing. Another escalation could push quarterly earnings above their already massive Q2 totals — but investors shouldn’t chase the stocks solely on the prospect of war.
The better thesis is that Exxon and Chevron have demonstrated they can convert elevated crude and refining margins into billions of dollars of cash. If Hormuz remains closed, that cash machine could keep running. If peace finally reopens the strait, the windfall can disappear almost as quickly as it arrived.
The post Oil Profits Have More Than Doubled. Here’s What Trump Escalating the Iran War Could Mean for XOM and CVX appeared first on 24/7 Wall St..
]]>The Wall Street Journal published a report today, Monday, August 17, 2026, titled “Iran’s Secret Plan to Escalate the War,” the same day the 60-day US-Iran memorandum of understanding signed in June expires with no follow-on deal in sight. For investors, the question is narrower: if the ceasefire framework is dead and the Strait of Hormuz has effectively stopped moving cargo, why aren’t oil equities rising on the news?
The WSJ report, based on Arab and Iranian sources, alleges that hardline elements in Iran’s leadership treated the June memorandum as preparation for future conflict and reportedly decided to violate it from the moment it was signed. According to the report, the hardliners gave the Islamic Revolutionary Guard Corps greater authority over Iran’s military, appointed veteran Iran-Iraq War commanders to senior posts, and accelerated missile and UAV production. US officials reportedly warned Gulf countries, particularly Kuwait, that Iran was preparing to strike in “enemy territory.”
The Strait Has Effectively Stopped
Kpler data cited by Reuters and CNBC shows the mechanism. Only five cargo ships passed through the Strait of Hormuz on Saturday, versus 31 the previous weekend, and no ships were registered to pass on Sunday. Shipping is down 90% since the war began February 28, 2026. The Strait normally averages about 130 vessel transits per day and carries about one fifth of the world’s oil. Yet Monday morning, per CNBC, Brent crude futures traded at $88.45 per barrel, down 0.15%, and WTI at $81.79, down 0.74%. Reuters reported the near-term potential for gains is seen as limited amid the stalemate. The muted crude reaction is itself the story.
The Majors and the War Premium
At Friday’s close, Exxon Mobil (NYSE:XOM) sat at $160.10, up 34.83% year to date and 53.82% over the past year. Chevron (NYSE:CVX) closed at $200.00, up 33.71% year to date, and Occidental Petroleum (NYSE:OXY) at $58.36, up 43.27% year to date. Exxon CEO Darren Woods told analysts the company absorbed “the temporary loss of approximately 10% of our upstream production” from the Middle East conflict.
The war premium moves violently in both directions. WTI peaked at $114.58 on April 7, 2026, fell to $69.60 by July 6, rebounded to $93.08 on July 23, dropped to $76.78 on August 5, and stood at $84.77 on August 11.
Exxon’s Valuation Tension
Wall Street’s consensus target of $168.55 sits above Friday’s close, but the ratings mix, 3 strong buy, 7 buy, 14 hold, 1 sell, tilts to holds. Our proprietary model rates XOM a HOLD with a base case of $138.68, citing roughly 13% overvaluation. Forward EPS of $7.07 implies a P/E around 25 on a $658.3 billion market cap.
The Tanker Trade
Frontline (NYSE:FRO) closed Friday at $41.21, up 102.93% year to date and 143.50% over the past year. DHT Holdings (NYSE:DHT) closed at $19.52, up 69.65% year to date. Both posted far larger year-to-date gains than the three majors. Tankers benefit directly from rerouting and higher freight rates.
A caveat on DHT: the latest quarterly dividend was $1.22, versus $0.24 in the same quarter of 2025, and the company pays 100% of ordinary net income. That payout structure means the yield falls when VLCC spot rates fall, not a fixed coupon.
Insurance and the Close
Per The National, citing Marsh broker Marcus Baker, war-risk premiums on tanker hull value rose from a pre-war baseline of about 0.25% of hull value to roughly 3% to 10% now. Insurers collect; operators absorb. HSBC’s Parash Jain told CNBC’s Squawk Box Europe Monday that investors should treat “chaos is the norm” as the base assumption. Watch Kpler’s Strait transit count over the next two weeks and whether Qatar and Pakistan, the current message-carriers, produce anything resembling resumed negotiation.
The post Here’s What “Iran’s Secret Plan To Escalate The War” Means For Oil Stocks appeared first on 24/7 Wall St..
]]>Brian, a caller from Pennsylvania, phoned in to Mad Money on August 13, 2026 with a stock his son had been researching. “My son has been following a stock that has over a 7% dividend yield, and they’ve historically raised the dividend every quarter,” he told Jim Cramer, before asking whether he should build a position in Hess Midstream (NYSE:HESM). Cramer’s verdict landed quickly: “I happen to like Hess Midstream. I happen to like the midstreams, especially Hess… I think you have a winner.”
The Caller’s Case
Brian built his question around two claims. The first was the yield: over 7%, as he described it on air. The second was more striking: Brian said the company had “historically raised the dividend every quarter.” That assertion about a partnership public since 2017 holds up cleanly when checked against the record. Brian also flagged something Cramer glossed past: “Chevron happens to make up about 3.5% of my portfolio.”
What the Distribution Record Actually Shows
Hess Midstream pays quarterly distributions, and the dataset contains 37 records going back to 2017. Every payment in that series is larger than the one before it. There is no cut and no flat quarter anywhere in the progression, which runs from $0.2703 in 2017 to $0.7888 today. That works out to an average annual growth rate of roughly 11% over nine years, which puts the consistency of the streak in sharper relief.
The most recent distribution was declared July 27, 2026, went ex-dividend on August 6, 2026, and was paid on August 14, 2026, at $0.7888 per share. The prior payout was $0.7792. Trailing twelve-month distributions total $3.0869, and the annualized forward figure sits at $3.1552. On the Q2 2026 earnings call, CEO Jonathan Stein reiterated a “targeted 5% annual distribution growth, which we expect to continue.” Past distribution growth does not guarantee future distributions.
The Q2 2026 Numbers Behind the Story
Hess Midstream’s second-quarter 2026 results gave income-focused holders a fresh look at the underlying finances. Net income came in at $173.7 million, with $96.4 million attributable to Class A shareholders, or $0.75 basic earnings per share. Adjusted EBITDA reached $314 million, producing a gross adjusted EBITDA margin of roughly 85%, well above the company’s stated 75% target. Revenue of $399 million slipped about 4% from $414 million a year earlier, as lower Bakken throughput from reduced new-well activity and planned maintenance at the Tioga Gas Plant offset higher tariff rates and growing third-party services.
Management kept its full-year 2026 guidance unchanged: adjusted EBITDA of $1.225 billion to $1.275 billion and adjusted free cash flow of $910 million to $960 million, which the company says represents roughly 20% growth at the midpoint from the prior year. Excess cash after distributions is targeted toward share repurchases and debt reduction, with leverage expected to decline from roughly 3 times toward 2.5 times by 2028.
Cramer’s Answer and the Chevron Link
Cramer stated a preference for the midstream category and for Hess Midstream in particular. He also connected the dots on the customer relationship: “Hess was bought by Chevron, which is why they had the related Chevron.”
Chevron (NYSE:CVX) closed its acquisition of Hess Corporation on July 18, 2025, in an all-stock deal valued at approximately $48 billion. Hess Midstream is a separate, publicly traded partnership that was not itself acquired. Its anchor customer is Hess Corporation, now a Chevron subsidiary, which holds an approximately 38% ownership interest in Hess Midstream as part of that transaction. One year after the close, Chevron CFO Eimear Bonner said on CNBC that the company is “fully integrated” and had already realized $1.5 billion in synergies, 50% more than initially targeted and six months ahead of schedule.
Midstream operators handle gathering, processing, transportation and storage of oil and gas rather than drilling for it, and revenue typically comes from fee-based contracts with producers. That fee-based structure is central to why these partnerships attract income-focused holders: cash flows are relatively predictable even when commodity prices move. The flip side, visible in Q2’s revenue dip, is that throughput volumes depend directly on how much the anchor customer drills.
The Question Cramer Did Not Answer
Brian effectively asked two questions on that call, and Cramer answered the one about the stock. The other was buried in the setup: he already holds Chevron at about 3.5% of his portfolio, and he is considering adding a company whose principal customer relationship runs through Chevron. As Hess Midstream itself noted in its Q2 2026 filings, its results depend materially on Chevron’s drilling plans, nominated volumes, and ability to meet its contractual obligations to the partnership.
A reader in a similar position might reasonably think about what that stacking looks like. Both names sit in energy. Both depend, to different degrees, on Chevron’s Bakken development pace and capital allocation choices. This is a consideration to weigh, not a criticism of Cramer’s view on the stock itself and not advice on what any particular investor should do.
Where the Stock Stands
Hess Midstream closed on August 13, 2026 at $39.78, down 0.75% on the day. The units were up 22.58% year to date from $32.45 at the end of 2025, up 2.62% over the prior year from $38.77 on August 13, 2025, and up 137.7% over five years from $16.74 on August 13, 2021. Market capitalization sits at approximately $5.14 billion.
The Kicker
A distribution record that runs uninterrupted across 37 quarterly payments, with every payment larger than the one before, is unusual in any corner of the market. That is the part of Brian’s case that stands on its own regardless of whose verdict you find persuasive, and it is the part any prospective holder can verify without taking anyone’s word for it. This article is informational and not a recommendation on either stock.
Editor’s note: This update adds Hess Midstream’s Q2 2026 financial results (net income of $173.7 million, adjusted EBITDA of $314 million, and full-year guidance of $910 million to $960 million in free cash flow), the confirmed close date and purchase price of Chevron’s acquisition of Hess Corporation, Chevron’s approximately 38% ownership stake in Hess Midstream, and the one-year integration milestone of $1.5 billion in realized synergies. The nine-year average annual distribution growth rate of roughly 11% was also added to contextualize the 37-quarter streak.
The post “I Think You Have a Winner” Cramer Excited About Hess Midstream’s 7% Dividend Yield appeared first on 24/7 Wall St..
]]>The iShares Core High Dividend ETF (NYSEARCA:HDV) leans hard on two sectors to fund its payout. Energy and pharma names account for the top four holdings, combining for 25.96% of net assets. With HDV up 19.66% year-to-date and yielding roughly 3%, I want to know whether the checks these four giants send to BlackRock are actually safe.
The Four Dividends Powering HDV
| Holding | Weight | Yield | Streak |
|---|---|---|---|
| Exxon Mobil (NYSE:XOM) | 8.42% | 2.65% | 43 yrs |
| Chevron (NYSE:CVX) | 6.42% | 3.67% | 38+ yrs |
| Johnson & Johnson (NYSE:JNJ) | 5.68% | 2.06% | 64 yrs (King) |
| AbbVie (NYSE:ABBV) | 5.44% | 2.80% | 13 yrs standalone |
Exxon: The Cleanest Balance Sheet in the Group
Chevron: Hess Cash Flow Reset the Math
Johnson & Johnson: The Dividend King Earns Its Crown
AbbVie: Growing but Leveraged
The Verdict on HDV’s Income Engine
The post The Energy and Pharma Giants Quietly Funding HDV’s 3% Yield, and How Safe Each One Is appeared first on 24/7 Wall St..
]]>Oil has come alive again in 2026. Brent crude spiked to $138 per barrel on April 7 during the Strait of Hormuz disruption, retraced to the high $60s in early July, and now sits near $89. That volatility has fueled the U.S. majors.
Chevron (NYSE:CVX) is up 24.73% year-to-date, Exxon Mobil (NYSE:XOM) has advanced 28.88%, and Occidental Petroleum (NYSE:OXY) leads the group at 37.26%. Here is the path to CVX at $225, XOM at $180, and OXY at $75 in the year ahead.
Why Wall Street Is Warming Up to Oil Majors
All three companies are beating expectations. Chevron posted seven consecutive quarterly EPS beats, with Q2 2026 adjusted EPS of $6.06 on revenue of $67.20 billion (+51.4% YoY). CEO Mike Wirth credited “disciplined investment and strong execution that drove record U.S. upstream production, record crude throughput in our U.S. refineries, and exceptional reliability across key assets.”
Exxon has strung together 4 consecutive EPS beats, and CEO Darren Woods says the company is “fundamentally stronger” after growing advantaged volumes in Guyana and the Permian. Occidental claims five straight beats, capped by a 29.8% Q2 EPS surprise at $2.40.
The Path to $225, $180, and $75
Chevron at $186.56 needs roughly 21% to hit $225. Exxon at $153.04 needs about 18% to reach $180. Occidental at $55.91 requires roughly 34% to $75.
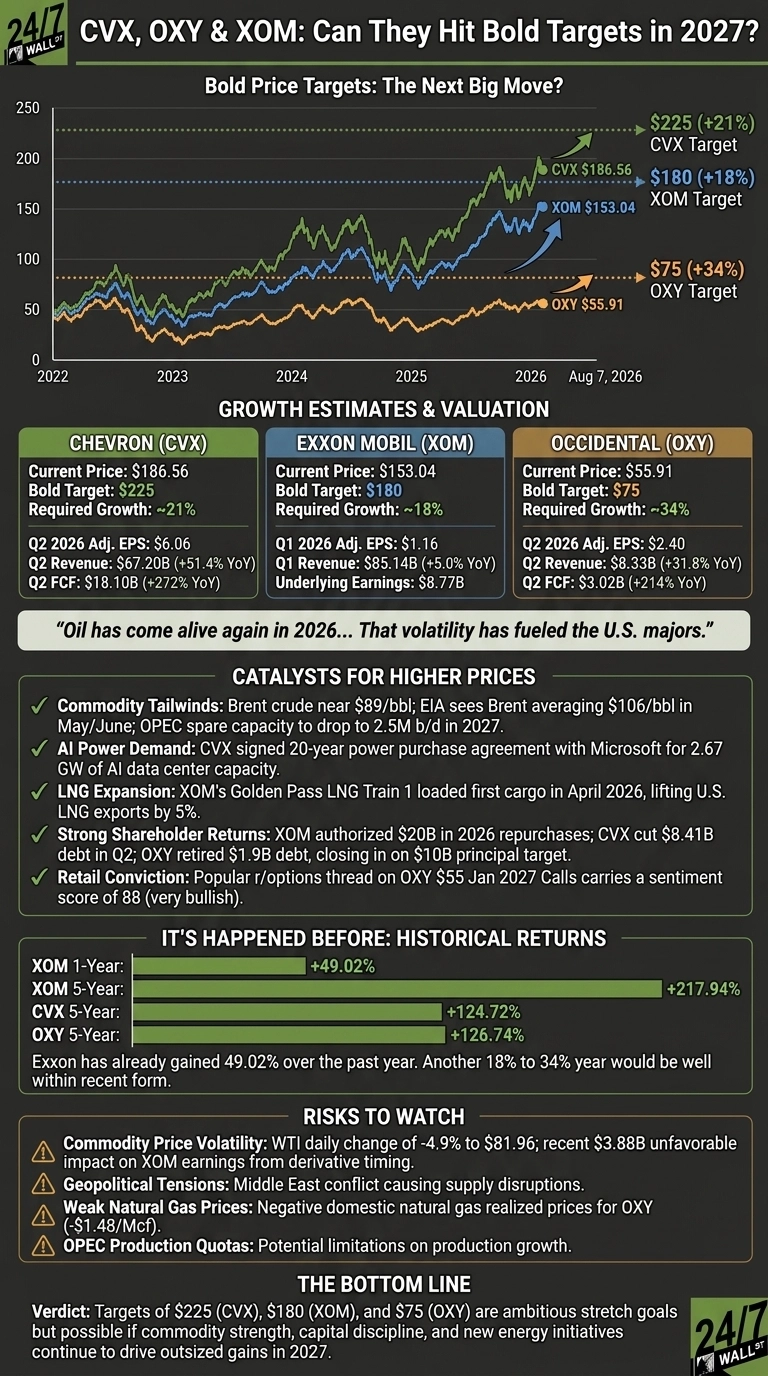
At $180, Exxon would trade near 27x its full-year 2025 EPS of $6.70, close to the S&P 500 average, before factoring in 2026 growth. Occidental at $75 would sit near 15x its forward EPS of $4.85, hardly demanding given the deleveraging story. Chevron’s Q2 run-rate annualizes above $24 in EPS, keeping $225 in normal multiple territory.
What Could Push These Stocks Higher
- Commodity tailwinds. The EIA sees Brent averaging $106 per barrel in May and June and warns OPEC spare capacity will drop to 2.5 million b/d in 2027 after the UAE’s departure.
- AI power demand. Chevron signed a 20-year power purchase agreement with Microsoft (NASDAQ:MSFT) for 2.67 GW of dedicated capacity in West Texas.
- LNG expansion. Exxon’s Golden Pass LNG Train 1 loaded its first cargo in April 2026, lifting U.S. LNG exports by 5%.
- Buybacks and deleveraging. Exxon authorized $20 billion in 2026 repurchases. Chevron cut $8.41 billion of debt in a single quarter. Occidental retired $1.9 billion and is closing in on its $10 billion principal target.
- Retail conviction. One popular r/options thread, “Oil is going to $150+ OXY $55 Jan 15th 2027 Calls,” carries a sentiment score of 88 (very bullish).

History Says These Moves Are Possible
Exxon has already gained 49.02% over the past year and 217.94% over five years. Chevron is up 124.72% over five years, and Occidental has climbed 126.74% in the same span. Another 18% to 34% year would be well within recent form.
The Bottom Line on the Bull Case
Chevron’s $18.10 billion in Q2 free cash flow, Exxon’s $15.60 billion in structural cost savings since 2019, and Occidental’s aggressive deleveraging support higher multiples.
Risks remain (OPEC quotas, weak U.S. natural gas prices, and Middle East supply shocks), but with Brent structurally supported and buybacks running hot, $225 for CVX, $180 for XOM, and $75 for OXY are stretch goals worth watching. Returns at this level should not be expected every year, but we have outlined the blueprint for how this trio could see outsized gains in 2027.
The post CVX, OXY & XOM: The Next Big Move in Oil Could Be Just Getting Started appeared first on 24/7 Wall St..
]]>
The Strait of Hormuz is one of the world’s biggest energy vulnerabilities. Roughly 20 million barrels of petroleum liquids — about 20% of global consumption — passed through the waterway in 2024, according to the U.S. Energy Information Administration. That makes the strait more than a shipping lane. It gives Iran a relatively inexpensive way to threaten a huge portion of the world’s oil supply.
Treasury Secretary Scott Bessent says Washington wants to change that equation, calling the strait potentially “irrelevant” within two years as more oil moves through pipelines. For Chevron (NYSE:CVX), that’s more than a geopolitical talking point. The company is already involved in studying one of those potential escape routes: a pipeline connecting Iraq’s oil network to Syria’s Mediterranean coast.
The Goal Is Bigger Than Iraqi Oil
Iraq’s Haditha-Baniyas pipeline is important because it illustrates the broader idea: move oil overland to export terminals outside the Persian Gulf rather than forcing every barrel through Hormuz.
The proposed route would connect Iraq’s oil network at Haditha with Syria’s Mediterranean port of Baniyas. It is closely related to the historic Kirkuk-Baniyas corridor, which once transported Iraqi crude through Syria to the Mediterranean. However, the current proposal is not simply a restoration of the old pipeline.
More importantly, Iraq is only one piece of the puzzle. The EIA estimates Saudi Arabia and the United Arab Emirates have about 4.7 million barrels per day of unused pipeline capacity that can bypass Hormuz. That’s nowhere near the roughly 20 million barrels per day that crossed the strait in 2024, which explains why Washington cannot make Hormuz irrelevant with one pipeline project. It needs a network.
Why That Matters to Chevron
That’s where Chevron gets interesting. The oil giant is participating in studies for the Haditha-Baniyas project alongside Iraq and Syria. If the project eventually moves from feasibility studies to construction, the company could gain a role in developing infrastructure connecting Middle Eastern oil to Mediterranean markets.
But the bigger investment thesis is strategic. Every barrel that can reach a Mediterranean or Red Sea terminal without passing through Hormuz reduces the amount of traffic that has to be protected in the strait. That potentially reduces the military burden of keeping the waterway open — particularly important after a prolonged conflict has consumed precision missiles and air-defense interceptors.
The U.S. military has reportedly depleted large portions of several missile inventories during the Iran war and after years of supporting Ukraine. Rebuilding those inventories will take money, production capacity, and time.
That creates a second reason for Washington to favor infrastructure over perpetual military protection: a pipeline is a permanent piece of energy infrastructure, while interceptors are one-time expenditures.
The Pipeline Has Its Own Weaknesses
Granted, pipelines aren’t invulnerable. Iran and other regional adversaries have shown they can readily attack fixed infrastructure with missiles and drones. A pipeline running through Iraq and Syria could become a tempting target precisely because it cannot move out of harm’s way.
But the risk is different. A damaged pipeline is a localized infrastructure problem. A threatened Strait of Hormuz can become a global shipping and energy problem affecting millions of barrels per day. That asymmetry is the point.
For Chevron, meanwhile, the opportunity doesn’t depend entirely on this one project. The company generated $33.9 billion of operating cash flow and $20.2 billion of adjusted free cash flow in 2025, while returning $27.1 billion to shareholders.
The pipeline opportunity would therefore sit on top of an already cash-generating energy business rather than determine its entire investment case.
Key Takeaway
In short, Bessent’s “irrelevant” comment shouldn’t be interpreted as a plan to replace Hormuz with the Haditha-Baniyas pipeline. The objective is much larger: build enough alternative energy infrastructure that Iran can no longer hold the global oil market hostage simply by threatening one narrow waterway.
Chevron’s involvement in Haditha-Baniyas gives investors a tangible example of what that transition could look like. The project remains preliminary, and pipelines through conflict zones carry obvious risks. But if Washington is genuinely shifting from defending Hormuz indefinitely to building around it, Chevron deserves a place on investors’ watch lists.
The most interesting part isn’t the Iraqi oil. It’s the infrastructure required to make the world’s most important oil chokepoint matter less.
The post Scott Bessent Calls the Strait of Hormuz “Irrelevant.” Chevron Shows Exactly How It Happens appeared first on 24/7 Wall St..
]]>Fifty thousand dollars a month in dividend income means $600,000 a year flowing into a brokerage account without selling a share. That target sits well above what the average American household spends. The Bureau of Labor Statistics puts annual consumer expenditures at $78,535 for 2024. So this is generational-wealth territory, and the capital required varies dramatically depending on the yield an investor is willing to chase.
The math is simple. Income divided by yield equals capital. The tradeoffs are what separate a portfolio that funds a lifestyle for forty years from one that pays high current income while quietly eroding.
The Conservative Tier: 3% to 4% Yield
At a blended 3.5% yield, hitting $600,000 in annual dividends requires roughly $17.14 million in capital. That is the price of buying the safest, longest-tenured dividend growers on the market.
Johnson & Johnson (NYSE:JNJ) fits here. The stock trades near $257, carries a 2% yield, and has raised its payout for 64 consecutive years. The quarterly dividend was lifted from $1.30 to $1.34 earlier this year. CEO Joaquin Duato said “Johnson & Johnson had a strong start to 2026 and is delivering on its promise for a year of accelerated growth”.
Procter & Gamble (NYSE:PG) yields 2.9% with 70 consecutive years of dividend increases and plans for roughly $10 billion in dividends in fiscal 2027. Coca-Cola (NYSE:KO) yields 2.4% and just raised its quarterly payout from $0.51 to $0.53. Chevron (NYSE:CVX) sits at the top of this tier at 3.7%, backed by a $1.78 quarterly dividend and 20% year-over-year production growth from the Hess acquisition.
The tradeoff: highest capital requirement, but the payouts grow every year, principal appreciates, and inflation risk is largely handled by the companies themselves.
The Moderate Tier: 5% to 7% Yield
At 6% yield, the capital drops to exactly $10 million. The universe shifts to REITs, telecoms, preferred shares, covered-call equity funds, and high-dividend business trusts.
Realty Income (NYSE:O) yields roughly 5%, pays monthly, and has raised its dividend for 115 consecutive quarters. The most recent monthly payment was $0.271 per share, and second-quarter revenue grew 9.7% to $1.55 billion. The REIT’s 115 consecutive quarterly increases make it a hybrid growth-plus-yield story rather than a pure high-yield play.
The tradeoff: dividend growth slows to a crawl or stops. REITs like Realty Income grow the distribution in pennies rather than percentage points. Income keeps pace with today’s bills but rarely outruns inflation over decades.
The Aggressive Tier: 8% to 14% Yield
At 12% yield, $600,000 in income requires only $5 million. That is the seductive part. The rest is the problem.
This tier lives in leveraged covered-call ETFs, business development companies, mortgage REITs, and high-yield bond funds. Some option-income ETFs currently show indicated annualized yields between 11% and 14%. Distributions here often include return of capital. Principal erodes. Payouts get cut when volatility collapses or credit spreads widen. The investor is spending down the asset, not living off its growth.
The Insight Most Retirees Miss
Lower yields usually win over decades because dividend growth compounds. Consider $17 million in a portfolio yielding 3.5% and growing the payout 7% a year. That $600,000 becomes roughly $1.2 million a year in a decade without adding a dollar. A 12%-yielding portfolio with flat or declining distributions still pays $600,000 ten years later, but often with less principal behind it.
The ten-year total returns tell the story. JNJ has returned 173%, Chevron 186%, and Coca-Cola 173%. Those are the compounders. The 10-year Treasury sits at 4.6%, which is the risk-free floor every dividend must clear on a risk-adjusted basis.
What to Do Next
- Recalculate the actual number. Household expenditures average $78,535. Fifty thousand a month may be aspirational rather than required. Model your real spending before sizing the portfolio.
- Blend the tiers. A mix of 60% conservative, 30% moderate, and 10% aggressive can produce a blended yield near 5% with meaningful dividend growth behind it. That structure needs roughly $12 million rather than $17 million or $5 million.
- Stress-test the aggressive tier. Pull ten-year total return charts for any 10%-plus yielder before buying. If price is flat or falling while yield stays high, the distribution is being funded from principal.
The post The Portfolio Blueprint for Building $50,000 a Month in Dividend Income appeared first on 24/7 Wall St..
]]>
Energy markets have spent 2026 relearning a lesson investors forget in calm years: supply chains built over four decades can unravel in four months. The Strait of Hormuz shutdown scrambled Middle East crude flows, a U.S. naval blockade briefly cut Venezuela off from the water entirely, and Washington has spent the past several months rewriting the sanctions rulebook that governs who gets to buy Venezuelan barrels.
Now the fallout is showing up in the government’s own numbers. Preliminary data from the U.S. Energy Information Administration confirms that U.S. refiners imported zero barrels of Saudi crude in July — the first time that’s happened since 1985.
The Numbers Behind the Reversal
As recently as March, U.S. refiners were buying more than 800,000 barrels of Saudi crude a day, according to the EIA. By July, that number was zero for the entire month. Occasional weekly readings have hit zero before, but a full month without a single Saudi barrel hasn’t happened in over 40 years.
Hormuz-related disruptions choked off Gulf crude flows and pushed prices on Middle East grades higher, so refiners went shopping elsewhere. Venezuela absorbed most of the difference: U.S. imports of its crude rose to roughly 600,000 barrels a day in July, up from about 100,000 barrels a day in January.
That jump coincided with Washington’s expanded access to Venezuelan oil. Following the ouster of the Maduro government, the Treasury Department authorized U.S. entities to lift, purchase, and transport Venezuelan crude, extending beyond Chevron (NYSE:CVX) to include BP (NYSE:BP), Eni (NYSE:E), Repsol, and Shell (NYSE:SHEL). The EIA said in February that it expected Venezuelan output to climb back toward its pre-blockade level of 1.1 million to 1.2 million barrels a day by mid-2026.
Who Wins From the Venezuela Pivot
Two kinds of companies benefit here, and they’re not the same trade. Refiners with the metallurgy to process Venezuela’s heavy, high-sulfur crude get cheaper feedstock and wider crack spreads. Chevron gets something rarer: a license that lets it operate inside Venezuela at all.
| Company | P/E Ratio | Dividend Yield | Venezuela/Heavy Crude Angle |
| Valero Energy (NYSE:VLO) | 12.3 | 1.6% | Gulf Coast refineries built for heavy sour crude; among refiners named as candidates to resume PDVSA purchases |
| Marathon Petroleum (NYSE:MPC) | 10.2 | 1.3% | Diversified feedstock slate limits direct Venezuela exposure |
| Phillips 66 (NYSE:PSX) | 11.6 | 2.4% | Cut Middle East crude to under 1% of slate |
| Chevron | 17.9 | 3.7% | Venezuela output near 250,000 bpd pre-restriction, cut to ~100,000 bpd last summer; negotiating with Treasury to expand its license |
Valero’s complexity — its refineries are built to run heavy, discounted crudes rather than light sweet grades — is exactly the asset class this shift rewards. Chevron’s position is different: it’s the only U.S. major with standing operations in Venezuela, and its ability to negotiate a bigger license is a regulatory catalyst, not just a commodity one. Surprisingly, that makes Chevron’s Venezuela business more of a binary political outcome than a refining-margin story.
The Risks Investors Shouldn’t Ignore
None of this is permanent, and it shouldn’t be treated as such. Kpler forecasts Saudi shipments to the U.S. rebounding to roughly 300,000 barrels a day this month — back near historical norms. Granted, that’s still down from March’s 800,000-barrel pace, but it shows how quickly a “generational shift” headline can revert once alternate trade routes are found.
Venezuela carries its own tail risk. Every barrel flowing north still depends on a sanctions license that the Treasury can amend or revoke, and PDVSA’s infrastructure spent years underinvested before the blockade. In any case, refiners leaning hard into Venezuelan crude are betting on the durability of a political decision, not just a supply contract.
Key Takeaway
The zero-Saudi-barrel month is a real data point, not a permanent state of affairs — expect Saudi volumes to partially recover if Hormuz-related disruptions ease. For investors, the more durable trade sits with refiners that can process heavy Venezuelan crude at a discount, with Valero best positioned on refining complexity and Chevron carrying the highest upside — and the highest political risk — through its Venezuela license.
Sharp investors should track Treasury’s licensing decisions as closely as EIA’s monthly import data. In this market, the regulator is setting the crude flows as much as the refiners are.
The post The U.S. Didn’t Buy a Drop of Saudi Oil in July — the First Time in 41 Years appeared first on 24/7 Wall St..
]]>After a career spanning two decades at Bear Stearns, Lehman Brothers, and Morgan Stanley, I gained an institutional perspective on dividend stock investing. My tenure at these premier Wall Street firms exposed me to fundamental analysis, credit evaluation, and risk management practices that directly translate into selecting high-quality dividend-paying companies. Having witnessed firsthand the 2008 financial crisis and its aftermath, including the collapse of Bear Stearns and Lehman Brothers, having left both firms before their respective collapses, I developed an appreciation for balance sheet strength, sustainable payout ratios, and the importance of dividends as a stabilizing force during market turbulence.
By analyzing cash flow generation, capital allocation strategies, and management quality at scale, I can identify companies with durable competitive advantages and the financial discipline to maintain and grow their dividends through economic cycles. Early in my career, I realized that dividend investing is not merely an income strategy but also a comprehensive framework for building wealth through companies that consistently return capital to shareholders while maintaining financial stability.
While much has changed since I started as a stockbroker in 1991, quality energy companies that dominate the industry and pay dependable high-yield dividends never go out of style. The big integrated giants dominated then and continue to do so, while the top midstream master limited partnerships (MLPs) still control the movement and storage of oil and gas. Five companies that investors can buy now at reasonable valuations can be stashed in a growth-and-income portfolio and held forever. All five are rated by the top Wall Street firms we cover.
Why Do We Cover High-Yield Energy, Dividend Stocks?
Since 1926, dividends have accounted for approximately 32% of the S&P 500’s total return, while capital appreciation has accounted for 68%. Therefore, sustainable dividend income and the potential for capital appreciation are essential to total return expectations. A study by Hartford Funds, in collaboration with Ned Davis Research, found that dividend stocks delivered an annualized return of 9.18% over the 50 years from 1973 to 2023. Over the same timeline, this was more than double the annualized return for non-payers (3.95%).
Chevron
Chevron (NYSE: CVX) is an American multinational energy company primarily focused on oil and gas. It is a safer option for investors looking to position themselves in the energy sector, and it pays a substantial 3.55% dividend, which was raised by 5% earlier this year. Chevron operates integrated energy and chemicals businesses worldwide through its subsidiaries.
The company operates in two segments. The Upstream segment is involved in the following:
- Exploration, development, production, and transportation of crude oil and natural gas
- Processing, liquefaction, transportation, and regasification associated with liquefied natural gas
- Transportation of crude oil through pipelines, and transportation, storage
- Marketing of natural gas, as well as operating a gas-to-liquids plant
The Downstream segment engages in:
- Refining crude oil into petroleum products
- Marketing crude oil, refined products, and lubricants
- Manufacturing and marketing renewable fuels
- Transporting crude oil and refined products by pipeline, marine vessel, motor equipment, and rail car
- Manufacturing and marketing of commodity petrochemicals, plastics for industrial uses, and fuel and lubricant additives
It also involves cash management, debt financing, insurance operations, real estate, and technology businesses.
Bank of America has a Buy rating with a $227 price target.
ConocoPhillips
The big always gets bigger, and this company completed a $22.5 billion purchase of Marathon Oil in November of 2024. This deal added high-quality assets, particularly in the Eagle Ford and Bakken shales, to the company’s portfolio. ConocoPhillips (NYSE: COP) is an exploration and production company with a rich dividend yield of 2.84%.
Its Alaska segment primarily explores for, produces, transports, and markets crude oil, natural gas, and natural gas liquids (NGLs). The Lower 48 segment covers operations in the 48 contiguous states of the United States and the Gulf of Mexico. Canadian operations consist of the Surmont oil sands development in Alberta, the liquids-rich Montney unconventional play in British Columbia, and commercial operations.
The Europe, Middle East, and North Africa segment consists of operations principally located in:
- The Norwegian sector of the North Sea
- The Norwegian Sea
- Qatar
- Libya
- Equatorial Guinea
- Commercial and terminalling operations in the United Kingdom
The Asia Pacific segment has exploration and production operations in China, Malaysia, and Australia, as well as commercial operations in China, Singapore, and Japan. The Other International segment includes interests in Colombia as well as contingencies associated with prior operations in other countries.
UBS has a Buy rating with a $143 target price.


Energy Transfer
Energy Transfer (NYSE: ET) is one of North America’s largest and most diversified midstream energy companies. This top MLP is a safe option for investors seeking energy exposure and income, as the company pays a 6.58% distribution yield. Energy Transfer owns and operates one of the largest and most diversified portfolios of energy assets in the United States, with a strategic footprint across all major domestic production basins.
The company is a publicly traded limited partnership with core operations that include:
- Complementary natural gas midstream, intrastate, and interstate transportation and storage assets
- Crude oil, NGLs, and refined product transportation and terminalling assets
- NGL fractionation
- Various acquisition and marketing assets
Following the acquisition of Enable Partners in December 2021, Energy Transfer owns and operates over 114,000 miles of pipelines and related assets in 41 states, spanning all major U.S. producing regions and markets. This further solidifies its leadership position in the midstream sector.
Through its ownership of Energy Transfer Operating, formerly known as Energy Transfer Partners, the company also owns Lake Charles LNG Company; the general partner interests, the incentive distribution rights, and 28.5 million standard units of Sunoco (NYSE: SUN); and the public partner interests and 39.7 million standard units of USA Compression Partners (NYSE: USAC).
Jefferies has a Buy rating on the shares, with a $23 target price.


Enterprise Products Partners
This top American midstream natural gas and crude oil pipeline company is headquartered in Houston, Texas. Enterprise Products Partners (NYSE: EPD) is one of the most extensive publicly traded energy partnerships and pays a reliable 5.78% dividend. The company’s debt-to-EBITDA ratio ranges from 3.1x to 3.4x, which is moderate for a midstream energy company, and its interest coverage ratio is 5x.
The company generates strong free cash flow, with an operating cash flow of approximately $8.8 billion, resulting in approximately $4.2 billion in free cash flow annually after deducting capital expenditures. Another significant benefit for shareholders is that most of the corporate debt is fixed-rate, thereby limiting the risk of rising interest rates.
Enterprise Products Partners provides various midstream energy services, including:
- Gathering
- Processing
- Transporting and storing natural gas, NGLs, and fractionation
- Import and export terminalling
- Offshore production platform services
Its four reportable business segments are:
- Natural Gas Pipelines and Services
- NGL Pipelines and Services
- Petrochemical Services
- Crude Oil Pipelines and Services
One reason many analysts like the stock might be its distribution coverage ratio. The company’s coverage ratio is well above 1x, making it relatively less risky among the MLPs.
UBS has a Buy rating with a $45 price objective.


Exxon Mobil
Exxon Mobil (NYSE: XOM) manages an industry-leading portfolio of resources and is one of the world’s largest integrated fuels, lubricants, and chemical companies. The decline in oil prices presents investors with an excellent entry point to secure a strong 2.69% dividend yield. Exxon is the world’s largest international integrated oil and gas company, exploring for and producing crude oil and natural gas in the United States, Canada, South America, Europe, Africa, Asia, and Australia/Oceania.
Exxon also manufactures and markets commodity petrochemicals, including olefins, aromatics, polyethylene, and polypropylene plastics, as well as specialty products. Additionally, the company transports and sells crude oil, natural gas, and petroleum products.
Top Wall Street analysts expect the company to remain a key beneficiary in a higher oil price environment. Most remain optimistic about the company’s sharp positive inflection in capital allocation strategy, upstream portfolio, and leverage to a further demand recovery. Exxon offers greater downstream/chemicals exposure than its peers.
Exxon completed its purchase of oil shale giant Pioneer Natural Resources in 2024 in an all-stock transaction valued at $59.5 billion. The deal created the largest U.S. oilfield producer and guarantees a decade of low-cost production.
Morgan Stanley has an Overweight rating and a $168 target price.
The post 20 Years on Wall Street Taught Me to Buy and Hold 5 High-Yield Energy Giants appeared first on 24/7 Wall St..
]]>Chevron (NYSE:CVX) is having a standout year heading into the second half of 2026. Chevron delivered Q2 2026 adjusted EPS of $6.06 and revenue of $67.20 billion.
Our 24/7 Wall St. price target for Chevron is $204.72, implying 4.99% upside from the current $194.99 quote. Our model’s rating is hold with high confidence at 90%.
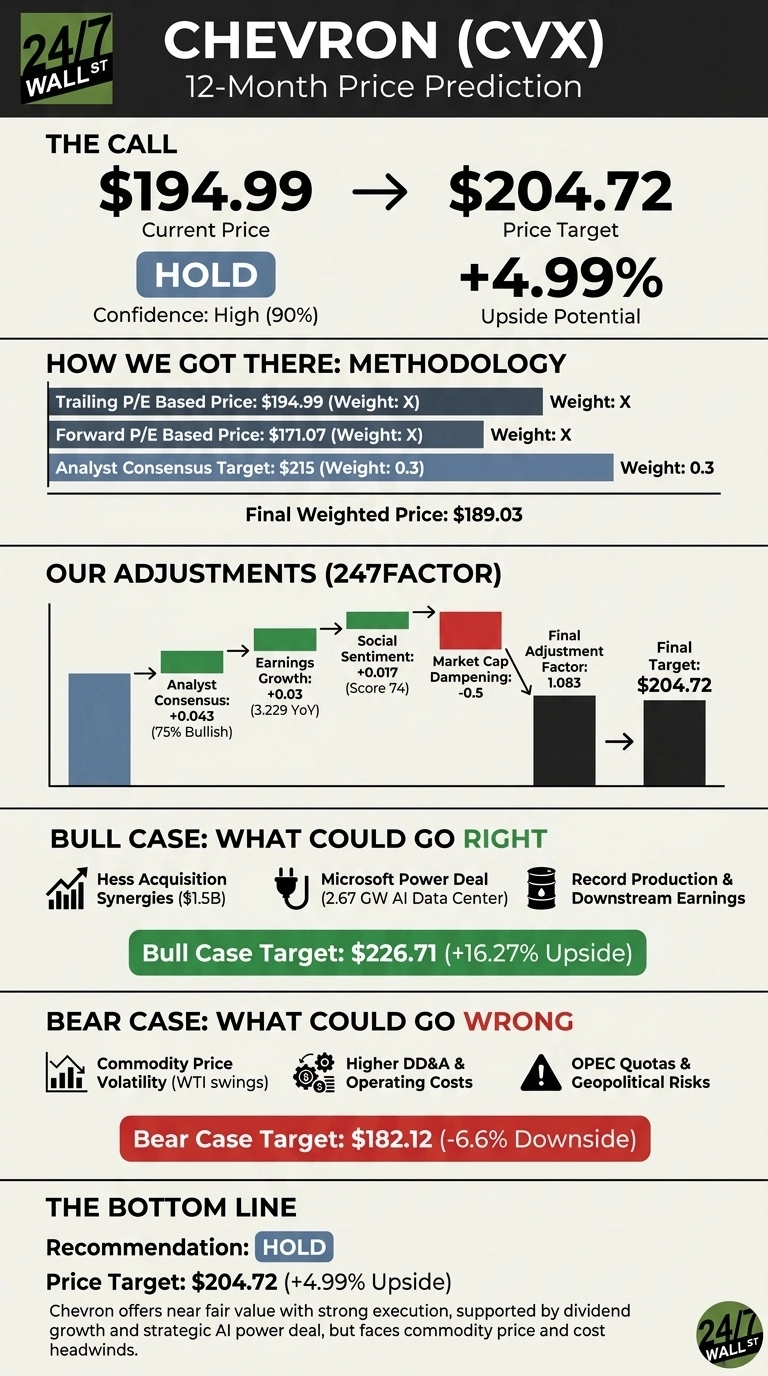
24/7 Wall St. Price Target Summary
| Metric | Value |
|---|---|
| Current Price | $194.99 |
| 24/7 Wall St. Price Target | $204.72 |
| Upside | 4.99% |
| Recommendation | HOLD |
| Confidence Level | 90% |
A Blistering Run Meets a Rich Setup
Chevron shares are up 31.6% year to date and 18.79% in the last month, sitting just 1% below the 52-week high of $212.76.
Q2 catalysts included worldwide production of 4,070 MBOED, a record 2,077 MBOED in U.S. upstream, 97% U.S. refinery utilization, and downstream earnings of $4.87 billion against $737 million a year ago.
Chevron cut total debt by $8.41 billion in the quarter and hit its $3 billion annual run-rate cost reduction target six months early. The 20-year, 2.67 GW power purchase agreement with Microsoft for a West Texas data center reframes part of the story as AI infrastructure.
The Case for $226+
Bulls have real ammunition. The Hess acquisition generated $1.5 billion in synergies within a year, 50% above the original target. Guyana’s Yellowtail and Hammerhead projects extend the runway, the Permian Basin cleared 1 million BOE/day, and the Microsoft deal opens a durable power-and-data-center adjacency.
Brent averaged $104/BBL in Q2; if crude stays firm, our bull scenario points to $226.71 over 12 months, a 16.27% total return. Chevron’s $7.12 annualized dividend and 39 consecutive annual increases add ballast.
What Could Go Wrong
WTI whipsawed from $60.04 in January 2026 to $102.13 in May before settling at $84.81 in June. That volatility is the swing factor. Higher DD&A from the Hess deal, OPEC quota risk, and exposure in Venezuela and Iraq round out concerns.
Our bear scenario models a slide to $182.12, a -6.6% return. Bulls counter that debt reduction, cost cuts, and record downstream reflect the through-cycle discipline that limits downside.
How Chevron Compares to ExxonMobil and ConocoPhillips
ExxonMobil (NYSE:XOM) is the direct integrated peer. Exxon trades at a trailing P/E of 22 with ROE of 11.03%, versus Chevron’s 32 P/E and 7.26% ROE. Exxon looks cheaper and more capital-efficient, making our modest CVX target reasonable rather than aggressive.
ConocoPhillips (NYSE:COP) is the pure-play E&P counterpoint at a $145.14 billion market cap. COP posted a Q1 2026 EPS beat of 11.62% but is guiding to a 45% CFO return to shareholders, in line with Chevron’s cadence. Against COP’s tighter shareholder return math, Chevron’s 3.63% yield and integrated downstream cushion justify a premium.
| Company | Trailing P/E | Dividend Yield |
|---|---|---|
| Chevron | 32 | 3.25% |
| ExxonMobil | 22 | 2.67% |
| ConocoPhillips | n/a | n/a |
Chevron Price Projection 2026-2030
Our 24/7 Wall St. price target of $204.72 and hold rating reflect a stock that has priced in most good news. The 90% confidence score is high because operational execution is clean, but the 18.79% one-month move leaves little cushion.
The $180 area could offer a more attractive risk/reward entry, particularly if Brent holds above $85. Stay patient if crude drifts to the mid-$60s, since that pressure was visible in Q4 2025 earnings.
Our base case model projects Chevron across the coming years, assuming steady execution and mid-cycle crude.
| Year | 24/7 Wall St. Price Target |
|---|---|
| 2026 | $204.72 |
| 2027 | $215.00 |
| 2028 | $226.00 |
| 2029 | $237.00 |
| 2030 | $248.81 |
These projections assume Chevron continues delivering on Hess synergies, Permian growth, and cost discipline. Upside or downside will hinge on the crude cycle and AI-driven power demand from partners like Microsoft.
The post Wall Street Is Bullish on Chevron Stock. Here’s Our Price Target appeared first on 24/7 Wall St..
]]>Volatility has been the theme of 2026. The VIX touched 31.05 in late March before settling back to a current reading of 15.86, and the 10-year Treasury yield sits at 4.70%, near the top of its 12-month range. That backdrop shifts the calculus for income investors. When the risk-free rate is competitive, dividend stocks must earn their keep with consistency, coverage, and growth. The five names below share a common trait: multi-decade dividend streaks that ride out cycles like the one we are in now.
These are compounders with 39 to 71 years of uninterrupted annual dividend growth, boring in the best possible way — not high-yield speculations. Here is why each merits a closer look this August.
Coca-Cola (KO)
Coca-Cola (NYSE:KO) is the archetypal defensive dividend name, and the numbers back it up. The quarterly dividend of $0.53 was raised from $0.51 beginning in 2026, extending a streak that spans 64 years. Shares closed at $86.56 on August 4, up 25.48% year to date, with an annualized forward dividend of $2.12 and a yield near 2.37%.
Second-quarter results reinforced the thesis. Q2 2026 adjusted EPS of $0.97 beat the $0.9323 consensus on revenue of $13.38 billion, up 6.7% year over year, and management raised full-year guidance to comparable EPS growth of 9% to 10%. Coca-Cola Zero Sugar grew 16%, and the FIFA World Cup 2026 marketing push should juice volume into year-end.
Risk: The stock trades at 26 times trailing earnings, a premium to its historical average, and Asia Pacific price/mix declined 9% last quarter. The premium valuation limits the margin of safety at current levels.
McDonald’s (MCD)
McDonald’s (NYSE:MCD) is the contrarian pick of the group. Shares are down 11.12% year to date, closing at $268.34, which pushes the yield up to 2.74%. The quarterly payout of $1.86 was raised from $1.77 in late 2025, marking its 49th consecutive annual increase and putting the company one hike away from formal Dividend King status.
The Q2 2026 report on August 4 delivered adjusted EPS of $3.38, beating the $3.32 estimate, with global comparable sales up 1.3% and nearly 220 million 90-day active loyalty users driving over $40 billion in trailing systemwide sales. Management is targeting 50,000 global units by 2028. Analyst target price of $323.58 implies material upside.
Risk: US guest counts turned negative and China and France posted negative comps. If a lower-income consumer slowdown deepens, traffic recovery gets pushed out.
Johnson & Johnson (JNJ)
Johnson & Johnson (NYSE:JNJ) delivers a 64-year streak of increases. The board raised the quarterly payout to $1.34 in the May 2026 ex-dividend cycle, up from $1.30. Shares closed at $254.93, gaining 24.56% year to date and 52.77% over the past year.
Q1 2026 revenue of $24.06 billion grew 9.9%, and management raised full-year guidance to revenue of $100.3 billion to $101.3 billion. Innovative Medicine grew 11.2%, with DARZALEX at $3.96 billion up 22.5% and TREMFYA up 68.3%. CEO Joaquin Duato said "Johnson & Johnson had a strong start to 2026 and is delivering on its promise for a year of accelerated growth and impact."
Risk: STELARA is running off at a 59.7% decline as biosimilars take share, and legal reserves remain lumpy.
Chevron (CVX)
Chevron (NYSE:CVX) is the highest yielder in the group at 3.55%, with a quarterly dividend of $1.78, raised from $1.71 in early 2026, extending its 39-year streak of consecutive increases. Shares are up 27.3% year to date to $190.40.
Q2 2026 delivered adjusted EPS of $6.06, revenue of $67.2 billion up 51.4% year over year, and free cash flow of $18.1 billion. Worldwide production climbed 20% to 4,070 MBOED post-Hess, and management pulled forward $3 billion in annual run-rate cost reductions six months ahead of schedule. The recently announced 20-year, 2.67 GW power purchase agreement with Microsoft in West Texas gives Chevron a data center demand tailwind that competitors lack. Next ex-dividend date is August 19, with payment on September 10.
Risk: Oil is cyclical. A sharp drop in crude flips the free cash flow story quickly.
Procter & Gamble (PG)
Procter & Gamble (NYSE:PG) owns the longest streak in the group: 71 consecutive years of dividend increases. The current quarterly payout is $1.0885, up from $1.0568 earlier in 2026, yielding 2.95% on a share price of $148.01. Management plans to return roughly $10 billion in dividends and $5 billion in buybacks in FY2027.
Q4 FY2026 core EPS of $1.43 beat the $1.407 estimate, and full-year free cash flow reached $15.84 billion. Beauty led the quarter with 6% growth. With a net debt/EBITDA ratio of 1.2x and a beta of 0.377, this is as defensive as blue chips get.
Risk: Management flagged a ~$1 billion after-tax commodity, energy, and transport headwind in FY27, an 8% drag on EPS growth. Organic sales were flat in Q4, so patience is required.
The post 5 Solid Dividend Stocks to Buy in August appeared first on 24/7 Wall St..
]]>Exxon Mobil (NYSE:XOM) posted its best underlying quarterly profit in four years, with shares hitting fresh highs. After a 30.9% year-to-date run, risk/reward looks stretched.
Our 24/7 Wall St. price target for Exxon is $139.86, implying 9.14% downside from current levels. The recommendation is hold with 90% confidence, reflecting strong operations colliding with a rich multiple.
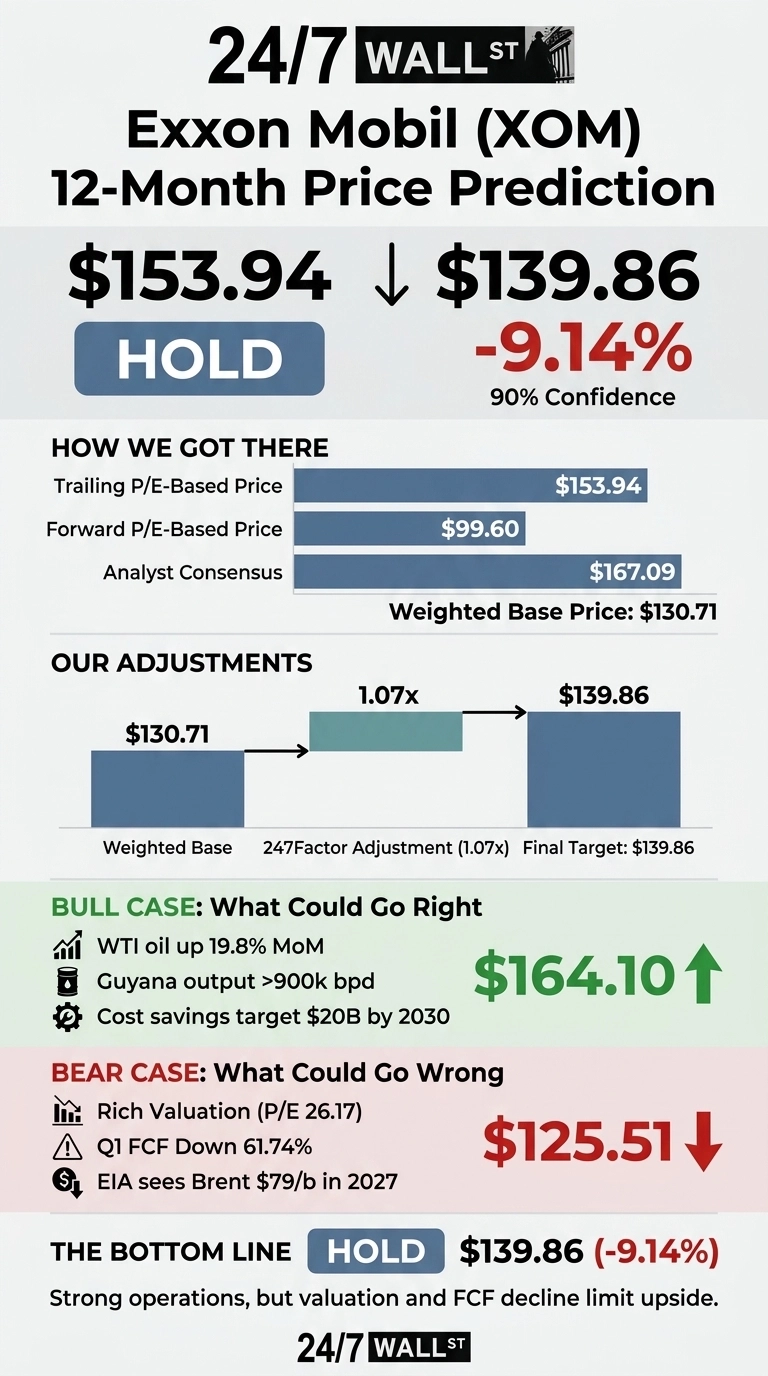
24/7 Wall St. Price Target Summary
| Metric | Value |
|---|---|
| Current Price | $153.94 |
| 24/7 Wall St. Price Target | $139.86 |
| Upside/Downside | -9.14% |
| Recommendation | HOLD |
| Confidence Level | 90% |
Why We Could Be Wrong on Exxon
Our price target sits below current trading levels, and the bull argument is real. Golden Pass LNG Train 1 shipped its first cargo in April 2026, Guyana keeps beating schedule, and WTI is up 19.8% month over month to $84.25. If Brent stays elevated on Middle East risk, Exxon could easily exceed our target.
A Four-Year Profit Peak Meets a 44% Rally
Exxon shares are up 43.65% over the past year and 14.06% in July alone, sitting just 5% below the 52-week high of $175.22.
Q1 2026 delivered adjusted EPS of $1.16 versus $1.01 expected, a 15.15% beat and the fourth straight quarter above consensus.
Underlying earnings hit $8.77 billion versus $7.58 billion a year earlier, the strongest underlying quarter in roughly four years, despite GAAP results dinged by $3.88 billion in unfavorable derivative mark-to-market timing and $706 million in Middle East disruption losses. CEO Darren Woods called it a “fundamentally stronger company”.
The Case for $164 and Higher
Bulls cite a genuinely improved earnings engine. Cumulative structural cost savings since 2019 hit $15.6 billion, targeting $20 billion by 2030. Guyana crossed 900,000 barrels per day, Permian hit records, and advantaged assets grew to 59% of production.
Capital return is exceptional: $20 billion in 2026 buybacks planned and 43 consecutive years of dividend growth. Analyst consensus sits at $167.09, with bull-case scenarios reaching $164.10, a 6.6% return. If Brent holds near the EIA’s $106/b Q2 forecast, upside estimates look conservative.
What Could Send Shares Back to $125
The bear case starts with valuation. Exxon trades at a a premium trailing multiple, well above peers, and the 224.56% five-year rally already prices in significant upside.
Q1 free cash flow fell 61.74% to $2.70 billion as capex climbed, and the effective tax rate jumped to 40%. The EIA expects Brent to fall to $79/b in 2027 as Middle East supply returns. Our bear-case scenario points to $125.51, an 18.47% drop.
How Exxon Compares to Chevron and ConocoPhillips
Chevron (NYSE:CVX) trades at a forward P/E of 14 versus Exxon’s 14, but its trailing P/E is 19 versus Exxon’s 26. Chevron’s analyst target of $215 implies meaningful upside, suggesting the Street sees Exxon’s premium as harder to justify.
ConocoPhillips (NYSE:COP) offers a pure upstream contrast. COP trades at a a lower forward multiple with a a lower PEG than Exxon. COP looks cheaper per unit of growth, reinforcing our view that Exxon’s target should sit closer to $140 than $167.
Model Verdict: Rich Multiple Meets Stronger Engine
The 24/7 Wall St. price target is $139.86, recommendation hold, confidence 90%. Valuation tips the scale: this is a fundamentally stronger Exxon, but a premium trailing multiple and 5% from the 52-week high leaves little margin for error.
The setup improves if crude sustains above $90 and free cash flow reaccelerates in Q2. Downside risk grows if Brent slides toward the EIA’s 2027 forecast. The current dividend yield sits at 2.6%.
Here is where our model projects Exxon could trade, assuming current growth trajectories hold.
| Year | 24/7 Wall St. Price Target |
|---|---|
| 2026 | $148.65 |
| 2027 | $145.00 |
| 2028 | $150.00 |
| 2029 | $155.00 |
| 2030 | $141.83 |
These projections assume Exxon continues executing on cost savings and advantaged-asset growth. Significant upside or downside could come from sustained Middle East disruption or faster-than-expected energy transition.
The post Exxon Posts Its Best Profit in Four Years, Here’s Where It’ll End The Year appeared first on 24/7 Wall St..
]]>Warren Buffett’s latest 13F filing, disclosing holdings as of March 31, and filed May 15, still concentrates Berkshire Hathaway’s public-equity firepower in just five names. Every one of them has moved this year, and the gap between what Buffett paid and where these tickers trade in July 2026 is the entire question. Skip this read and you are guessing at what the world’s most famous allocator is quietly compounding into. Here is the buy/hold/sell tape on all five, ranked for pacing, not size.
1. Chevron (The Surprise at the Top of the Line of Fire)
Start with the name most retail investors forget is even in the portfolio. Chevron (NYSE:CVX) is Buffett’s energy anchor, and it just delivered the kind of quarter that vindicates a contrarian oil bet: an adjusted EPS blowout against a headline revenue miss, masking the fact that production is ripping higher post-Hess.
In Q1 2026, Chevron posted adjusted EPS of $1.41 versus the expected 97 cents, a 45.56% beat, on worldwide production of 3,858 MBOED, up 15%, with U.S. output above 2 million barrels per day for the third straight quarter. Analysts have not chased the move: consensus target sits at $213.91 against a share price of $195.19 on Aug. 3, and the stock is already up more than 25% year to date.
Read: Buy. A 3.65% dividend yield, a 13 forward P/E and 18 Buy or Strong Buy ratings versus one Sell rating makes this the cheapest conviction pick on Buffett’s sheet. The obvious heavyweight is next.
2. Apple (The Position That Bankrolled the Berkshire Decade)
Apple (NASDAQ:AAPL) remains the largest common-stock holding on the 13F, and the tape has finally caught up to the thesis Buffett locked in years ago. The iPhone 17 supercycle plus Services at record levels has re-rated the multiple hard.
Q2 2026 landed at revenue of $111.18 billion, up 16.6% year over year, with EPS of $2.01 beating the $1.94 estimate by 3.61%, powered by iPhone revenue of $56.99 billion and Services at a record $30.98 billion. The board reloaded with a fresh $100 billion buyback authorization and a 4% dividend hike to 27 cents per share. Shares have surged more than 50% over the past year to $305.24 on Aug. 3.
Read: Hold. The fundamentals are pristine, but with the analyst consensus target at $315.79, the stock is trading above the Street. Buffett has been trimming for a reason. Fresh money buyers should wait for a pullback toward the 50-day moving average of $301.66. Next up: the bank that just posted one of its cleanest quarters in years.
3. Bank of America (The Rate-Cycle Beneficiary Buffett Won’t Fully Let Go)
Bank of America (NYSE:BAC) has been the subject of endless “is Buffett selling?” chatter, yet it remains a top-five 13F position, and Q2 2026 explained why he is holding the core.
The bank delivered Q2 2026 revenue of $31.56 billion beating by 2.55% and EPS of $1.21 versus $1.12 estimated, a 7.74% beat, with EPS up 34% year over year. Global Markets revenue jumped 34% to $8.02 billion, equities sales and trading rocketed 70% to $3.62 billion, and investment banking fees rose 50% to $2.14 billion. Credit stayed pristine: net charge-off ratio improved to 0.47% from 0.55%, and the bank returned $8 billion to shareholders in the quarter. CEO Brian Moynihan called it “one of our strongest quarters to date”.
Read: Buy. At a 14 trailing P/E and 1.565 price-to-book, with the Street target at $67.26 against an Aug. 3 share price around $62.07 and zero Sell ratings on 24 analysts, BAC is the cleanest risk/reward in the megabank complex. The next name is quieter, more defensive, and just went ex-CEO.
4. Coca-Cola (The Dividend Fortress in a Leadership Transition)
Coca-Cola (NYSE:KO) is the position Buffett has famously never sold a share of, and Q1 2026 explained the loyalty: pricing power intact, volumes accelerating in emerging markets, and margins expanding under new CEO Henrique Braun.
Q1 2026 delivered revenue of $12.47 billion, up 12.1% year over year, beating by 1.97%, with EPS of 86 cents versus the expected 81 cents, a 5.87% beat. Underneath: organic revenue growth of 10%, Coca-Cola Zero Sugar volume up 13% across all segments and operating margin expanded to 35% from 32.9%. Full-year guidance calls for organic revenue growth of 4% to 5% and comparable EPS growth of 8% to 9% off the 2025 base of $3, with roughly $12.2 billion in free cash flow.
Read: Hold, buying dips. At a 27 trailing P/E with a 2.44% dividend yield, KO is not cheap after ripping nearly 26% year to date, but the analyst target of $87.10 leaves upside from the $86.84 share price on Aug. 3. But the stock has pulled back around 3% since July 29, providing the exact window income buyers wait for. Now comes the payoff.
5. American Express (The Longest Conviction Trade in the Book)
American Express (NYSE:AXP) is the punchline. Buffett has owned it since the 1963 Salad Oil Scandal, and it is the only top-five holding sitting in the red year to date, which is precisely why it belongs at the top of the shopping list right now.
Q1 2026 delivered revenue of $18.91 billion beating by 1.61%, EPS of $4.28 versus $3.99 expected, a 7.24% beat, and net income of $2.97 billion, up 15%. Billed business hit $428 billion, up 10% from $387.4 billion, with Card Member spending growing 9% FX-adjusted, the highest quarterly growth in three years. Management reaffirmed FY 2026 guidance of 9% to 10% revenue growth and EPS of $17.30–$17.90, and CEO Stephen Squeri called it a “very strong start to the year…10 percent FX-adjusted revenue growth and 18 percent EPS growth.”
Read: Buy. AXP trades at a 22 trailing P/E and just 20 forward earnings, is down 8.09% year to date to $342.57 on Aug.3, and the stock carries an analyst target of $374.94. Every prior time Buffett’s oldest conviction pick has stalled while its fundamentals accelerated, the reversion has been sharp. This is the setup.
The Threads Pulled Together
Two clear buys (CVX and BAC), one high-conviction laggard payoff (AXP) and two holds where fundamentals are pristine but valuations are ahead of themselves (AAPL and KO). The pattern in Buffett’s own trading, trimming Apple, holding banks, adding energy, points to the same conclusion: The money in the 13F is rotating toward the names that have not run yet. The window on AXP and CVX narrows every session the rest of the market keeps grinding higher.
The post Are Billionaire Investor Warren Buffett’s Top 5 Stock Picks a Buy in August? appeared first on 24/7 Wall St..
]]>The Schwab U.S. Dividend Equity ETF (NYSEARCA:SCHD) sells one number in bold: a 0.06% expense ratio. On $10,000 invested, that headline fee costs about $6 a year. That fee is the smallest cost this ETF quietly extracts from a taxable holder, and the March 2026 reconstitution proved it.
What You Are Actually Paying
Let’s start with what is immediately visible — the low expense ratio. At 6 basis points, SCHD looks cheap. That said, similar funds, like the Vanguard Dividend Appreciation ETF (NYSEARCA:VIG) still charges less, at 0.04%, or about $4 per $10,000. The direct fee gap is roughly $2 a year on a $10,000 stake. Admittedly, that is a small difference. However, the real cost lies underneath.
SCHD tracks the Dow Jones U.S. Dividend 100 Index. The index reconstitutes each March, with the March 2026 reconstitution being one of the largest turnover events in fund history. Every name added or dropped forced the ETF to trade. As such, every appreciated share sold inside that trade became a realized gain the fund could pass to shareholders as a distribution.
The payout history shows this in practice. SCHD paid $0.8241 per share in Q2 2024 and $0.7545 in Q3 2024, well above the fund’s normal quarterly cadence of roughly $0.25 to $0.28. Post-reconstitution distributions like these arrive on your 1099 as income for shares you never actually sold, taxed at your income bracket in the year Schwab decides.
The Concentration the Factsheet Downplays
The May 31, 2026 NPORT filing shows how top-heavy this “diversified” ETF has become. Qualcomm (NASDAQ:QCOM) alone accounts for 6.74% of net assets. Add Texas Instruments and UnitedHealth Group, and the top three positions carry 17.73% of a 102-holding portfolio.
Energy is another cluster. Chevron (NYSE:CVX) sits at 3.83%, ConocoPhillips (NYSE:COP) at 3.51%, and Devon, EOG, SLB and ONEOK fill in around them. Analyst commentary puts SCHD’s total energy weight at nearly 17%, well above the S&P 500. That said, concentration cuts both ways. Qualcomm shares are down 18.86% over the past month and 12.81% year to date, and that pain flows straight into the ETF’s largest slot.
The Performance Gap Less Talked About
Here is the part the marketing tends to skip. Since February 2022, SCHD returned 46% while dividend-growth peer CGDV returned 113%. Over the last decade, SCHD trailed WisdomTree’s DGRW by roughly 38%. The screen that excludes megacap tech and demands a 10-year dividend record seemingly has a bill attached. And that hidden cost never shows up on the expense ratio line.
Holders pay through single names too. Merck (NYSE:MRK) sits at 3.86%, Abbott Laboratories (NYSE:ABT) at 2.96%, and Altria (NYSE:MO) at 2.94%. Altria’s high yield is fully taxable at ordinary rates for most holders; SCHD’s screen accepts high-yield names like Altria because the dividend keeps coming.
The Cheaper Mirror
Investors who want broad U.S. dividend exposure with lower fees and lower turnover have options. VIG charges 0.04% and screens for consecutive dividend growers, skewing to more diversified megacaps. The trade-off is real: lower headline yield, less energy exposure, and far less reconstitution churn in your taxable account.
What This Means for You
SCHD’s 24.03% year-to-date gain is real, and the dividend growth streak is also real. However, before your next contribution, ask whether the March reconstitution tax bill, the Qualcomm-heavy top of the book, and the decade-long gap versus dividend-growth peers add up to more than the six-basis-point sticker suggests. The fee is the price on the label. The costs live underneath.
The post SCHD’s 0.06% Fee Hides the Real Cost: How March Reconstitution Triggered $0.8241 Per Share in Surprise Distributions appeared first on 24/7 Wall St..
]]>The two largest American oil companies just booked a combined $26.5 billion in second-quarter net income, their strongest showing in years, and the president is furious about it. “They’re making too much money,” President Trump said Monday, according to CNBC. “I don’t like it.” A fuller version relayed by France 24: “I don’t like it. They’re making too much money, okay? Based on a shortage, they’re making too much money.” The shortage he refers to is one his own administration is helping create.
Chevron (NYSE:CVX) posted roughly $12.1 to $12.2 billion in net income, up about 384% from $2.5 billion a year earlier, aided by the Hess integration that lifted worldwide production to 4,070 MBOED. Downstream did the heavy lifting: refining profit jumped to $4.9 billion from $737 million, with 97% U.S. refinery utilization and record crude throughput. Exxon Mobil (NYSE:XOM) delivered $14.5 billion in net income, double the year-ago quarter and its best result since the post-Ukraine-invasion spike. Its refining arm earned $5.5 billion after losing $1.3 billion in the first quarter. CFO Neil Hansen has flagged that the binding constraint has shifted from crude to the shrinking availability of refined products like gasoline and diesel.
That constraint traces to the war. The U.S.-Israel conflict with Iran began February 28, 2026. Iran declared the Strait of Hormuz “closed” starting March 4, a chokepoint carrying roughly 20% of global oil trade. The EIA later assessed that Persian Gulf producers shut in 10.5 million barrels per day in April, driving Brent to $138.21 on April 7. Prices have since eased, with WTI at $84.25 on July 27, but the refined-product squeeze remains. Middle East refinery outages, lost Russian capacity from the Ukraine war, and China’s tight export posture have all compounded the crunch. The U.S. national average pump price reached $4.11 on July 31, versus roughly $2.93 a month before the war intensified.
On June 24, Trump accused Exxon, Chevron, Shell, and BP of price gouging and ordered a Department of Justice investigation, arguing crude had fallen roughly 36% without pump prices following. Six weeks later, crude is elevated because of a war his administration is prosecuting, and he objects to that too. In June the complaint was that oil companies were not passing along cheaper crude. In August the complaint is that they are cashing in on genuinely expensive crude. Chevron CFO Eimear Bonner and the American Petroleum Institute pushed back in June, citing the lag between crude and retail prices.
The DOJ probe appears still live, and a crude export ban is reportedly no longer being dismissed. Chevron has warned that restricting exports would discourage investment and ultimately shrink future supply. Trump has meanwhile stuck to a $2.25-per-gallon target, a level last seen during the pandemic driving collapse, a benchmark difficult to reproduce under wartime conditions. Investors have voted with capital: XOM is up 43.65% over the past year, CVX up 35.24%.
The same day, per Bloomberg, Trump separately criticized Chevron’s CEO for not sufficiently praising the administration’s pro-fossil-fuel policies. The signal to watch over the next quarter is whether the DOJ probe produces a subpoena, or an actual export restriction lands. Either would turn a personal grievance into policy that reshapes the barrel.
The post Trump Blasts Oil Companies For Making “Too Much Money” During Iran Conflict As Chevron and Exxon Profits Skyrocket appeared first on 24/7 Wall St..
]]>
High energy prices have become one of the biggest inflation stories of 2026. According to AAA, the national average price for regular gasoline now sits around $4.10 per gallon, up sharply from roughly $2.98 before the Iran conflict erupted earlier this year.
Every trip to the pump reminds consumers how quickly geopolitical events can ripple through household budgets. For investors, it also highlights an important lesson: commodity markets don’t respond to political demands. Oil prices are set globally, retail gasoline prices are set locally, and neither changes because a president posts on social media.
Oil Companies Aren’t the Ones Setting Pump Prices
President Trump took aim at Chevron (NYSE:CVX) this morning after CEO Mike Wirth appeared on Fox Business with Maria Bartiromo discussing the company’s strong performance. In a Truth Social post, Trump argued Chevron’s success was only possible because of his administration’s actions in Venezuela, including reopening the country’s oil industry to U.S. companies after Nicolas Maduro’s removal.
He then demanded Chevron and other producers “get your consumer (retail!) Oil Prices DOWN, NOW!”
That criticism misses how gasoline pricing actually works. Contrary to popular belief, Chevron, ExxonMobil (NYSE:XOM), Shell (NYSE:SHEL), and other integrated oil companies rarely determine the price consumers see on station signs. According to the American Petroleum Institute, fewer than 5% of U.S. gas stations are owned directly by major oil companies.
Retail stations are largely price takers rather than price makers. Owners price fuel based on what it will cost to replace the next shipment, local competitors’ prices, labor costs, rent, credit card fees, taxes, and margins that are often just pennies per gallon. Many convenience stores earn more profit selling coffee and snacks than gasoline itself.
Chevron can influence wholesale fuel costs through its refining business. It cannot simply order independently owned stations across America to slash prices.
Trump’s Own Policies Have Been a Bigger Driver
The biggest move in gasoline prices this year followed Trump’s military action against Iran at the end of February. Oil markets immediately priced in the possibility of supply disruptions throughout the Middle East, sending both West Texas Intermediate (WTI) and Brent crude above $100 per barrel before easing.
Although WTI has since fallen below $80 per barrel and Brent has retreated to roughly $83 after Trump again delayed retaliatory strikes against Iran, crude remains well above where it traded when his administration negotiated a temporary truce with Tehran.
Markets continue to build a geopolitical risk premium into oil prices because Trump’s repeated threats to resume military action create uncertainty over future supply. That uncertainty — not Chevron’s earnings call — is what has kept gasoline prices elevated.
The merits of Trump’s foreign policy can certainly be debated. Investors understand that protecting strategic interests sometimes carries economic costs. But assigning responsibility for higher gasoline prices to oil companies ignores how commodity markets function.
Investors Should Focus on the Real Drivers
Ironically, Chevron is benefiting from stronger crude prices that largely reflect geopolitical developments beyond its control. That’s exactly what integrated energy companies are designed to do. Higher oil prices typically expand upstream profits, even if refining margins fluctuate.
For investors, the more important variables remain global supply, OPEC+ production decisions, U.S. shale output, refinery utilization, and geopolitical tensions — not presidential demands directed at corporate executives.
When oil prices rise, retail gasoline follows. When crude falls for a sustained period, wholesale prices decline, and competition gradually pushes pump prices lower. No social media post changes that equation.
Key Takeaway
In short, Trump’s criticism of Chevron shifts attention away from the biggest factor behind today’s gasoline prices. The jump from roughly $2.98 per gallon before the Iran conflict to more than $4 today largely reflects higher crude oil prices driven by geopolitical risk, not decisions made by Chevron or ExxonMobil. Investors should separate political messaging from market mechanics.
Energy stocks will continue to rise and fall with global oil fundamentals, while consumers will keep paying prices determined primarily by wholesale markets and local station owners — not by directives from Washington.
The post Trump Deflects Blame for High Gas Prices, Demands Chevron Lower Pump Costs appeared first on 24/7 Wall St..
]]>If any investor has stood the test of time, it’s Warren Buffett, and with good reason. For 60 years, the “Oracle of Omaha” has had a rock-star-like presence in the investing world, and his annual Berkshire Hathaway shareholders meeting has drawn thousands of loyal investors. They were stunned at last year’s meeting when Buffett announced he would step down as CEO of the investment giant at year’s end. While he remains board chair and vows to come to the office every day, he will also continue to have a voice in the day-to-day operations. His pre-announced successor and long-time lieutenant, Greg Abel, assumed the CEO position on January 1, 2026, and will likely direct or have a say in most, if not all, new investments, public or private. Some of these new investments have already been put into place.
Long-time investors and Buffett mavens are familiar with this quote: “His favorite holding for an S&P 500 stock is forever.” So it’s not surprising to report that for all the success and stature Berkshire Hathaway has in the investment world, just four top Dow Jones Industrial companies make up 50% of the fund’s total holdings. While much more concentrated than most portfolio managers would ever consider, the strategy has worked for Berkshire Hathaway investors for years and will likely continue to do so.
Why Do We Cover Berkshire Hathaway Stocks?
Few investors have the results and reputation that Buffett has garnered over the past 60 years. Though he has stepped away from the CEO chair, his impact and investment guidelines are likely to remain in place long after he is gone. While investing has evolved since Buffett took control of Berkshire Hathaway in 1965, buying good companies with products and services recognized worldwide and paying dividends will always remain a timeless approach.
Here are the four Dow Jones Industrials that reside in the Berkshire Hathaway portfolio. All are Buy-rated at the top Wall Street firms we cover.
American Express
American Express (NYSE:AXP) is an American bank holding company and multinational financial services corporation specializing in payment cards. The stock performed strongly for most of this year but has backed off some and offers a solid entry point with a dividend yield of 0.98%. American Express is a globally integrated payments company that deals with card-issuing, merchant-acquiring, and card network businesses.
The company offers products and services to customers worldwide, including consumers, small businesses, mid-sized companies, and large corporations. Its segments include:
- U.S. Consumer Services, which offers travel and lifestyle services, as well as banking and non-card financing products.
- Commercial Services offers payment, expense management, banking, and non-card financing products.
- International Card Services provides services to international customers, including travel and lifestyle services, and manages certain international joint ventures and its loyalty coalition business.
- Global Merchant and Network Services operates a payments network that processes and settles card transactions, acquires merchants, and provides multichannel marketing programs, capabilities, services, and data analytics.
Berkshire Hathaway owns 151,610,700 shares, 22.2% of American Express’s float, and 14.8% of the portfolio.
J.P. Morgan has an Overweight rating with a $400 target price.
Apple
Apple (NASDAQ:AAPL) designs, develops, and sells consumer electronics, computer software, and online services, offering a small dividend of 0.31%. It is remarkable that the legacy technology giant, even after a recent fourth-quarter sale of 10 million shares and a surge in sales over the past two years, still holds a 227,917,808-share position that accounts for a stunning 21% of the Berkshire Hathaway portfolio, which holds 1.6% of Apple’s stock.
The company offers:
- The iPhone, a line of smartphones
- Mac, a line of personal computers
- iPad, a line of multi-purpose tablets
- Wearables, home, and accessories comprising AirPods, Apple TV, Apple Watch, Beats products, and HomePod
Apple also offers AppleCare support and cloud services, and operates various platforms, including the App Store, which enables customers to discover and download applications and digital content, such as books, music, videos, games, and podcasts.
In addition, the company offers various services, such as:
- Apple Arcade, a game subscription service
- Apple Fitness+, a personalized fitness service
- Apple Music, which gives users a curated listening experience with on-demand radio stations
- Apple News+, a subscription news and magazine service
- Apple TV+, which offers exclusive original content
- Apple Card, a co-branded credit card
- Apple Pay, a cashless payment service
Morgan Stanley has an Overweight rating with a $364 target price.


Chevron
This American multinational energy company primarily focuses on oil and gas. Chevron (NYSE:CVX) is a safer option for investors looking to position themselves in the energy sector, and it pays a substantial 3.64% dividend, which was raised by 5% earlier this year. The company operates integrated energy and chemicals businesses worldwide. Berkshire Hathaway bought a very well-timed 8 million additional shares in the fourth quarter but sold a massive 46 million shares in Q1. Despite the sale, Berkshire still holds 84,375,856 shares, representing 4.2% of the float and 4.7% of the portfolio.
The company operates in two segments. The Upstream segment is involved in:
- Exploration, development, production, and transportation of crude oil and natural gas
- Processing, liquefaction, transportation, and regasification associated with liquefied natural gas
- Transportation of crude oil through pipelines, and transportation, storage
- Marketing of natural gas, as well as operating a gas-to-liquids plant
The Downstream segment engages in:
- Refining crude oil into petroleum products
- Marketing crude oil, refined products, and lubricants
- Manufacturing and marketing renewable fuels
- Transporting crude oil and refined products by pipeline, marine vessel, motor equipment, and rail car
- Manufacturing and marketing of commodity petrochemicals, plastics for industrial uses, and fuel and lubricant additives
It also involves cash management, debt financing, insurance operations, real estate, and technology businesses.
Jefferies has a Buy rating with a $216 target price.
Coca-Cola
Coca-Cola (NYSE:KO) is an American multinational corporation founded in 1892. This company remains a top long-time holding of Buffett. Berkshire owns a massive 400 million shares, which is 9.3% of the float and 9.3% of the portfolio. The stock pays a dependable 2.51% dividend.
Coca-Cola is the world’s largest beverage company, offering consumers more than 500 sparkling and still brands. Led by Coca-Cola, one of the world’s most valuable and recognizable brands, the portfolio features 20 billion-dollar brands, including:
- Diet Coke
- Coca-Cola Light
- Coca-Cola Zero Sugar
- Caffeine-free Diet Coke
- Cherry Coke
- Fanta Orange
- Fanta Zero Orange
- Fanta Zero Sugar
- Fanta Apple
- Sprite
- Sprite Zero Sugar
- Simply Orange
- Simply Apple
- Simply Grapefruit
- Fresca
- Schweppes
- Dasani
- Fuze Tea
- Glacéau Smartwater
- Glacéau Vitaminwater
- Gold Peak
- Ice Dew
- Powerade
- Topo Chico
- Minute Maid
Globally, it is the top provider of sparkling beverages, ready-to-drink coffees, juices, and juice drinks. Through the world’s most extensive beverage distribution system, consumers in more than 200 countries enjoy the company’s beverages at a rate of over 1.9 billion servings per day. And remember that the company owns 19.5% of Monster Beverage (NASDAQ:MNST), which continues to deliver strong financial results.
UBS has a Buy rating and a target price of $98.
The post 4 Dow Jones Industrial Giants Make Up 50% of Warren Buffett’s Berkshire Hathaway Portfolio appeared first on 24/7 Wall St..
]]>Exxon Mobil (NYSE:XOM) enters its July 31 earnings report with 43 consecutive years of dividend growth and a $20 billion annual buyback program. Strong production from Guyana and the Permian, combined with higher oil prices during Q2, could give the energy giant another opportunity to extend its four-quarter earnings-beat streak.
Higher Oil Prices Could Drive Another Earnings Beat
ExxonMobil has beaten EPS four straight quarters. Q1 2026 adjusted EPS came in at $1.16 versus $1.0074, a 15.15% beat, and Polymarket puts an 84.5% probability on another beat on July 31. Golden Pass LNG Train 1 loaded its first cargo in April 2026, Guyana output crossed 900,000 gross barrels per day, and the Permian hit a record 1.8M boed in Q4 2025. WTI traded between $80 and $114 during Q2, providing a strong upstream backdrop.
A 43-Year Dividend Growth Streak Meets a $20 Billion Buyback
Exxon pays a 2.65% dividend yield, and the last hike (4% announced in Q3 2025) extended the 43-year growth streak. Layer the $20 billion 2026 repurchase program (with $4.9 billion executed in Q1) on top of the dividend, and total shareholder yield lands much higher than the visible dividend yield.
Exxon’s Balance Sheet Supports the Valuation
XOM trades at a P/E of 23, an EV/EBITDA of 10.71, and a Price/Book of 2.51. These don’t seem like unreasonable multiples for a business that generated $26.13 billion in free cash flow in 2025 with Debt/Equity of just 0.168 and interest coverage of 56.28x. The stock’s beta sits at just 0.162, making it a low-volatility stock relative to the broader energy sector.
Exxon Looks Stronger Than Chevron on Cash Flow and Valuation
Chevron (NYSE:CVX) trades at a P/E of 32 (versus XOM’s 23), rides a shorter 39-year dividend streak, and reported negative $1.55 billion of free cash flow in Q1 2026 as capex outran operating cash.
Chevron is also investing in recently acquired Hess assets, Guyana, the Gulf of Mexico, and the Permian Basin to support 7% to 10% production growth in 2026. That spending could strengthen future cash flow, but Exxon currently offers the more attractive combination of valuation, reported free cash flow, dividend history, and buyback scale.
The Headline Profit Decline Hides Stronger Underlying Earnings
Exxon’s reported Q1 profit fell sharply, but the headline decline included billions of dollars in derivative timing effects and disruption costs. Excluding those items, underlying earnings increased to $8.77 billion from $7.58 billion. As CEO Darren Woods said on the Q1 call, “This quarter demonstrated that ExxonMobil is a fundamentally stronger company than it was just a few years ago, built to perform through disruption and across market cycles.”
The post The Single Biggest Reason to Buy Exxon Mobil Before July 31st appeared first on 24/7 Wall St..
]]>The VistaShares Target 15 Berkshire Select Income ETF (NYSEARCA:OMAH) markets a headline distribution that few equity strategies can match: a 14.9% trailing yield delivered in monthly payments against a share price of $19. OMAH does this by holding the same public companies that anchor Berkshire Hathaway’s portfolio, then layering a covered-call overlay on top. Whether that distribution reflects genuine cash flow from those holdings or something more fragile is the relevant question.
How OMAH Generates Its 15% Yield
The underlying dividend yields on those names average well below the fund’s headline number. Coca-Cola (NYSE:KO) yields 2.5%, Chevron (NYSE:CVX) yields 3.8%, and American Express (NYSE:AXP) yields roughly 1%. The gap between those cash dividends and OMAH’s 15% target is bridged by selling short-dated call options against the portfolio. The April filing shows short call positions against Apple, Alphabet, Berkshire, Coca-Cola, and Amazon, with premiums collected up front and recycled into the monthly distribution.
Are the Underlying Dividends Actually Safe?
The equity floor under OMAH is genuinely durable. Coca-Cola posted Q1 2026 free cash flow of $1.76 billion, raised the quarterly payout to $0.53, and carries a Dividend King track record. American Express earns $15.87 in trailing EPS against a $3.80 annualized dividend, leaving payout coverage of roughly 4x. Bank of America (NYSE:BAC) grew Q2 net income 27% and just lifted its quarterly dividend to $0.40. Chevron continued its streak of increases, moving the quarterly payout to $1.78, though Q1 free cash flow turned negative on Hess-related working-capital drag.
The one exception is Occidental Petroleum, which cut its dividend 87% in 2020 and pays $0.26 quarterly, still far below the $0.79 pre-COVID level. That risk is small at OMAH’s 6% weighting in the name.
The Options Overlay and the Payout Ratio
The uncomfortable number is the fund’s 305% payout ratio. That reflects a distribution funded largely by option premium and, at times, return of capital rather than accounting earnings. Premium generation depends on volatility. The VIX sits at roughly 19, in the normal 15 to 20 band, and has averaged about 18 over the past year. That environment supports the current call-writing income, but a sustained drop below 15 would compress premiums, and a sharp rally would cap upside on the underlying stocks that OMAH has written calls against.
Total Return and the Verdict
The share price is up 14% over one year and 9% year to date, and layered on top of the roughly 15% distribution, total return has run ahead of Berkshire’s own B shares, which are up 3% over one year. The forward annualized distribution estimate of $2.77 is slightly below the trailing $2.83, hinting that management is calibrating payouts to option income rather than forcing a fixed number.
This portfolio’s distribution is best understood as a synthetic yield, safe as long as volatility stays in a normal band and the Berkshire-style equity book holds its value. The 1% expense ratio is high for a passive-looking product, and investors focused on capital growth over income have historically been better served by owning Berkshire Hathaway directly, while JEPI and SPYI offer similar options-income mechanics on broader indexes with longer track records. OMAH’s performance relative to its underlying inspiration highlights the trade-off between income generation and pure equity appreciation.
The post Why a 15% Yield on Blue Chip Stocks Worries Even Income Investors appeared first on 24/7 Wall St..
]]>The ALPS Sector Dividend Dogs ETF (NYSEARCA:SDOG) pays a trailing dividend yield of 3.4%, distributing $2.38 per share annually across quarterly payments. SDOG applies the Dogs of the Dow logic to the full S&P 500, isolating the five highest-yielding stocks in each of ten GICS sectors and equal-weighting them.
The question is whether that mechanical yield-chasing produces a durable income stream or concentrates capital in businesses whose dividends are at risk. A holding-by-holding look at SDOG suggests the answer is mostly the former, with two clear exceptions worth understanding.
How SDOG Manufactures Its Yield
Where the Income Actually Comes From
- Lockheed Martin (NYSE:LMT) is the fund’s largest position at 2.49%. The dividend stepped up to $3.45 quarterly, but Q1 2026 free cash flow was negative $291 million against $816 million in dividends paid. That quarter did not cover its payout. Management reaffirmed full-year FCF guidance of $6.5 to $6.8 billion, which would restore coverage, but F-16 program charges and fixed-price contract risk make the H2 recovery a real assumption rather than a given.
- Edison International (NYSE:EIX) yields 4.4% and raised its quarterly to $0.8775, its 22nd consecutive year of dividend growth. Board confidence held even as Southern California Edison extended roughly 1,500 Eaton Fire settlement offers exceeding $500 million. The company targets a 45 to 55% payout of SCE core earnings and expects no new equity issuance through 2030. SB 254 established an $18 billion continuation fund that materially caps utility exposure.
- Kinder Morgan (NYSE:KMI) grew Q1 free cash flow 73% to $687 million, Moody’s upgraded the credit to Baa1, and net debt to adjusted EBITDA fell to 3.6x. The $10.1 billion project backlog is 92% natural gas, giving the 2% dividend hike genuine runway. This is the safest income contributor in the top five.
- Merck (NYSE:MRK) carries a 2.6% yield and $0.85 quarterly payout. GAAP results are distorted by $14.8 billion in Cidara and Terns acquisition charges, but non-GAAP FY26 EPS guidance of $5.04 to $5.16 and KEYTRUDA growth of 12% to $8.03 billion keep cash generation intact. Long-term KEYTRUDA patent exposure is the risk.
- Chevron (NYSE:CVX) delivered its 39th consecutive annual increase and pays $1.78 quarterly. Q1 free cash flow was negative $1.55 billion on $2.9 billion of timing effects, but FY25 free cash flow was $16.6 billion. WTI at $79.20 sits comfortably above breakeven levels for the dividend.
Total Return Alongside the Payout
Yield only matters if the NAV holds up. SDOG is up almost 20% year to date and 27% over the past year at $71. Dividend growth of nearly 9% compounds on top of price appreciation, so shareholders are not paying for yield with capital erosion.
The Verdict
The post The 3.4% Income Play That Beats the Dogs of the Dow Strategy appeared first on 24/7 Wall St..
]]>Exxon Mobil (NYSE:XOM) and Chevron (NYSE:CVX) both reported Q1 2026 results on May 1, 2026, right as the war with Iran reshaped global crude flows. With the Strait of Hormuz effectively closed and Brent recently near $90 per barrel, the two American majors are running the same playbook with very different exposure maps.
How the Quarter Landed for Each Business
Exxon posted adjusted EPS of $1.16 versus $1.01 expected on revenue of $85.14 billion, a solid beat despite $706 million in direct Middle East losses and a $3.88 billion mark-to-market drag on unsettled derivatives. Upstream volumes hit 4.6 million oil-equivalent barrels per day, and CEO Darren Woods framed the quarter bluntly: “Events in the Middle East tested that strength with the safety of our people remaining our top priority.”
Chevron’s beat was larger but messier. Adjusted EPS came in at $1.41 versus $0.97 expected, though revenue of $47.56 billion missed by 9.76% and free cash flow flipped to negative $1.55 billion. Curtailments hit its Tamar and Leviathan operations in Israel, and Mike Wirth leaned on the Hess integration and record U.S. throughput to carry the story.
Cash Machine vs. Hemisphere Hedger
| Lens | XOM | CVX |
| Core Bet | LNG, Guyana, Permian scale | Hess, Gulf of America, Venezuela |
| Middle East Exposure | Physical shipment losses | Israel field curtailments |
| 2026 Buyback Pace | $20B planned | $2.5B quarterly |
Exxon is engineered to convert $100 oil into raw cash. Golden Pass LNG Train 1 shipped its first cargo in April, Guyana output topped 900,000 gross barrels per day, and cumulative structural cost savings since 2019 reached $15.6 billion. Chevron is trading pure upside for geographic insurance. Talks around a $366 billion Iraq-to-Syria pipeline revival aim to bypass Hormuz entirely, and new plays in Libya, Uruguay, and Venezuela widen its Western Hemisphere footprint.
The Next Test Is How Long Brent Stays Elevated
The EIA now expects Brent around $106 per barrel in May and June before easing to $89 by 4Q26, with 10.75 million barrels per day of Middle East production shut in. WTI last traded at $80.77, already off May highs. I will be watching whether Exxon’s LNG cargoes and Permian barrels keep compounding, and whether Chevron’s Hess-era production growth of 15% year over year can offset those Israeli curtailments.
Why I Lean Toward Exxon on This Setup
For me, Exxon is the cleaner Iran-war trade. The 47.24% one-year return against Chevron’s 32.29% reflects tighter operating leverage to crude, and the $20 billion buyback is a real floor. Investors focused on lower operational supply risk and unique Venezuela and Israel optionality may find Chevron’s profile more appealing, especially with a $1.78 quarterly dividend backed by 39 straight years of increases. The key variable for both names is whether Hormuz reopens faster than the EIA expects.
The post The Iran War Isn’t Stopping and What That Means for Chevron and Exxon Mobil appeared first on 24/7 Wall St..
]]>Energy is back in focus midday Thursday. WTI crude oil is up 6% over the past 24 hours to $91.94 per barrel, and Barron’s reported that WTI briefly hit $100 per barrel earlier today, its first time above $100 in nearly two months, before settling near $91.94. That crude rally is lifting the integrated oil majors across the board.
With oil testing triple digits again, investors are asking a fair question. Among the three most widely held integrated names, ExxonMobil (NYSE:XOM), Chevron (NYSE:CVX), and BP (NYSE:BP), which stock has actually dominated in 2026?
The short answer: it’s a close race rather than a blowout, and ExxonMobil stock is narrowly out in front year to date (YTD). All three, however, are riding the same tailwind of firmer crude oil prices.
ExxonMobil Leads the 2026 Pack
ExxonMobil stock is up 31% YTD, the best of the three majors. Investors are paying a P/E ratio of 26x for ExxonMobil shares and collecting a dividend yield of 2.67%, the lowest income yield in the trio.
The fundamentals behind the run are solid. ExxonMobil produced 4.6 million oil-equivalent barrels per day and posted a Q1 2026 adjusted EPS of $1.16, topping estimates by 15%. The company is also executing a $20 billion buyback plan in 2026 and just extended its dividend raise streak to 43 consecutive years.
The trade-off is straightforward. ExxonMobil shares offer the smallest current income stream but the cheapest earnings multiple and the strongest 2026 price performance.
Chevron Sits in the Middle
Chevron stock is up 29% YTD, trailing ExxonMobil by only two percentage points. Chevron shares trade at a P/E ratio of 34x and carry a dividend yield of 3.69%, a middle-ground profile on both valuation and income.
Chevron’s Q1 2026 report was one of its stronger recent showings. Chevron’s adjusted EPS came in at $1.41 versus $0.97 expected, a 45% beat and the sixth straight quarter of topping consensus. Chevron’s production climbed to 3,858 MBOED, up 15% year over year (YoY), boosted by the Hess acquisition that closed last year.
Chevron also returned $2.5 billion via buybacks in Q1 and has paid out more than $5 billion to shareholders for 16 straight quarters. Income investors get more yield in Chevron stock than in ExxonMobil, though they’re paying a richer earnings multiple to get it.
BP Offers the Highest Yield
BP stock is up 27% YTD, the smallest gain of the group. BP is a UK-based oil major that trades in the U.S. as an NYSE-listed ADR, which is why it doesn’t appear in most S&P 500 energy funds. BP shares carry a P/E ratio of 36x and a dividend yield of 4.61%, easily the top yield of the three.
Operationally, BP’s first quarter was strong. BP’s EPS per ADS hit $1.24 versus $0.93 expected, powered by an exceptional oil-trading contribution and higher refining margins. However, BP has suspended its share buyback to prioritize balance-sheet repair, targeting net debt of $14 billion to $18 billion by the end of 2027.
BP stock offers the richest income and the most turnaround optionality under new CEO Meg O’Neill. However, it also carries the highest valuation and the smallest 2026 gain.
ETF Exposure and What to Watch
For investors who prefer a basket, the Energy Select Sector SPDR Fund (NYSEARCA:XLE) is the standard vehicle. ExxonMobil is the XLE ETF‘s largest holding at 24%, and Chevron is second at 18%, so the ETF is a top-heavy way to own the two U.S. majors. BP is not held in XLE because it isn’t in the S&P 500, so the fund isn’t a route to BP exposure.
The verdict on the headline: ExxonMobil stock has dominated in 2026, but only just. Chevron stock trails by two points and BP stock by four, and all three are winning primarily because crude oil has rallied. That’s a reminder that these gains depend on a commodity that swung from a 2026 high of $114.58 in April down to the low $70s earlier this month before this week’s rebound.
Investors can pick their trade-off: ExxonMobil for the cheapest multiple and best price action, Chevron for the balanced middle, or BP for income and turnaround upside. The next near-term cue is whether WTI crude oil can hold near $90 into Thursday’s close and whether it can reclaim $100 on a sustained basis, because oil is volatile and cyclical, and today’s tailwind can reverse quickly.
The post At $100 Per Barrel, Which Oil Stock Has Dominated in 2026: ExxonMobil, Chevron, or BP? appeared first on 24/7 Wall St..
]]>Schwab U.S. Dividend Equity ETF (NYSEARCA:SCHD) sits at the center of income-focused portfolios for a reason. SCHD tracks the Dow Jones U.S. Dividend 100 Index, screening for companies with at least 10 years of dividend payments, strong cash-flow-to-debt ratios, and consistent dividend growth. The fund currently offers a 3.2% dividend yield on $1.05 in annual distributions per share, backed by a 55% payout ratio at the fund level.
How SCHD Generates Its Income
Cost drag is minimal, as SCHD charges a 0.06% expense ratio against roughly $100.8 billion in assets, leaving nearly all of the underlying dividend stream intact for shareholders.
Evaluating the Top Holdings
- Coca-Cola (NYSE:KO) anchors the safety case. The company just raised its quarterly payout to $0.53 from $0.51, extending a 63-year streak of annual increases. FY2026 guidance calls for roughly $12.2 billion in free cash flow against $8.8 billion in dividends paid in 2025, leaving a meaningful cushion. Coca-Cola’s 28% net margin and 43% return on equity show a business that funds its dividend from operations, not balance-sheet stretching.
- Chevron (NYSE:CVX) raised its quarterly dividend to $1.78, its 39th consecutive annual increase. Q1 2026 free cash flow ran negative on timing effects, but FY2025 delivered $16.6 billion in free cash flow against a dividend load well under half that figure. The 3.8% yield is real, but energy-sector cyclicality means CVX’s payout is durable across cycles while still exposed to oil-price swings.
- Merck (NYSE:MRK) warrants the closest look. Merck lifted its quarterly dividend to $0.85 from $0.81, and the current payout is easily covered by earnings. The complication is structural. KEYTRUDA generates roughly half of pharma revenue and faces a late-decade patent cliff, and Merck has taken on $14.8 billion in combined acquisition charges for Cidara and Terns to diversify. The dividend is safe today; the pipeline transition determines whether growth continues past 2028.
- Lockheed Martin (NYSE:LMT) raised its quarterly dividend to $3.45, supported by a record $194 billion backlog. Q1 2026 free cash flow was negative on working-capital timing, but FY2026 guidance calls for $6.5 to $6.8 billion in free cash flow. Program-execution charges on F-16 and classified work are the recurring risk, but multi-year revenue visibility from the backlog is why the dividend keeps rising.
Total Return Context
Total return matters as much as yield here. SCHD trades at about $33, up 21% year to date and roughly 26% over the past year, with a 55% five-year gain. That total return context matters because the 10-year Treasury is near 4.6% and Fed funds are at 3.75%, both of which yield more than SCHD’s 3.2% payout in cash terms. Investors are accepting a lower current yield in exchange for dividend growth and equity appreciation, and historical numbers show that trade has worked.
The Verdict
The post Why Retirees Are Choosing This $100.8 Billion ETF Over Individual Dividend Stocks appeared first on 24/7 Wall St..
]]>Occidental Petroleum (NYSE:OXY) has become a case study in how far retail conviction can drift from professional caution. Shares closed at $57.50 on Wednesday, up 39.8% year to date and 6.9% in the past week alone, sitting 14.8% below the 52-week high. Reddit’s aggregate sentiment score for Occidental is currently pinned at 88, a “very bullish” reading held across all 10 measured intervals this week. Wall Street sees the same setup and shrugs.
The Reddit Trade Behind Occidental’s 88 Sentiment Score
Almost the entire retail signal traces back to a single r/options post titled “Oil is going to $150+ OXY $55 Jan 15th 2027 Calls,” which climbed to 228 upvotes and 92 comments before losing traction Wednesday. The thesis is straightforward crude speculation rather than a fundamental case, and it landed as Brent pushed above $94 on U.S. strikes against Iranian targets and Strait of Hormuz tensions.
The bullish framing rests on real business milestones:
- Q1 adjusted EPS of $1.06, comfortably beating the $0.58 consensus.
- Principal debt cut to $13.3 billion from $20.8 billion, funded by the OxyChem sale to Berkshire Hathaway (NYSE: BRK.B) that closed January 2.
- Dividend lifted to $0.26 per share, more than 8% higher and doubled over four years.
Analysts Keep Trimming Occidental Price Targets
The sell side is not buying the euphoria. The consensus target is $64.26, but the rating split leans neutral. In the past two weeks, Stephens cut its target to $69 from $73, HSBC to $68 from $73, and Jefferies trimmed to $56. Mizuho still expects a 6% downward bias to Q2 Street EBITDAX and cash flow estimates. On a trailing basis, Occidental trades at a P/E near 77, though the forward multiple compresses to 10, illustrating how much the bull case hinges on crude cooperating.
Chevron Sets the Sober Benchmark
Peer Chevron (NYSE:CVX) runs the same Permian playbook with a higher yield and none of the Buffett-associated retail mystique, which is exactly why Occidental’s Reddit crowd keeps piling in. The wrinkle worth tracking: former CEO Vicki Hollub disposed of 74,178 shares at nearly $59 on June 1, the largest insider sale in the recent window. Retail is trading a $150 oil narrative. Insiders and analysts are trading the earnings report.
The post Reddit’s Oil Bet on Occidental Clashes With Wall Street’s Caution appeared first on 24/7 Wall St..
]]>The pitch for the VistaShares Target 15 Berkshire Select Income ETF (NYSEARCA:OMAH) is almost too clever to ignore. You get a portfolio built around Warren Buffett’s publicly disclosed equity book, layered with a monthly cash distribution aiming for a 15% annualized yield. Berkshire Hathaway itself famously pays no dividend, so OMAH is essentially promising to bolt an income stream onto Buffett’s stock picks and hand you a check every month. For retirees who love the holdings but hate the zero yield, it sounds like a workaround Buffett himself refused to build.
Look under the hood, and OMAH does mirror the greatest hits. As of the April 2026 filing, the fund held Apple (NASDAQ:AAPL) at 9.97% of net assets, Berkshire Hathaway (NYSE:BRK.B) itself at 8.99%, and American Express (NYSE:AXP) at 8.35%, with meaningful slugs of Occidental Petroleum (NYSE:OXY), Coca-Cola (NYSE:KO), Chevron (NYSE:CVX), Bank of America (NYSE:BAC), Moody’s (NYSE:MCO), and Kraft Heinz (NASDAQ:KHC). That is a recognizable Berkshire silhouette. Total net assets sat near $748.6 million, so this is a real fund with real scale.
Where the 15% Actually Comes From
Here is the part the marketing skims over. Those underlying holdings throw off maybe 1% to 2% in cash dividends. The rest of the 15% target has to come from somewhere, and the somewhere is a short-dated call-writing overlay plus, when the math is short, return of capital. The N-PORT snapshot shows 74 derivative positions, structured as call spreads and outright short calls against the biggest names in the book. Selling calls generates premium. It also caps how much you can participate when a stock rips higher.
The VistaShares prospectus is refreshingly blunt about the rest. Distributions “may include amounts classified as return of capital,” which the document defines as “a return of a shareholder’s invested capital rather than income or profits.” It goes further: “To the extent that distributions exceed the Fund’s total returns, such payments will reduce the Fund’s net asset value.” If the strategy does not earn the 15%, the fund fills the gap by handing you back your own money and calling it a distribution. Do that long enough and NAV grinds lower, which means each future 15% target is being calculated off a smaller base.
What OMAH’s Returns Actually Show
OMAH launched in March 2025. Since inception, the ETF has paid monthly, most recently $0.23138 per share on June 30, 2026, with trailing 12-month distributions totaling $2.83514. On a total-return basis (dividends reinvested), OMAH is up about 16% since its March 5, 2025 launch, and shares closed recently at roughly $19. Over that same stretch, Berkshire’s own B shares are down roughly 4%, so the income overlay has actually rescued a stretch where owning Buffett directly hurt.
Fine. But zoom out and the mechanics still bite. The 0.98% expense ratio is steep for what is, at its core, a Berkshire clone plus a call-writing program. And the capped upside is not theoretical. When AAPL or GOOGL (NASDAQ:GOOGL) runs past the short strike, OMAH surrenders the difference. Over a normal Buffett-holdings decade, that giveback compounds.
Who This Fits, and Who It Fools
OMAH earns a spot in a portfolio only if you truly want monthly cash from a Berkshire-flavored basket and you accept two things. The 15% is a target rather than a guarantee, and part of it is often your own principal being recycled with a nicer label. For a retiree carving out a 5% to 10% income sleeve, that trade can be worth it, particularly in flat years for Berkshire.
For anyone treating the 15% as safe yield or expecting the total return of holding BRK.B outright over a long horizon, look elsewhere. A cheaper large-cap dividend ETF, or simply owning BRK.B and selling shares as needed, will usually get you closer to Buffett’s actual compounding, minus the return-of-capital sleight of hand.
The post A 15% “Dividend” ETF With Berkshire Stocks? Read This Before You Buy a Single Share appeared first on 24/7 Wall St..
]]>Dividend Aristocrats have earned their reputation the hard way: through recessions, rate cycles, and oil crashes, they kept raising the payout. The most persuasive proof point in this bundle comes from Federal Realty (NYSE:FRT), which has now stretched its increase streak to 58 consecutive years, the longest in the entire REIT industry. That is the kind of track record that lets passive income do the heavy lifting in a portfolio, and the five names below all lean on cash generation deep enough to keep the checks arriving on schedule.
Realty Income (O)
Realty Income (NYSE:O) yields 4.76% and pays it out monthly, which is exactly the cadence retirees want. The current monthly dividend sits at $0.271 per share, with an annualized rate of $3.252, and the company has now declared 670 consecutive monthly dividends and 114 consecutive quarterly increases since its 1994 NYSE listing.
Dividend safety here rests on AFFO coverage and scale. Q1 2026 AFFO per share came in at $1.13, up 6.6% year over year, and management raised full-year 2026 AFFO guidance to $4.41 to $4.44 per share, comfortably above the annualized dividend. Portfolio occupancy is 98.9% with a rent recapture rate of 103.4%, credit ratings sit at A3 from Moody’s and A- from S&P, and free cash flow yield is 6.30%. The bull case is simple: a diversified net-lease portfolio spanning over 15,500 properties leased to 1,786 clients, with 2026 investment volume guided up to $9.5 billion and new private capital vehicles with Apollo and GIC extending the runway.
The caveat is leverage. Net debt to EBITDA sits at 7.91x and full-year 2025 interest expense reached $1.13 billion against $471.3 million in impairment provisions, so any refinancing shock would pinch AFFO growth.
Federal Realty Investment Trust (FRT)
Federal Realty is the only REIT Dividend King, riding 58 consecutive years of dividend increases. The current quarterly dividend is $1.13 per share, for an indicated annual rate of $4.52, most recently paid on July 15, 2026.
The safety math is unusually clean for a REIT. Full-year 2026 Core FFO guidance was raised to $7.46 to $7.55 per diluted share, or 5.7% to 6.9% growth, and Q1 2026 Core FFO of $1.88 per share was up 10.6% year over year. That leaves the $4.52 annualized dividend covered many times over on FFO. Portfolio occupancy stood at 93.8% with a leased rate of 96.1%, cash rent spreads hit 13%, and the balance sheet was reinforced by an expanded revolver from $1.25 billion to $1.4 billion. The bull case is a premium, coastal, open-air retail portfolio (Santana Row, Pike & Rose, Assembly Row) whose higher-income consumer base keeps buying through cycles.
The risk is a rising interest expense environment for a REIT that is actively developing. Q4 2025 included a $7.4 million impairment, and refinancing costs could compress coverage if long rates stay sticky.
Chevron (CVX)
Chevron (NYSE:CVX) yields 3.48% and just extended its increase streak to 39 consecutive years. The current quarterly payout of $1.78 per share annualizes to $7.12, and management has now returned more than $5 billion to shareholders for 16 consecutive quarters.
Safety comes from a fortress balance sheet paired with real cash generation. Debt to equity is 0.25, net debt to EBITDA is 1.08x, and interest coverage is 13.70x. Full-year 2025 delivered operating cash flow of $33.9 billion and free cash flow of $16.6 billion, funding $27.1 billion in total shareholder returns. The Hess deal is now integrated, with Q1 2026 production up 15% year over year to 3,858 MBOED and the Permian sitting at 1 million BOE per day. CEO Mike Wirth framed the quarter this way: “This disciplined performance supports dependable cash generation, enabling us to continue returning significant capital to shareholders, while investing in advantaged long-lived assets.”
The caveat is commodity sensitivity. Brent averaged $64 per barrel in Q4 2025 versus $75 the prior year, and Alpha Vantage shows a payout that currently runs above trailing EPS with dividend per share of $6.91 against diluted TTM EPS of $5.74. Cash flow easily covers it, but sustained low crude would test the math.
T. Rowe Price (TROW)
T. Rowe Price (NASDAQ:TROW) offers a yield of 4.31%, backed by a current quarterly dividend of $1.30, up from $1.27 in 2025 and $1.24 in 2024. The annualized forward estimate is $5.20.
The dividend is easily covered. TTM diluted EPS is $9.34 against dividend per share of $5.11, operating margin runs at 37.2%, and return on equity is 18.7%. The balance sheet is debt-free with $3.73 billion in cash and equivalents, and Q1 2026 operating cash flow of $966.3 million funded $629 million returned to shareholders. Multi-asset advisory fees, the fastest-growing segment, rose 12.0% year over year, and AUM finished the quarter at $1.71 trillion. Trading at a forward P/E of 12, income investors get a well-covered payout at a modest multiple.
The caveat is the flows story. Net client outflows were $13.7 billion in Q1 2026 on top of $56.9 billion in full-year 2025, and the effective fee rate slipped to 38.4 bps. The dividend is safe today, but the growth rate depends on stabilizing active equity flows.

Franklin Resources (BEN)
Franklin Resources (NYSE:BEN) yields 3.87%, with a current quarterly dividend of $0.33 per share and an annualized forward rate of $1.32. The dividend has stepped up from $0.31 in early 2024 to $0.32 and now $0.33.
Coverage is anchored by a turnaround that is now visibly showing up in the numbers. Q2 FY2026 EPS came in at $0.71, beating consensus of $0.55, with operating income more than doubling year over year and long-term net inflows of $16.9 billion reversing prior outflows. AUM has climbed to $1.74 trillion as of April 30, 2026, alternatives fundraising totaled $14.3 billion in the quarter, and Canvas custom indexing grew 27% quarter over quarter. CEO Jenny Johnson called out “positive long-term net flows in every region”. Alpha Vantage shows a forward P/E of 11 and TTM operating margin of 17.2%, both supportive of the current payout.
The caveat is Western Asset Management, which still bled $4.1 billion in Q2 net outflows. Until that subsidiary stabilizes, headline flow numbers will keep needing an asterisk.

The Bottom Line
These five Aristocrats attack income from different angles: monthly cadence at Realty Income, the REIT industry’s longest increase streak at Federal Realty, energy cash flow at Chevron, and asset-manager operating leverage at T. Rowe Price and Franklin Resources. Every one is backed by earnings or AFFO that comfortably fund the current payout, and each has already raised the dividend in 2026. For an income investor who wants passive checks to carry the load, the combination of coverage, streak length, and yield here is doing exactly that.
The post These Dividend Aristocrats Yield Enough to Let Your Passive Income Do the Heavy Lifting appeared first on 24/7 Wall St..
]]>The ProShares S&P 500 Dividend Aristocrats ETF (CBOE:NOBL) pays a roughly 2% dividend yield built on a portfolio of 70 holdings, each of which has raised its dividend for at least 25 consecutive years. Income investors buy NOBL for a specific promise: that the underlying companies are so entrenched in their markets that quarterly dividend growth continues through recessions, inflation shocks, and rate cycles. That promise faces a test in mid-2026, especially across the five holdings most investors watch as bellwethers for the group.
How NOBL Generates Its Income
The Five Holdings That Anchor the Income Story
- Johnson & Johnson (NYSE:JNJ) just raised its payout to $1.34 per quarter, marking 64 consecutive years of increases. Q1 free cash flow fell 55% because of litigation charges, but the trailing payout ratio sits at roughly 61% of EPS. Management raised full-year guidance to $100.3 billion to $101.3 billion in revenue, suggesting the cash flow dip reflects timing. The dividend is safe.
- Procter & Gamble (NYSE:PG) has paid dividends for 136 consecutive years and lifted the payout to $1.0885 quarterly. Free cash flow of $3.03 billion in Q3 FY2026 grew 6.3% year over year, and the company plans roughly $10 billion in dividends this fiscal year. Tariff and commodity costs pressure margins, but P&G’s payout ratio near 62% of TTM EPS provides a cushion.
- Coca-Cola (NYSE:KO) generated $1.76 billion of Q1 free cash flow, up 131.9% year over year, against a $0.53 quarterly dividend. Operating margin expanded to 35.0%, and full-year free cash flow is guided to about $12.2 billion. With 60-plus years of raises and a payout ratio near 65%, this is one of the sturdiest income streams in the fund.
- McDonald’s (NYSE:MCD) pays $1.86 quarterly and has raised the dividend for roughly 48 straight years. Operating margin of 46.1% and loyalty sales above $38 billion on a trailing basis support the payout. Negative book value from buybacks reflects capital returns rather than distress.
- Chevron (NYSE:CVX) is the wobble in the group. Q1 free cash flow was negative $1.55 billion after unfavorable derivative timing and a legal reserve, and net income fell 37% year over year. The $1.78 quarterly dividend still increased this year, and interest coverage of 13.7 times plus $2.5 billion in Q1 buybacks show the balance sheet is intact. The risk lies in oil price sensitivity.
Total Return and Valuation
The Verdict on NOBL’s Distribution
The distribution is safe. Equal weighting spreads exposure so no single holding can break the income stream, and the average constituent has proven it will defend its dividend across cycles. Chevron’s quarter was weak, but its 1.4% weight limits the drag. Covered-call or high-yield alternatives offer higher current yield, though they sacrifice the growth compounding that has driven NOBL’s decade-long total return. For those prioritizing durable, rising income rather than maximum yield today, the aristocrat blueprint remains one of the more defensible income vehicles available.
The post 70 Dividend Aristocrats Face Their Mid-2026 Test: NOBL’s 2% Yield Under Pressure appeared first on 24/7 Wall St..
]]>The safety net keeping oil prices from spiking is nearly gone, and one analyst warns that when it runs out, the move could be sudden and severe.
“Crude oil is fast losing its strategic petroleum reserve buffer, and a violent repricing up cannot be discounted until the market sees toned-down rhetoric from both parties,” said June Goh, an analyst at Sparta Commodities. Her warning lands as the U.S. Strategic Petroleum Reserve drops toward a Reagan-era low, right as geopolitical risk around the Strait of Hormuz sits at its highest in years.
A Cushion Draining Toward 1983 Levels
The SPR hit a three-year low of 349.2 million barrels on June 5, 2026, and by July 3 was reported at around 319.5 million barrels. That already surpasses the prior low of 346.7 million barrels set in July 2023 during the Biden administration. Fall much further and the reserve reaches a level not seen since August 1983, when Ronald Reagan was in the White House.
The pace concerns analysts. Since the Iran conflict began, the Trump administration has drained more than 66 million barrels from the reserve as of June 5, and is authorized to release up to 172 million barrels in total. In one week alone, a record 9.92 million barrels were pulled, according to Fortune’s Jordan Blum. This represents rapid emptying of a stockpile meant for genuine emergencies.
Why the Reserve Is Emptying Now
With the Strait of Hormuz effectively closed, straining global oil flows, the administration has leaned on the SPR to keep U.S. exports moving and cap domestic gasoline prices. Pump prices have stayed contained, $3.85 per gallon as of July 13, even after WTI briefly touched $114.58 per barrel in April. But every barrel released is one less cushion for the next shock.
Patrick De Haan, head of petroleum analysis at GasBuddy, underscored how unusual the moment is. “It’s a pretty monumental number to hear multidecade lows reached,” he said. “The longer this goes on the fewer tools the administration has in dealing with it and the more risk there is to a slingshot for costs.”
The “Danger Zone” and Where Prices Could Go
UBS has warned of a crude “danger zone” as SPR buffers disappear. On price, Eurasia Group sees oil rising toward $95 a barrel, and TD Securities says $100 a barrel is plausible if physical shortages become obvious. These are scenarios that become more likely as the buffer thins.
The SPR was created after the 1970s Arab oil embargo and peaked at 726.6 million barrels in December 2009. Today, at around 319.5 million barrels, it holds a fraction of that. China now sits on the world’s largest reserve, roughly 1.4 billion barrels, more than four times the current U.S. stockpile.
Energy Equities Have Already Moved
Investors positioned for supply tightness have been rewarded. Exxon Mobil (NYSE:XOM) is up 24.1% year to date, Chevron (NYSE:CVX) has climbed 25.28%, and the Energy Select Sector SPDR Fund (NYSEARCA:XLE), where Exxon and Chevron together represent roughly 41% of holdings, is up 30.77%. Both majors flagged Middle East disruptions as material headwinds in their Q1 filings.
A Risk That’s Building
The framing is one of elevated risk. Goh tied the “violent repricing” scenario to the absence of toned-down rhetoric, meaning diplomacy could defuse it. This is danger accumulating quietly. The SPR has been doing heavy lifting to keep gas prices calm through a Middle East conflict. Now it is running low, at the same moment the risks it exists to offset are running high. Whether the market lands softly or violently may come down to what happens next in the Strait of Hormuz.
The post Oil Analyst Warns of ‘Violent Repricing’ as US Oil Reserves Fall to a Level Not Seen Since the Reagan Administration appeared first on 24/7 Wall St..
]]>Antero Resources (NYSE:AR) has quietly become one of the most strategically attractive assets in U.S. energy. The Appalachian pure-play carries a market cap of roughly $10.3 billion, trades at 11x trailing earnings and an EV/EBITDA of 7.05, yet delivered record production of 3.9 billion cubic feet equivalent per day (Bcfe/d) in Q1, up 13% year over year, with free cash flow of $657 million.
CEO Michael Kennedy laid out the takeover pitch himself: “We have the highest LNG exposure among Appalachian producers, selling 2.3 Bcf per day of production to sales points along the LNG fairway” and “we are the largest producer-exporter of NGLs in the U.S.” With Henry Hub spot at just $3.44 per million British thermal units (MMBtu), Antero still realized $5.57 per million cubic feet (Mcf) on gas, proof of premium export capture. Shares are down 7.9% over the past year to $33.35, well below the analyst target of $48.75. Insiders have been net sellers, with CFO-connected executives disposing of shares near $39 in May.
Ranking the Likely Acquirers, Weakest Case First
4. Chevron: The Longest Shot
Chevron (NYSE:CVX) has the balance sheet at a $366.2 billion market cap, and it recently completed the acquisition of Hess. Its Permian and deepwater focus makes Appalachian gas a stretch, though a Microsoft data-center power joint venture offers only a tenuous strategic link. Antitrust would be easy; strategic fit is the problem.
3. TotalEnergies: Global LNG Trader Angle
TotalEnergies (NYSE:TTE) grew integrated liquefied natural gas (LNG) sales 10% to 43.9 metric tonnes (Mt) and signed onto Rio Grande LNG Train 4. Antero’s export-linked barrels would feed the French supermajor’s global book. Scrutiny from the Committee on Foreign Investment in the United States (CFIUS) and cultural fit are the main drags.
2. ConocoPhillips: The Serial Acquirer
ConocoPhillips (NYSE:COP), fresh off Marathon Oil integration and targeting $7 billion incremental FCF by 2029, holds 10 MTPA of Port Arthur LNG offtake. Antero’s Gulf-linked gas would plug directly into that portfolio, and COP has proven M&A muscle.
1. EQT: The Obvious Buyer
EQT (NYSE:EQT) is the largest U.S. gas producer at a $30.8 billion market cap, trading at 4.82 EV/EBITDA. CEO Toby Rice has told investors, “accelerating power demand growth in the United States, particularly in Appalachia, is creating incremental opportunities in our backyard.” Geographic overlap, shared LNG contracting, and EQT’s $1.83 billion Q1 free cash flow make this the cleanest fit. Antitrust review would be the main hurdle.
Where Private Equity Fits
Energy-focused private equity firms (EnCap, NGP, Quantum, Blackstone Energy) could bid, but a $10 billion public E&P with an investment-grade credit profile and integrated midstream operations exceeds typical PE sweet spots. PE ranks below Chevron: strategic synergies cannot match EQT’s, and financing costs erode the arbitrage. Keep an eye on the stock as consolidation logic tightens across Appalachia.
The post Antero Resources Is in Play: Which Energy Titan Will Acquire It? appeared first on 24/7 Wall St..
]]>Shares of Apple (NASDAQ:AAPL) are up 4% Wednesday afternoon to a fresh record of $327, extending a rally that now has Apple stock up 20% year to date (YTD). The move puts Apple on pace for its 15th intraday record of 2026 and lifts the company’s market value to nearly $5 trillion.
Apple has added more than half a trillion dollars in market value this month alone, leading the Dow Jones into mid-July. The move sits on top of a trailing-12-month P/E ratio of 39.67x, a premium multiple that raises the bar for the next leg higher. With shares now flirting with $330, the natural question for Apple investors is what it would actually take to punch through $350.
Catalyst: Citi Lifts AAPL’s Price Target to $365
The immediate spark is a fresh Wall Street endorsement. Citi analyst Asiya Merchant raised her AAPL price target to $365 from $315 on July 13, maintaining a Buy. Her thesis leans on record smartphone share of 25%, continued PC share gains, and pricing power evidenced by management’s gross margin guide of 48% to 49% despite the memory-chip shortage squeezing rivals that buy on the spot market.
Services stickiness is the other pillar. Apple posted an all-time Services revenue record of $30.98 billion in Q2 FY2026, alongside iPhone revenue of $56.99 billion and revenue growth of 17% year over year (YoY). A smarter Siri, framed as the tool that keeps users inside the ecosystem, is Citi’s perceived mechanism for compounding that recurring revenue.
What Would It Take for AAPL to Hit $350?
From here, $350 is another meaningful leg higher, and the model math tells a nuanced story. Our internal framework pegs a base-case one-year target of $359 with a BUY rating and 10% upside, with a bull case of $411 and a bear case of $305. Citi is at $365, and JPMorgan sits at $345.
The tension is that Wall Street’s average target is only $317, which is already below where Apple stock trades. Apple has effectively run past the consensus estimate, so a move to $350 requires the bullish drivers to keep delivering: iPhone 17 momentum, Services growth in the mid-teens, and margin expansion despite input-cost headwinds. The prediction markets echo the caution, with only a 0.395 probability of AAPL hitting $344 during July.

The bear case is worth noting for AAPL stock. It rests on the premium 39.67x valuation, that below-market consensus target, memory-cost pressure that could compress product gross margin, softer smartphone and PC end markets, and Apple’s recently filed lawsuit against OpenAI over alleged trade-secret theft. Investors weighing their position sizes should treat $350 as achievable but not automatic.
Peers and the Broader Rally
Apple stock isn’t moving alone atop the Dow. Goldman Sachs (NYSE:GS) and Chevron (NYSE:CVX) are the index’s other July leaders for very different reasons. Goldman Sachs stock is up 30% YTD after posting record Q2 2026 diluted EPS of $20.98, and Chevron stock is up 19% YTD on the crude oil recovery.
Mega-cap tech is broadly participating, including NVIDIA (NASDAQ:NVDA), with NVIDIA stock up 13% YTD on sustained AI-infrastructure demand. For diversified exposure with Apple as a top holding, the NASDAQ 100 tracking Invesco QQQ Trust (NASDAQ:QQQ) captures the mega-cap-tech theme, though the ETF remains concentrated in a handful of names, which cuts both ways when leadership narrows.
What to Watch
The next real test comes fast. Apple reports its Q3 FY2026 earnings on July 30, with the consensus estimate calling for EPS of $1.88, up 20% YoY. Citi frames the iPhone 18 launch in September as the key sentiment inflection for the second half, and Polymarket assigns a 97% probability that the launch happens this year.
Investors can watch for whether Apple’s gross margin guidance holds through the memory-cost squeeze, whether Services stays in the mid-teens growth zone, and whether the pace of the $100 billion buyback authorization keeps supporting the tape. Given the roughly 39x multiple and a consensus target sitting below the stock, investors should consider keeping their AAPL stock position sizes modest and adding on pullbacks rather than chasing record closes. A move to $350 is well within reach if the bullish drivers keep firing, but it’s the July 30 earnings report, not today’s tape, that could decide whether this rally will persist in the long run.
The post Apple Is Up 20% in 2026. What Will It Take for AAPL Stock to Hit $350? appeared first on 24/7 Wall St..
]]>Social Security’s cost-of-living adjustment is a floor, not a raise. The 2026 Social Security COLA is 2.8%, which means retirees leaning on that check for real spending power need income streams that clear that bar without breaking a sweat. The three names below all pay yields that top 2.8%, and each one carries a dividend record long enough to matter. Safety, not yield chasing, is what qualifies them here.
Realty Income (NYSE: O)
Realty Income (NYSE:O) is the net lease REIT that has branded itself “The Monthly Dividend Company,” and the branding is earned. The current yield sits at 5.12%, and shareholders collect it in twelve installments rather than four. The most recent monthly declaration was $0.271, with an annualized forward estimate of $3.252.
On safety, the coverage math works. Realty Income’s 2026 AFFO guidance sits at $4.41 to $4.44, implying 3.0% to 3.7% growth, against an annualized dividend of $3.246. That leaves clear headroom on the funds available to pay the distribution. Portfolio occupancy stands at 98.9% with rent recapture of 103.4%, and Q1 2026 AFFO per share of $1.13 rose 6.6% year over year. Balance sheet leverage improved to Net Debt to Annualized Pro Forma Adjusted EBITDAre of 5.2x from 5.4x. The dividend track record is the headline: 670 consecutive monthly dividends declared and 114 consecutive quarterly increases, confirmed by an unbroken monthly dividend history going back to at least 1999, spanning 27 years.
The bull case for an income investor is simple: a monthly check that has been raised, in small increments, essentially every quarter, backed by a diversified global net lease portfolio and an $9.5 billion 2026 investment volume guide. Shares are up 16.81% year to date, so total return is showing up alongside the payout.
The caveat: interest expense and impairments remain a live headwind. Q1 2026 carried $129.3 million in impairment provisions and interest coverage of only 1.42x. That is the price of running a leveraged real estate model in a higher-rate world.
Verizon (NYSE: VZ)
Verizon (NYSE:VZ) is the ultra-high-yield name in this trio. The current yield reads 6.66%, comfortably above the 6% threshold and roughly triple the COLA benchmark. The quarterly dividend was raised to $0.7075 from $0.69, with an annualized forward estimate of $2.83.
Safety here is about cash generation, not accounting earnings. 2026 adjusted EPS guidance sits at $4.95 to $4.99, up 5% to 6%, and 2026 free cash flow guidance is $21.5 billion or better, up roughly 7% year over year. That FCF envelope easily covers the dividend commitment plus the $2.5 billion in Q1 2026 buybacks, on pace for $3 billion or more this year. On the track record, the dividend has been paid quarterly without interruption for 27+ years, with the current $0.7075 quarterly rate up from $0.665 in Q3 2024.
The bull case is a turnaround with proof points. Under CEO Dan Schulman, Verizon posted its first positive Q1 postpaid phone net adds since 2013, and the Frontier acquisition expanded the fiber footprint past 30 million homes. Income investors get a real yield on a business that finally shows subscriber traction. If you are building a paycheck-style portfolio around names like this, our From $250K to $1,500 a Month research walks through how high-yield telecom, REIT, and energy income can be layered on top of Social Security.
The caveat is the balance sheet. Total debt sits at $172.5 billion with net unsecured debt leverage at 2.6x after the Frontier deal. Add churn ticking up to 0.97% and ARPA slipping 1.9% year over year, and integration risk is real. The yield gets paid, but debt servicing capacity is what income holders should keep watching.
Chevron (NYSE: CVX)
Chevron (NYSE:CVX) rounds out the group with the lowest headline yield of the three but arguably the sturdiest income structure. The current yield reads 3.97%, still comfortably ahead of the 2.8% COLA. The quarterly dividend was raised 4% to $1.78 per share, verified in the payment schedule showing $1.78 quarterly in 2026 versus $1.71 in 2025 and $1.63 in 2024.
On safety, the balance sheet does the heavy lifting. Debt to equity of 0.25, net debt to EBITDA of 1.08, and interest coverage of 13.7x is fortress-level for an integrated oil major. Cash generation backs the payout: FY 2025 operating cash flow was a record $33.9 billion with free cash flow of $16.6 billion, and Chevron returned $27.1 billion to shareholders in 2025, including $12.1 billion in buybacks. Q1 2026 buybacks of $2.5 billion marked the 16th consecutive quarter of returning $5 billion or more annually. On the track record, this is the 39th consecutive annual dividend increase, and the dividend history data confirms an uninterrupted quarterly payment pattern with no year-over-year decreases across the entire 27-year dataset.
The bull case: a dividend grower with a real production tailwind. Q1 2026 production hit a record 3,858 MBOED, up 15% year over year, on the back of Hess integration and Permian scale, with structural cost cuts targeting $3 to $4 billion by end of 2026. Shares are up 21.81% year to date, so the dividend is being paid on rising equity value, not falling.
The caveat is what it always is with an oil major: commodity prices set the tone. Q1 2026 net income fell 37% year over year, and free cash flow ran negative at -$1.55 billion on working capital timing. The FCF profile easily supports the dividend across a cycle, but a single quarter can look ugly when crude prices roll over.
The Bottom Line
These three names give income investors three different ways to clear the 2.8% COLA hurdle. Realty Income delivers the monthly cadence and the longest unbroken payment record. Verizon delivers the fattest yield and a real FCF cushion behind it. Chevron delivers the strongest balance sheet and the most robust dividend growth streak of the group. Different engines, same job: paying a check that grows faster than the government’s inflation adjustment.
The post 3 Dividend Stocks That Pay More Than Social Security COLA appeared first on 24/7 Wall St..
]]>US gasoline prices spent the spring of 2026 on a rollercoaster driven by Middle East supply disruptions. The FRED weekly regular gasoline series peaked at $4.50 per gallon on May 11 before easing to $3.78 by July 6, just ahead of the July Fourth holiday. Prices edged back up to about $3.85 the following week, and even after the pullback, they remained elevated, sitting around the 72nd percentile of their trailing 52-week range. For energy stocks, that keeps the setup constructive without looking overheated: consumers got some relief at the pump, but with Middle East tensions on again, off again, gasoline prices are still volatile enough to support margins across parts of the refining and integrated oil trade.
1. Valero Energy (VLO)
Valero Energy (NYSE:VLO) is the purest bet on wider crack spreads. As a stand-alone refiner, gasoline and distillate margin expansion can flow quickly to earnings. Refining is a bright spot. Q1 2026 refining operating income swung to $1.8 billion from a $530 million loss a year earlier, and US Gulf Coast distillate margins jumped to $27.60/bbl versus $16.69/bbl in Q1 2025. EPS of $4.22 beat the $3.16 consensus.
On the earnings call, Valero COO Gary Simmons flagged “distillate inventories at five-year lows” and US product exports up 470,000 barrels a day year over year as factors helping keep crack spreads wide. VLO shares are up 81.9% year to date, trading at a forward P/E of 10.
Risk: the idled Benicia refinery and a March fire in the diesel hydrotreater at Port Arthur.
2. Phillips 66 (PSX)
Phillips 66 (NYSE:PSX) captures refining upside alongside a midstream fee stream that softens volatility. Worldwide realized refining margins expanded to $10.11/bbl in Q1 2026 versus $6.81/bbl a year earlier, and adjusted EBITDA hit $1.27 billion versus $736 million in Q1 2025. Adjusted Q1 EPS of $0.49 handily beat the -$0.39 consensus, though $839 million in mark-to-market derivative losses masked the physical margin strength.
CEO Mark Lashier said the firm is positioned to “navigate market volatility due to our integrated business and strength of our balance sheet.”
Shares are up 55.0% year to date. Debt-to-cap climbed to 48% from 39% after the WRB and Lindsey acquisitions, so leverage is the offset to margin upside.
3. Exxon Mobil (XOM)
Exxon Mobil (NYSE:XOM) benefits at both ends of the barrel: upstream realizations and refining crack spreads. Underlying Q1 earnings hit $8.8 billion excluding some items versus $7.58 billion a year earlier, with the Energy Products segment alone delivering $2.8 billion excluding certain items, up $2 billion year over year. Production reached 4.6 million oil-equivalent bpd.
CEO Darren Woods warned “there is more to come if the Strait remains closed.” Golden Pass LNG Train 1 shipped its first cargo in April, adding roughly 5% to US LNG exports versus 2025.
Shares are up 20.3% year to date with a 2.99% dividend yield backed by 43 straight years of increases. This ranks alongside coverage in our Wealth Blueprint reports on dividend-anchored energy compounders.
4. Chevron (CVX)
Chevron (NYSE:CVX) combines Permian scale with the newly integrated Hess assets. Worldwide production hit 3,858 MBOED, up 15% year over year, and US output topped 2 million bpd for a third straight quarter. Q1 adjusted earnings of $1.41 per diluted share beat the $0.97 estimate, though $2.9 billion in unfavorable hedging results weighed on GAAP results. CEO Mike Wirth is expanding equity crude into refineries to over 40% in Asia and north of 50% in the US, which could deliver a structural margin lift.
CVX YTD return is 19.4%, with a 3.9% dividend yield and 39 consecutive annual hikes.
5. ConocoPhillips (COP)
ConocoPhillips (NYSE:COP) is the pure upstream play with no refining hedge, giving it the cleanest crude and natural gas price sensitivity. Henry Hub averaged $5.05/MMBTU in Q1 2026 versus $3.65 a year earlier, lifting Q1 adjusted EPS to $1.89 versus a $1.69 estimate. Total realized price was $50.36/BOE. Marathon Oil integration is delivering over $1 billion in run-rate synergies, and management targets $7 billion in incremental free cash flow by 2029.
COP shares are up 18.6% year to date. The 2026 production guidance excludes Qatar due to Middle East uncertainty, leaving geopolitics as the key risk.
Conclusion
The common thread is supply tightness: The EIA estimates that global oil inventories fell by an average of 5.1 million bpd in Q2 2026 and are expected to drop by another 2.2 million bpd in Q3, even as Middle East production and exports recover. Brent implied volatility has averaged 78% since the conflict began. Refiners with heavy sour flexibility (VLO, PSX) capture the widest crack spreads, integrated majors (XOM, CVX) monetize both ends, and COP offers the highest upstream beta. The counter-risk is speed of resolution: WTI pulled back 26.2% over the past month to below $70/barrel, before its latest rally, a reminder that geopolitical premiums can compress as quickly as they expand.
The post 5 Stocks Poised to Benefit the Most When US Gas Prices Soar appeared first on 24/7 Wall St..
]]>
For much of 2026, investors kept their attention on artificial intelligence, earnings growth, and record stock prices. Energy markets stayed relatively calm despite persistent geopolitical tensions. That calm has now shattered.
President Trump declared the ceasefire with Iran over as the U.S. resumed strikes against targets inside Iran after Tehran began targeting vessels transiting the Strait of Hormuz. Iran announced the Strait of Hormuz closed “until further notice.” The conflict has since grown into a broader military confrontation, and the world’s most important oil chokepoint has become the defining variable in global energy markets.
Why the Strait of Hormuz Matters So Much
According to the U.S. Energy Information Administration (EIA), roughly 20 million barrels of crude oil and petroleum products passed through the Strait of Hormuz each day before the conflict began. The Congressional Research Service, citing 2025 data, puts the strait’s share of world maritime crude and petroleum trade at about 25%, with roughly 19% of global liquefied natural gas (LNG) also flowing through the passage. There are few alternative shipping routes capable of absorbing that volume, which is why even a partial disruption sends shockwaves across the global economy.
| Metric | Figure |
| Oil flowing through Strait of Hormuz (pre-conflict) | ~20 million barrels/day |
| Share of world maritime crude and petroleum trade | ~25% |
| Share of global LNG trade | ~19% |
Sources: U.S. Energy Information Administration; Congressional Research Service (2026)
The disruption has already proven historic in scale. The International Energy Agency (IEA) formally classified the crisis as the largest oil supply disruption in the history of the global oil market, surpassing even the 1973 OPEC embargo that originally prompted the IEA’s creation. Global oil supply plummeted by 10.1 million barrels per day in March alone, as attacks on Middle Eastern energy infrastructure and near-total tanker restrictions through the strait forced Gulf producers to slash output by at least 10 million barrels per day. By early September 2026, oil product shipments through Hormuz had recovered only to around 1 million barrels per day, a fraction of the roughly 4 million barrels per day that moved through the strait before the war.
Uncertainty about how long the closure will persist has kept crude prices well above the levels seen earlier in 2026. Oil prices had briefly retreated toward the mid-$60 to $70 a barrel range after a temporary ceasefire, but the resumption of hostilities pushed prices sharply higher. As of early September 2026, Brent crude had climbed back toward $97 a barrel, while West Texas Intermediate (WTI), the U.S. benchmark, rose to roughly $92. At the peak of the crisis in March, Brent surged above $114 a barrel before retreating on reports of potential U.S. military intervention to reopen the strait.
Higher Oil Prices Reach Far Beyond the Gas Pump
Oil rarely stays confined to the energy sector. It works its way into transportation costs, manufacturing, agriculture, airline operations, and consumer prices across the economy. The consequences of the Hormuz disruption are already showing up in official data rather than just in analyst forecasts.
The U.S. Bureau of Labor Statistics reported that energy prices rose 15.7% year-over-year through June 2026, with gasoline prices surging 26.7% over the same period. Energy was also the largest contributor to the August CPI reading, rising 2.1% in a single month. That inflation is unfolding against a backdrop in which many economists had expected price pressures to keep easing through the second half of 2026. Instead, the all-items CPI stood at 3.4% year-over-year in August, with energy acting as a persistent upside driver.
Brent crude has already crossed the $100 per barrel threshold that was treated as a worst-case scenario earlier in the year. If prices push toward the $130 to $170 range that some analysts have projected for a prolonged closure, businesses would face severe input cost pressures while consumers absorb higher costs for gasoline, diesel, jet fuel, and utilities. That combination risks converting what began as a geopolitical shock into a broader economic slowdown.
Oil-producing companies have been clear beneficiaries so far. Integrated producers such as Exxon Mobil (NYSE:XOM) and Chevron (NYSE:CVX) generate stronger cash flow when crude prices rise, and oil service companies have seen drilling activity increase as elevated prices have persisted. U.S. crude exports have also responded, soaring more than 60% from pre-war levels to a record high of nearly 6.5 million barrels per day, according to the EIA. The flip side is real pain for airlines, cruise operators, trucking companies, and industrial manufacturers whose profit margins narrow as fuel expenses climb.
Policymakers have tried to cushion the blow. On March 11, 2026, IEA member countries agreed to release 400 million barrels of oil from emergency reserves, the largest coordinated stock release in the agency’s 52-year history. Still, reserve drawdowns can provide only a temporary buffer. The IEA itself noted that “resuming flows through the Strait of Hormuz remains the single most important variable in easing the pressure on energy supplies, prices and the global economy.”
Key Takeaway
This is no longer simply a geopolitical headline. The Strait of Hormuz is the world’s most critical energy artery, and the ongoing U.S.-Iran conflict has already produced the largest oil supply disruption on record. Inflation has reaccelerated, crude has broken above $100 a barrel, and the IEA has deployed its largest-ever emergency reserve release to slow the damage. The question facing investors is no longer whether the Strait of Hormuz disruption will have economic consequences; it is how severe and how long-lasting those consequences will prove to be.
Delegates at the Asia Pacific Petroleum Conference in September 2026 reached a sobering consensus: the standoff is likely to persist through the end of President Trump’s current term, meaning markets may need to treat the current supply disruption as a structural baseline rather than a temporary premium. For investors, tracking crude oil benchmarks is now every bit as important as watching quarterly earnings reports, and possibly more so.
Editor’s note: This article was updated to reflect current oil price levels (Brent near $97, WTI near $92 as of early September 2026, up sharply from the $76 and $71 figures cited at publication), the IEA’s classification of the Hormuz closure as the largest oil supply disruption in history (10.1 million barrels per day lost in March), the agency’s record 400-million-barrel emergency reserve release, Bureau of Labor Statistics data showing energy prices up 15.7% year-over-year through June 2026, and the Congressional Research Service’s updated figure that 25% of world maritime crude and petroleum trade transited the strait in 2025.
The post After Iran Says Strait of Hormuz Is Closed Again, Oil’s Risk to Economy Rises Once More appeared first on 24/7 Wall St..
]]>Less than a month in, the US-Iran ceasefire is starting to look like a pause between rounds. Earlier this week, Washington struck more than 80 Iranian targets in response to attacks on three commercial vessels in the Strait of Hormuz, the US Treasury revoked the sanctions waiver that had allowed Iranian oil sales, and Tehran claims it hit back at US bases in Kuwait and Bahrain. Brent climbed 2.7% to $76 a barrel on the news, as reported on Bloomberg’s Daybreak Europe by Abeer Abu Omar.
For a market that had spent the spring pricing in a return to normal after Brent touched $138.21/bbl on April 7, the message is clear. The risk premium is not going anywhere.
The Escalation and Why It Matters Now
Before the waiver was pulled, Iran was moving roughly 1% to 2% of global oil supply. That volume now goes offline. LNG traffic has largely stopped transiting the Strait on shipping caution, which rattles the tanker market. The EIA’s May Short-Term Energy Outlook already flagged this scenario, warning that even after flows resume, it will take until late 2026 or early 2027 for most pre-conflict production and trade patterns to resume.
Camille de Courcel of BNP Paribas argued there is “no return to pre-war levels” for oil, and that is precisely why central banks remain cautious.
Energy Stocks Are Repricing the Risk Premium
Chevron (NYSE:CVX) is up 3.7% over the past 5 days, trading around $174.7. That reaction sits atop a Q1 in which CEO Mike Wirth flagged “heightened geopolitical volatility and related supply disruptions,” and Chevron delivered adjusted EPS of $1.41, beating expectations of $0.97. Chevron has direct exposure to Israel through its Tamar and Leviathan gas fields, so the headline risk cuts both ways.
Exxon Mobil (NYSE:XOM) is flat over the past 5 days and 31.56% higher over the past year. Exxon absorbed a $706 million hit tied to Middle East supply disruptions in Q1, disclosed in its May 8-K filing, and CEO Darren Woods argued the company is “built to perform through disruption and across market cycles.” On Reddit’s r/wallstreetbets, retail sentiment on XOM has been running bullish in 7 of 9 snapshots this week, concentrated in a thread titled “What is going on with Oil prices?”
ConocoPhillips (NYSE:COP) yanked Qatar from its 2026 guidance, a 20 MBOED annual adjustment. The stock is up 3.9% over the past week. Pure-play upstream names carry the cleanest leverage to Brent staying north of $80, though they also carry operational headaches when tankers stop moving.
The counter-play is Marathon Petroleum (NYSE:MPC), whose crude sourcing is “insulated from ongoing Middle East supply pressures.” Marathon is up 69.6% year to date, and Q1 blended refining margins expanded to $17.74 per barrel from $13.38 a year earlier. Refiners gain wider crack spreads when input volatility punishes competitors who cannot pivot.
Then there is Cheniere Energy (NYSE:LNG), which raised 2026 EBITDA guidance to $7.25 to $7.75 billion after exporting a record 187 LNG cargoes in Q1. CEO Jack Fusco argued, “the elevated volatility in global energy markets today further signals the need for additional investment in reliable, secure LNG capacity.” The stock is up 6.69% this week alone.
What This Does to the Rate-Cut Story
The Fed has held at up to 3.75% since December 10, 2025, seven months of patience while inflation refused to fully behave. The energy component of PCE ran 24.26% year-over-year in May 2026, a stunning swing from the -3.77% deflation posted in May 2025. Headline PCE is now at 4.07% YoY. Core PCE, at 3.41%, lets doves sleep, arguing the shock is an energy story rather than a wage story. That argument holds only if oil comes down. If Brent camps above $80 and gasoline climbs off the recent $3.78 print, the case for further cuts thins fast. The 10-year Treasury already reflects this.
Watch two things into the back half of July. First, whether Iran actually loses its export flows or finds another gray-market outlet, because that determines how tight the barrel math gets. Second, whether the Fed’s July meeting language shifts on energy pass-through. A ceasefire that cracks moves oil and the entire duration trade underneath every stock in your portfolio.
The post Oil Is Spiking and the Iran Ceasefire Is Cracking: What It Means for Your Stocks appeared first on 24/7 Wall St..
]]>Warren Buffett spent decades assembling Berkshire Hathaway’s equity book around a simple principle: Own high-quality businesses that produce predictable cash flow and share it with owners. Three of the longest-tenured holdings in that portfolio, Coca-Cola, American Express, and Chevron, all pushed their dividends higher over the past six months, and each offers a distinct income and growth profile heading into the back half of 2026. Here’s why July is a reasonable window for investors to examine each one.
Coca-Cola (KO)
Coca-Cola (NYSE:KO) has been the archetypal Buffett income holding for decades, and the fundamentals still look sturdy. The company delivered $816 million in dividend income to Berkshire in 2025 alone, on a cost-basis yield that Berkshire’s disclosures pegged at 65%. That is what compounding at scale looks like.
Q1 2026 results reinforced the thesis. Coca-Cola posted EPS of 86 cents against the 81 cents expected, with revenue of $12.47 billion up 12.1% year over year and organic revenue growth of 10%. Operating margin expanded to 35.0% from 32.9%, and Coca-Cola Zero Sugar volume grew 13%. Management guided FY2026 organic revenue growth to 4-5% and comparable EPS growth to 8-9%.
The current quarterly dividend sits at 53 cents per share, up from 51 cents in 2025, extending a streak of annual increases that now stretches back more than six decades. Shares traded around $83.93 on July 8, up more than 21% year to date. The forward P/E of 26 is not cheap and a dividend yield of 2.53% reflects that.
The risk: FX headwinds, a $960 million BODYARMOR impairment, and roughly 4% headwind from divestitures including the pending Coca-Cola Beverages Africa sale can weigh on reported growth even as the underlying business hums.
American Express (AXP)
American Express (NYSE:AXP) is the growth engine of the Buffett dividend trio. The company recently raised its quarterly dividend from $0.82 to $0.95 per share, roughly a 16% bump, and Berkshire collected $479 million in AXP dividend income during 2025 on a 44% cost-basis yield. The stock has gained nearly 125% since the start of 2023, elevating its weight in Berkshire’s equity portfolio.
Q1 2026 numbers were strong across the board. AXP reported EPS of $4.28 versus $3.99 expected, revenue of $18.91 billion, and net income of $2.97 billion, up 15%. Billed business hit $428.0 billion, and card member spending climbed 10%, the highest quarterly growth in three years. Net card fee revenues grew double digits for a 30th consecutive quarter. The write-off rate improved to 2.0% from 2.1%. Management reaffirmed FY2026 guidance of 9% to 10% revenue growth and EPS of $17.30 to $17.90.
CEO Stephen J. Squeri said, “We had a very strong start to the year, reflecting continued momentum across our premium customer base.” Shares traded around $337.34 on July 8 after an 8.02% rally over the past month, with a forward P/E of 20 and analyst target of $366.58.
The risk: Macro and geopolitical uncertainty, potential credit card interest rate caps, and rising variable engagement costs could compress margins if premium spending slows.
Chevron (CVX)
Chevron (NYSE:CVX) is the highest-yielding name in this group and the one most tied to the commodity cycle. The quarterly dividend was recently raised to $1.78 per share, up from $1.71, extending a 39-year streak of annual increases. Trailing yield sits near 4.08%.
Q1 2026 marked Chevron’s sixth consecutive EPS beat. Adjusted EPS came in at $1.41 versus 97 cents expected, a 45.56% beat. Worldwide net oil-equivalent production jumped 15% to 3,858 MBOED, powered by the Hess acquisition and record U.S. output above 2 million bpd for a third straight quarter. Chevron repurchased $2.5 billion in Q1, its 16th consecutive quarter returning more than $5 billion to shareholders. In 2025 alone, the company returned $27.1 billion to shareholders.
Wolfe Research upgraded CVX to Outperform with a $210 price target on July 6, citing Guyana as a near-term free cash flow catalyst. CEO Mike Wirth said, “Chevron delivered solid first quarter performance, underscoring the resilience of our portfolio and the value of disciplined execution.” Shares traded around $175.66 on July 8, still up nearly 13% year to date despite a roughly 17% pullback from their 2026 high.
The risk: Citigroup sees Brent falling to $60–$65/barrel by year-end, and Goldman Sachs forecasts a 3 million bpd global oil surplus by 2027. Political friction in California and Venezuela operational uncertainty add to the volatility.
What to Watch Next
Each of these Berkshire mainstays offers a different flavor of the same underlying thesis: durable brands, disciplined capital returns, and dividends that keep climbing. Coca-Cola gives defensive stability, American Express supplies dividend growth with premium-consumer torque, and Chevron delivers the highest current yield with commodity optionality. Upcoming Q2 earnings reports across all three will be the next major test.
The post 3 Warren Buffett Dividend Stocks to Buy in July appeared first on 24/7 Wall St..
]]>Fresh tanker attacks in the Strait of Hormuz prompted the US Treasury Department to revoke a waiver allowing Iranian oil sales, and WTI crude jumped more than 5% on the news. Don Striven, co-head of global commodities research at Goldman Sachs, reframed this on Bloomberg Radio around three calls that extend well past a single price spike.
The ‘Staggering’ China Number
Striven’s anchor point: China’s crude import demand is down a staggering 5 million barrels per day year over year, a 50% drop. Oil flows from the Persian Gulf have recovered to roughly 75% of normal (including pipelines), but demand is not recovering at the same pace. Goldman expects about 90% of that demand weakness to unwind in coming quarters, but the remaining 10% may be permanent.
“I think the largest oil supply shock ever, the Hormuz shock, will validate the Chinese strategy to diversify into other energy sources and to continue to stockpile,” Striven said. Even if Hormuz fully reopens, China may structurally reduce dependence on imported crude.
Why the Recovery May Disappoint
Striven warned that “Markets had priced in perhaps with excessive confidence the recovery in supply and perhaps extrapolated to the base case of surplus in 2027. But it’s still a highly uncertain environment.” Iran sanctions, Strait management, and regional investment remain unresolved. Goldman separately warned Hormuz tanker traffic may recover only to ~70% of pre-war levels as producers permanently reroute via pipelines. JPMorgan commodities head Natasha Kaneva added: “The barrels now exiting Hormuz increasingly have nowhere to go except China. But China is not buying.”
Current pricing reflects that ambiguity. WTI closed at $71.87/barrel on June 29, 2026, and Brent at $71.59, both well off April’s spike above $138.
EV Acceleration Is the Structural Threat
EV share of global car sales has risen ~4 percentage points since the start of the Iran war. Goldman’s June 21 note pegged global EV penetration at 26.1% of new passenger car sales in May 2026, its second-highest level ever, with China accounting for more than 60% of the increase and Chinese EV adoption up 11.4 percentage points since February. Chinese EV heavy truck sales grew 45% year over year in Q1 2026, and CATL predicted half of China’s heavy truck sales could be electric by 2028. Goldman’s “Persistent Acceleration” scenario has current-pace EV adoption cutting global oil demand by 0.32 million bpd by December 2027, with Brent potentially falling to the mid-$50s per barrel.
The AI Power Pivot: Striven’s Top Call
Striven’s favored commodity is US power, specifically PJM markets like Virginia, which hosts roughly a quarter of global data centers. Data center power demand is projected to double by end of 2027. “It’s this beautiful intersection from an investor perspective of very rapid demand growth… and very fixed supply. It’s very difficult to add power supply. The queues for gas turbines are 5 to 10 years,” Striven said. PJM forecast a record 166 gigawatt load during the July heat dome, underscoring the tightness.
Copper was his second pick, with over 50% of demand tied to electrification, offering dual exposure to EVs and AI power buildout.
Investor Exposure Map
Oil-demand bears. Exxon Mobil (NYSE:XOM) and Chevron (NYSE:CVX) sit closest to the China thesis. XOM’s forward P/E of 12 and CVX’s 12 signal analysts expect earnings compression. Chevron’s Q1 2026 adjusted EPS of $1.41 beat estimates even as revenue slipped year over year. Integrated peers BP and Shell face similar demand math.
Power bulls. Vistra (NYSE:VST) is the largest independent producer in PJM at 13.9 GW, with 2026 Adjusted EBITDA guidance of $6.80 billion to $7.60 billion and Meta PPAs at PJM nuclear sites. Constellation Energy (NASDAQ:CEG) carries 20.3 GW in PJM, is nuclear-heavy, and posted quarterly revenue growth of 63.8% year over year after closing Calpine. Talen Energy has 13.1 GW in PJM plus a dedicated campus for Pennsylvania data centers.
Copper and EV materials. Freeport-McMoRan, the largest publicly traded copper producer, screens as a direct electrification beneficiary. Albemarle (NYSE:ALB) is the lithium proxy: quarterly revenue growth of 32.7% year over year and an ALB analyst target price of $209.71 vs. a July 7 close of $129.02. BYD and CATL dominate the demand side but sit outside US exchanges.
What Investors Should Watch
The Hormuz story began as a supply shock. Striven reframes it as a demand story with a permanent tail: a China that stockpiles, diversifies, and electrifies faster than the forward curve assumes. If even 10% of the 5 million bpd drop is structural, and if EV penetration keeps climbing at May’s pace, the oil market pricing into 2027 may not resemble the one investors underwrote before the war. Keep an eye on Chinese import data, PJM capacity auctions, and Brent’s ability to hold above the mid-$50s scenario Goldman has now put on the table.
The post ‘Staggering’: Goldman Sachs Says China’s Oil Demand May Never Fully Recover appeared first on 24/7 Wall St..
]]>Shares of Occidental Petroleum (NYSE:OXY) are up 4% at midday Wednesday, trading at $53.90. The move puts Occidental well ahead of integrated peers ExxonMobil (NYSE:XOM) and Chevron (NYSE:CVX).
ExxonMobil stock is off 1% at $140.51, essentially flat. Meanwhile, Chevron shares are higher by 1% to $176.07, a modest gain that trails Occidental by a wide margin on the session.
The gap reflects a company-specific catalyst layered on top of a broad energy tailwind. Occidental has both today, while the oil majors ExxonMobil and Chevron have only one catalyst.
Evercore Upgrade and Crude Spike Drive OXY
Evercore ISI upgraded Occidental stock to Outperform from In-Line, with analyst Stephen Richardson lifting his OXY price target to $65 from $58. The firm’s thesis leans on deleveraging and capital efficiency rather than production growth.
Evercore projects that Occidental’s free cash flow per share to grow 8% annually through 2030 at a flat $75 WTI crude oil, with a potential resumption of share buybacks in the second half of 2028. That framing lands well against Occidental’s Q1 2026 earnings report, which delivered an 80% adjusted EPS beat and $7.10 billion in principal debt repaid.
The second factor is the crude oil price. WTI crude oil is up 6% over the past 24 hours to $74.58 per barrel, driven by renewed threats of U.S. military strikes tied to Iran and Strait of Hormuz disruption. Occidental Petroleum carries the highest oil-price beta among U.S. majors, which amplifies the move.
Peers Get the Oil Lift, Not the Upgrade
ExxonMobil and Chevron shares are participating in the crude rally, just without a company-specific driver to match Evercore’s Occidental call. The Energy Select Sector SPDR Fund (NYSEARCA:XLE), a broad energy ETF that holds all three names, is up 1%. ExxonMobil and Chevron together account for a heavy 41% of the ETF, so the fund’s muted move mirrors the majors.
Chevron stock did get a bullish note earlier this week: Wolfe Research upgraded Chevron stock to Outperform with a $210 target, citing Guyana growth and sustainable cash generation. Yet, the enthusiasm was partially offset by Mizuho’s price target cut on ConocoPhillips (NYSE:COP) on capex concerns that spilled across the group.
ExxonMobil’s recent re-domiciliation to Texas was largely viewed as administrative, offering little to no sentiment lift. Other oil-levered names are also participating in today’s sector bid, but they don’t share Occidental Petroleum’s specific catalyst today.
Bull and Bear Views on OXY Stock
The bull case leans on the deleveraging story and Berkshire Hathaway’s ownership footprint. Berkshire Hathaway (NYSE:BRK-B) remains a major Occidental backer, and Evercore’s $65 target is roughly in line with the $65.30 average analyst target.
The bear case matters too. Evercore itself flagged that Occidental’s free cash flow growth trails Diamondback Energy (NASDAQ:FANG), ConocoPhillips, and Chevron. The analyst rating mix still skews to Hold (14 Holds versus 8 Buys), and Occidental stock was still down 9% over the past month heading into today. Investors may want to keep their position sizes measured given crude’s volatility.
What to Watch
The $65 target sits below Occidental stock’s 2026 high of $67 from late March, so the remaining upside after today’s gain is narrower. Traders can watch for whether OXY holds above $53 into the close and how crude oil settles as Strait of Hormuz headlines evolve. The next scheduled event is Occidental’s Q2 2026 earnings on August 5.
Positioning matters here. Today’s move rewards investors who were already long the most oil-levered major heading into the crude spike, but chasing after a 4% single-session gain carries obvious risk if Middle East tensions cool or if the Evercore thesis gets faded by other desks.
For investors weighing the oil majors, the setup remains a choice between Occidental’s upside torque to crude and the steadier, dividend-anchored profiles of ExxonMobil and Chevron. Today’s tape favors the former, but a single session doesn’t settle that debate.
The post Occidental Petroleum Jumps 4% While ExxonMobil, Chevron Lag: Evercore Upgrade and Oil Spike Fuel OXY’s Lead appeared first on 24/7 Wall St..
]]>The Number
With oil now trading well below the $100 level (and seemingly poised to continue heading lower, after OPEC announced further production increases recently and recessionary concerns pick up), it’s unclear where certain oil stocks are headed.
One such name that’s on my radar right now just reported its Q1 2026 earnings in early May – Chevron (NYSE:CVX). With the company posting adjusted earnings of $1.41 per share against a $0.97 consensus (a 45.56% beat), there’s plenty to seemingly like about this company’s growth trajectory in a lower oil price environment.
Let’s dive into what these results mean for the average investor.
What It Means
This recent earnings beat rested on operational strength as much as on crude prices. Chevron’s average Brent realization in the quarter came in at $81 per barrel versus $76 a year earlier, a modest tailwind. The volume story did the heavy lifting. Worldwide net oil-equivalent production reached 3,858 MBOED, up 15% year over year, powered by the company’s high-profile Hess acquisition. U.S. output cleared 2 million barrels per day for the third consecutive quarter, a company record.
Reported net income tells a noisier story at $2.21 billion, down 37.07% year over year, weighed by roughly $2.9 billion in unfavorable timing effects tied to derivatives and LIFO, a $360 million legal reserve, and a $223 million FX headwind. Strip those out and the operating engine is running hotter. Chevron returned $2.5 billion via buybacks in Q1, the 16th straight quarter of returning more than $5 billion to shareholders.
Market Reaction
Chevron shares closed at $169.20 on July 2, 2026, up 13.12% year to date and 19.13% over the past year. Now, the stock’s recent price action has cooled, alongside oil prices which dipped. Over the past month, CVX stock is off nearly 10% as WTI retreated from May’s peak to around $68.50 per barrel on July 6. Peer Exxon Mobil (NYSE:XOM) and Suncor Energy (NYSE:SU) have seen similar downside moves, as investors gauge where oil prices could be headed over the medium-term.
Bull Case
Chevron’s Q1 beat pairs cleanly with three durable levers. First, volume: production growth of 15% year over year is a rare figure for a supermajor, and the Hess integration is the reason U.S. barrels have crossed two million a day for three straight quarters.
Second, cost discipline is impressive, with Chevron delivering $1.5 billion in structural cost reductions in 2025, targeting $3 billion to $4 billion by the end of 2026.
Finally, the company’s capital return profile remains robust. Chevron returned $27.1 billion to shareholders in FY 2025, a 39th consecutive annual dividend increase, and a quarterly dividend of $1.78 per share that carries a yield near 4.17%.
CEO Mike Wirth framed the quarter this way: “Despite heightened geopolitical volatility and related supply disruptions, Chevron delivered solid first quarter performance, underscoring the resilience of our portfolio and the value of disciplined execution.”
Overall, Chevron’s forward P/E sits at 11, well below the trailing multiple, reflecting analyst expectations for higher earnings power as Hess barrels flow and cost programs land. Wall Street’s consensus target of $217.14 sits above current levels, with 18 buy or strong-buy ratings against one sell.
Bottom Line
For long-term holders, Chevron’s 45.56% EPS beat is the tell. The company produced this metric all the while oil prices continued to sink below $70 per barrel. To me, that means the oil giants earnings engine is not in any way dependent on oil prices remaining in triple-digit territory. For those thinking long-term, that’s a big deal.
That said, it’s also true that volatility in commodity markets is a given. The catalyst worth watching is the structural cost target of $3 billion to $4 billion by year-end 2026. If Chevron hits it while Hess barrels compound, the $100 oil headline becomes optional to the investment case.
The post Oil’s $100 Threshold: What It Means for Energy Stocks Now appeared first on 24/7 Wall St..
]]>