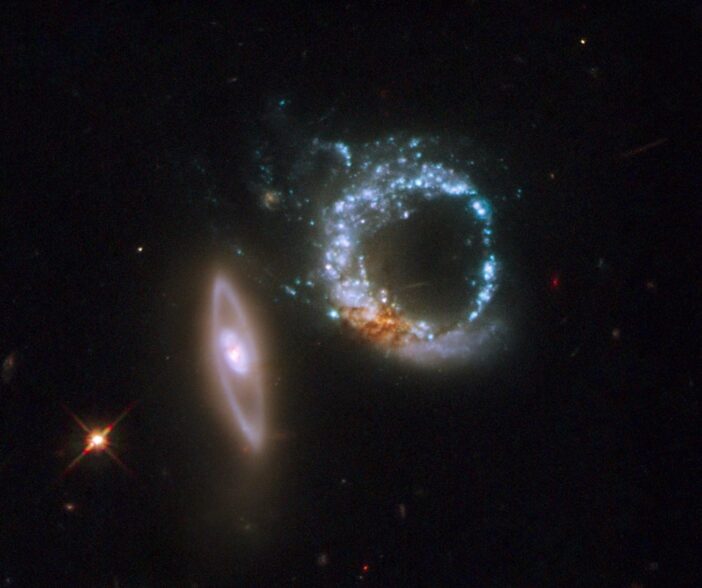
Astrobites reports on a new diagnostic tool used to understand how the neighborhood a black hole grows up in may affect the rest of its life.
The post Not All Black Holes Who Wander Are Lost appeared first on AAS Nova.
]]>Editor’s Note: Astrobites is a graduate-student-run organization that digests astrophysical literature for undergraduate students. As part of the partnership between the AAS and astrobites, we occasionally repost astrobites content here at AAS Nova. We hope you enjoy this post from astrobites; the original can be viewed at astrobites.org.
Title: Tracing Black Hole and Galaxy Growth Across Environments Since Cosmic Noon
Authors: Emma Jane Weller et al.
First Author’s Institution: Yale University
Status: Published in ApJ
They say you can’t choose your hometown, but it still ends up shaping who you become. Turns out the same is true for black holes. The galaxy a black hole grows up in will have a major impact on how it will live out the rest of its life. Similarly, the black hole can leave a lasting impression on its galaxy!
Astronomers have long known that a galaxy’s stellar mass (the combined mass of all its stars) tracks pretty tightly with the mass of the black hole sitting at its centre: bigger galaxy, bigger black hole. This is one pillar of the idea that galaxies and their central black holes coevolve; that is, their life stories are tangled up with one another from early on. But ever since JWST started spotting suspiciously large black holes in the early universe, astronomers have been debating whether this relationship holds steady across cosmic time, or whether the rules were different when the universe and everything in it was younger.
Not Everyone Stays in the Town Centre
Most previous studies of the relationship between black holes and their galaxies have focused only on the central black hole: the biggest, most famous resident of a galaxy, sitting right downtown at its centre. That’s a reasonable place to start, since the central black hole is usually the most massive one around and tends to dominate the story. But this article’s authors wanted to know what happens to everyone else in town, too!
That includes satellite black holes, which are the central black holes of smaller “satellite” galaxies that orbit a bigger “primary” galaxy, a bit like a small town around a big city. It also includes a stranger, more recently discovered population: wandering black holes. These are the black hole equivalent of someone whose hometown got swallowed up by an expanding metropolis, and who never quite settled into their new surroundings.
Here’s how it happens: when a small satellite galaxy merges with a larger one, the satellite gets torn apart by tidal forces and its gas and stars are stripped away. However, its central black hole is often left behind, drifting through the new, much bigger galaxy on a wide orbit. The process that would normally drag a black hole down to the centre of a galaxy, called dynamical friction, is painfully slow, so wanderers can spend billions of years roaming the outskirts.
Two Cities, Two Sets of Rules
To study how these different black hole “life paths” shape, and are shaped by, their host galaxies, the authors turned to two cosmological simulations, ASTRID and TNG300, which handle black hole physics quite differently.
In TNG300, black holes are assumed to start fairly massive and are snapped straight to the centre of their host galaxy at every timestep. This makes mergers happen quickly and often, but it also means there’s no such thing as a wandering black hole in TNG300.
ASTRID, on the other hand, seeds smaller black holes and lets them move more realistically through their galaxy using a subgrid dynamical friction model. This is what allows wandering black holes, with their slow, aimless orbits, to exist and be studied in the first place.
Figure 1 reveals a lot at once. First, ASTRID (the simulation that allows wandering black holes and tidally stripped satellites) has whole new neighbourhoods on the map that simply don’t exist in TNG300. Those populations clearly aren’t following the same tidy, linear coevolution that central black holes enjoy with their galaxies. Second, the most massive black holes tend to be the most yellow, meaning mergers did the heavy lifting for their growth. This is especially pronounced in TNG300, where roughly 80–90% of the growth of the most massive black holes comes from mergers. Meanwhile, the wanderers and stripped satellites sit at the deep-purple end: these black holes have barely merged with anyone at all.
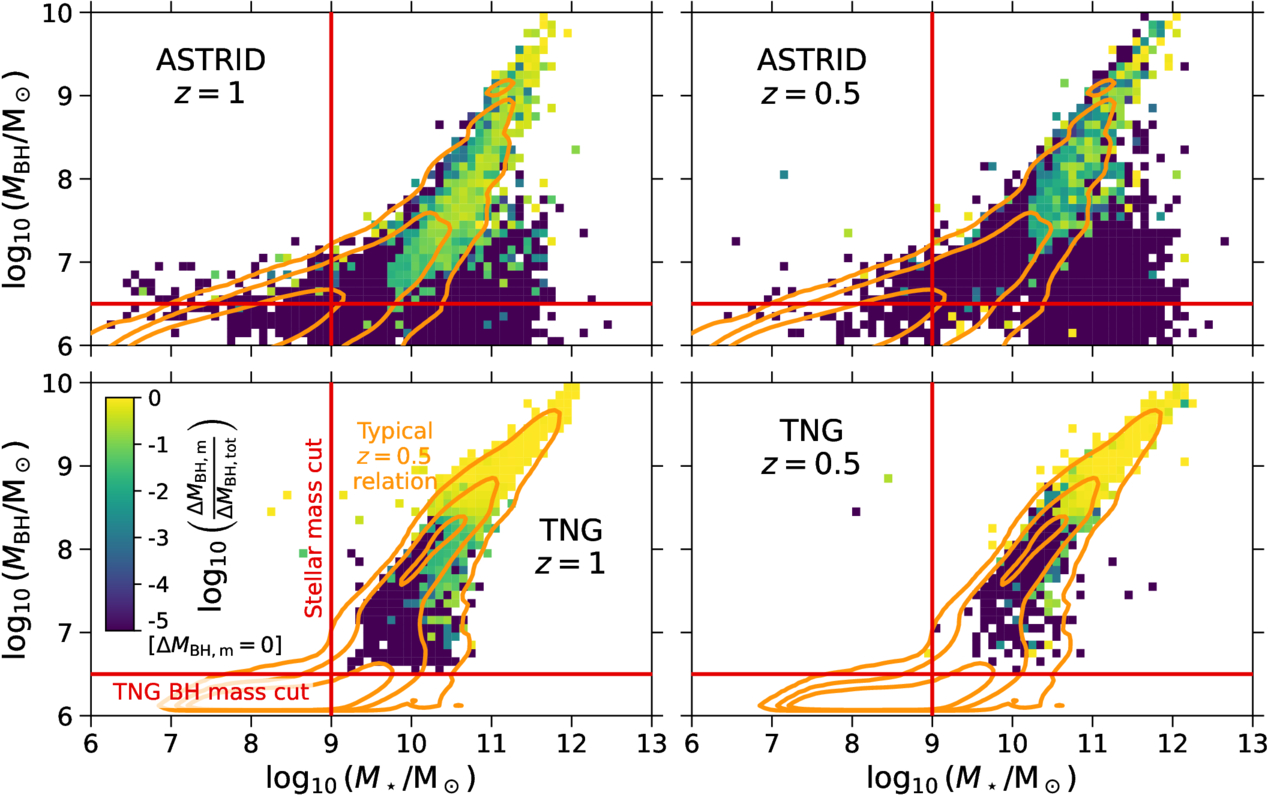
Figure 1: How black hole mass relates to host galaxy stellar mass, shown at two snapshots in cosmic history, 8 and 5 billion years ago, for both simulations (ASTRID: top row; TNG300: bottom row). Colour shows what fraction of each black hole’s growth since the last snapshot came from mergers, from purple (grown almost entirely by slowly swallowing gas) to yellow (grown mostly by swallowing other black holes). [Weller et al. 2026]
Four Kinds of Black Hole Life Stories
Pulling all of this together, the authors sketch out a kind of “neighborhood map” of black hole fates, sorted by where a black hole ends up on the mass-relation plot and how it got there (see Figure 2).
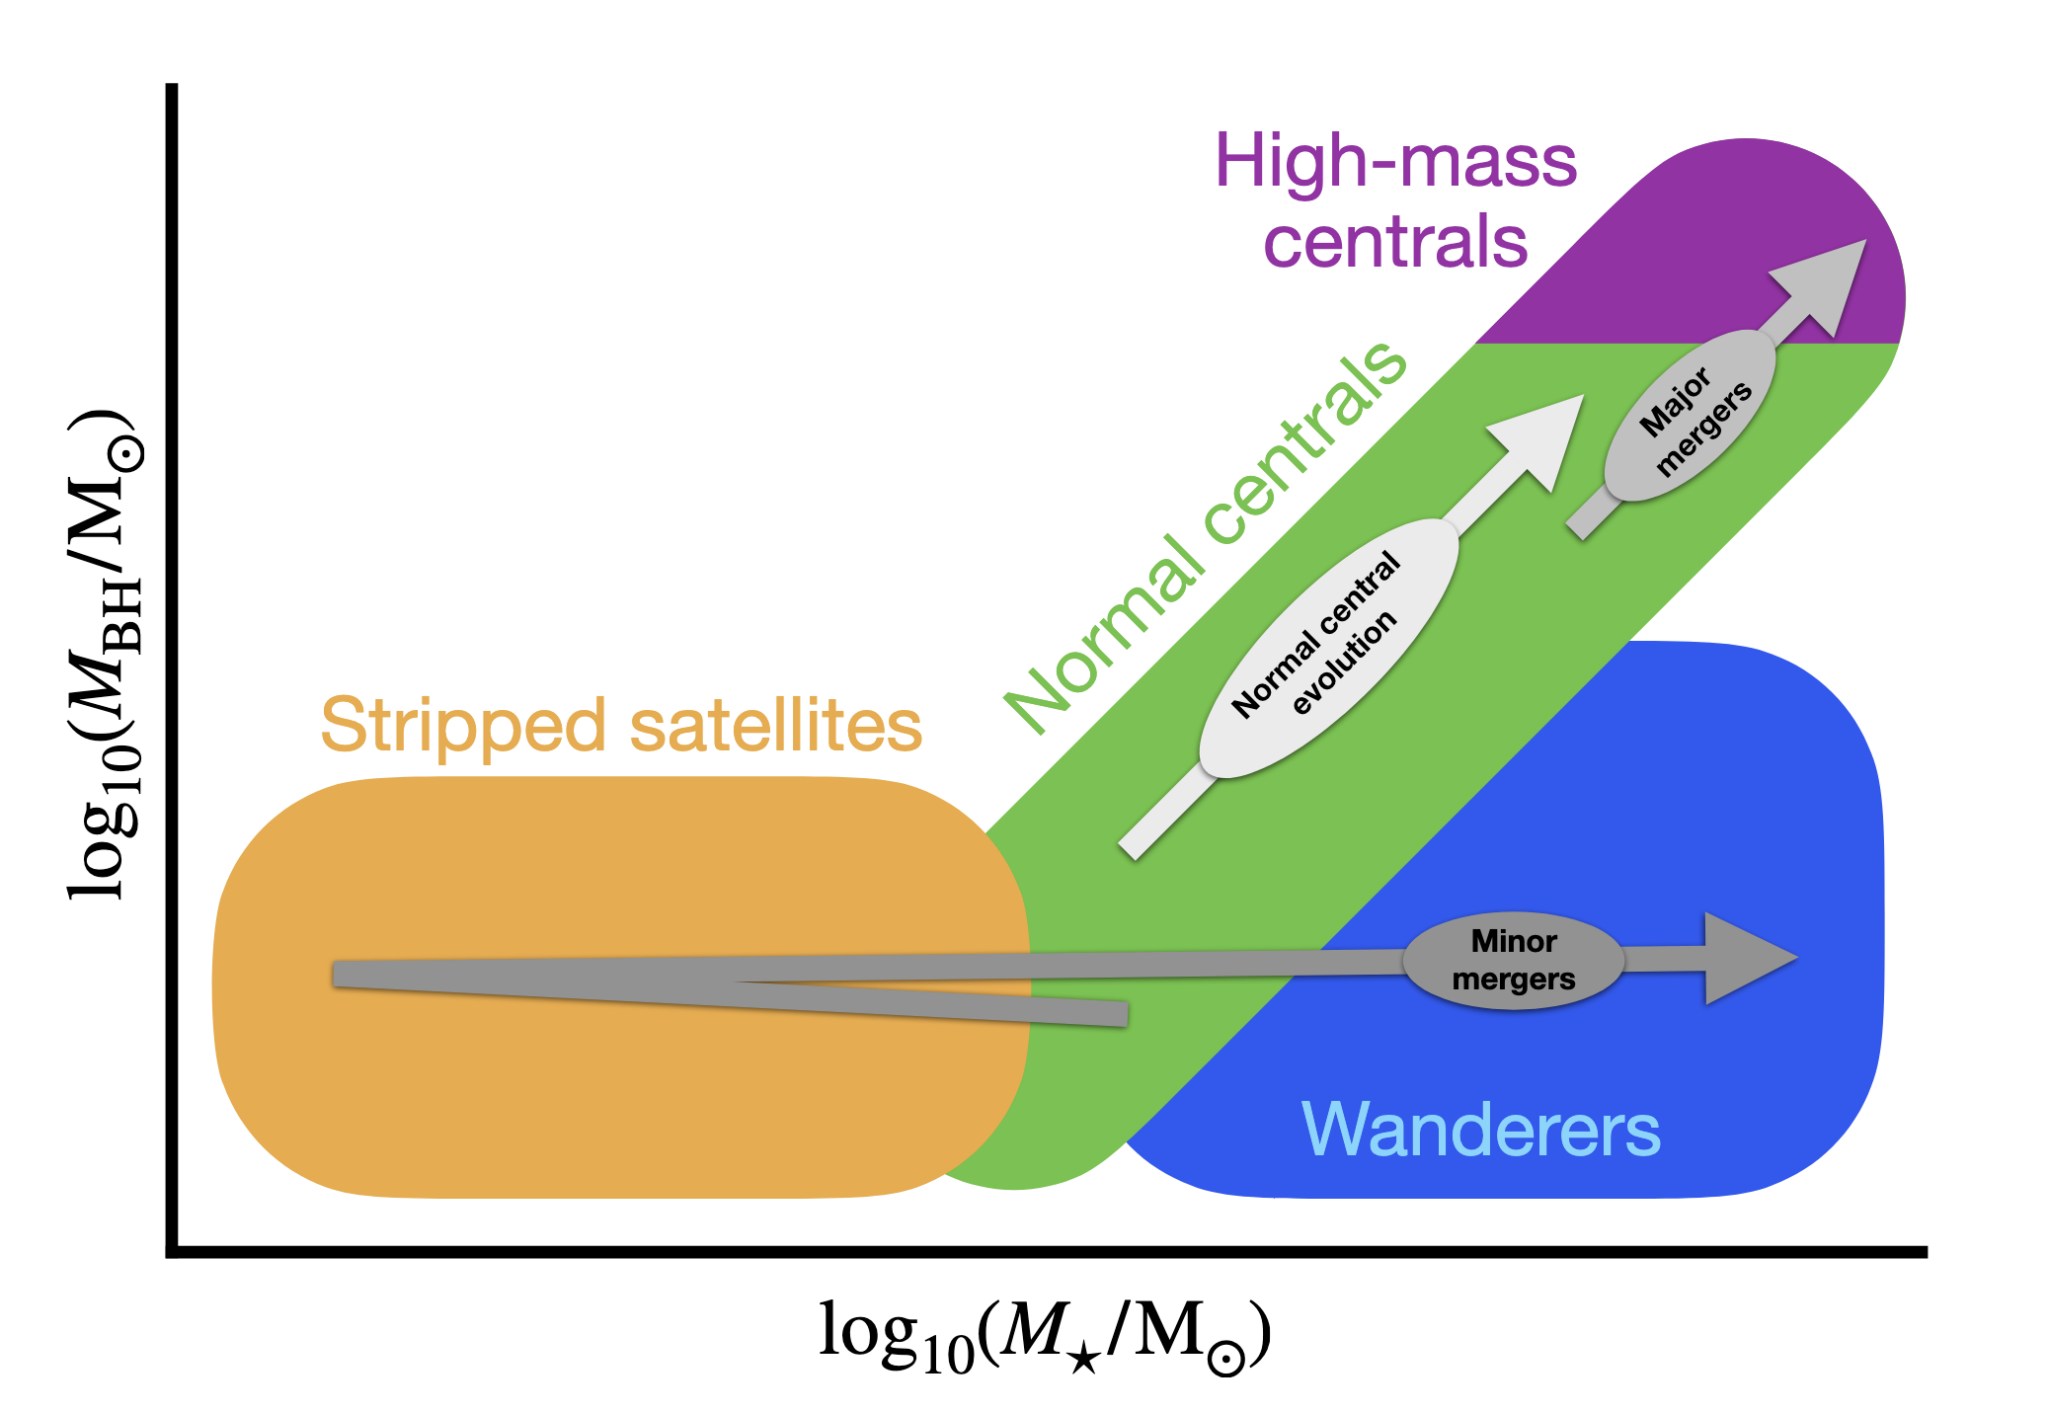
Figure 2: The distinct black hole populations revealed by the black hole mass–stellar mass relation, and the evolutionary path that lands each population in its corner of the map. [Weller et al. 2026]
- Normal centrals are the homebodies. They sit at the centre of primary or satellite galaxies and grow up steadily alongside their hometown, climbing the mass relation together through a healthy mix of accretion and the occasional merger. Their galaxies keep forming stars the whole time in a functional, unremarkable, thoroughly nice place to live.
- High-mass centrals are the ones who “made it.” These are central black holes in big primary galaxies, and their growth comes overwhelmingly from mergers with other black holes. Once they get big enough, they start throwing their weight around: their jets blast gas out of the galaxy, shutting down both star formation and their own further growth.
- Stripped satellites are the annexed suburbs. They start out on the normal mass relation, but a merger with a bigger galaxy tears away their gas and stars, shrinking their stellar mass while their black hole is left comparatively overweight for its new, smaller home. With their gas reserves gone, star formation grinds to a halt, and their black holes, starved of fuel, barely grow either.
- Wanderers are the ones who moved to the big city and never quite settled in. They start out on the normal relation inside a satellite galaxy, but when that galaxy merges into something much bigger, they’re left drifting through unfamiliar, low-density territory. With little gas around to feed on and almost no chance of merging with anyone else, their growth basically stalls.
This four-way map is a genuinely useful new way to read the black hole–galaxy relation: a black hole’s exact position on the plot isn’t just a number, it’s a fossil record of everywhere it’s ever “lived.”
There’s plenty more in the article we haven’t covered here, including how quenching plays out over time, how these results stack up against the local universe, and a closer look at how star formation rates and black hole accretion rates track each other across all four populations. If any of this piqued your interest, the full article is well worth a read.
Original astrobite edited by Ryan White and Chloe Klare.
About the author, Jayde Willingham:
I am a first-year PhD student at Swinburne University of Technology studying the early universe and how the first galaxies came to be. My work combines observations and theoretical modelling to explore how galaxies form, evolve, and shape the universe we see today. When I’m not at my desk or doing SciComm, I’m probably reading a good book with a hot beverage under a cozy blanket.
The post Not All Black Holes Who Wander Are Lost appeared first on AAS Nova.
]]>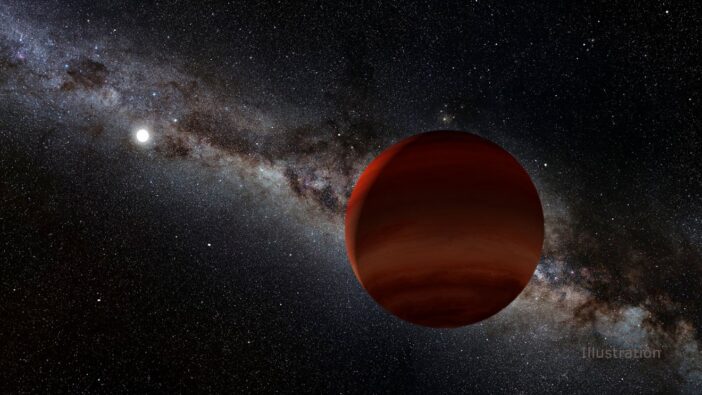
The white dwarf–brown dwarf pair J0404+1112 — one of only about a dozen known systems like it — offers researchers a chance to study a substellar atmosphere blasted with intense radiation.
The post Astronomers Get a Better Look at a Rare White Dwarf–Brown Dwarf Pair appeared first on AAS Nova.
]]>Researchers have followed up on the discovery of a rare binary system containing a white dwarf and a brown dwarf. This unusual pairing offers valuable insights into the physics of atmospheres subjected to strong radiation.
Odd Couple
In 2025, researchers searching through observations from the Transiting Exoplanet Survey Satellite (TESS) spotted an eclipsing binary system in which a brown dwarf orbits the white dwarf J0404+1112 every 2.93 hours. Only about a dozen white dwarf–brown dwarf binaries have been confirmed so far, and each newfound system offers clues to how substellar or planetary companions survive a star’s transition from main-sequence star to swollen red giant to blazing white dwarf.
Because the two objects orbit one another so closely, this remarkable system also offers researchers an opportunity to study the dynamics and chemistry of an atmosphere blasted with high-energy radiation, with important implications for close-in brown dwarfs and giant planets.
Insights from New Observations
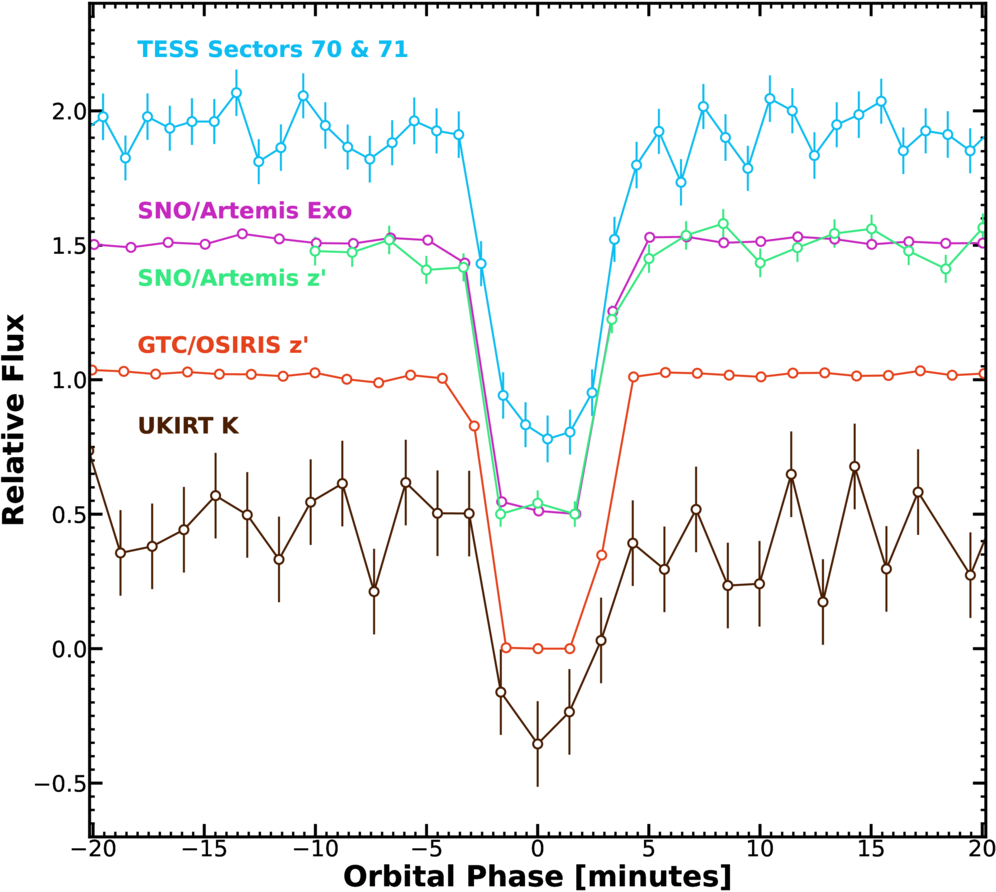
Eclipse photometry of J0404+1112 from TESS, SPECULOOS, the Gran Telescopio Canarias, and the United Kingdom Infra-Red Telescope. [de Wit et al. 2026]
Now, the team has obtained new photometry from the Gran Telescopio Canarias and the United Kingdom Infra-Red Telescope, plus spectroscopy from the Gran Telescopio Canarias, to get a better sense of the system. These observations allowed them to break the degeneracies in the white dwarf’s properties, showing it to be an 0.60-solar-mass white dwarf that has been cooling for more than 10 million years to a present-day temperature of 28,000K. The brown dwarf also appears to be more massive than initially thought, weighing in at roughly 40 Jupiter masses.
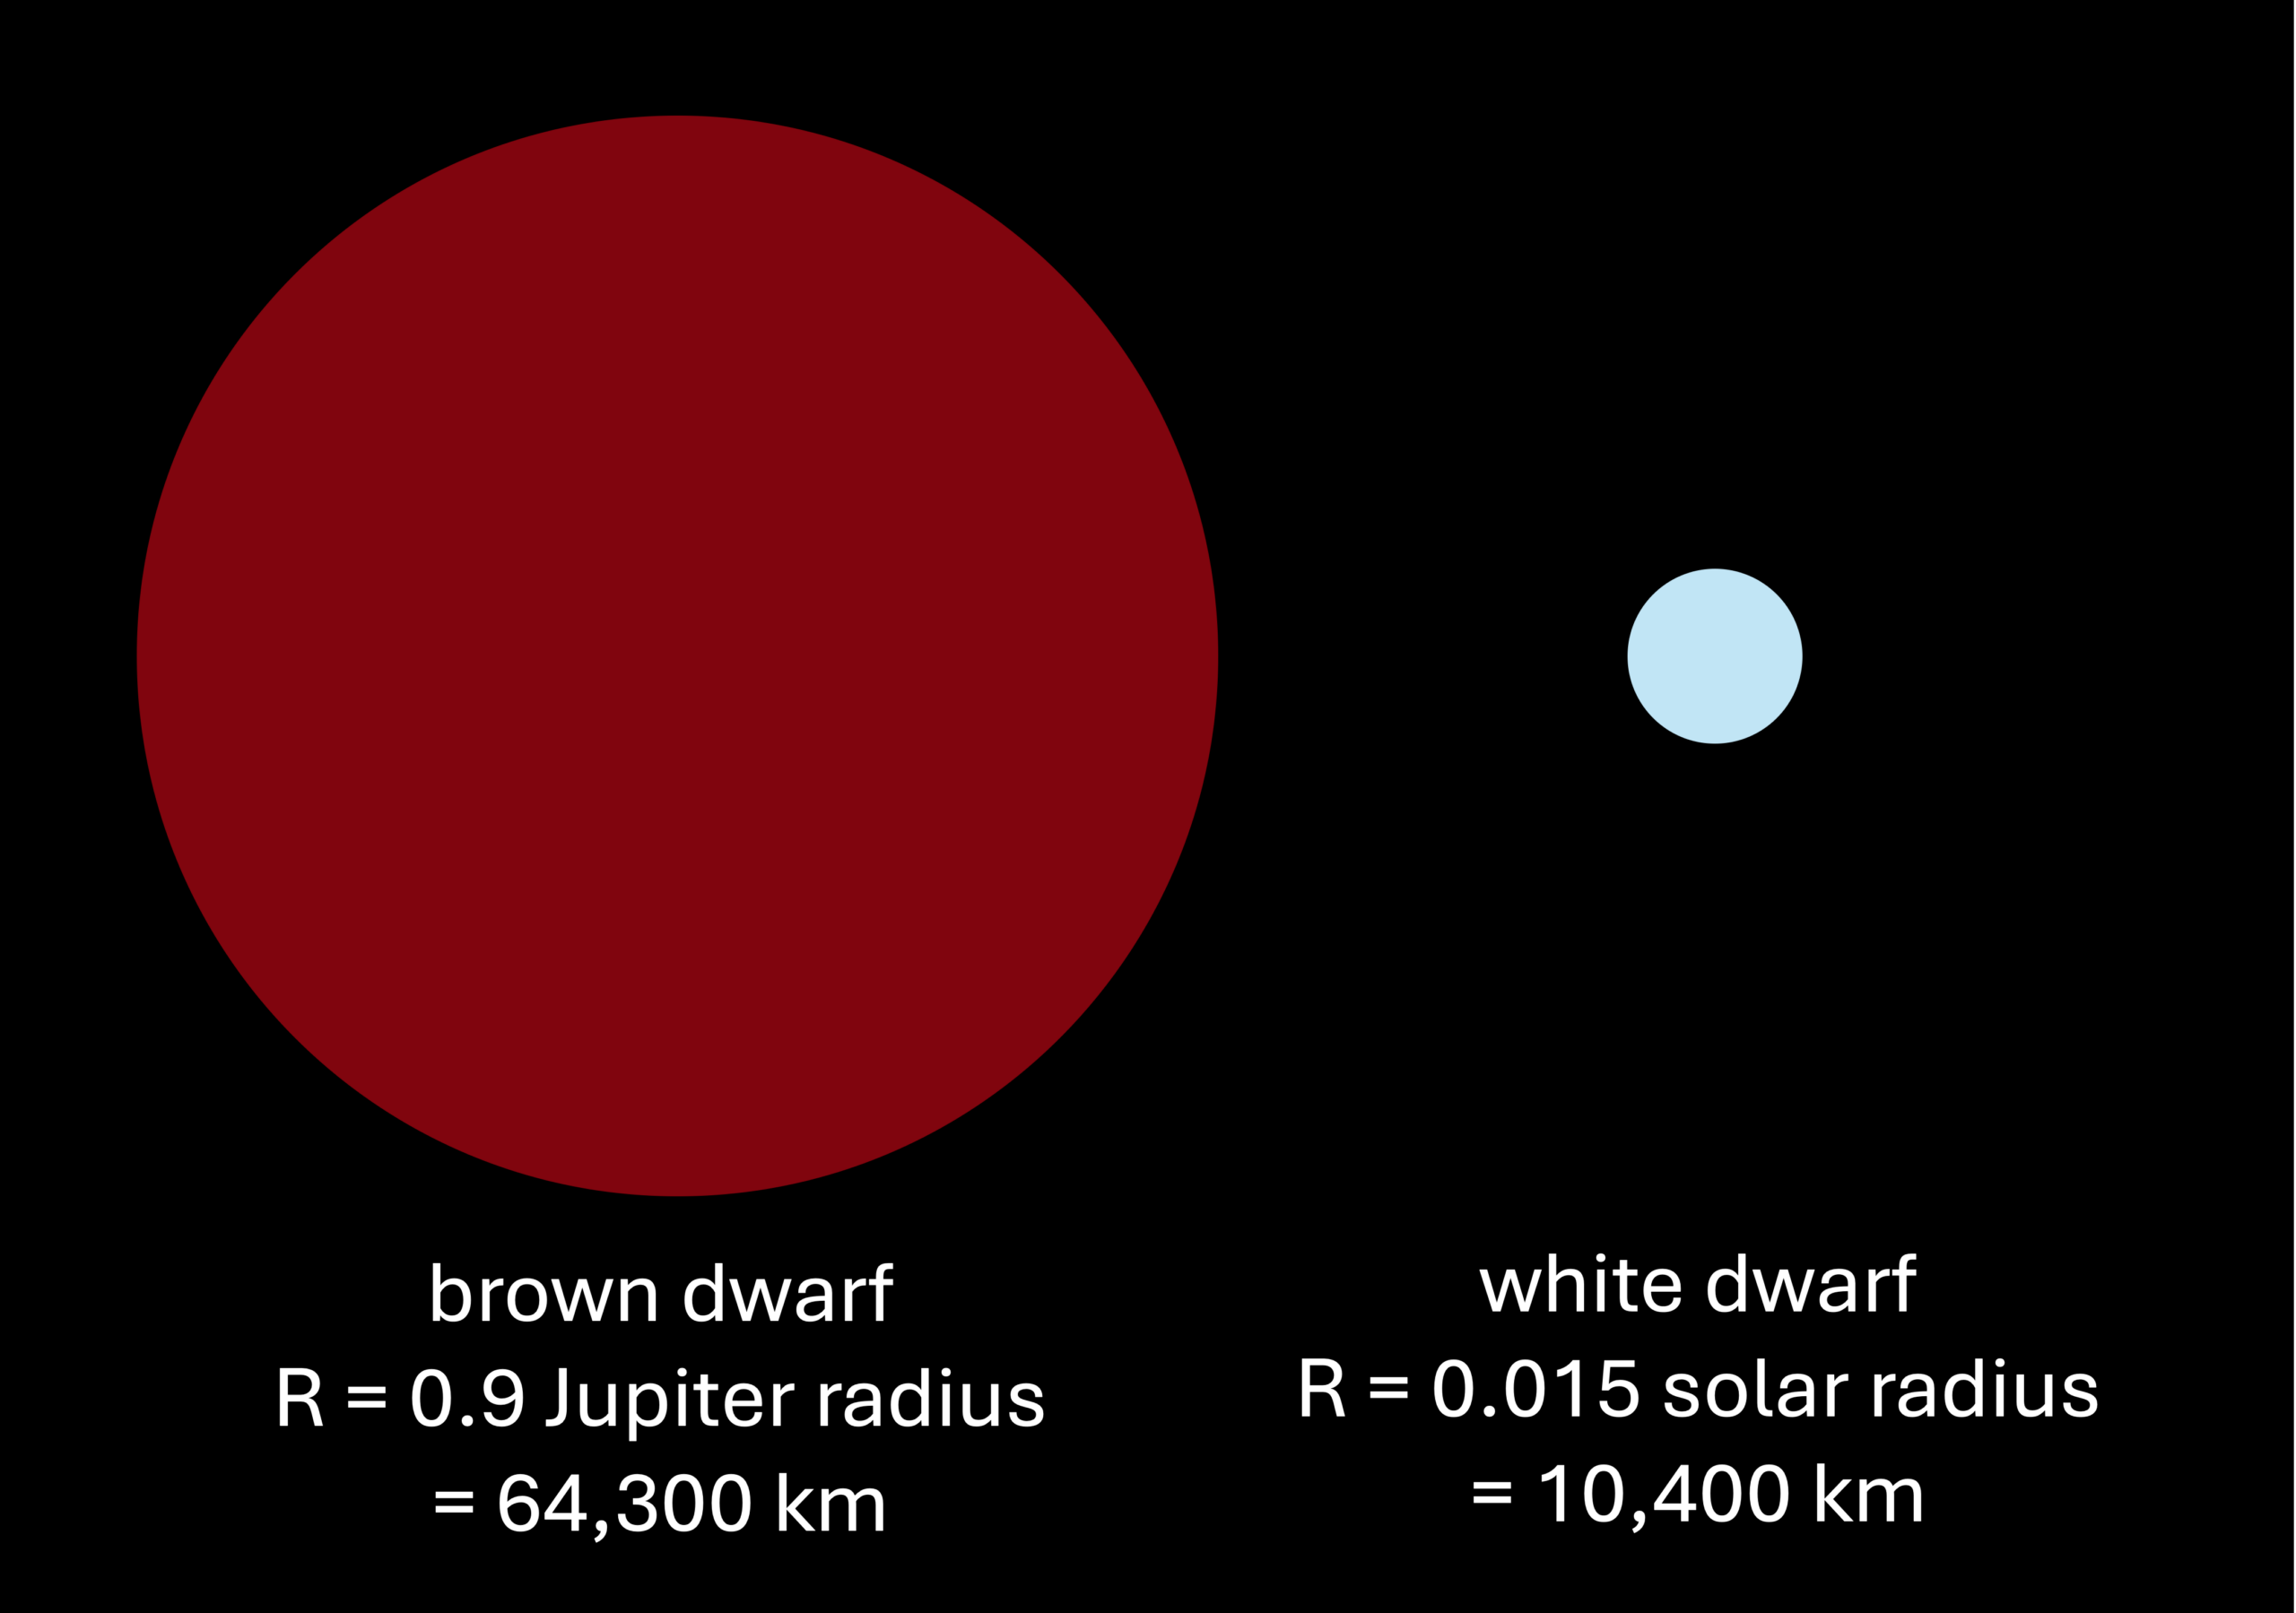
This diagram shows the relative sizes of the brown dwarf and the white dwarf. [AAS Nova/Kerry Hensley]
Like Night and Day
Because the system’s orbit is almost exactly edge on from our point of view, the white dwarf is completely eclipsed as the much larger brown dwarf passes in front of it. This allows the contributions from the two components to be separated, and for the emission from the brown dwarf’s nightside to be measured. The authors constrained the brown dwarf’s nightside temperature to roughly 1750K. Its dayside temperatures are likely to be significantly higher — potentially around 3750K at the point where the white dwarf is directly overhead — but more data are needed to constrain the dayside temperature of this world.
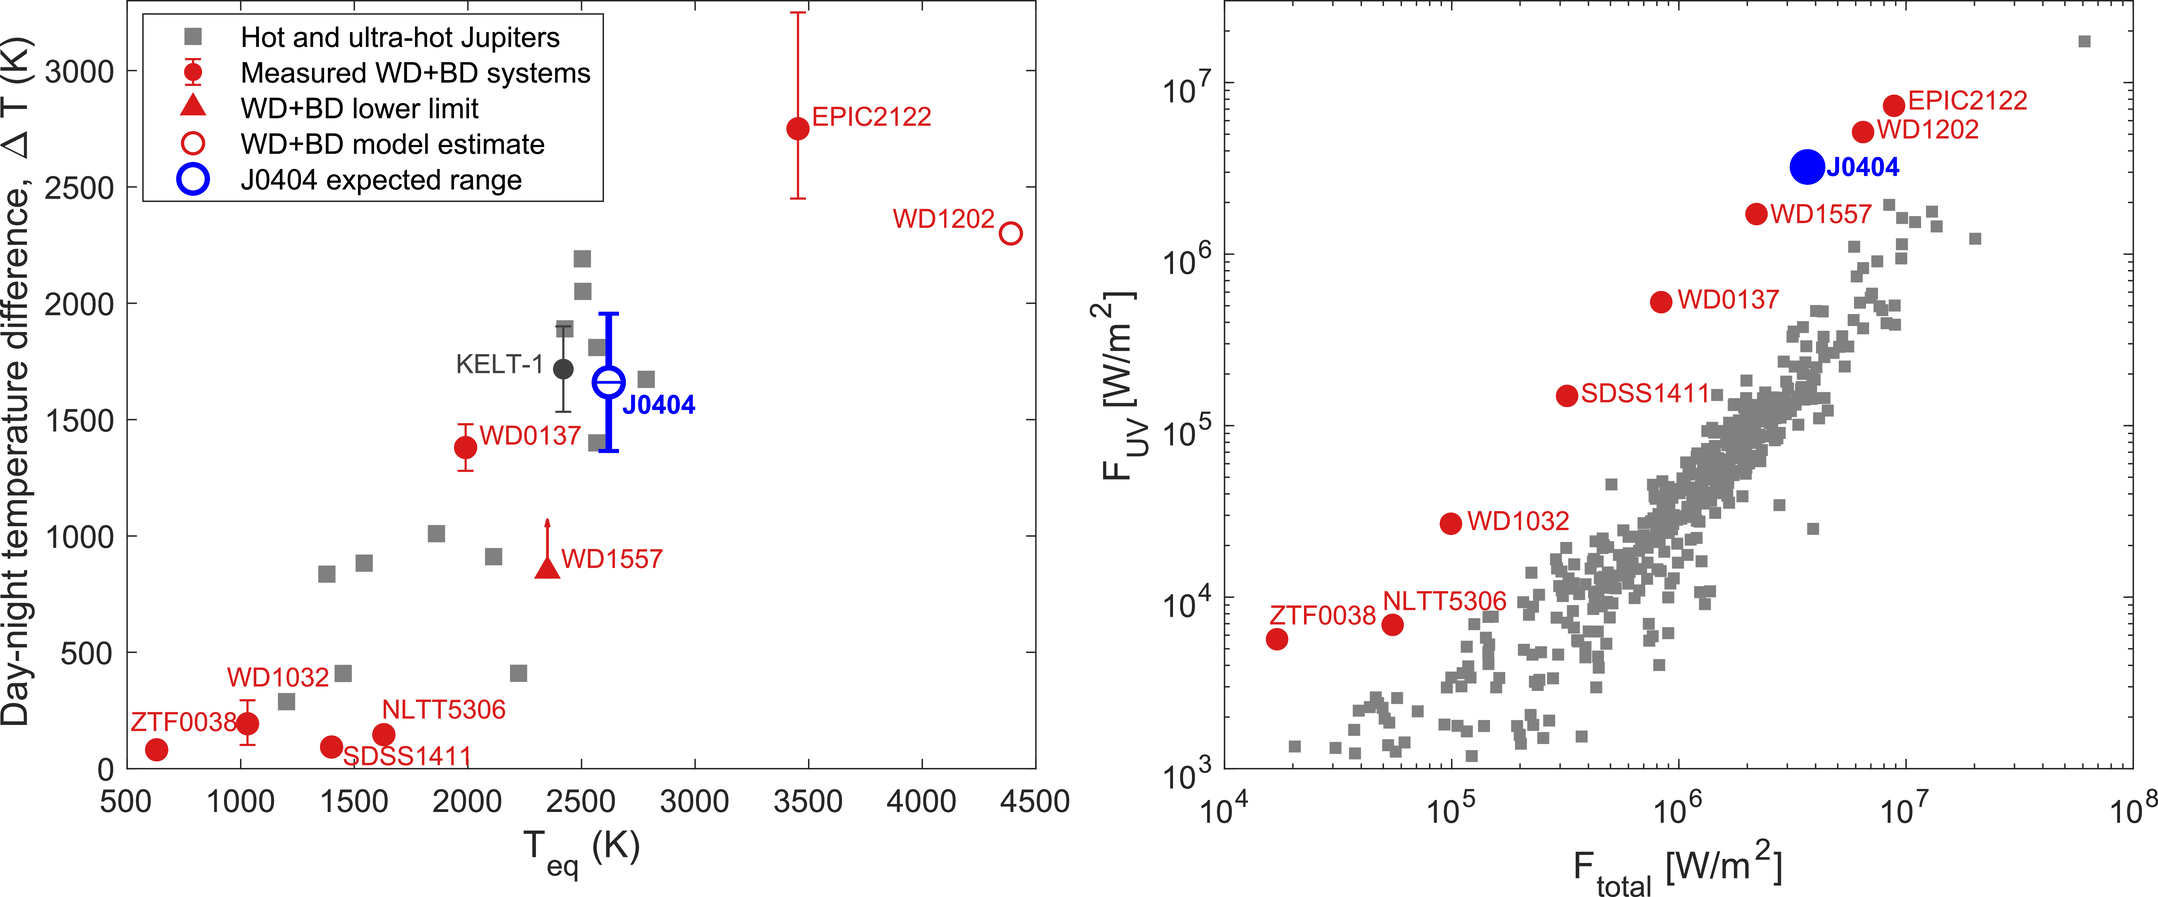
Day–night temperature difference (left) and irradiation flux (right) of the brown dwarf in this system compared to other white dwarf–brown dwarf systems and hot and ultra-hot Jupiters. Click to enlarge. [de Wit et al. 2026]
Citation
“J0404+1112: A 3 hr Eclipsing White Dwarf–Brown Dwarf Probing Multiple Atmospheric Regimes,” J. de Wit et al 2026 ApJL 1009 L40. doi:10.3847/2041-8213/ae9a97
The post Astronomers Get a Better Look at a Rare White Dwarf–Brown Dwarf Pair appeared first on AAS Nova.
]]>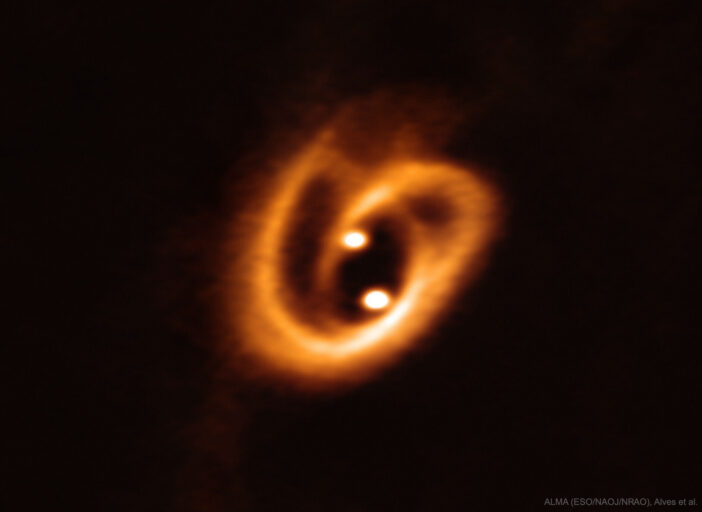
Globular clusters have far fewer binary stars than the solar neighborhood. New research identifies black hole burning as the culprit.
The post Catching the Culprit Behind Globular Clusters’ Disappearing Binaries appeared first on AAS Nova.
]]>Roughly one-third of stars in the Milky Way are in binary or multiple systems, but only ~1–10% of stars in globular clusters have a companion. Did globular clusters start with fewer binaries than the solar neighborhood, or have they since been wiped out?
Survival of the Tightest
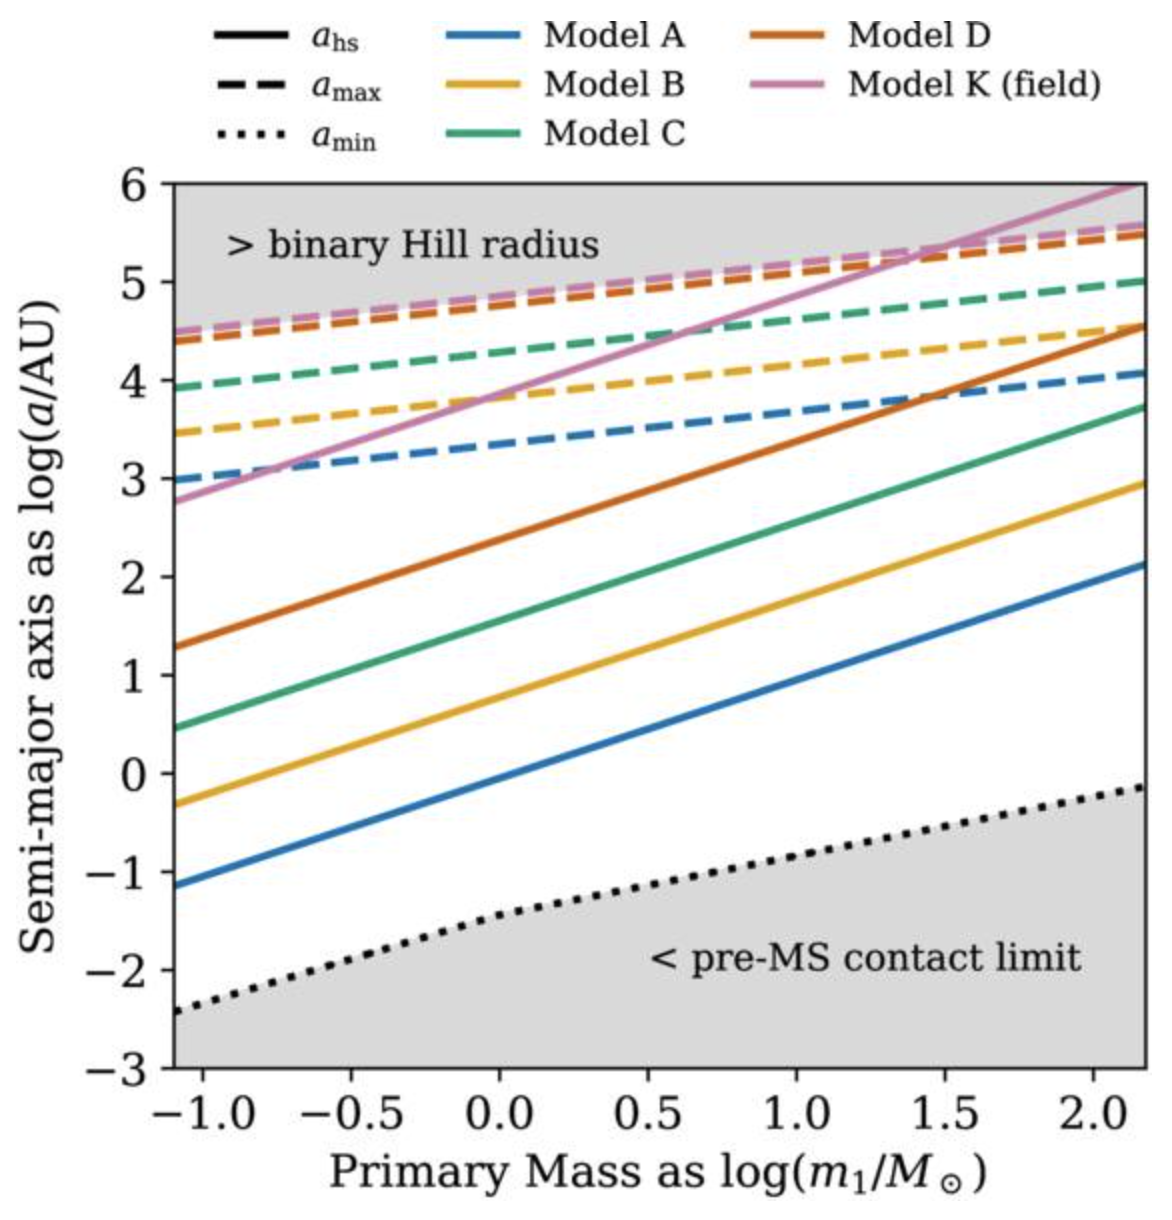
Map of the semi-major axis–primary mass parameter space for binary systems. Solid lines show the boundary between hard (below the line) and soft (above the line) binaries for a variety of models. Models A–K span a variety of cluster masses and virial radii (a proxy for cluster density). [O’Connor et al. 2026]
It turns out that the fate of a binary system depends on whether it is dynamically “hard” or “soft.” Hard binaries are generally tightly bound, and they tend to get “harder” from stellar flybys, which are common in a crowded cluster environment. Soft binaries are the opposite — they have much shorter lifetimes since encounters with other stars tend to loosen them. The team found that, assuming GCs have the same initial distribution of binaries as the solar neighborhood, the dissolution of soft binaries is sufficient to explain the present-day scarcity of binaries in GCs.
Burning Away the Binaries
What actually tears the soft binaries apart? The answer is a process called “black hole burning.” As some of the most massive objects in a globular cluster, black holes in binary systems can transfer energy when they interact with passing stars. This influx of energy can excite soft binaries to the point of dissolution, the study shows.
Black hole burning can also prevent core collapse in GCs. Left to itself, a cluster’s core gradually loses energy to its outskirts, causing the core to grow hotter and denser with stars. This leads to more dynamical interactions between stars that can then get flung from the core or enter new tight binaries. Black hole burning pumps energy back into the core and prevents this from happening.
Putting the Theory to the Test
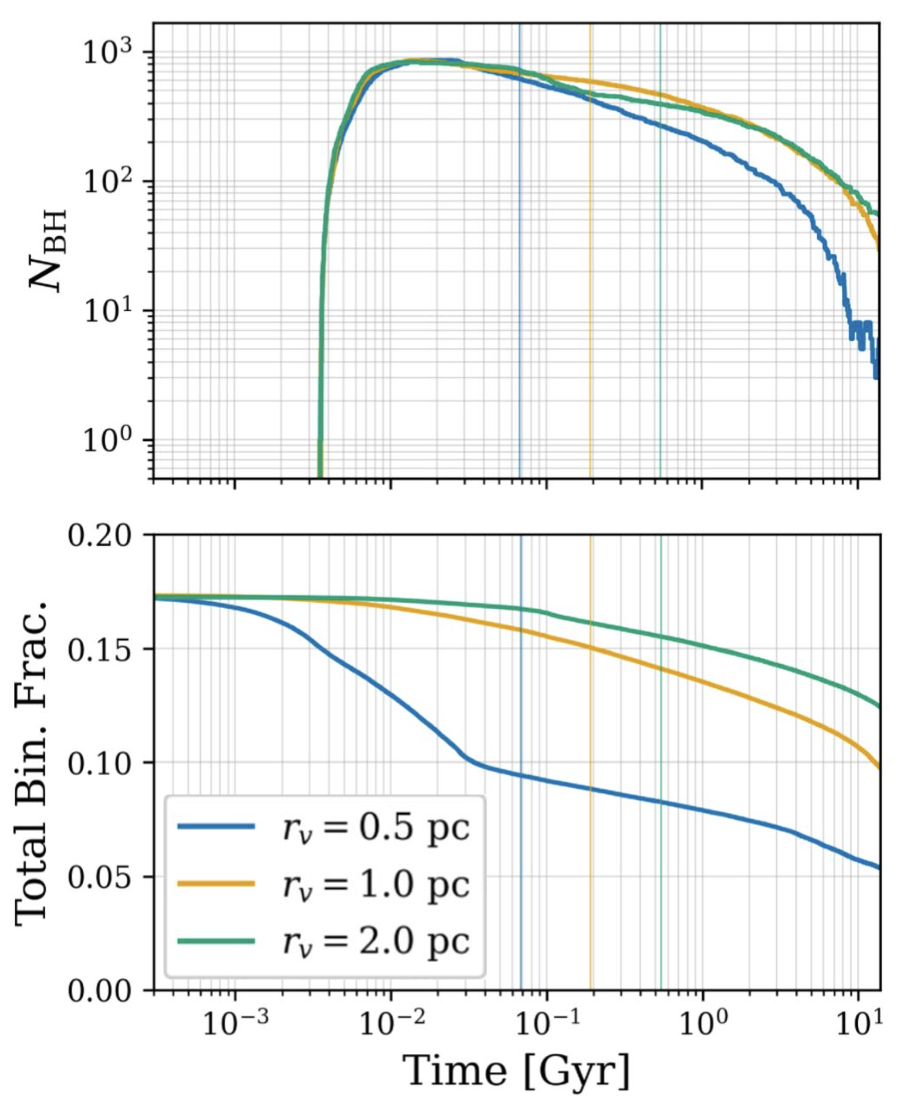
The total number of black holes in a cluster (top) and the binary fraction (bottom) as a function of time for three different cluster models. In the densest cluster (blue), binary dissolution starts early on, mainly driven by stellar collisions. For the other two models, binary dissolution mainly occurs after the number of black holes reaches its peak and black hole burning commences. [Adapted from O’Connor et al. 2026]
In general, the final binary fractions of the simulated clusters agree with those predicted by the team’s analytical formalism. This further supports the theory that there is a universal initial binary distribution between galactic GCs and our solar neighborhood. Constraining this distribution is pivotal for refining dynamical models of GCs.
In short, GCs and the solar neighborhood likely started with the same amount of binary systems, and interstellar dynamics handled the rest.
Citation
“A Common Origin for Binary Fractions in the Field and in Dense Clusters,” Christopher E. O’Connor et al 2026 ApJ 1009 L80. doi:10.3847/1538-4357/aea078
The post Catching the Culprit Behind Globular Clusters’ Disappearing Binaries appeared first on AAS Nova.
]]>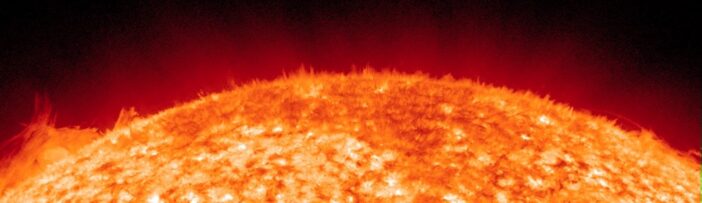
Why do spicules — tiny spikes of plasma on the Sun — appear to rotate, split, and merge? New simulations reveal the possible cause of these motions.
The post Drawing Back the Curtain on Solar Spicules appeared first on AAS Nova.
]]>The Sun’s surface is peppered with spikes of plasma called spicules that appear to shift and twist over time. Recent simulations suggest a new explanation for the motion of solar spicules.
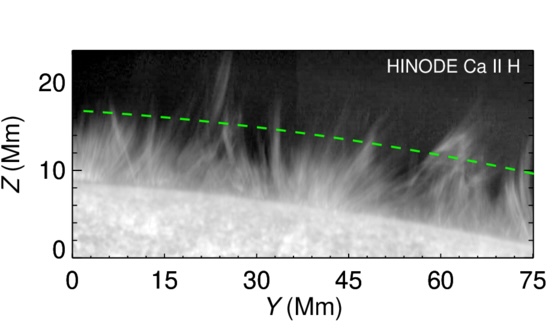
Solar spicules as seen by the Hinode mission. [Adapted from Dey et al. 2026]
Jets in Motion
Solar spicules are tiny jets of solar plasma that last just a few minutes. When viewed along the solar limb, spicules resemble blades of grass blowing in the wind. Observations show these structures moving in a variety of ways: twisting, shifting side to side, splitting, and joining together. Though spicules were first identified more than a century ago, where these motions come from is still up for debate.
In a recent research article, Sahel Dey (University of Newcastle; Indian Institute of Astrophysics; Indian Institute of Science) and collaborators performed 3D magnetohydrodynamics simulations to investigate the source of solar spicules’ motion. The team’s simulations encompassed a volume of 6,000 × 9,000 × 37,000 kilometers that stretched from beneath the visible surface of the Sun up to the lower region of the Sun’s outer atmosphere, or corona. In this region, they applied a uniform vertical magnetic field, mimicking the conditions within a coronal hole, where the Sun’s magnetic field streams outward into the solar system
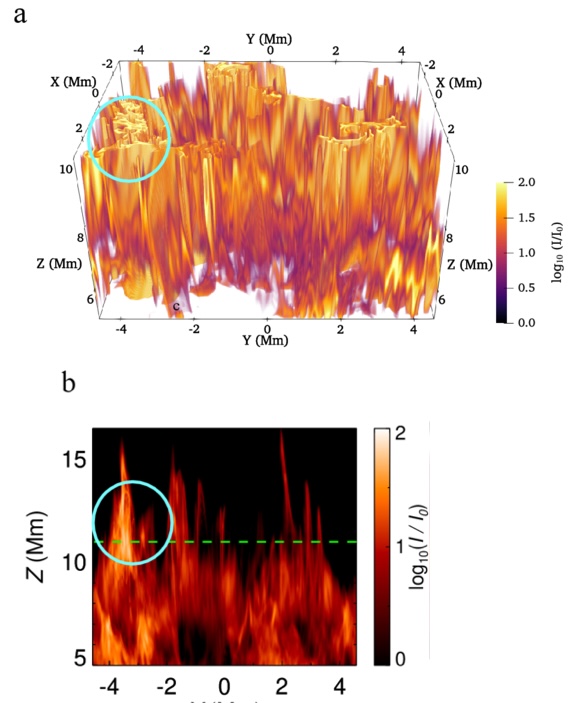
A) A three-dimensional view of simulated solar spicules, showing curtain-like structures. B) Intensity of synthetic emission from the spicules in panel A, integrated along the line of sight. The cyan circle indicates the same region in both panels. [Adapted from Dey et al. 2026]
Simulating Spicules
The jet-like appearance arises when this arrangement is viewed from the side; the team created synthetic images of their simulated spicules that show individual jet-like features. These “jets” have properties similar to those of real spicules, lasting just 5–10 minutes, journeying upward at 20–70 kilometers per second, and reaching heights of 6,000–16,000 kilometers.
These simulations clearly demonstrate that what appear to be individual jets can arise from curtain-like plasma structures. Dey and collaborators showed that this network of spicules evolves over time, buoyed upward from below by a series of shocks, pulled down gradually by gravity, and buffeted by adjacent plasma.
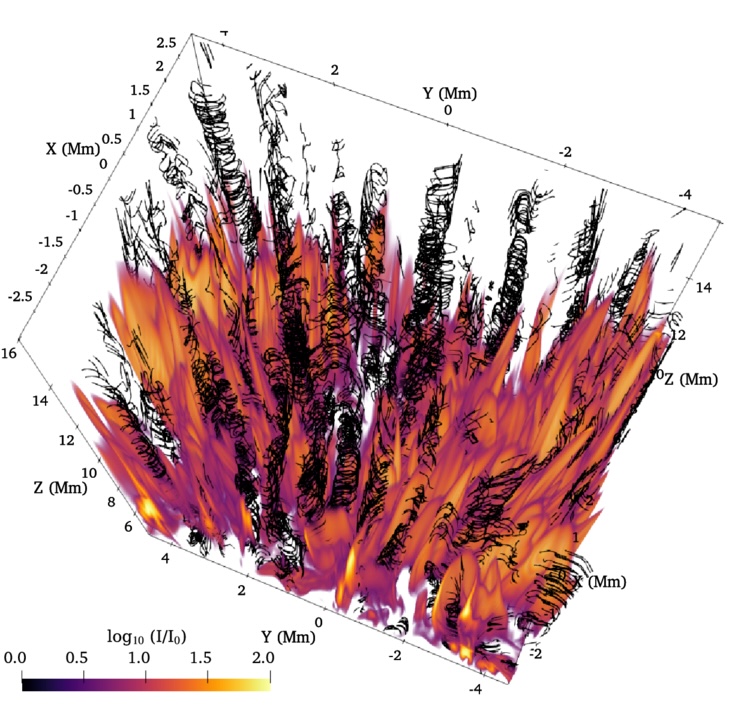
Three-dimensional view of spicules (purple–yellow regions) and coronal swirling conduits (represented by spiraling black lines). [Adapted from Dey et al. 2026]
This work demonstrates that a curtain-like configuration provides a viable explanation for the observed variety of spicule motions. Going forward, it will be critical to test this possibility further, as correctly interpreting the underlying structures of solar spicules is key to understanding how mass and energy are transferred to the solar corona.
Citation
“Solar Spicule Rotation Driven by Plasma Curtain–Vortex Interactions,” Sahel Dey et al 2026 ApJ 1008 132. doi:10.3847/1538-4357/ae8999
The post Drawing Back the Curtain on Solar Spicules appeared first on AAS Nova.
]]>
Astrobites reports on why interstellar magnetic fields can appear ordered or tangled, depending on which gas clouds you measure and how.
The post The Invisible Architecture Between the Stars appeared first on AAS Nova.
]]>Editor’s Note: Astrobites is a graduate-student-run organization that digests astrophysical literature for undergraduate students. As part of the partnership between the AAS and astrobites, we occasionally repost astrobites content here at AAS Nova. We hope you enjoy this post from astrobites; the original can be viewed at astrobites.org.
Title: Phase-Dependent Magnetic Coherence in the Turbulent Interstellar Medium
Authors: Iryna S. Butsky et al.
First Author’s Institution: Stanford University
Status: Accepted to ApJ
The space between stars isn’t empty, because it’s threaded with magnetic fields that shape how gas moves and steer cosmic rays as they race across the galaxy. As a result, understanding how the magnetic field is structured within different components of the interstellar medium, specifically clouds of different temperatures, is a key part of understanding how the interstellar medium we see today takes shape.
Because magnetic fields are invisible, astronomers need tracers to reveal their structure. One such tracer is the emission from dust grains. Dust grains are not spherical, and a dust grain’s long axis tends to align at a right angle to the magnetic field, causing dust grains to emit light that vibrates in a particular direction. This is called polarized emission. If the magnetic field in a region is very ordered, the grains all align the same way, and a large fraction of their emitted light vibrates in the same direction, giving a high polarization fraction. This fraction is therefore used as a proxy for whether the field can maintain a consistent direction on large scales (an ordered/regular magnetic field).
Comparing the polarization fraction with other tracers of gas lets astronomers infer the field’s structure in the interstellar medium. Previous observations found that the polarization fraction correlates with the fraction of cold gas, but not with the total amount of gas along the line of sight. This suggests that the field is preferentially ordered within cold clouds rather than warm clouds. Curiously, this seemed to contradict other studies that found the field to be more ordered in the warm clouds. Such disagreements are where simulations become useful: because the true magnetic field is known in a simulation, astronomers can test which interpretation the observations actually support.
In this article, the authors use high-resolution numerical simulations to reproduce the relationship between polarization fraction and cold cloud fraction. They find that as long as the line of sight crosses fewer than about 20 clouds, the polarization fraction correlates with the cold cloud fraction, but not with the total neutral gas (Figure 1). This matches earlier observations, where the correlation shows up at high galactic latitudes, which point out of the galactic plane and therefore cross only a few cold structures. When too many clouds lie along the line of sight, each cloud carries an ordered field pointing in a different direction. Averaged together, these vibration directions cancel out, lowering the polarization fraction and washing the correlation away.
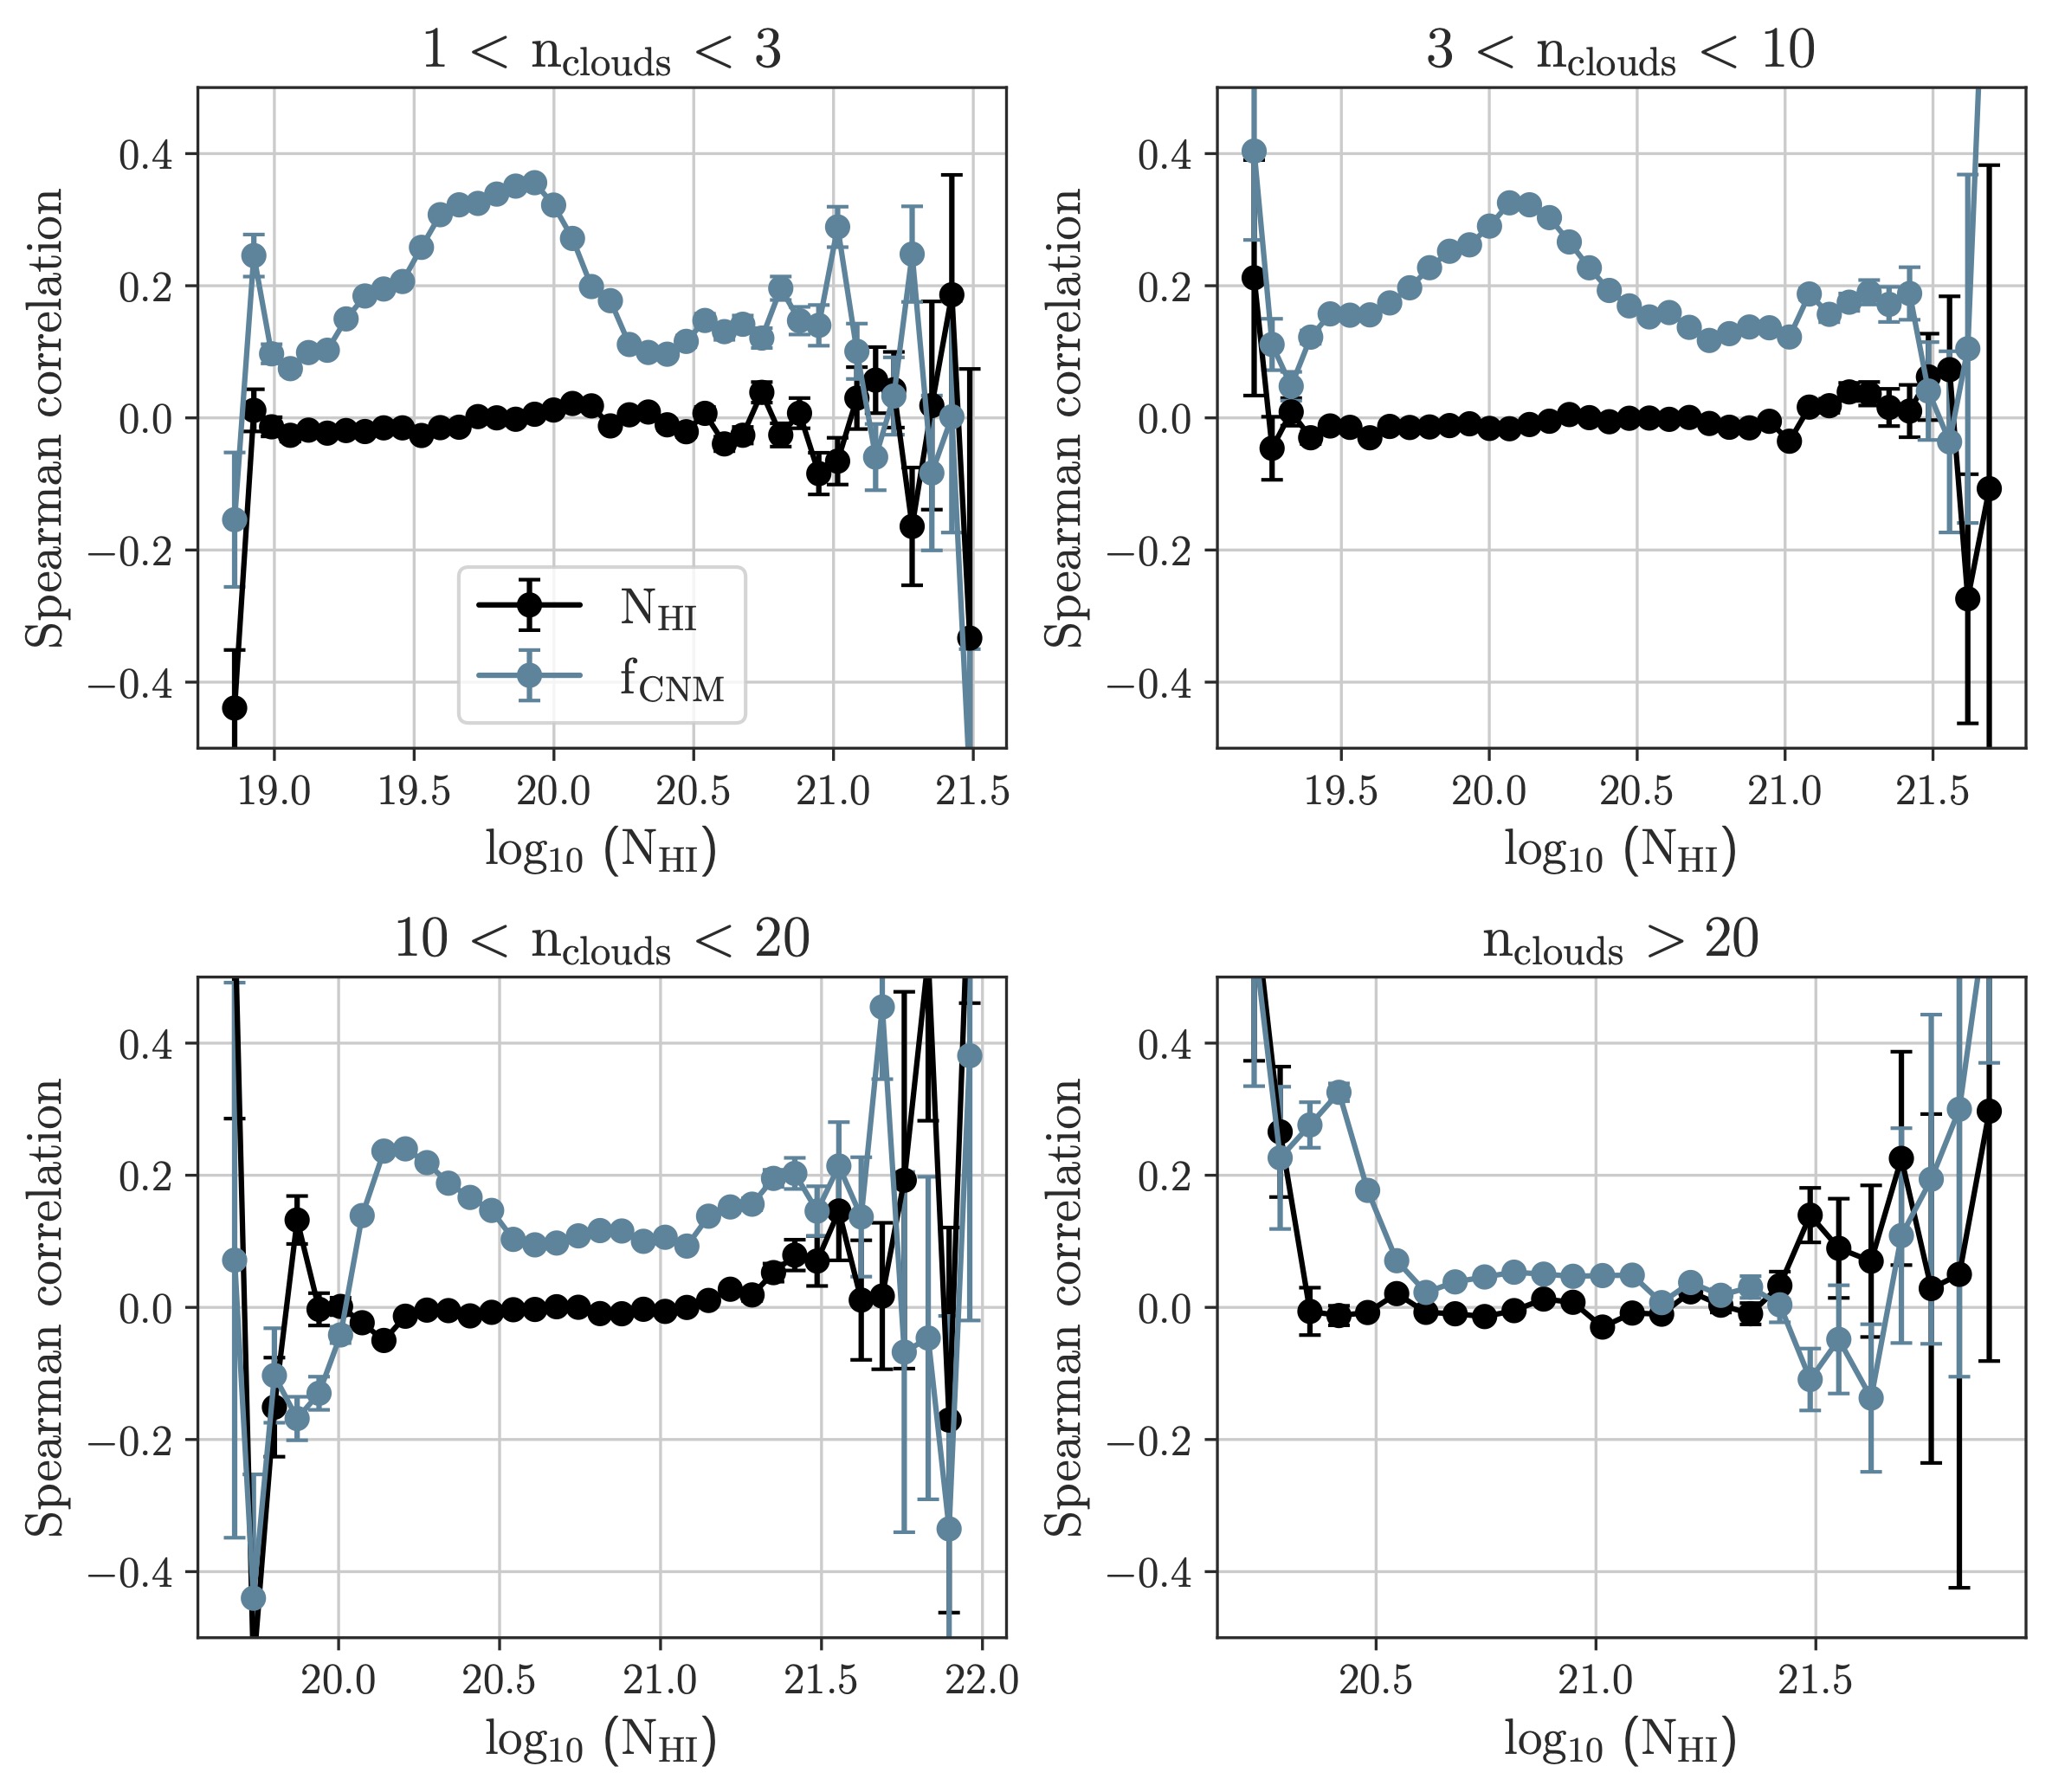
Figure 1: Correlation between dust polarization fraction, the total gas amount (neutral hydrogen column density, NHI), and the fraction of cold medium along the line of sight (fCNM) for projections of different path lengths. The polarization fraction correlates with fCNM but not with NHI. The correlation disappears once many clouds lie along the line of sight (see lower-right panel). [Butsky et al., in press]
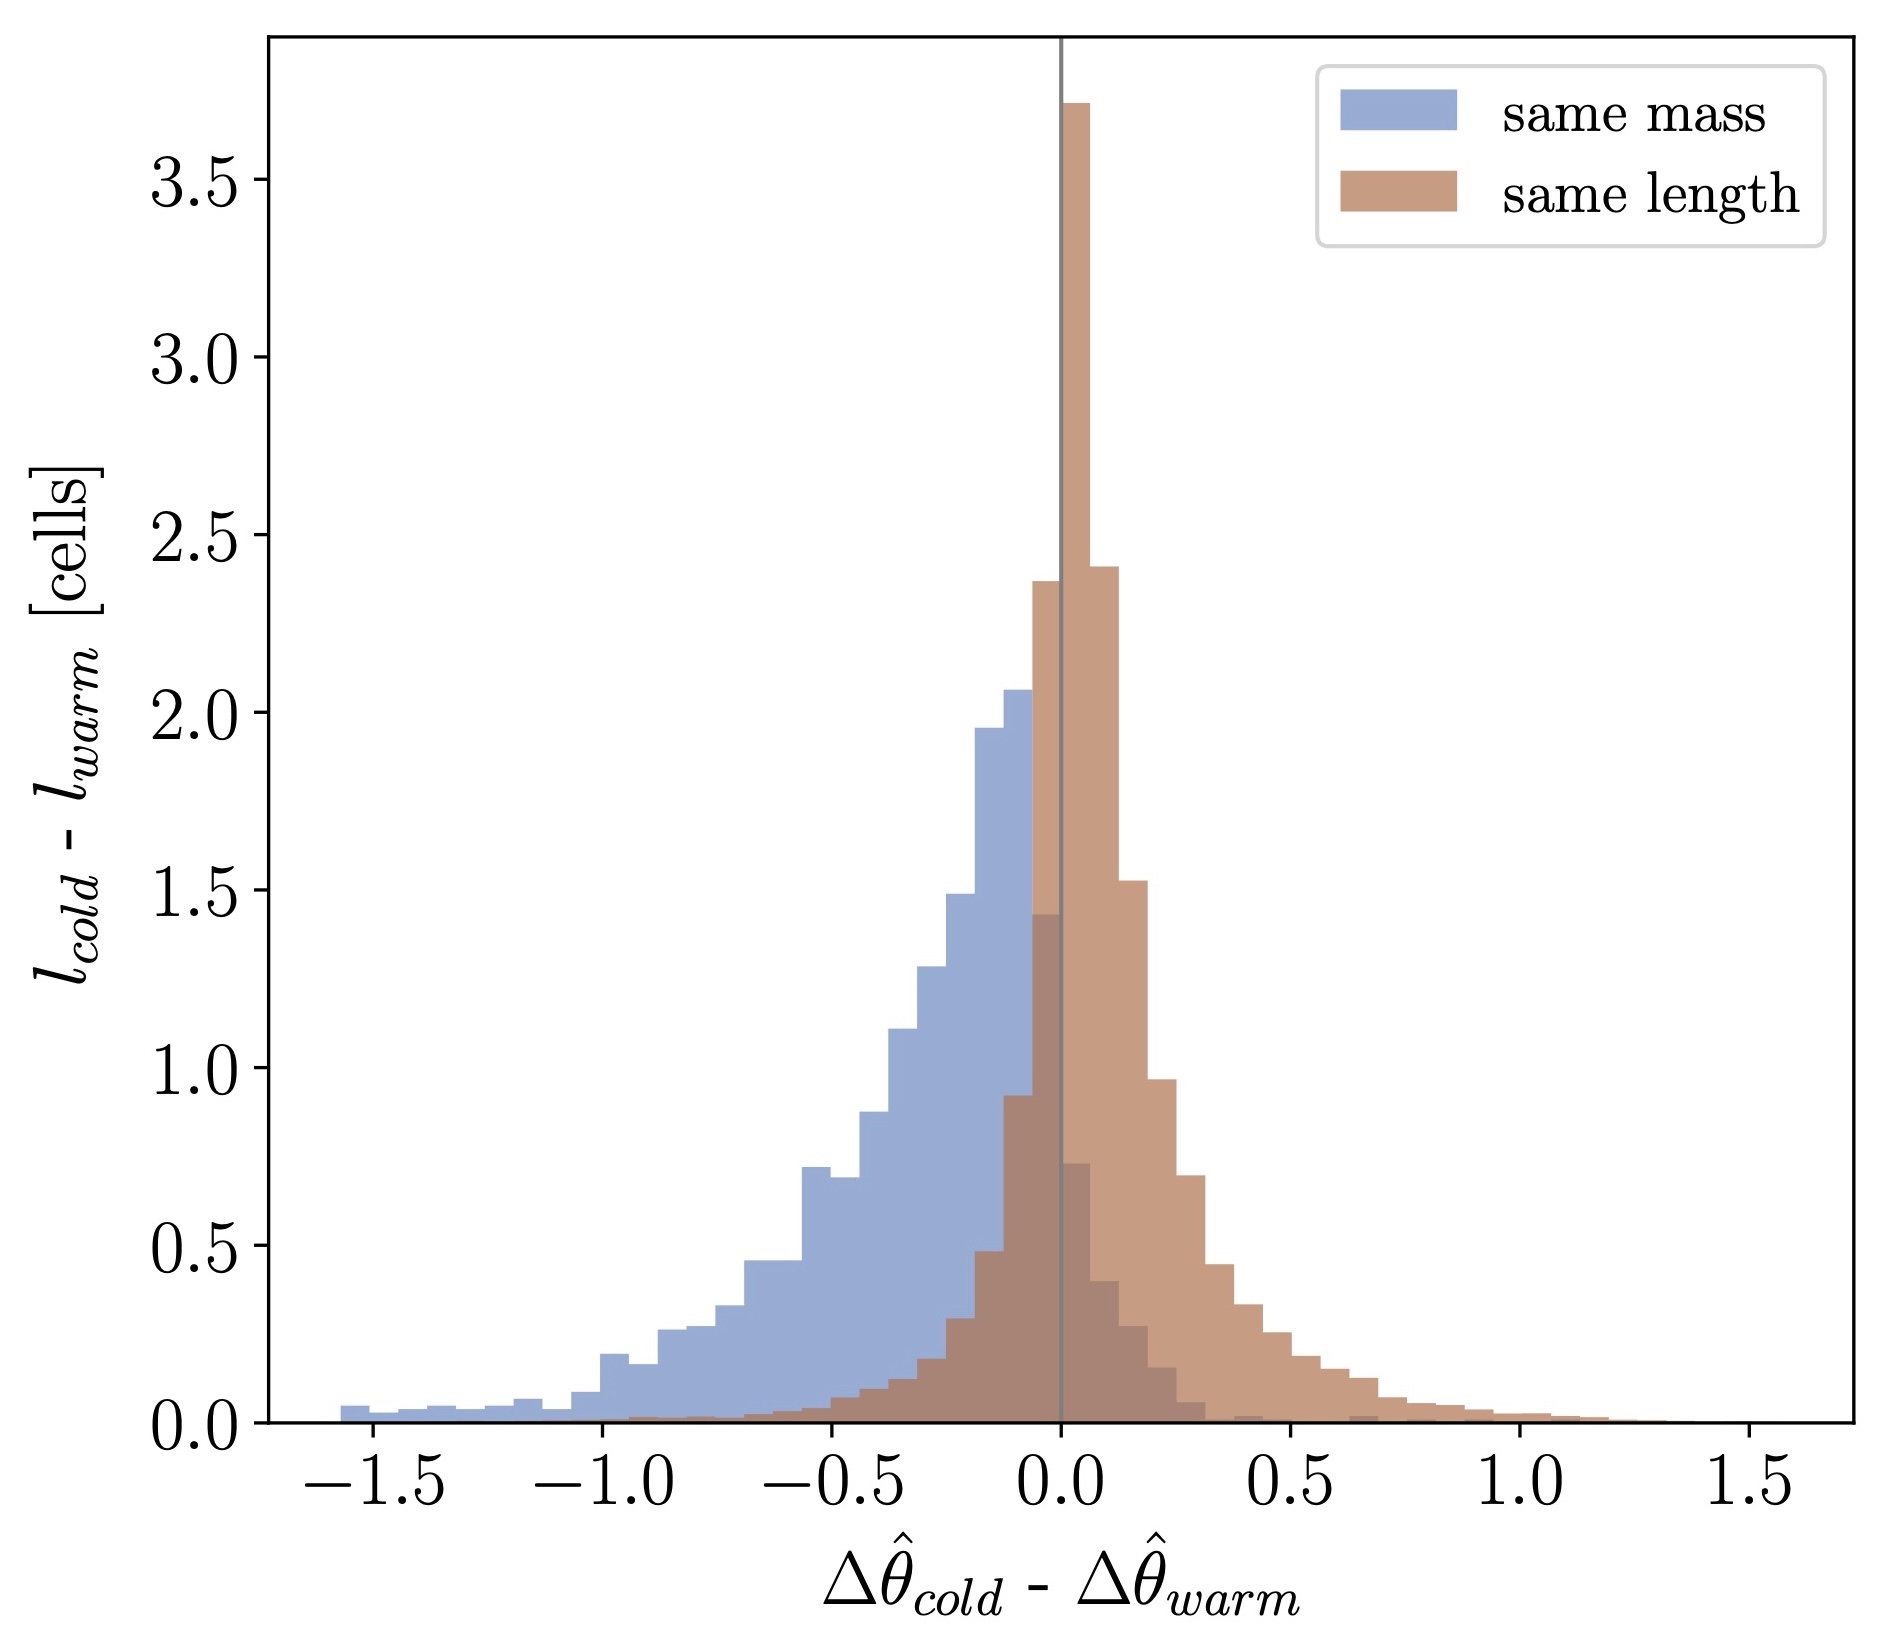
Figure 2: Distribution of the angle difference between the average magnetic field and the line of sight for cold and warm clouds, shown for clouds matched by mass and by length. A smaller angle difference means a more ordered field. At similar mass, cold clouds show a more ordered field; at similar length, the reverse holds. [Adapted from Butsky et al., in press]
This apparent paradox comes from the different nature of cold and warm clouds. Cold clouds are denser and more compact, occupying much smaller physical scales than warm clouds. So to match the length of a warm cloud, you have to string together several cold structures, sampling more of the field’s variation and making the cold gas look disordered. Measured per unit length, then, warm clouds appear more ordered. Measured per unit mass, cold clouds appear more ordered. Crucially, when we observe dust emission, we are naturally weighting by mass, so real observations effectively trace the polarization fraction per unit mass, the regime in which the cold clouds are the more coherent phase.
In the end, this work shows that the ordering of interstellar magnetic fields depends on both the gas phase and how we choose to measure it. Cold clouds carry more coherent fields per unit mass, which is exactly the quantity dust observations trace, resolving an apparent contradiction between earlier studies. It is a reminder that even our best observations come with hidden assumptions, and that simulations, where the true field is known, are essential for interpreting what the sky is really telling us.
Original astrobite edited by Viviana Cáceres.
About the author, Sandy Chiu:
I’m a PhD candidate at the University of Michigan, Ann Arbor. I’m interested in numerical simulations of cosmic rays feedback in galaxies and their comparison with observation.
The post The Invisible Architecture Between the Stars appeared first on AAS Nova.
]]>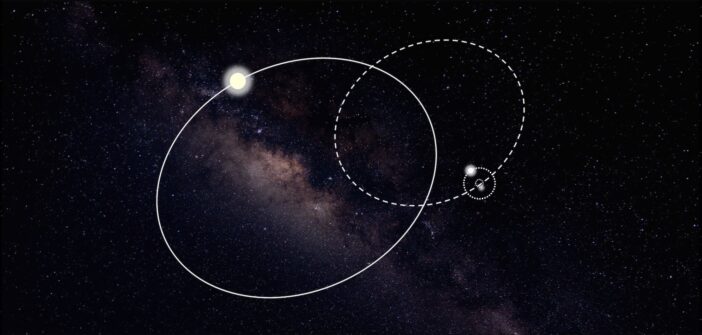
Researchers have discovered a millisecond pulsar with two stellar companions — one of only a handful of these rapidly spinning stellar remnants known to be in a triple system.
The post A Pulsar in a Rare Triple System appeared first on AAS Nova.
]]>Follow-up observations show that a recently discovered pulsar has two stellar companions, making it one of just a handful of millisecond pulsars known to be in triple-star systems.
An Unusual New Pulsar
Earlier this year, researchers reported the discovery of a pulsar with the Five-hundred-meter Aperture Spherical radio Telescope (FAST). The newfound pulsar, PSR J0435+3233, is a millisecond pulsar, rotating once every 3.2 milliseconds. What’s unique about this pulsar is how quickly it’s spinning down: its spin rate is decreasing roughly 100 times faster than other millisecond pulsars in our galaxy, suggesting an unusually strong magnetic field and the possibility of an exotic formation pathway.
The FAST observations also showed that the pulsar is not alone: it appears to be on an 8-day orbit with a white dwarf. Now, follow-up observations have revealed the pulsar’s membership in an intriguing stellar system.
From Radio to Gamma Rays
Zonglin Yang (National Astronomical Observatories, Chinese Academy of Sciences) and coauthors followed up on the discovery of PSR J0435+3233 using multiwavelength data from FAST, multiple optical and infrared observatories, and the Fermi Gamma-Ray Space Telescope.
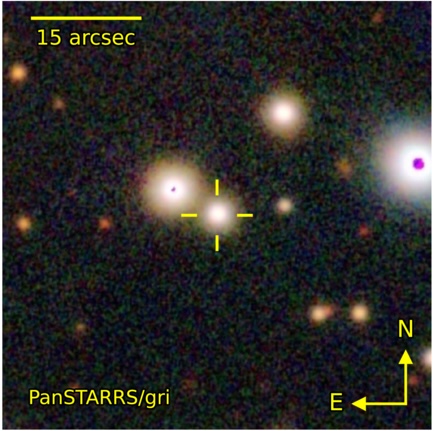
Visible-light image from PanSTARRS of the outer subgiant companion. [Adapted from Yang et al. 2026]
Insights into Stellar Evolution
While it’s common to find millisecond pulsars in binary systems — in fact, many millisecond pulsars are thought to spin up to their incredible speeds via accretion from a stellar companion — it’s rare to discover them in triple systems. Because this system is isolated out in the field rather than crowded together with other stars in a dense cluster, Yang and collaborators suspect that the three stars have been together since birth, as opposed to being assembled dynamically later on.
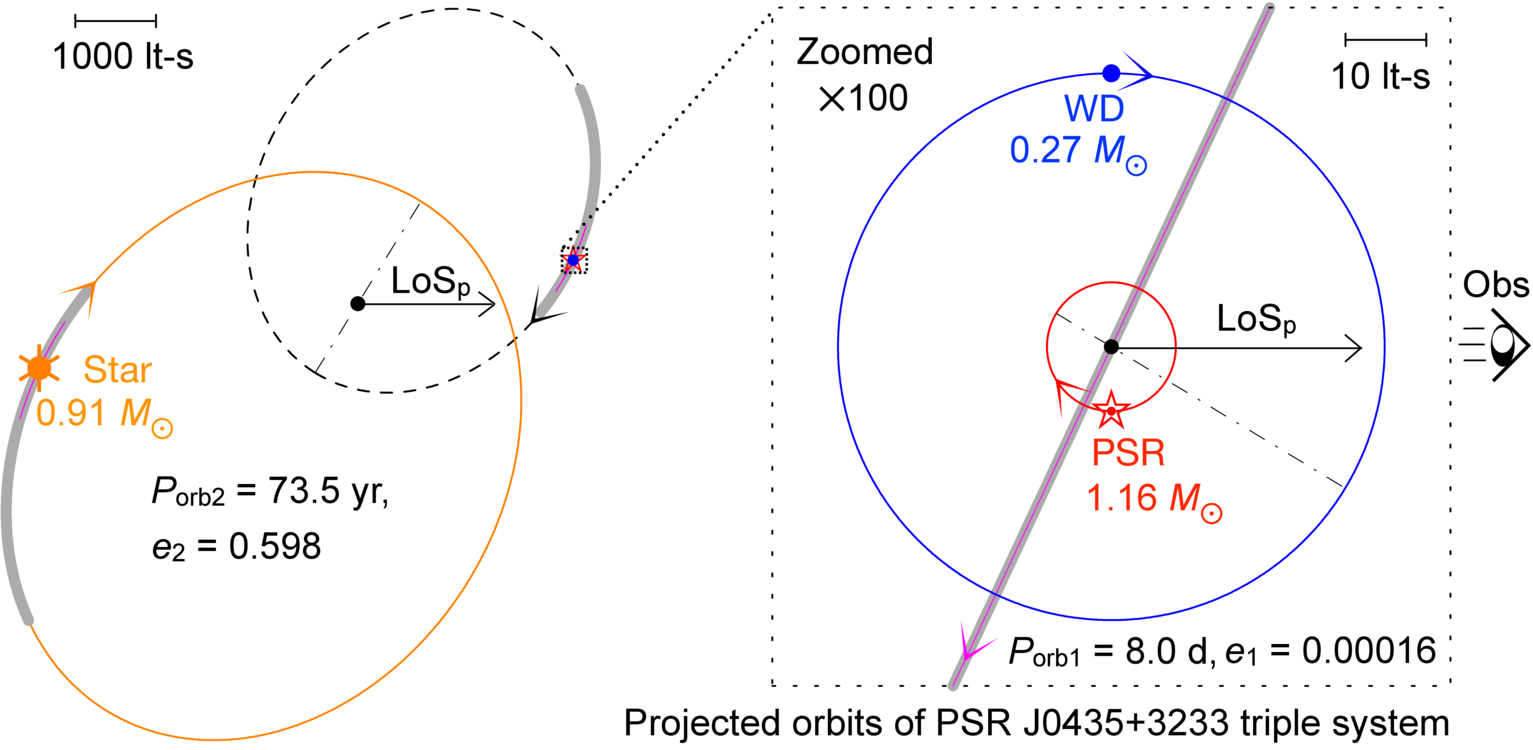
Projected orbits of the three stars in the system. Click to enlarge. [Yang et al. 2026]
Triple-star systems are common among massive stars, but how this configuration affects stellar evolution is still being explored. This discovery offers a valuable opportunity to study dynamics and stellar evolution in a rare triple system.
Citation
“The PSR J0435+3233 Triple System,” Z. L. Yang et al 2026 ApJL 1010 L9. doi:10.3847/2041-8213/aeaa29
The post A Pulsar in a Rare Triple System appeared first on AAS Nova.
]]>
The hot Jupiter WASP-12b is on a collision course with its host star, and it's heading that way faster than expected. New research examines a possible explanation for the planet's speedy inspiraling.
The post Tilting WASP-12b Doesn’t Solve the Mystery of Its Inspiral appeared first on AAS Nova.
]]>In 3 million years or less, WASP-12b will tumble into its host star. It’s not surprising that the planet will meet its end this way, but it is surprising that it will happen so soon. New work tests a potential explanation for the planet’s rapid orbital decay.
Diagnosing a Doomed Planet
Roughly twice as wide as Jupiter and almost 50% more massive, exoplanet WASP-12b zips around its Sun-like stellar host every 1.09 days at a distance of just 0.023 au (3.4 million kilometers or 2.1 million miles). If placed in our solar system, WASP-12b would easily dethrone Mercury as the nearest planet to the Sun.
Observations show that WASP-12b’s already tiny orbit is shrinking, with each orbital period growing shorter at a rate of 29 milliseconds per year (Earth-year, that is). While we would expect the planet to slowly spiral inward due to tidal interactions with its star, it’s moving several orders of magnitude faster than predicted. The planet’s motion has so far defied all attempts to explain it, and now, a new research article by Caleb Lammers (Princeton University) and collaborators appears to topple yet another hypothesis for WASP-12b’s unexpectedly fast orbital decay.
A Tidy Tidal Explanation?
Previous work has proposed that WASP-12b’s rapidly shrinking orbit is due to obliquity tides, which could come into play if the planet had a nonzero obliquity, or axial tilt. Tidal dissipation generally works to keep close-in giant planets like WASP-12b from having a significant axial tilt. However, if you throw a second planet into the system, the companion can exert a torque that could force WASP-12b to remain tilted. This outside forcing, the hypothesis suggests, changes the orbital, spin, and tilt evolution of WASP-12b and ultimately pushes it toward its star far faster than expected without the tilt or the companion.
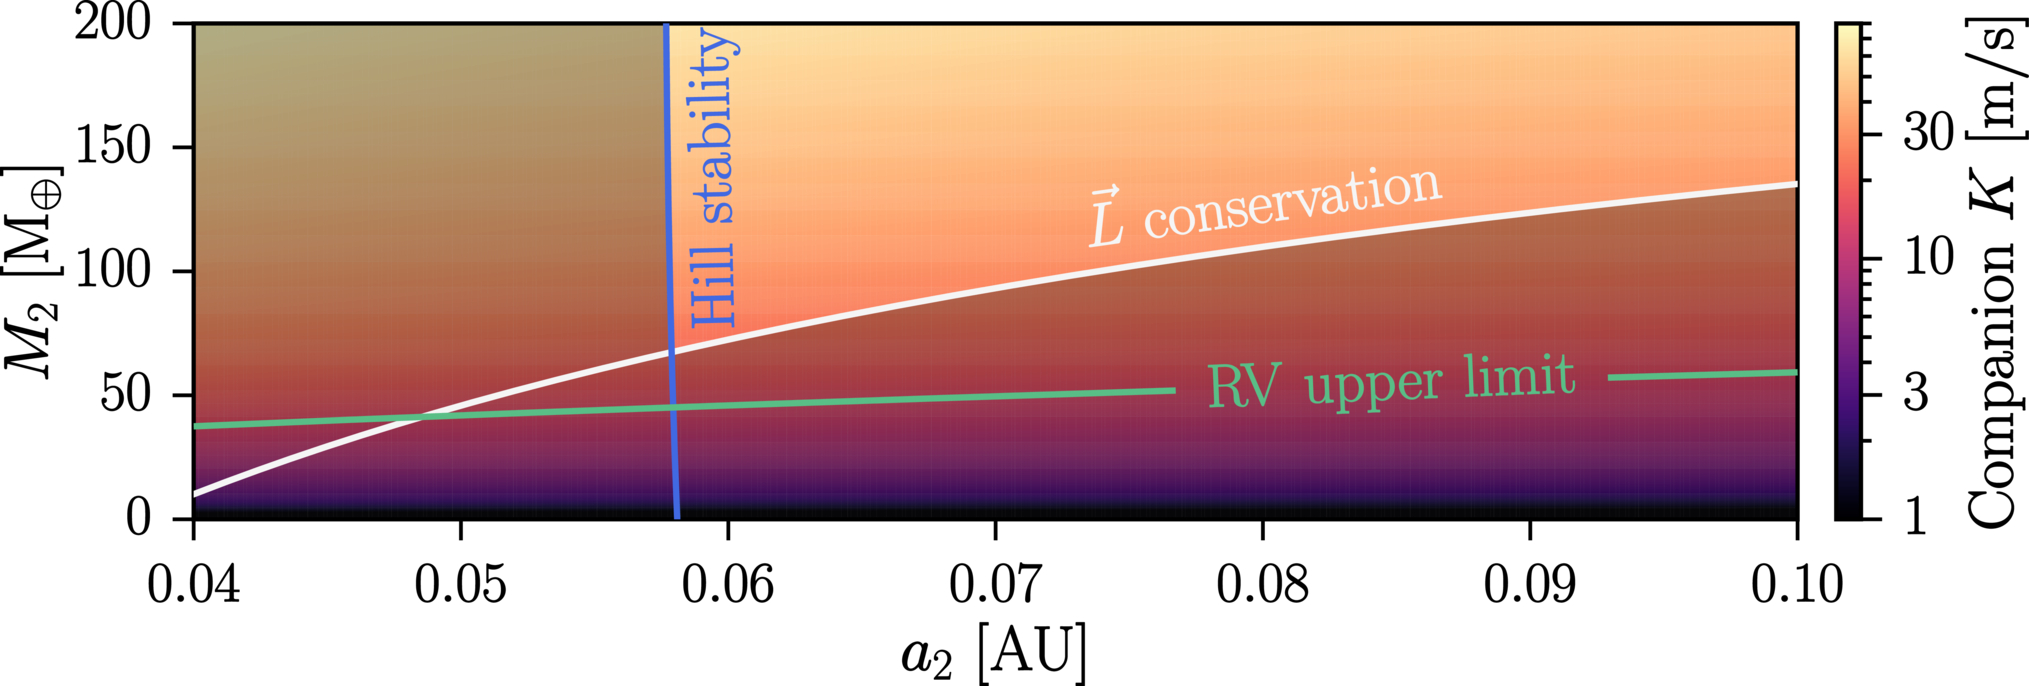
Constraints on the mass and orbital distance of the companion planet in the obliquity-tide scenario. The color shows the radial velocity signal associated with each combination of parameters. The green line shows the maximum radial velocity allowed by observations. Click to enlarge. [Lammers et al. 2026]
The Mystery Persists
This companion mass and orbital distance are both larger than predicted by previous work, which had suggested that a 10–20-Earth-mass planet at 0.04 au would be sufficient to drive WASP-12b’s inward journey. Lammers and coauthors analyzed WASP-12’s radial velocity data for evidence of such a planet tugging on the star, but found none; only under extremely particular conditions could such a planet exist and not be detected in current data.
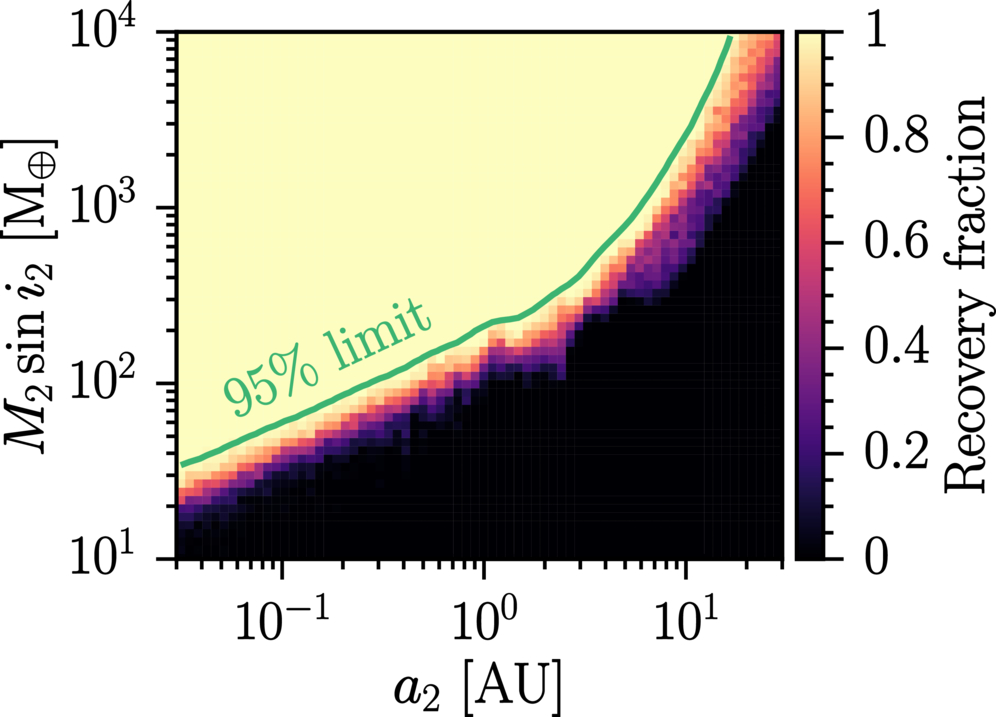
Radial velocity constraints on the properties of a hypothetical second planet in the WASP-12 system, obtained via injection-recovery tests. [Lammers et al. 2026]
Citation
“The Mysterious Inspiral of WASP-12 b: Why Obliquity Tides Cannot Drive Orbital Decay,” Caleb Lammers et al 2026 ApJL 1009 L43. doi:10.3847/2041-8213/aea405
The post Tilting WASP-12b Doesn’t Solve the Mystery of Its Inspiral appeared first on AAS Nova.
]]>
A new catalog of giant pulses from the Crab Nebula pulsar reveals a feature predicted to exist but not seen until now.
The post Featured Image: Echoes of Giant Pulses appeared first on AAS Nova.
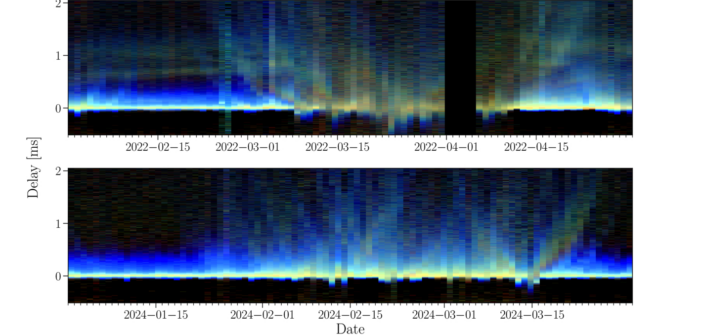
]]>What at first might appear to be abstract pixel art or a fuzzy photograph of skyglow from a distant city is actually a representation of radio emission from the pulsar at the center of the Crab Nebula. When a pulsar’s radio emission passes through a region of ionized gas — like the complex filaments of the Crab Nebula — the plasma deflects the radio signal from its intended course. This detour can create “echoes”: copies of the pulsar signal that arrive later than the original pulse. Thierry Serafin Nadeau (University of Toronto) and collaborators studied these echoes from the Crab pulsar by compiling an archive of giant pulses detected over 2.5 years by the Canadian Hydrogen Intensity Mapping Experiment (CHIME). Giant pulses, which are brighter and narrower than typical pulses, offer a powerful way to probe plasma echoes. The image above shows sweeping parabola-shaped echoes during two particularly active periods. The color shows the frequencies at which power was received: mainly at low (blue), high (red), or all (yellow-white) frequencies. This dataset revealed for the first time a feature predicted to exist but never seen: echoes from plasma structures that never pass directly in front of the pulsar from our point of view. To learn more about the echoes of the Crab pulsar, be sure to check out the research article linked below.
Citation
“Echoes in Different Tempo: Long-Term Monitoring of Crab Echoes with CHIME,” Thierry Serafin Nadeau et al 2026 ApJ 1006 82. doi:10.3847/1538-4357/ae7336
The post Featured Image: Echoes of Giant Pulses appeared first on AAS Nova.
]]>
Astrobites reports on NASA’s SPHEREx mission, which is collecting an infrared spectrum for every point in the sky — potentially revolutionizing our understanding of cosmic inflation, galaxy formation, and interstellar ices.
The post SPHEREx: The Niftiest Space Telescope You May Not Have Heard Of appeared first on AAS Nova.
]]>Editor’s Note: Astrobites is a graduate-student-run organization that digests astrophysical literature for undergraduate students. As part of the partnership between the AAS and astrobites, we occasionally repost astrobites content here at AAS Nova. We hope you enjoy this post from astrobites; the original can be viewed at astrobites.org.
Title: The SPHEREx Satellite Mission
Authors: James J. Bock et al.
First Author’s Institution: California Institute of Technology; Jet Propulsion Laboratory
Status: Published in ApJ
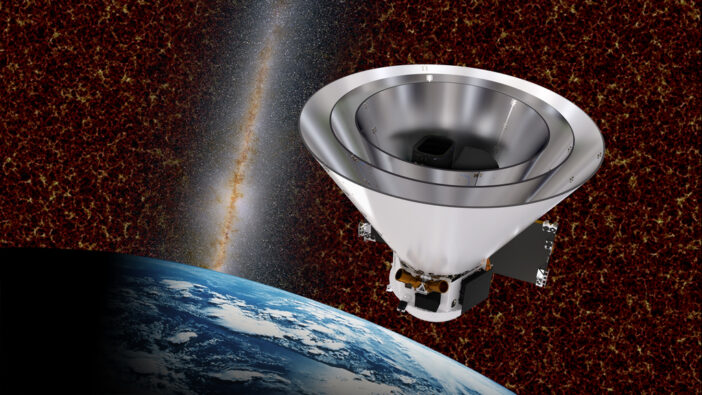
You know JWST. You’ve likely heard about the recently launched Nancy Grace Roman Space Telescope. But did you know that NASA launched a third space telescope focused on infrared astronomy just last year? That telescope, called SPHEREx (short for Spectro-Photometer for the History of the Universe, Epoch of Reionization, and Ices Explorer, but we’ll forgive the tortured acronym), is currently carrying out its ambitious mission to record an infrared spectrum for every point in the sky. Let’s break down SPHEREx’s three main science goals and then discuss how SPHEREx will accomplish its mission.
Goal #1: Stress-Testing Cosmic Inflation
According to our best current models of cosmology, the very early universe experienced a rapid burst of accelerating expansion called cosmic inflation. During inflation, small regions of the universe that by chance had slightly higher energy density than their neighbors (due to quantum fluctuations) expanded to huge scales. Because these regions were very gravitationally attractive, once inflation ended, they became the seeds where matter accumulated and eventually formed galaxies.
This means that the distribution of galaxies that we see today is a reflection of the properties of inflation (i.e., what the quantum fluctuations were like and how inflation supersized them). SPHEREx will assemble the largest atlas of galaxies ever, recording the three-dimensional positions of hundreds of millions of galaxies across the entire sky. To do this, SPHEREx must figure out how far away these galaxies are from Earth, using their redshifts. SPHEREx’s low-resolution infrared spectroscopy allows for moderately precise measurements of these redshifts. By performing statistical analyses of how galaxies are separated from each other, SPHEREx will test different theories of inflation, like whether inflation was driven by multiple fields.
Goal #2: Frozen Assets
Astronomers are racing to find evidence for life (or at least habitability) in the atmospheres of exoplanets through transmission spectroscopy. However, we don’t know for sure how molecules that could be used in biological processes (called biogenic molecules, these include water, carbon dioxide, carbon monoxide, and methanol) even end up on planets.
We think that a large fraction of these molecules are frozen onto dust grains throughout the interstellar medium. When a new star forms in the interstellar medium, this ice and dust would become part of the star’s protoplanetary disk. The ice species can help create planetesimals (which may grow into planets) or can later deliver biogenic molecules to planetary surfaces. Earth’s oceans likely came (at least in part) from collisions with icy asteroids. As Figure 1 shows, SPHEREx will measure the abundance of ice species in different environments that track the history of solar system formation, from dense clouds in the interstellar medium that may soon form stars to regions around newborn stars and evolving protoplanetary disks. In this way, SPHEREx will track how biogenic molecules from the interstellar medium can end up on planets.
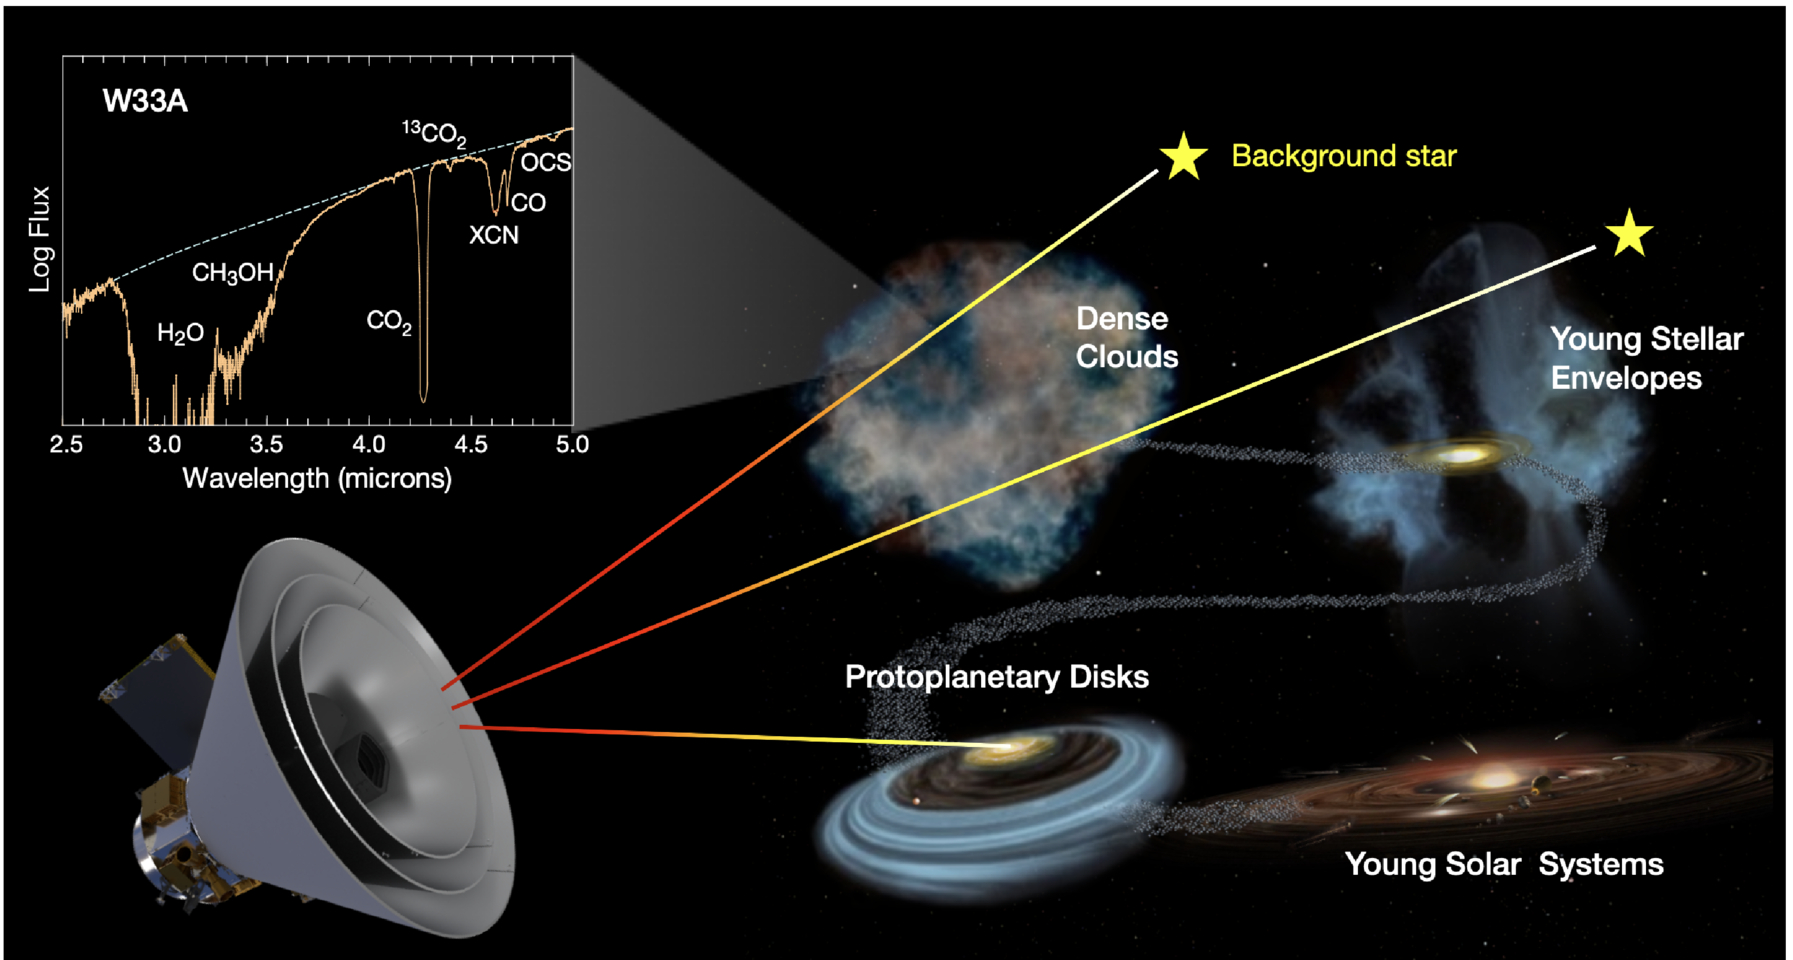
Figure 1: Examples of the sources SPHEREx will look at to search for biogenic ice species. In the top left, what the spectra of these sources will look like if those species are present: each type of ice leaves a distinct fingerprint in an infrared spectrum. [Bock et al. 2026]
Goal #3: Your Noise Is SPHEREx’s Signal
SPHEREx will measure an infrared spectrum for every point in the sky — even those that don’t contain galaxies or stars that we can resolve. These points are instead dominated by diffuse extragalactic background light. This light comes from many different sources, including stars, dust, and quasars, from the early universe to the present day, all added together incoherently. For most telescopes, the extragalactic background light is just a frustrating source of noise. For SPHEREx, it’s a treasure trove. We can compare the properties of the extragalactic background light that SPHEREx measures (its spectrum and how it fluctuates across the sky) to theoretical predictions and see if we seem to be missing anything. SPHEREx’s very broad infrared spectra — capturing redshifted light from the very early universe — and total sky coverage are crucial for this purpose. For instance, the SPHEREx team will try to isolate emission from the first stars and galaxies, which ionized most of the gas in the universe in the epoch of reionization. By understanding this and other contributions to the extragalactic background light, we can test hypotheses about how galaxies form and evolve.
Making It Happen
Beyond inflation, ices, and extragalactic background light, SPHEREx’s all-sky infrared spectra will be invaluable for countless other science cases, like studying asteroids, characterizing the atmospheres of stars that host exoplanets, and even understanding the upper atmosphere of Earth, through which SPHEREx orbits.
But how can SPHEREx even make a spectrum for every point in the sky? An image of some part of the sky is fundamentally two-dimensional, and measuring how the brightness of every point changes with wavelength adds a third dimension. Astronomers have come up with many ways to solve this problem. Integral field spectroscopy approaches typically involve splitting an image into small regions or strips, then using a dispersive element like a prism or grating to make a spectrum of each region, and finally putting these spectra side by side on a camera. Figure 2 shows an example of this strategy, as well as what the final three-dimensional “datacube” looks like after processing.
This approach is fairly complicated, relying on fancy optics, a prism or grating, and oftentimes optical fibers. From Figure 2, note that you could also make the final “datacube” product if you simply took many images with narrow filters that let through different wavelengths of light. This takes to an extreme the approach astronomers use for spectral energy distribution fitting. Of course, this would require an exorbitant number of filters. Here, the SPHEREx team had a stroke of genius: instead of having many different filters, what if you had a filter where the transmitted wavelength changes linearly across the filter? Each row would let through a different wavelength. To get a full spectrum for all points in an image, you could take many exposures, moving the telescope slightly between each exposure so points in the image fall on different rows each time.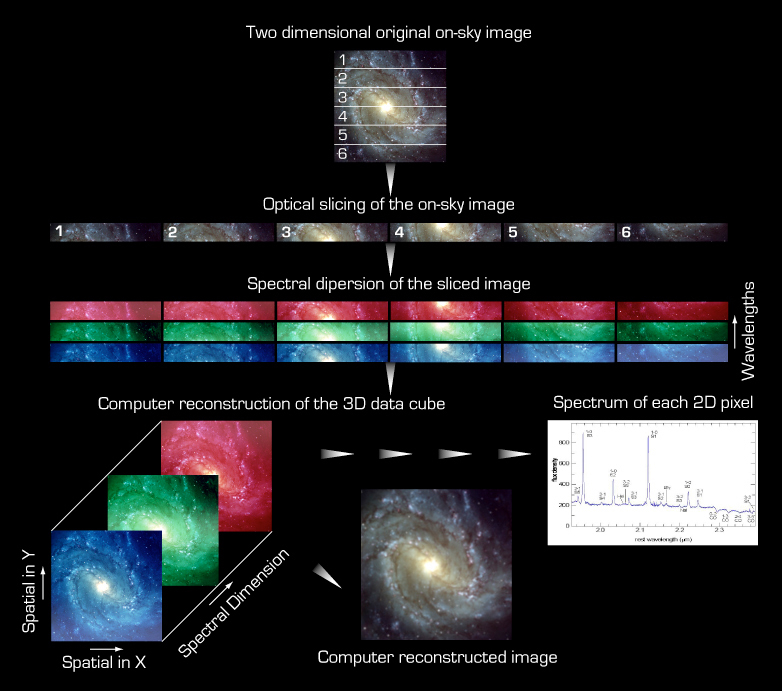
This is the SPHEREx survey strategy, with a few complications. First, before any filter, SPHEREx splits incoming light into two beams, with short-wave infrared light (SWIR, with 0.75 μm < λ < 2.42 μm) going in one direction and mid-wave infrared light (MWIR, 2.42 μm < λ < 5.00 μm) going in another. SPHEREx makes images with these two beams on different sets of detectors, so it can measure the brightness of an object at one SWIR wavelength and one MWIR wavelength simultaneously. The SPHEREx field of view covers 10.5° by 3.5°, with the SWIR and MWIR images each spread across three detectors. Every detector has a different linearly variable filter. To get a complete infrared spectrum of a given point in the sky, SPHEREx moves that point to 17 different positions on each detector. This requires 51 different telescope (17 × 3 detectors) pointings in all and yields 102 spectral values (51 × 2 for the SWIR and MWIR beams). Figure 3 shows the 17 bands on each of the six SPHEREx detectors, each corresponding to a different wavelength value.
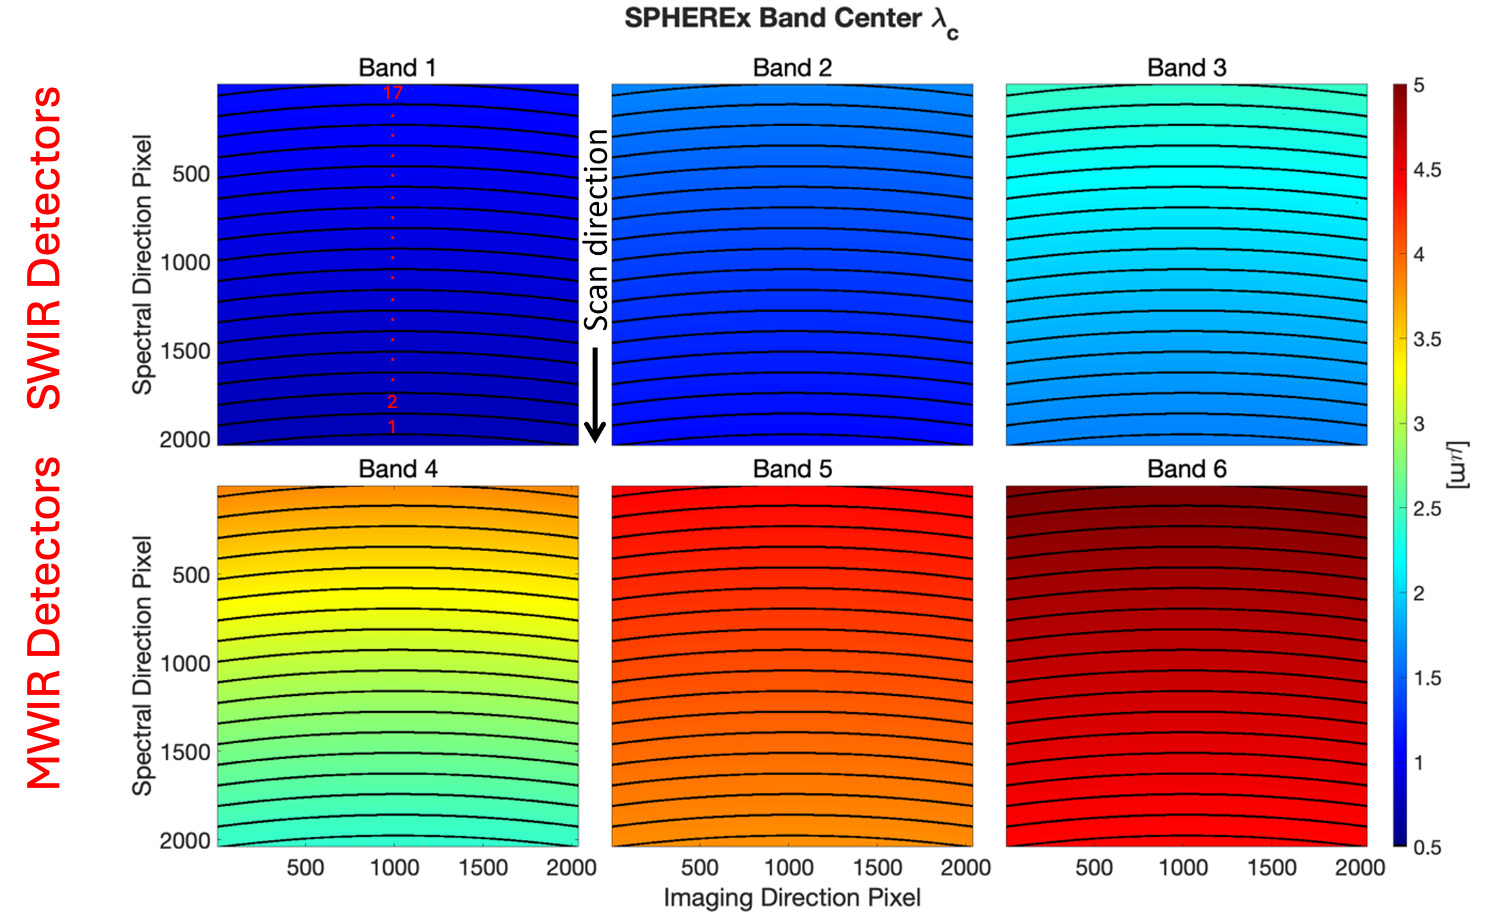
Figure 3: The wavelength of light that each part of each SPHEREx detector is sensitive to. A point in the sky is imaged on one short-wave infrared detector (top row) and one mid-wave infrared detector (bottom row) simultaneously. SPHEREx measures each point in the sky at 102 different wavelengths by placing the point at 17 different positions on each of the detectors. [Adapted from Bock et al. 2026]
Original astrobite edited by Veronika Dornan.
About the author, Chris Layden:
Chris is a PhD candidate in astrophysics at the Massachusetts Institute of Technology. His primary research interest is developing instrumentation that enables high-speed astronomical observations. With such instruments, he studies the most rapidly varying phenomena in the sky, including millisecond pulsars, accreting black holes, and solar system objects whizzing past background stars. Outside of astronomy, Chris enjoys reading classic novels, playing ultimate frisbee, and hanging out with his wife and dog.
The post SPHEREx: The Niftiest Space Telescope You May Not Have Heard Of appeared first on AAS Nova.
]]>
Last year, gravitational wave detectors triggered on what may have been a collision involving a sub-solar-mass neutron star. New research investigates a potential link between this event and a supernova.
The post Supernova, Kilonova, or Both? Another Look at SN 2025ulz appeared first on AAS Nova.
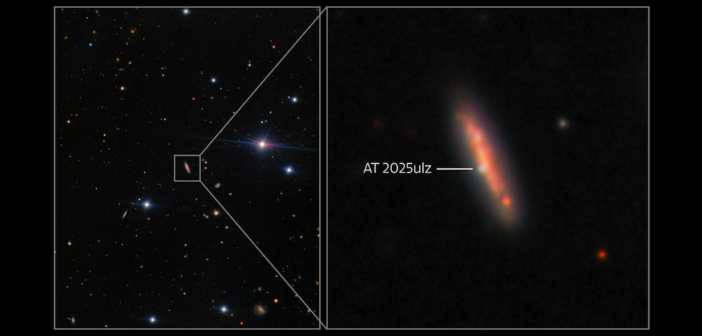
]]>A tentative gravitational wave signal sent astronomers searching for a possible electromagnetic counterpart. New radio observations weigh in on whether the candidate counterpart is a standard supernova or a sign of something rarer.
A Potential Neutron Star Merger
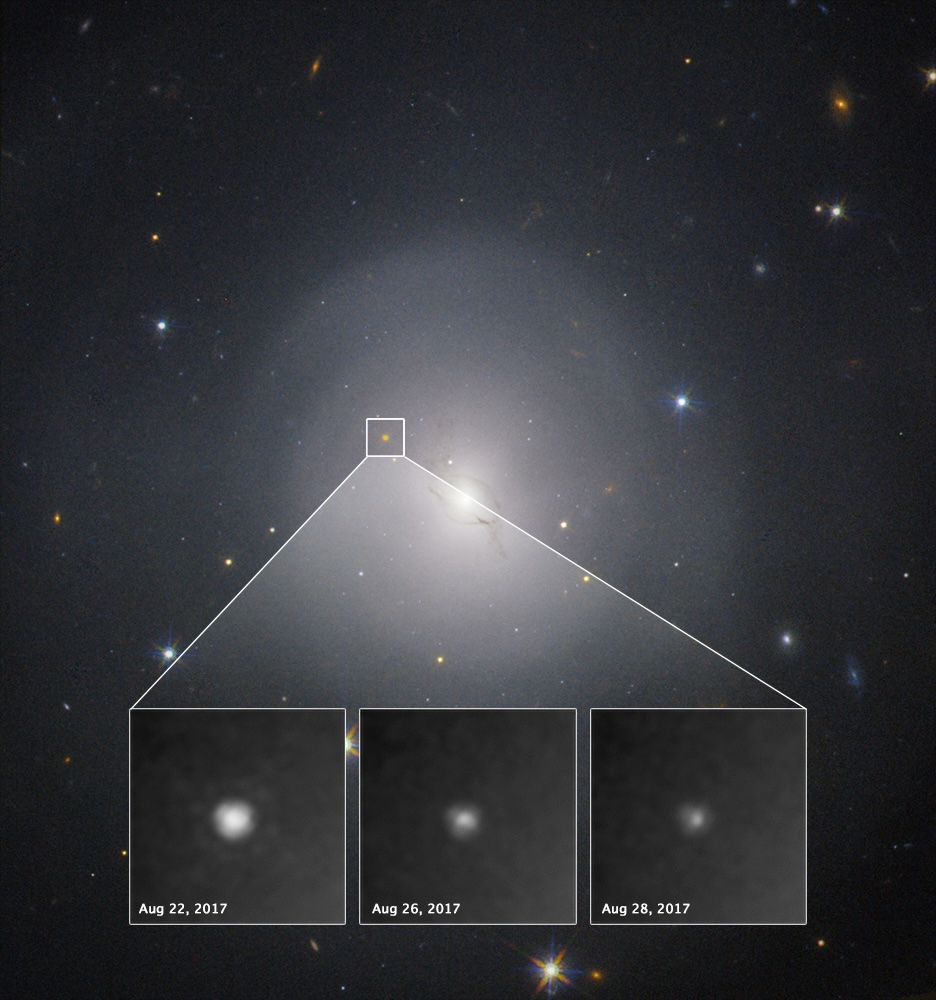
These images from the Hubble Space Telescope show the fading light of the kilonova associated with the gravitational wave event GW170817. [NASA and ESA Acknowledgment: A. Levan (U. Warwick), N. Tanvir (U. Leicester), and A. Fruchter and O. Fox (STScI)]
S250818k offered a rare opportunity to associate the light from a kilonova with a gravitational wave detection, a feat achieved only once so far, in 2017. The intrigue surrounding S250818k was heightened even further by the possibility that the collision involved at least one sub-solar-mass neutron star. Such a lightweight neutron star would fall below the lower mass limit set by stellar evolution models, requiring a different formation pathway.
S250818k’s kilonova potential rose and fell once researchers spotted an electromagnetic transient in its source region. Early optical observations revealed a kilonova-like color and rapid fading, while later observations showed brightening similar to a supernova interacting with circumstellar gas. This led the event to be classified as supernova SN 2025ulz — and therefore unlikely to be the source of the gravitational wave signal.
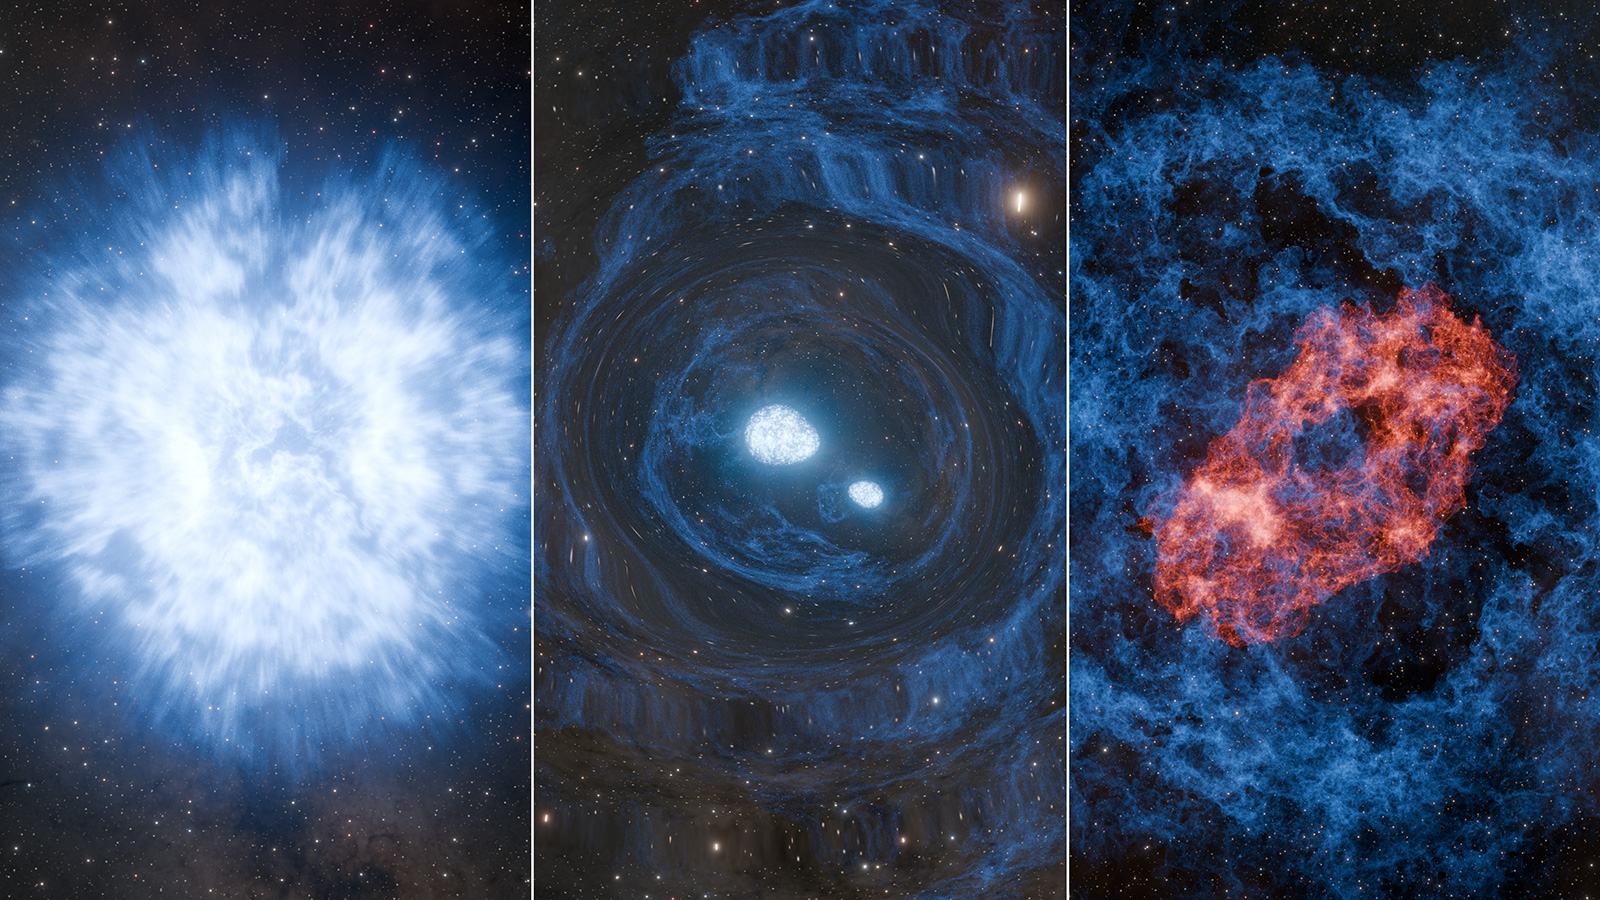
Illustration of a kilonova that occurs in the wake of a supernova. First, a massive star collapses. Then, neutron stars form in the aftermath. Finally, the neutron stars collide, producing a kilonova whose signal might be hidden by the supernova. [Caltech/K. Miller and R. Hurt (IPAC)]
A Kilonova in a Supernova?
Unlikely, but not impossible. Tanner O’Dwyer (Johns Hopkins University) and collaborators investigated the supernova for signs that it wasn’t a typical collapsing star. The team was motivated by theories suggesting that the collapse of a rapidly rotating massive star could produce both a kilonova and a supernova — potentially uniting gravitational wave signal S250818k and supernova SN 2025ulz.
In theory, the demise of a fast-spinning massive progenitor could produce one or more sub-solar-mass neutron stars. This could happen if 1) the collapsing stellar core splits into two neutron stars, or 2) in a twist on the star-formation process, neutron stars coalesce out of neutron-rich material in the disk surrounding the dying star. In either scenario, the neutron stars could merge shortly after the star’s collapse, generating kilonova emission that might be obscured by the expanding supernova.
Looking Deeply in the Radio
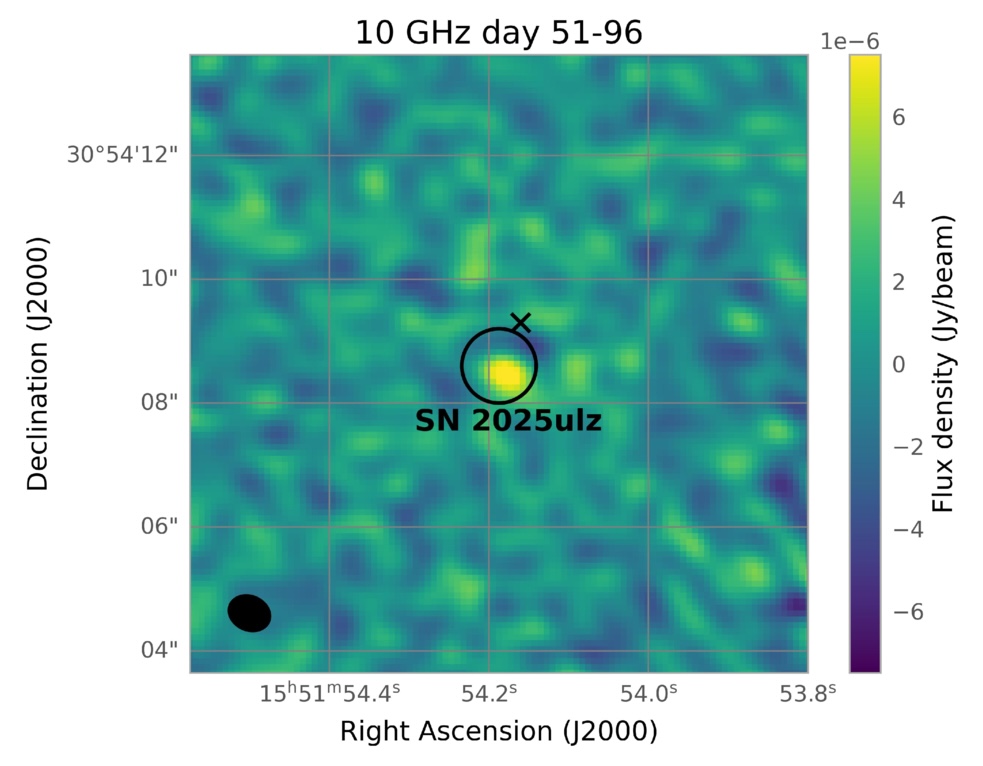
Very Large Array detection of a radio counterpart to SN 20215ulz. The circle shows the optical position of the supernova, and the “x” shows the optical position of the host galaxy. [Adapted from O’Dwyer et al. 2026]
The team found that standard supernova ejecta and relativistic jet models can both plausibly fit the data. In the supernova scenario, the estimated expansion speed and progenitor mass-loss rate place the event well within the bounds of known stripped-envelope supernovae. Though the data were also compatible with an off-axis relativistic jet, the authors were unable to resolve degeneracies in the event’s properties, including the jet energy and the interstellar medium density.
Ultimately, the authors suggested that a supernova fits the data more naturally. While this radio investigation didn’t unambiguously link S250818k and SN 2025ulz via an exotic kilonova-plus-supernova mechanism, it’s clear that radio observations have an important role to play in examining future gravitational wave signals.
Citation
“Identification of a Radio Counterpart to SN 2025ulz in the S250818k Localization Area,” Tanner O’Dwyer et al 2026 ApJL 1009 L44. doi:10.3847/2041-8213/aea4a5
The post Supernova, Kilonova, or Both? Another Look at SN 2025ulz appeared first on AAS Nova.
]]>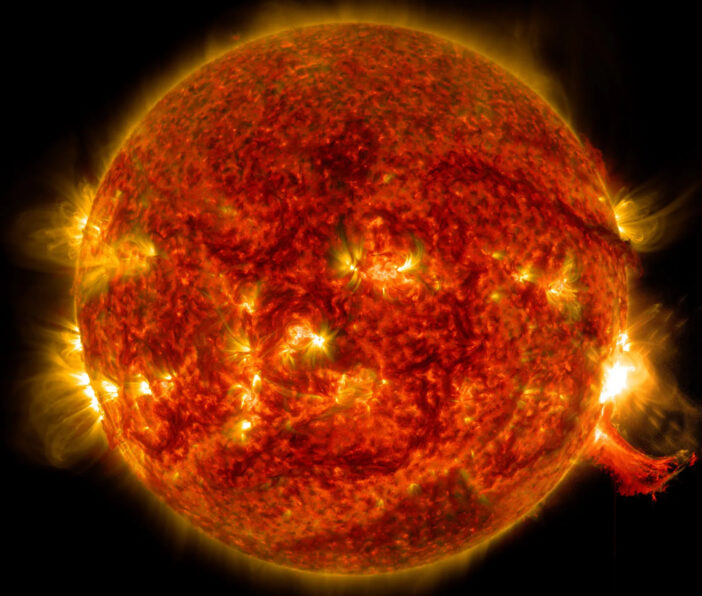
New simulations suggest the outer solar system could disassemble within about one billion years after the Sun becomes a white dwarf.
The post The Solar System Has a New Life Expectancy, and It’s a Billion Times Shorter appeared first on AAS Nova.
]]>Isaac Newton suspected that the gravitational dance between the Sun and Jupiter would eventually destabilize the solar system, but modern computational research has shown that its long-term stability is, statistically, pretty secure. However, new simulations with more realistic solar mass-loss conditions make a strong case for the disassembly of the outer solar system — and on timescales much shorter than previously thought.
Kick It Up a Notch
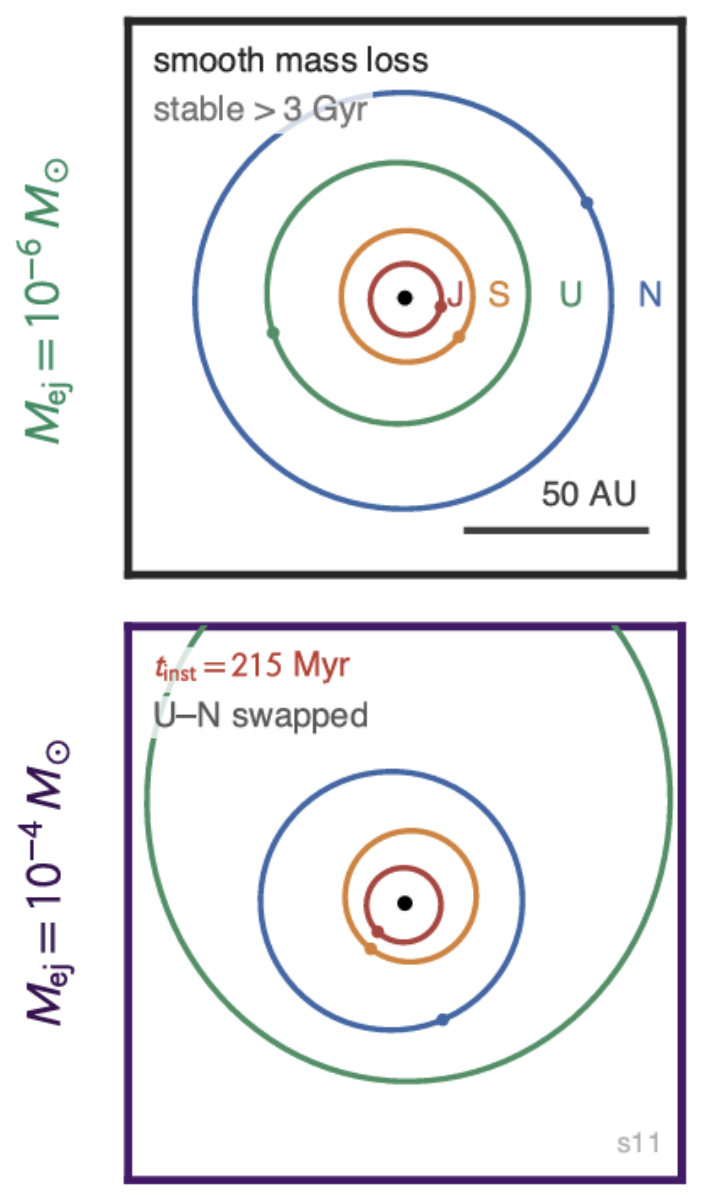
Final outer planet orbital configurations for two simulations — one stable and one unstable. t=0 at the onset of white dwarf formation. Click to enlarge. [Adapted from Batygin et al. 2026]
However, all of these studies modeled solar mass loss as a smooth function, so the dismantling of the solar system was left up to external forcings. In reality, stars on the red giant branch undergo mass ejections that are random in time and direction, corresponding to velocity “kicks” that can alter the dynamics of the planets.
A team led by Konstantin Batygin at the California Institute of Technology conducted numerical experiments to analyze the orbital dynamics of the outer solar system under different solar mass-loss conditions. First, they tested the classic case of smooth mass loss and validated previous findings that, despite planetary orbits doubling in size, the dynamics are pretty tame. This holds true even when mass is ejected anisotropically: if the timing is smooth, the asymmetries cancel out.
Outer Solar System, Your Days Are Numbered
Next, they simulated stochastic kicks and found that the behavior of the outer planets was largely tied to the ejection mass of each kick. For very small ejection masses (≤ 10-7 M☉), dynamics mimic the smooth mass-loss case. For intermediate values (10-7 to 10-6 M☉), there’s a roughly 20% chance Jupiter–Saturn and Uranus–Neptune enter mean-motion resonances: an orbital configuration where planets’ periods are a ratio of small integers. These resonant configurations don’t protect the giant planets, however: resonant simulations disassemble slightly more often than nonresonant simulations. For larger ejection masses (≥ 10-5 M☉), the outer solar system disassembles on the timescale of billions of years.
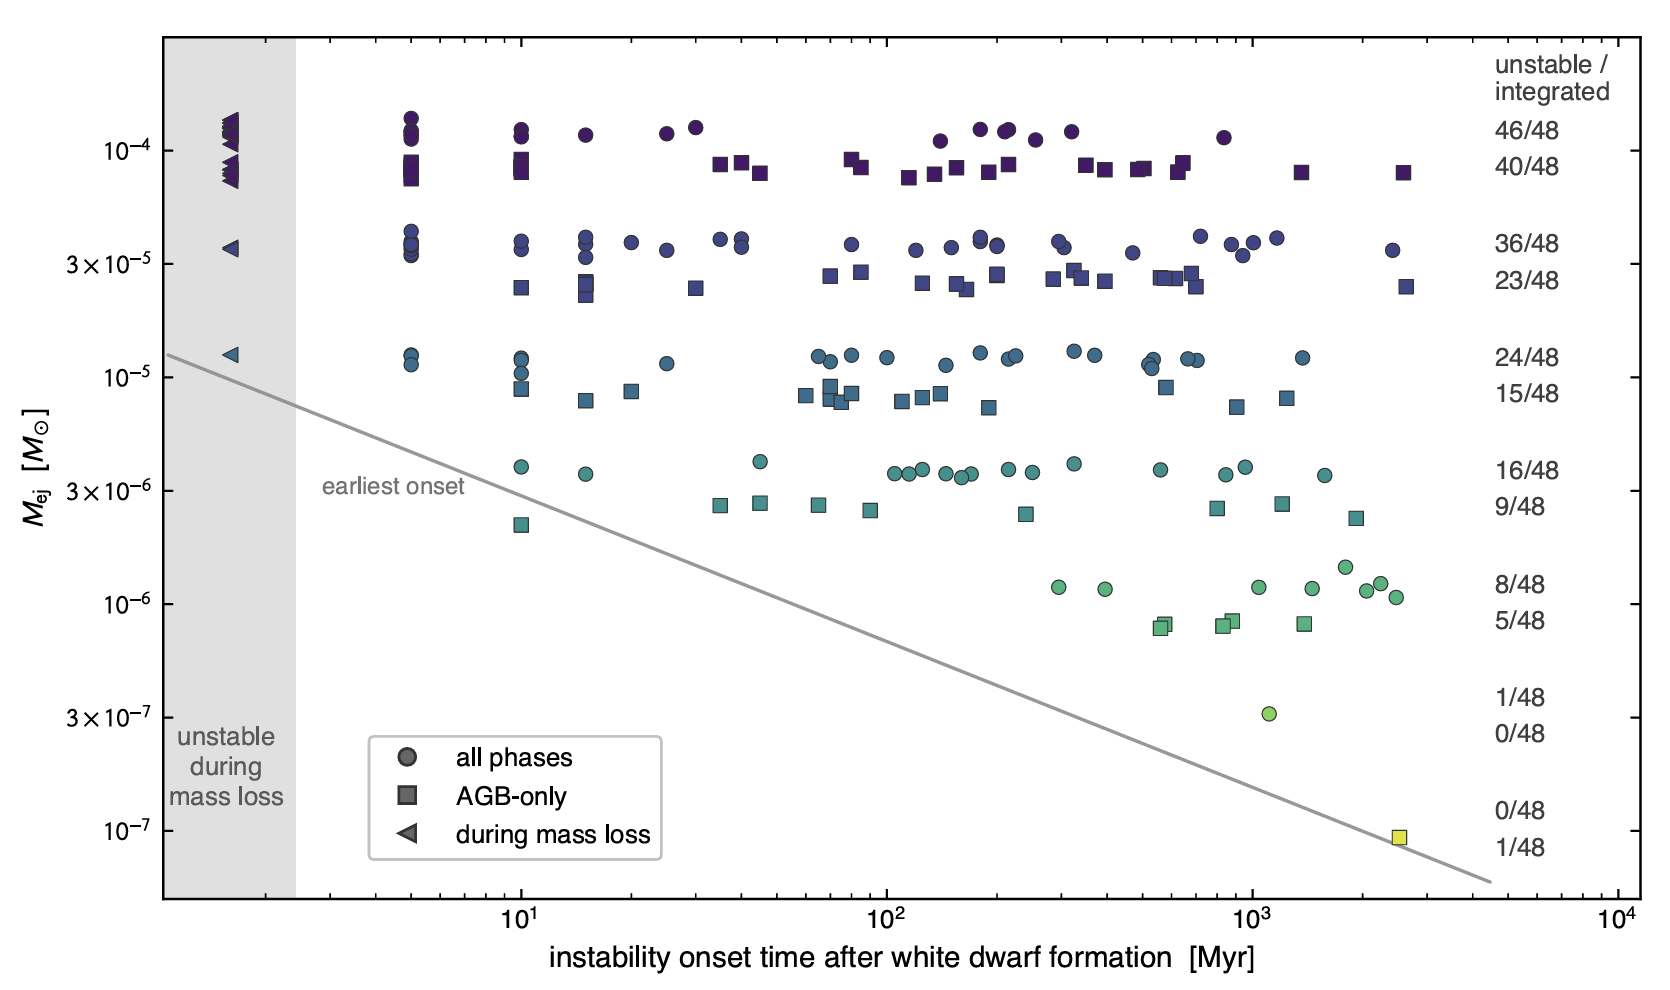
Instability onset time — or how long after white dwarf formation the outer solar system disassembles — as a function of ejection mass. The larger the ejection mass, the greater the chance of instability. Click to enlarge. [Batygin et al. 2026]
This new discovery reduces the life expectancy of the solar system from one billion billion years to a meager one billion years after white dwarf formation.
Citation
“Terminal Instability of the Solar System Triggered by Stochastic Solar Mass Loss,” Konstantin Batygin et al 2026 ApJL 1009 L22. doi:10.3847/2041-8213/aea290
The post The Solar System Has a New Life Expectancy, and It’s a Billion Times Shorter appeared first on AAS Nova.
]]>
Astrobites reports on the discovery of a new ultra-faint dwarf galaxy in preview data taken before the start of Vera C. Rubin Observatory's 10-year survey.
The post An Early Discovery by Rubin Observatory appeared first on AAS Nova.
]]>Editor’s Note: Astrobites is a graduate-student-run organization that digests astrophysical literature for undergraduate students. As part of the partnership between the AAS and astrobites, we occasionally repost astrobites content here at AAS Nova. We hope you enjoy this post from astrobites; the original can be viewed at astrobites.org.
Title: Discovery of the Distant, Ultra-Faint Milky Way Satellite Aquarius IV with the Vera C. Rubin Observatory Early Data Preview 2
Authors: William Cerny et al.
First Author’s Institution: Yale University
Status: Published in RNAAS
Warming Up the World’s Largest Camera
Today’s bite covers one of the NSF–DOE Vera C. Rubin Observatory‘s first major discoveries, which was found in testing data before the observatory began its decade of observations. Perched atop a mountain in Chile, the brand-new Rubin Observatory is just beginning a 10-year survey called the Legacy Survey of Space and Time (LSST). LSST will be the deepest and widest sky survey ever conducted, taking images of the entire southern night sky every three nights. This ultra-wide, ultra-high-definition time-lapse of the universe will help answer fundamental questions about dark matter and dark energy, study objects in our solar system, find distant supernova explosions, and more.
LSST is a photometric survey, meaning its main data product is images in several filters. These images are taken with the largest digital camera ever constructed, about the size of a Mini Cooper. The LSST camera has a resolution of 3.2 gigapixels. To put that number into perspective, you would need about 13 copies of the Las Vegas Sphere to display just a single LSST image… and hundreds of these images will be taken every night!
The authors of today’s article use the first dataset from the LSST camera, called Early Data Preview 2 (EDP2). EDP2 was taken from April 2025 to January 2026, covered about 3,000 square degrees (about 7% of the entire night sky), and primarily served as a test before beginning the 10-year LSST (which began in June 2026).
Small Galaxies, Big Questions
Since LSST will survey a large area at unprecedented depths, one field of interest is to study extremely dim and small galaxies called ultra-faint dwarf galaxies (UFDs). These galaxies are so faint that we can only find them close to home, orbiting the Milky Way and other nearby galaxies as satellites. UFDs don’t have much luminous matter, meaning they are likely dominated by their dark matter halos. This makes them useful test beds for our theories of dark matter and galaxy formation, if we can spot them.
Many UFDs don’t look like normal galaxies that resemble blobs of diffuse light with stars; instead, they’re more like a handful of individual stars in an image that also contains foreground stars and background galaxies. So how do you identify them? The trick is that stars born together at the same time from the same gas follow a predictable track in color and brightness called an isochrone. The authors slide a model isochrone for an ancient, metal-poor population through the data at a range of assumed distances and ask: at any spot in EDP2, are there more stars sitting on that track than random chance would predict? Cerny and coauthors found a new spot, which they call Aquarius IV, a new UFD candidate (Figure 1).
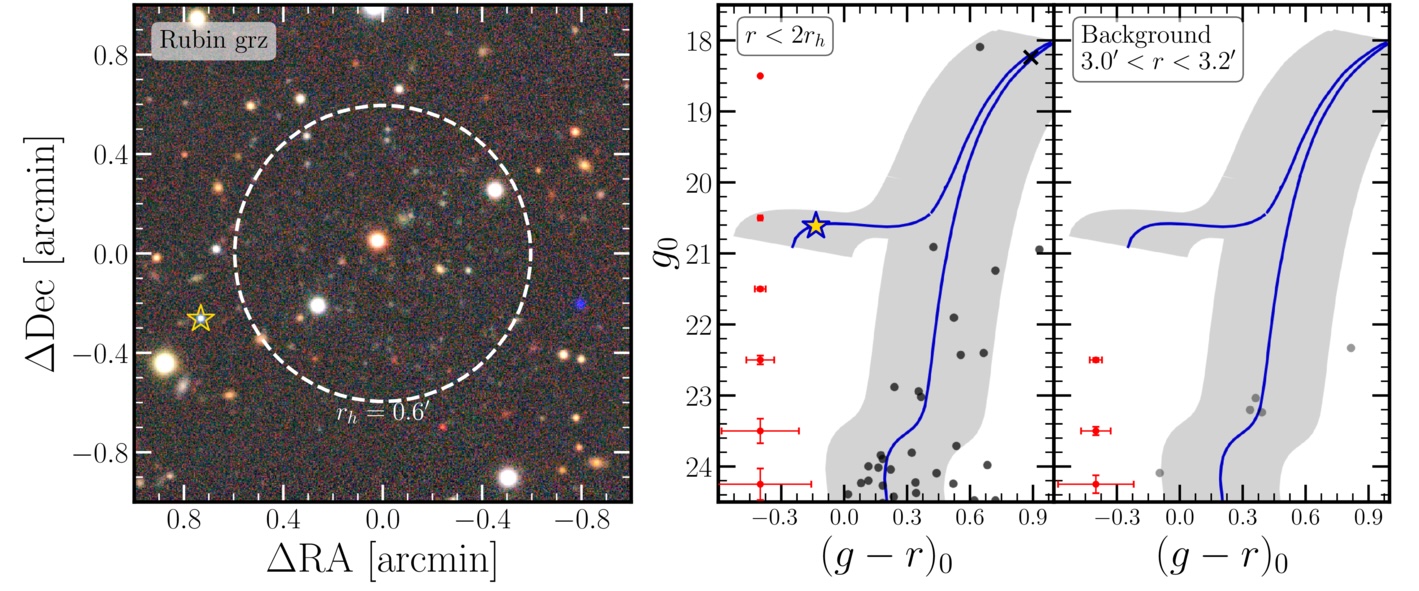
Figure 1: Left: A Rubin image centered on Aquarius IV, combining images in the g, r, and z filters. The dashed circle marks the half-light radius, the region enclosing half the galaxy’s light. Aquarius IV is only a scattering of individual faint stars. The yellow star marks a likely blue horizontal-branch member. Right: A plot of brightness against color for the stars inside twice the half-light radius (first panel) and inside a ring of sky just outside the galaxy (second panel). Stars born at the same time from the same gas fall along the isochrone (blue line; any stars in the grey regions are deemed to follow the isochrone). All the stars follow the isochrone in the first panel but not the second, indicating that the stars are associated. [Adapted from Cerny et al. 2026]
The authors also infer several properties of Aquarius IV, including its centroid coordinates, half-light radius, ellipticity, distance, and absolute magnitude. They find that its radius is larger than almost all Milky Way globular clusters (tight gravitationally bound systems of old stars that don’t reside in their own dark matter halos), suggesting that Aquarius IV is a true dwarf galaxy.
Currently, there are about 40 known UFDs around the Milky Way, and LSST is expected to roughly double this number (see this Astrobite), allowing us to study these tiny galaxies at a population level. This article proves that LSST has the potential to revolutionize many areas of astrophysics! If you are a researcher in the US or Chile and want to play with the EDP2 data yourself, you can access it via the Rubin Science Platform. For researchers from other countries, see more info here.
Original astrobite edited by Katya Gozman.
About the author, Ben Sherwin:
I am a physics PhD student and NSF Graduate Research Fellow at Stanford University. I am interested in theoretical and observational cosmology, specifically in cross-correlations between the cosmic microwave background and tracers of large-scale structure. Outside of work, I enjoy seeing the latest movies in theaters and exploring the San Francisco Bay Area.
The post An Early Discovery by Rubin Observatory appeared first on AAS Nova.
]]>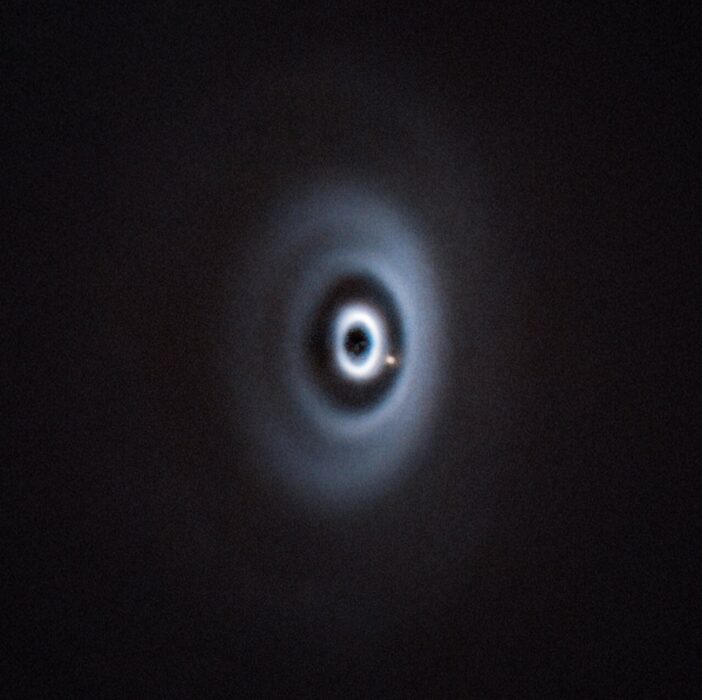
New radio observations provide the best view yet of the WISPIT 2 planetary system, revealing spiral wakes driven by a growing young planet.
The post Researchers See Gas Swirling Around a Growing Baby Planet appeared first on AAS Nova.
]]>Astronomers seem to find something new every time they point a telescope at WISPIT 2, a 5-million-year-old solar-mass star located 430 light-years away. New high-resolution radio observations provide the best view yet of how the young planets of this system interact with the disk that feeds them.
Detecting Distant Planets
In 2025, astronomers carrying out the WIde Separation Planets In Time (WISPIT) survey — a targeted search for widely separated giant planets around young Sun-like stars — revealed a dusty disk surrounding the star WISPIT 2. Orbiting within this disk is a 4.9-Jupiter-mass planet, WISPIT 2b, at 57 au from the star. This makes WISPIT 2 just the second star to host a confirmed, directly imaged planet within its protoplanetary disk. Even more remarkable, WISPIT 2b was detected in Hα, showing that the planet is still growing by accreting gas from the disk.
Later observations confirmed the presence of a second planet, WISPIT 2c, which has an estimated mass of 8–12 Jupiter masses and orbits the star at 15 au. On top of these planetary discoveries, researchers have also found that WISPIT 2 is two stars rather than one!
Best View Yet of the WISPIT 2 System
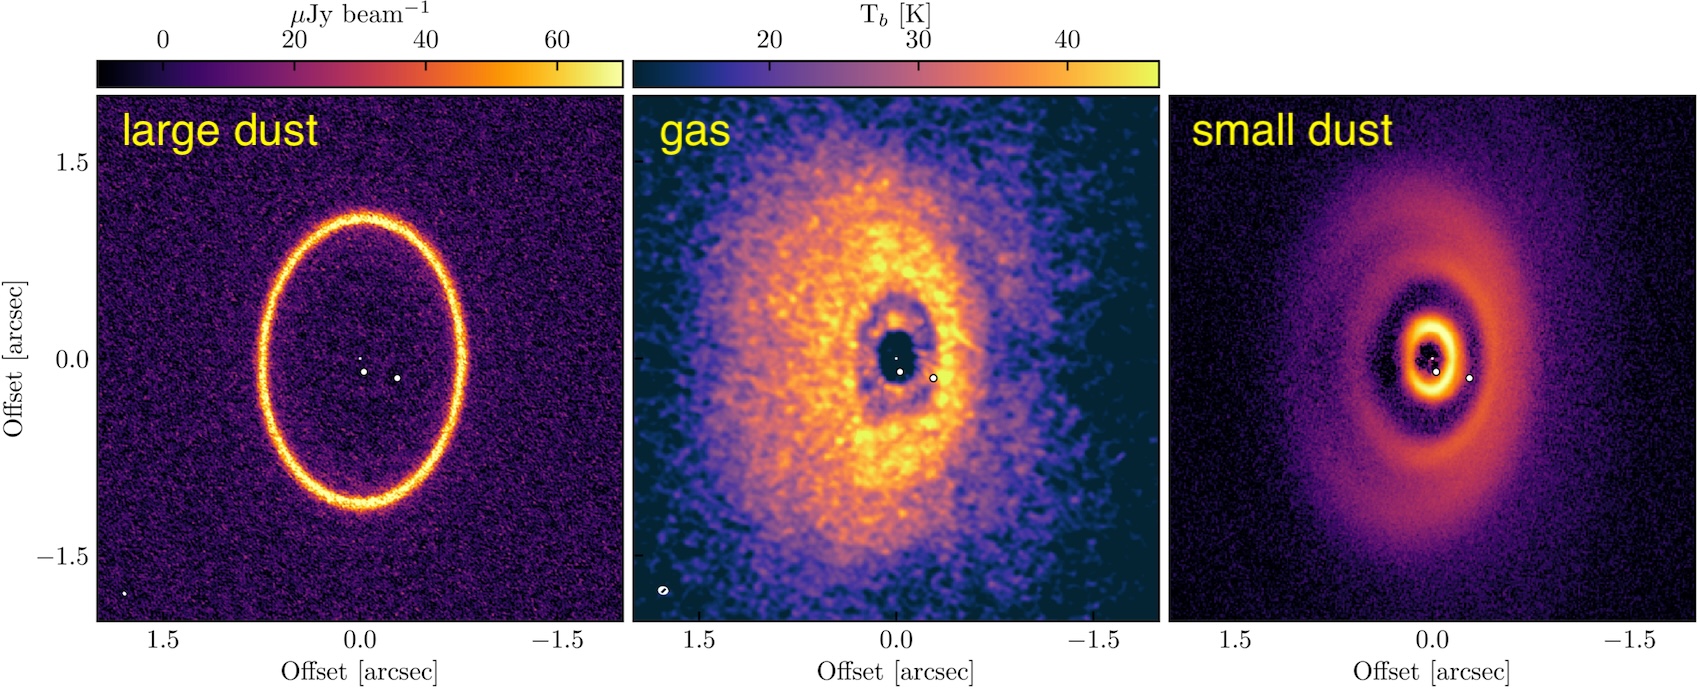
New observations of WISPIT 2 from ALMA (left and center panels) and previous observations from the Very Large Telescope (right panel). The star is shown by the small dot at the very center, and the planets are indicated by the two white circles. Click to enlarge. [Adapted from Benisty et al. 2026]
The distribution of gas within the disk, traced by emission from carbon monoxide, roughly follows the pattern seen in previous observations of small dust grains: the orbits of WISPIT 2b and 2c are depleted of gas and dust, demonstrating how the young planets have carved their own berths within the disk, creating a gap at WISPIT 2b’s orbit and a cavity around the star.
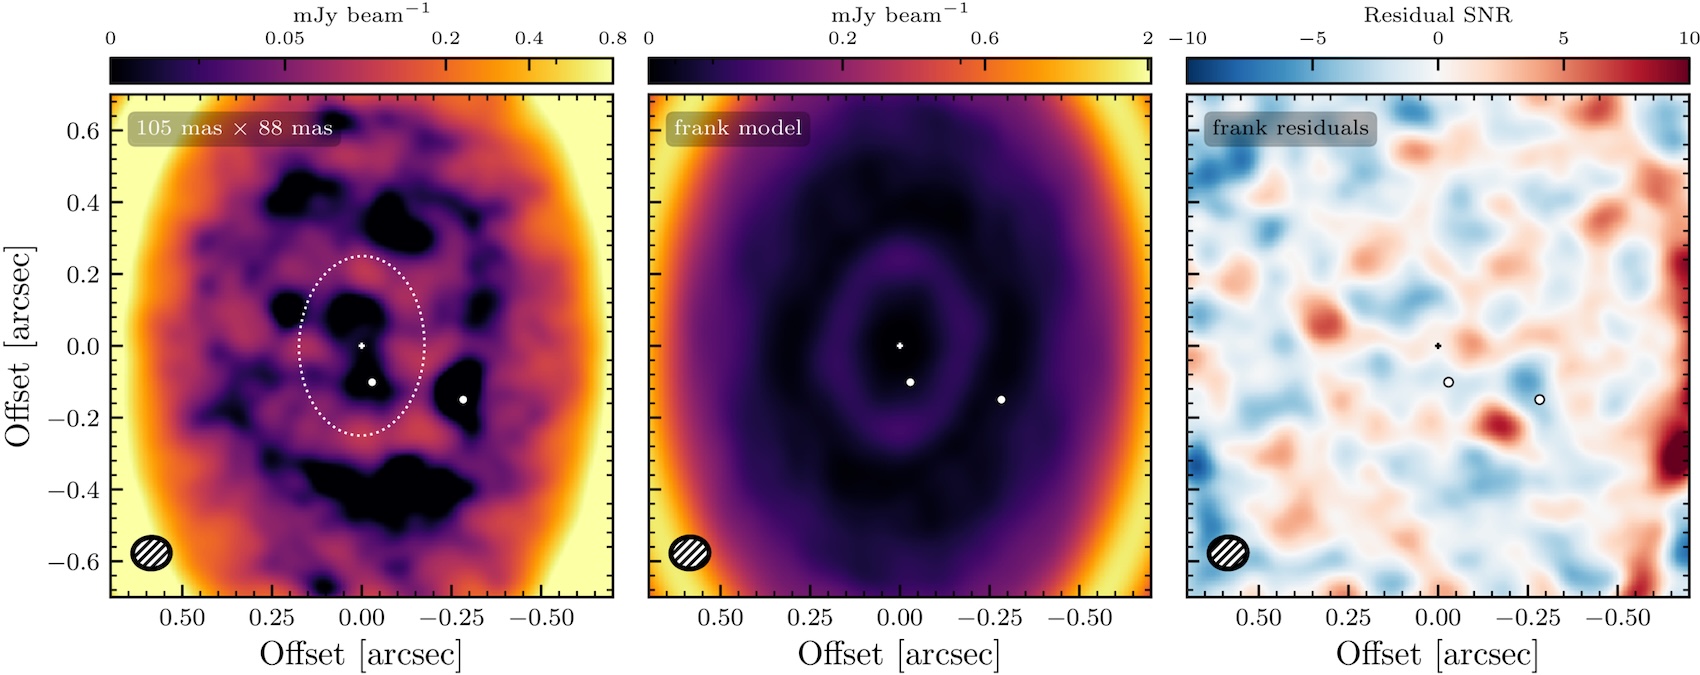
The left panel shows the dust continuum emission zoomed in on the star (plus sign) and planets (circles). The dotted line shows the location of a faint ring, which is modeled in the center panel. The right panel shows the residuals. Click to enlarge. [Benisty et al. 2026]
Spiral Wakes Making a Splash
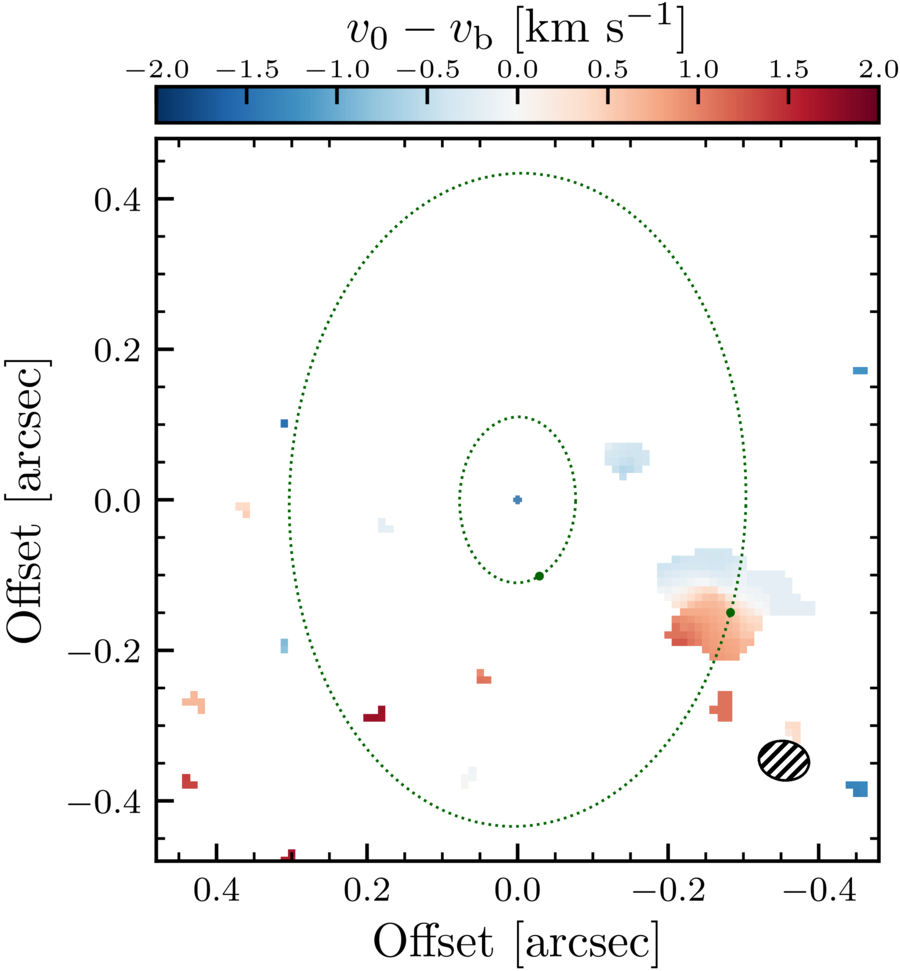
Velocity field showing the gas swirling around WISPIT 2b, which is indicated by the green circle farther from the star. [Benisty et al. 2026]
Spiral wakes have been spotted in other protoplanetary disks, but this is the first time researchers have been able to definitively associate this feature with a planet rather than other causes, such as gravitational instabilities. Looking ahead, future high-resolution spectroscopic observations of WISPIT 2b and its surroundings will offer researchers an unprecedented opportunity to compare the properties of the planet and its spiral wake against the predictions of simulations — advancing toward a powerful new way to study exoplanets embedded in protoplanetary disks.
Citation
“Mapping the WISPIT 2 Planet-Hosting Cavity at Sub-Hill-Radius Scales,” Myriam Benisty et al 2026 ApJL 1009 L32. doi:10.3847/2041-8213/aea214
The post Researchers See Gas Swirling Around a Growing Baby Planet appeared first on AAS Nova.
]]>
Researchers use stellar pulsations to detect substellar companions around A-type stars — including what could be a first-of-its-kind exoplanet.
The post Stellar Pulsations Suggest Habitable-Zone Planet Around a Massive Star appeared first on AAS Nova.
]]>By observing subtle variations in the timing of stellar pulsation modes, researchers may have made the first detection of a planet in the habitable zone of a massive A-type star.
Listening for Planets in Stellar Heartbeats
To date, some 6,000 exoplanets have been detected across a vast array of surveys and instruments. The majority of these have been detected around main-sequence F, G, and K stars — but not because these are the only places exoplanets can exist. Rather, this is a result of selection bias: these stars tend to be both bright and luminously stable enough for astronomers to deploy the radial velocity or transit methods.
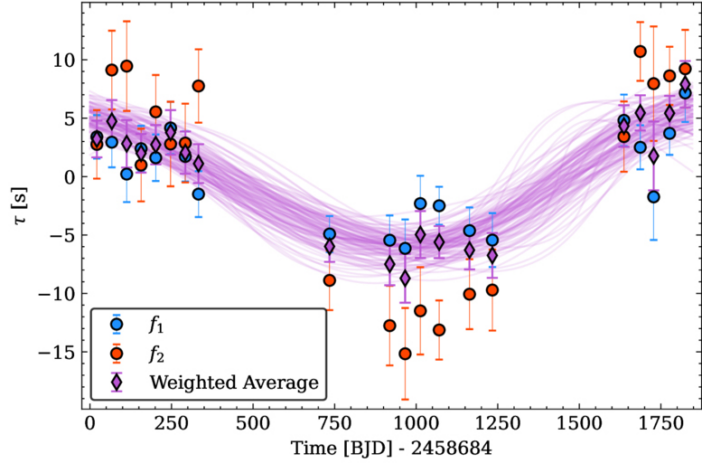
Periodic modulations in the time of observed stellar pulsations can indicate the presence of an orbiting companion. In this case, timing variations are displayed for the two most prominent pulsation modes f1 and f2 for the variable star HD 156295. The sinusoidal pattern indicates they may be caused by an orbiting companion with a mass of about 6.3 Jupiter masses at a distance of 3.9 au, in this star’s habitable zone. [Adapted from Wilson et al. 2026]
Luckily, one transit astronomer’s trash data can be a pulsation timer’s treasure. For some A-type stars called δ Scuti stars, the pulsation is regular enough to be used like a cosmic clock. Subtle variations in a star’s position due to the tug of an orbiting companion can then disrupt the timing of its otherwise steady pulsation, allowing one to once again find planets via its light curve — including massive ones on intermediate-period orbits that are the most difficult to detect around massive stars using traditional methods.
A Massive Planet in the Habitable Zone of a Hot Star?
In a new study led by Logan Wilson (Center for Astrophysics | Harvard & Smithsonian), researchers analyzed 16,440 highly pulsating δ Scuti stars observed at a high cadence by the Transiting Exoplanet Survey Satellite (TESS) in order to look for the distinctive, periodic timing modulations associated with an orbiting companion. This sample was then whittled down to nine candidate systems they believe may contain substellar companions — likely either brown dwarfs or massive planets.
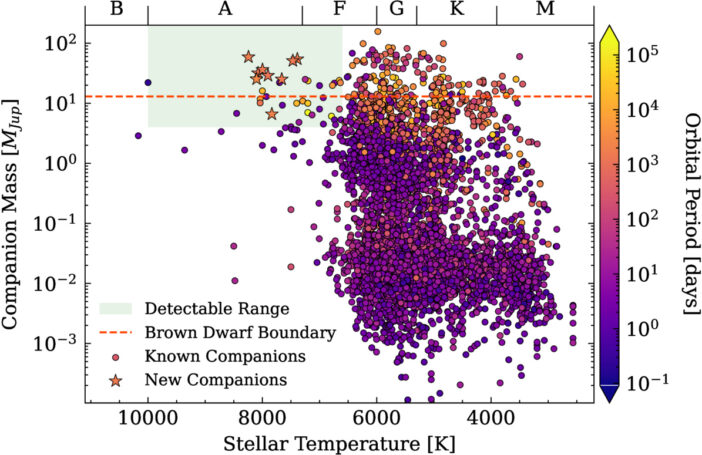
The properties of the nine candidate objects identified in this study and their host stars are shown here, along with the properties of other exoplanet systems. Through stellar pulsation timing, the researchers were able to identify substellar candidates around hot A-type stars in intermediate-period orbits, a region of parameter space that has been difficult to probe with other methods. [Wilson et al. 2026]
The other eight candidates are more consistent with brown dwarfs. Six of these candidates show somewhat uncommon masses and orbital separations that place them in a region of parameter space known as the “brown dwarf desert.” Some observations suggest this desert is less severe around hotter stars — a conclusion that this study supports.
All of these findings are still quite tentative, however; the researchers estimate that the probability for the planetary signal being real is just over 50%, and the parameters given for each candidate are still subject to large uncertainties. With new data arriving all the time, it may not take long before we have a clearer picture of these unique substellar companions.
Citation
“A Search for Substellar Companions around A-type Stars: Pulsation Timing Detection of Eight Brown Dwarf Candidates and a Possible Habitable-zone Planet,” Logan G. Wilson et al 2026 ApJ 1009 78. doi:10.3847/1538-4357/ae93a0
The post Stellar Pulsations Suggest Habitable-Zone Planet Around a Massive Star appeared first on AAS Nova.
]]>
Handwritten eclipse observations and sketches of solar prominences from 1733 offer researchers a rare window into a data-poor period of solar history.
The post A New Look at a Centuries-Old Solar Eclipse appeared first on AAS Nova.
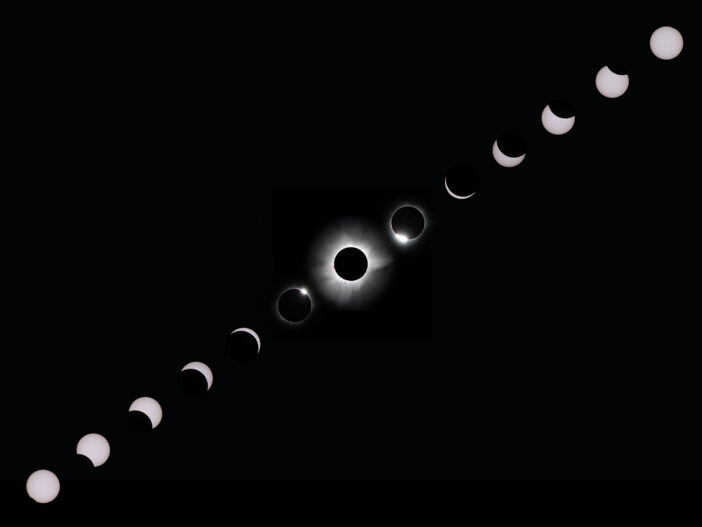
]]>Humans have recorded solar eclipses for thousands of years. Recently, researchers translated and analyzed solar eclipse observations from 18th-century Sweden to determine the Sun’s radius at that time and study the first confirmed record of solar prominences.
Looking Back Nearly 300 Years
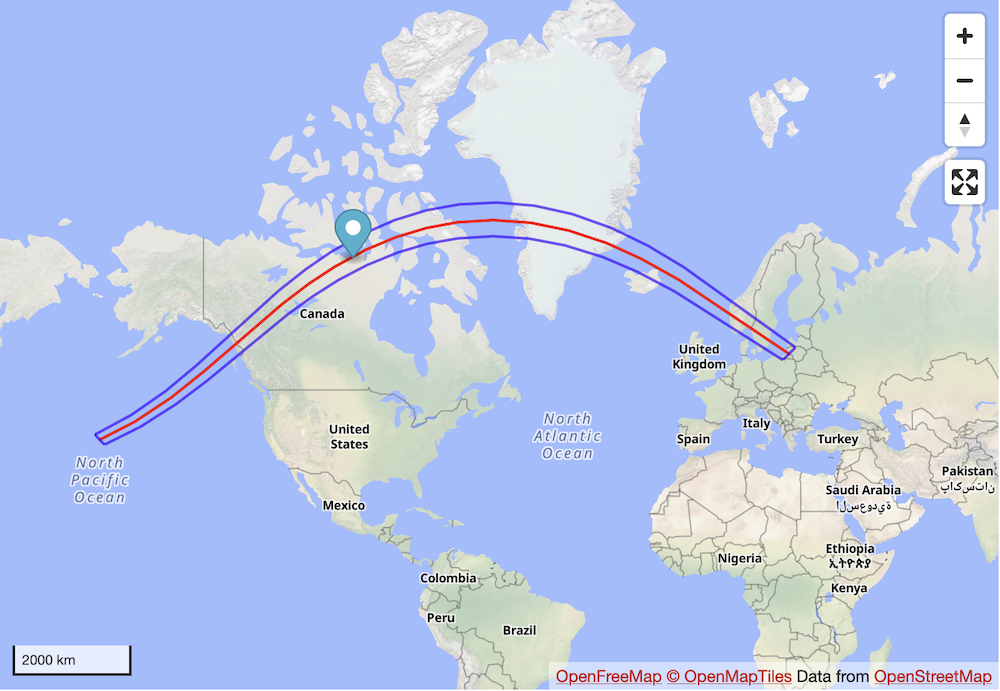
The path of the 13 May 1733 total solar eclipse. Click to enlarge. [Eclipse Predictions by Fred Espenak (NASA’s GSFC)]
Wassenius penned a short account of his observations in Latin for Philosophical Transactions of the Royal Society (the longest-running scientific journal in the world!). His drawings of the event, which include the first robust record of solar prominences, were never officially published, but were housed in the Royal Academy Archives of Sweden. Now, researchers have translated Wassenius’s full report from Swedish to English and analyzed his sketches, helping to fill an important gap in the historical record of solar activity.
Drawing from Observations
Hisashi Hayakawa (Nagoya University; Rutherford Appleton Laboratory) and collaborators translated Wassenius’s notes, which describe how he viewed the eclipsed Sun through a 21-foot-long telescope during just over two minutes of totality. From Wassenius’s measurements, Hayakawa and coauthors calculated the solar radius to be 696,250 ± 170 km; this is larger than the modern accepted radius, but it’s in line with what has been calculated from solar eclipse measurements two decades earlier, in 1715.
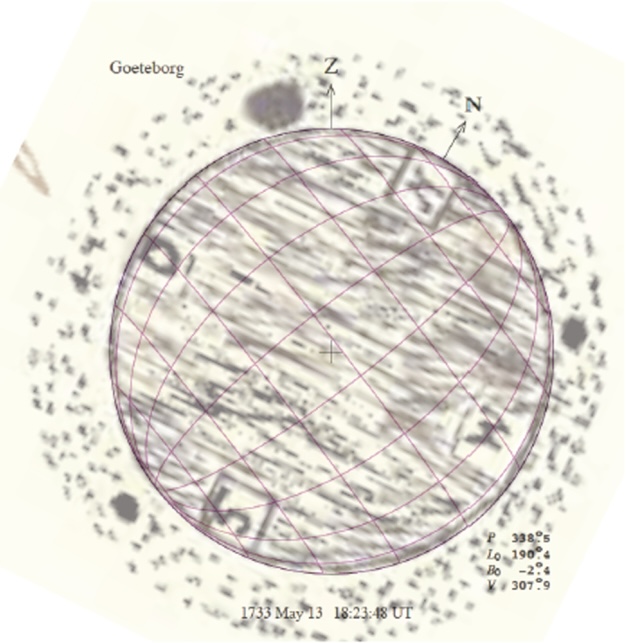
Wassenius’s sketch of the solar eclipse, showing three prominences as filled circles emerging from behind the disk of the Moon. [Adapted from Hayakawa et al. 2026]
Prominent Features
High-latitude prominences like the one (or more) seen by Wassenius are most common during what’s known as the “polar rush,” which occurs as solar activity rises toward a maximum. If these prominences are related to the polar rush, that would mean that in 1733, the Sun was not in an activity minimum as previously thought. However, it’s also possible for prominences to pop up at high latitudes during other times in the solar cycle; the authors estimated the likelihood of this happening at 20%.
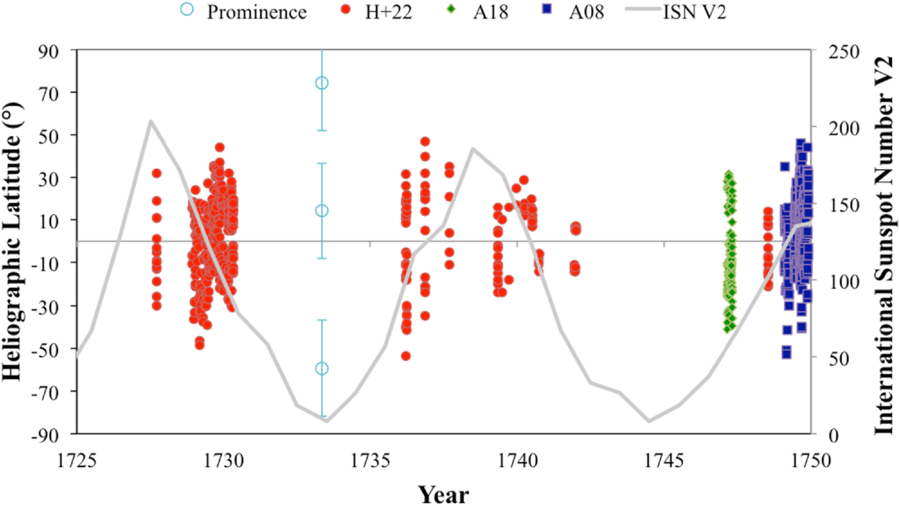
Heliographic latitude of solar prominences estimated from Wassenius’s drawings (light blue circles), compared to the positions (filled symbols) and number (gray line) of sunspots. Note that sunspot data around this time were scarce, and some researchers have suggested that revisions to the sunspot number are needed. Click to enlarge. [Hayakawa et al. 2026]
Citation
“Analyses on Wassenius’s Report for Total Solar Eclipse in 1733: Quantifications of the Solar Radius and the Earliest Reported Prominences,” Hisashi Hayakawa et al 2026 ApJ 1007 189. doi:10.3847/1538-4357/ae6451
The post A New Look at a Centuries-Old Solar Eclipse appeared first on AAS Nova.
]]>
Astrobites reports on a hunt for evidence of a universal initial mass function using JWST observations of local relic galaxy Boötes I.
The post A Sneak Peek into Early-Universe Star Formation with Boötes I appeared first on AAS Nova.
]]>Editor’s Note: Astrobites is a graduate-student-run organization that digests astrophysical literature for undergraduate students. As part of the partnership between the AAS and astrobites, we occasionally repost astrobites content here at AAS Nova. We hope you enjoy this post from astrobites; the original can be viewed at astrobites.org.
Title: Probing the IMF in the Early Universe — Direct Measurements in the Boötes I UFD with JWST/NIRCam
Authors: Keyi Ding et al.
First Author’s Institution: University of Maryland
Status: Published in ApJ
The Stellar Initial Mass Function
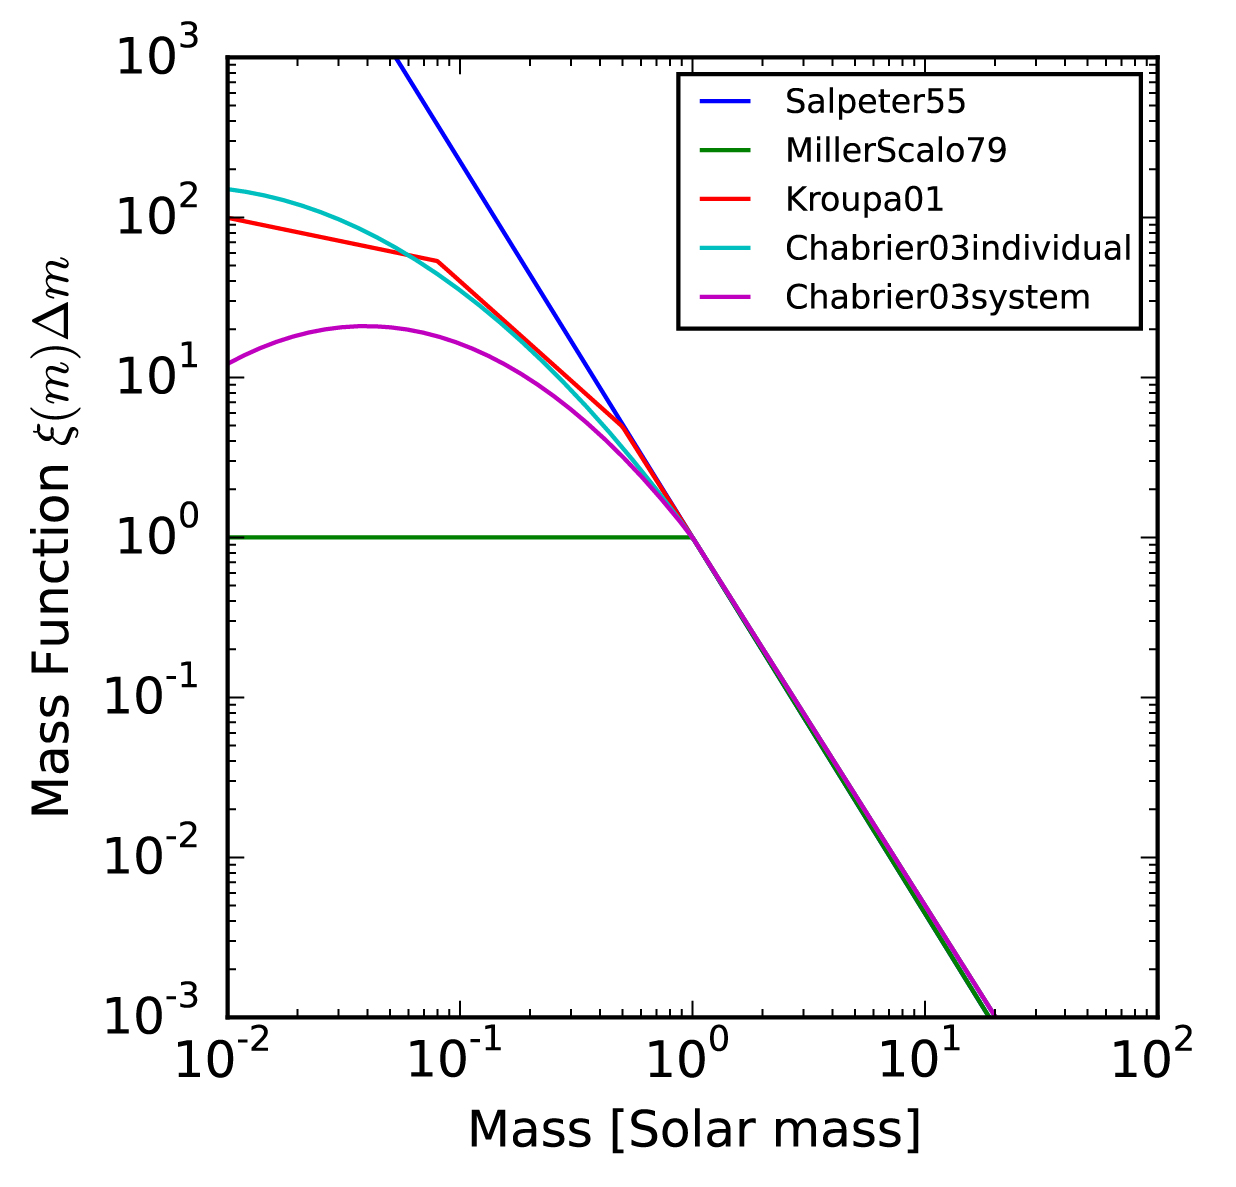
Figure 1: Several different formulations for the IMF. Astronomers have found that the Milky Way IMF seems to follow either a broken power law (Kroupa), or a log-normal (Chabrier) distribution. [JohannesBuchner; CC BY-SA 4.0]
For a relatively simple concept, the IMF is shaped by incredibly complicated underlying physical mechanisms. Things like turbulence, magnetic fields, and chemical enrichment all play a role in shaping the observed IMF. Additionally, the IMF is a pretty fundamental quantity. An enormous amount of astronomy research relies on assumptions made about the IMF. For example, since most stars are low in mass, and low-mass stars are dimmer, astronomers use the IMF to convert the amount of light in a galaxy to the number of stars; if there are more or fewer low-mass stars than we expect, our measurements will be wrong.
A big question surrounding the IMF is whether or not it’s universal. In the Milky Way, astronomers have been able to measure the IMF accurately, and they have found that it seems to be the same regardless of which bunch of stars we use to measure it.1 However, we know that galaxies in the early universe were very different compared to today. Things get tricky when you acknowledge that most measurements made of early-universe galaxies rely on modeling tools that are entirely reliant on assuming an IMF. This gnarly little detail makes measuring the IMF in the early universe especially valuable to astronomers.
What Makes Ultra-Faint Dwarfs So Special?
Today’s authors attempt to measure the early-universe IMF using a local relic, an ultra-faint dwarf galaxy (UFD). You might describe UFDs as “incredibly funky little galaxies.” They’re much less massive than the Milky Way, with about 10,000 times less stellar mass. What stars they do have tend to be very old and metal poor. The nature of UFDs has led many astronomers to think of them as fossils: relatively untouched galaxies formed in the early universe. Since we think UFDs are fossils of earlier galaxies, measuring the IMF in a UFD tells us whether the IMF was the same in the early universe as it is today. The authors focus on Boötes I, a relatively luminous UFD orbiting the Milky Way. Figure 2 shows Boötes I as seen by the Sloan Digital Sky Survey.
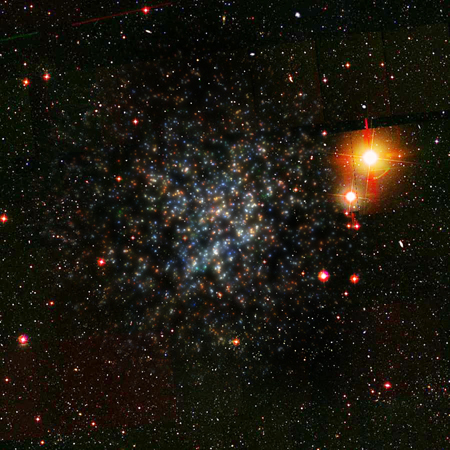
Figure 2: Boötes I as seen by the Sloan Digital Sky Survey. Because they’re so diffuse, UFDs look less like galaxies and more like groups of stars. [Vasily Belokurov – SDSS-II Collaboration]
The IMF in Boötes I
Measuring the IMF can get tricky — it’s typically pretty difficult to measure the mass of each individual star in a galaxy. Thankfully, Boötes I is close enough that we can do exactly that! Using JWST’s NIRCam instrument, today’s authors obtain imaging of Boötes I that is sensitive enough to extract roughly 10,000 stars belonging to the galaxy.
To measure the IMF from the observed population of stars, the authors use a modified version of Starwave, a Bayesian inference tool. In short, the tool takes in some assumptions about the population of stars in the galaxy, then generates many potential color–magnitude diagrams for various parameter selections. You can then assess how well each simulated color–magnitude diagram fits the observed data, thus determining likely parameters for the stellar population. The authors apply their tool for three different IMF models, testing how close the IMF in Boötes I is to that of the Milky Way. This allows them to determine how well the IMF compares to that of the Milky Way, which is typically thought of as a broken power law or log-normal distribution. If the IMF in Boötes I aligns with the Milky Way’s IMF, we’ll have a solid piece of evidence for a truly invariant IMF across cosmic time, allowing astronomers to rest easy knowing our modeling efforts haven’t been bunk this whole time.
So… What Did We Learn?
The authors find that a single power law can be ruled out to a good degree of confidence. This is good, as Milky Way studies show undeniable evidence of a turnover in the distribution. The broken power law and log-normal models both fit the observed data relatively well, aligning well with Milky Way–derived IMFs. All in all, they find solid evidence for an invariant IMF in the early universe.
However, they are unable to say with absolute certainty that the IMF is invariant. Given that their data are nearly perfect (that is, it’s pretty much impossible to get better data for Boötes I), the authors emphasize that a larger sample of UFD IMFs is needed to truly rule out an invariant IMF, but we’re certainly taking steps in the right direction! As the age-old saying goes, “more data are needed!”
Original astrobite edited by Maggie Verrico.
- Editor’s Note: The Milky Way IMF may vary from star cluster to star cluster; as described in this AAS Nova highlight from 8 July 2026, recent research using data from the Gaia spacecraft has found evidence for IMF variation in our galaxy.
 ︎
About the author, Drew Lapeer:
Drew is a first-year PhD student at the University of Massachusetts Amherst. They are broadly interested in the evolution of galaxies, with a focus on the impact of cosmic feedback on the galactic ecosystem. In their free time, they enjoy reading, rock climbing, hiking, and baking!
The post A Sneak Peek into Early-Universe Star Formation with Boötes I appeared first on AAS Nova.
]]>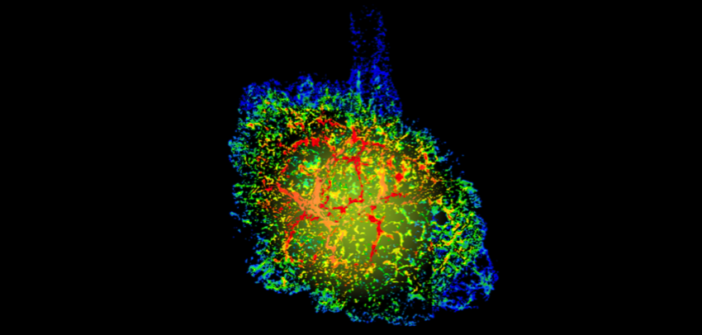
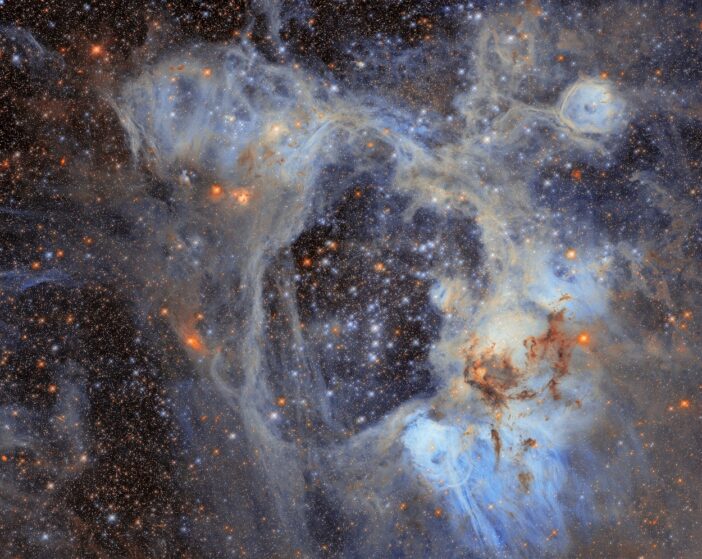
See the famous Crab Nebula in a whole new way: researchers have mapped the 3D kinematic structure of the nebula and investigated a jet-like feature emerging from the expanding shell.
The post Featured Image: Evolution of a Cosmic Crab appeared first on AAS Nova.
]]>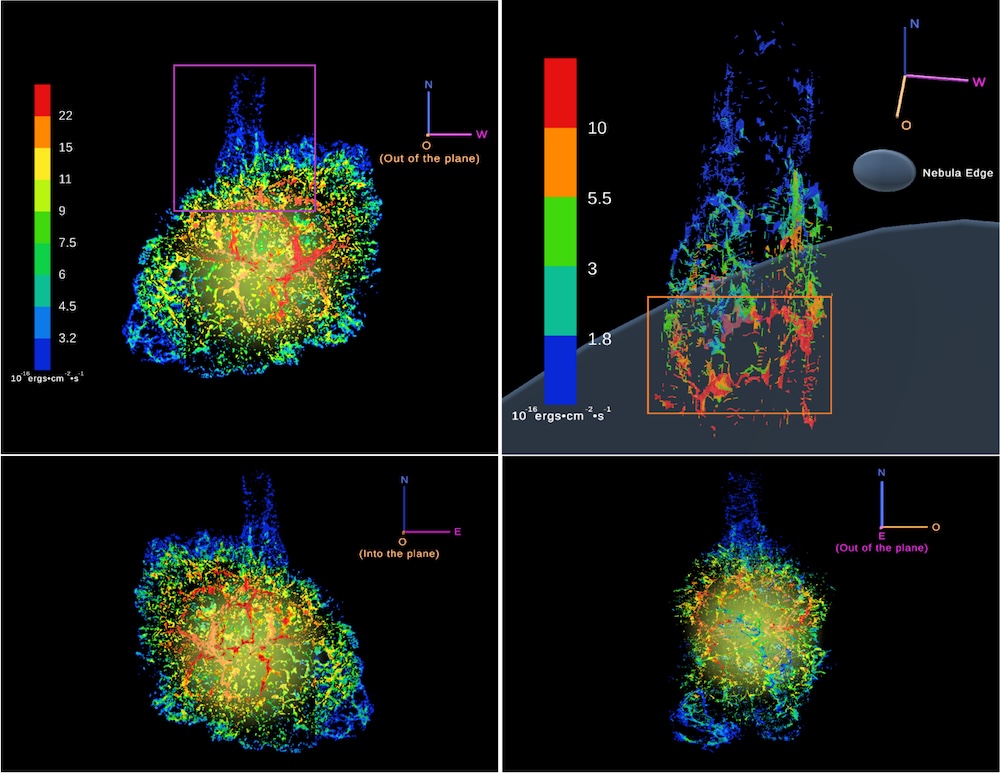
Three-dimensional reconstructions of the Crab Nebula using oxygen emission lines. An animation of the 3D reconstruction is also available. [Ding et al. 2026]
Citation
“3D Kinematic Reconstruction of the Crab Nebula That Includes the Northern Ejecta ‘Jet,'” Z. Ding et al 2026 ApJ 1007 130. doi:10.3847/1538-4357/ae84c0
The post Featured Image: Evolution of a Cosmic Crab appeared first on AAS Nova.
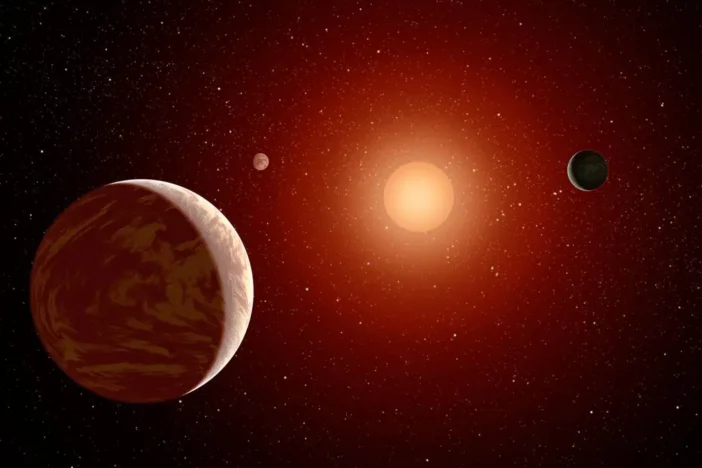
]]>
A recent study has found that the observed mass–eccentricity relation of warm Jupiters can be explained by dynamical interactions between planets in these systems.
The post Planets Scattering Planets in Warm Jupiter Systems appeared first on AAS Nova.
]]>While our solar system sports one Jupiter-like planet, exoplanet discoveries have revealed that giant planets come in a few different forms in systems with varying architectures. A recent study has explored how the mass–eccentricity relationship in warm Jupiters is shaped by dynamical interactions between planets.
Jupiter-like Planet Eccentricities
Exoplanet surveys have uncovered three different Jupiter-like planet populations across the galaxy: hot, warm, and cold Jupiters. Much like our own, cold Jupiters orbit on long periods, far away from their host stars. Conversely, hot Jupiters zip around their host stars on extremely short-period orbits. Somewhere in between, warm Jupiters orbit their host stars with periods from 10 to 365 days.
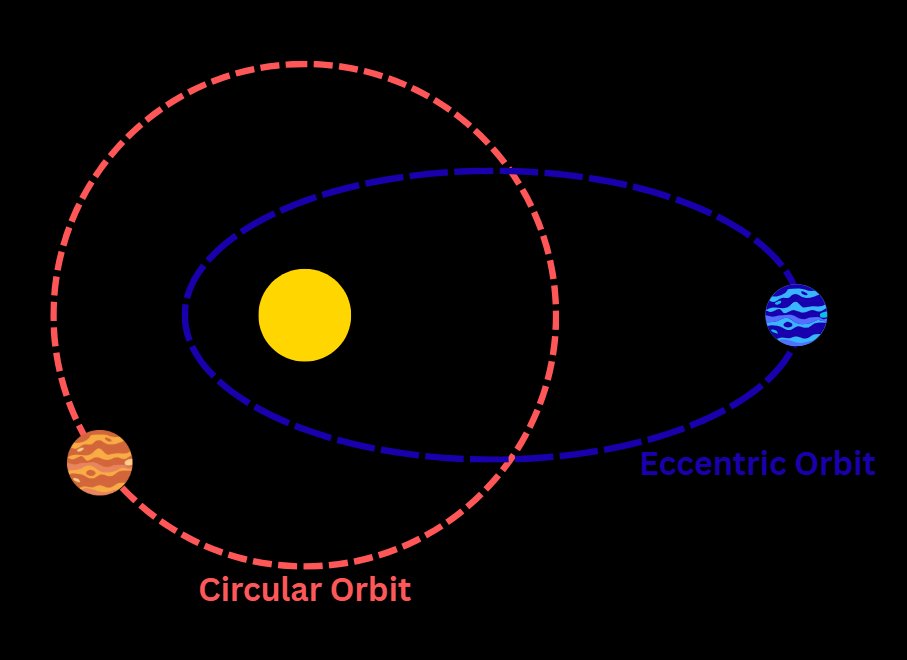
Diagram showing examples of a circular and an eccentric orbit. Click to enlarge. [AAS Nova/Lexi Gault]
Does this relationship extend to shorter-period giant planets as well? Hot Jupiters are heavily impacted by tidal interactions with their host stars, circularizing their orbits and erasing dynamical imprints on their eccentricities. Warm Jupiters, on the other hand, orbit far enough away for their eccentricities to preserve clues about their energetic histories. Recently, thanks to the Transiting Exoplanet Survey Satellite (TESS), astronomers have identified a positive correlation between planetary mass and eccentricity in a growing sample of warm Jupiters, but the exact driver of this trend has yet to be uncovered.
Planets Scattering Planets
To test if the positive mass–eccentricity correlation in warm Jupiters is consistent with planet–planet scattering, Jiayin Dong (University of Illinois at Urbana-Champaign) constructed a sample of 85 warm Jupiters from the NASA Exoplanet Archive. This carefully selected sample, dominated by discoveries from TESS and Kepler, included planets with masses between 0.3 and 15 Jupiter masses and orbital periods between 10 and 365 days. In conjunction with this sample, the authors built a planet–planet scattering framework to assess the range of properties anticipated for scattered warm Jupiter systems.
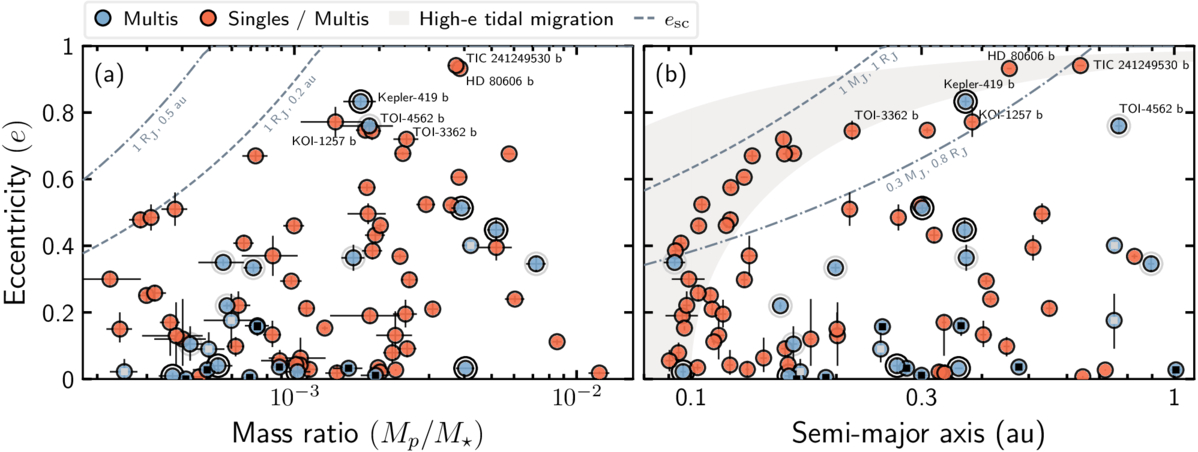
Warm Jupiter eccentricity versus planet–star mass ratio (left) and semimajor axis (right). Click to enlarge. [Dong et al 2026]
The mass–eccentricity relation of warm Jupiters, the authors suggested, represents a transition from collision-dominated interactions among low-mass planets to ejection-dominated interactions among high-mass planets. For massive enough systems, scattering can excite eccentricities high enough to trigger the high-eccentricity migration responsible for moving hot Jupiters to their close-in orbits. Overall, this study suggests that warm Jupiters are not a distinct planet species, but instead may represent the shorter-period counterparts of cold Jupiters whose orbits are shaped by the same dynamical processes. Future observations expanding the sample of warm Jupiters and discoveries of additional planet companions will further uncover the links between hot, warm, and cold Jupiter systems.
Citation
“Planet–Planet Scattering Explains the Mass–Eccentricity Relation of Warm Jupiters,” Jiayin Dong et al 2026 ApJL 1007 L29. doi:10.3847/2041-8213/ae930e
The post Planets Scattering Planets in Warm Jupiter Systems appeared first on AAS Nova.
]]>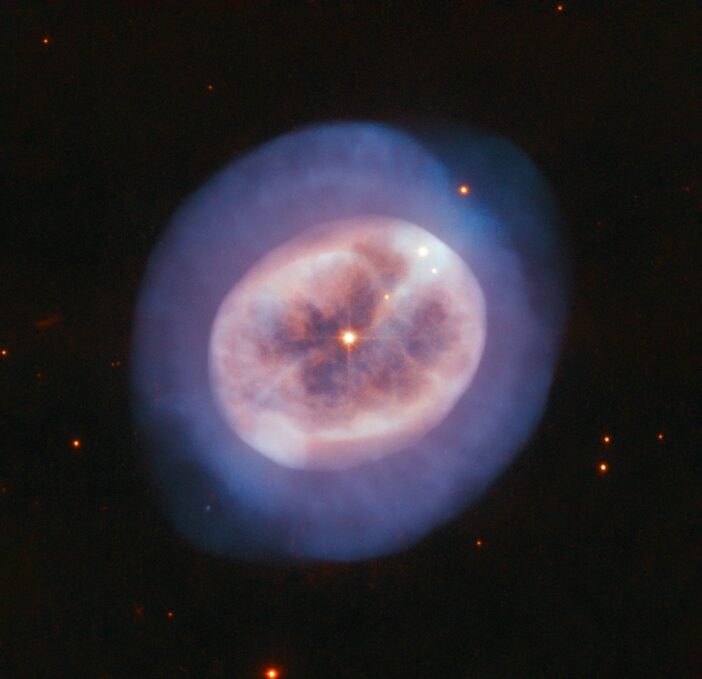
Researchers investigate a planetary nebula in a star cluster in the Andromeda Galaxy — one of just a handful of known extragalactic planetary nebula–open cluster pairs.
The post Extragalactic Planetary Nebula with Massive Progenitor Sheds Light on Stellar Evolution appeared first on AAS Nova.
]]>Editor’s Note: This article was co-written by Lucas Brown and Alexia Kubas, our 2026–2027 AAS Media Fellows. We’re excited to welcome Lucas and Alexia to the team and look forward to featuring their writing on AAS Nova regularly!
Planetary nebulae mark a key evolutionary phase for low- and intermediate-mass stars, but properties of the parent star are difficult to sleuth out. Researchers have discovered an extragalactic planetary nebula in the center of a star cluster, offering an unprecedented opportunity to trace planetary nebula properties to parent star stats.
The Puzzle of Planetary Nebula Progenitors
A planetary nebula, so named because the first ones discovered resemble the planet Uranus in a small telescope, forms when a Sun-like star runs out of fuel and sheds its outer layers, leaving a hot remnant core enveloped in a gaseous nebula. At higher masses, a different process kicks in: stellar cores can collapse to produce a chaotic burst of stellar material called a supernova. Where exactly the boundary should be placed between planetary nebula progenitors and supernova-forming stars remains an outstanding question in the field of stellar evolution.
Answering this question is challenging because once a planetary nebula becomes visible, the progenitor star’s transition into a hot, compact white dwarf is already underway, making it difficult to determine the star’s initial mass. For this task, researchers seek out planetary nebulae within open clusters — groups of stars that were born from the same molecular cloud and are roughly the same age — so that cluster characteristics can help piece together the progenitor puzzle. Since open clusters tend to be relatively young, they are also a great tool to probe planetary nebulae from more massive progenitors and explore the boundary between stars that produce planetary nebulae and those that go supernova.
Striking Gold
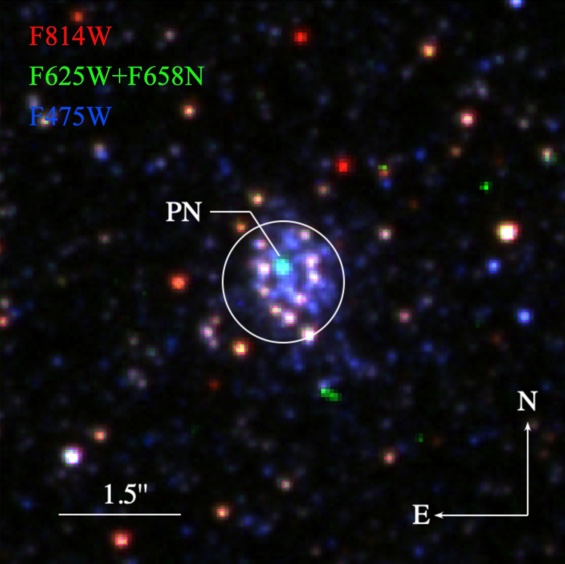
Open cluster AP 210 and planetary nebula M279 in the Andromeda Galaxy, as seen in archival Hubble observations. Click to enlarge. [Chen et al. 2026]
To make this identification, Chen’s team used archival Hubble Space Telescope and MMT data to examine the location of the planetary nebula candidate M279 within the Andromeda Galaxy. The researchers’ critical observation was that the nebula not only overlaps with the position of an open star cluster called AP 210, but it also has an estimated velocity that matches the velocity of other stars in the cluster. These associations, when combined, provide strong evidence that M279 originated within the cluster.
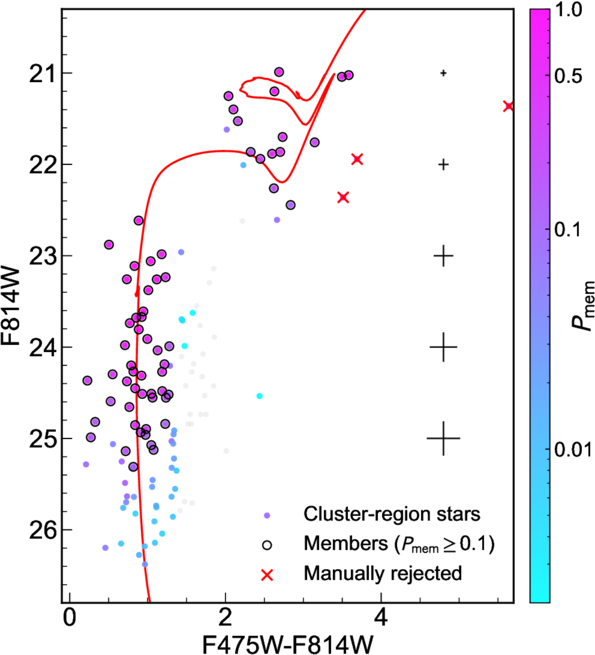
Color–magnitude diagram of stars in the open cluster AP 210. Colored dots represent stars, and the red line is the best-fitting isochrone, which was used to determine the cluster’s age. Click to enlarge. [Chen et al. 2026]
What’s My (Cluster) Age Again?
M279’s cluster origin has significant consequences for pinning down the properties of the progenitor star. First, stars in open clusters all form at roughly the same time — 90 million years ago in the case of AP 210 — allowing the authors to set a tight constraint on the progenitor’s age. Then, because the rate at which a star burns through its nuclear fuel and generates a planetary nebula is related to its initial mass, the researchers are able to connect this age to a specific progenitor mass of around 5.7 solar masses.
The team also subtracted the central star’s contribution from the observed spectrum to isolate the nebula’s composition, illuminating specific nuclear processes relevant to higher-mass stars. Planetary nebulae are cosmic cocktails whose chemical abundances trace the composition of the interstellar medium when the progenitor formed as well as elements formed via nucleosynthesis inside the star during its lifetime. Chen and collaborators found the nebula to be significantly nitrogen-enhanced, which is consistent with a massive asymptotic giant branch progenitor undergoing hot bottom burning that converts carbon to nitrogen. This newly minted metal would then be mixed back into the star’s outer layers, flooding the resultant nebula with its particular spectral signature.
While this work represents only a single observation of a high-progenitor-mass planetary nebula — and only the third compelling extragalactic planetary nebula–open cluster pair — it opens up the possibility that there may be many more waiting to be found, unlocking new insight into the lives of massive stars.
Citation
“A Planetary Nebula from a 5.7 M⊙ Progenitor in a 90 Myr M31 Star Cluster,” Pinjian Chen et al 2026 ApJL 1005 L2. doi:10.3847/2041-8213/ae77e4
The post Extragalactic Planetary Nebula with Massive Progenitor Sheds Light on Stellar Evolution appeared first on AAS Nova.
]]>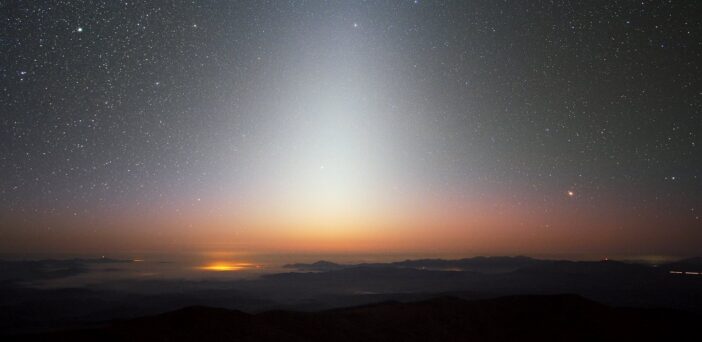
Astrobites reports on why we might need a cosmic feather duster to see life on other worlds.
The post Dust Deal with It appeared first on AAS Nova.
]]>Editor’s Note: Astrobites is a graduate-student-run organization that digests astrophysical literature for undergraduate students. As part of the partnership between the AAS and astrobites, we occasionally repost astrobites content here at AAS Nova. We hope you enjoy this post from astrobites; the original can be viewed at astrobites.org.
Title: The Exozodi Spectral Effect: Residual Habitable Zone Dust May Bias exoEarth Characterization
Authors: Miles H. Currie et al.
First Author’s Institution: NASA Goddard Space Flight Center
Status: Published in AJ
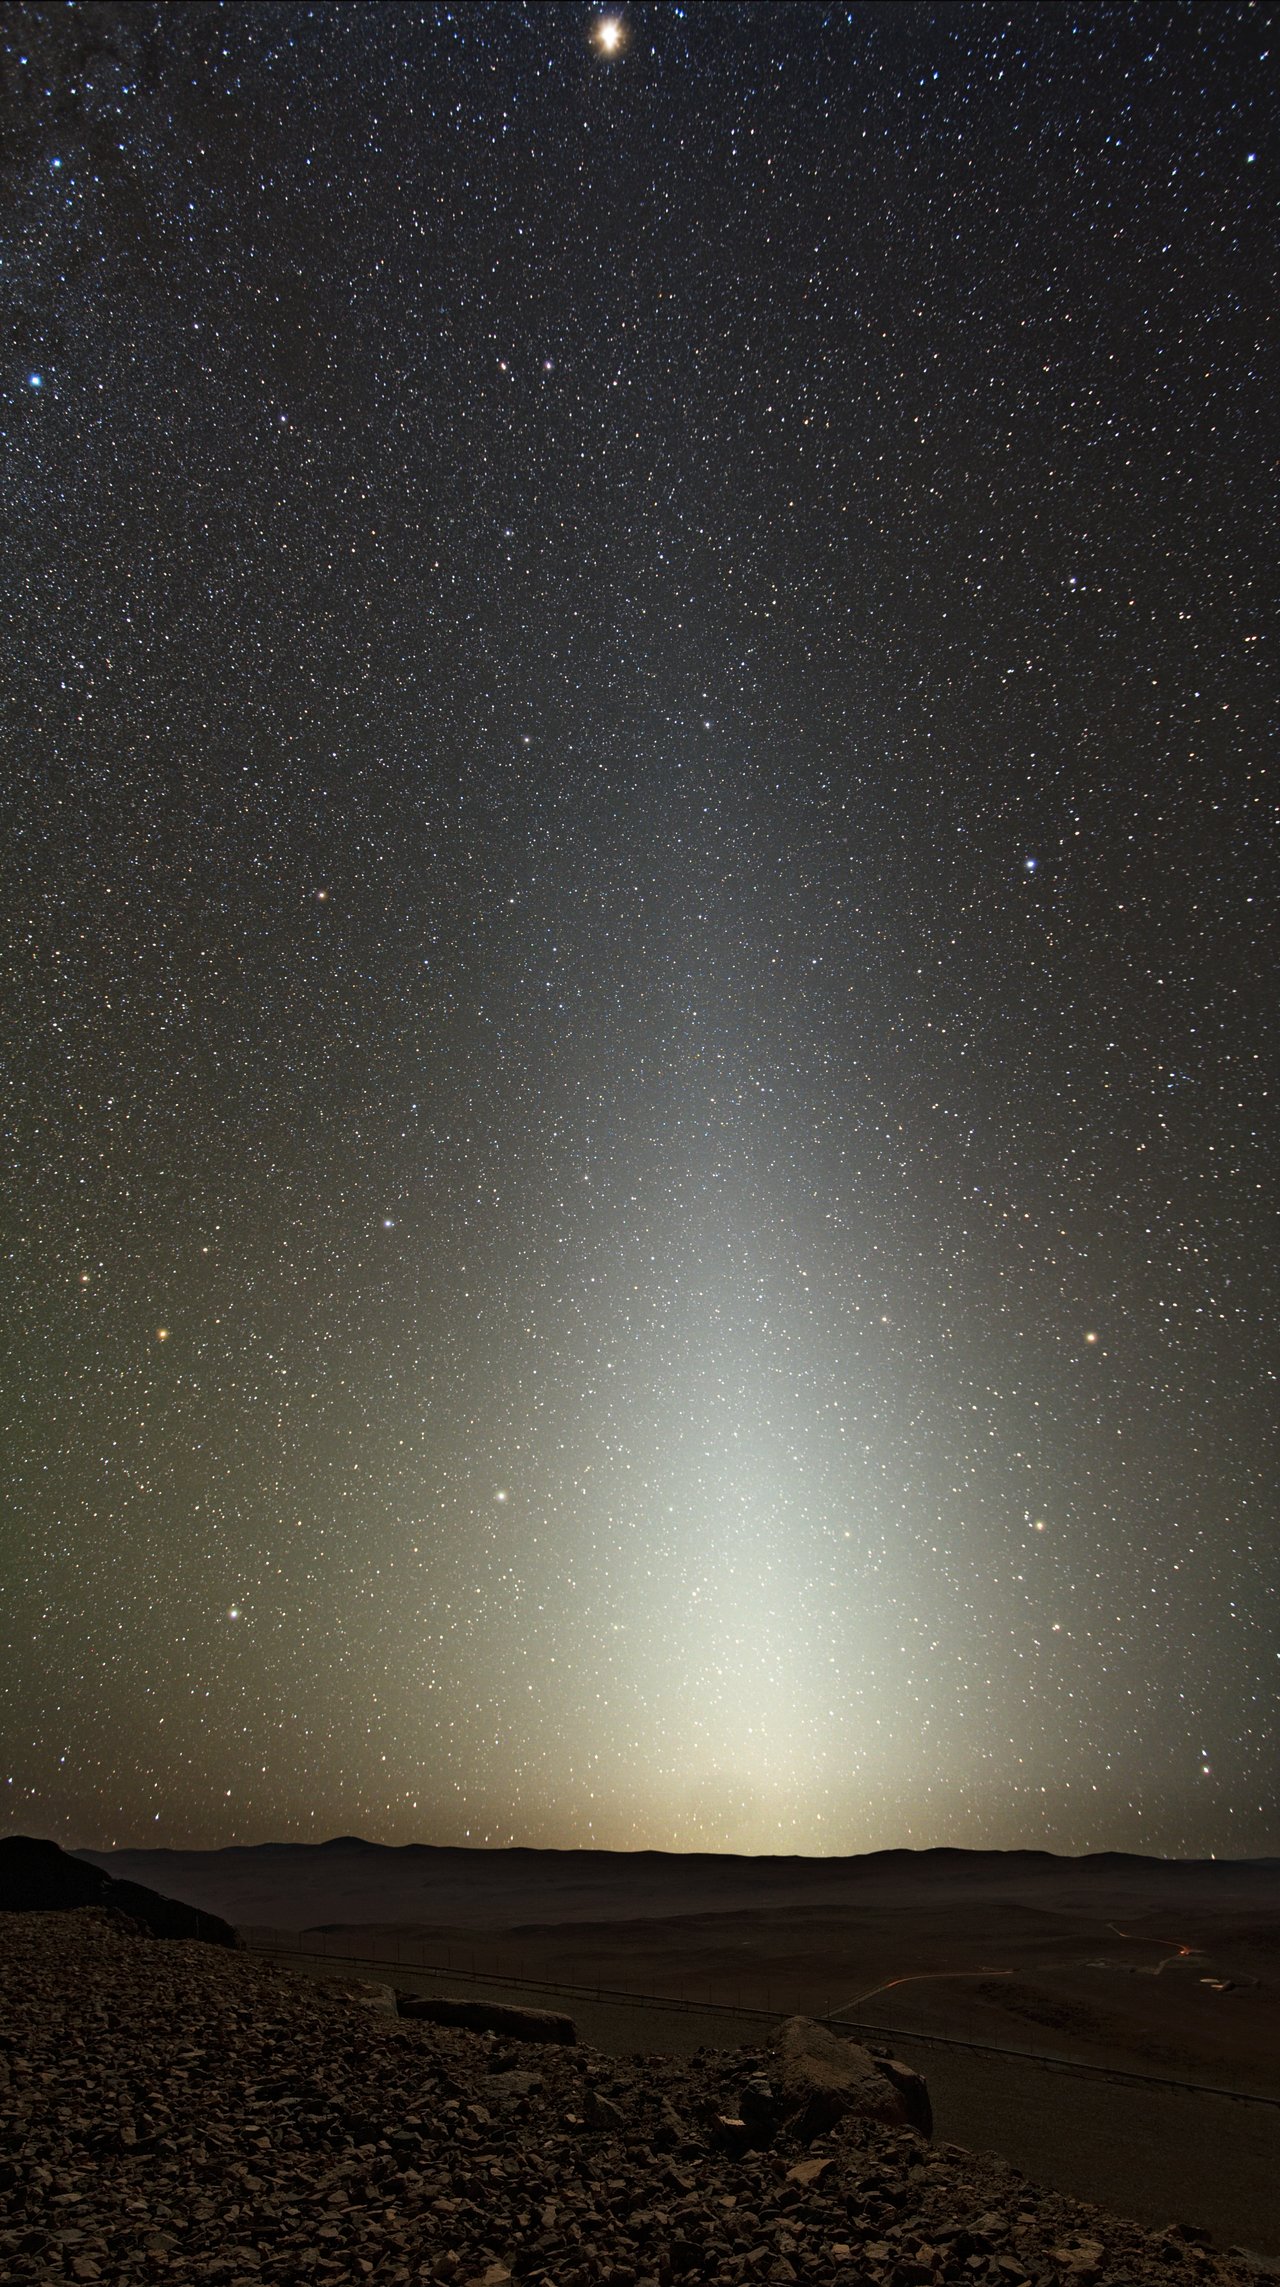
Figure 1: Zodiacal light as seen from Cerro Paranal. [ESO/Y. Beletsky; CC BY 4.0]
This zodiacal dust is not exclusive to the solar system. Other star systems, such as Tau Ceti and Vega, have been found to host similar clouds of interplanetary dust. This means planets imaged in these systems will also have emission from this dust mixed into the light that we observe from the planets. The Habitable Worlds Observatory (HWO) is a future space telescope mission under development by NASA. One of its primary science goals is to directly image 25 Earth-like planets in the habitable zones of nearby stars and look for signs of life (or biosignatures) in these planets’ atmospheres. Exozodiacal dust (aka exozodi) represents the biggest source of astrophysical noise that will need to be subtracted out from HWO observations of exoEarths. The authors of today’s article look at the potential impact of exozodi emission on the spectra of exoEarth atmospheres.
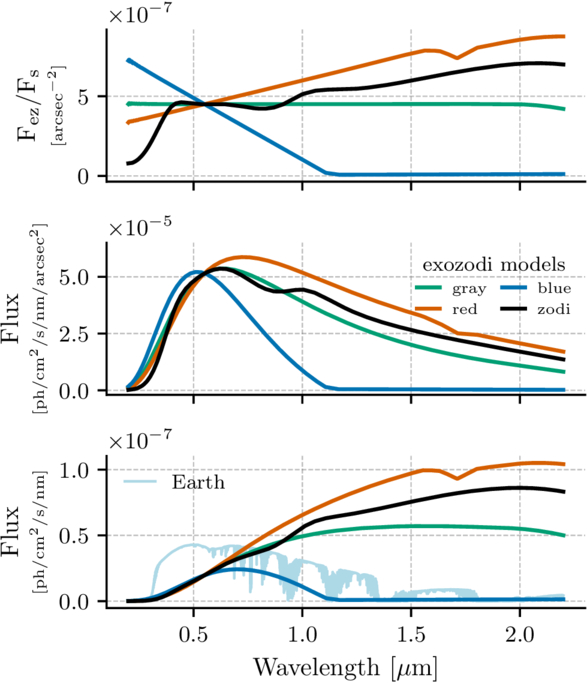
Figure 2: Different models of three “zodis” of dust observed at an inclination of 60 degrees plotted across HWO’s potential wavelength range. The gray scattering model is shown in green, the solar system’s model is shown in black, with the red and blue debris disk models shown in their respective colors. The top panel shows the flux contrast between the dust and the star. The middle panel shows the flux per area. The bottom panel shows the total flux captured with a 7.2-meter HWO with the thin blue line representing the spectrum of an Earth twin 10 parsecs (33 light-years) away for comparison. [Currie et al. 2026]
Show Me the Zodi
The authors first assume four different models of exozodi dust and how the dust’s emission changes with wavelength. The first model assumes a dust cloud that acts as a gray scatterer, meaning the particles scatter all wavelengths of light with no preference, and the second model’s dust acts just like the solar system’s does. However, it’s unknown whether the composition of exozodi will be the same as the solar system’s. Therefore, they adopt two more models of exozodi that act just like debris disks that have different compositions. One model is bluer in color because it is made up of smaller particles that preferentially scatter blue light, and the other model is redder in color because it is made up of bigger dust particles or different chemical compositions. Each of these models over HWO’s wavelength range can be seen in Figure 2. The authors then simulate a modern Earth atmosphere (both clear and 50% cloudy) as well as an Archean Earth atmosphere to understand how different exozodi models will affect observations of different exoplanet atmosphere conditions and compositions.
There’s Dust in My Spectra
In general, the effect that zodiacal dust has on the spectra of Earth-like planets can be broken down into two categories: its effect on the continuum and on the spectral features. The continuum is the object’s light emitted over all wavelengths and uninterrupted by spectral features. Spectral features are absorption and emission lines. These create either a dip or peak in the spectrum where atoms have either absorbed or emitted light at that particular wavelength. Lines at specific wavelengths tell us that a certain material is there, providing a list of possible chemicals that could be present in the planet’s atmosphere. For a brief summary of spectroscopy more generally, see here.
In the case of the continuum, exozodiacal emission raises the continuum, meaning the base flux of the planet is raised and absorption lines become more shallow. These effects can be seen in Figure 3, where the authors’ simulated spectra are plotted with and without zodiacal dust included. Not only is the continuum elevated for all models including zodiacal dust, notice how the dips become shallower at longer wavelengths. Because dust primarily radiates thermally, the red debris disk model nearly smooths out all dips beyond 1.25 microns! Molecules that absorb at these longer wavelengths, such as water or methane, may not be correctly identified with this type of exozodiacal emission.
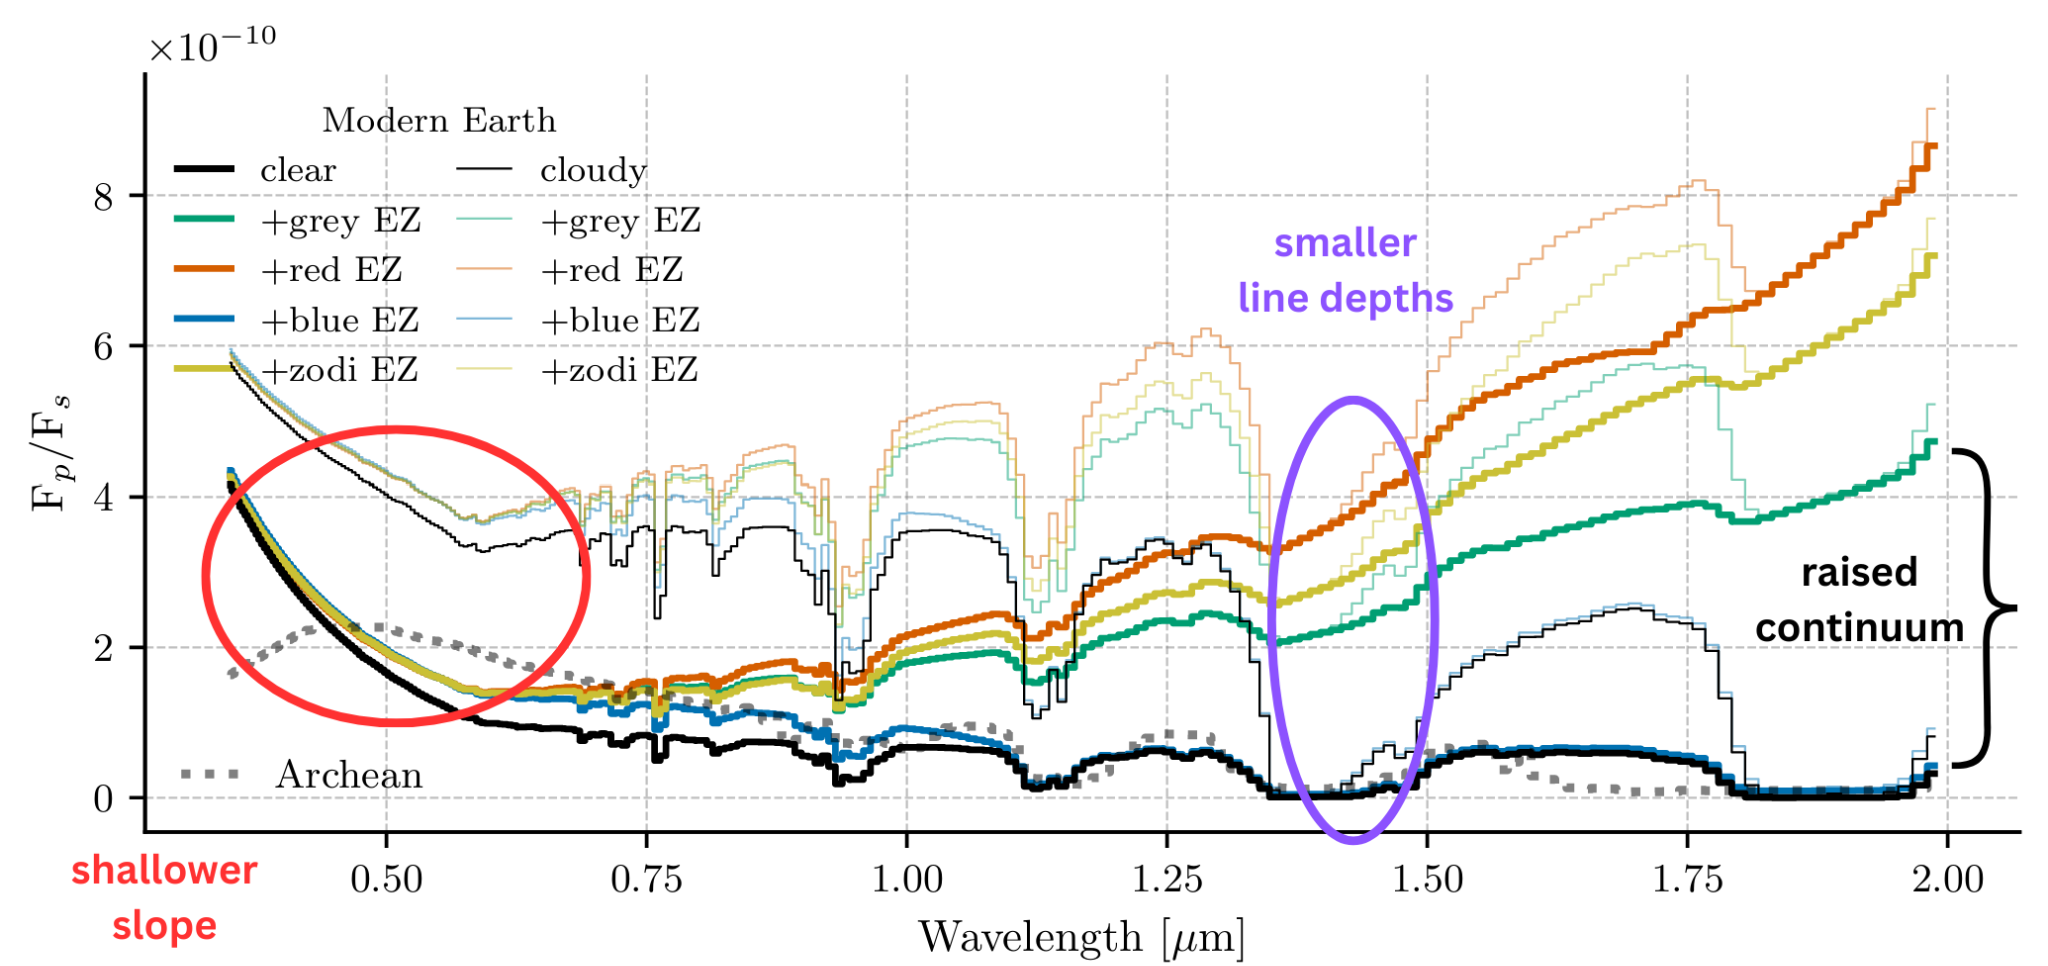
Figure 3: Spectra of simulated modern-Earth atmospheres for clear (solid bright lines) and cloudy (solid dimmer lines) scenarios. The Archean Earth atmosphere is plotted in dotted gray. The redder exozodiacal spectrum has an elevated continuum and smoothed spectral features as opposed to the original, zodi-free spectrum plotted in black. [Currie et al. 2026, with annotations by Kaz Gary]
From Figure 3, the effects of zodiacal dust are minimized with a bluer zodiacal dust model. This means systems with “bluer” zodiacal dust may be more optimal for HWO observations, as bluer dust does not scatter as much starlight as gray, solar system–like, or red dust. From their results, the authors recommend that the residual exozodi-to-planet flux ratio (in the V-band wavelengths) be kept to less than 10-2 in order to correctly understand the line depths (identify if a molecule is present or not) and 10-3 in order to accurately retrieve molecular abundances (understand how much of a molecule is present in the atmosphere). Dust is pesky enough here on Earth, but to find life on another planet like ours, we’ll dust have to deal with it.
Original astrobite edited by Anavi Uppal.
About the author, Kaz Gary:
I am a fourth-year PhD candidate at The Ohio State University with a passion for planets. My current work focuses on modeling exoplanet observations for the Habitable Worlds Observatory and understanding planetary atmospheres. Outside of research, I help develop planetarium shows and love all forms of science communication. In my free time, I enjoy playing tabletop RPGs, painting, watching terrible reality TV, and hanging out with my pet hedgehog.
The post Dust Deal with It appeared first on AAS Nova.
]]>
We're excited to welcome Alexia Kubas and Lucas Brown to the team as AAS Media Fellows for 2026–2027!
The post Welcome and Farewell to Our AAS Media Fellows appeared first on AAS Nova.
]]>In 2017, we announced a new AAS-sponsored program for graduate students: the AAS Media Fellowship. This quarter-time opportunity is intended for current graduate students in the astronomical sciences who wish to cultivate their science-communication skills. This year, for the first time, we are welcoming two Media Fellows to the team.
We are pleased to announce that Lucas Brown and Alexia Kubas have been selected as our AAS Media Fellows for 2026–2027.

Alexia Kubas, a 2026–2027 AAS Media Fellow, is a graduate student at Cornell University.
Alexia majored in astronomy with minors in physics, math, and planetary sciences at the University of Arizona. They are now a fifth-year PhD candidate at Cornell University, researching periglacial processes on Earth and Ceres. Outside of research, Alexia founded and currently helps run an Ithaca, NY, chapter of Astronomy on Tap.
Lucas majored in physics with an astronomy concentration at the University of California, Davis, and he has a master’s degree in physics from Tufts University. He is now a physics PhD candidate at the University of California, Santa Cruz, where he works with Stefano Profumo on studying the phenomenology of primordial black holes. Outside of research, Lucas participates in outreach activities through organizations like the Santa Cruz Organization for Outreach in Physics and the Project for Inmate Education. He also serves as co-chair of the Astrobites collaboration.

2026–2027 AAS Media Fellow Lucas Brown is a graduate student at the University of California, Santa Cruz.
As AAS Media Fellows, Alexia and Lucas will regularly write and publish summaries of the latest astronomy research on AAS Nova, assist in managing the distribution of press releases as part of the AAS press office, and gain a broad understanding of the worlds of scientific publishing, communications, and policy. Alexia and Lucas will also be assisting with the press conferences at the upcoming AAS meetings, so please say hello if you spot them at future meetings!
As we welcome our new Fellows to the team, we’ll also soon bid farewell to Lexi Gault, our 2024–2026 AAS Media Fellow. Lexi will be continuing her PhD research at Indiana University, where she studies the interstellar medium conditions in nearby low-mass galaxies. After defending her PhD in Spring 2027, Lexi plans to pursue a postdoc in extragalactic astronomy or a full-time science writing position.
Please join us in welcoming Lucas and Alexia as our new Media Fellows and wishing Lexi the best in all her future endeavors!
The post Welcome and Farewell to Our AAS Media Fellows appeared first on AAS Nova.
]]>
A recent study has used spectroscopy from JWST to decipher the source of carbon oxides on the four largest moons of Uranus.
The post Breaking the Ice: Origins of Carbon Oxides on Uranian Moons appeared first on AAS Nova.
]]>For decades, astronomers have tried to decipher the source of carbon oxides on Uranus’s largest moons from ground-based telescopes. A recent study has leveraged JWST spectroscopy and laboratory experiments to identify carbon oxides and their origins for Ariel, Umbriel, Titania, and Oberon.
Unknown Origins of Carbon Oxide Enrichment
Forty years ago, the Voyager 2 spacecraft flew past Uranus and its twenty-seven moons, sending back prized portraits of the planet’s large and tidally locked satellites Miranda, Ariel, Umbriel, Titania, and Oberon. These images revealed extensive valleys, smooth plains, deep canyons, and possible icy volcanic (cryovolcanic) activity across the surfaces of the icy moons — the telltale signs of intense geologic activity. While Voyager 2 could take spectacular pictures, the spacecraft was not capable of identifying the molecules and materials making up these active surfaces.

Voyager 2 images of Uranus’s six largest moons. Click to enlarge. [NASA / JPL-Caltech / Ted Stryk; CC BY-NC-ND 4.0]
Ground-based detections are limited due to contamination from Earth’s atmosphere as well as the overall weakness of the carbon dioxide spectral features, thus space-based near-infrared observations of the Uranian moons are necessary to better constrain the carbon oxides on the satellites. Luckily, JWST’s Near-Infrared Spectrograph (NIRSpec) now offers astronomers unimpeded access the moons’ carbon oxide spectral features.
Chemical Clues from Space and in the Lab
In 2024, a study acquired NIRSpec observations of Uranus’s moon Ariel, revealing prominent carbon dioxide features and confirming the presence of carbon monoxide ice hinted at by ground-based studies. Expanding on these observations to include Umbriel, Titania, and Oberon alongside Ariel, Richard J. Cartwright (Johns Hopkins University) and collaborators obtained JWST NIRSpec spectroscopy of Uranus’s four largest moons in hopes of disentangling the origin story of their carbon oxides.

Diagram illustrating the leading and trailing sides of a moon orbiting Uranus. Click to enlarge. [AAS Nova/Kerry Hensley]

Spectral ratios of the trailing and leading hemispheres for each moon, labeling spectral features of multiple carbon-bearing molecules. Click to enlarge. [Cartwright et al 2026]
Carbon Oxide Origins
What does this mean for the origins of the carbon oxides on the Uranian moons? Spectral features of carbonate minerals and the widespread presence of carbon dioxide throughout the Uranus system suggest that these compounds exist natively. On the other hand, the concentration of carbon oxide features on the trailing hemispheres supports radiolytic production as these hemispheres are bombarded with more ionizing particles from Uranus’s magnetosphere.
Based on these results, the authors have postulated that both origin scenarios, native presence and radiolysis, are required to fully explain the presence of carbon oxides. Future laboratory studies and JWST observations will continue to reveal the nature and composition of bodies in the Uranus system, furthering our understanding of our solar system siblings.
Citation
“Tracing the Source of Carbon Oxides on the Large Moons of Uranus,” Richard J. Cartwright et al 2026 Planet. Sci. J. 7 199. doi:10.3847/PSJ/ae8818
The post Breaking the Ice: Origins of Carbon Oxides on Uranian Moons appeared first on AAS Nova.
]]>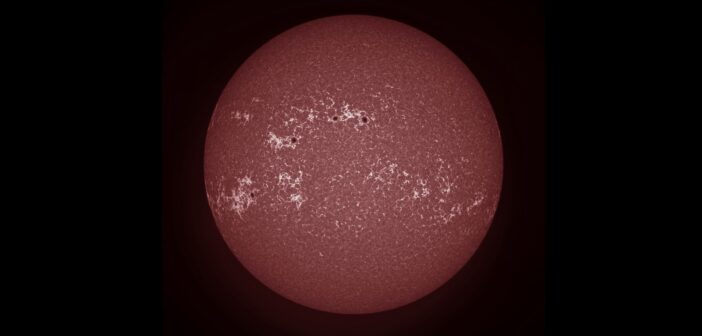
New modeling tests a common assumption that's important for interpreting exoplanet spectra: that stars of all spectral types exhibit bright magnetized regions called faculae.
The post When Bright Spots Go Dark appeared first on AAS Nova.
]]>Light and dark regions speckle the Sun and other stars, complicating the interpretation of exoplanet transmission spectra. New modeling suggests that faculae — bright areas on the visible surface of the Sun — appear dark on cooler stars, adding a new wrinkle to this challenge.
Dark Spot, Bright Spot
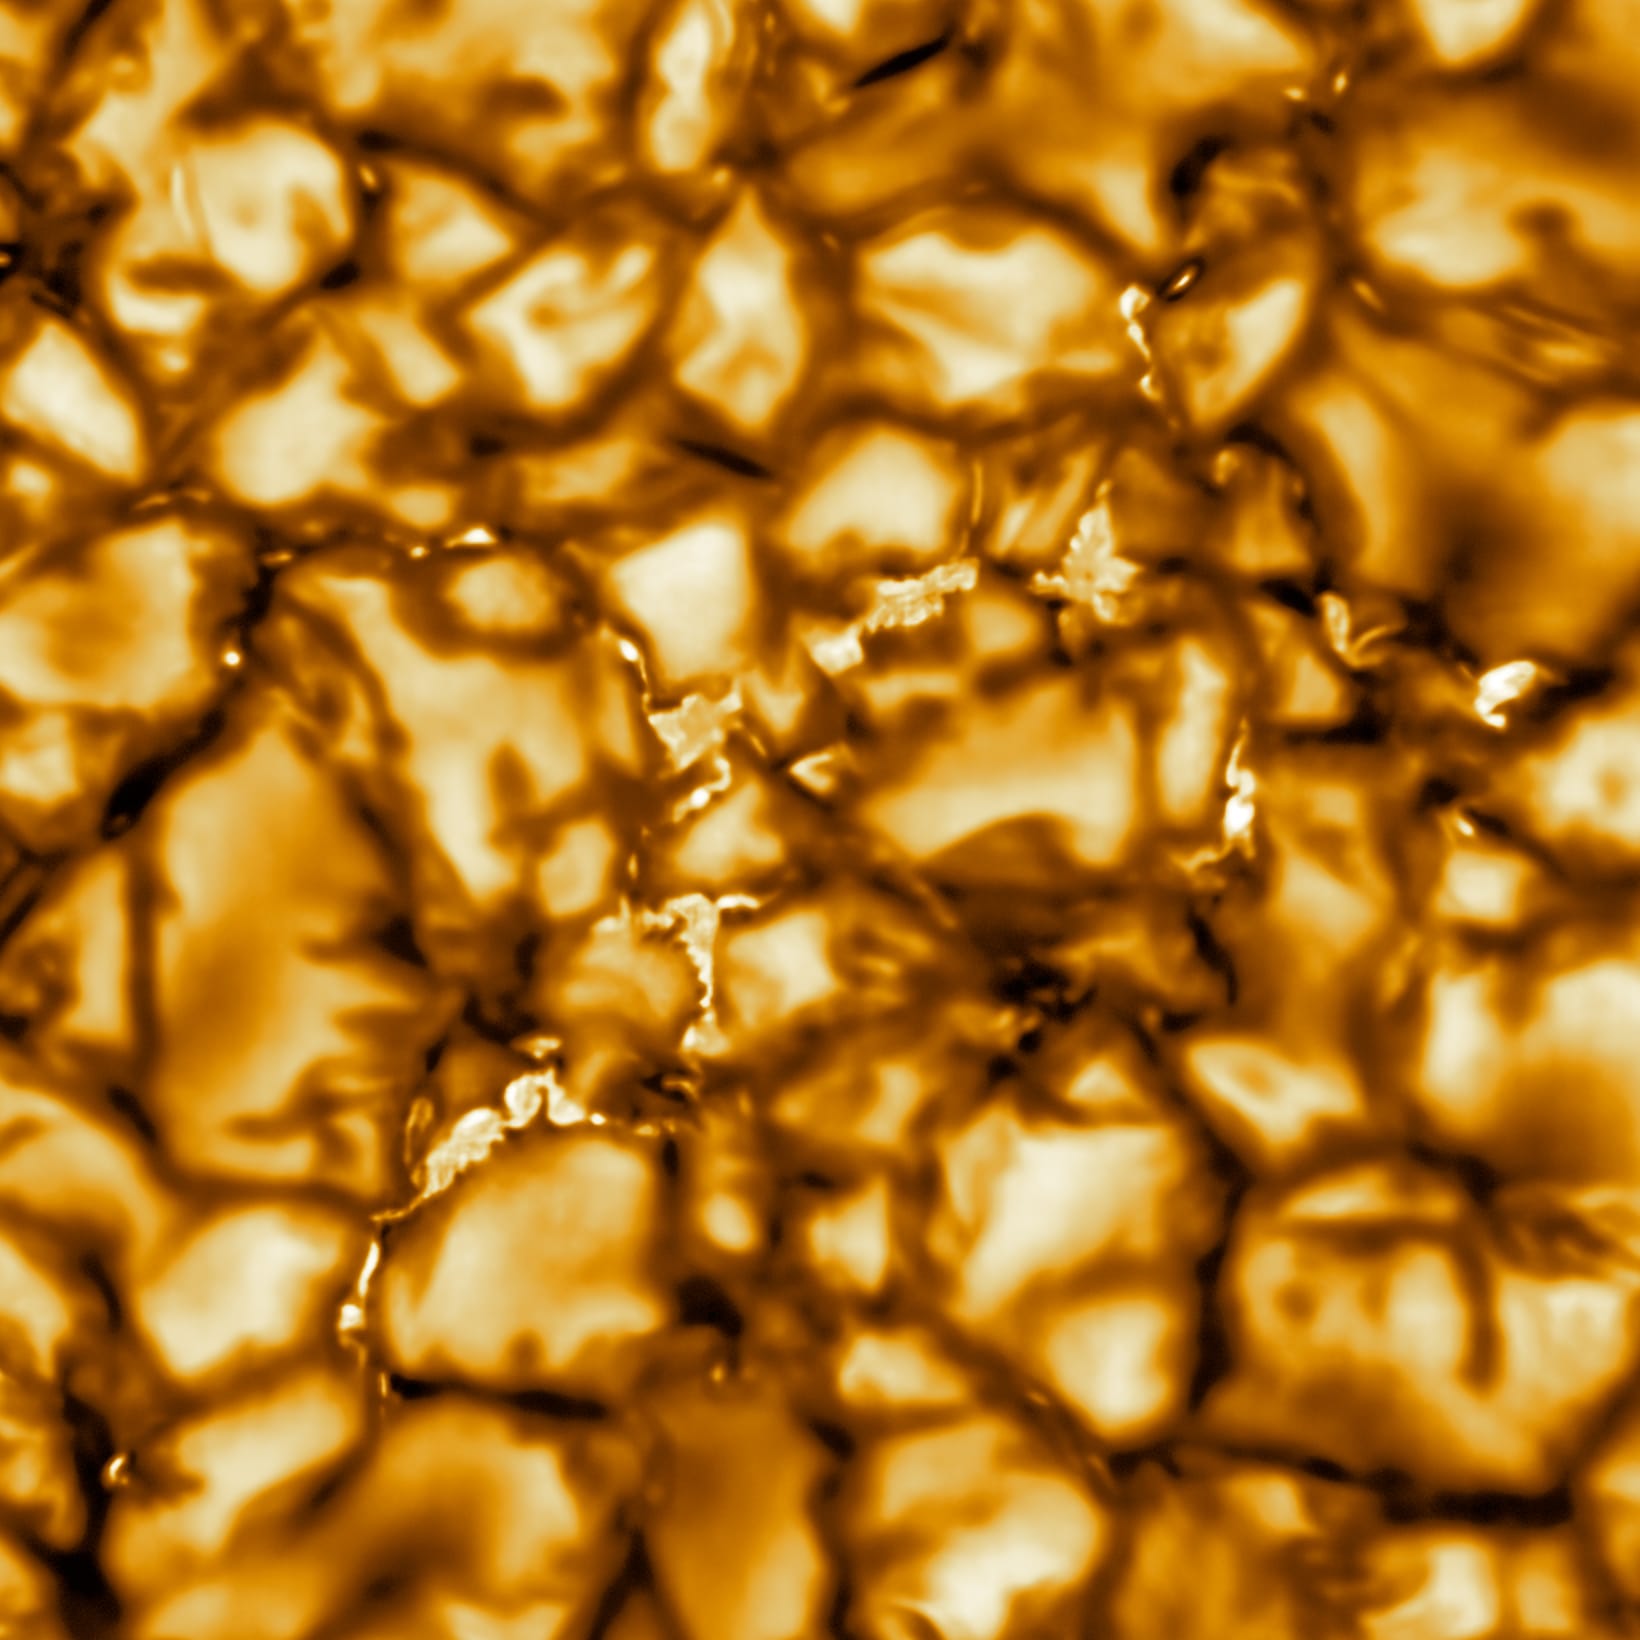
This image from the Daniel K. Inouye Solar Telescope shows solar convective cells called granules. The bright points in the dark lanes between granules are regions of enhanced magnetic field strength. [NSO/AURA/NSF; CC BY 4.0]
The Sun is freckled with dark spots — sunspots — as well as bright regions called faculae. Sunspots form where the Sun’s magnetic field bubbles up, creating pockets of cooler, less luminous plasma. Solar faculae form in regions of concentrated magnetic field, creating bright spots that line the dark crevasses between convective cells.
Other stars also have starspots and faculae, but thus far, astronomers have no direct observations of faculae on any star except the Sun. Out of necessity, researchers interpreting exoplanet spectra assume that faculae on other stars are similar to those on the Sun — but are they actually?
Would a Facula on Any Other Star Look as Bright?
To explore what faculae might look like on stars other than the Sun, Alexander Shapiro (University of Graz; Max Planck Institute for Solar System Research) and collaborators turned to three-dimensional radiative magnetohydrodynamics simulations and radiative transfer modeling. Their aim was to simulate the appearance and spectra of faculae on stars of spectral type G2, K2, M0, and M4 — from Sun-like to substantially smaller and cooler than the Sun.
Simulated faculae on a Sun-like star (left) and an M4 star (right). These images show the faculae at 600 nm. Click to enlarge. [Shapiro et al. 2026]
Exoplanetary Effects
The transition from bright faculae on Sun-like stars to dark faculae on M4-class stars directly affects interpretations of exoplanet transmission spectra. The existence of dark faculae increases the derived exoplanet radius, whereas bright faculae on Sun-like stars decrease the derived radius. The contamination due to the faculae is wavelength dependent, with the largest contamination occurring at shorter wavelengths. This contamination, if not fully accounted for, can mimic spectral features from an exoplanet’s atmosphere.
Contamination of transmission spectra by faculae near a star’s poles (left) and closer to the star’s equator (right). Faculae are bright for the simulated G2, K2, and M0 stars, and they are dark on the simulated M4 star. Click to enlarge. [Shapiro et al. 2026]
Citation
“The Curious Case of Dark Faculae on M Dwarf Stars,” A. I. Shapiro et al 2026 ApJ 1008 24. doi:10.3847/1538-4357/ae7105
The post When Bright Spots Go Dark appeared first on AAS Nova.
]]>
Astrobites reports on how synchrotron emission from thermal electrons could help to explain the behavior of certain tidal disruption events.
The post Thermal Electrons Can Explain the Mysterious Radio Behavior of a Tidal Disruption Event appeared first on AAS Nova.
]]>Editor’s Note: Astrobites is a graduate-student-run organization that digests astrophysical literature for undergraduate students. As part of the partnership between the AAS and astrobites, we occasionally repost astrobites content here at AAS Nova. We hope you enjoy this post from astrobites; the original can be viewed at astrobites.org.
Title: Thermal Electrons in the Radio Afterglow of Relativistic Tidal Disruption Event ZTF22aaajecp/AT 2022cmc
Authors: Lauren Rhodes et al.
First Author’s Institution: McGill University
Status: Published in ApJ
Tidal disruption events (TDEs, see Figure 1), which occur when a star gets a little too close to a supermassive black hole (SMBH) and gets ripped apart, are a hot topic across the electromagnetic spectrum. During a TDE, the star can no longer hold itself together under the gravitational pull of the SMBH. Some bits of the star end up accreting onto the black hole, which can launch a temporary outflow, or, in especially dramatic cases, a relativistic jet.
Figure 1: Timeline of events leading to a tidal disruption event. [Chloe Klare]
How to Spot a TDE
Usually, TDEs are discovered in the X-ray (after all, not many transients are powerful enough to generate an X-ray flare) or in the optical (thanks to high-cadence, wide-field surveys like the Zwicky Transient Facility and the Legacy Survey of Space and Time). However, radio is a particularly useful regime for TDE searches, especially in dusty host galaxies where we cannot see the optical TDE signatures at all; while dust obscures optical light, the radio is unaffected! There is just one catch: how exactly can we identify a TDE based on only its radio emission?
The radio light in a TDE is generated via synchrotron radiation — which is caused by fast moving electrons in strong magnetic fields — and originates in jets or shocks. Unfortunately, this is also the case in AGN, the primary extragalactic source of variable radio emission, and it can be difficult to distinguish between the two. Additionally, the amount of light we see from synchrotron radiation at a given frequency depends on how energy is distributed among the electrons in the source, which is unknown. Perhaps the simplest case — or at least the one you’ll learn about first in your undergraduate statistical mechanics course — is that the energy is distributed among the electrons thermally (left panel in Figure 2). However, most radio transients associated with black holes are assumed to have non-thermal electron energy distributions, usually where there are exponentially many more low-energy electrons than high-energy electrons (right panel in Figure 2).
Figure 2: Energy can be distributed among the electrons in a source either thermally (left panel), where most electrons have a medium amount of energy, or non-thermally (right panel), where most electrons have a small amount of energy. Often, extragalactic radio transients are assumed to originate from non-thermal electrons, but today’s article argues why we shouldn’t ignore thermal electrons. [Chloe Klare]
This includes today’s authors, who have focused on one particular TDE, ZTF22aaajecp/AT2022cmc (I’m sure everyone mispronounces her name), or 2022cmc for short. 2022cmc is a special TDE: it is one of only five TDEs suspected to have launched a relativistic jet, and it has the highest redshift (z ~ 1.2) of the five. It was observed first in the optical and then in the X-ray and radio. The X-ray emission was highly variable for 400 days post-TDE, and then disappeared, and the first 100 days of radio emission indicated there was a relativistic outflow. At the time, it was concluded that the jet shut off and the X-ray emission ceased. However, the story doesn’t end there; the authors of today’s article continued to observe 2022cmc in the radio for an additional 900 days at frequencies spanning about 1–100 GHz.
Our authors had two key observing strategies: wide frequency coverage and long duration. Measuring the change in brightness with observing frequency, or the spectral energy distribution (SED), is important for determining which processes are responsible for the radio emission, since thermal electrons and non-thermal electrons will produce different SEDs. On the other hand, measuring the change in brightness over time, or the light curve, is important for determining what is happening at the source, such as whether there is a jet and, if so, how long it lasts. Here, our authors combine light curves at six different frequencies (Figure 3) and SEDs at nine different epochs (Figure 4) to investigate both.
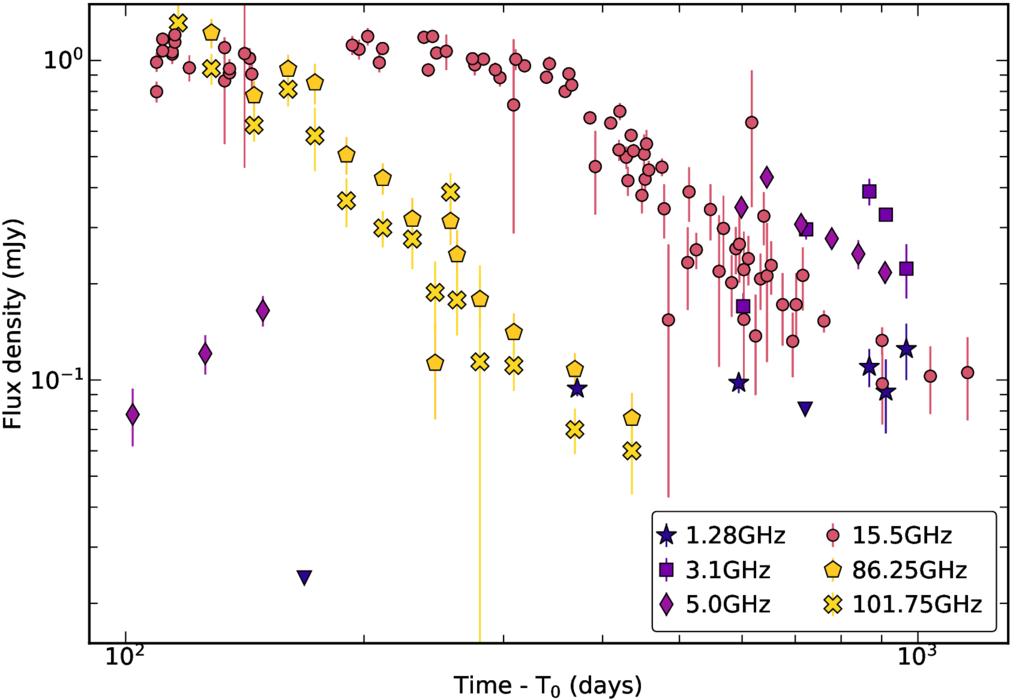
Figure 3: Light curves spanning six frequencies and 900 days obtained by today’s authors. [Rhodes et al. 2025]
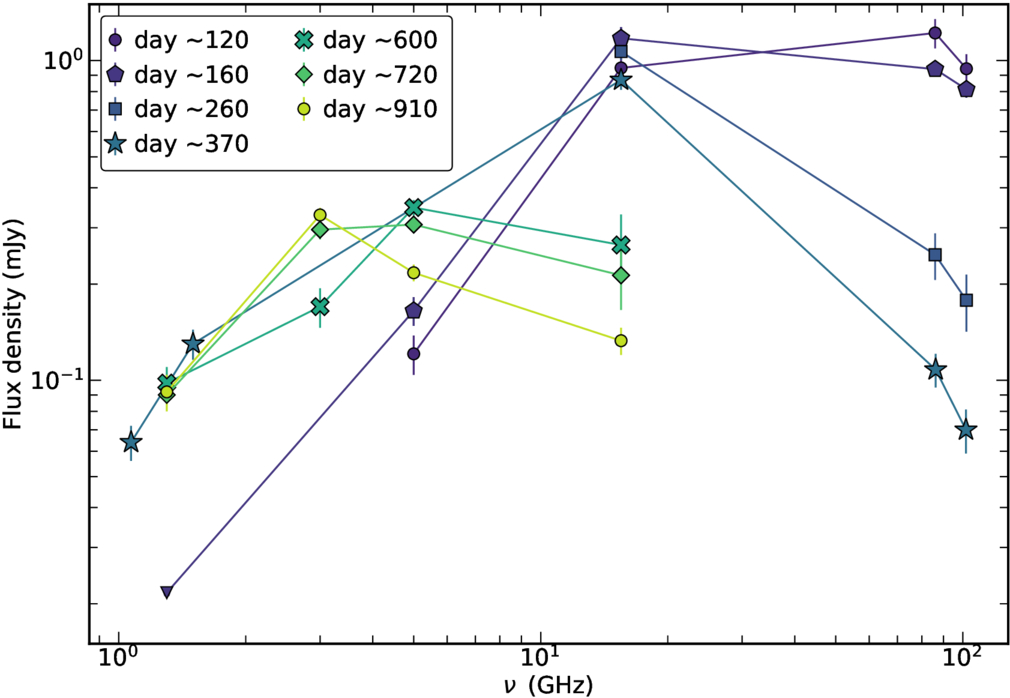
Figure 4: Nine epochs of radio SEDs, which show the peak moving to lower frequencies over time. [Rhodes et al. 2025]
The Findings
Our authors find a couple of interesting results. First, in the time domain, they find the highest-frequency light curves fade with time, while the lower-frequency light curves increase initially, hit peaks at different times (after 300 days at 15.5 GHz, and after 800 days at 1.3 GHz), and then begin to decay. The spectral evolution is even more intriguing; the SED is always peaked, and the peak shifts to lower frequencies over time, which is typical for an expanding emission region. At frequencies below the peak, the SED doesn’t change much. However, the high-frequency side of the SED shows confusing behavior: early on, it has a very steep slope (the amount of light drops off sharply at higher frequencies), but it eventually flattens.
Investigations Begin
Next, our authors consider three possibilities to explain these observations. They first consider synchrotron radiation from only non-thermal electrons in a relativistic jet (Figure 5), which is the canonical model for a gamma-ray burst radio afterglow. Initially, the jet is so fast that all its radio light is relativistically beamed in one direction (like a flashlight), and we can only see the jet if it’s pointed directly at us. Eventually, the jet slows down enough that it is no longer beamed, and light is emitted in all directions (like a light bulb). At this point, we see the light fade over time, which is exactly what happened in the high-frequency light curves. However, there is one glaring problem: this model cannot possibly explain the observed long-lasting steep SED at high frequencies. So, our authors discard this theory.

Figure 5: The left image shows what a black hole–generated jet looks like in the rest frame of the jet itself. As long as the jet isn’t moving too fast, this is what we see too. However, if the material in the jet is moving near the speed of light, we observe a relativistically beamed jet (right image). [Chloe Klare]
Lastly, our authors keep the thermal/non-thermal electrons combo and ditch the jet entirely, modeling a spherical outflow. Excitingly, this model best fits the observations, and, most importantly, can explain the mysterious high-frequency behavior. Initially, most of the radio emission originates in the thermal electron population, which produces more light at higher frequencies. As the outflow expands, the non-thermal electrons begin to dominate, and the SED transforms into the classic non-thermal synchrotron shape.
Next Steps
Ideally, our authors want to compare 2022cmc to other TDEs, but few TDEs have such thorough follow-up observations. They speculate that thermal electrons were important in the radio evolution of one of the few such TDEs, Swift J1644, and recommend we revisit its emission models. More broadly, they recommend two future priorities: first, we need extensive radio observations for larger samples of TDEs, especially around 100 GHz, where the thermal electrons contribute most to the SED; secondly, we should stop neglecting thermal electrons not just in TDE models, but in models of any black hole jets, including gamma-ray bursts and X-ray binaries. While this work addresses only one event, one thing is clear. For theorists and observers alike, there is a myriad of exciting work to be done, so it’s no wonder TDEs have garnered so much attention lately.
- A convenient property of extragalactic synchrotron sources is that all their electrons radiate independently of one another, even if they are part of the same electron population. This is called incoherent emission. (Galactic sources are another story, but I’ll save that for another time.) ︎
Original astrobite edited by Flavia Pascal.
About the author, Chloe Klare:
I’m a PhD student in astronomy and astrophysics at Penn State (with a physics minor, so I get to use my semester spent in QFT for something!). I study active galactic nuclei (in the radio!), and I’m currently looking for baby synchrotron jets in active galactic nuclei.
The post Thermal Electrons Can Explain the Mysterious Radio Behavior of a Tidal Disruption Event appeared first on AAS Nova.
]]>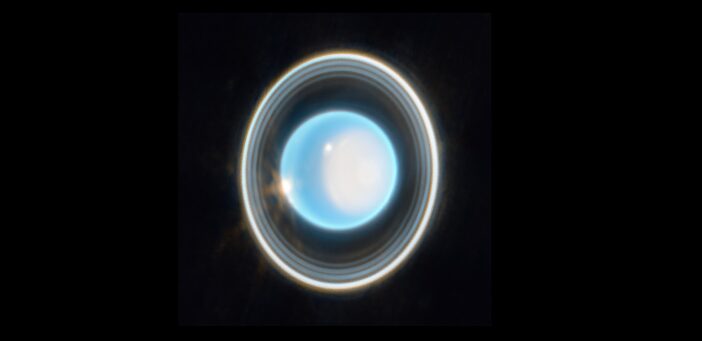
The original plan for an upcoming flagship mission to Uranus called for a slingshot around Jupiter. Now that the planet won't be in the right position at launch time, the spacecraft will need to follow a different path.
The post Who Needs Jupiter? appeared first on AAS Nova.
]]>A planned flagship spacecraft to Uranus was aiming to use Jupiter for a gravitational boost to shorten its journey to the outer solar system. Now that the mission’s launch date has been pushed back, it’ll need to find another way to its target.
Redesigning the Route
Uranus and Neptune, the ice giants of our solar system, have been comparatively neglected by humanity’s fleet of interplanetary probes. While all of the other major bodies have been visited by at least an orbiter or even a lander, the most detailed exploration we’ve done of these two planets happened when the Voyager 2 spacecraft went screaming past on its way toward interstellar space.
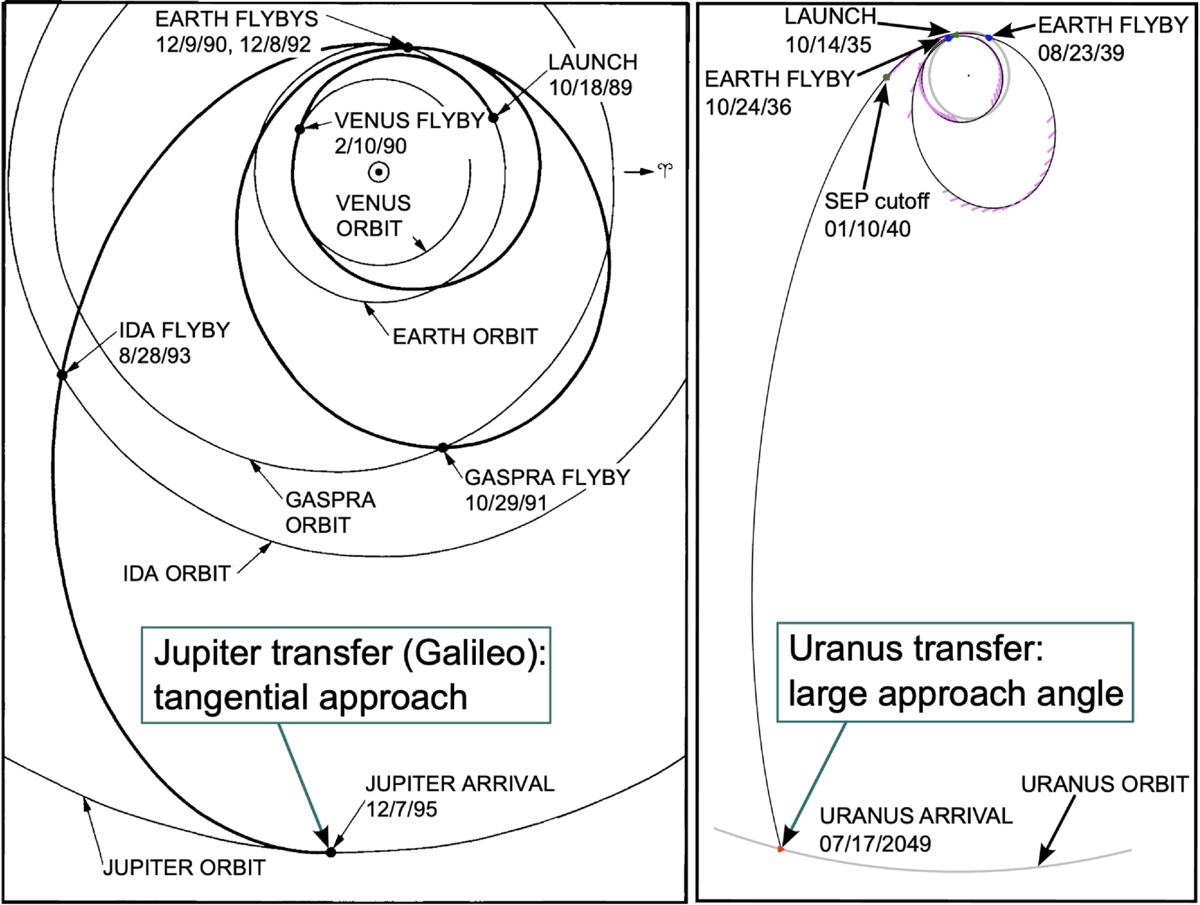
Schematics of different trajectories within the solar system. Left: The path the Galileo spacecraft took to Jupiter. This path arrived nearly parallel to the planet’s motion. Right: One of the proposed paths to Uranus. This path will intersect the planet’s orbit at a much steeper angle to shorten the flight time. Click to enlarge. [Simon et al. 2026]
Getting these spacecraft to their destination will be a challenge The thriftiest path to get to Uranus, a trajectory called a Hohmann transfer that’s been used for other missions aimed elsewhere in the solar system, would take 16–17 years. Rather than accept the long wait, the original authors suggested that the mission instead fly toward Jupiter, using the giant planet’s massive gravitational tug to slingshot the spacecraft toward Uranus.
However, this plan relied on Jupiter being in just the right place when the spacecraft approached. This in turn relied on the mission launching sometime in 2031 or 2032: any earlier or later, the slingshot would be aimed in the wrong direction. Now that timelines and budgets have slipped for this flagship mission, hitting this launch window seems unlikely. And, without the boost from Jupiter, the mission will have to cross 20 au of open interplanetary space on its own.
Solar Electric Propulsion to the Rescue

Several proof-of-concept designs for the mission’s SEP components. How these designs would be packaged into a rocket fairing for launch is shown at right. Click to enlarge. [Simon et al. 2026]
The power levels would likely get too low just a few astronomical units into their journey, but that would be enough: after discarding the SEP stage, the mission could coast to Uranus on a journey that would take only 13 years. Even better, this technology has a proven flight history and would require little maturation or development. The BepiColombo mission to Mercury is currently using SEP, and similar techniques are used on satellites in Earth orbit today.
Simon and collaborators also took on a number of other challenges that have cropped up since the mission was proposed, including fewer available plutonium power sources and a re-assessment of Uranus’s rings that revealed hazards in the original flight path. Their work brings the mission closer to the launch pad and illustrates how much iteration goes into the spacecraft that finally takes to the stars.
Citation
“Uranus Orbiter and Probe: Mission Challenges and Concept Updates Since the Origins, Worlds, and Life Decadal Survey,” Amy A. Simon et al 2026 Planet Sci. J. 7 143. doi:10.3847/PSJ/ae680c
The post Who Needs Jupiter? appeared first on AAS Nova.
]]>
How early did planets form in the universe? A recent study used simulations to find that planetesimals could have formed significantly earlier than previously thought.
The post Primordial Planetesimals from the Guts of Population III Stars appeared first on AAS Nova.
]]>While previous investigations of planet formation across the universe’s history suggest that planets trickled into the picture, a recent study has found that primordial planetesimals could have formed much earlier from the insides of the first stars in the universe.
First Stars, First Planets?
When the first stars flickered on, the universe was filled with pristine gas, containing only hydrogen, helium, and a little lithium. This gas, though great at making massive stars known as Population III (Pop III) stars, was not yet enriched with the heavy elements necessary for planet formation and, of course, life. Past studies have suggested that planet formation in the universe was gradual, taking several billion years to peak after billions of stars created and spilled the needed metals into the universe. However, local pockets of enriched gas from Pop III stars could have created the right conditions for planet formation earlier in the universe’s history.
Pop III stars burned bright and fast, exploding violently in pair-instability supernovae that completely shredded the progenitor, ejecting over 100 solar masses of metals into their previously pristine surroundings. Cosmological simulations suggest that oxygen from these supernovae could have produced significant water fractions within the dense cores of the supernova remnant. This may have set the stage for planet formation in water-rich disks around subsequent generations of stars as early as 150–200 million years after the Big Bang — does numerical modeling support this planet formation hypothesis?
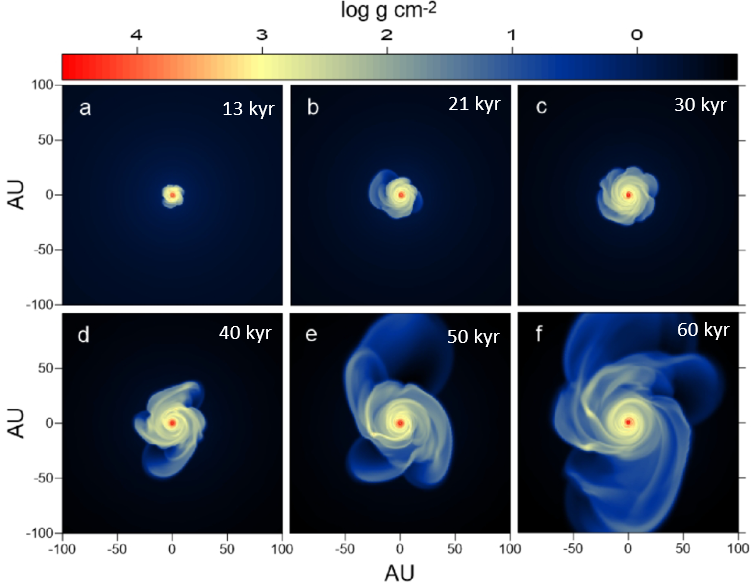
Simulation snapshots showing the formation and evolution of the protoplanetary disk for 13, 21, 30, 40, 50, and 60 thousands of years after protostellar birth. Click to enlarge. [Modified from Vorobyov et al 2026]
Primordial Planetesimals in Simulated Water-Rich Disks
To test if these water-rich dense cores within Pop III supernova remnants could form planetesimals, the building blocks of terrestrial planets, Eduard I. Vorobyov (University of Innsbruck; Southern Federal University) and collaborators performed numerical simulations tracing the collapse of one such gas core into a protoplanetary disk around a protostar. The simulations begin from the gravitational collapse of a 1-solar-mass gas cloud core, with a protostar emerging 24 thousand years after the initial cloud collapse. As the protostar’s gravity pulled in material from its surroundings, a rotating disk formed around the growing star.
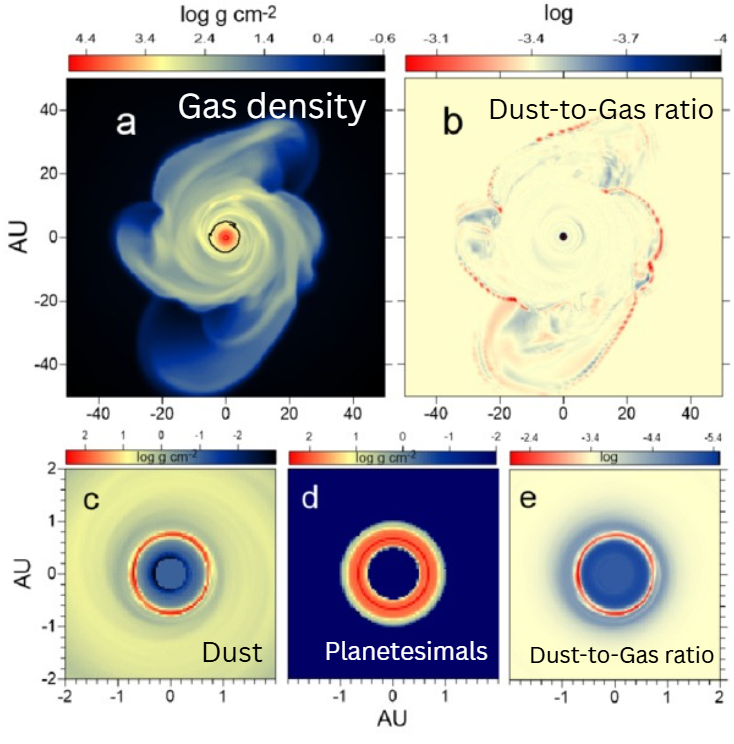
Simulation snapshot 40 thousand years after the formation of the protostar showing the gas, dust, and planetesimal surface densities and the dust-to-gas ratio. Click to enlarge. [Modified from Vorobyov et al 2026]
Citation
“Planet Formation at Cosmic Dawn: Planetesimals in H2O-rich Disks around Low-mass Stars,” Eduard I. Vorobyov et al 2026 ApJL 1007 L51. doi:10.3847/2041-8213/ae907c
The post Primordial Planetesimals from the Guts of Population III Stars appeared first on AAS Nova.
]]>
Astrobites reports on JWST observations of dust that has survived being expelled from a galaxy into the circumgalactic medium.
The post Hitchhiking PAHs Caught Catching a Ride on Galactic Winds appeared first on AAS Nova.
]]>Editor’s Note: Astrobites is a graduate-student-run organization that digests astrophysical literature for undergraduate students. As part of the partnership between the AAS and astrobites, we occasionally repost astrobites content here at AAS Nova. We hope you enjoy this post from astrobites; the original can be viewed at astrobites.org.
Title: JWST Discovery of Warm Dust in the Circumgalactic Medium of the Makani Galaxy
Authors: Sylvain Veilleux et al.
First Author’s Institution: University of Maryland
Status: Published in ApJ
The Windy Galaxy
Billions of light-years away lies Makani, a record-breaking galaxy discovered in 2019 by researchers at the Keck Observatory atop Maunakea, Hawaiʻi. The galaxy shows evidence of a large merger event, where two galaxies collided to form a larger galaxy. This event triggered starburst activity, or several waves of intense star formation, that changed the makeup of not just Makani, but the region around it.
There are several processes that can create galactic winds. An active supermassive black hole at the center of the galaxy can slingshot particles out of the galaxy at close to the speed of light, or supernovae leftover from previous starburst activity can help to expel material from the galaxy. Makani, whose name in Hawaiian just so happens to mean “wind,” has both factors contributing to its galactic winds: massive amounts of star formation and a very active black hole in its center.
This contributes to some of the strongest galactic winds discovered to date, stretching approximately 100 kiloparsecs (330,000 light-years) beyond the galaxy, roughly ten times the extent of a typical galactic wind. These galactic winds remove gas from the galaxy and help to enrich the circumgalactic medium around the galaxy. There is still much to discover about how galactic winds change the makeup of such galaxies, and what exactly they take with them on their way out.
Earth’s Favorite Carcinogen: Polycyclic Aromatic Hydrocarbons
Polycyclic aromatic hydrocarbons (PAHs, pronounced P-A-Hs or “paws”) are small flat dust grains scattered into every corner of the universe, from the atmosphere of Earth in the form of exhaust and wildfire smoke to the circumgalactic medium (the mostly empty space between galaxies). These PAHs contribute to regulating the temperature of the interstellar medium, but astronomers have long wondered how they migrate across galaxies.
Even though they are smaller than a human hair, PAHs are still easily observable even in very distant galaxies. These dust grains emit infrared light, and if there are enough PAHs in a region, they are bright enough to be observed with modern telescopes, such as JWST. By combining multiple observations across multiple filters, astronomers can calculate ratios that reveal information about the PAHs’ size, temperature, and charge, allowing reserachers to further discern properties about the regions in which these PAHs reside.
With redshifted galaxies like Makani, the light from PAHs is stretched beyond its usual wavelength, but fortunately for today’s authors, the light was stretched just enough to land known PAH features well within JWST filters, as seen in Figure 1. The authors were then able to use this information to track the distribution of these PAHs across Makani.
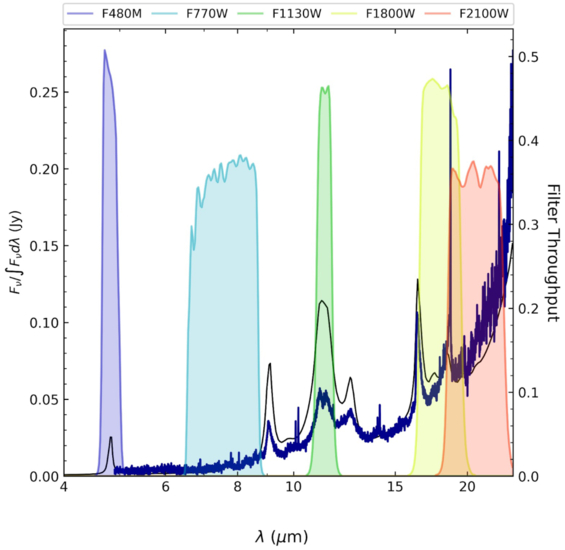
Figure 1: Makani’s spectrum overlaid on top of the JWST filters. The peaks in the spectrum are PAH features that neatly overlap with JWST’s observing bands. [Veilleux et al. 2025]
PAHs Gone Extragalactic
Using JWST, the authors scrutinized Makani for any signs of PAHs. They found that not only did PAHs exist within the galaxy, these molecules were found up to 30 kpc (~100,000 light-years) outside the galaxy. Makani’s strong galactic winds were ejecting the dust grains from the galaxy over an estimated timescale of a billion years.
Previously, astronomers had not expected to find high quantities of dust grains outside the protection of a galaxy. The journey across a galaxy is long and hot, with temperatures in the millions of degrees. A dust grain would likely not survive the trip, as it would be destroyed by high-energy photons. This suggests that the PAHs were somehow shielded from the hotter parts of the interstellar medium and circumgalactic medium in large enough volumes to make it beyond the edge of Makani.
This answered questions about how galaxies enrich the circumgalactic medium, but it also added several more. Since today’s authors were limited by the sensitivity and range of their instruments, they were unable to confirm if there were PAHs along Makani’s entire wind structure, or just the first 35 kpc (114,000 light-years) of it. They also would like to turn their sights towards the intergalactic medium to see if PAHs could make it even farther beyond the reach of their host galaxy.
Original astrobite edited by Chloe Klare.
About the author, Natalie Price:
As a first-year master’s student at Wesleyan University, I study how stellar winds interact with the local interstellar medium. Outside of the observatory, you can find me dancing, with my nose in a book, or running at non-relativistic speeds.
The post Hitchhiking PAHs Caught Catching a Ride on Galactic Winds appeared first on AAS Nova.
]]>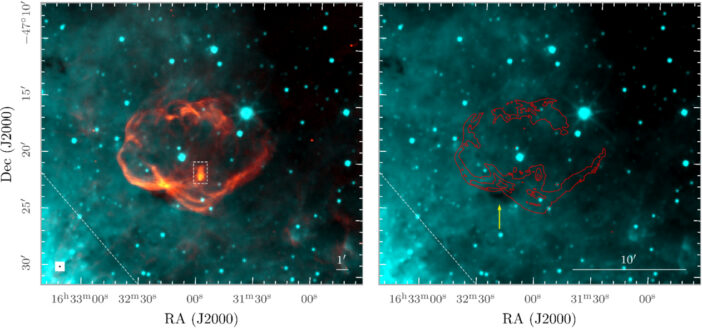
Researchers have discovered a comet-shaped nebula surrounding a pulsar speeding through the remains of its progenitor star.
The post Featured Image: A Pulsar in a Nebula in a Supernova Remnant appeared first on AAS Nova.
]]>When a massive star collapses, the subsequent supernova can leave behind the star’s condensed core in the form of a neutron star. Some neutron stars are also pulsars, which rotate at incredible speeds, emit beamed radio emission, and expel winds of charged particles. A pulsar’s relativistic charged-particle winds billow around the pulsar as it travels through space — often at a few hundreds of kilometers per second or faster, having received a “kick” when its progenitor star exploded. When these winds interact with the surrounding supernova ejecta or the interstellar medium, the interaction creates a detectable pulsar wind nebula. The image above combines data from the Australian Square Kilometre Array Pathfinder (orange) and Wide-field Infrared Survey Explorer (cyan) to show a pulsar wind nebula, indicated with a white rectangle, within a larger supernova remnant. Sanja Lazarević (Western Sydney University) and collaborators discovered this pulsar wind nebula, which they’ve named “Thunder” in a nod to the supernova remnant’s moniker, “Nimbus.” The cometary shape of the pulsar wind nebula suggests that the pulsar is moving quickly, traveling outward from the center of the explosion that occurred some 30,000–45,000 years ago. To learn more about the discovery and characterization of this pulsar wind nebula, check out the article linked below.
Citation
“EMU Discovery of Thunder: A Bow-Shock PWN Powered by PSR J1631–4722 Escaping the Nimbus SNR (G336.7+0.5),” S. Lazarević et al 2026 ApJ 1007 159. doi:10.3847/1538-4357/ae7f11
The post Featured Image: A Pulsar in a Nebula in a Supernova Remnant appeared first on AAS Nova.
]]>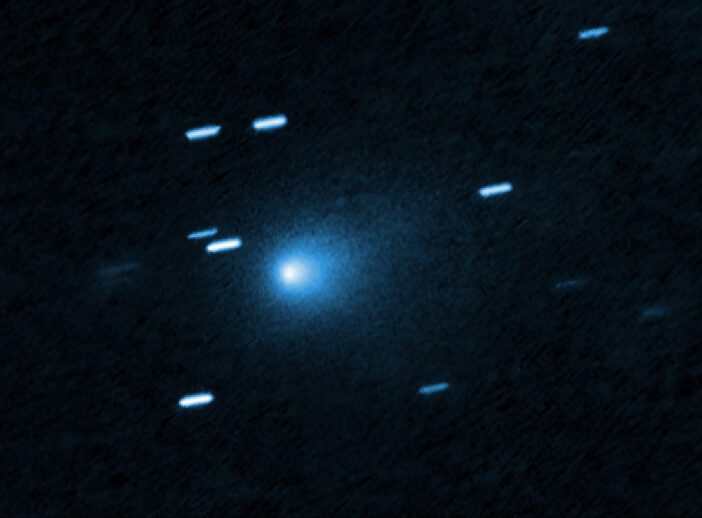
JWST observations of the most recent interstellar visitor reveal a coma dominated not by water, as expected for solar system comets, but instead carbon monoxide.
The post An Interstellar Comet’s Coma Composition appeared first on AAS Nova.
]]>Astronomers have been measuring comets for centuries. But in December of last year, researchers collected a unique set of comet observations: they recorded some of the highest-quality data of one of the weirdest known comets while it was far from the Sun.
Simultaneous Spectra and Images
A few months after the famous interstellar comet 3I/ATLAS rounded the Sun and began its journey back into the space between the stars, a group of astronomers led by Nathan Roth (NASA Goddard Space Flight Center) aimed JWST in the direction of its retreat to watch it fade away. Using a special observing mode that leveraged the Integral Field Unit (IFU) in JWST’s Near Infrared Spectrometer, these observations didn’t result in just a single image of the comet, but a full stack of images, each corresponding to a different wavelength of light.
Using the IFU allowed the observers to combine the best of both regular imaging, which reveals spatial structure, and standard spectroscopy, which reveals wavelength dependencies. As a result, they could make spatially resolved maps of how the emission from the comet’s fuzzy atmosphere of gas and dust, or coma, changed with distance from the comet’s icy nucleus and angle to the Sun. Since different molecules radiate at different wavelengths, these maps in turn reveal the composition and geometry of 3I/ATLAS’s coma.
Mapping the Coma
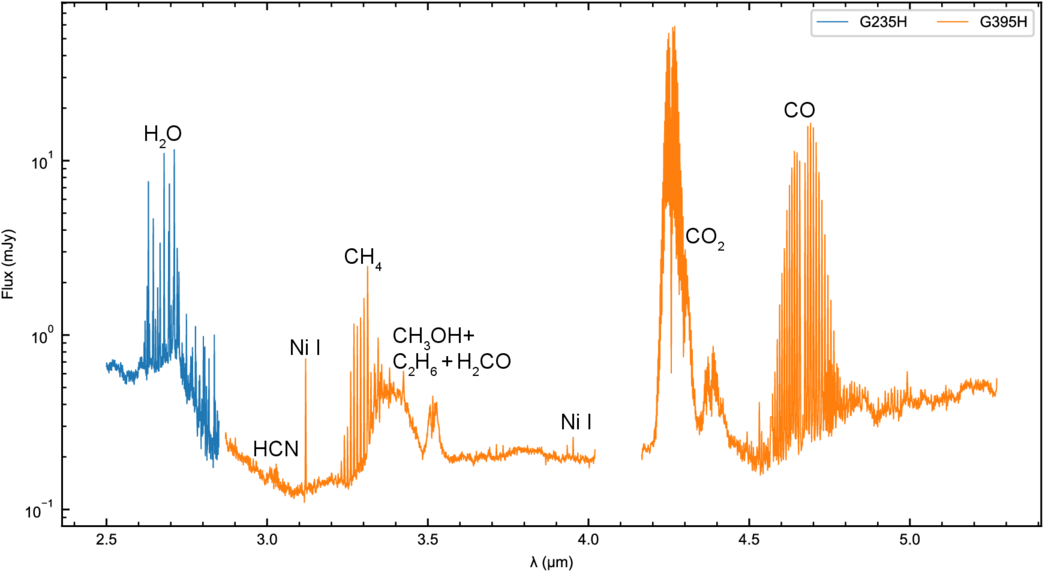
The spectrum of the coma of 3I/ATLAS. Note that this is a real spectrum, not a simulation. The contributions of various molecules are labeled alongside their most prominent emission lines. Click to enlarge. [Roth et al. 2026]
First, in contrast with normal solar system comets where water is the most abundant molecule, water was actually a secondary player here: there was significantly more carbon monoxide, or CO, than water in 3I/ATLAS’s coma. The researchers note that this might not be representative of the true distribution of the two species, but instead be the result of the timing of these observations. When observing a standard solar system comet, astronomers usually examine their targets when the object in question is within 2 au of the Sun. At these close distances, solar radiation is strong enough that water ice dominates the outgassing and activity in a coma.
However, these IFU measurements were taken when 3I/ATLAS was about 2.4 au from the Sun, or right in the transition region where water doesn’t sublimate as easily as CO or carbon dioxide (CO2). It’s likely that as the comet approaches the so-called “ice line” where water will naturally freeze out, CO will only increase its domination of the coma.
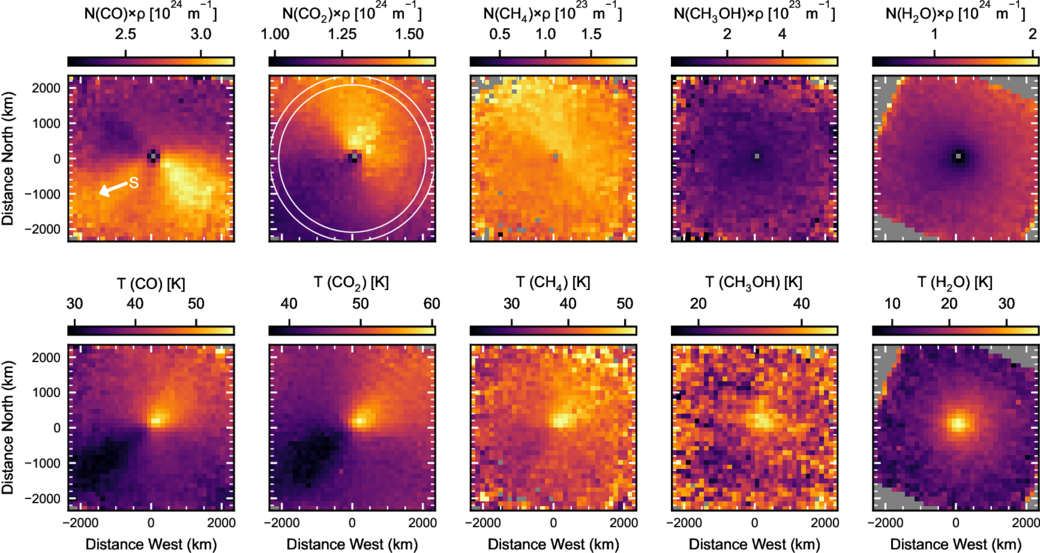
Top row: Maps of the distribution of various molecules in the coma. The white arrow shows the direction toward the Sun. Bottom row: The spatial distribution of the temperature of each species. Click to enlarge. [Roth et al. 2026]
Every Molecule for Itself
Second, each molecule seemed to be outgassing in its own unique direction from the coma. CO is leaving the nucleus in two different jets, one aimed directly back at the Sun and one perpendicular to it; CO2 and methane (CH4) are both leaking away in the anti-Sun direction; and water and methanol (CH3OH) are sublimating in nearly spherically symmetric shells. The authors speculate that these geometries may be caused by different “active sites” on the comet, and that had they observed the comet for one full rotational period, they might have seen these jets pointing in different directions.
Although 3I/ATLAS is now too far and faint for observations like these, this study reveals just how much we can learn in the brief time interstellar visitors spend in our solar system. When the fourth interstellar comet inevitably wanders through the inner solar system, astronomers will doubtless be ready to use this observing mode again.
Citation
The post An Interstellar Comet’s Coma Composition appeared first on AAS Nova.
]]>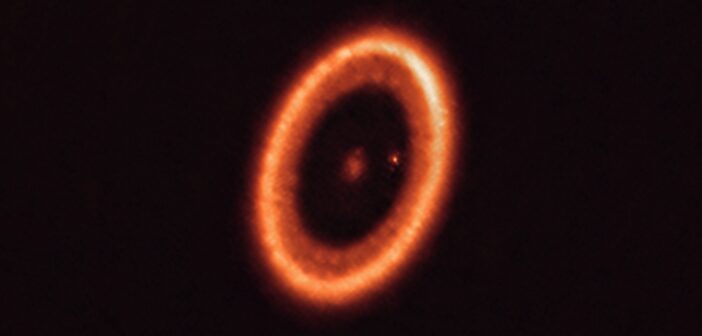
PDS 70c is the first exoplanet known to host a circumplanetary disk, where moons are potentially forming.
The post Probing Dust in the Disk of a Growing Giant Planet appeared first on AAS Nova.
]]>New research suggests that the circumplanetary disk surrounding the exoplanet PDS 70c contains a ring of dense dust, and the conditions within this ring may allow baby moons to form.
A Disk Within a Disk
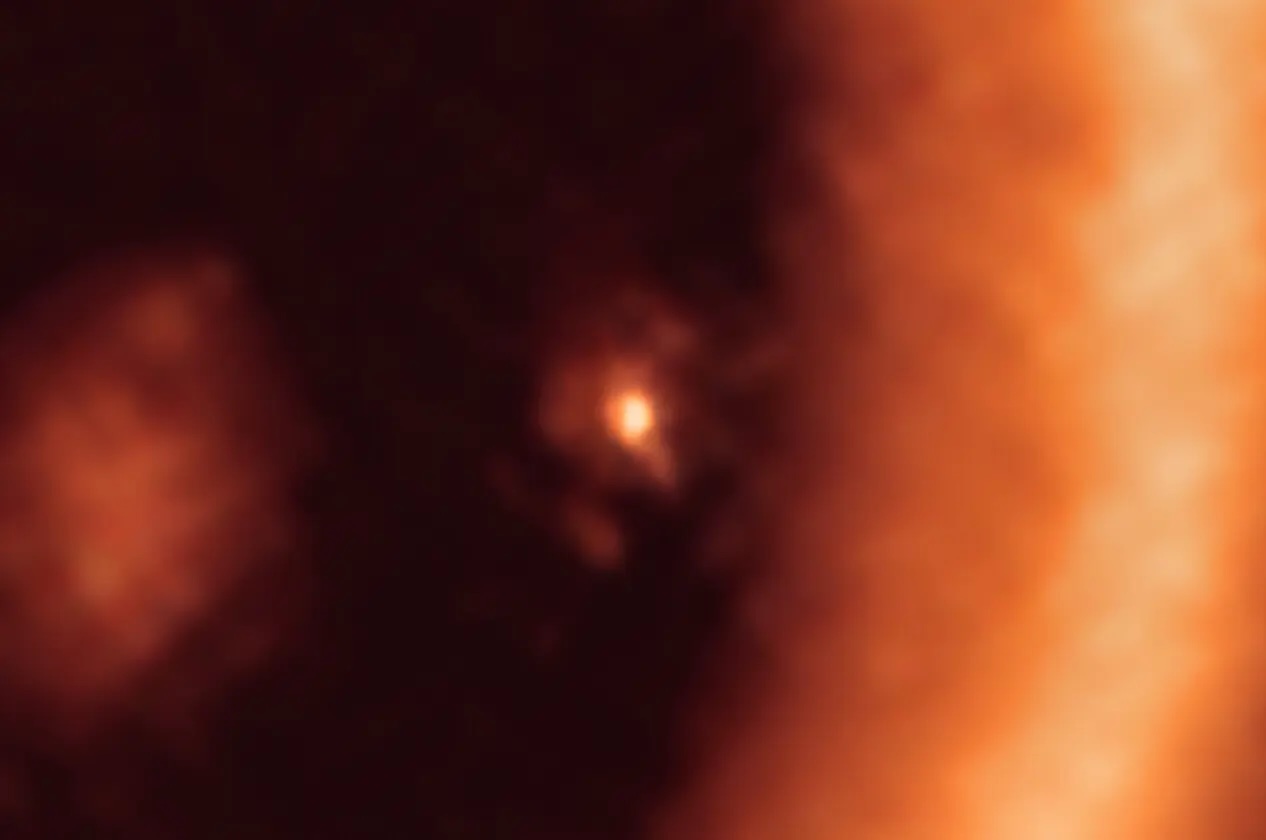
A closeup of PDS 70c’s circumplanetary disk within PDS 70’s protoplanetary disk. [ALMA (ESO/NAOJ/NRAO)/Benisty et al.; CC BY 4.0]
There’s still debate over the exact source of the emission detected by ALMA. Does this emission come from dust, and if so, how is the dust distributed? Is the disk optically thick or optically thin? Does the emission even come from dust, or could it instead be free–free emission from unbound electrons navigating a charged-particle maze?
Dust Diagnosis
Yuhito Shibaike (Kagoshima University) and collaborators recently examined the hypothesis that the emission from PDS 70c’s circumplanetary disk arises from dust distributed in an optically thick ring. To test this hypothesis, the team explored two possible dust distributions, which they call “drift” and “ring.” In the drift model, dust grains within the circumplanetary disk migrate inward toward the planet, leaving much of the disk optically thin. Modeling suggests that this migration is typical in protoplanetary disks, and it might be common in circumplanetary disks as well.
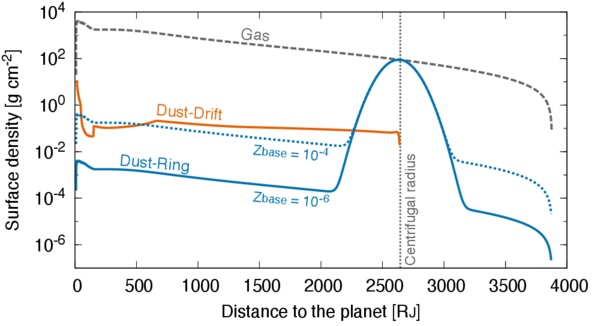
Dust and gas surface density for the modeled disks in the drift (orange) and ring (blue) models. Click to enlarge. [Adapted from Shibaike et al. 2026]
Shibaike and coauthors found that the ring model naturally reproduced the observed spectral energy distribution for a range of reasonable parameters. The drift model, on the other hand, required an unrealistically high dust-to-gas ratio for the material accreted onto the circumplanetary disk from the parent protoplanetary disk to reproduce the observed spectral index.
Future Prospects and Moon-Making Possibilities
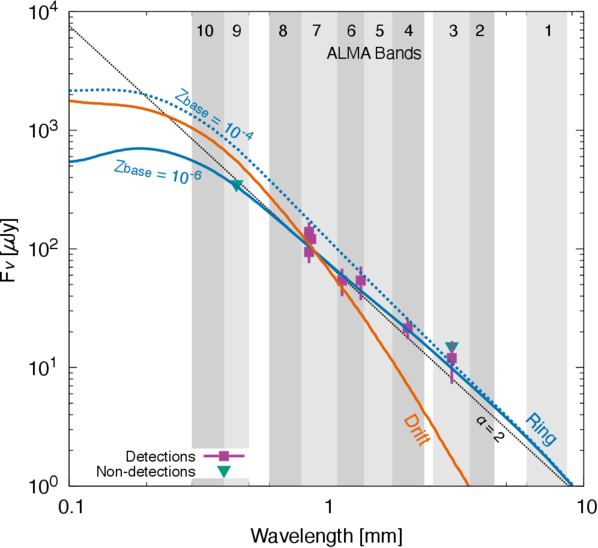
Comparison of ALMA observations (colored symbols) and model predictions (colored lines) from the drift (orange) and ring (blue) models. Click to enlarge. [Adapted from Shibaike et al. 2026]
Luckily, this likely won’t remain a mystery forever: the next-generation Very Large Array, which is anticipated to begin full science operations in the mid-2030s, should be able to resolve the location of the dust within the circumplanetary disk and illuminate the source of emission.
Finally, if the dust surrounding PDS 70c is concentrated within a ring, what does that mean for the possibility of moons forming within the disk? Shibaike and collaborators found that the conditions within the ring likely satisfy the requirements of both the streaming instability and the gravitational instability, which are required for dust grains to clump together and form the rocky building blocks of baby moons. Perhaps the PDS 70 system will one day be the site of not only a circumplanetary disk, but an exomoon as well!
Citation
“Interpreting ALMA Multiwavelength Continuum Observations of PDS 70 c: An Optically Thick Dust Ring in the Circumplanetary Disk,” Yuhito Shibaike et al 2026 ApJL 1006 L26. doi:10.3847/2041-8213/ae86f5
The post Probing Dust in the Disk of a Growing Giant Planet appeared first on AAS Nova.
]]>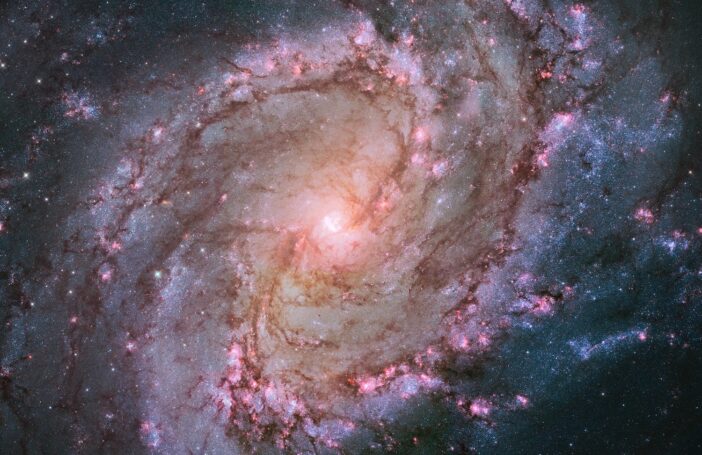
Astrobites reports on whether our methods for weighing galaxies can help save cosmology from JWST’s universe-breaking galaxies.
The post Galaxies of Many Colors appeared first on AAS Nova.
]]>Editor’s Note: Astrobites is a graduate-student-run organization that digests astrophysical literature for undergraduate students. As part of the partnership between the AAS and astrobites, we occasionally repost astrobites content here at AAS Nova. We hope you enjoy this post from astrobites; the original can be viewed at astrobites.org.
Title: Unbreaking the Universe: MINERVA Measurements of Color Gradients in Massive Quiescent Galaxies Can Help Ease Too-Early Star Formation Tensions
Authors: Sam E. Cutler et al.
First Author’s Institution: Tufts University
Status: Published in ApJL
Universe Breakers
JWST launched in 2021, and one of its key goals was to observe the first galaxies as they formed. Early results from JWST found something surprising: extremely massive galaxies in the early universe that had “quenched,” or stopped making new stars, much faster than was expected. These early results led some to believe that our understanding of how quickly massive galaxies can form and quench was fundamentally wrong.
Before concluding that our understanding of the universe is broken, it’s important to find other reasons why we might see very massive galaxies in the early universe. One theory is that these galaxies are actually less massive than we think. To “weigh” a galaxy, astronomers first measure the amount of light being emitted by that galaxy. If all the light in a galaxy comes from stars (which should be true in the early universe, though active black holes can contribute a lot of light in some galaxies), you can infer the total number of stars by accounting for the average amount of light emitted per star of a certain mass; this is called the “mass-to-light ratio.” Since massive stars emit a lot more light than low-mass stars, and high-mass stars die out faster than low-mass stars, the mass-to-light ratio is higher for older stellar populations. To accurately “weigh” a galaxy, scientists therefore need both a good measurement of the total amount of light in the galaxy and how old its stellar population is. The authors of today’s article suggest that the uncertainty in these measurements might be leading to overestimates of galaxy masses and underestimates of galaxy star formation rates, possibly explaining the existence of the earliest massive quiescent (non-star-forming) galaxies.
The Impact of Color Gradients
Previous works about the massive quiescent galaxies in this study used spectroscopy to determine the galaxies’ masses and star formation rates. These spectra were taken with a “slit,” which introduces a source of error: if the slit is smaller than the image of the galaxy, some of the galaxy’s light will be missed in the spectrum. Astronomers usually correct for this by checking how much of the total light of a galaxy image is covered by the slit and scaling up the spectrum to account for the missing light, but this correction assumes that the spectrum is basically the same across the entire galaxy.
However, this assumption is rarely correct. In the local universe, star-forming spiral galaxies like the Milky Way tend to be made of a central “bulge” surrounded by a “disk” (see Figure 1). The bulge is no longer actively forming new stars, leading to a red-to-blue color gradient as you move out from the center of the galaxy. In astronomy, this is considered a “negative” color gradient. A slit that only covers the galaxy center would lead to an overall overestimate of the stellar mass and underestimate of the star formation rate. If the galaxies instead had a positive color gradient, with more star formation in the center of the galaxy, the mass would be underestimated and the star formation rate would be overestimated. Galaxies with both positive and negative color gradients have been found in the distant universe. By measuring the color gradient for each individual galaxy in their sample, the authors can correct the mass and star formation rate calculations from spectra taken with a slit spectrograph.
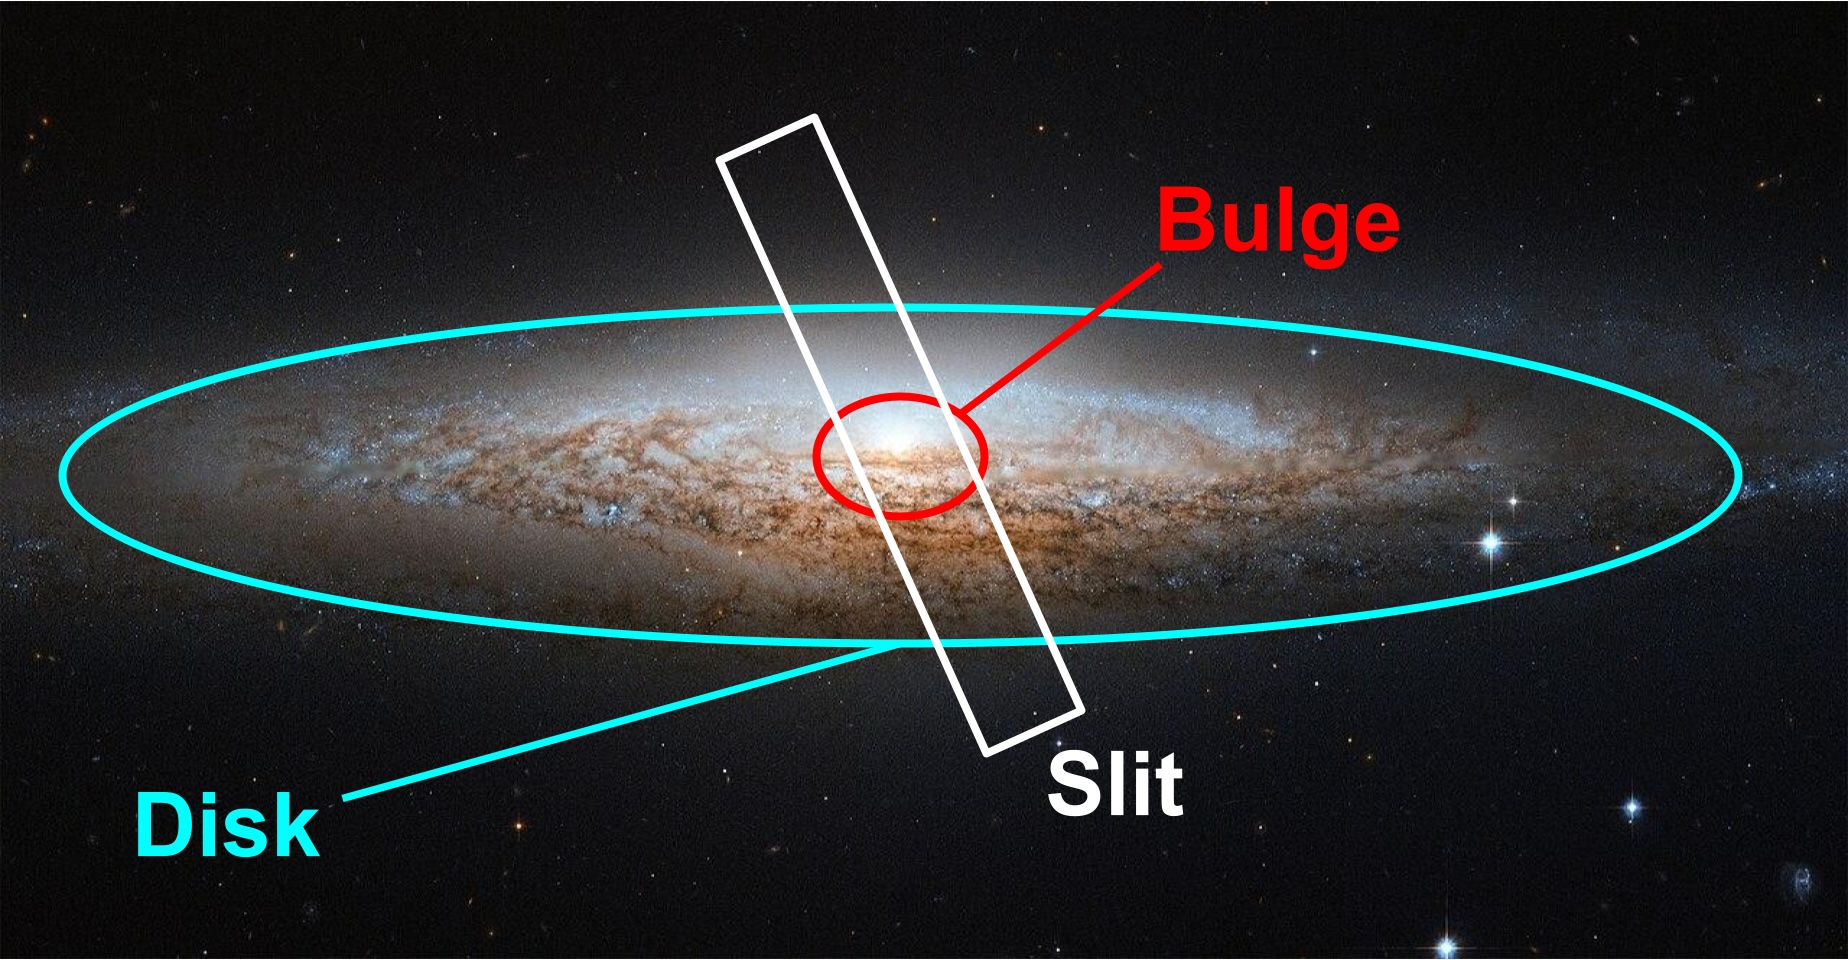
Figure 1: The spiral galaxy NGC 2683 with its bulge and disk labeled. The inner part of the galaxy (“bulge”) contains older, redder stars; the outer part of the galaxy (“disk”) contains bright blue stars that indicate that star formation is ongoing. Here, the slit spectrograph only covers the galaxy’s bulge, leading to incorrect mass and star formation rate measurements. [ESA/Hubble & NASA (CC BY 4.0) with annotations by Margaret Verrico]
Results
Instead of using spectra, the authors of today’s article use imaging in different filters to measure color gradients for a sample of four galaxies in the early universe that had previously been found to be extremely massive and no longer forming stars. They use medium-band filters, or filters that let in only a small part of a galaxy’s spectrum, to produce a spectral energy distribution at each radius. This spectral energy distribution is less informative than a spectrum (think a handprint versus a fingerprint), but it’s detailed enough to model the likely stellar population at each radius to determine whether the galaxies have positive, negative, or no color gradients, allowing for better corrections to the properties measured from the galaxies’ centers. They also model the stellar population from the central part of the galaxy that would normally be covered by a slit, as well as from the actual spectrum, to test whether any differences in their results come from their choice of modeling techniques.
The authors find that three of the four galaxies have a negative color gradient in at least some areas. The fourth galaxy has a relatively flat color gradient, though this measurement is less certain due to the object’s redshift. When the authors plot the galaxies’ colors on a diagnostic diagram that separates red and old galaxies from young and blue galaxies, they find that three of the four galaxies have centers that appear red and old but outskirts that appear young and blue (Figure 2). This means previous measurements of the mass may have been overestimated, and previous measurements of the star formation rate may have been underestimated.
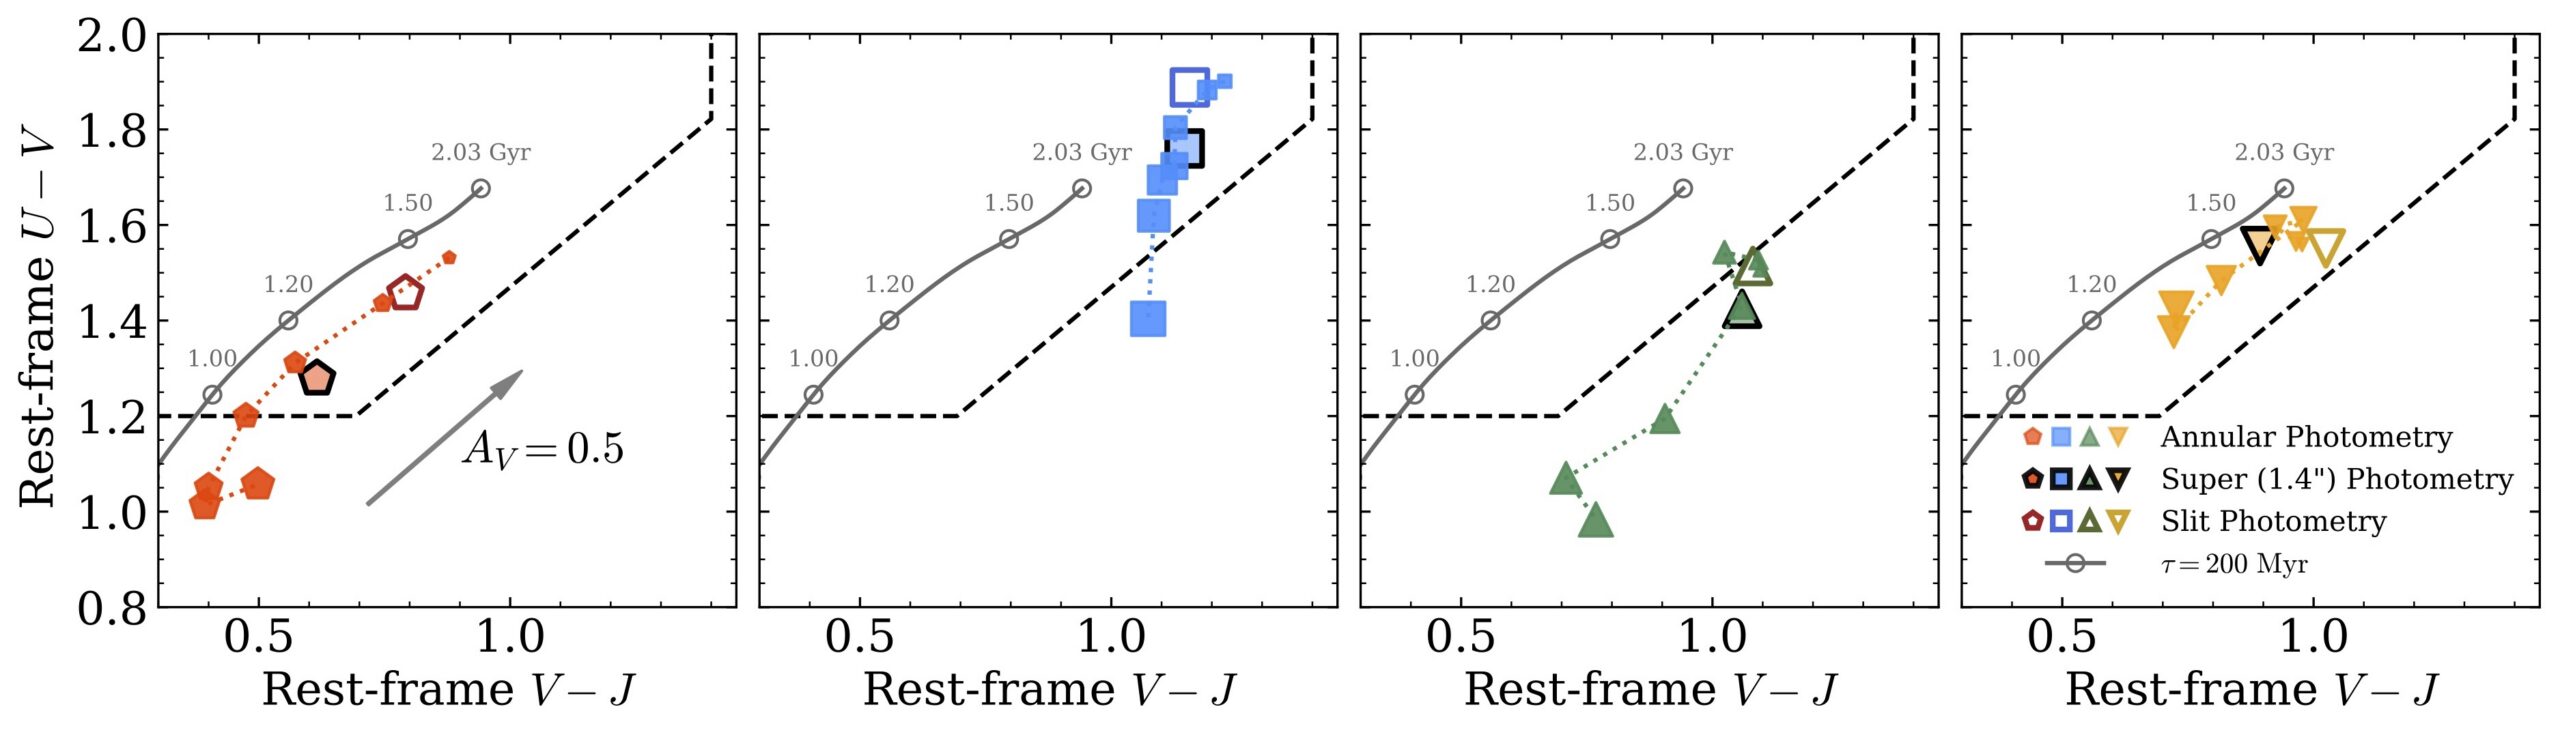
Figure 2: The location of each of the four galaxies on a color–color diagram that separates red galaxies (above/to the left of the dashed lines) from blue galaxies (below/to the right of the dashed lines). The open markers indicate the galaxy color as measured from the center of the galaxy; the filled-in markers show the color at different radii from the galaxy center. For all but one galaxy, the color at several radii is bluer than at the center, indicating that the galaxy might have younger stars at least at some radii. [Adapted from Cutler et al. 2026]
Is the Universe Broken?
To determine whether these galaxies still count as “universe breakers,” the authors use a cosmological model to predict the largest expected galaxy mass in the observed area at different periods in cosmic time. The previous results had less than a 0.3% chance of occurring under current cosmological models; with their updated numbers and stellar population models, the authors find that the observed galaxies sometimes have more than a 5% chance of occurring, though there is still tension. They point out that their analysis ignores processes that could help galaxies grow and quench in the early universe, like galaxy mergers; still, the existence of these massive galaxies with such low star formation rates remains a puzzle.
Original astrobite edited by Ansh Gupta.
About the author, Margaret Verrico:
I am a fourth-year graduate student at the University of Illinois Urbana-Champaign. I study the connection between supermassive black hole transients and their host galaxies. I am also an avid knitter and reader, and I am passionate about opening up STEM opportunities for people of all backgrounds.
The post Galaxies of Many Colors appeared first on AAS Nova.
]]>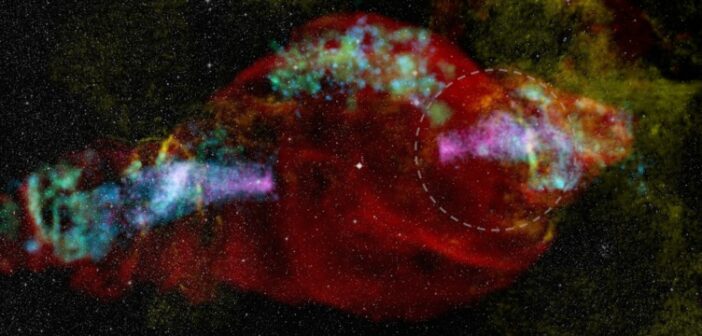
An accreting stellar-mass black hole embedded in a supernova remnant is potentially a powerful cosmic particle accelerator.
The post Featured Image: The Microquasar and the Manatee appeared first on AAS Nova.
]]>The supernova remnant W50 — nicknamed “the Manatee” because its blobby radio emission resembles an aquatic mammal floating through starry waters — harbors an extreme system at its heart. Near the center of the remnant, the microquasar SS 433 exhibits an immense pair of relativistic jets, likely powered by a stellar-mass black hole accreting material from a companion star. In the image of W50/SS 433 above, radio emission is in red, optical light is in yellow, and soft, medium, and hard X-ray emission are in green, cyan, and magenta, respectively. Brydyn Mac Intyre (University of Manitoba) and collaborators focused on the region circled above, using NuSTAR and XMM-Newton to understand the source of the X-ray emission in that region and the potential for SS 433 to accelerate particles to relativistic velocities. These observations suggest that W50/SS 433 accelerates electrons up to energies of more than 100 teraelectronvolts, and it may launch other particles into the highly sought-after petaelectronvolt range. To learn more about the particle-acceleration possibilities in this remarkable region, be sure to check out the full research article linked below.
Citation
“The Western Jet of SS 433/W50: Hard X-Ray Emission, Spectral Evolution, and Comparison to the Eastern Jet,” Brydyn Mac Intyre et al 2026 ApJ 1006 69. doi:10.3847/1538-4357/ae7a47
The post Featured Image: The Microquasar and the Manatee appeared first on AAS Nova.
]]>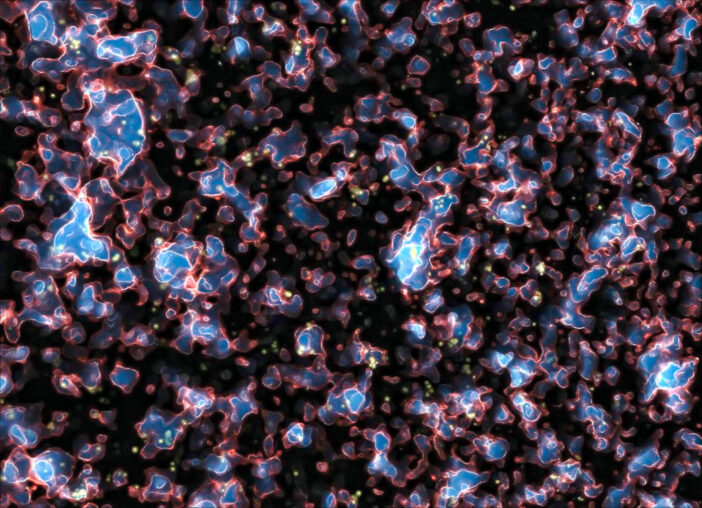
When two galaxies collide, they spark new star formation that can emit tons of powerful radiation. A recent study observes such a system and connects this process to the reionization of the universe.
The post A Lyman-Leaking Galaxy Merger Confirmed with JWST appeared first on AAS Nova.
]]>Exactly how the universe became reionized after cooling to form stars and galaxies remains an open question. A recent study investigates how a merging set of galaxies may have spurred an onslaught of ionizing photons into the intergalactic medium.
Lyman Continuum Leakers and Merging Galaxies
After its chaotic and blistering beginning, the universe cooled and began to coalesce, stars and galaxies flickering on to set the universe alight. From a few hundred million to about a billion years after the Big Bang, galaxies pumped high-energy ionizing Lyman continuum (LyC) photons into the intergalactic medium during what is known as the epoch of reionization. The exact mechanisms that produced and allowed LyC emission to escape galaxies during this era remain elusive.
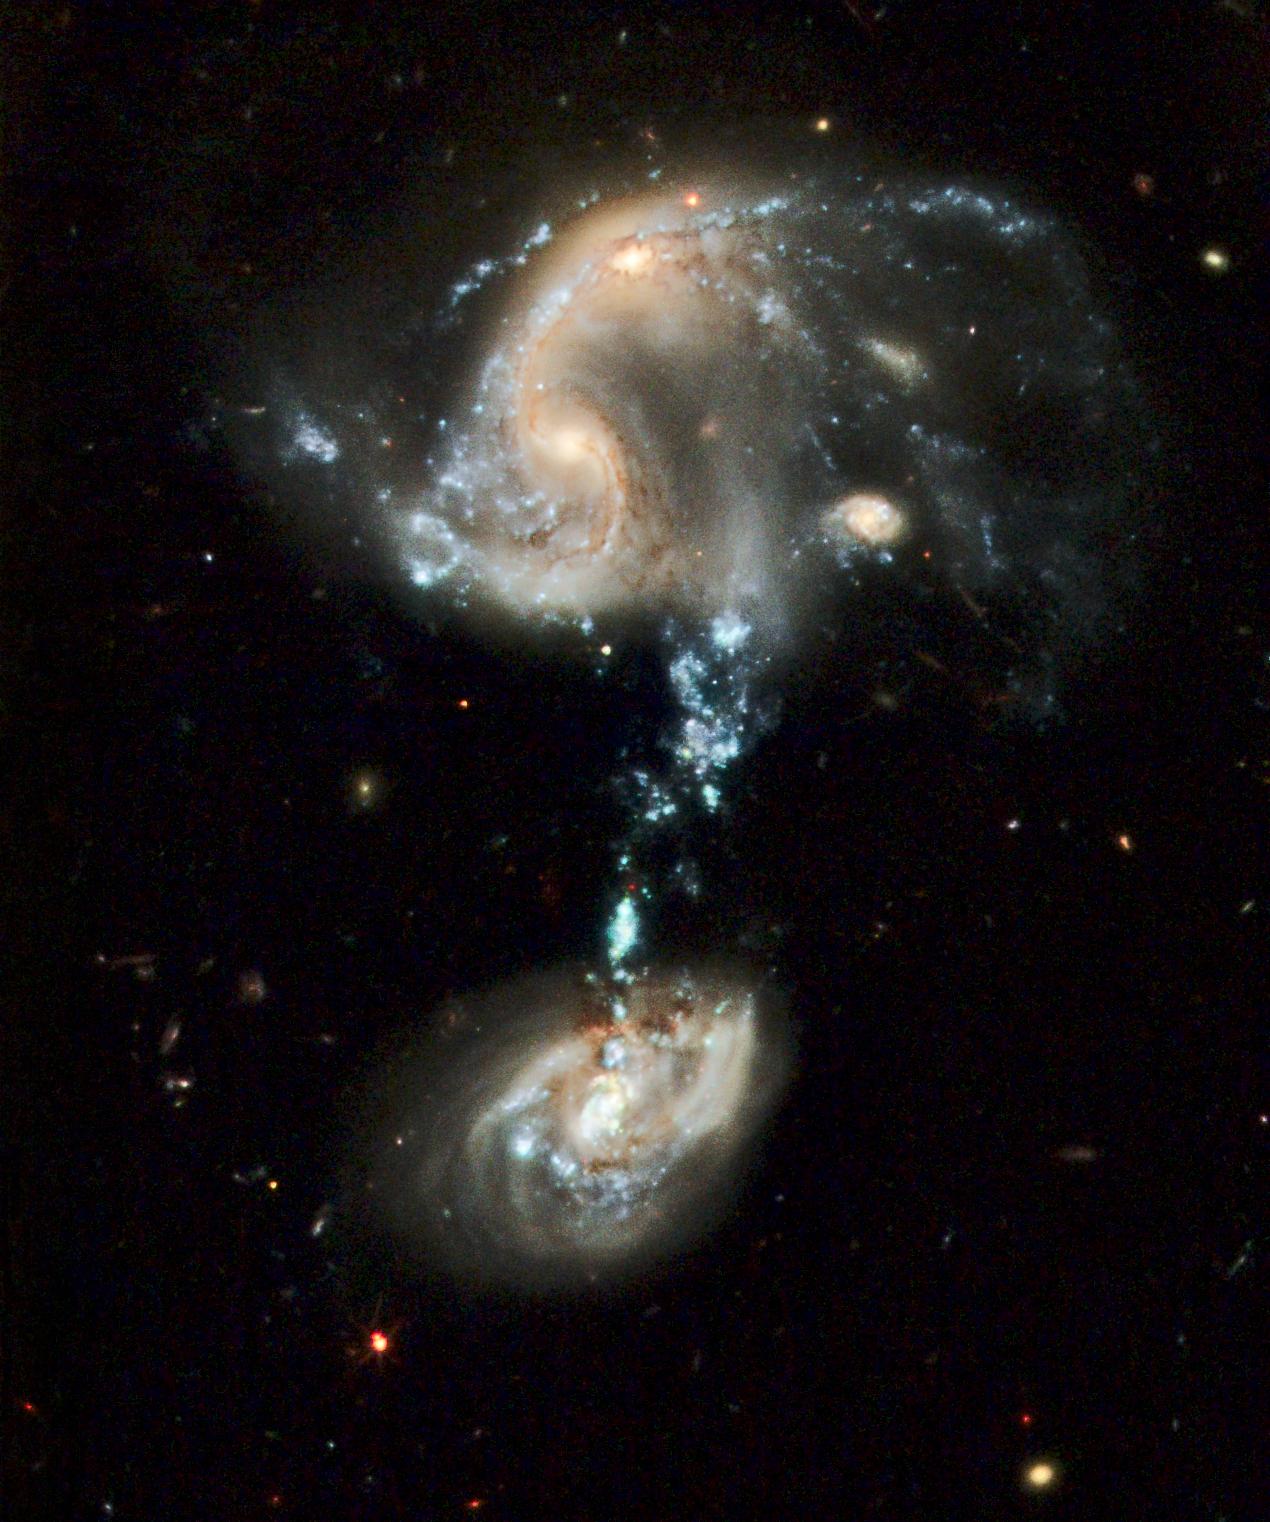
Hubble Space Telescope image of the interacting galaxy group Arp 194. The blue stream connecting the galaxies is where tidally stripped gas formed millions of new stars. [NASA, ESA, and the Hubble Heritage Team (STScI/AURA)]
While observational studies have increasingly pointed to galaxy mergers as considerable drivers of LyC escape, only a small number have explicitly considered the role of mergers in the epoch of reionization due to spectral and spatial resolution limitations. Leveraging the high-resolution capabilities of JWST, Shengzhe Wang (University of Chinese Academy of Sciences; National Astronomical Observatories, Chinese Academy of Sciences) and collaborators performed detailed analyses of two LyC-leaker candidates to better understand the role of galaxy mergers in heating up the universe.
Confirming (and Refuting) Merger-Driven Leaks with JWST
Using candidate LyC leakers first identified in the LymAn Continuum Escape Survey (LACES) carried out with the Hubble Space Telescope, Wang and team obtained high-resolution JWST spectroscopy for two galaxies at redshift z = 3.1 (about 2 billion years after the Big Bang), LACES94460 and LACES104037. After carefully identifying and measuring emission lines in each candidate, the authors confirmed LACES104037 as a merger-driven LyC leaker. However, the apparent LyC emission from LACES94460 was determined to be contamination from a low-redshift object.
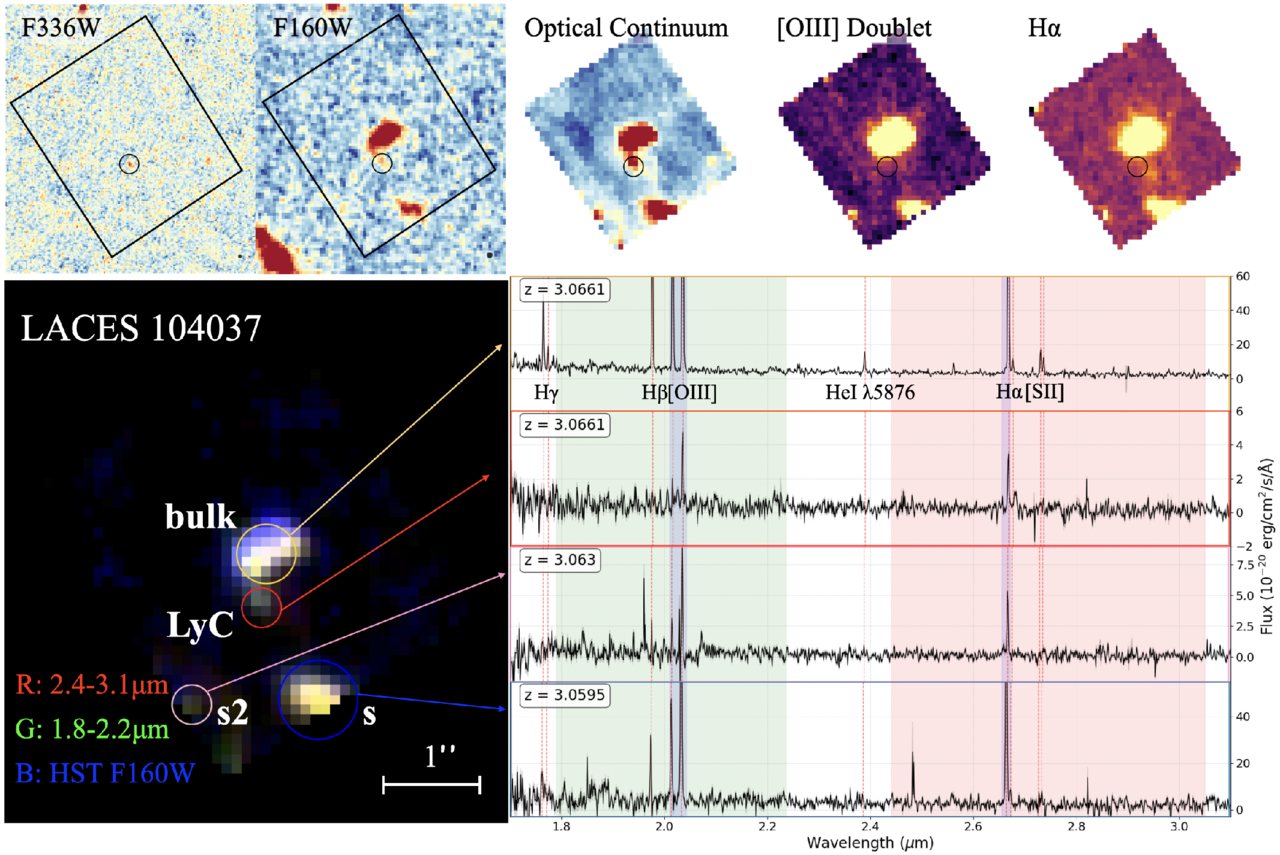
Hubble and JWST observations of LACES104037. The top panels show the Hubble images (first two panels) and the JWST spectral observations (last three panels). The bottom panel shows a composite three-color image marking the location of two primary interacting galaxies and the LyC emission along with the associated spectra. Click to enlarge. [Wang et al 2026]
LACES104037-LyC represents the first confirmed LyC leaker of its kind: an external clump of star formation in a tidal tail. This discovery aids in our understanding of how mergers can drive high-energy photon emission, and highlights the critical role galaxy mergers may play in the epoch of reionization. Future high-resolution observations will hopefully reveal more knots of LyC-leaking stars within merging galaxies and provide a deeper understanding of this important evolutionary phase of the universe.
Citation
“Confirmation and Refutation of Lyman Continuum Leakers at z ~ 3 with JWST NIRSpec IFU,” Shengzhe Wang et al 2026 ApJL 1006 L17. doi:10.3847/2041-8213/ae8523
The post A Lyman-Leaking Galaxy Merger Confirmed with JWST appeared first on AAS Nova.
]]>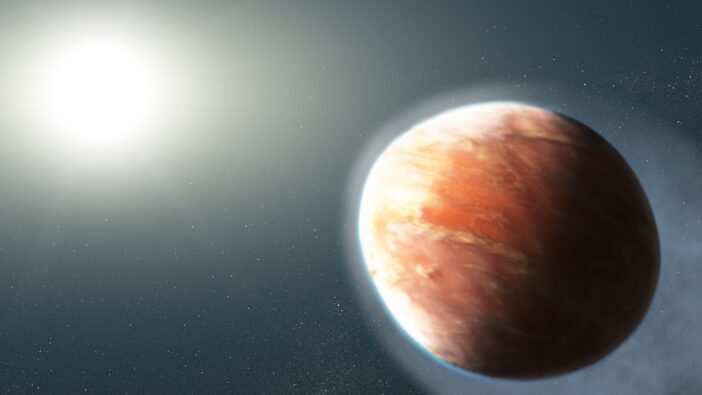
What do the latest JWST data say about the notable ultra-hot Jupiter WASP-121b?
The post Complexities and Mysteries in the Atmosphere of Ultra-Hot Jupiter WASP-121b appeared first on AAS Nova.
]]>Ultra-hot Jupiter WASP-121b is once again puzzling astronomers. New JWST observations have revealed aspects of this superheated planet’s atmosphere that models cannot yet explain.
An Extreme Planet
Among the more than 6,000 known exoplanets, there are many types of worlds that aren’t represented in our solar system. The most exotic and unfamiliar planets might be the ultra-hot Jupiters: giant planets nestled so close to their host stars that they are tidally locked, with temperatures on their permanently starlit sides climbing to thousands of degrees.
WASP-121b, which circles its F-dwarf host star every 30.5 hours, is one of the best-studied ultra-hot Jupiters. Previous work has started to reveal the complexity of its atmosphere, and now, data from JWST have opened a new window onto WASP-121b’s behavior.
New View from JWST
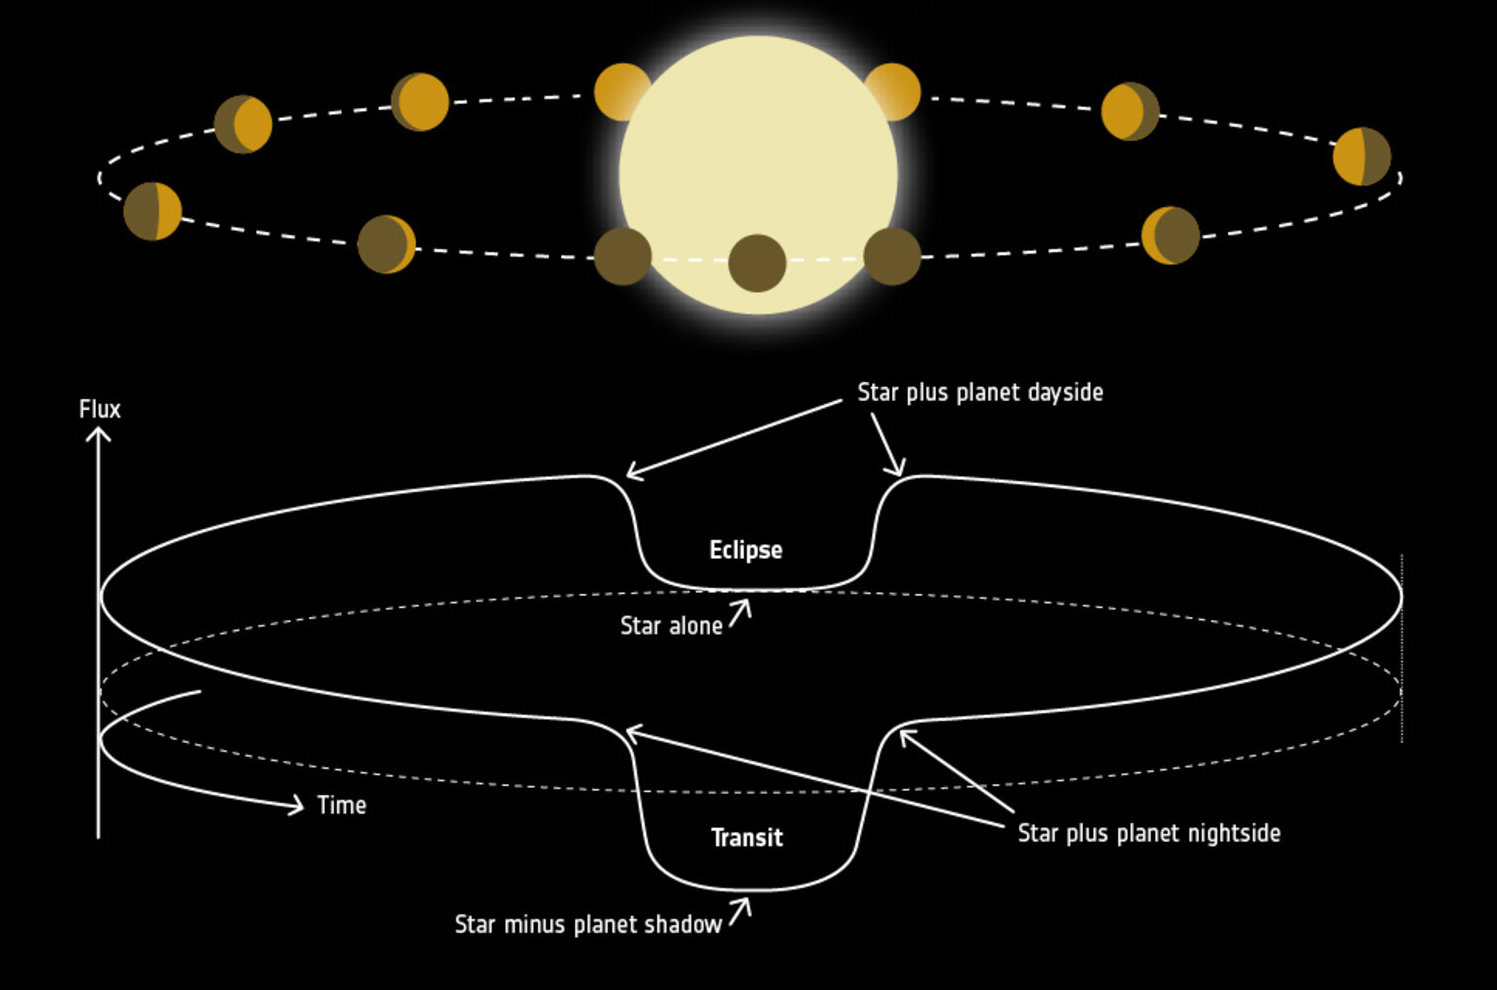
A representation of an exoplanet’s phase curve. Click to enlarge. [ESA]
The team used two 3D general circulation models to predict the planet’s atmospheric structure and extract synthetic spectra and phase curves to compare against the JWST observations. Using nine model configurations in total, the team varied several inputs, including sources of atmospheric opacity, sources of atmospheric drag, and assumptions about whether clouds are able to form on the planet’s cooler nightside.
Left with a Mystery
Frazier and collaborators found two aspects of WASP-121b’s phase curve that their models couldn’t explain: the planet emits less light overall than predicted, and the location of its phase-curve offset changes with wavelength.
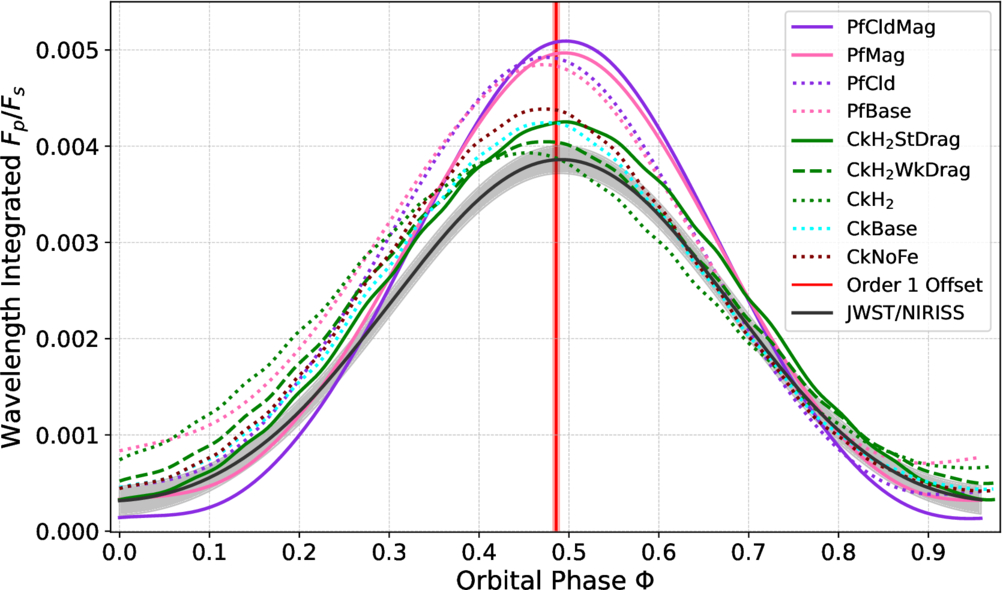
Modeled phase curves, shown as the flux of the planet divided by the flux of the star, for WASP-121b (colored solid and dotted lines) compared to the best fit to the JWST observations (black line). Click to enlarge. [Frazier et al. 2026]
The phase-curve offset is the difference between a planet’s sub-stellar point (where the star is directly overhead) and the brightest point in the planet’s atmosphere. In general, some degree of offset is expected because planetary winds tend to whisk heat away from the sub-stellar point, placing the brightest point somewhere to the east (usually). For WASP-121b, the offset is unexpectedly small — suggesting a source of drag in the atmosphere that prevents winds from transporting heat away from the sub-stellar point — and it’s larger at shorter wavelengths. This wavelength dependence isn’t predicted by any of the models, and it’s not clear what causes it.
These results demonstrate something remarkable: that our observations of a planet nearly 900 light-years away have become so precise that they’re pushing our already complex models to include more physics — an exceptionally exciting motivation for model improvement!
Citation
“The Days Drag On on WASP-121 b: Interpreting Its NIRISS Spectroscopic Phase Curve with General Circulation Models,” Robert C. Frazier et al 2026 ApJ 1004 102. doi:10.3847/1538-4357/ae69ca
The post Complexities and Mysteries in the Atmosphere of Ultra-Hot Jupiter WASP-121b appeared first on AAS Nova.
]]>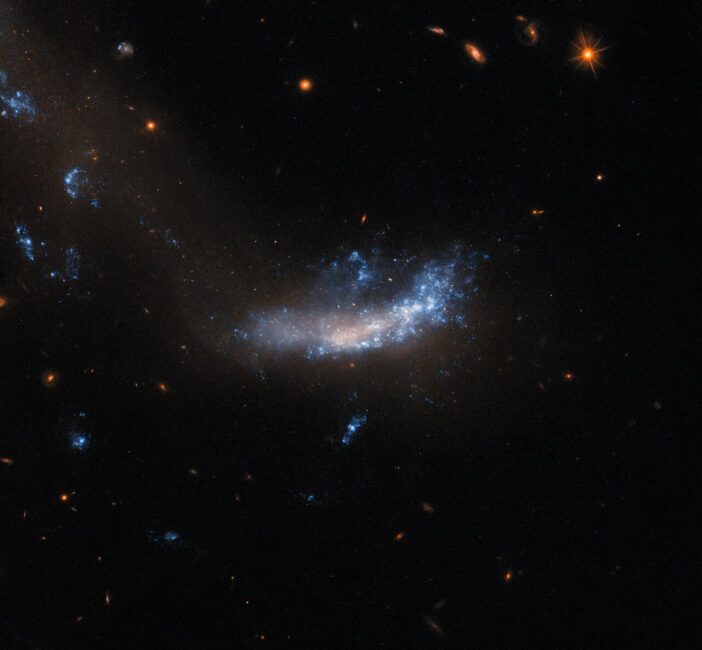
A supernova discovered in 2010 appears to have created tens of thousands of Earth masses of dust.
The post A Seriously Dusty Supernova appeared first on AAS Nova.
]]>In 2010, the supernova SN 2010jl illuminated a corner of a small, irregular galaxy 150 million light-years away. More than a decade later, researchers have found evidence that this collapsing massive star has created a significant amount of cosmic dust.
Superluminous Supernova
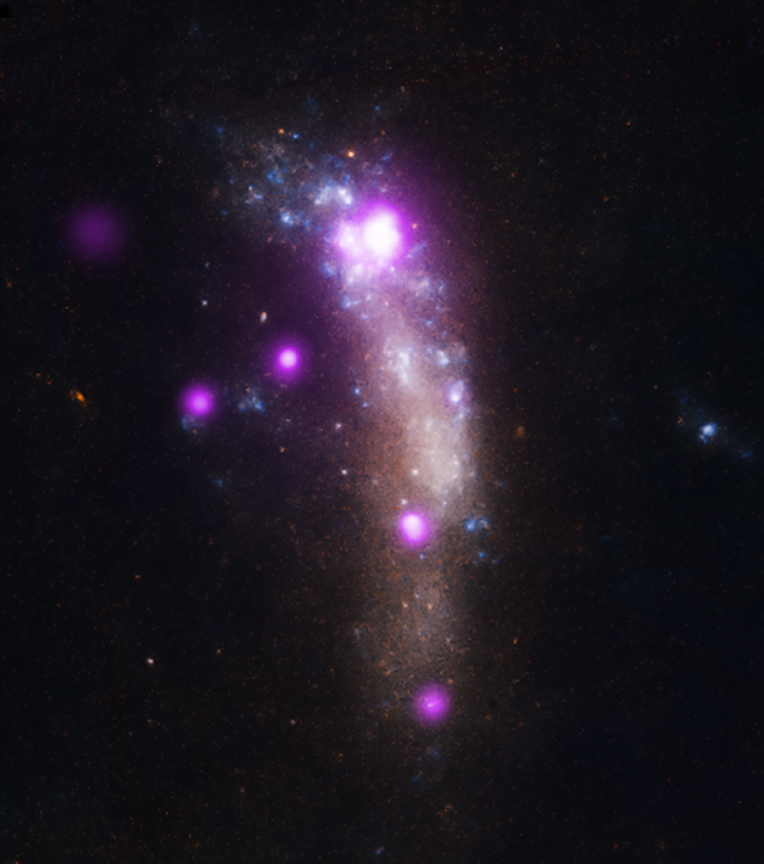
This X-ray and optical image shows SN 2010jl in its host galaxy. The supernova is the brightest X-ray source, near the top of the galaxy. [X-ray: NASA/CXC/Royal Military College of Canada/P.Chandra et al); Optical: NASA/STScI]
SN 2010jl offers an excellent chance to study the dust-forming potential of core-collapse supernovae. This supernova was unusually luminous because of intense interactions between the expanding supernova shock and the dense material surrounding the exploding star, and it’s possible that these types of interactions spur the creation of dust. In the first few years after the supernova was discovered, researchers found evidence that it had produced new dust. What has it been up to since?
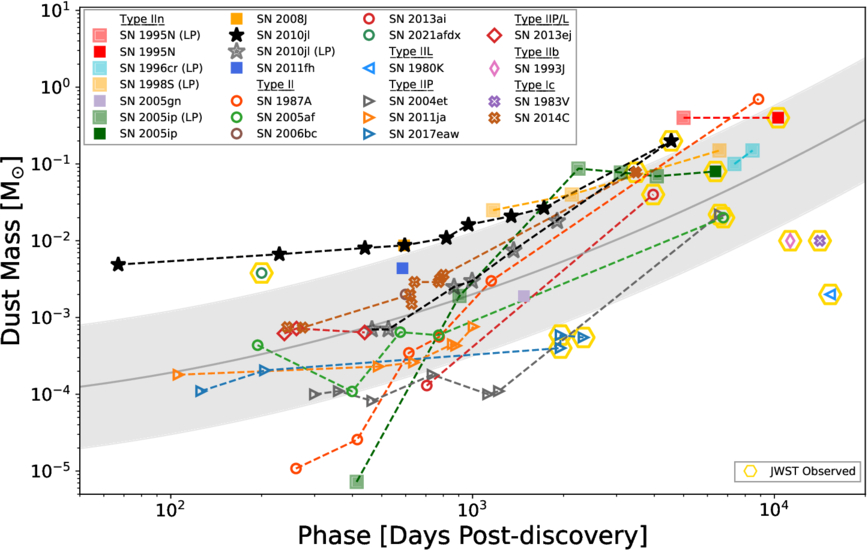
SN 2010jl’s inferred dust mass over time (black stars) compared to other supernovae. Click to enlarge. [Smith et al. 2026]
Checking Back In
Thirteen years after SN 2010jl was discovered, Nathan Smith (Steward Observatory) and collaborators checked in on its dust production. The team collected new ground-based optical spectra from the Keck I telescope and the MMT Observatory and mid-infrared spectra from JWST. The optical spectra — among the latest collected for any superluminous supernova — show numerous narrow emission lines that indicate that the expanding supernova continues to interact with its surroundings.
In the JWST observations, SN 2010jl is the brightest mid-infrared point source in its host galaxy. Through spectral energy distribution modeling, Smith and coauthors found that the brilliant infrared emission is likely due to a shroud of warm dust totaling roughly 20% of the mass of the Sun. This is about 80 times more dust than inferred from observations made a decade earlier.
Where’s the Dust?
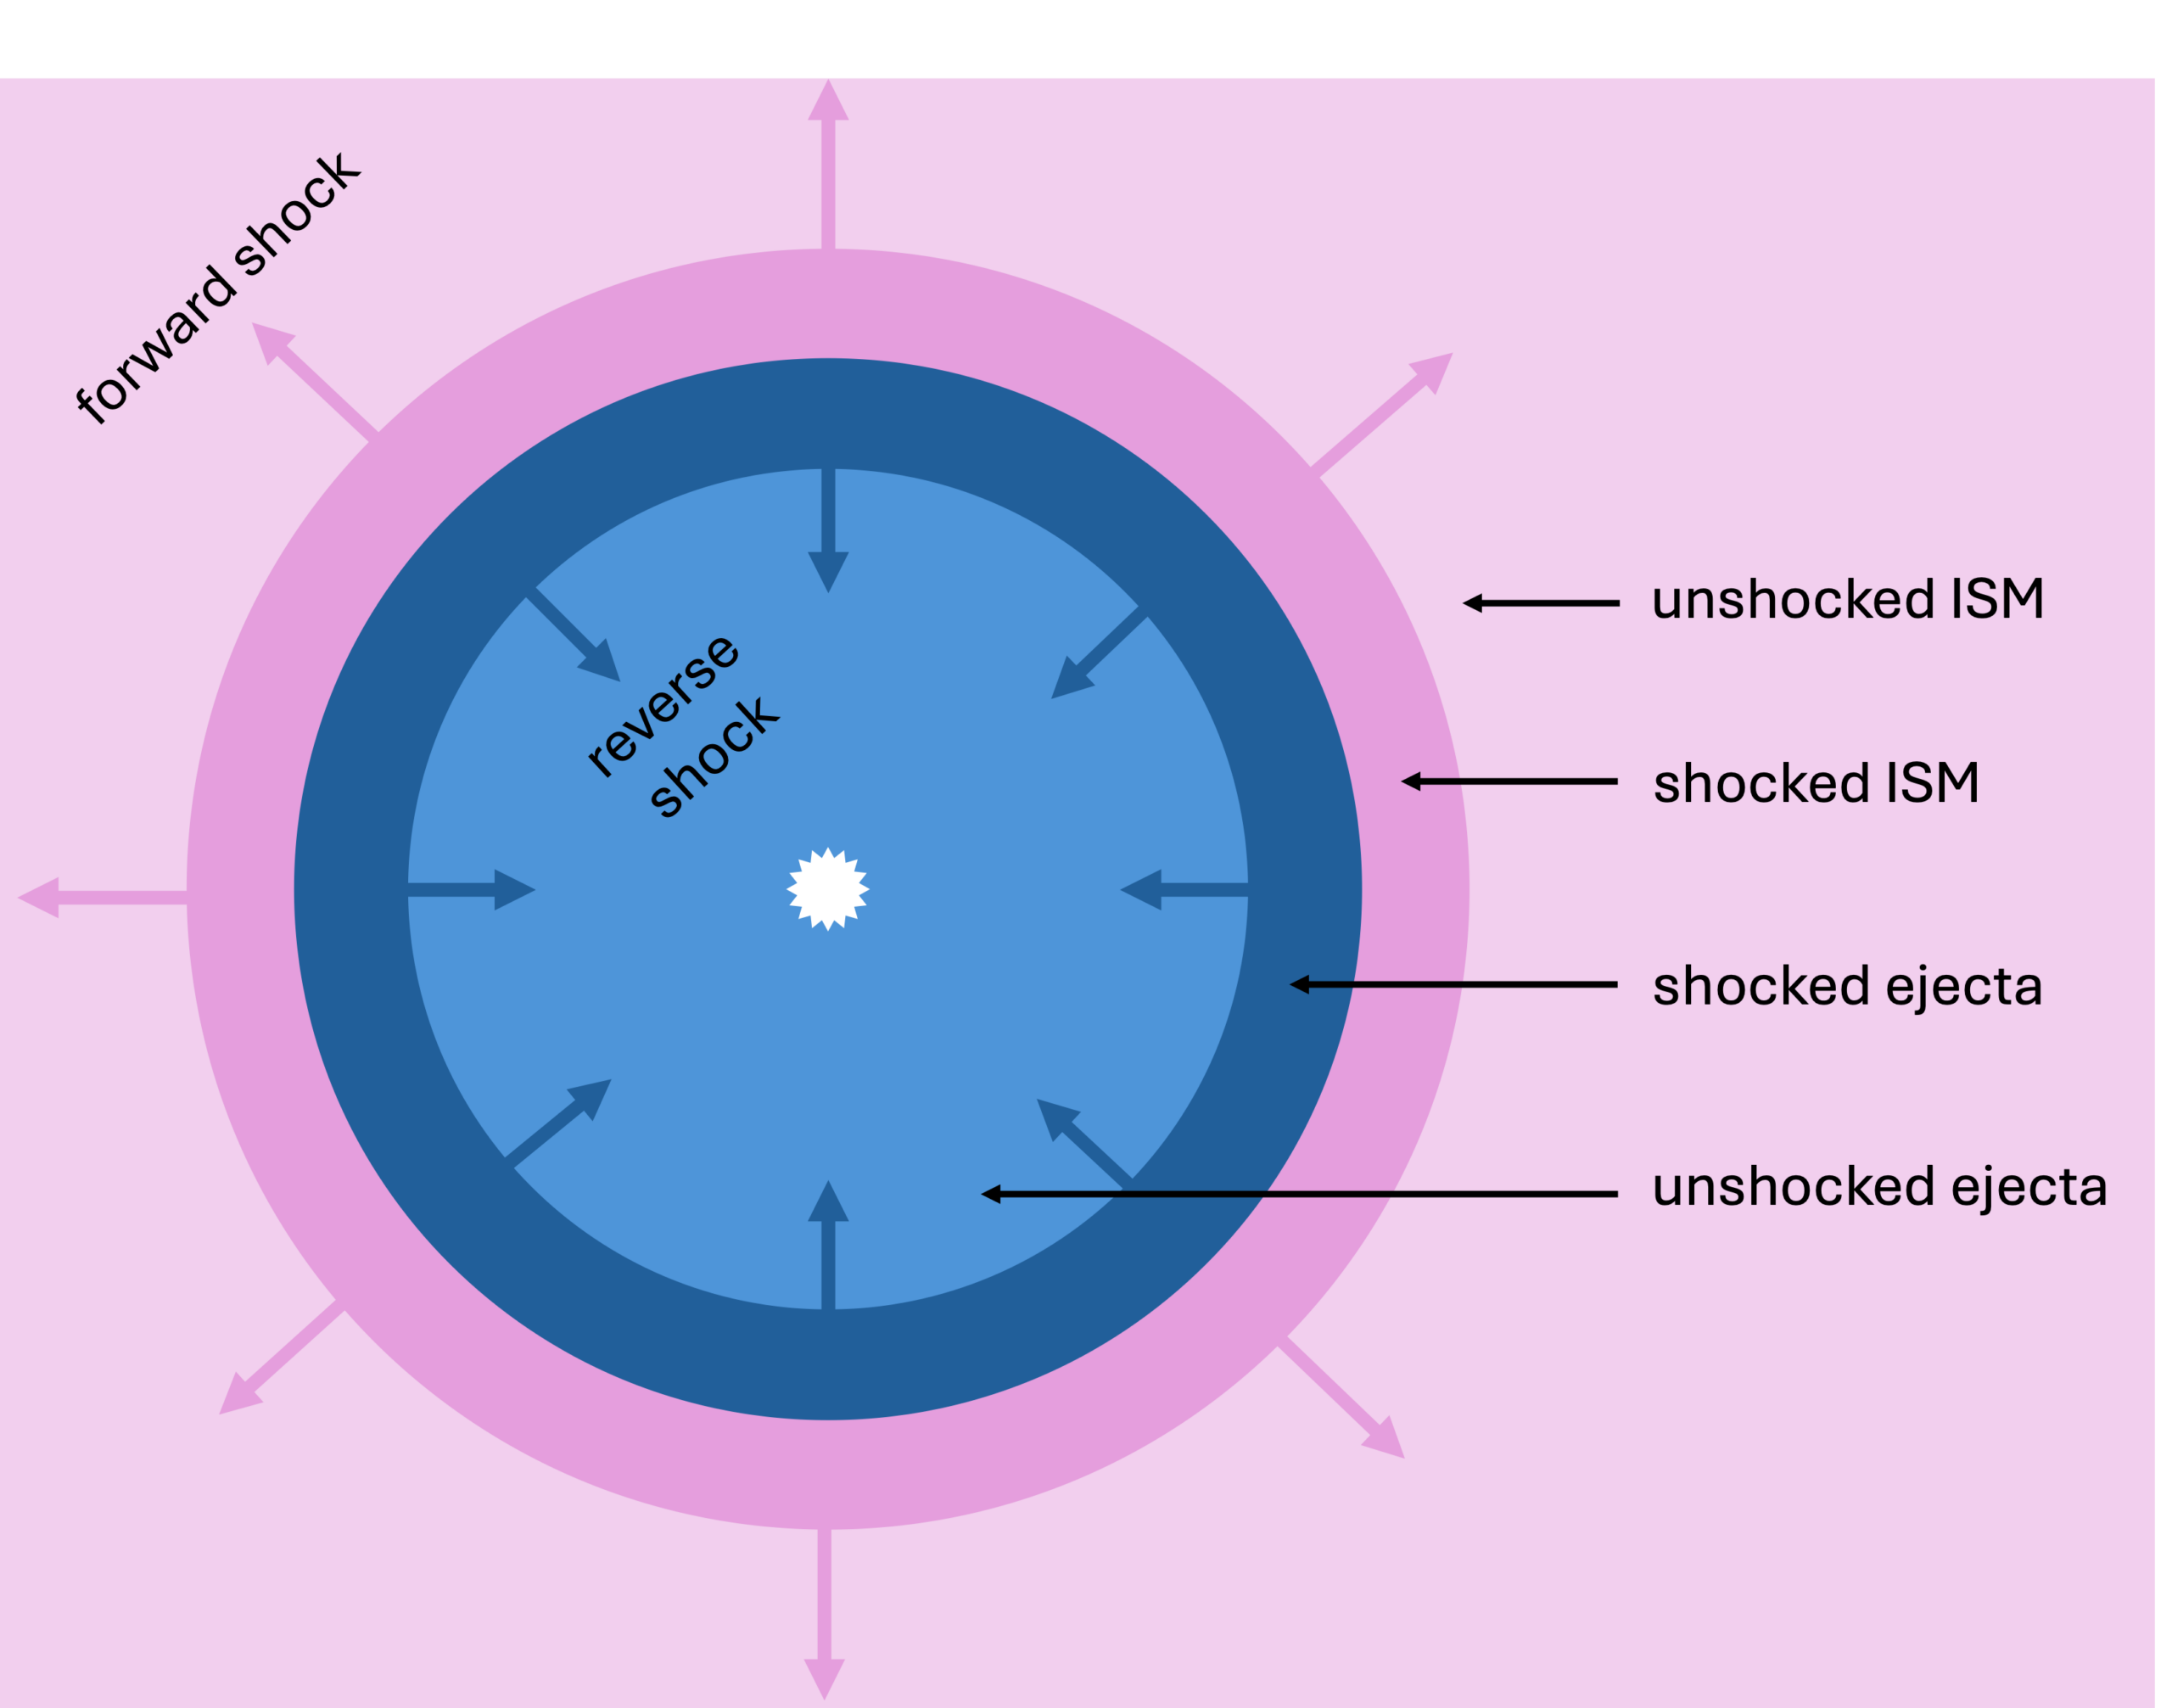
Diagram showing the outward-moving forward shock and inward-moving reverse shock of a supernova that is interacting with the interstellar medium (ISM). The post-shock region is located between the two shocks and contains shocked ejecta as well as shocked interstellar material. Click to enlarge. [AAS Nova/Kerry Hensley]
While it’s not possible to rule out the other options entirely, Smith and collaborators argue that at least some of the dust can be traced to new growth in the post-shock region. Because post-shock dust grains are likely to reach the interstellar medium, this suggests that superluminous, strongly interacting supernovae like SN 2010jl are a viable source of dust in the present-day universe and in high-redshift galaxies alike.
Citation
“JWST Spectra Indicate a Large Mass of Postshock Dust Formed by SN 2010jl,” Nathan Smith et al 2026 ApJ 1006 224. doi:10.3847/1538-4357/ae74c5
The post A Seriously Dusty Supernova appeared first on AAS Nova.
]]>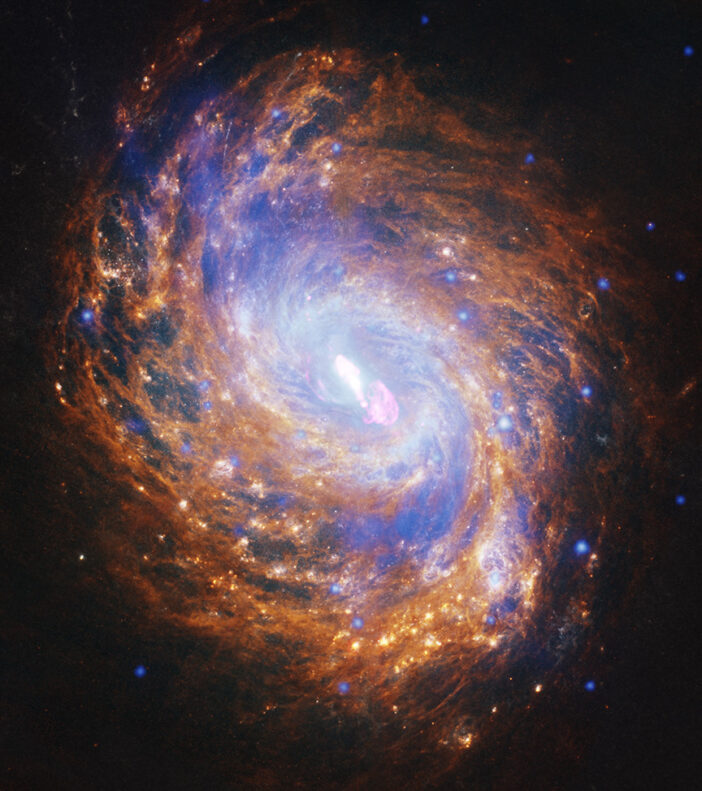
Astrobites reports on whether the correlation between galactic radio, infrared, and gamma-ray emission is truly a sign that cosmic-ray electrons deposit all their energy before they can escape to intergalactic space.
The post Do Galaxies Really Glow in Sync — or Are We Just Tilting Our Heads? appeared first on AAS Nova.
]]>Editor’s Note: Astrobites is a graduate-student-run organization that digests astrophysical literature for undergraduate students. As part of the partnership between the AAS and astrobites, we occasionally repost astrobites content here at AAS Nova. We hope you enjoy this post from astrobites; the original can be viewed at astrobites.org.
Title: Geometry, Not Calorimetry, Drives the Radio–Infrared–γ Ray Correlation
Authors: T. A. Porter, I. V. Moskalenko, and G. Jóhannesson
First Author’s Institution: Stanford University
Status: Published in ApJ
Galaxies emit light not only in the visible band, but also across other wavelengths via different physical mechanisms. Finding correlations between emissions at different wavelengths is a powerful tool for astrophysicists to explore the underlying mechanisms of galaxy formation. One of the most famous examples is the infrared–radio continuum correlation, which holds across several orders of magnitude in luminosity.
The typical explanation for this correlation is that both infrared light and radio synchrotron emission share the same energetic origin: star formation. Young stars emit ultraviolet radiation, which is absorbed by interstellar dust and re-radiated in the infrared. When these stars end their lives in core-collapse supernovae, the resulting shock waves accelerate cosmic-ray electrons, which then interact with the magnetic field to produce synchrotron emission.
For this correlation to hold, cosmic-ray electrons must radiate away all their energy within the galaxy, unable to escape and carry away some of their energy. Otherwise, the amount of radio emission would depend on how quickly cosmic rays escape and would no longer correlate with the infrared emission. This assumption is called the “electron calorimeter” model, which assumes that electrons lose all their energy due to radiation without escaping the galaxy. However, observations show that the infrared–radio correlation persists even in low-density galaxies where cosmic rays can easily escape, suggesting that the calorimeter model may not be the full story. To reconcile this, previous studies proposed “conspiracy-like” scenarios in which cosmic-ray injection, transport, magnetic-field amplification, and gas density are all coupled in a finely self-regulating way to maintain the correlation across diverse galactic environments — a somewhat awkward explanation that requires multiple unrelated physical processes to conveniently work together.
With the increased sensitivity of the Fermi Large Area Telescope, high-energy gamma-ray (or γ-ray) detections add new information to this picture. A galaxy’s γ-ray emission is produced by two different sources: cosmic-ray protons interacting with the interstellar medium gas, and cosmic-ray electrons inverse-Compton scattering off of nearby starlight or photons from the cosmic microwave background. Since both processes involve cosmic rays, the total γ-ray emission should also reflect the amount of star formation and therefore correlate with infrared and radio emission.
Because all three wavelengths trace different pieces of the same cosmic-ray population, studying them together reveals how the galaxy’s total cosmic-ray energy budget is distributed across its multi-wavelength emission.
The infrared–radio correlation has been established not only at the scale of entire galaxies, but also locally, down to patches roughly 100 parsecs across. Think of it like the relationship between a city’s electricity consumption and its population: we have long known they track each other city-wide, but it turns out the same relationship holds block by block. The infrared–radio correlation works the same way: zoom into any 100-pc region within a galaxy, and the correlation is still there. Unfortunately, the resolution of γ-ray observations is still stuck at around the kiloparsec scale. It is therefore unclear whether the local infrared–radio correlation reflects a genuine local physical coupling, one that would extend to γ-rays if we had sufficient resolution, or whether it is simply a spatial average of the emission, smoothed out by insufficient resolution. The answer determines whether radio and γ-ray emission can be used as reliable tracers of star formation, or whether they are just smeared out by cosmic-ray propagation over kiloparsec scales.
In this study, the authors numerically model galactic cosmic-ray transport, building a suite of physically motivated three-dimensional models of the Milky Way. They consider two variants for each of the four key inputs: 1) the cosmic-ray source distribution, 2) the interstellar gas, 3) the amount of starlight within the galaxy (the interstellar radiation field), and 4) the galactic magnetic field. Crucially, every model is normalized to reproduce the locally observed cosmic-ray data to within 5%, so that any differences in the predicted emission come purely from the large-scale geometry of each input, rather than from variations in the total cosmic-ray budget.
After evolving cosmic-ray transport for these realistic models, the authors then compute synthetic observations at radio, infrared, and γ-ray bands from various viewing inclinations to investigate how the underlying galactic model and the viewing angle affect the correlations between these emissions.
Surprisingly, inclination plays the most important role — more so than the cosmic-ray source distribution, the radiation field, or the magnetic field. Figure 1 shows the correlation plots between the radio and γ-ray emission (left two columns) and between infrared and γ-ray emission (right two columns) when viewing the galaxy face-on (i.e., viewing the galaxy from directly above the disk). Different colors represent γ-ray emission components from different physical mechanisms, with orange showing the total γ-ray emission. For both sets of correlation plots, starting from the upper-left panel, each panel modifies one physical input and recomputes the emission. Although there is some variation, one can see that the γ-ray emission correlates with both the radio and the infrared emission over several orders of magnitude, regardless of the underlying input model.
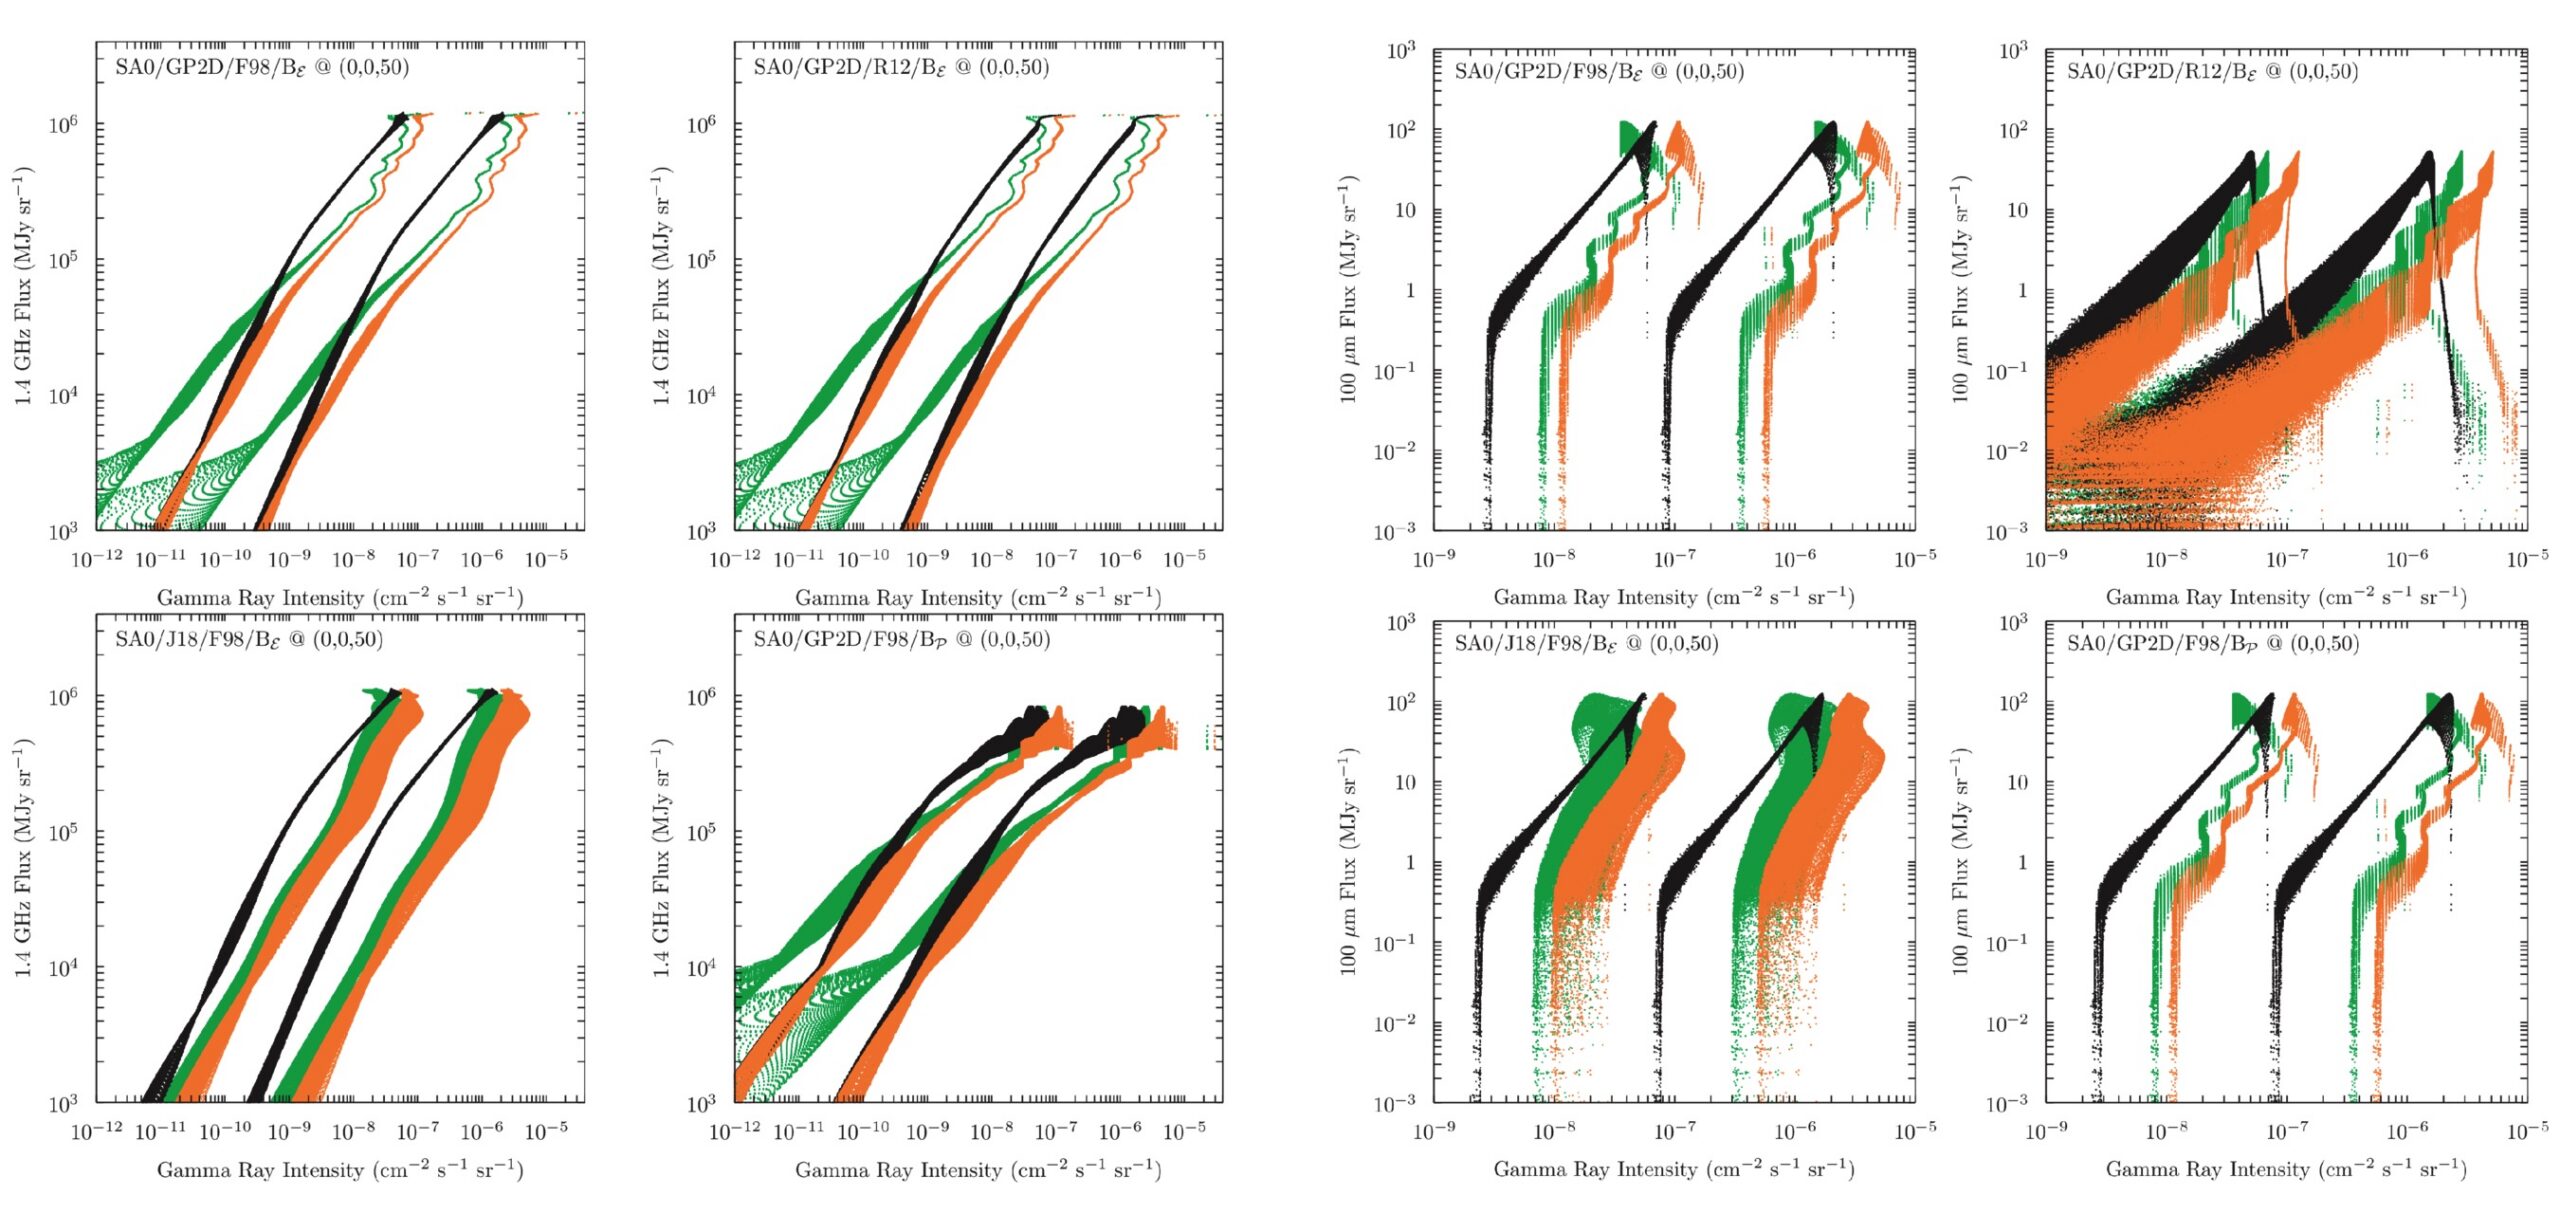
Figure 1: Radio (left two columns) and infrared (right two columns) vs. γ-ray correlation plots for a galaxy viewed face-on from 50 kpc. Each panel modifies one input — the cosmic-ray source distribution, gas, radiation field within the galaxy, or magnetic field — relative to a baseline model. Colors indicate γ-ray production mechanisms (green: proton–gas; black: inverse-Compton; orange: total). Across all variations, both the radio–γ-ray and infrared–γ-ray correlations remain quasi-linear over several orders of magnitude, showing that the correlations are robust to the choice of underlying galactic model. [Adapted from Porter et al. 2026]
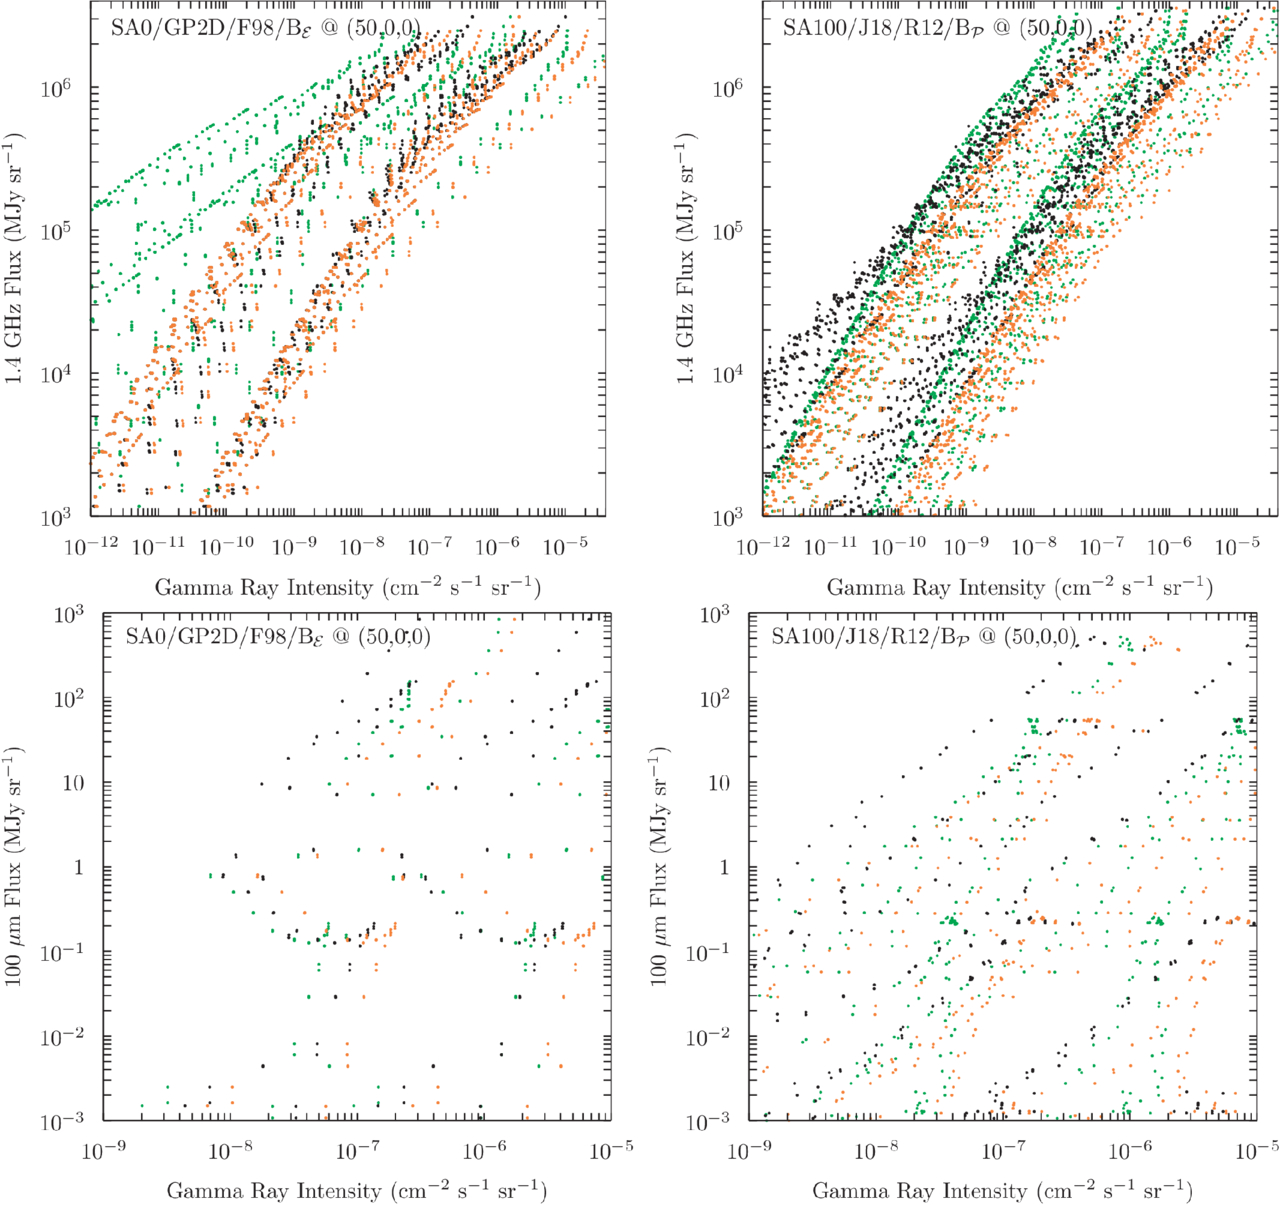
Figure 2: Correlation plots for two galaxy models viewed edge-on from 50 kpc — simple axisymmetric (left) and complex with spiral arms (right). Top: radio vs. γ-ray; bottom: infrared vs. γ-ray. Colors indicate γ-ray production mechanisms (green: proton–gas; black: inverse-Compton; orange: total). The infrared–γ-ray correlation breaks down, while the radio–γ-ray correlation is broadened but partially preserved. [Porter et al. 2026]
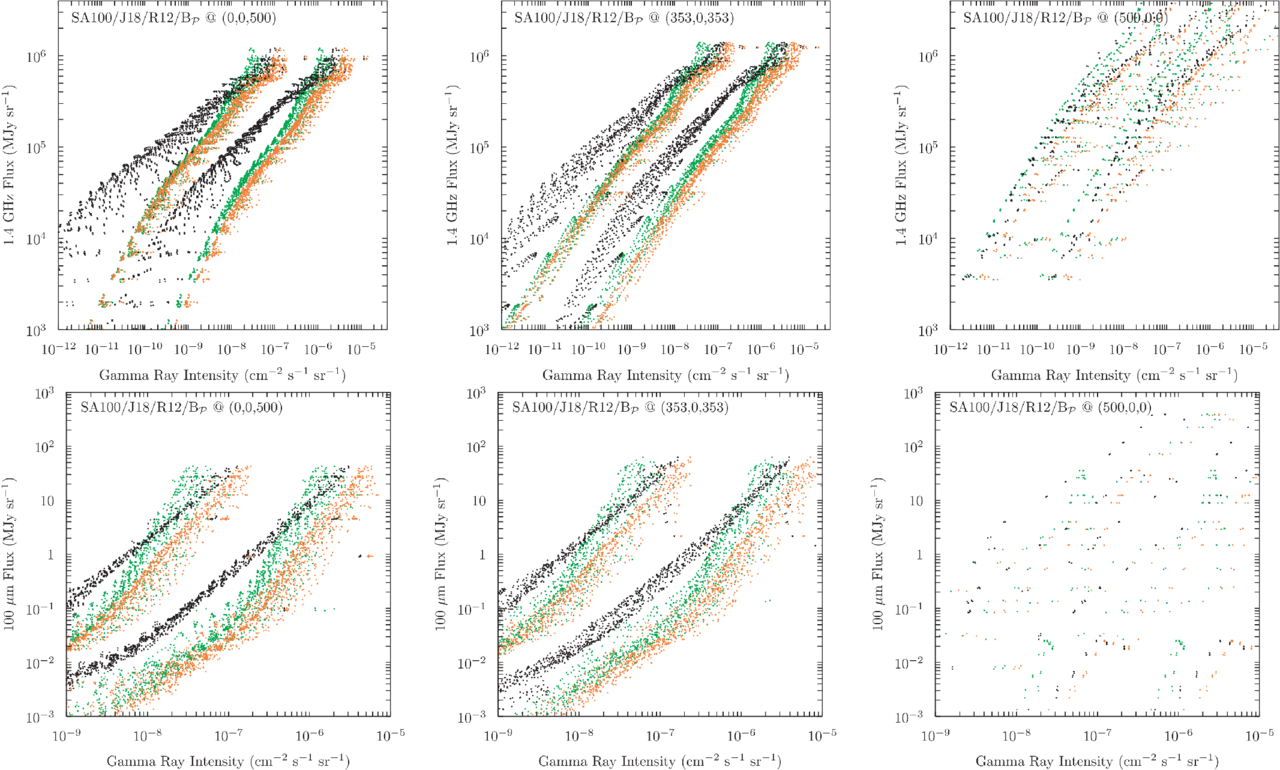
Figure 3: Correlation plots from a complex galaxy model viewed from 500 kpc, at three different inclinations (face-on, 45°, edge-on). Top row: radio vs. γ-ray; bottom row: infrared vs. γ-ray. Colors indicate different γ-ray production mechanisms (green: proton–gas; black: inverse-Compton; orange: total). At this distance, the blurring effect of large pixels restores a tight correlation even in the edge-on view. [Porter et al. 2026]
Original astrobite edited by Kelsie Taylor.
About the author, Sandy Chiu:
I’m a PhD candidate at the University of Michigan, Ann Arbor. I’m interested in numerical simulations of cosmic rays feedback in galaxies and their comparison with observation.
The post Do Galaxies Really Glow in Sync — or Are We Just Tilting Our Heads? appeared first on AAS Nova.
]]>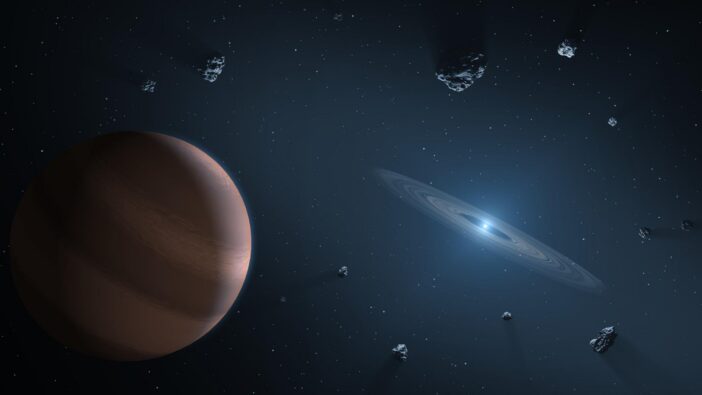
Astronomers may have spotted the crumbs of a recently eaten asteroid around a white dwarf star.
The post Finishing Off an Asteroid appeared first on AAS Nova.
]]>Only one white dwarf star has ever been caught eating an asteroid. Recently, however, astronomers may have found another that just finished its meal.
Eating Asteroids
Although stars like our Sun don’t explode in violent supernovae like their massive counterparts, they don’t slink quietly into a peaceful old age either. When a solar-mass star reaches the end of its main sequence life, it first swells dramatically (the Sun may eventually grow so large that it consumes Earth and the device you’re reading this on), then shrinks down to a tiny but incredibly hot ember known as a white dwarf.
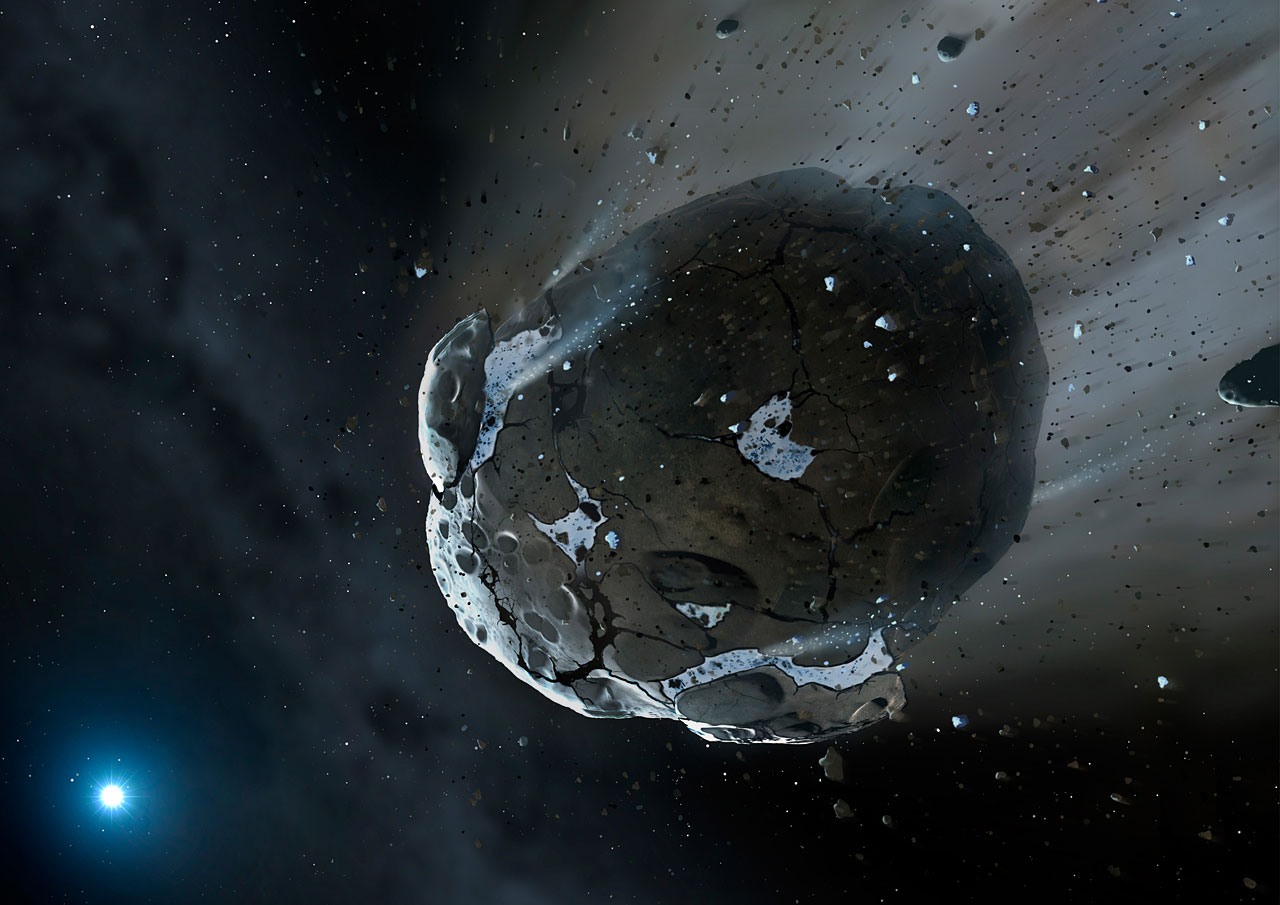
An artist’s impression of an asteroid breaking up near a white dwarf star. [NASA, ESA, M.A. Garlick (space-art.co.uk), University of Warwick, and University of Cambridge]
However, although researchers have found these stains in over a quarter of white dwarfs and consequently have reasoned that asteroid snacking must be common, they’ve only ever caught one star mid-meal. Recently, Ben Zuckerman (University of California, Los Angeles) and a team of collaborators may have found another, though it may have just finished dining.
Leftover Crumbs
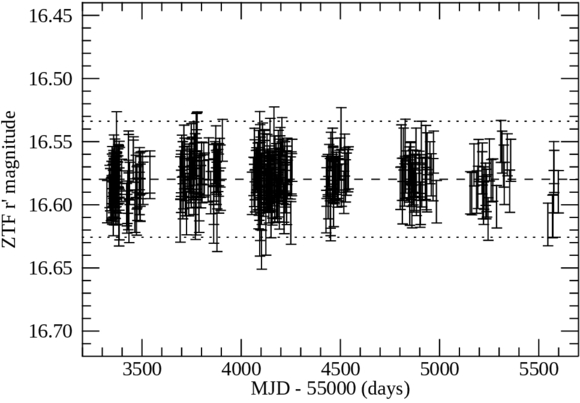
The light curve of WD J0234-0406 measured by the Zwicky Transient Facility. Unlike WD 1145+017, which frequently changes brightness, this white dwarf appears remarkably steady despite the high-velocity gas surrounding it. [B. Zuckerman et al. 2026]
The researchers suggest that this relative quiet is a matter of timing. While asteroids are actively breaking up around WD 1145+017, the parent bodies that supplied the gas and dust around WD J0234-0406 may have shattered long ago and have already been either vaporized or ground down into smaller particles. All that is left over are the crumbs slowly spiraling toward the star.
Although WD J0234-0406’s meal may not be as dramatic as WD 1145+017’s feast, it’s still exciting to expand the sample of known white dwarf-asteroid interactions. And, with the upcoming release of data from the DESI survey poised to reveal the spectra of tens of thousands of white dwarfs, the sample is likely to grow again soon.
Citation
“High-velocity Circumstellar Gas Orbiting a White Dwarf Star,” B. Zuckerman et al 2026 ApJ 1004 254. doi:10.3847/1538-4357/ae23c4
The post Finishing Off an Asteroid appeared first on AAS Nova.
]]>
Using fast radio bursts, researchers have measured just how empty cosmic voids truly are.
The post Diving into the Darkest Corners of the Universe with Fast Radio Bursts appeared first on AAS Nova.
]]>Even the darkest corners of the universe are not completely empty. A recent study has used fast radio bursts to provide the first estimate of the baryon content in cosmic voids.
What’s in a Void?
Cosmological studies have revealed the large-scale filamentary structure of the universe known as the cosmic web. Chains of galaxies and galaxy clusters fall into spindly strands (or filaments) of matter overdensities, opening up cavernous cosmic voids that comprise the darkest corners of the universe. These seemingly vacant voids serve as critical test beds for cosmology, allowing researchers to constrain things like the nature of dark energy and the matter density of the universe.
Despite their name, voids are not completely empty but are instead underdensities with considerably less matter compared to the bustling filaments they border. The baryon (normal matter) content of cosmic voids has important implications for cosmological models and large-scale galactic feedback processes, but assessing how many baryons actually occupy voids has only recently become observationally accessible.
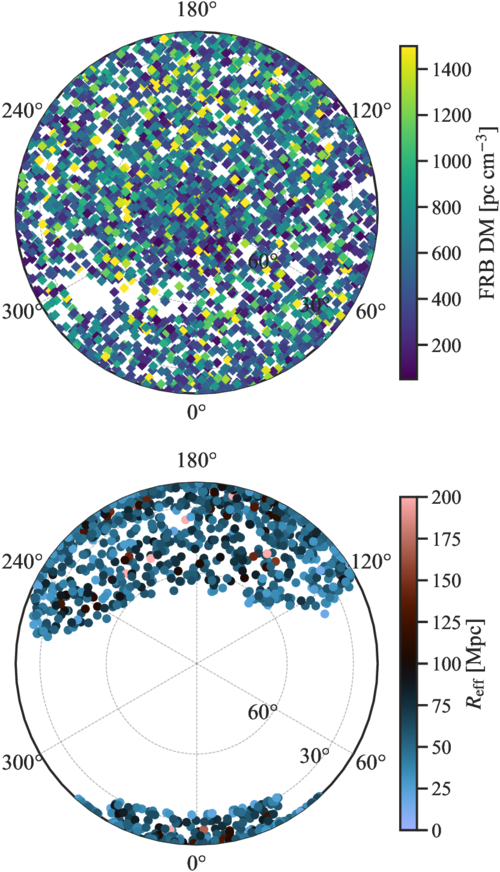
Sky maps centered on the north celestial pole showing the CHIME fast radio burst sample (top) and the SDSS void catalog (bottom). [Sharma et al 2026]
Chiming In on the Baryon Search
In concept, directly stacking fast radio burst sight lines that coincide with the positions of known cosmic voids provides a direct measurement of the baryon underdensity inside voids. With no previous observational exploration of this quantity, Kritti Sharma (California Institute of Technology) and collaborators leveraged the second catalog of the Canadian Hydrogen Intensity Mapping Experiment Fast Radio Bursts (CHIME/FRB) sample in conjunction with the Sloan Digital Sky Survey (SDSS) Baryon Oscillation Spectroscopic Survey (BOSS) void catalog to provide the first observational assessment of the baryon underdensity in cosmic voids.
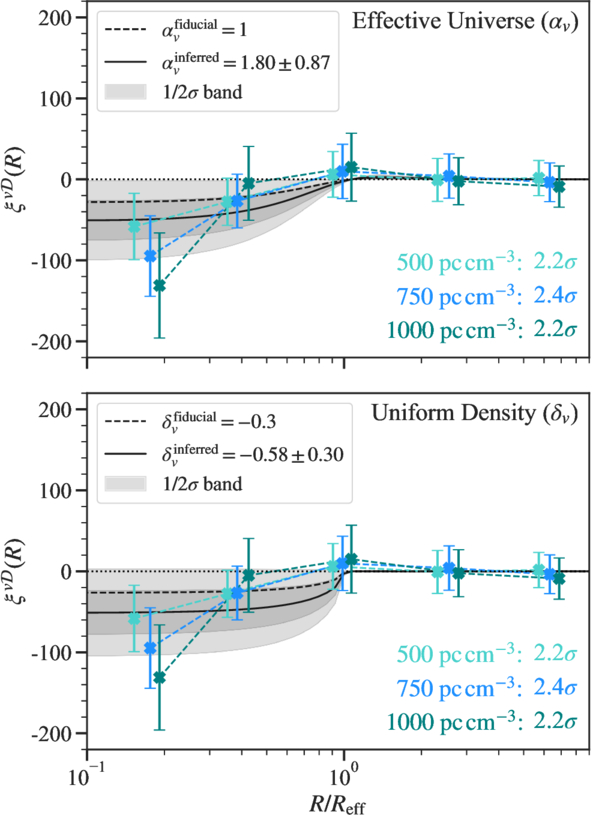
Anticorrelations between fast radio burst dispersion measures and void positions. There is a clear dispersion measure deficit closer to voids centers. [Sharma et al 2026]
This study provides a unique approach to baryon mapping and opens up the door for future investigation of cosmic voids. While not physically containing much, voids hold vast astrophysical and cosmological significance. With the astronomical stage primed with galaxy-mapping powerhouses like the Dark Energy Spectroscopic Instrument, Vera Rubin Observatory, Nancy Grace Roman Space Telescope, and Euclid Space Telescope, cosmic voids will become a cornerstone of cosmological studies.
Citation
“Baryons in the Darkest Sites of the Universe,” Kritti Sharma et al 2026 ApJL 1006 L3. doi:10.3847/2041-8213/ae81ac
The post Diving into the Darkest Corners of the Universe with Fast Radio Bursts appeared first on AAS Nova.
]]>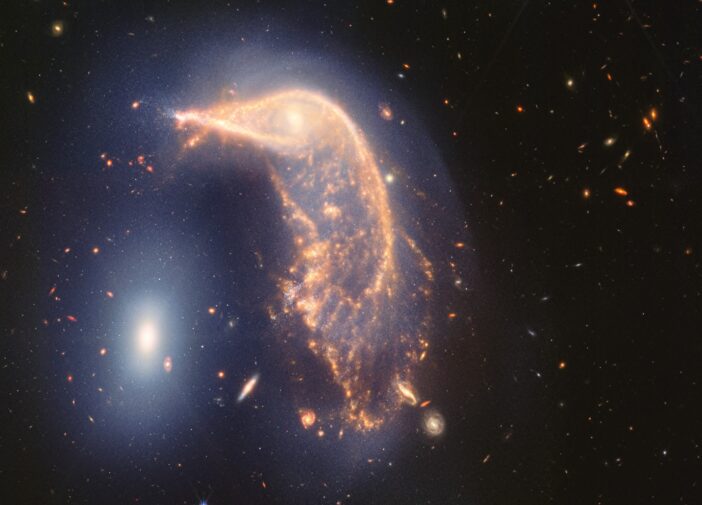
Astrobites reports on a whodunit of cosmic significance: who killed star formation in massive elliptical galaxies?
The post EXCELlent Work, Detectives! Solving the Murder of Star Formation in Galaxies with JWST appeared first on AAS Nova.
]]>Editor’s Note: Astrobites is a graduate-student-run organization that digests astrophysical literature for undergraduate students. As part of the partnership between the AAS and astrobites, we occasionally repost astrobites content here at AAS Nova. We hope you enjoy this post from astrobites; the original can be viewed at astrobites.org.
Title: The JWST EXCELS Survey: Insights into the Nature of Quenching at Cosmic Noon
Authors: Maya Skarbinski et al.
First Author’s Institution: Johns Hopkins University
Status: Published in ApJ
How to Quench a Galaxy
Look at an image of the sky taken with a sufficiently sensitive telescope, and you’ll quickly notice that galaxies tend to cluster into two main types: blue spiral galaxies, which have flat disk shapes with a central bulge, and red elliptical galaxies, which look like spherical or elliptical balls of red stars. Blue spiral galaxies can form tens to hundreds of stars every year, while elliptical galaxies have completely stopped forming stars, meaning that some process has to transform star-forming spirals into non-star-forming, or “quiescent,” elliptical galaxies. To form the current population of massive elliptical galaxies, this process had to be common about 2–3 billion years after the Big Bang at “cosmic noon,” the period when star formation in the universe peaked. The processes that “quench” star formation in massive galaxies are still being studied, and one of the best ways to study them is to find galaxies that recently quenched and look for clues about the processes that quenched them.
Post-starburst galaxies are galaxies that have rapidly quenched after a short burst of star formation. Because these galaxies quenched so quickly and so recently, it’s often possible to find signs of whatever quenched them, like the signatures of past galaxy mergers, feedback from supermassive black hole accretion, or the shutoff of gas flowing into the galaxy. Rapid quenching is pretty uncommon now, but it was a much more common way for galaxies to quench at cosmic noon. Understanding post-starburst galaxies at cosmic noon is therefore critical for understanding the formation of massive elliptical galaxies in the local universe.
The Quest for Quenched Galaxies
Today’s article uses data from the JWST Early eXtragalactic Continuum and Emission Line Survey (EXCELS) to identify post-starburst galaxies at cosmic noon and try to determine why they quenched. EXCELS is a spectroscopic survey, so the authors get a spectrum for every galaxy. The spectrum encodes information about the galaxy’s stellar population, including the mass of stars in the galaxy, the number of stars forming every year, and the history of star formation throughout the galaxy’s life.
The authors use a technique called principal component analysis to further divide the sample into young and old post-starbursts. Principal component analysis is a machine-learning technique that learns the most important features of a data set. This technique is used for “dimension reduction,” or reducing the number of data points needed to learn something about the object. A typical spectrum has hundreds or even thousands of data points, which means performing data analysis on a spectrum can be very computationally expensive. Principal component analysis takes these thousands of data points and learns broad patterns that correlate with each other. These patterns are called “supercolors” in the context of spectral data, and they encode things like the overall shape and color of the spectrum as well as the spectral shape around key features (see Figure 1 for a visualization). Since the overall shape, color, and emission/absorption line features of a spectrum come from the galaxy’s stellar population, this method can be used to identify galaxies with lots of star formation a billion years ago but very little star formation today — in other words, post-starburst galaxies.
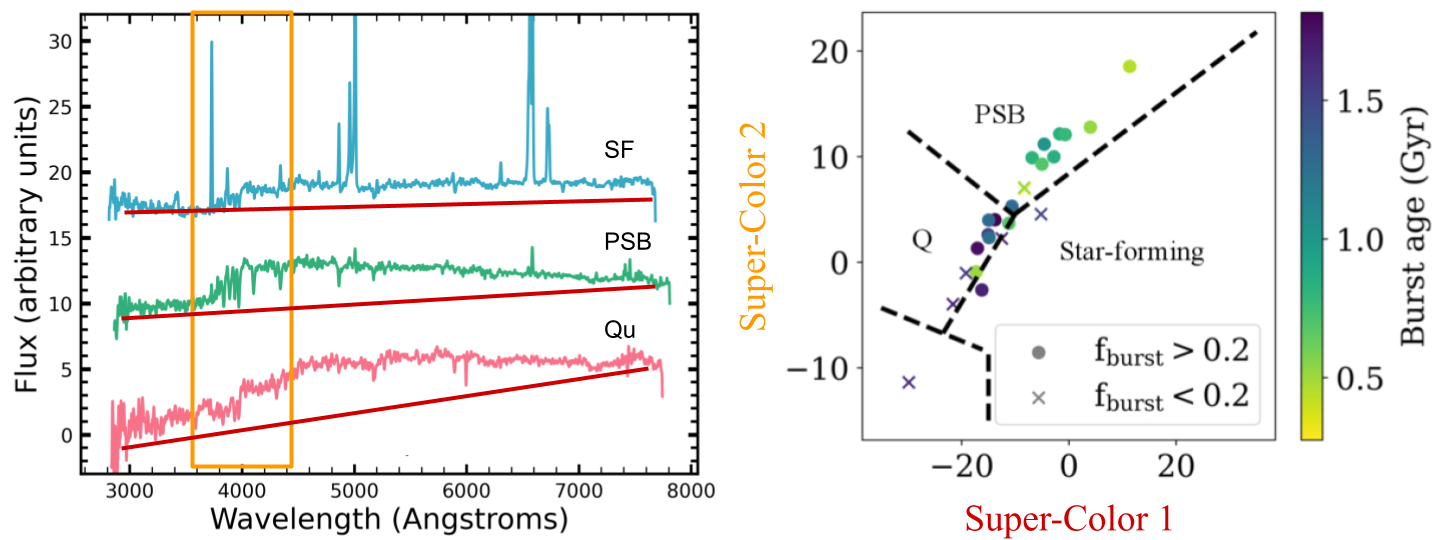
Figure 1: An example of principal component analysis for sample star-forming (SF), quiescent (Qu), and post-starburst (PSB) galaxy spectra (left-hand side). Principal component analysis simplifies a many-dimensional data set (for example, spectra) into fewer dimensions. In this case, Super-Color 1 measures the overall color of the spectrum (shown on the left-hand side as the slope of the spectra, marked with red lines), while Super-Color 2 measures the shape of the spectrum around 4,000 angstroms (orange box). The authors use principal component analysis to identify post-starburst galaxies for further analysis (right-hand side). [Adapted from Skarbinski et al. 2026]
How Quickly Do Post-Starbursts Quench?
First, the authors measure something called a “quenching timescale,” which they define as the length of time between when the galaxy’s star formation rate peaked and when it fell low enough that the galaxy was quenched. The quenching timescale depends on which process shut down star formation in the galaxy — feedback from black hole accretion or star formation should cause fast quenching, while galaxies that are starved of gas from the intergalactic medium should quench more slowly. The authors find that 15 of their galaxies quenched in under 500 million years, 6 took between 500 million and 1 billion years, and 3 took longer than 1 billion years to quench. The galaxies that had the highest peak star formation rates quenched the fastest, suggesting that feedback from star formation could have played a role in quenching these galaxies.
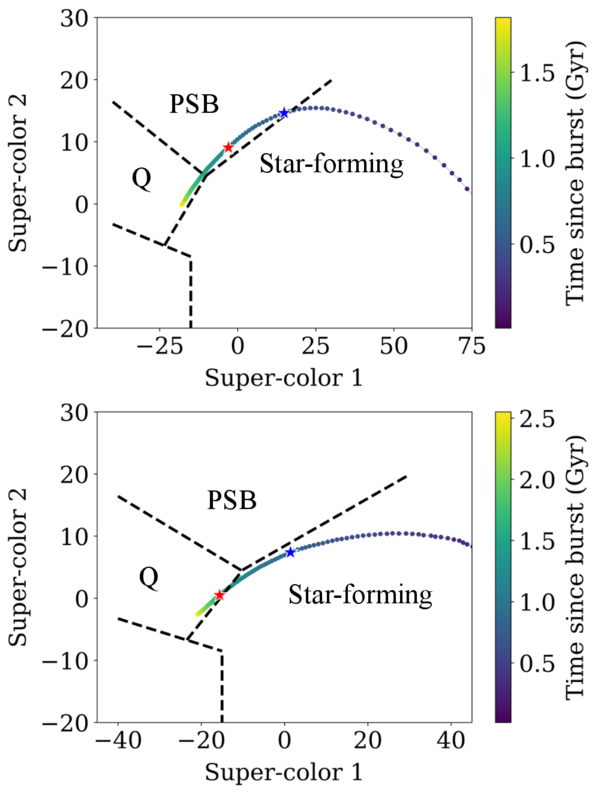
Figure 2: Possible evolutionary tracks in supercolor for two example galaxies as they quench. The galaxy in the top panel quenches quickly and has post-starburst supercolors for about a billion years, while the galaxy in the bottom panel quenches without ever going through the post-starburst phase. The authors use these tracks to determine how important the post-starburst phase is for quenching massive galaxies. [Skarbinski et al. 2026]
While the post-starburst phase is important, the different quenching timescales present across the sample suggest that multiple pathways existed to quench galaxies at cosmic noon, similar to what has been found in less-distant galaxies and at cosmic noon in other samples. This is also supported by the fact that four of the five galaxies with sufficient data show evidence of an actively accreting supermassive black hole that may help shut down star formation in many (but perhaps not all) massive galaxies. While the precise processes that quench massive galaxies are still uncertain, one thing is clear: JWST EXCELS at solving the mystery!
Original astrobite edited by Anavi Uppal.
About the author, Margaret Verrico:
I am a fourth-year graduate student at the University of Illinois Urbana-Champaign. I study the connection between supermassive black hole transients and their host galaxies. I am also an avid knitter and reader, and I am passionate about opening up STEM opportunities for people of all backgrounds.
The post EXCELlent Work, Detectives! Solving the Murder of Star Formation in Galaxies with JWST appeared first on AAS Nova.
]]>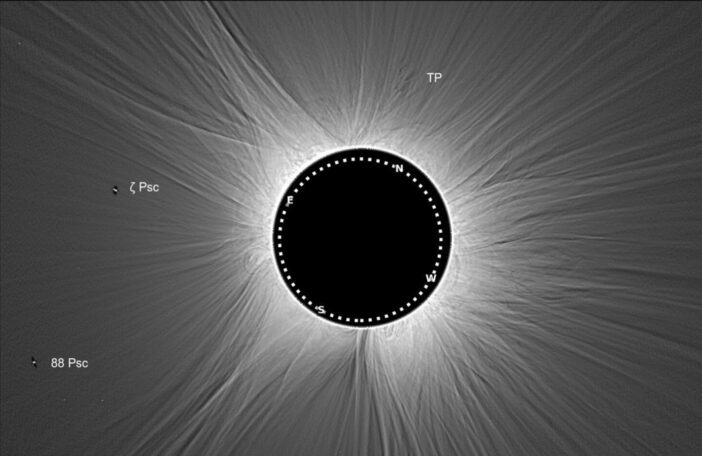
Citizen scientists from the Dynamic Eclipse Broadcast Initiative recorded nearly an hour of coronal behavior during the 8 April 2024 solar eclipse.
The post Featured Image: Citizen Science and Solar Structure appeared first on AAS Nova.
]]>During the 8 April 2024 solar eclipse, the path of totality swept across North America, dazzling millions of skygazers. Scattered along this path were 82 viewing sites of the Dynamic Eclipse Broadcast Initiative citizen science project, which aimed to observe the dynamics of the tenuous solar corona. Though poor weather dashed many observers’ hopes, the project managed to collect data at 11 sites spanning 2,700 kilometers, capturing 49 minutes of coronal behavior. The image above shows the solar corona as seen during totality from one of the DEB Initiative sites. In a recent research article, Matthew J. Penn (Southern Illinois University Carbondale; Tucson Amateur Astronomy Association) and collaborators described the results of the Initiative’s viewing efforts, including identification of downflows and outflows, plumes, coronal loops, and apparent motion of background stars. To learn more about these observations of the solar corona, be sure to check out the full article linked below.
Citation
“Structure and Dynamics of the Inner Corona Measured from the DEB Initiative 2024 Eclipse Image Sequence,” Matthew J Penn et al 2026 ApJL 1006 L25. doi:10.3847/2041-8213/ae8797
The post Featured Image: Citizen Science and Solar Structure appeared first on AAS Nova.
]]>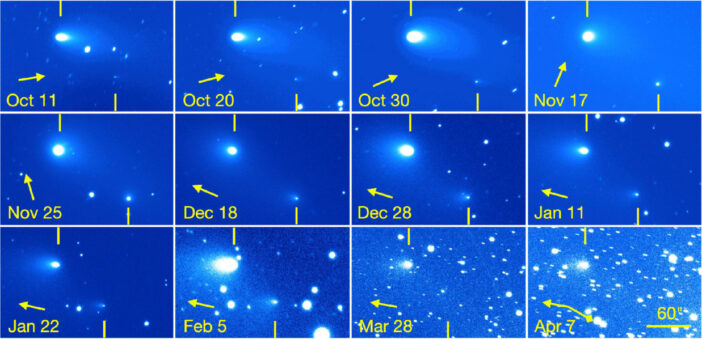
A recent study investigated the possible mechanisms that caused a known Jupiter-family comet to split in two.
The post Spying on a Split Comet appeared first on AAS Nova.
]]>Traversing through the solar system, a comet split in two, and a recent study used six months of observations to investigate when and why.
A Split Comet
Orbital path of 240P/NEAT (purple) and the position of the comet on 30 July 2026 (light blue teardrop). Click to enlarge. [TheSkyLive]
Most recently, 240P swept closest to Jupiter in July 2007, shifting the comet’s perihelion distance (closest approach to the Sun) from 2.5 to 2.1 au, and several long-lived bursts in brightness in 2018/2019 could have been spurred by this orbital shift. Excitingly, a fainter comoving object, 240P-B, was first reported in June 2025 as the comet headed toward perihelion — at some point recently, 240P had split in two!
Over the last century, numerous split comets have been recorded, but detailed physical studies of these objects are rare. With growing evidence suggesting splitting and disintegration are the primary mechanisms of comet destruction, understanding the properties and cause of 240P’s split is imperative.
Observing 240P
With 240P on the move to perihelion, David Jewitt (University of California, Los Angeles) and collaborators monitored the comet from October 2025 to April 2026 to establish the likely cause of its split. Employing the Alhambra Faint Object Spectrograph and Camera on the 2.56-meter Nordic Optical Telescope, the authors obtained detailed imaging of the comet from two months before to four months after perihelion to characterize both components.
Tracking both photometric and morphological changes across their observations, the authors estimated the dust-loss rates, physical sizes, and separation speed of 240P-A and 240P-B. The brighter component, 240P-A, has an estimated radius between 400 and 600 meters and a dust-loss rate almost four times higher than 240P-B. Because 240P-B is fainter, its radius is harder to constrain observationally. From its lower dust-loss rate and lower brightness, the authors estimated a radius around 300 meters (and no smaller than 50). Based on how the separation of the two comet pieces changes over time, the authors determined that the split of 240P occurred at least three years before their observations.
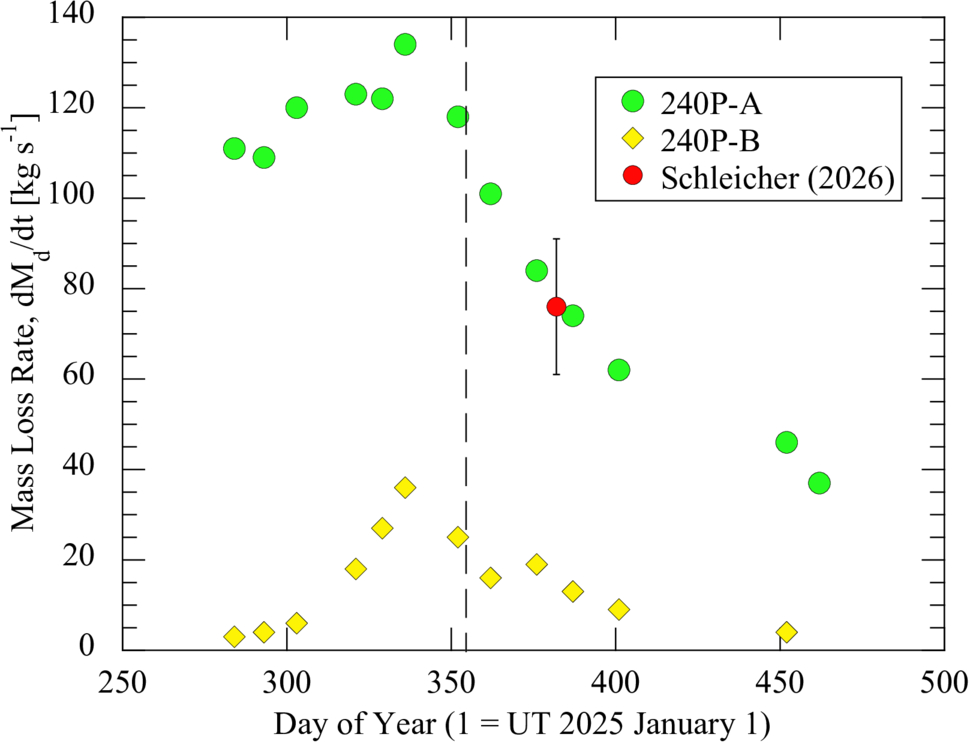
Dust mass-loss rates for 240P-A (green circles) and 240P-B (yellow diamonds) over the course of the observations. Both components peak shortly before perihelion (dashed vertical line). Click to enlarge. [Jewitt et al 2026]
Source of the Split
How exactly did this fragmented comet get this way? The authors considered a number of comet-splitting mechanisms: tidal forces, asteroid impact, pressure buildup below the comet’s surface, thermal stresses, and rotational instability. Given the comet’s orbit, it has not had close enough encounters with the Sun or other planets for tidal forces to be the culprit, and it traverses well above the asteroid belt, avoiding collisions. Pressure buildup and thermal stresses can fracture comets, but both are unlikely to launch such a large fragment as seen in this system.
This leaves rotational instability as the likely source of 240P’s split. Outgassing torques lead to rotational instability, especially in subkilometer comets like 240P, and 240P has exhibited recent outgassing. In addition, the separation speed between the 240P components is comparable to the escape speed of the primary comet, which is expected for rotational breakup. To confirm this hypothesis, future observations measuring the rotation period of 240P are necessary, but this study adds to the small number of split-comet observations that aid in understanding comet destruction.
Citation
“Investigation of Split Comet 240P/NEAT,” David Jewitt et al AJ 172 113. doi:10.3847/1538-3881/ae83ac
The post Spying on a Split Comet appeared first on AAS Nova.
]]>
A recent Focus Issue of the Astrophysical Journal Letters introduces the fourth version of the gravitational wave transient catalog from the LIGO, Virgo, and KAGRA collaborations.
The post Monthly Roundup: The Fourth Catalog of Gravitational Wave Events from LIGO, Virgo, and KAGRA appeared first on AAS Nova.
]]>A recent Focus Issue of the Astrophysical Journal Letters describes the fourth version of the catalog of gravitational wave events (GWTC-4.0) from the Laser Interferometer Gravitational Wave Observatory (LIGO), the Virgo interferometer, and the Kamioka Gravitational Wave Detector (KAGRA).
This catalog contains transient gravitational wave events recorded through January 2024, during the observatories’ fourth observing run, which concluded in November 2025. GWTC-4.0 displays the results of significant improvements to our suite of gravitational wave detectors, including higher-powered lasers and reduced quantum noise. A fifth catalog of gravitational wave events was released in Spring 2026, with the accompanying scientific articles being submitted to the Astrophysical Journal and the Astrophysical Journal Letters.
This Monthly Roundup consists of short descriptions of each of the currently published research articles in the LIGO–Virgo–KAGRA Gravitational Wave Transient Catalog (GWTC): Release 4 Focus Issue. Each snippet links to the corresponding research article, and the Focus Issue landing page is linked at the bottom of this post. Be sure to revisit the landing page to catch new articles as they’re published!
Introducing GWTC-4.0
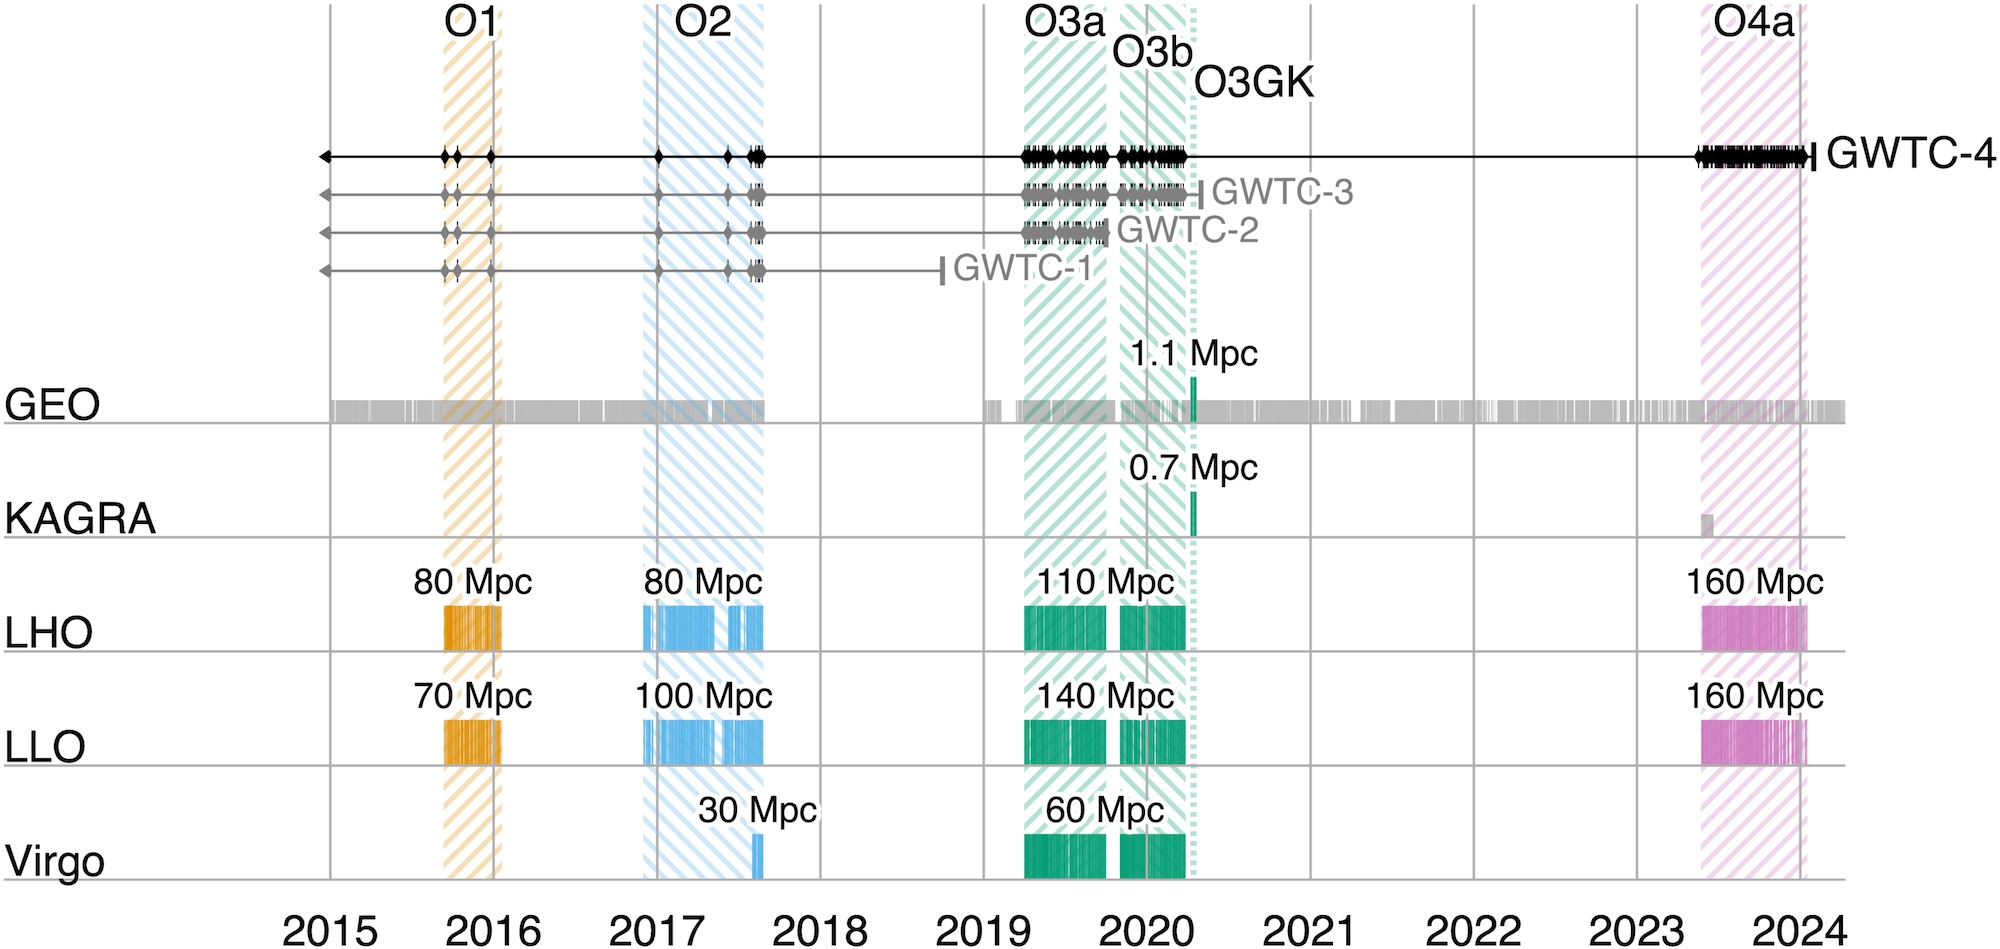
A timeline showing observing runs between 2015 and 2024. Click to enlarge. [LVK Collaboration 2025]
After these detectors record subtle spacetime squiggles from compact objects colliding millions to billions of light-years away, the collaboration converts the raw signals into the data contained in catalogs like GWTC-4.0. This process involves modeling the gravitational wave signals, filtering them to identify candidate transients, and pinpointing the most significant events.
After collecting and cleaning the signals, the collaboration undertakes a critical step: making their data accessible to researchers and the public. The data are available through the Gravitational Wave Open Science Center, and the Focus Issue article on open data describes how to navigate the online portal, how the datasets archived online are structured, and how the data were calibrated.
Science Results
This fourth version of the gravitational wave transient catalog greatly expands the sample of gravitational wave transients recorded by detectors across the globe. Including events from previous catalogs, GWTC-4.0 brings us to 218 events for which the probability of the source being astrophysical in nature is more than 50% and for which there is little chance of the signal being an instrumental artifact. This represents a more than 100% increase in the number of recorded gravitational wave events fulfilling this criterion, broadening our understanding of colliding compact object pairs. This release also includes some superlative signals, such as the most massive black hole binary with a low false-alarm rate and the highest signal-to-noise ratio for a gravitational wave event thus far.
Detected in November 2023 by both LIGO Hanford and LIGO Livingston, GW231123 is in many ways an exceptional gravitational wave transient. The total mass of the merging components appears to be between 190 and 265 solar masses, and the false-alarm rate for this signal is less than one per year. This makes it the most massive merger event with such a low false-alarm probability. The two components also appear to have high spins, which complicates the interpretation of the signal with existing models. A binary black hole merger in which one or more components lies within the pair-instability mass gap is the likeliest explanation for this signal, but the authors also present alternative scenarios, such as a core-collapse supernova or a gravitationally lensed gravitational wave signal.
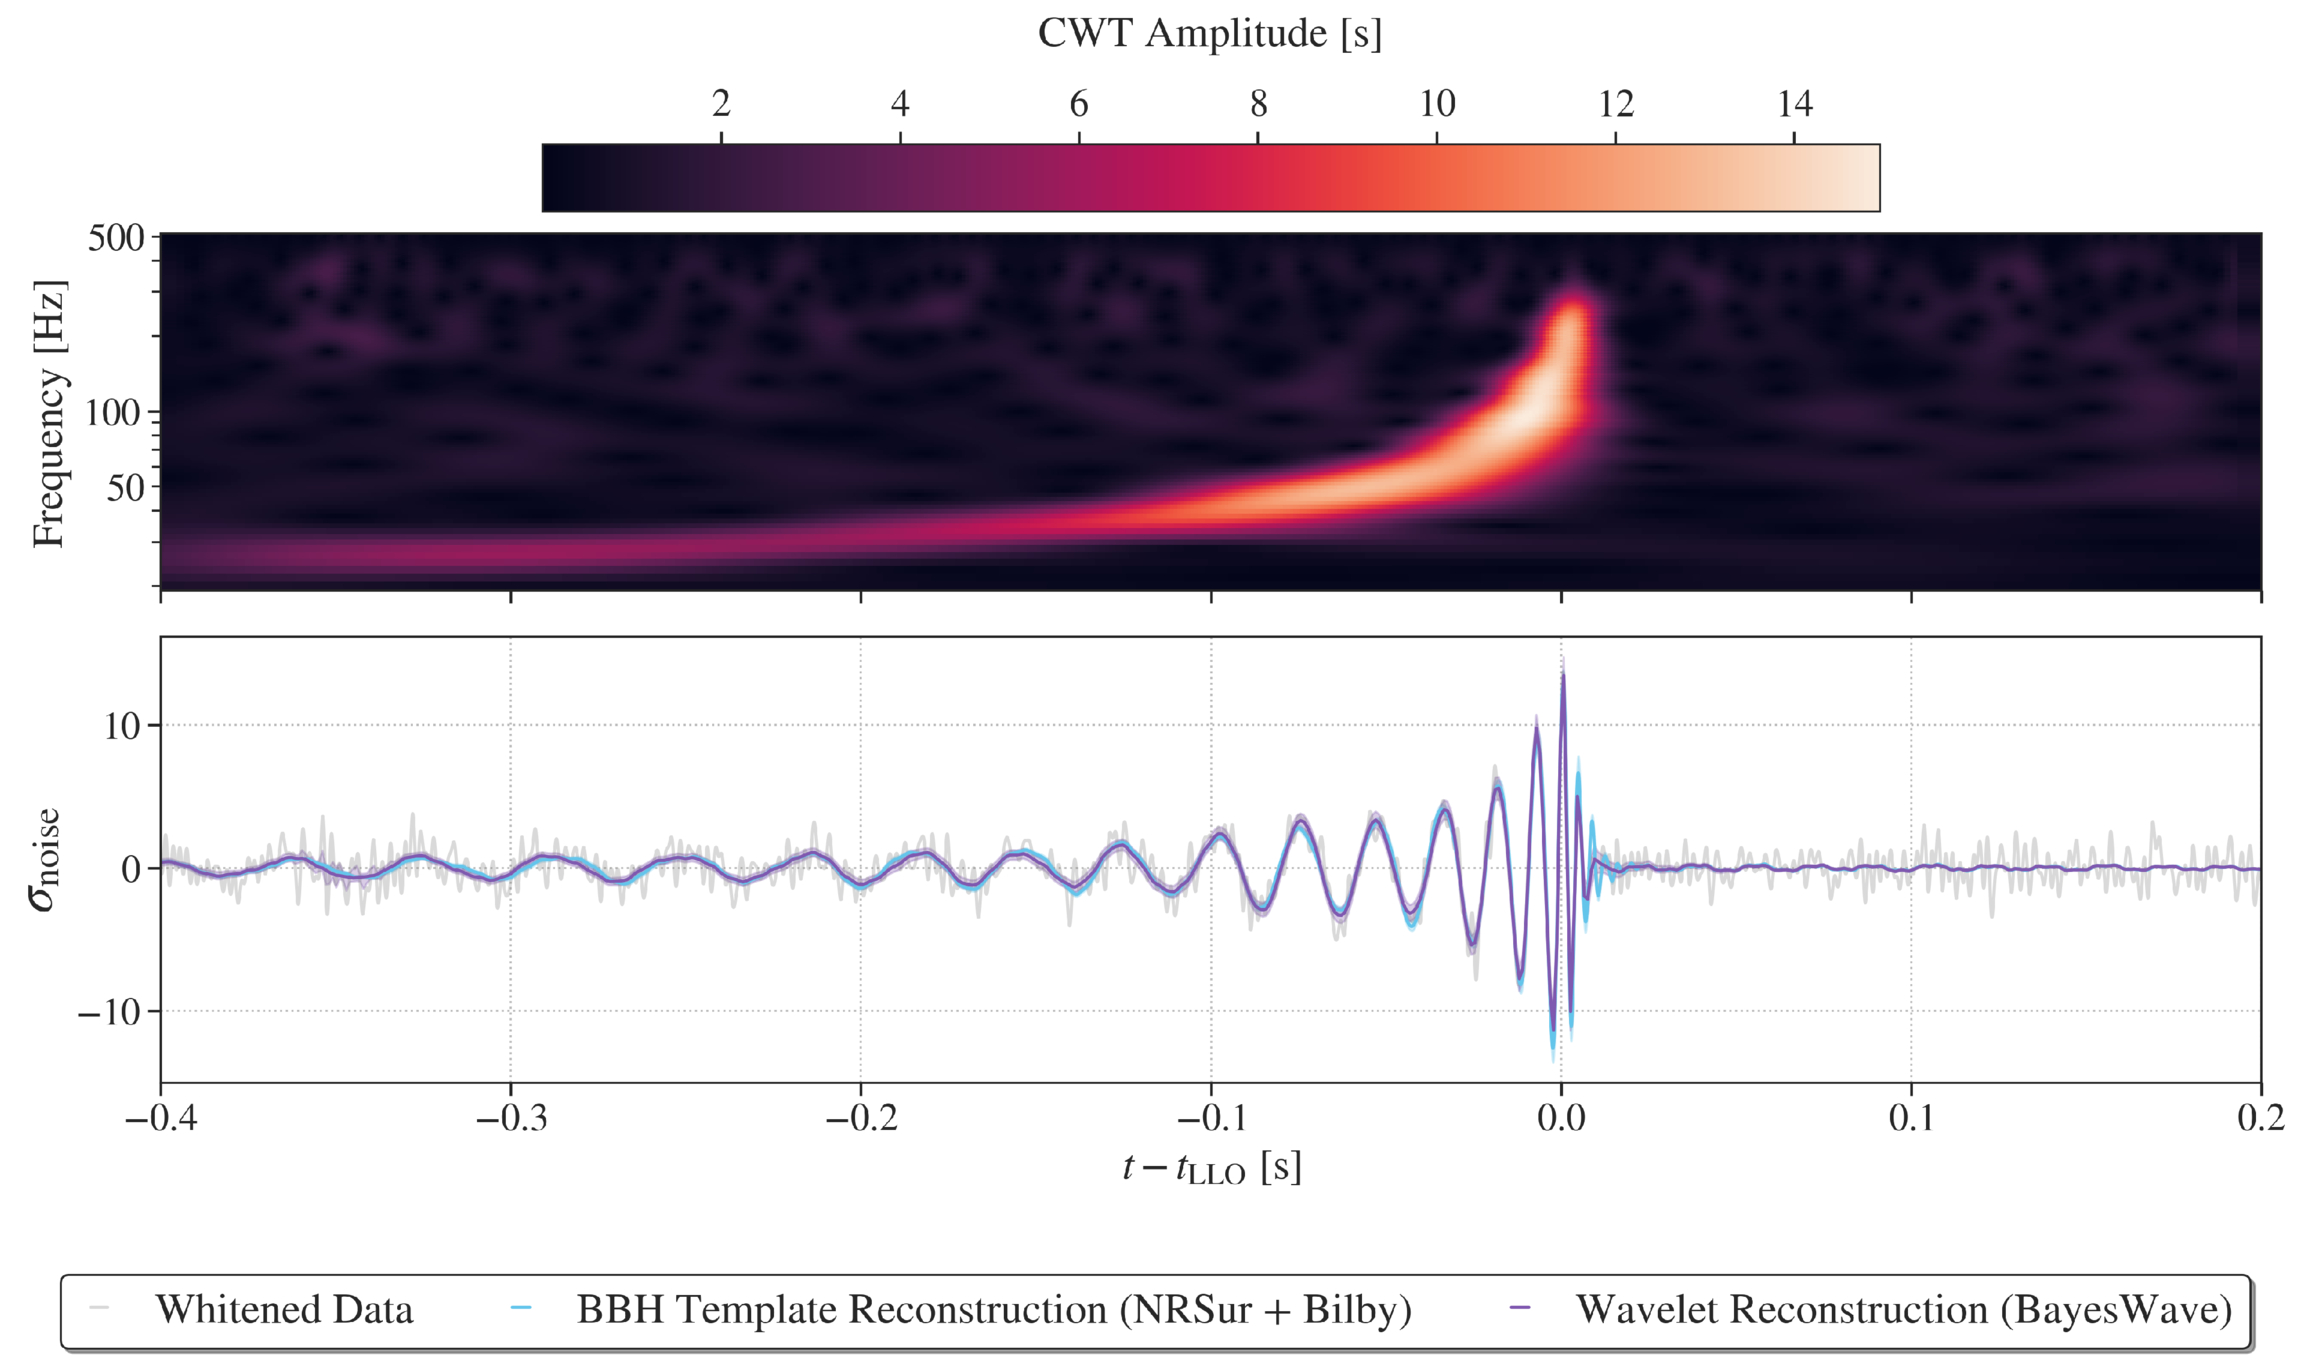
Representations of the GW230814 gravitational wave signal. Click to enlarge. [LVK Collaboration 2026]
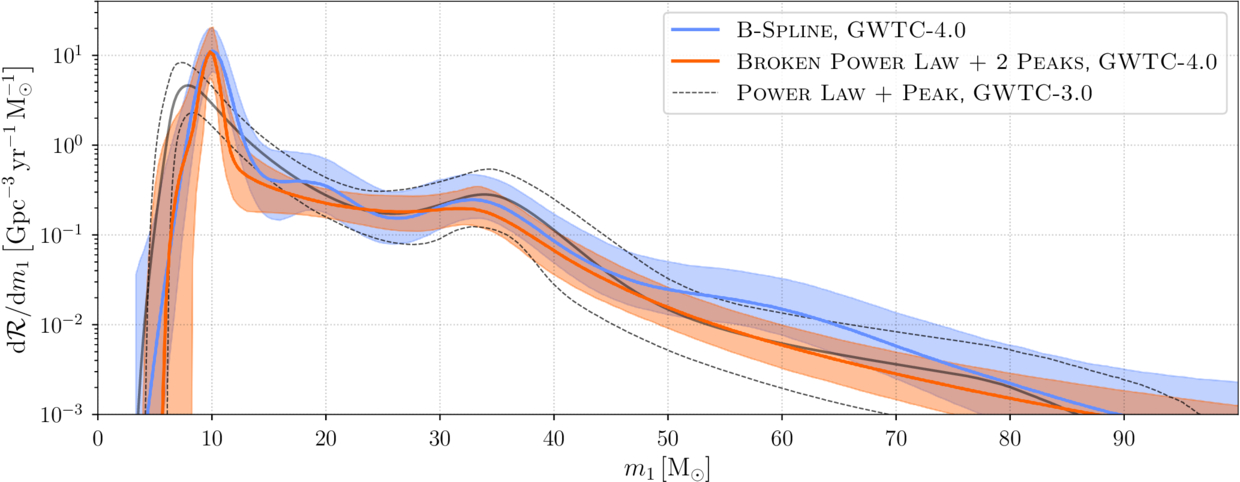
Plot of the differential merger rate as a function of the mass of the more massive of the two merger components. This shows overdensities at 10, 35, and possibly 20 solar masses. Click to enlarge. [LVK Collaboration 2026]
The full list of articles in the GWTC-4.0 Focus Issue can be found here.
Citation
“GWTC-4.0: An Introduction to Version 4.0 of the Gravitational-Wave Transient Catalog,” A. G. Abac et al 2025 ApJL 995 L18. doi:10.3847/2041-8213/ae0c06
“GWTC-4.0: Methods for Identifying and Characterizing Gravitational-Wave Transients,” A. G. Abac et al 2026 ApJL 1004 L21. doi:10.3847/2041-8213/ae447b
“Open Data from LIGO, Virgo, and KAGRA Through the First Part of the Fourth Observing Run,” A. G. Abac et al 2026 ApJ 1004 232. doi:10.3847/1538-4357/ae211e
“GWTC-4.0: Updating the Gravitational-Wave Transient Catalog with Observations from the First Part of the Fourth LIGO–Virgo–KAGRA Observing Run,” A. G. Abac et al 2026 ApJL 1004 L22. doi:10.3847/2041-8213/ae2c74
“GW231123: A Binary Black Hole Merger with Total Mass 190–265 M⊙,” A. G. Abac et al 2025 ApJL993 L25. doi:10.3847/2041-8213/ae0c9c
“GW230814: Investigation of a Loud Gravitational-Wave Signal Observed with a Single Detector,” A. G. Abac et al 2026 ApJL 1004 L23. doi:10.3847/2041-8213/ae2ad3
“GWTC-4.0: Population Properties of Merging Compact Binaries,” A. G. Abac et al 2026 ApJL 1005 L51. doi:10.3847/2041-8213/ae771e
The post Monthly Roundup: The Fourth Catalog of Gravitational Wave Events from LIGO, Virgo, and KAGRA appeared first on AAS Nova.
]]>
Astrobites reports on the interplay between the interstellar medium and star formation in simulated galaxies.
The post The “Rhythm” of the Interstellar Medium appeared first on AAS Nova.
]]>Editor’s Note: Astrobites is a graduate-student-run organization that digests astrophysical literature for undergraduate students. As part of the partnership between the AAS and astrobites, we occasionally repost astrobites content here at AAS Nova. We hope you enjoy this post from astrobites; the original can be viewed at astrobites.org.
Title: The Rhythm of the ISM: Tracing the Timescales of Gas Evolution and Star Formation Across Galactic Environments
Authors: Zuzanna Kocjan and Vadim A. Semenov
First Author’s Institution: University of Maryland
Status: Published in ApJ
The Connection Between Gas and Star Formation in Galaxies
Stars are born in the interstellar medium (ISM) when cold, dense clouds of gas become unstable and collapse under gravity. Despite their plentiful reservoirs of gas, galaxies convert only a small fraction of this material into stars, making star formation a surprisingly inefficient process. A key factor behind this inefficiency is stellar feedback: radiation, stellar winds, and supernova explosions from young stars can inject energy and momentum into the surrounding gas, heating, stirring, and dispersing it. In this way, stellar feedback shapes future star formation across scales ranging from individual regions in the ISM to whole galaxies.
An important tool astronomers use to study star formation is the Kennicutt–Schmidt relation, which links the amount of gas in a galaxy to the rate at which stars form. More specifically, it relates the gas surface density, Σgas, to the star formation rate surface density, ΣSFR. (For more on this relation, see this Astrobites article on a classic research article.) However, this law is underpinned by a crucial ingredient: timescales. In particular, the pace of star formation depends both on how quickly galactic gas is cycled into star-forming material and on how rapidly those regions convert gas into stars once they form. Today’s article investigates the physical origin of star-formation scaling relations behind the Kennicutt–Schmidt law by building on a simple theoretical framework for the ISM.
Consider a Kettle of Boiling Water…
In a given region of a galaxy, the ISM consists of gas in either an actively star-forming state or an inert, non-star-forming state, depending on whether it is dense and unstable enough to collapse (as illustrated in Figure 1). The transition of non-star-forming gas into the star-forming state occurs on the supply timescale, τ+. Conversely, the dispersal of star-forming gas back into a non-star-forming state is characterized by the removal timescale, τ–. As a helpful analogy, the authors compare this process to water boiling in a kettle: the ISM is continuously “boiling,” with gas moving between active and inactive states. Meanwhile, the total gas reservoir gradually decreases, analogous to water slowly evaporating as the kettle boils. The gas depletion time, τ*, therefore represents the timescale over which the available gas would be exhausted by star formation.

Figure 1: Schematic of the gas cycling framework used in the authors’ theoretical model for how gas is converted into stars, which takes into account a supply, removal, and depletion timescale. [Adapted from Kocjan and Semenov 2026]
The Timescales of the Interstellar Medium
To explore how gas and star formation are connected across different galactic environments, the authors analyze three simulated systems: a dwarf galaxy, a Milky Way–like galaxy, and a gas-rich starburst galaxy, as shown in Figure 2. Despite spanning very different physical regimes, the galaxies exhibit remarkably similar trends in the fraction of gas actively forming stars as a function of Σgas. This suggests that the amount of star-forming gas is governed primarily by local interstellar conditions, since regions with higher gas surface densities tend to contain denser, more strongly self-gravitating gas.

Figure 2: Using simulations (left to right) of an isolated intermediate-mass dwarf galaxy, Milky Way–like galaxy, and gas-rich galaxy, the authors measure the star-forming gas fraction versus the gas surface density (right). [Adapted from Kocjan and Semenov 2026]

Figure 3: Scaling relations between the supply (left), depletion (middle), and removal (right) times in kiloparsec-scale regions of the simulated galaxies (shown in different colors). Based on the measurements from the simulations, the authors introduce a parameterized model for the gas cycling framework, as defined in the equations. [Adapted from Kocjan and Semenov 2026]
Original astrobite edited by Jayde Willingham.
About the author, Shalini Kurinchi-Vendhan:
After studying astrophysics and literature at Caltech, I moved onto a Fulbright Fellowship in Heidelberg, Germany. I’m passionate about using computer simulations to explore supermassive black holes and galaxy evolution — but I also love poetry and traveling.
The post The “Rhythm” of the Interstellar Medium appeared first on AAS Nova.
]]>
What powers the prominent helium emission from Hebe, a gas clump seen just 450 million years after the Big Bang?
The post First-Generation Stars Provide Better Fit than a Black Hole for Early-Universe Gas Clump appeared first on AAS Nova.
]]>An unusual clump of gas 450 million years after the Big Bang may contain stars hailing from the universe’s elusive first generation of stars. New research examines an alternative explanation involving an accreting black hole.
Meet Hebe
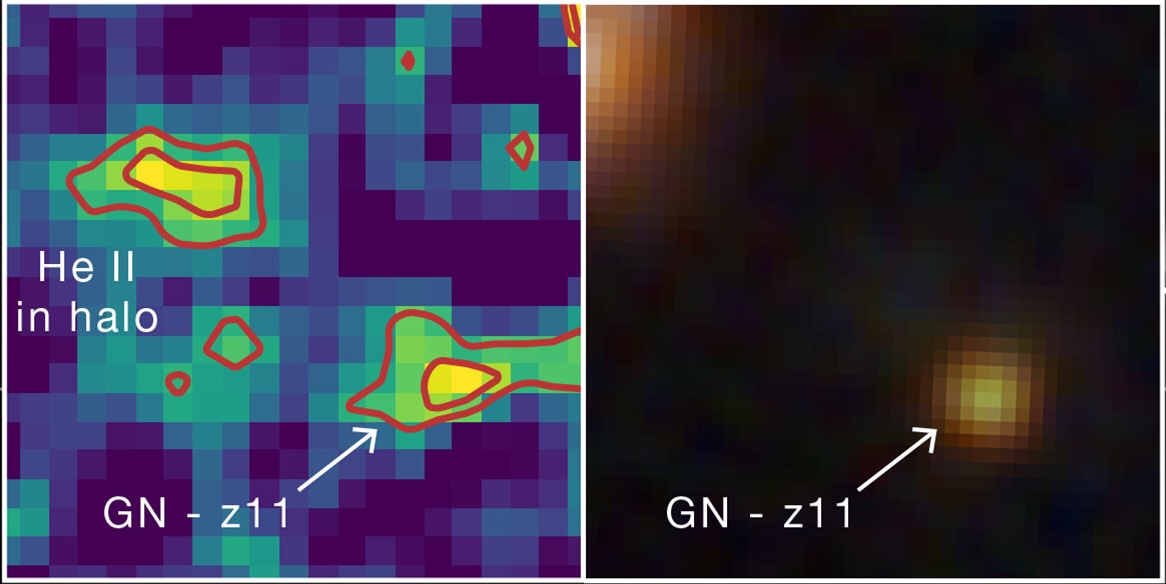
Hebe is visible in the image on the left as a prominent blob of helium emission up and to the left from GN-z11, a luminous galaxy hosting an accreting supermassive black hole. On the right is an infrared image of the same region, in which Hebe is not visible. Click to enlarge. [Adapted from NASA, ESA, CSA, Ralf Crawford (STScI)]
Before the community settles on this exciting explanation, however, the hypothesis must withstand all the tests astronomers can throw at it. In a recent research article, Junehyoung Jeon, Tae Bong Jeong, and Saiyang Zhang (The University of Texas at Austin) along with Volker Bromm (The University of Texas at Austin) attempted to explain Hebe’s properties in another way.
Considering Alternatives
Hebe glows with distinctive helium emission that requires a source of high-energy radiation. This radiation could be provided by a cluster of Pop III stars, but it could also, in theory, arise from an accreting supermassive black hole embedded within the gas clump.
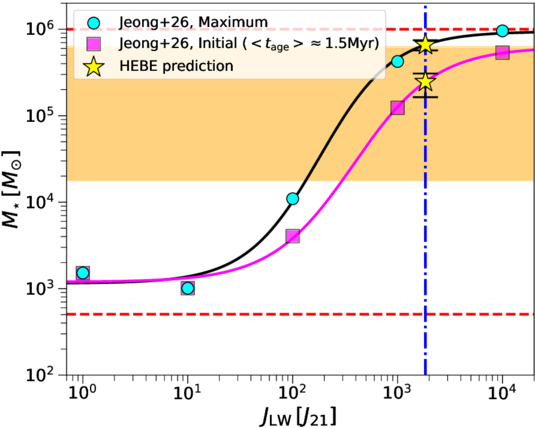
Predicted total mass of Hebe’s Pop III stars as a function of the Lyman–Werner flux from the nearby galaxy GN-z11. Click to enlarge. [Jeon et al. 2026]
Still a Leading Explanation
While the black hole scenario could, with reasonable black hole masses, gas densities, and accretion rates, reproduce individual flux measurements drawn from JWST observations, this hypothesis struggled to simultaneously match multiple measurements. The Pop III star cluster scenario, with a cluster mass of a few hundred thousand solar masses, provided the best fit to the JWST data.
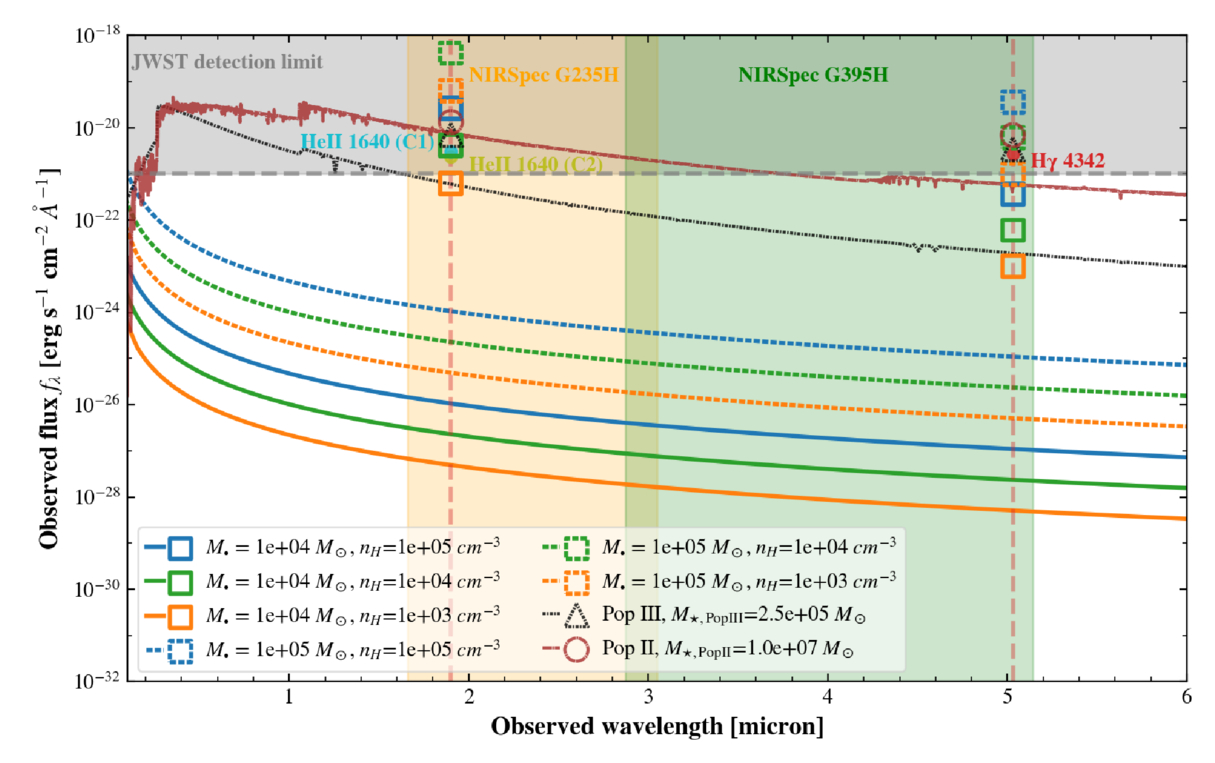
Modeled spectral energy distributions (lines) and predicted line flux densities (open symbols) for the accreting black hole, Pop III star, and Pop II (second-generation) star hypotheses. The observed JWST line fluxes are shown as filled circles. Click to enlarge. [Jeon et al. 2026]
While a cluster of Pop III stars is still the leading explanation for Hebe’s properties, the team noted that the Pop III star and black hole hypotheses aren’t mutually exclusive; Hebe could very well harbor a primordial black hole and a smattering of Pop III stars. Regardless of what powers its characteristic helium emission, Hebe offers an enticing glimpse into the early universe, and more work is needed to understand this intriguing object.
Citation
“What Is Powering the Enigmatic He II Emitter Hebe: The First Stars or Black Holes?” Junehyoung Jeon et al 2026 ApJ 1006 27. doi:10.3847/1538-4357/ae7bea
The post First-Generation Stars Provide Better Fit than a Black Hole for Early-Universe Gas Clump appeared first on AAS Nova.
]]>
How did neon end up inside Earth's mantle, and what does that tell us about how our planet formed?
The post Noble Gases Along for the Ride appeared first on AAS Nova.
]]>What can some neon trapped in a chunk of rock tell us about Earth’s formation and the protosolar nebula? Quite a lot, as detailed in a recent study in The Planetary Science Journal.
Noble Mysteries
By analyzing rocks pulled from mid-ocean ridges, geologists have concluded that there are tiny amounts of noble gases in the deep interior of Earth. That’s a strange statement upon reflection: how did these gases, which are famously apathetic to essentially all other elements, end up embedded within rocks thousands of kilometers underground? Since their passivity rules out the potential of a chemical reaction that formed them in place, they must have been in the mantle since the very beginning of Earth’s history.
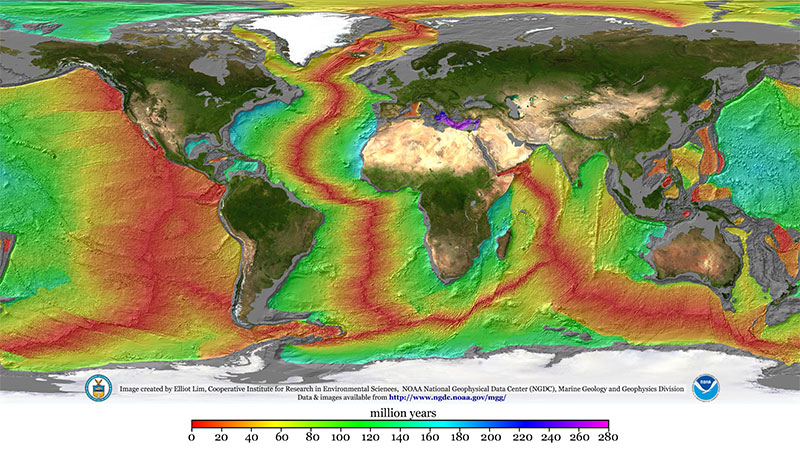
A map illustrating the age of the seafloor. Mid-ocean ridges stand out clearly in red. By sampling material from these ridges, planetary scientists can infer the composition of Earth’s deep interior. Click to enlarge. [Mr. Elliot Lim, CIRES and NOAA/NCEI]
That last option is especially exciting to present-day planetary scientists interested in constraining Earth’s formation history because it requires some very specific conditions. Since light noble gases like neon don’t dissolve well in seawater, they must have dissolved into a magma ocean — meaning the nebula was still around when Earth was large enough to have a molten surface. That already restricts us to a very specific time in the solar system’s history, but it doesn’t say much about the specific size of the proto-Earth other than “big,” and it doesn’t say much about the state of the nebula other than “it existed.” Recently, Vincent Savignac and Eve Lee (University of California, San Diego; McGill University) successfully refined these constraints to pin down information about both the early Earth and the nebula that surrounded it.
Infant Earths
Savignac and Lee began by growing a grid of infant Earths on their computers via models of gas accretion and atmosphere–magma interactions. Each simulation started with a different proto-Earth mass and nebular density, and each one yielded a different amount of neon in Earth’s deep interior. Excitingly, only a small handful of the scenarios tested ended up with values similar to those observed.
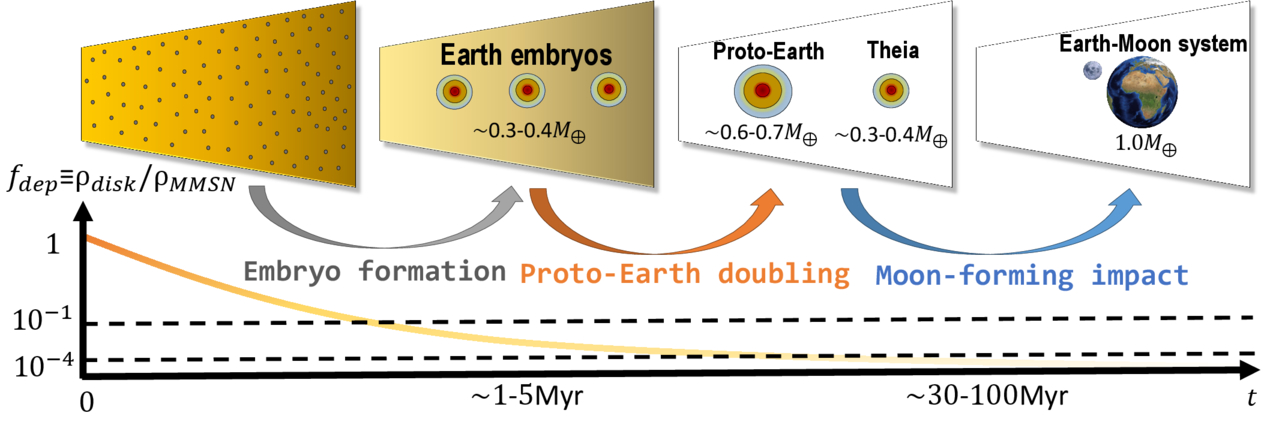
A schematic of Earth’s formation via embryo formation (when the noble gases enter the mantle) followed by mergers. Click to enlarge. [Savignac & Lee 2026]
Savignac and Lee demonstrated that these constraints are robust against the later stages of Earth’s evolution. In its later years, Earth either suffered or benefited from a giant impact, depending on your feelings about the Moon, but the researchers showed that this event doesn’t pose a problem for their models. Overall, this study builds a delightful link between rocks from our deep oceans and the particulars of Earth’s formation, demonstrating the unique power of planetary science to tie together different scientific fields.
Citation
“Constructing the Earth’s Formation History Using Deep Mantle Noble Gas Reservoirs,” Vincent Savignac and Eve J. Lee 2026 Planet Sci. J. 7 135. doi:10.3847/PSJ/ae64f7
The post Noble Gases Along for the Ride appeared first on AAS Nova.
]]>
Hydrocarbons keep turning up in surprising places. This time, they've been found near a pair of accreting supermassive black holes 3 billion years after the Big Bang.
The post Researchers Spot Hydrocarbons Surprisingly Close to a Quasar Pair appeared first on AAS Nova.
]]>Researchers have detected molecules containing rings and chains of carbon atoms in the vicinity of a rare pair of quasars. The trends in the distribution of these molecules are unexpected, suggesting that more work is needed to understand the conditions surrounding active supermassive black holes.
Infrared Eyes on Molecules in Space
Examples of aromatic and aliphatic hydrocarbons. Benzene (top left) is the simplest aromatic molecule. Propane (top right) is a simple aliphatic molecule. Propylbenzene (bottom) is an aromatic molecule with an aliphatic chain branching off of it. In these “skeletal” formulae, there is a carbon atom at each vertex, and the remaining atoms (not depicted) are all hydrogens. Single lines indicate single chemical bonds, and double lines indicate double bonds. [Wikipedia; Public Domain]
JWST’s sensitive infrared eyes have allowed researchers to study the distribution, creation, and destruction of both aromatic (containing one or more rings of carbon atoms in which certain electrons spread out within the ring) and aliphatic (containing chains of carbon atoms) hydrocarbons. These molecules have been spotted in a wide array of environments, and now, astronomers are finding them in more distant and more extreme environments than ever before.
Distant Discovery
SDSS J074922.96+225511.7, or J0749+2255 for short, is a quasar pair seen 3 billion years after the Big Bang. The two feasting supermassive black holes are roughly 12,000 light-years apart, giving researchers a glimpse into the late stages of a galaxy merger and a harsh environment in which to study the survival and destruction of molecules.
Researchers studying J0749+2255 with JWST have previously reported the detection of a 3.3-μm emission feature from aromatic molecules. Now, C. E. Mentzer (University of Missouri), Aigen Li (University of Missouri), and Xuejuan Yang (Xiangtan University) have analyzed JWST spectra of J0749+2255 and found not just widespread aromatic emission at a rest-frame wavelength of 3.3 μm, but also aliphatic emission at 3.4 μm, which they attribute to carbon chains branching off from the aromatic molecules. This likely makes J0749+2255 the most distant galaxy in which both aromatic and aliphatic emission has been detected.
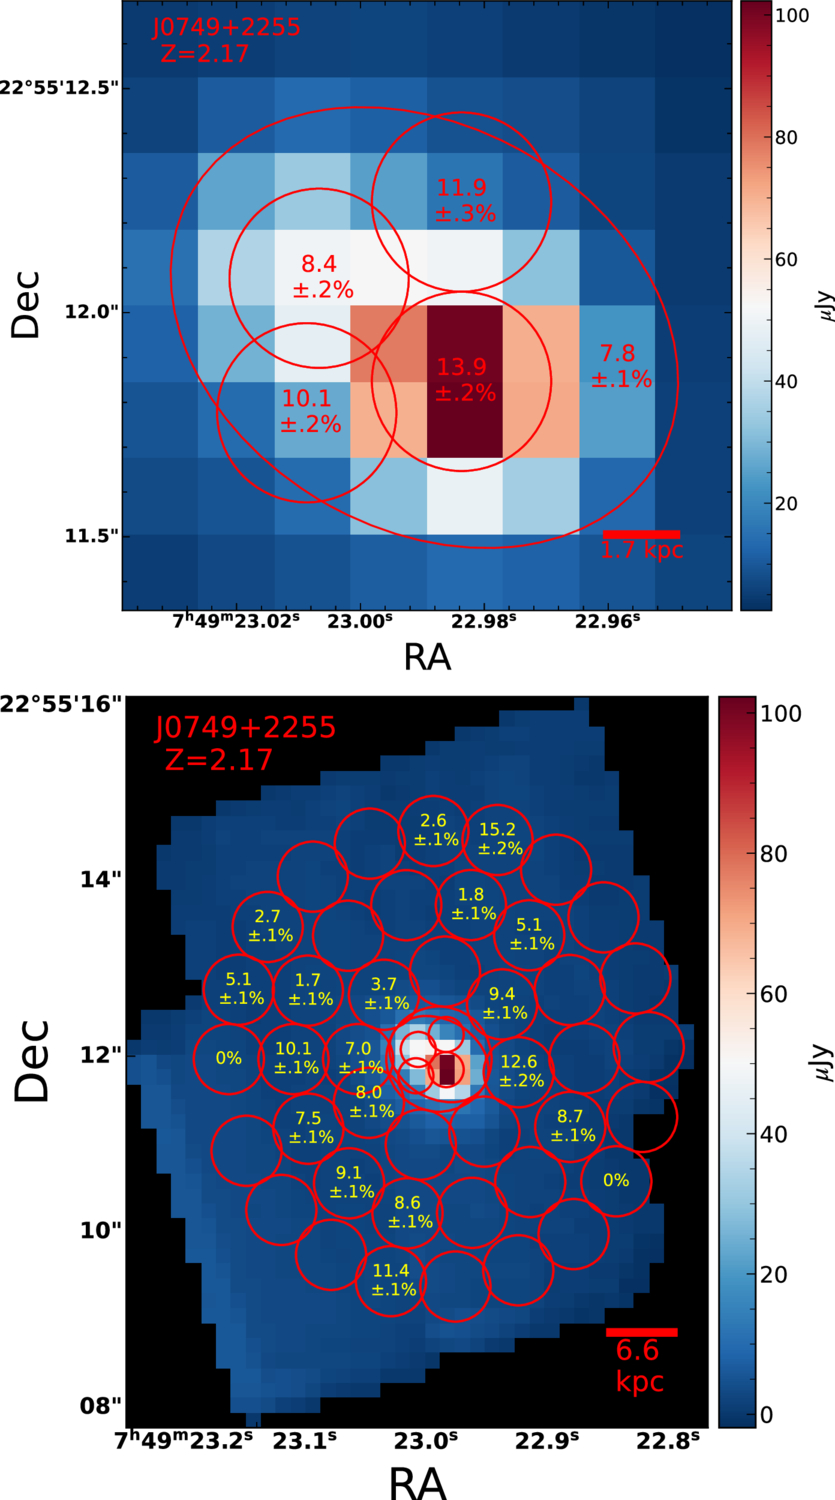
Aliphatic fractions in the bright central region surrounding the two quasars (top) and in the outer regions (bottom). [Mentzer et al. 2026]
Unexpected Trends
Mentzer, Li, and Yang subdivided the observations into 47 regions and measured the strength of the 3.3- and 3.4-μm features in each region. This analysis found strong aromatic emission nearest the quasars and showed that the fraction of carbon atoms bound up in aliphatic chains is highest close to the quasars.
Both of these findings are unexpected: the harsh radiation environment near the two active black holes is thought to break apart chains of carbon atoms attached to aromatic rings (which should decrease the 3.4-μm emission) and possibly destroy small aromatic molecules (which should decrease the 3.3-μm emission) — yet both of these features are strongest near the quasar cores where the radiation should be most capable of molecular destruction.
The authors speculated that the analysis regions centered on the quasars are large enough that they contain gas that hasn’t been pummeled by the quasars’ intense radiation and outflows, leaving molecules intact and able to produce the observed emission. However, this doesn’t explain the trend of stronger 3.3- and 3.4-μm emission closer to the quasars — necessitating further research into the emitting behavior of aromatic and aliphatic molecules under the extreme conditions of a dual quasar’s neighborhood.
Citation
“Widespread Detection of Aromatic and Aliphatic Emission in the Dual Quasar J0749+2255 at Cosmic Noon,” C. E. Mentzer et al 2026 ApJL 1005 L38. doi:10.3847/2041-8213/ae7e86
The post Researchers Spot Hydrocarbons Surprisingly Close to a Quasar Pair appeared first on AAS Nova.
]]>
Astrobites reports on whether we'd even know what we were looking at if our familiar red neighbor were a stranger light-years away.
The post What if Mars Were a Stranger (Thing)? appeared first on AAS Nova.
]]>Editor’s Note: Astrobites is a graduate-student-run organization that digests astrophysical literature for undergraduate students. As part of the partnership between the AAS and astrobites, we occasionally repost astrobites content here at AAS Nova. We hope you enjoy this post from astrobites; the original can be viewed at astrobites.org.
Title: Mars as an Exoplanet: Lessons from a Planet at the Edge of Habitability
Authors: Stephen R. Kane et al.
First Author’s Institution: University of California, Riverside
Status: Published in PSJ
Mars in the Upside Down
If you’re a fan of Stranger Things like me, you’ll know of the Upside Down: a mirror world similar to our own, but with very different rules. Imagine Mars in the Upside Down, where it is no longer our next-door neighbor but a planet hundreds of light-years away. An astronomer on this Upside Down Earth would be looking at a distant speck with a transit signal barely distinguishable from noise. In this world, Mars would no longer be familiar but completely foreign, with unknown properties. Kane et al. suggest that treating Mars as if it were a stranger is a useful way to think about exoplanet science today.
JWST is hunting for atmospheres on small rocky planets around other stars. However, only a select few Mars-like exoplanets have been discovered (Figure 1). This is because sub-Earth planets are small and hard to detect, testing the bounds of current technology. The ones that have been discovered, such as TRAPPIST-1h and Kepler-138b, were detected due to favorable geometry. They happen to orbit very close to a low-mass star or sit in resonant multi-planet systems, which amplify the signal we are looking for. True Mars analogs with low flux and moderate orbital periods remain out of reach. This is precisely what makes Mars itself so important scientifically — it is the only planet of this type we can study up close.
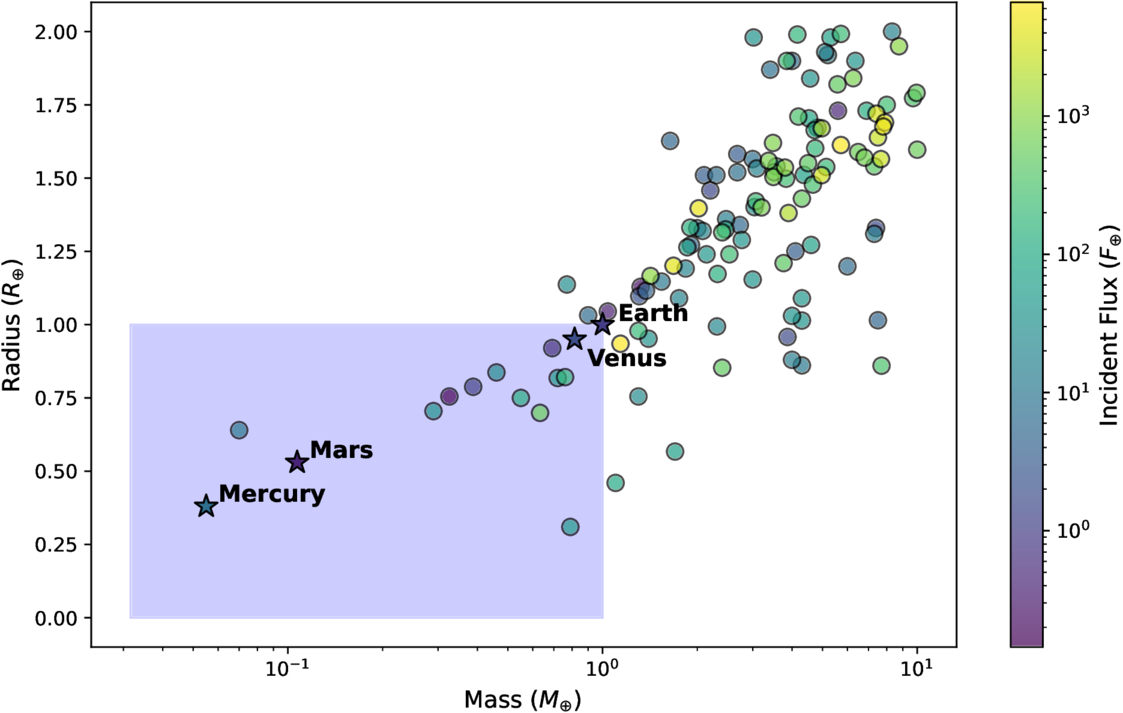
Figure 1: A plot of confirmed exoplanets by mass and radius. Most confirmed exoplanets are larger and more massive than Earth. Mars-like planets (dots in the blue box) are rare in confirmed exoplanet detections. [Kane et al. 2026]
Getting to Know Mars, Getting to Know All About Mars
We know a lot about Mars in comparison to other planets thanks to rovers (such as Curiosity and Perseverance), atmospheric orbiters (such as Mars Atmosphere and Volatile EvolutioN and the Mars Orbiter Mission), and other science missions (Figure 2). We know it once had water features with neutral pH and favorable chemistry for life from sedimentary evidence at the Gale and Jezero craters. We know its atmosphere is 95% CO2 with a surface pressure less than 1% of Earth’s. We know it once had an active magnetic dynamo, but the dynamo died out about 4 billion years ago, leading to solar wind steadily stripping away Mars’s atmosphere over time.
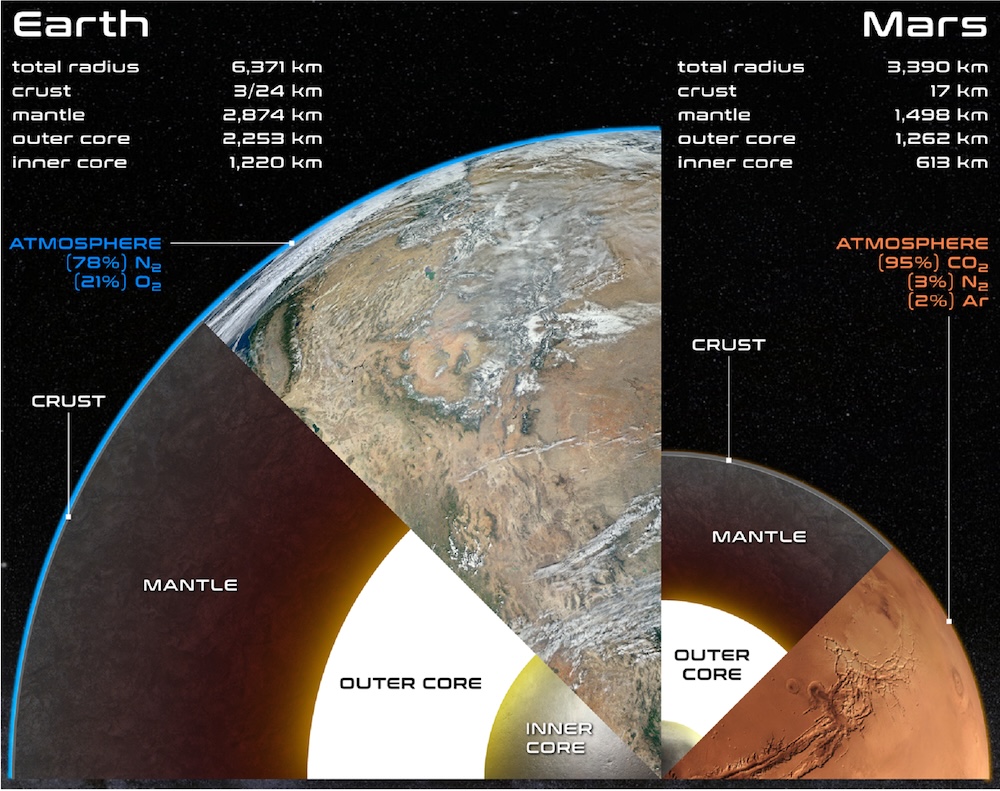
Figure 2: Earth and Mars to scale, showing their internal structures and atmospheres. Despite being neighbors, Mars is dramatically smaller with a thin CO2 atmosphere, similar to the planets JWST is struggling to characterize. [Kane et al. 2026]
Beyond Our Backyard
JWST is currently studying the small rocky TRAPPIST-1 planets and is finding little evidence of atmospheres. The authors of today’s article explore the idea that these exoplanets are similar to Mars and perhaps are undergoing processes that strip away their atmospheres and create optimal conditions for life only for short durations. Using Mars as a blueprint, the authors show how we can better understand exoplanet processes, including volatile delivery and loss, photochemistry, climate evolution, obliquity forcing, planetary architecture, and intrinsic magnetism. For example, measurements of noble gases directly fingerprint Mars’s atmospheric escape process, and the authors argue these give us a calibration framework for interpreting future exoplanet spectra.
The upcoming Nancy Grace Roman Space Telescope’s microlensing survey will start revealing how common true Mars analogs actually are throughout the galaxy, while the future Habitable Worlds Observatory will attempt direct imaging of nearby candidates with unprecedented precision. Together, these missions will tell us whether Mars-like outcomes (brief habitability, catastrophic atmospheric loss, barren surfaces, etc.) are the default fate for small rocky planets. Interpreting that data will require the exact framework this article builds: one grounded in the only Mars analog we can study in detail.
Original astrobite edited by Sandy Chiu.
About the author, Ben Sherwin:
I am a physics PhD student and a National Science Foundation Graduate Research Fellow at Stanford University, working with Josh Frieman. I am interested in theoretical and observational cosmology, specifically in cross-correlations between the cosmic microwave background and tracers of large-scale structure.
The post What if Mars Were a Stranger (Thing)? appeared first on AAS Nova.
]]>
The galaxies FCC 224 and FCC 240 appear to be a rare example of a dark-matter-poor, globular-cluster-rich pair formed via colliding dwarf galaxies.
The post Featured Image: A Rare Pair of Galaxies Lacking Dark Matter appeared first on AAS Nova.
]]>This image, which combines a background view from the Dark Energy Camera Legacy Survey with two inset images from the Very Large Telescope, shows an unusual pair of galaxies in the Fornax Cluster. The galaxies FCC 224 and FCC 240 are under scrutiny because they may have formed via a high-velocity collision between dwarf galaxies — the so-called “bullet-dwarf” model. Using new spectroscopy from the Very Large Telescope, Maria Luísa Buzzo (Yale University) and collaborators analyzed the ages and kinematics of the galaxies’ stars as well as the unusually bright globular clusters swirling around each galaxy. These data suggest that both galaxies are deficient in dark matter, and their stellar populations and globular clusters are all roughly 10 billion years old. The lack of dark matter and the uniform stellar ages are both consistent with the bullet-dwarf model, in which the collision strips away dark matter and ignites a burst of star formation. Since this type of collision can create more than two remnants, the team suggests searching along the trajectory defined by FCC 224 and FCC 240 for more fragments from the collision, some of which may contain the galaxies’ lost dark matter. To learn more about these galaxies and what they might mean for the bullet-dwarf mechanism, be sure to check out the full research article linked below.
Citation
“Dark-Matter-Deficient Twins: FCC 224 and FCC 240 as Possible Analogs of NGC 1052-DF2 and DF4,” Maria Luísa Buzzo et al 2026 ApJ 1005 15. doi:10.3847/1538-4357/ae7349
The post Featured Image: A Rare Pair of Galaxies Lacking Dark Matter appeared first on AAS Nova.
]]>
A recent study used the kinematics, chemical composition, and ages of thousands of stars to determine when the Milky Way settled into the spiral disk we know it as today.
The post Dating the Dawn of the Milky Way Disk appeared first on AAS Nova.
]]>The iconic disks of spiral galaxies are well known across the local universe and now far beyond. A recent study looks at the Milky Way to determine when its own disk emerged.
Spinning into Spirals
The Milky Way, a grand spiral galaxy with stars and gas rotating in a disk, did not always look this way. Galaxies begin as chaotic clumps of gas and stars inside a knot of dark matter, and at some point in time, spiral galaxies must transform into the flat rotating disks we observe them as today. Recent JWST observations have uncovered disk galaxies emerging much earlier in the universe than previously thought, shifting our understanding of how quickly spiral galaxies come together and settle into disks. While we cannot study the detailed assembly history of these very distant galaxies, we can dissect galaxies in the local universe to build a better timeline of galaxy evolution.
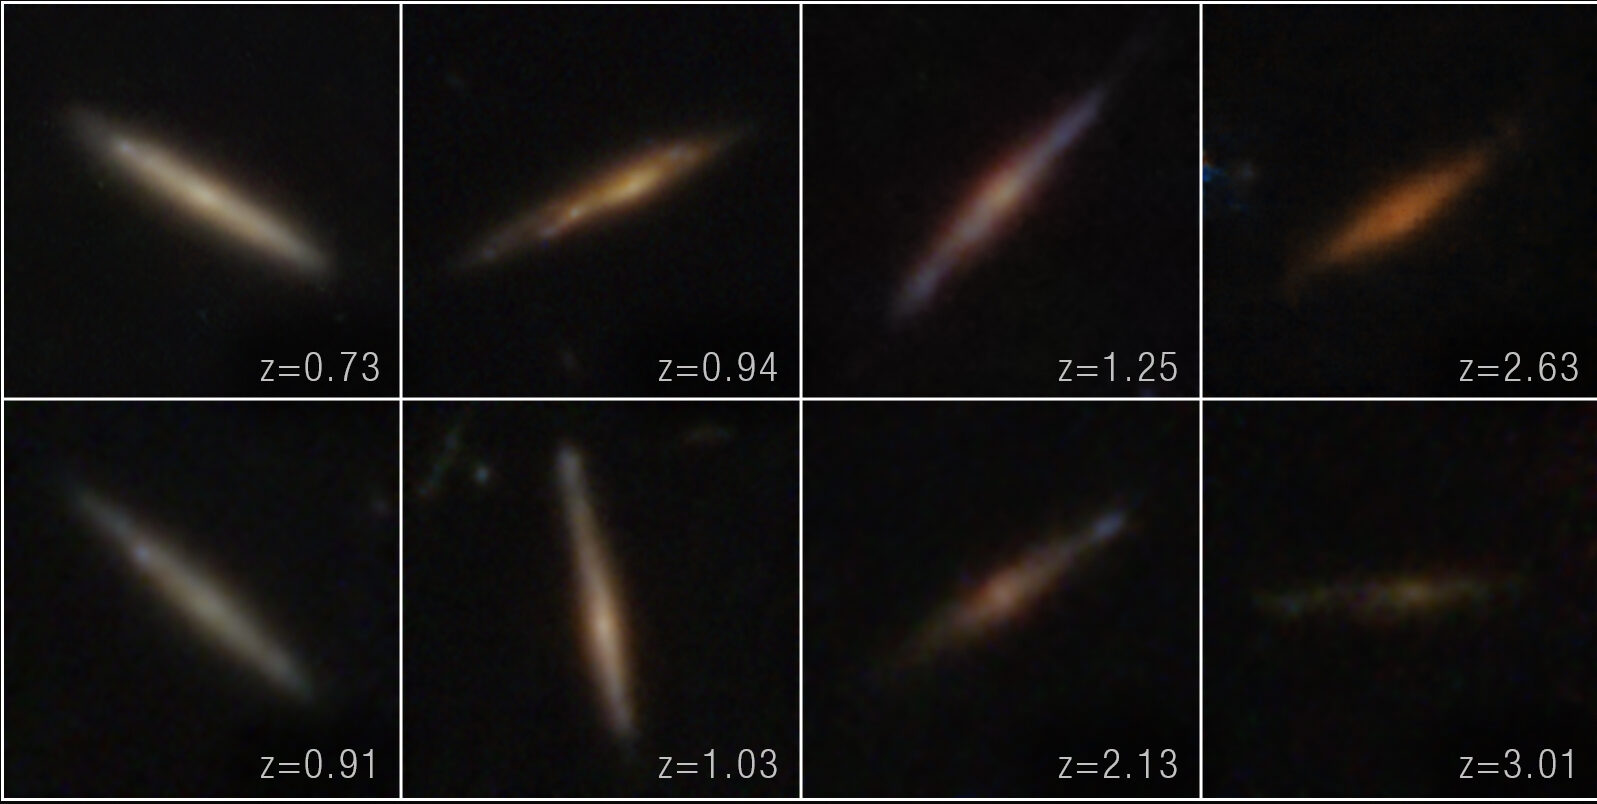
JWST images of distant edge-on galaxy disks [NASA, ESA, CSA, STScI, Takafumi Tsukui (ANU)]
Stars hold on to the kinematic and chemical information they are born with, so stars of different ages and metallicities across the galaxy should trace the development of the disk. Because stellar ages have been difficult to constrain observationally, studies of galactic spin-up have typically relied on readily available metallicity measurements as a proxy for age; however, metallicity is not a clear-cut age indicator, making it difficult to truly distinguish different stellar populations across the Milky Way’s disk. Luckily, new major surveys have recently provided stellar databases adding the stellar age measurements necessary to pin down when the Milky Way spun up.
Dawn of the Galactic Disk

Plots showing stellar age and rotational velocity (Vϕ) versus metallicity, [Fe/H]. The metallicity range where the age–[Fe/H] relation stalls coincides with the point when the Vϕ–[Fe/H] relation rapidly increases, indicating the age of the spin-up in the Milky Way. Click to enlarge. [Modified from Feltzing et al 2026]
With these star samples, Feltzing and team analyzed how both stellar rotational velocity and age varied with metallicity to determine when the Milky Way spun up. They found that high-α stars clearly move from having random motions to being rotationally supported over a short range of metallicities about 12.5 billion years ago, while the low-α stars seem to begin in a rotating disk and stay there. When varying their selection criteria and looking at the full sample, the authors determined that the Milky Way spin-up happened between 12.1 to 12.5 billion years ago — the first time Milky Way spin-up has been age-dated in this way.
These results imply a rapid chemical evolution and change in kinematic properties as stars went from randomly orbiting to rotating in an ordered disk in the Milky Way. The authors suggest that future studies should focus on lower-metallicity stars to better disentangle stars in the disk from stars in the halo, which will lead to a more precise determination of the Milky Way’s spin-up. Upcoming large-scale surveys will make this possible and allow astronomers to build a better picture of galaxy formation in the early universe.
Citation
“Dawn of the Milky Way Disk: Determination of When a Rotationally Supported Disk Appears and Dating the Spin-up of the Disk,” Sofia Feltzing et al 2026 ApJL 1004 L28. doi:10.3847/2041-8213/ae6f14
The post Dating the Dawn of the Milky Way Disk appeared first on AAS Nova.
]]>
White dwarfs with metals in their spectra preserve a record of planets that once orbited them. New research examines these spectra for signs that the metals underwent technological processing.
The post Seeking Technosignatures in Polluted White Dwarfs appeared first on AAS Nova.
]]>White dwarfs often show signs of metals in their spectra, providing evidence that these evolved stars have accreted planetary material. Could white dwarf spectra also provide evidence for technological activity in these star systems?
A Record of Planets Past
When a Sun-like star reaches the end of its hydrogen-burning lifetime, it first puffs up into a red giant before exposing its white-hot core, which evolves into a white dwarf. This dramatic transition shakes up any planets that happened to be orbiting the star, and some close-in planets may end up crumbling apart, their rubbly remains peppering the surface of the white dwarf.
So far, astronomers have found hundreds of white dwarfs that appear to be polluted with heavy elements from their destroyed planets. These observations provide a valuable look into the bulk compositions of planetary materials outside our solar system. They may also provide a way to detect patterns of chemical abundances that are not natural, resulting from technological processes like industrial refining or the creation of alloys — in other words, a technosignature that is evidence of not just life, but technologically advanced life.
Seeking Signs of Technology
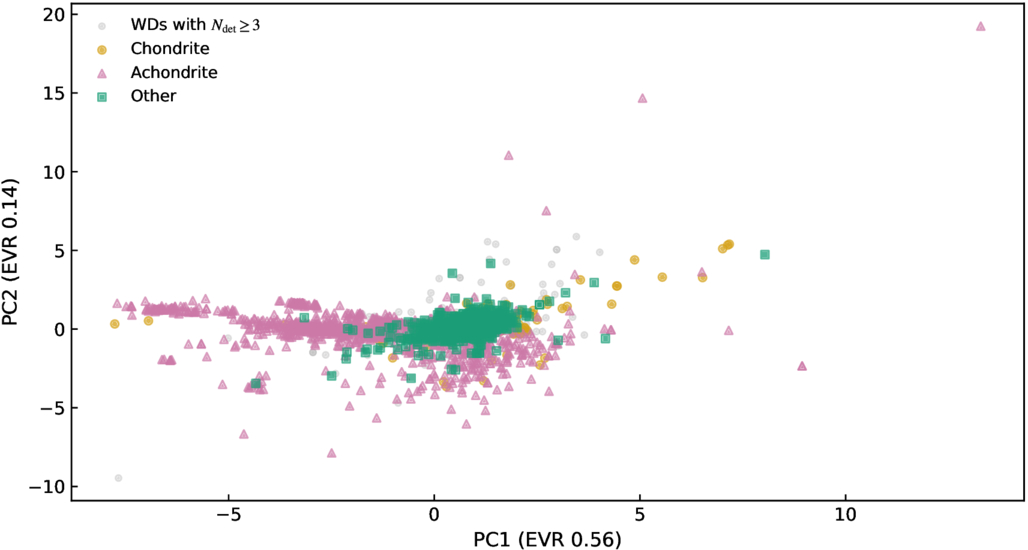
Representation of the chemical abundances of meteorites (pink, orange, and green) and white dwarfs (gray). Most white dwarf abundances overlap with the parameter space defined by the meteorite sample. Click to enlarge. [Huang et al. 2026]
The team used thousands of chemical abundance measurements from meteorites as a reference for the natural bulk composition of planetary material. For the mixture of natural and processed material, they combined the meteorite reference material with a template that is metal-rich and silicate-poor, with enhanced amounts of iron, nickel, chromium, and manganese.
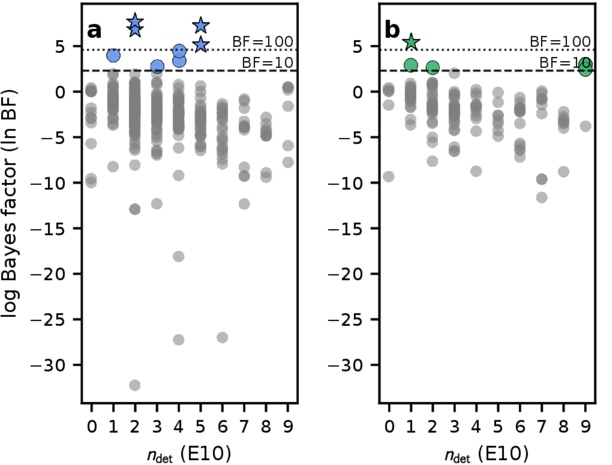
Evidence for a model including technologically processed material relative to a purely natural model, as a function of the number of elements detected in the white dwarf. ndet = 0 indicates that only upper limits were obtained on elemental abundances. Higher Bayes factors indicate stronger evidence. The left-hand plot is based on abundances measured from the white dwarfs’ photospheres, while the right-hand plot uses abundances adjusted for diffusion within the white dwarf. Click to enlarge. [Adapted from Huang et al. 2026]
No Strong Evidence, but a Path Forward
Ultimately, Huang’s team found that strong statistical support for the existence of technological processes was uncommon, though there were certain measurements in their sample of white dwarfs that were difficult to reconcile with a solely natural model.
Perhaps unsurprisingly, the team also found that the quality of the chemical abundance measurements affected the constraining power of the observation; some white dwarfs had upper limits for just a few elements, while others had definitive detections of many elements. They found that the most discerning observations recorded iron, magnesium, chromium, and titanium, plus either nickel, silicon, or sodium.
While this work didn’t dredge up firm evidence for technological activity, it provides a jumping-off point for future searches. The handful of white dwarfs in this sample that were fit poorly by a purely natural model could be compared against other technosignature models or targeted with high-resolution spectroscopy. Future measurements of iron and magnesium in polluted white dwarfs may be useful as a preliminary screening tool, helping to pick out intriguing targets for follow-up observations.
Citation
“A Calibrated Bayesian Search for Potential Chemical Technosignatures in Polluted White Dwarfs,” Bo-Lun Huang et al 2026 ApJ 1006 9. doi:10.3847/1538-4357/ae742c
The post Seeking Technosignatures in Polluted White Dwarfs appeared first on AAS Nova.
]]>
Astrobites reports on why dry planets may be missing the critical thermostat of the geologic carbon cycle, which has helped to stabilize Earth's climate over billions of years.
The post Can Arid Planets Keep Their Cool? appeared first on AAS Nova.
]]>Editor’s Note: Astrobites is a graduate-student-run organization that digests astrophysical literature for undergraduate students. As part of the partnership between the AAS and astrobites, we occasionally repost astrobites content here at AAS Nova. We hope you enjoy this post from astrobites; the original can be viewed at astrobites.org.
Title: Carbon Cycle Imbalances on Arid Terrestrial Planets with Implications for Venus
Authors: Haskelle T. White-Gianella and Joshua Krissansen-Totton
Authors’ Institution: University of Washington
Status: Published in PSJ
The Carbon-Cycle Thermostat
When discussing the habitability of planets, we usually focus on the habitable zone, the region around a star where a planet can host a temperature suitable for supporting liquid water on its surface. Yet, being in the right place doesn’t necessarily guarantee that a planet will be habitable.
A planet also needs the right atmospheric composition to sustain the necessary temperatures for hosting liquid water. A key mechanism found on Earth for maintaining this composition is the geologic carbon cycle, which acts as a built-in climate control system. This cycle begins with volcanic eruptions releasing carbon dioxide (CO2), which then dissolves in rainwater and forms a weak acid that weathers rocks on continents. The weathering products wash into oceans, where they form carbonate rocks, locking carbon away. Eventually, plate tectonics recycles some of that carbon back to volcanoes. The weathering process works faster when the planet is warmer, thus regulating the amount of CO2 and stabilizing the climate over long periods of time (but it should be noted that it can take up to a few hundred thousand years to rebalance this slow carbon cycle through the weathering process).
An important caveat is that the weathering process requires sufficient liquid water on the planet’s surface, so what happens in the case for planets with shallower oceans? Low-mass M dwarfs, the most common type of star found in the galaxy, are expected to host less-massive disks and therefore lower water inventories for forming planets. If more “dry” planets are indeed a more likely outcome of planet formation, we’d want to know how their arid conditions influence their long-term evolution and habitability.
Creating Carbon-Tracking Models
The authors built a model that tracks how water and CO2 move between a planet’s interior, oceans, and atmosphere over 4.5 billion years. The model notably includes the following:
- A sophisticated weathering model that accounts for how runoff can limit rock weathering, improving upon previous models that only included a temperature dependence on weathering
- Wind-driven evaporation limits that influence the amount of water evaporation in addition to sunlight-driven evaporation
- Multiple deep water cycle parameterizations that explore how water moves between the interior and the surface
The model tests for four initial surface water inventories (0.1%, 1%, 10%, and 100% of Earth’s oceans) and then simulates how the surface water, atmosphere, and climate evolve over time.
A Critical Water Threshold
The models reveal that planets require at least 20–50% of Earth’s ocean mass to maintain a balanced carbon cycle. Below this threshold, the carbon cycle becomes unbalanced, leading to devastating consequences for habitability (Figure 1).
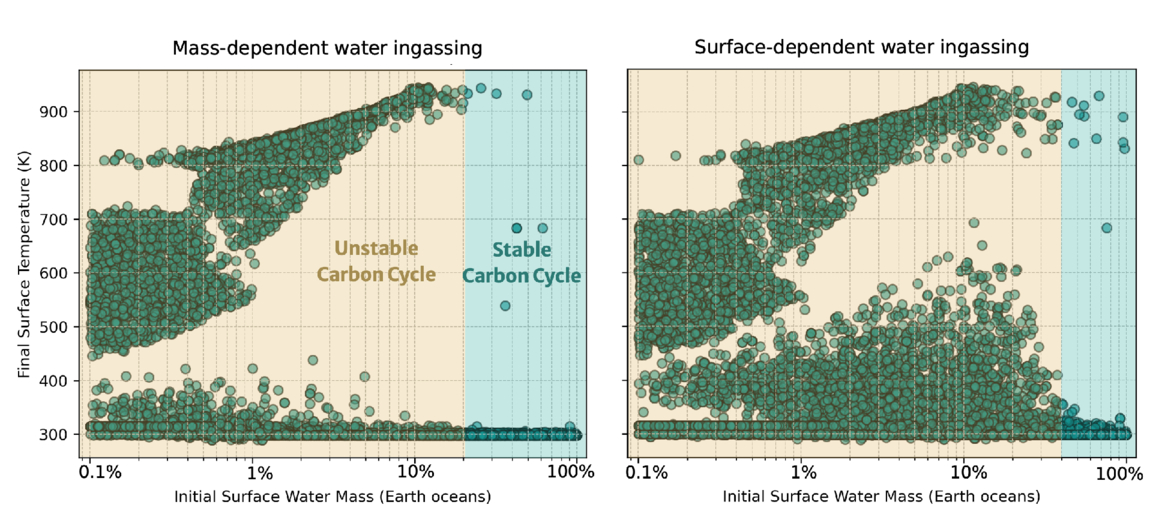
Figure 1: Final surface temperature after simulating 4.5 billion years of evolution as a function of initial water inventory for Earth-like planets. Each dot represents a model run with different assumptions (total carbon inventory, temperature dependence of weathering, soil age, etc.). The yellow region shows where most simulations result in uninhabitable surface temperatures from an unbalanced carbon cycle, and the cyan region shows where most simulations result in habitable surface temperatures and a balanced carbon cycle. The left and right plots show the results for two different parameterizations of the deep water cycle implemented in the model. [White-Gianella & Krissansen-Totton 2026]
Important Implications (Within and Outside Our Solar System)
Looking within the solar system, the results offer an explanation for how a potentially habitable Venus could have transitioned into its current inhospitable state. If Venus had formed with an initial water inventory below this critical threshold of 20–50% of Earth’s ocean mass, then its carbon cycle would have become unbalanced, creating the CO2 inferno seen on Venus today.
In future exoplanet studies, telescopes like the Habitable Worlds Observatory might detect ocean glint (specular reflection from liquid water) or measure land fraction from light curves. Finding a planet in the habitable zone but with limited ocean coverage would likely be bad news, as the planet could be quietly losing its grip on habitability. Astronomers may want to be more careful when looking at seemingly promising planets within their habitable zones.
Original astrobite edited by Natalie Price.
About the author, Jared Bull:
I am a 2nd-year PhD student at Johns Hopkins University. I study brown-dwarf variability and am interested in using time-series observations to uncover dynamic processes within their atmospheres. In my free time I like to read, cook, and do astrophotography.
The post Can Arid Planets Keep Their Cool? appeared first on AAS Nova.
]]>
When a powerful solar flare saturates a detector, the information about the flare is lost — or is it? New research validates a technique for extracting knowledge from saturated images of solar flares.
The post When the Spacecraft Align: Rescuing Saturated Images of Solar Flares appeared first on AAS Nova.
]]>Many observations of solar flares suffer from saturation and blooming, causing crucial information to be lost. Researchers recently validated a technique for retrieving information from saturated flare images, unlocking a treasure trove of powerful solar flares for examination.
Solutions for Saturation
Since 2010, the Atmospheric Imaging Assembly (AIA) on the Solar Dynamics Observatory (SDO) has been capturing nearly continuous extreme-ultraviolet images of the Sun’s disk, revealing our star’s dramatic high-energy behavior. Though SDO/AIA’s observations have transformed our understanding of the Sun’s activity, they have limitations: powerful solar flares can saturate the detector, spilling charge into nearby pixels.
This saturation and overflow compromises our ability to study the most energetic solar flares — but the “lost” information may actually be recoverable. When light from an intense flare enters SDO’s instruments, not all of it pools in the saturated region of the detector: some of the light is diffracted by the optics, and by mathematically inverting this pattern of diffracted light, researchers can attempt to extract the encoded information about the saturated region. Researchers have used this technique for more than a decade, but options for validating the results were limited until now.
Solar Orbiter Lends a Hand
Launched almost 10 years to the day after SDO, the Solar Orbiter spacecraft provides an excellent opportunity to test inversion techniques for recovering information from saturated solar images. Solar Orbiter’s Extreme Ultraviolet Imager snaps brief photos of the Sun at a rapid cadence, and its images remain unsaturated even when faced with energetic solar flares.
Positions of SDO (green) and Solar Orbiter (blue) during a solar flare on 19 March 2024. Click to enlarge. [Guastavino et al. 2026]
Guastavino’s team aligned and reprojected the data, accounting for the slightly different viewing angles of the two spacecraft, then applied an algorithm called Adaptive SE-DESAT to reconstruct the flux within the saturated portion of the SDO image. The team compared the desaturated SDO images to the unsaturated Solar Orbiter images over the course of the flare, finding the same flare morphology and similar time evolution between the two data sets.
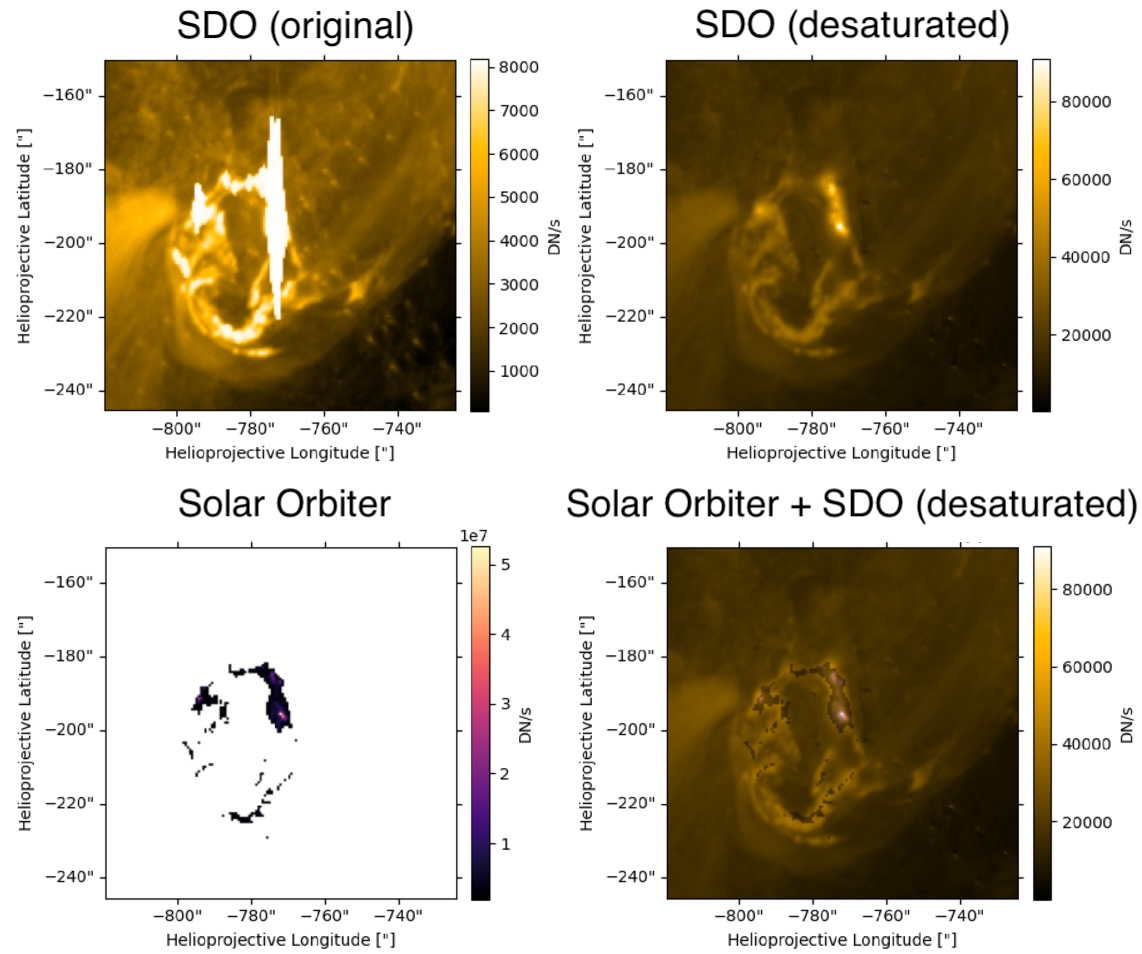
Example of unprocessed SDO data (top left), desaturated SDO data (top right), Solar Orbiter data (bottom left), and a combination of the two data sources (bottom right). Note that the Solar Orbiter observations have been clipped so that only the highest flare intensities were recorded. Click to enlarge. [Adapted from Guastavino et al. 2026]
A Treasure Trove of Desaturated Data
Overall, these results demonstrate the effectiveness of the inversion technique, though Guastavino and coauthors noted that improvements could be made during the impulsive phase of the flare, when the emission is increasing. The team identified several reasons why the results may not match during this phase, including rapid evolution of the flare during individual exposures.
Despite these areas that require further attention, the validation of this technique unlocks 16 years of solar flare observations from SDO. This especially enhances our sample of powerful solar flares, increasing the available records of the most energetic solar flares by orders of magnitude.
Citation
“Validation of an Extreme-Ultraviolet Desaturation Technique for the Atmospheric Imaging Assembly on Board the Solar Dynamics Observatory Using Observations from the Extreme Ultraviolet Imager on Board Solar Orbiter,” Sabrina Guastavino et al 2026 ApJL 1005 L50. doi:10.3847/2041-8213/ae7d2e
The post When the Spacecraft Align: Rescuing Saturated Images of Solar Flares appeared first on AAS Nova.
]]>
How do you pick a landing site before you know how you're going to land? The scientists behind NASA's latest Moon missions are working on just that.
The post Putting the Landing Site Before the Lander appeared first on AAS Nova.
]]>NASA is once again sending scientific missions to the Moon. But under the new commercial framework for getting there, researchers need to invent a new method for how to pick where to land.
A New Process for Picking Sites
NASA’s Commercial Lunar Payload Services program is a bold innovation in organizing robotic missions to the Moon. Under this model, rather than keeping the mission process entirely in-house, the agency selects the scientific mission they want to support then simply buys a ride to the lunar surface from a commercial vendor. But, how do you pick a landing site before you know exactly how you’re getting there?
The Gruithuisen domes region, the broad area the Lunar-VISE team searched for potential landing sites. Click to enlarge. [Adapted from Williams et al. 2026]
No Parking Lots on the Moon
Picking a landing site is no small task: for context, selecting the landing sites for each of the most recent Mars rovers took five years and multiple community workshops. The Lunar-VISE team therefore took a streamlined and logic-driven approach. They started by explicitly laying out their science objectives: Lunar-VISE’s purpose is to investigate some strangely silicate-rich volcanic formations called the Gruithuisen domes, so they had to land either on or near those. They also had to have access to boulders that were excavated from deep within the domes during a crater formation event, so they had to pick a spot with boulders relatively nearby.
In addition to objectives, they also laid out a slew of constraints. Although they needed boulders nearby, they couldn’t have too many boulders, or any particularly large boulders, since those could pose hazards for landing. There also couldn’t be any steep slopes in the field. Most of the area had to maintain a line of sight with a supporting orbiter for communications, so they couldn’t set down near any ridges. Also, they had to consider how the terrain would cast shadows as the lunar day progressed, since they didn’t want their mission cut short by freezing temperatures and a lack of solar power. As the team quipped, “many interesting, high-science value locations on the Moon may not be in proverbial ‘parking lots.'”
An image from the Lunar Reconnaissance Orbiter overlaid onto a terrain model of the final landing site. Click to enlarge. [Williams et al. 2026]
In addition to presenting their landing site, the researchers offered a handful of lessons to others who may someday be in the fortunate and thrilling position of needing to pick a landing spot on the Moon. For one, they urged teams to coordinate with the Lunar Reconnaissance Orbiter specialists as early as possible, since processing the imaging data for lander-quality maps is a specialized and intensive task. For another, they recommended that all of the software tools used be made publicly available so that future missions don’t need to duplicate their work.
As this article laid out, the Commercial Lunar Payload Services program and Lunar-VISE take us one step closer to making missions to the Moon routine — but we’re still figuring out exactly how to do that.
Citation
“Lunar-VISE Landing Site Selection and Characterization at Mons Gruithuisen Gamma,” Jean-Pierre Williams et al 2026 Planet. Sci. J. 7 161. doi:10.3847/PSJ/ae7d2c
The post Putting the Landing Site Before the Lander appeared first on AAS Nova.
]]>
Do all clusters form stars with the same distribution of masses? Researchers have demonstrated that the initial mass function, often assumed to be universal, varies across Milky Way clusters.
The post Gaia Data Show That the Initial Mass Function Is Not Universal appeared first on AAS Nova.
]]>Do all star-forming regions birth stars with the same distribution of masses? Theory suggests that they do not, but researchers often assume they do for simplicity. Now, ultra-precise observations from Gaia have demonstrated that the initial mass function varies across star clusters in the Milky Way.
A Universal Initial Mass Function?
The light from distant galaxies is dominated by high-mass stars, requiring the use of the IMF to estimate the stellar mass of a galaxy. [ESA/Webb, NASA & CSA, G. Östlin, P. G. Perez-Gonzalez, J. Melinder, the JADES Collaboration, the MIDIS collaboration, M. Zamani (ESA/Webb); CC BY 4.0]
The IMF is important in many areas of astronomy, and it’s relied on especially heavily in studies of distant galaxies. The light from these galaxies is dominated by high-mass stars, with the emission from lower-mass stars lost in the glare, so astronomers must use the IMF to reconstruct the stellar populations of these far-off locales.
Though theory suggests that the IMF should vary with factors like temperature and metallicity, demonstrating these variations has been difficult, even within our own galaxy. Because of this, researchers often adopt a universal IMF drawn from observations of star clusters in the Milky Way. But is the IMF truly universal?
The More the Slope Changes, the More the Break Mass Stays the Same
Determining whether the IMF is universal is more complicated than simply comparing the stars in one cluster to those in another. That’s because what astronomers measure in present-day star clusters is not the initial mass function, but a version of the IMF that has been skewed by millions to billions of years of evolution; over time, high-mass stars die and low-mass stars get ejected, warping the shape of the mass function.
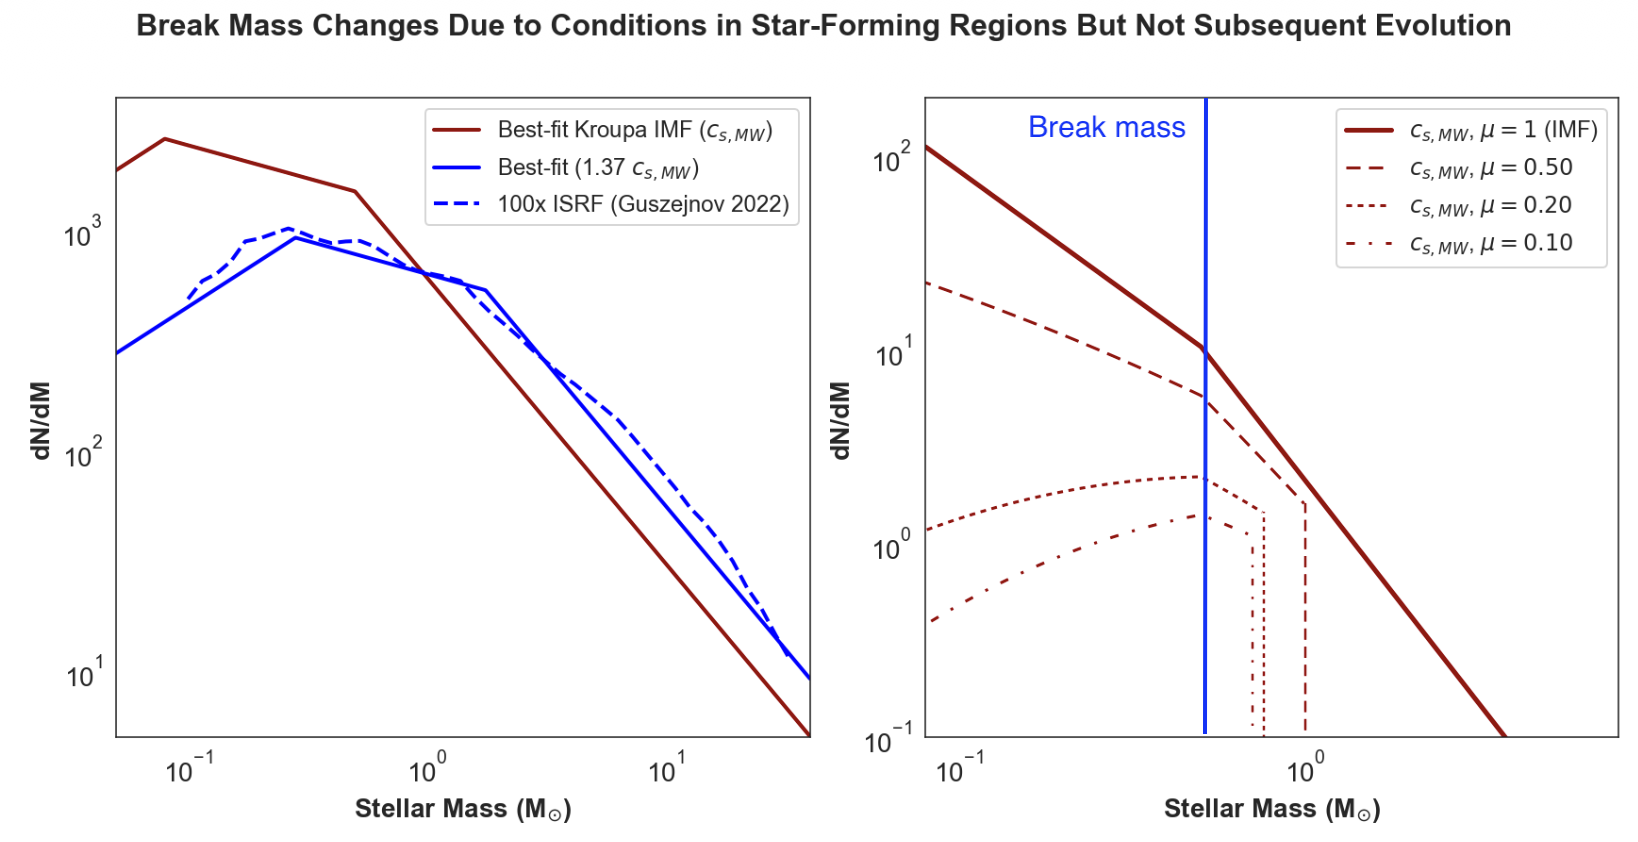
Left: Different break masses arise for different properties (here, the sound speed) of a given star-forming cloud. Right: Evolution of the mass function over time for a single star cluster. Over time, high-mass stars die and low-mass stars are ejected from the cluster, resulting in a decrease in the remaining mass fraction, μ, from 1 to 0.1. The slopes change, but the break mass does not. Click to enlarge. [Adapted from Steinhardt et al. 2026]
Insights from Gaia
Thanks to the Gaia spacecraft, which made precise observations of more than 2 billion stars in the Milky Way and beyond, it’s now possible to measure and compare the break masses of individual star clusters. Out of an initial catalog of 7,167 Milky Way clusters observed with Gaia, Steinhardt’s team selected just 110 that were of high enough quality and contained a sufficient number of stars to measure cluster break masses accurately.
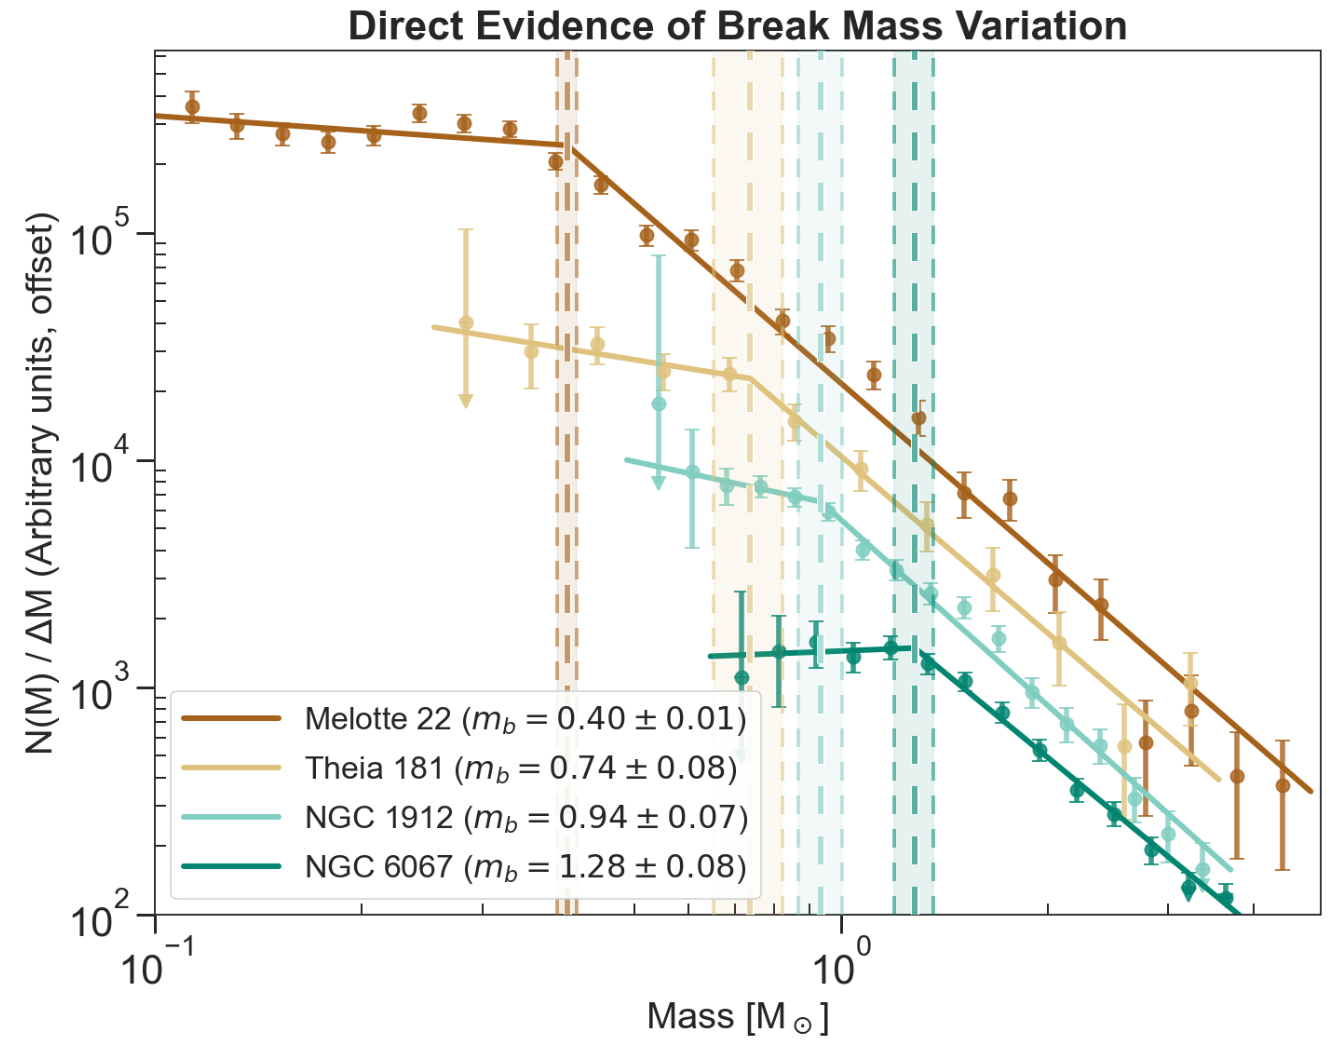
Observed mass functions of four Milky Way star clusters. The break masses are clearly different, showing that the IMF must vary from cluster to cluster. Click to enlarge. [Steinhardt et al. 2026]
This finding has implications for studies of high-redshift galaxies, where the properties of star-forming clouds are markedly different from those in the Milky Way. Going forward, Steinhardt and coauthors recommend developing a flexible parameterization of the IMF to capture how this critical function behaves in environments vastly different from our own.
Citation
“Direct Evidence for Stellar Initial Mass Function Variation in the Milky Way,” Charles L. Steinhardt et al 2026 ApJL 1005 L40. doi:10.3847/2041-8213/ae7444
The post Gaia Data Show That the Initial Mass Function Is Not Universal appeared first on AAS Nova.
]]>
Astrobites reports on whether some of the most massive galaxies in the early universe are truly quenched, or if they're just hiding their star formation behind dust.
The post Distant Galaxies: Dead or in Disguise? appeared first on AAS Nova.
]]>Editor’s Note: Astrobites is a graduate-student-run organization that digests astrophysical literature for undergraduate students. As part of the partnership between the AAS and astrobites, we occasionally repost astrobites content here at AAS Nova. We hope you enjoy this post from astrobites; the original can be viewed at astrobites.org.
Title: MAGAZ3NE: Confirming Dust Deficiency and Quiescent Nature of Ultramassive Galaxies at 3 < z < 4 with ALMA Observations
Authors: Wenjun Chang et al.
First Author’s Institution: University of California, Riverside
Status: Published in ApJ
Distant galaxies offer a unique window into how stars, gas, and dust evolve over cosmic time. Tracing this evolution requires understanding not only how galaxies form, but also how and when they stop forming stars, a process known as quenching. Understanding how, when, and why galaxies quench is a fundamental question in astrophysics, and one that requires observations of star-forming, quenching, and fully quenched galaxies alike. Unfortunately, one complication is that identifying truly quenched galaxies is challenging: galaxies that appear “dead” may instead be actively forming stars, hidden behind a thick veil of dust.
In today’s article, the authors use observations from the Atacama Large Millimetre/submillimetre Array (ALMA) to investigate five ultramassive galaxies at redshifts, z, between 3 and 4, and ask a deceptively simple question: are these massive red galaxies genuinely quenched, or are they secretly forming stars behind the scenes?
Meet the Suspects: Ultramassive Galaxies at the Edge of Cosmic Noon
The five galaxies in this study are drawn from the Massive Ancient Galaxies at z > 3 NEar-infrared (MAGAZ3NE) survey, which targets some of the most massive galaxies known at early cosmic times. All five have stellar masses exceeding 100 billion solar masses and have been confirmed at z > 3. At these redshifts, we are observing the galaxies as they were when the universe was less than 2 billion years old. This is just before an epoch known as cosmic noon, when star formation across the universe reached its peak.
These galaxies also benefit from extensive multiwavelength observations from a range of observatories, including the ground-based Visible and Infrared Survey Telescope for Astronomy and the Spitzer Space Telescope. By combining imaging across wavelengths from the ultraviolet to the near-infrared, astronomers can measure the “colours” of galaxies and use these colours to infer the galaxies’ star-forming activity.
Galaxies that have quenched their star formation are dominated by older stellar populations, which makes them appear red (hence why they are often referred to as “red and dead” galaxies). However, dust can redden galaxies in a similar way by absorbing blue light and re-emitting it at longer wavelengths — meaning that a dusty, star-forming galaxy can easily masquerade as a quenched one. To uncover any hidden star formation, the authors turn to ALMA to search for far-infrared dust emission. The sample of galaxies investigated with ALMA is shown in Figure 1.
Figure 1: UVJ colour–colour diagram, which uses galaxy colours in the ultraviolet (U), visible (V), and near-infrared (J) to identify quenched galaxies. The five ultramassive galaxies (UMGs) studied here (filled cyan circles) lie firmly in the quenched region (QG), consistent with a lack of ongoing star formation. Crosses indicate galaxies undetected in ALMA dust emission, while other massive galaxies at similar redshifts are shown in grey for comparison. [Chang et al. 2026]
ALMA on the Scene
ALMA observes light at sub-millimetre wavelengths, which at these redshifts traces emission from star-forming regions that are obscured by dust. Of the five ultramassive galaxies in this sample, only one is detected with ALMA. Even when the remaining four galaxies are stacked together, no dust emission is recovered, indicating that if any dust is present, it must be extremely faint.
To better quantify what these ALMA non-detections imply, the authors perform spectral energy distribution fitting (see a recent overview bite on spectral energy distribution fitting) using the Code Investigating GALaxy Emission, or CIGALE, a code that enforces energy balance between absorbed starlight and dust emission to estimate physical properties such as a galaxy’s star formation rate and dust content. With the ALMA constraints included, all five galaxies are found to lie more than 10 times below the star-forming main sequence. Even the single ALMA-detected galaxy remains formally quenched, showing only weak residual star formation.
In other words, these galaxies really are dead (or at least extremely dormant).
Extremely Dust-Poor Galaxies
The spectral energy distribution fitting also allows the authors to measure how much dust these galaxies contain relative to their stellar mass. This ratio provides a simple but powerful way to assess how much interstellar material remains in a galaxy — and therefore how much fuel is left for future star formation.
Three of the five ultramassive galaxies have ratios of Mdust/Mstar < 10-4 (Figure 2), placing them among the most dust-poor quenched galaxies confirmed at z > 3. The lone galaxy detected by ALMA contains slightly more dust, with Mdust/Mstar = 10-3, but even this is far below what would be expected for an actively star-forming galaxy. For comparison, typical star-forming galaxies at similar stellar masses host more than 100 times more dust.
Figure 2: The ratio of dust mass to stellar mass versus redshift for massive quenched galaxies (QGs). This quantity measures how dust rich a galaxy is compared to its stellar mass. The ultramassive galaxies in this study (cyan pentagons) fall well below the dust content expected for star-forming galaxies (solid blue line), highlighting their extreme dust deficiency. [Adapted from Chang et al. 2026]
For now, ALMA has delivered a clear answer to the question of “dead or in disguise?”: at least some candidate ultramassive galaxies in the early universe really are quenched, and they are strikingly dust poor. By ruling out the dusty impostor scenario, this study shows that deep ALMA observations can cleanly distinguish genuinely quenched galaxies from dusty star-forming ones, even at the highest stellar masses and earliest cosmic times. How these galaxies lost their dust remains an open question, but one thing is clear: by the time cosmic noon arrived, some galaxies had already finished forming stars and quietly faded into dormancy.
Original astrobite edited by Viviana Cáceres.
About the author, Lucie Rowland:
I’m a fourth (and final!) year PhD student at Leiden Observatory in the Netherlands, studying massive, star forming galaxies in the early universe with ALMA and JWST. It’s a really exciting time to be interested in astronomy, so I hope to make groundbreaking new research more accessible!
The post Distant Galaxies: Dead or in Disguise? appeared first on AAS Nova.
]]>
Using data from JWST and the Dark Energy Camera, researchers have revisited a long-standing issue with measurements of the famous Bullet Cluster.
The post Featured Image: A Mass Mystery in the Bullet Cluster appeared first on AAS Nova.
]]>The Bullet Cluster is best known for being considered a “smoking gun” for the existence of dark matter, but even a famous galaxy cluster like this one has its secrets. For more than two decades, different measurements of the merging clusters’ dynamical mass ratio have yielded vastly different results. In a recent research article, Boseong Young Cho (Yonsei University) and collaborators used data from JWST and the Dark Energy Camera to revisit the Bullet Cluster and measure its mass ratio using new data. The image above shows a near-infrared view of the Bullet Cluster from JWST, with an overlay of mass contours derived from gravitational-lensing measurements. The team’s analysis assigned a mass of 1.5 quadrillion solar masses for the main cluster (on the left side of the image above), and a mass of 150 trillion solar masses for the subcluster. This suggests a mass ratio of roughly 10, which matches the value supported by hydrodynamical simulations and cements the event as a minor merger. The team also identified three distinct cluster halos (two in the main cluster and one in the subcluster), providing an important constraint on the cluster configuration for future modeling. To learn more about this investigation of the Bullet Cluster, be sure to check out the full research article linked below!
Citation
“Joint JWST–DECam Lensing Reveals that the Bullet Cluster Is a Minor Merger,” Boseong Young Cho et al 2026 ApJ 1005 28. doi:10.3847/1538-4357/ae6a90
The post Featured Image: A Mass Mystery in the Bullet Cluster appeared first on AAS Nova.
]]>
A recent study has leveraged TESS's full-sky coverage to build a catalog of stellar rotation periods for over a million stars.
The post A New Catalog of Stellar Rotation Periods for Over a Million Stars appeared first on AAS Nova.
]]>Stellar rotation is a crucial aspect of not only stellar evolution but also exoplanet science, and a recent study has built the largest catalog of stellar rotation periods to date.
Stellar Opportunities with TESS
Since its launch in 2018, the Transiting Exoplanet Survey Satellite (TESS) has scoured the sky, searching for the signature recurring dip in starlight caused by planetary companions. While the primary goal of TESS is to discover exoplanets, the satellite’s mapping of the entire sky has created a rich database of high-quality photometry for millions of stars. These observations offer ample opportunity for scientists to study stellar properties and behavior across the Milky Way.
In particular, stellar rotation is a key property that traces a star’s age, magnetic activity, and internal structure. For exoplanet science, stellar rotation is both a help and a hindrance: it allows us to study how exoplanets may evolve over time with their host stars, but stellar activity can mimic or drown out planet signals, making them harder to detect. A few studies have investigated stellar rotation periods with TESS, looking at specific star clusters and known planet hosts. To date, however, no existing study has produced a larger catalog of TESS rotation periods — a product that would provide a wealth of information for both exoplanet and stellar evolution science.
Creating a Catalog
Target sample summary showing the TESS sky coverage (top left), histogram of number of TESS observations per star (top right), TESS magnitude as a function of distance to the star (bottom left), and histograms of magnitude, distance, temperature, and color across the sample (bottom right). Click to enlarge. [Boyle et al 2026]
Not all brightness variations present in a star’s light curve are due to stellar variability — instrumental systematics and artifacts from the spacecraft’s orbital period can produce periodic variability. To combat this, the authors created a classification algorithm to select sources whose periodicity is most likely due to true stellar variability rather than instrumental or observational effects. Pairing this classification with some additional validation criteria, the authors built the TESS All-Sky Rotation Survey (TARS), a catalog of periods for 1,046,317 stars within about 1,600 light-years of our Sun.
Map of all TARS stars within about 1,600 light-years of the Sun (left) and only the fast-rotating stars in the survey, highlighting clustered populations (right). Click to enlarge. [Boyle et al 2026]
Implications of TARS
Looking more finely at the TARS catalog, the authors provided additional quality cuts to remove other potential sources of stellar variability like binary companions or pulsations. The authors estimated that roughly 93% of their measured periods are due to stellar rotation, which expands the number of stars with known rotation periods by a factor of 2.3 within about 325 light-years and by a factor of 4.0 within about 1,600 light-years. As the largest homogeneous catalog of stellar rotation periods to date, TARS lays the groundwork for studies of stellar evolution, exoplanet discovery and evolution, and even Milky Way structure. For example, the authors found that when mapping the fast-rotating, typically younger stars in TARS, the location of young stellar associations in the local neighborhood became significantly clearer. This underscores the importance of this catalog for a range of science goals, and future work will only improve upon the data provided by TARS.
Citation
“The TESS All-Sky Rotation Survey: Periods for 1,046,317 Stars within 500 pc,” Andrew W. Boyle et al 2026 ApJS 284 75. doi:10.3847/1538-4365/ae6657
The post A New Catalog of Stellar Rotation Periods for Over a Million Stars appeared first on AAS Nova.
]]>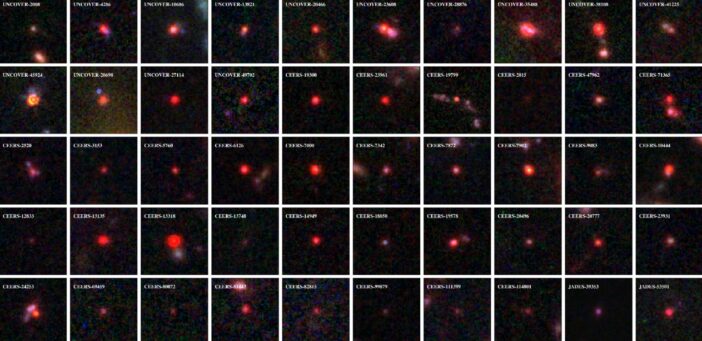
What's behind the population of compact, reddish objects spotted by JWST? Two recent research articles have explored theories involving young globular clusters and little red dots with little blue companions.
The post Two More Thoughts on Little Red Dots appeared first on AAS Nova.
]]>One of the biggest discoveries from JWST’s tenure is a population of compact reddish objects nicknamed “little red dots.” Numerous theories have been proposed to explain the small sizes, high luminosities, and characteristic “V”-shaped spectra of these objects, and today we’ll examine two recent research articles that have explored the identity of the universe’s most mysterious inhabitants.
Red Dot, Blue Dot
You can tell a lot about a person by looking at their friends — and the same might be true for little red dots. A team led by Josephine Baggen (Yale University) examined a sample of 83 little red dots imaged with JWST. They found that 43% of the little red dots in this sample had a little blue companion: an ultraviolet-bright object within a projected separation of 1,630–16,300 light-years. The brightest little red dots were even more likely to have a blue companion; 80% of the brightest objects in the sample were paired up.
Baggen’s team set out to test the hypothesis that these red–blue pairs are fundamentally linked rather than coincidental. Under this hypothesis, the ultraviolet-bright blue companions were assembled first. The ultraviolet radiation from these objects suppressed the cooling of molecular hydrogen in pristine gas clouds in the early universe, causing the gas to skip the usual star-forming process and instead form a massive compact object such as a black hole star, supermassive star, or quasi-star — which we see as a little red dot.
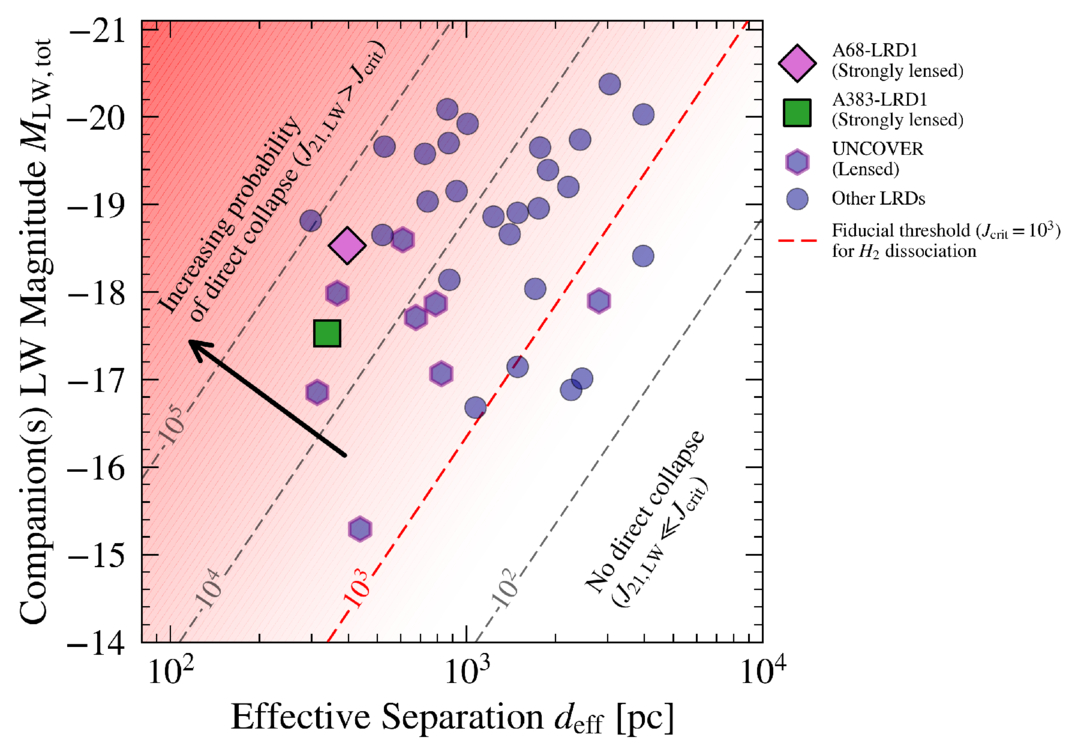
The companion’s mean flux density from 91.2 to 111 nm versus projected separation between the blue companion and the little red dot. The red dashed line shows the estimated values necessary for gas clouds to collapse. Click to enlarge. [Baggen et al. 2026]
If little red dots form thanks to their little blue companions, that would imply that every little red dot has or had such a companion. Though little blue companions weren’t so universal in the sample used in this work, the team noted that their analysis techniques, combined with observational limitations and other factors, likely yielded a smaller number of blue companions than are actually present. Further simulations exploring the collapse of pristine gas clouds into massive compact objects and high-resolution spectroscopic observations of little red dots can illuminate the potential link between these objects.
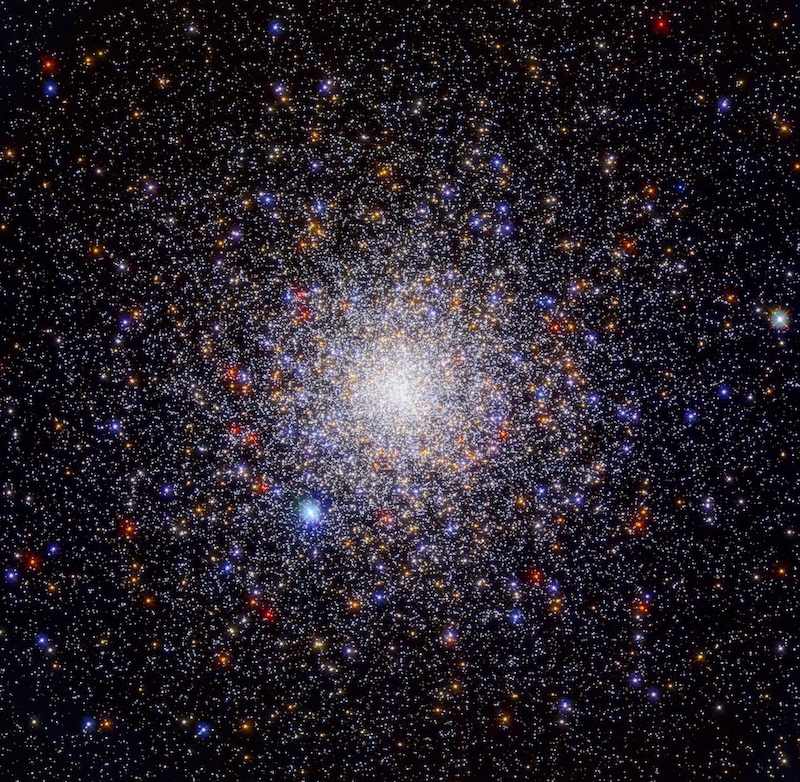
The densely packed globular cluster NGC 1851, as seen by the Hubble Space Telescope. [NASA, ESA, and G. Piotto (Università degli Studi di Padova); Processing: Gladys Kober (NASA/Catholic University of America)]
Little Red Dots as Young Globular Clusters
John Chisholm (The University of Texas at Austin) and collaborators hypothesized that little red dots represent a brief phase in the formation of globular clusters. In this hypothesis, the rest-frame ultraviolet emission of little red dots comes from the hot young stars of the newborn cluster, while the rest-frame optical emission comes from a single supermassive star at the cluster’s heart. Thus, in this framework, the little red dot phase lasts only as long as the fleeting lifespan of the supermassive star.
Chisholm’s team first showed that the spectrum of a young globular cluster with a supermassive star at its center is similar to the observed spectrum of a little red dot. But showing that the emission properties of globular clusters in formation and little red dots are similar is not enough — it’s also necessary to investigate whether the numbers and masses of these objects line up.
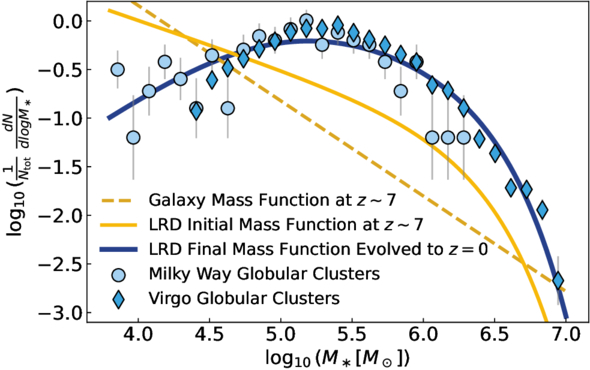
Comparison of the mass functions of little red dots evolved forward to the present day (blue line) and globular clusters in the Milky Way and Virgo (blue symbols). The results for both populations have been normalized to emphasize the shape of the distributions. Click to enlarge. [Chisholm et al. 2026]
In addition to describing how the properties of globular clusters in formation match those of little red dots, Chisholm’s team outlined some testable predictions for this scenario, including formation timescales and chemical abundance patterns. If this hypothesis withstands further scrutiny, little red dots may provide a valuable look at the early years of some of our universe’s oldest star clusters.
Citation
“Connecting the Dots: UV-Bright Companions of Little Red Dots as Lyman–Werner Sources Enabling Direct-Collapse Black Hole Formation,” Josephine F. W. Baggen et al 2026 ApJL 1002 L4. doi:10.3847/2041-8213/ae58a5
“Little Red Dots as Globular Clusters in Formation,” John Chisholm et al 2026 ApJL 1004 L4. doi:10.3847/2041-8213/ae6dae
The post Two More Thoughts on Little Red Dots appeared first on AAS Nova.
]]>
Astrobites reports on the first case of a supermassive black hole discovered away from its galaxy’s center, exposed when it tore apart a star in a tidal disruption event.
The post A Wandering Supermassive Black Hole Eating a Star appeared first on AAS Nova.
]]>Editor’s Note: Astrobites is a graduate-student-run organization that digests astrophysical literature for undergraduate students. As part of the partnership between the AAS and astrobites, we occasionally repost astrobites content here at AAS Nova. We hope you enjoy this post from astrobites; the original can be viewed at astrobites.org.
Title: The Wandering Supermassive Black Hole Powering the Off-Nuclear Tidal Disruption Event AT2024tvd
Authors: M. Guolo et al.
First Author’s Institution: Johns Hopkins University
Status: Published in ApJL
A Star Gets Eaten in the Wrong Neighborhood
We find supermassive black holes at the centers of most large galaxies. They end up there because of how galaxies form: as matter collapses and merges over time, material sinks to the gravitational center, and the black hole settles in.
So, what happens when we catch a star being ripped apart by a supermassive black hole that is not at the center of its galaxy?
That is exactly the puzzle posed by AT2024tvd, a tidal disruption event (TDE) spotted roughly 2,600 light-years from the center of a massive galaxy located 600 million light-years away from us (see Figure 1).
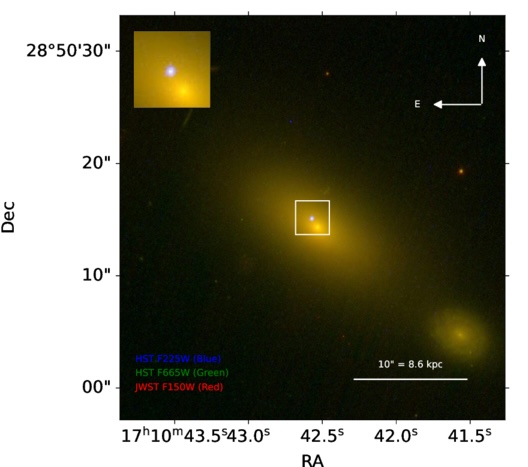
Figure 1: A color image of AT2024tvd from the Hubble Space Telescope and JWST. The yellow dot inside the square marks the galaxy’s center, while the TDE is the white dot, which is visibly offset to the upper left, about 2,600 light-years away. [Adapted from Guolo et al. 2026]
Measuring Mass Using Light
To figure out the mass of the black hole responsible for AT2024tvd, the authors needed to get creative. You cannot weigh a black hole directly, so astronomers have to work backward from what they can see. The key idea is that a black hole’s mass controls how its accretion disk behaves. A more massive black hole produces a larger, cooler disk, while a less massive one produces a smaller, hotter disk. By measuring how bright the disk is at different wavelengths and how hot it gets, you can figure out how massive the black hole must be.
The authors did this by modeling the light the event produced across many wavelengths. They combined data from several telescopes: the Zwicky Transient Facility, the Neil Gehrels Swift Observatory, Pan-STARRS, and two rounds of high-quality X-ray data from XMM-Newton. TDE light curves go through different phases. The early flare in visible and ultraviolet light is bright but complicated, and the physical processes behind it are not fully understood. But after a few hundred days, TDEs settle into a quieter “plateau phase,” where the ultraviolet and visible light come directly from the accretion disk. At this stage, the emission follows well-understood physics, and astronomers can model it reliably.
The authors used a model called kerrSED, which describes the spectral energy distribution (SED) of a spinning black hole’s accretion disk (kerr). It accounts for the disk’s temperature, its physical size, the black hole’s spin (how fast it rotates), and the angle at which we are viewing the system. It also accounts for a process called Comptonization, where hot electrons near the black hole boost lower-energy photons (particles of light) up to X-ray energies. By fitting this model to the observed light at multiple wavelengths simultaneously, the authors could pin down the disk properties and extract the black hole mass. The result was a clean fit: the disk model alone could explain all the observed light during the plateau phase, with nothing significant left over (see Figure 2).
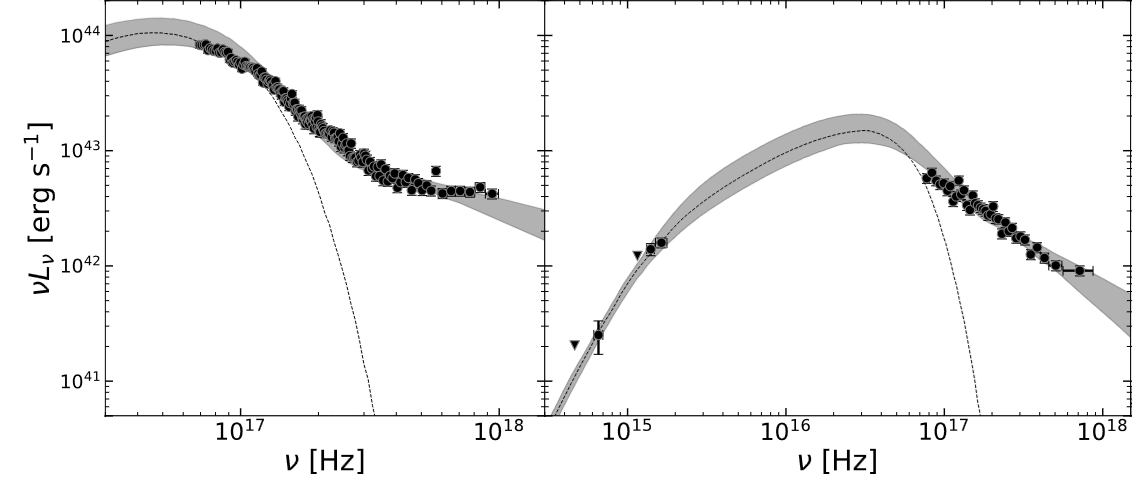
Figure 2: The brightness of AT2024tvd measured across a wide range of wavelengths, after correcting for absorption and the galaxy’s motion. The symbols show individual measurements from different telescopes, while the shaded contours represent the best-fit disk model and its uncertainty. Left: The early X-ray data, which is well explained by emission from the hot inner accretion disk. Right: The later data covering both visible/ultraviolet light and X-rays, all consistently explained by the same disk model. [Adapted from Guolo et al. 2026]
Not an Intermediate, but a Supermassive Black Hole
From their fit, the authors found a black hole mass of about one million solar masses. Black holes above about 100,000 solar masses are considered supermassive, while those below that threshold but above about 100 solar masses are called intermediate-mass black holes. So, this puts AT2024tvd in the supermassive category. This matters because the two previously known off-nuclear TDEs, called 3XMM J2150-05 and EP240222a, were both powered by intermediate-mass black holes. Those black holes were found inside small, dense collections of stars called ultra-compact dwarf galaxies that were orbiting larger host galaxies.
AT2024tvd is different. When the authors looked at deep images of the location where the TDE happened, they found no star cluster or small galaxy there. Whatever group of stars once surrounded this black hole has been almost entirely pulled apart by the gravity of the much larger parent galaxy. The ratio of the black hole’s mass to the mass of any remaining stars around it is extreme: greater than 3%, which is far above what we normally see. This is the signature of a “wandering” supermassive black hole, one that was brought in during a past galaxy merger and has been slowly sinking toward the center of its new host ever since, losing its surrounding stars along the way.
The authors compared AT2024tvd to other TDEs using established relationships between accretion disk properties and black hole mass (Figure 3). In terms of its disk temperature, luminosity, and inferred mass, AT2024tvd behaves like a typical nuclear TDE powered by a supermassive black hole. However, when placed on the black hole mass versus host stellar mass relation, it stands out as a strong outlier. The black hole mass is far too large for the small amount of surrounding stellar mass detected at its location.
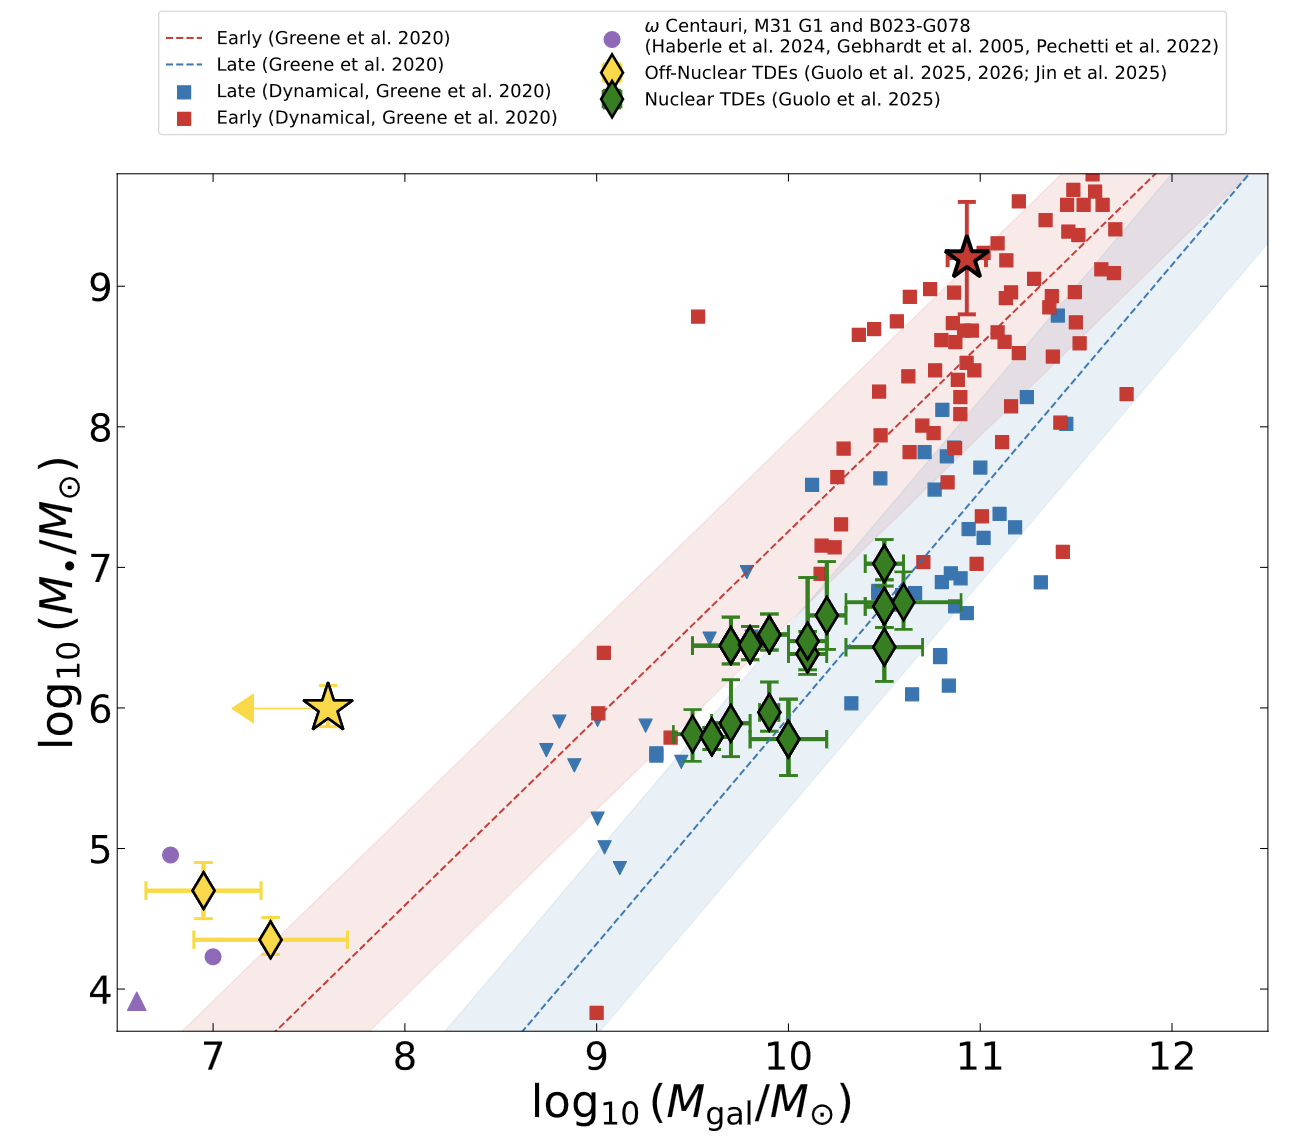
Figure 3: AT2024tvd (yellow star) plotted on the relationship between black hole mass and host galaxy stellar mass. Red squares show nearby galaxies with dynamically measured black hole masses plotted against galaxy bulge stellar mass, while blue squares show the relation using total galaxy stellar mass. Purple points and green diamonds represent nuclear TDE host galaxies with black hole masses inferred from different TDE modeling techniques. Yellow diamonds mark the two previously known off-nuclear TDEs. AT2024tvd stands out as a clear outlier, with a very high black hole mass compared to the upper limit on any surrounding stellar mass. [Guolo et al. 2026]
The Big Picture
This discovery matters for several reasons. It shows that off-nuclear TDEs are not limited to intermediate-mass black holes sitting in small satellite galaxies. Some are powered by fully supermassive black holes that have been displaced from their original galactic centers. It also shows that TDE modeling, when done carefully during the plateau phase of the light curve (when the emission is dominated by well-understood accretion disk physics), can provide reliable black hole masses on its own, without assuming any relationship between the black hole and its host galaxy. This is particularly important for wandering black holes, where those relationships do not apply.
Looking ahead, upcoming surveys like Vera C. Rubin Observatory’s Legacy Survey of Space and Time are expected to find many more off-nuclear TDEs. Combined with X-ray follow-up from telescopes like XMM-Newton, these events could become our main tool for mapping out the population of displaced black holes in the nearby universe. One disrupted star at a time, we are starting to find black holes that theory told us should exist but that had, until now, stayed hidden.
Original astrobite edited by Kelsie Taylor and Veronika Dornan.
About the author, Serat Saad:
Serat is a first-year PhD student in astronomy at The Ohio State University. His research is on stellar and galactic dynamics, where he uses observational data to understand gravity. He also has interests in active galactic nuclei and tidal disruption events.
The post A Wandering Supermassive Black Hole Eating a Star appeared first on AAS Nova.
]]>
The galaxy seems to be full of free-range Neptunes, but a closer look reveals some complicated family dynamics in planetary systems.
The post Detached but Not Alone appeared first on AAS Nova.
]]>Microlensing surveys have discovered plenty of regular exoplanets, but more surprisingly, they’ve also turned up many solo Neptunes with no star nearby. New research suggests that first impressions might be deceiving, however, and that at least some of these planets might not be so alone: they just have a complicated family history.
An Abundance of Exo-Neptunes
There are simply too many Neptune-like exoplanets in our galaxy. Or at least that’s the current feeling astronomers get from gravitational microlensing surveys, which look for exoplanets during short-lived magnification events caused by chance alignments between stars. These surveys have now found about a dozen so-called “free-floating” planets, and while this doesn’t sound like that many, running the numbers reveals that this tiny sample implies that there are about two free-floating Neptune-size planets for every star in the galaxy.
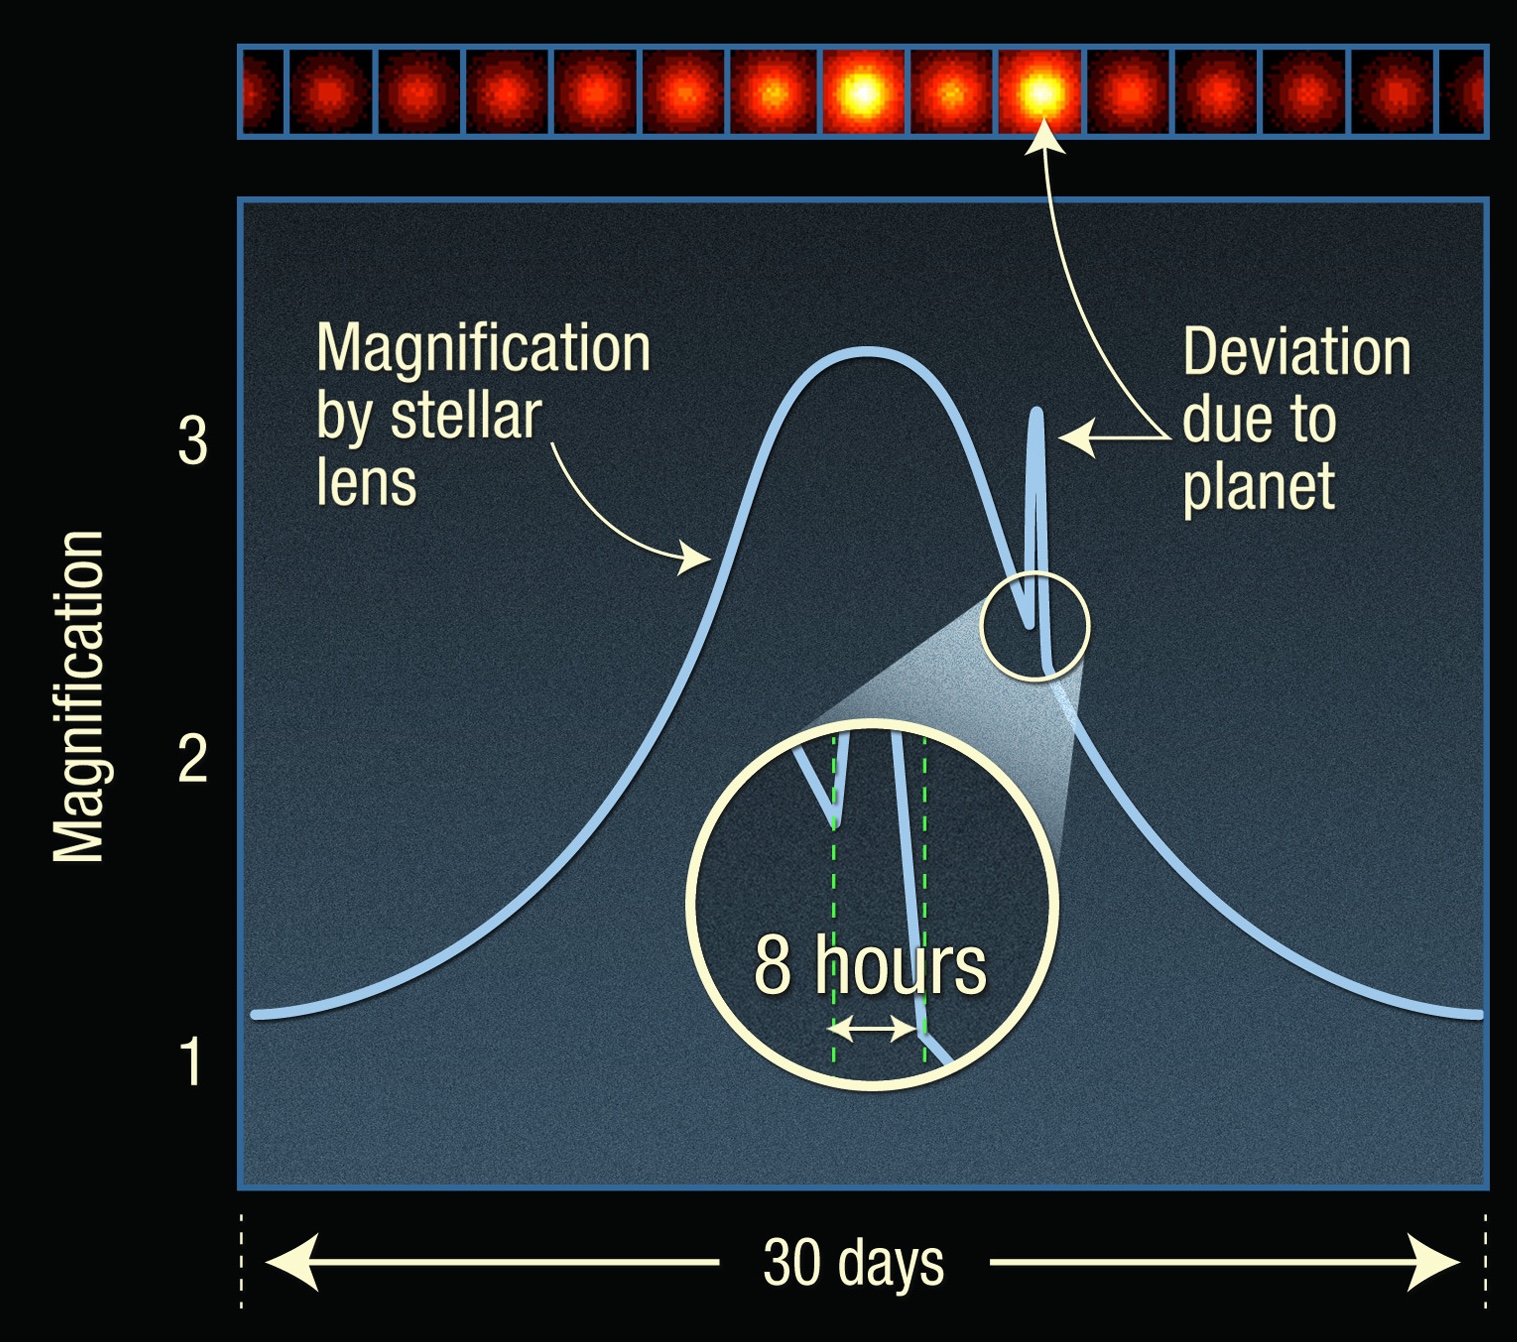
An illustration of how exoplanets are found via microlensing. The broad first bump is caused by the host star magnifying the light from a background star; the narrow second bump is caused by the planet acting as a lens as well. “Free-floating” planets create only one bump. [Adapted from NASA, ESA, and A. Feild (STScI)]
However, new research by Sam Hadden (Canadian Institute for Theoretical Astrophysics) and Yanqin Wu (University of Toronto) presents an alternative idea: what if at least some of these free-floating planets aren’t fully on their own, but instead remain estranged but weakly bound to their parent stars?
Simulated Scattering
Two celestial objects need to align nearly perfectly in order to create a microlensing pulse that we can detect. For an exoplanet orbiting a star, we should observe two of these pulses: one when the host star drifts in and out of alignment with a background star, and one when the nearby bound planet does the same. In the case of a free-floating planet, there’s only one pulse, and we therefore assume that there is no host star. Hadden and Wu noticed that since the alignment has to be so precise for microlensing to occur, it’s possible that a seemingly free-floating planet is simply widely separated from its host star, and the star managed to dodge the magnification effect. In other words, these planets might not be free floating at all, just on wide and eccentric orbits.
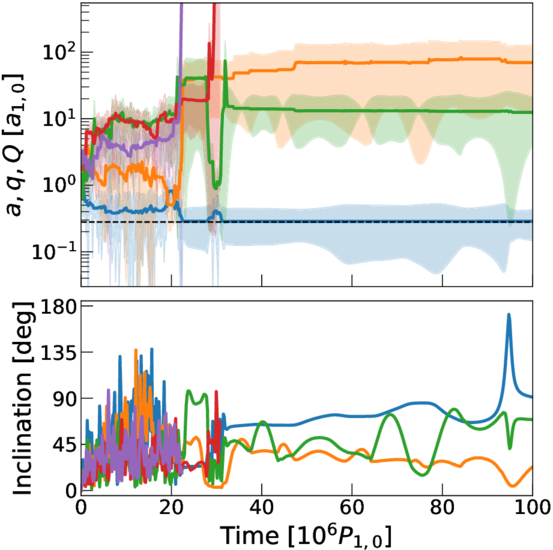
The orbital evolution of a five-planet system that undergoes planet–planet scattering. Each line represents one planet; note that in the end two are ejected, two end up on wide detached orbits, and the fifth ends up on a tightly bound inner orbit. Click to enlarge. [Hadden & Yu 2026]
They found that both types of simulations readily created the “detached” objects needed to mimic free-floating planets. In fact, the most common outcome was for two or three planets to be bullied into far-out orbits by a planet that then plunges onto a tight inner orbit extremely close to the star.
Though the authors caution that this process likely doesn’t explain all of the free-floating planets observed to date, this is an exciting model that would dramatically lower our estimates of the number of Neptunes roaming alone between the stars.
Citation
“Free Floating or Merely Detached?,” Sam Hadden and Yanqin Wu 2026 ApJ 1000 70. doi:10.3847/1538-4357/ae6508
The post Detached but Not Alone appeared first on AAS Nova.
]]>
JWST observations serendipitously revealed new emission features from fullerenes, the largest molecules definitively detected in space.
The post New Spectral Signs of Buckyballs Discovered in Planetary Nebula appeared first on AAS Nova.
]]>Fullerenes — a class of molecules composed entirely of interconnected carbon atoms — are the largest molecules definitively detected in space. Researchers using JWST to study a planetary nebula have found new spectral features from a fullerene composed of 60 carbon atoms, offering another way to study how these molecules form and survive in space.
Full of Fullerenes
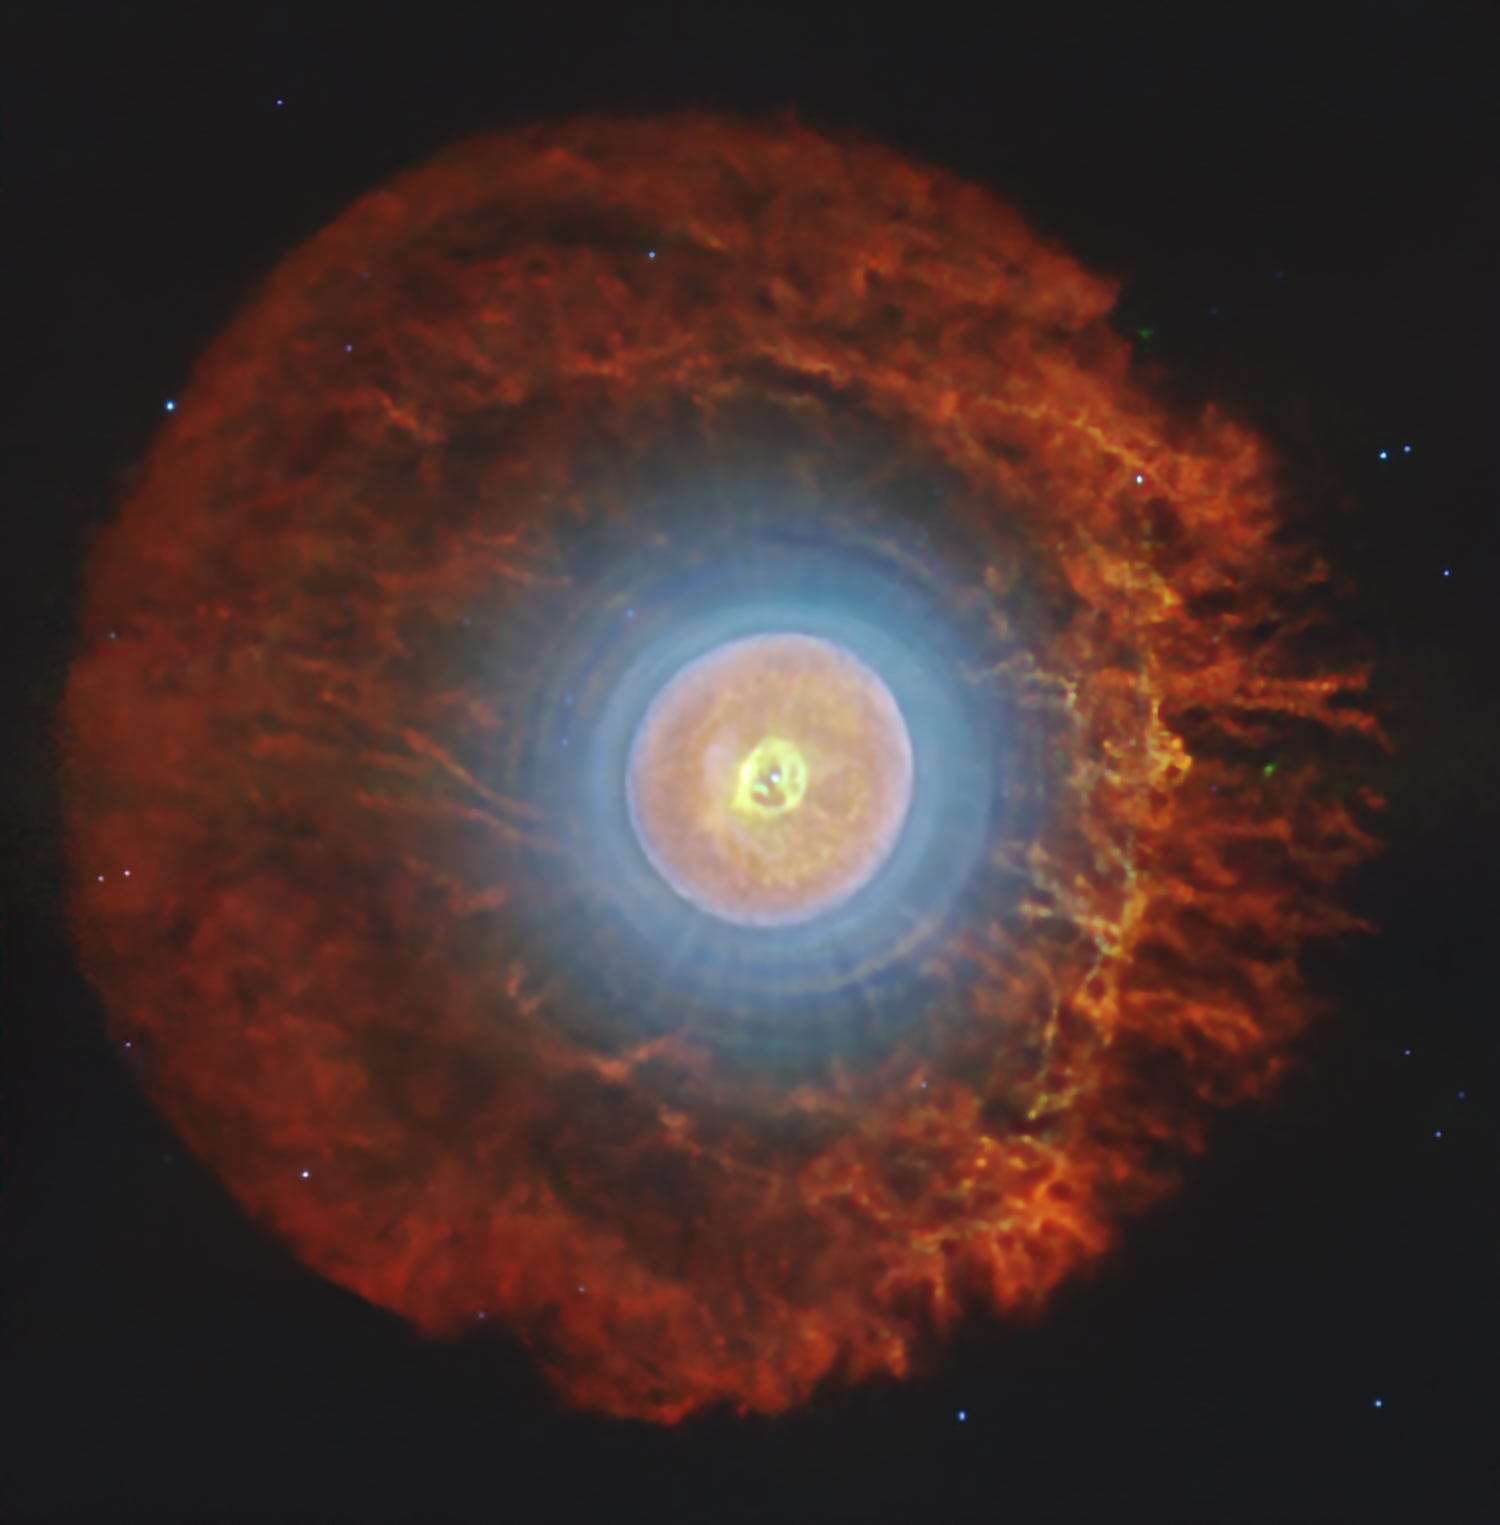
Planetary nebula Tc 1 as seen by JWST. [NASA / ESA / CSA / Western University, J. Cami]
Since that discovery, Tc 1 has been a hot spot for studies of buckyballs. However, researchers are still puzzling over how these large molecules form and survive in harsh space environments.
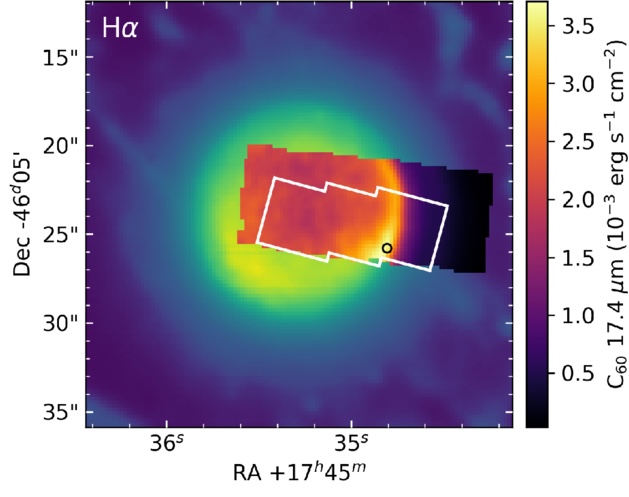
A closeup of the center of Tc 1, showing the region observed with JWST’s Mid-Infrared Instrument (black-to-yellow color scale) and Near-Infrared Spectrograph (white outline). The background color scale shows the nebula’s H-alpha emission as seen by the Very Large Telescope. [Adapted from Giese et al. 2026]
From Spitzer to JWST
Morgan Giese (The University of Western Ontario) and collaborators recently reported on the results of a JWST observing program that aimed to understand how fullerenes respond to changes in their environment. The team mapped the distribution of C60 molecules at varying distances from the powerful ionizing radiation of Tc 1’s central star.
The team successfully spotted the emission features from the fullerene C60 seen in earlier observations, but they also turned up something unexpected: a handful of prominent emission features from 3.5 to 5.2 microns that had not been reported previously.
Feature Presentation
What’s the source of these emission features? The distribution of the emission provides a strong clue: known spectral features from fullerenes C60 and C70 are concentrated in a narrow, bright ring around the center of the nebula, with diffuse emission suffusing the rest of the nebula — and the newfound spectral features follow the same distribution.
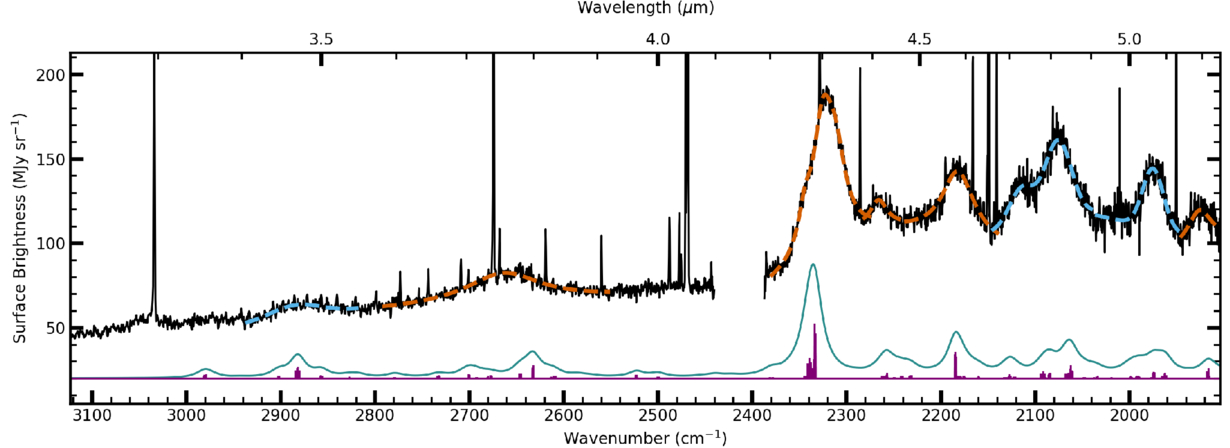
JWST spectrum of Tc 1 (black line) extracted from the area indicated by a black circle in the previous image. The orange and blue dashed lines show fits to the newfound emission bands, and the results of the anharmonic calculations are shown as the teal line below the JWST spectrum. Click to enlarge. [Giese et al. 2026]
Giese and coauthors found that 17% of the energy emitted by the C60 molecules in Tc 1 is released in these combination bands, suggesting that these features must be taken into account when modeling the cooling of C60 molecules. The discovery of new fullerene spectral features also has implications for future studies of these molecules: since these features appear in a wavelength range where features from other complex molecules like polycyclic aromatic hydrocarbons are weak, these newly identified bands provide a promising way to spot and study fullerenes across space environments.
Citation
“Detection of C60 Combination Bands in the Near-IR Spectrum of Tc 1,” Morgan M. Giese et al 2026 ApJL 1004 L32. doi:10.3847/2041-8213/ae76d5
The post New Spectral Signs of Buckyballs Discovered in Planetary Nebula appeared first on AAS Nova.
]]>
Astrobites reports on the potential detection of intermediate-mass black holes in the early universe — signs of black holes seeded by direct collapse.
The post Black Holes Reveal Their Seeds appeared first on AAS Nova.
]]>Editor’s Note: Astrobites is a graduate-student-run organization that digests astrophysical literature for undergraduate students. As part of the partnership between the AAS and astrobites, we occasionally repost astrobites content here at AAS Nova. We hope you enjoy this post from astrobites; the original can be viewed at astrobites.org.
Title: A GLIMPSE of Intermediate Mass Black Holes in the Epoch of Reionization: Witnessing the Descendants of Direct Collapse?
Authors: Qinyue Fei et al.
First Author’s Institution: University of Toronto
Status: Published in ApJ
In the late 2010s, astronomers were getting hints of something strange going on in the early universe. Using the most powerful telescopes on the ground, we were able to find black holes in the centers of some of the most distant galaxies. The light from these active galactic nuclei (AGNs) was emitted over 12 billion years ago, revealing conditions close to the beginning of cosmic time.
To an astronomer, that’s the mundane part. I’m only half joking — thousands of AGNs had already been identified in the previous half century. However, the most distant of these sources were startling because their central black holes appeared much more massive than expected. To be specific, we know how much mass black holes can start with, and we can write down equations to predict how quickly they should grow. The AGNs we observed seemed to violate these predictions. This raised some serious questions and was highlighted as a major point of inquiry to focus on going into the 2020s.
Then JWST launched, and the mystery grew deeper. No matter where we looked, enormous black holes kept cropping up in astonishing numbers. Astronomers who model the universe with equations and computer simulations have tried to explain these results, but this has been a serious challenge. Some researchers have broken the emergency glass and reached for a highly theoretical tool: the direct-collapse black hole. Unlike the normal pathway for forming black holes (the deaths of massive stars), this model suggests that an enormous cloud of gas could directly collapse into a black hole without forming a star at all. The resulting black holes could have as much mass as a hundred thousand Suns put together — orders of magnitude more than a “normal” black hole. Although this pathway can explain the presence of huge black holes so early in the universe’s history, we’ve never directly seen this happen, so for now it remains just a theoretical possibility.
However, if direct-collapse black holes were widespread at early times, there is one indirect signature we might be able to detect: a large population of intermediate-mass black holes with masses between a hundred thousand and a million times that of the Sun. If we can find such a population, we’ll have strong evidence for the direct-collapse model. Let’s go looking!
Intermediate Mass, Impossible Difficulty
Identifying intermediate-mass black holes requires a tricky combination of spectral resolution and sensitivity. Light from an object must be examined very finely in order to detect the telltale features of an intermediate-mass black hole. However, these sources are already quite faint, so spreading their emission this thin means that any potential signal is very likely to get lost in the noise.
The authors of today’s article use an unprecedented set of observations to leap over this hurdle and directly probe intermediate-mass black holes. They not only use the most sensitive spectroscopic instrument (NIRSpec) on the most powerful space telescope (JWST), but they take advantage of a phenomenon known as gravitational lensing.
According to Einstein’s general theory of relativity, gravity is the result of matter curving spacetime. Areas with more concentrated matter will experience stronger curvature. When an object traveling in a completely straight line moves through curved space, its path appears bent. This same effect happens to light. Intriguingly, a large concentration of matter can redirect diverging rays of light to a focus, acting like an enormous magnifying glass.
Astronomers take advantage of gravitational lensing by pointing telescopes at massive clusters of galaxies. The intense gravity of these regions can magnify sources in the background by tens or even hundreds of times. Galaxies that would be impossibly faint to see under normal conditions can thus be observed if they are strongly lensed, making this a powerful technique to examine otherwise hidden objects.
Putting Faint AGNs Under a Lens
The Galactic Legacy Infrared Mid-Plane Survey Extraordinaire (GLIMPSE) program took extremely powerful observations of a galaxy cluster called Abell S1063 using JWST. The long exposure time, combined with the lensing power of the cluster, allows extremely faint sources in the background to be seen in unprecedented detail. The researchers scoured the data to search for signs of active black hole growth in the observed galaxies. Specifically, they carefully studied the emission lines in the spectrum of each object.
Normally, emission lines appear narrow. However, gas surrounding a massive black hole circulates at rapid speeds. A phenomenon known as the Doppler effect then comes into play. This is the same effect responsible for the characteristic rise and fall in the pitch of a siren from an emergency vehicle passing by. Emission from gas moving toward our line of sight appears bluer than it otherwise would, and gas moving away from us appears redshifted. The net effect is that a single emission line is widened, and we see characteristic “broad wings.” The width of the emission line can be used to estimate the mass of the central black hole, where broader wings imply a more massive black hole.
The researchers uncover 10 AGNs that display broadened Balmer series lines. Strikingly, they estimate that these galaxies have central black holes with masses as low as 400,000 times that of the Sun. While that might sound like a lot, it’s practically nothing compared to the monstrous 100-million-solar-mass black holes that JWST consistently turns up in other studies. Detecting such lightweight black holes, pushing into the realm of intermediate-mass black holes, is only possible due to the incredible sensitivity of these observations.
The researchers also compute what’s known as the black hole mass function. This is a measure of how many black holes exist at each mass. In other words, the black hole mass function measures how common lightweight black holes are compared to heavy ones. The mass function computed in this work and several other points of comparison are shown in Figure 1.
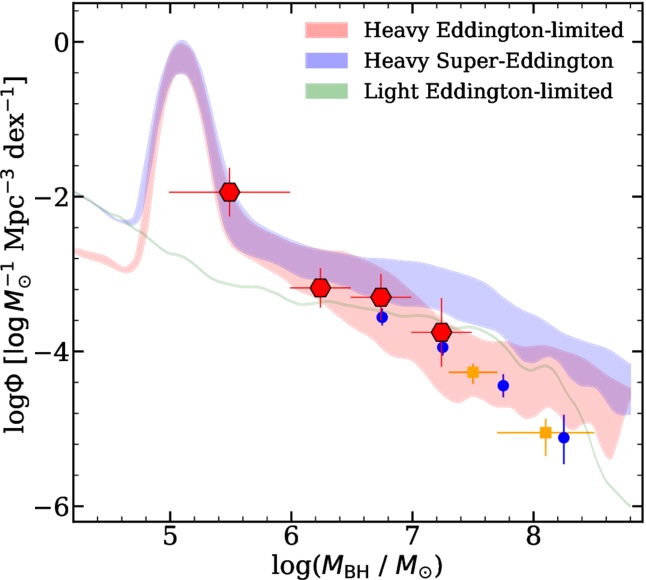
Figure 1: A comparison of black hole mass functions from various previous works and today’s article. The red hexagons are data points computed using the AGNs observed in this work, while blue circles and yellow squares are measurements computed using AGNs observed in previous articles. The red, green, and blue shaded areas represent the expected black hole mass function from various theoretical models. [Adapted from Fei et al. 2026]
Amazingly, this is exactly the measurement you would get if direct-collapse black holes (the hypothetical kind of massive black holes mentioned earlier in this article) were common in the early universe. If you scatter huge seeds across a large field, then you shouldn’t be surprised to see a sea of barely larger plants a few months later. Likewise, since these black holes start off so massive, they only need to grow a tiny bit to reach the threshold of that first red hexagon.
So is this proof that the early universe was filled with direct-collapse black holes, with this study probing the tip of an astonishing iceberg? It’s too early to tell for sure. While this is certainly an exciting result that sheds light on a previously unexplored population of objects, one can only do so much with a sample size of 10. More follow-up observations will be needed to measure the black hole mass function more precisely. Still, it’s amazing to think how much has changed in just a few years. JWST continues to provide unprecedented insight into some of the most breathtaking questions in all of astronomy.
Original astrobite edited by Tori Bonidie.
About the author, Ansh Gupta:
I’m an astronomy graduate student at the University of Texas at Austin working with Steven Finkelstein. I use data from JWST to study the formation and growth of the first galaxies and black holes in the universe. In my spare time, I enjoy playing piano, reading, and making YouTube videos.
The post Black Holes Reveal Their Seeds appeared first on AAS Nova.
]]>
A newly discovered molecular cloud in the Milky Way displays a surprising spiral structure.
The post Featured Image: A Spiral Cloud in the Milky Way appeared first on AAS Nova.
]]>The image above shows a newly discovered molecular cloud. This cloud was discovered through the Milky Way Imaging Scroll Painting project, which uses a 13.7-meter millimeter telescope to survey molecular clouds in our galaxy. Xuepeng Chen (Purple Mountain Observatory; University of Science and Technology of China) and collaborators came upon this cloud in survey data from a region of the Milky Way opposite the galactic center. The newfound cloud is roughly 5,400 light-years away, spans an area of 245 by 294 light-years, and contains an estimated 80,000 solar masses. The most remarkable feature of the cloud is its structure: it appears to have a central cavity, an elliptical disk-like body, and spiral arms. Chen’s team has suggested that the cloud owes its surprising structure to density wave theory — the same process thought to govern the formation of spiral arms in galaxies — but other possibilities such as collisions between molecular clouds can’t yet be ruled out. To learn more about the properties of this unusual molecular cloud, be sure to check out the full research article linked below.
Citation
“Discovery of a Giant Spiral Molecular Cloud in the Galactic Anticenter,” Xuepeng Chen et al 2026 AJ 172 4. doi:10.3847/1538-3881/ae6800
The post Featured Image: A Spiral Cloud in the Milky Way appeared first on AAS Nova.
]]>
On the final day of AAS 248, we heard about how ultraviolet spectroscopy can transform our understanding of the origin of the elements.
The post AAS 248: Day 4 appeared first on AAS Nova.
]]>Editor’s Note: This week we’re at the 248th AAS meeting in Pasadena, CA. Along with a team of authors from Astrobites, we will be writing updates on selected events at the meeting and posting each day. Follow along here or at astrobites.com for daily summaries, or follow @astrobites.bsky.social on Bluesky for more coverage. The usual posting schedule for AAS Nova will resume on 22 June
Table of Contents:
Plenary Lecture: Ian Roederer, The Ultraviolet Path to the Origin of the Elements (by Susanna Kohler)
When the universe first formed, the only elements present were the three lightest — hydrogen, helium, and lithium. Today, there are 118 confirmed chemical elements that make up the periodic table. So where did the heavier elements come from, when were they first created, and what can they tell us about the first stars that formed in the universe? In the final plenary of AAS 248, Ian Roederer (North Carolina State University) walked us through how ultraviolet observations are the key to understanding the origin of the elements.
We know that hydrogen, helium, and lithium were cycled through the earliest stars in the universe, where fusion and other processes produced the first heavy elements that were spit back out into the cosmos when these stars ended their lives as supernovae. According to Roederer, within just the first two or three generations of stars, every element with stable or long-lived isotopes had already been created. For the heaviest of these elements, the dominant source is likely a process called r-process nucleosynthesis, in which a rapid burst of neutrons bombards atomic nuclei, resulting in the quick capture of the neutrons to form very massive nuclei that subsequently decay to stable isotopes.
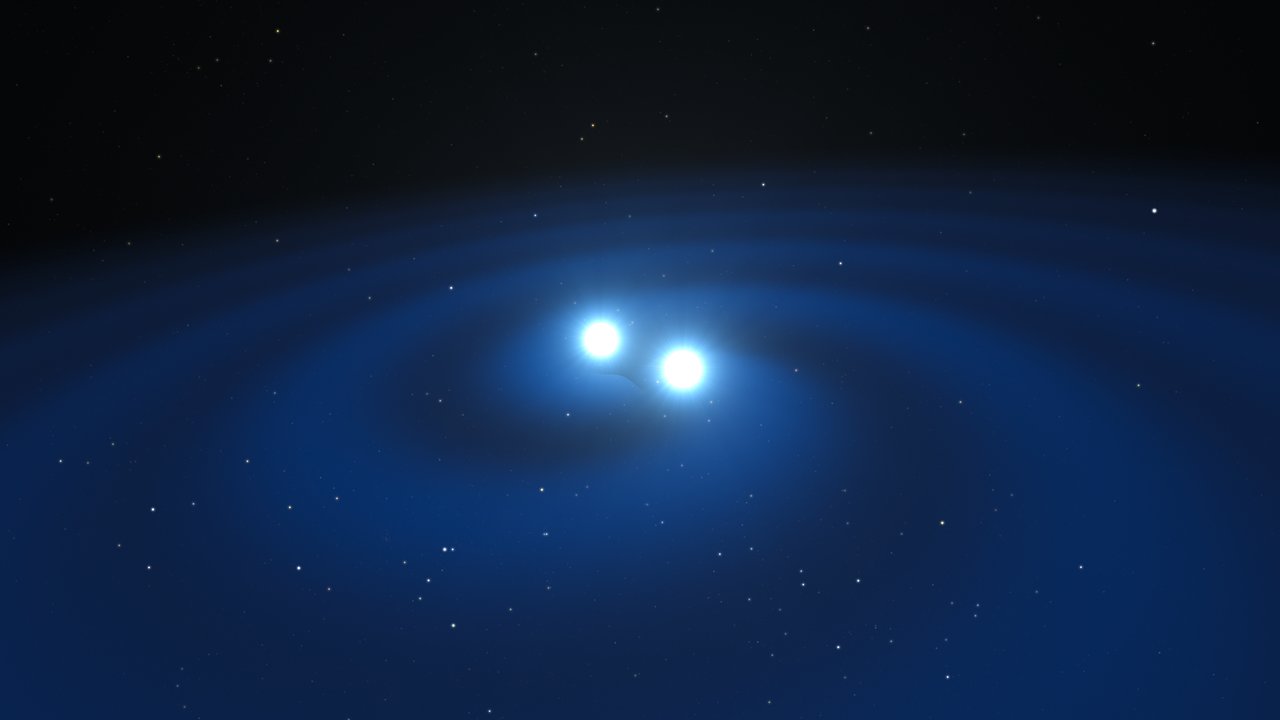
Illustration of two neutron stars approaching a merger, emitting gravitational waves as they draw closer together. [ESO/L. Calçada/M. Kornmesser; CC BY 4.0]
But remember all those news headlines about how binary neutron star mergers produce gold and platinum? Roederer points out that these were all inferred results — we didn’t actually observe direct evidence of gold and platinum in the aftermath of this explosion. That’s because it’s very difficult to detect the spectroscopic emission lines of heavy elements. To do so effectively, Roederer argues, requires high-resolution ultraviolet (UV) spectroscopy. He showed that in a cool star, high-resolution UV spectra provide a 50% increase in the number of elements you can detect. The heaviest of elements are only detectable with spectra in the UV range.
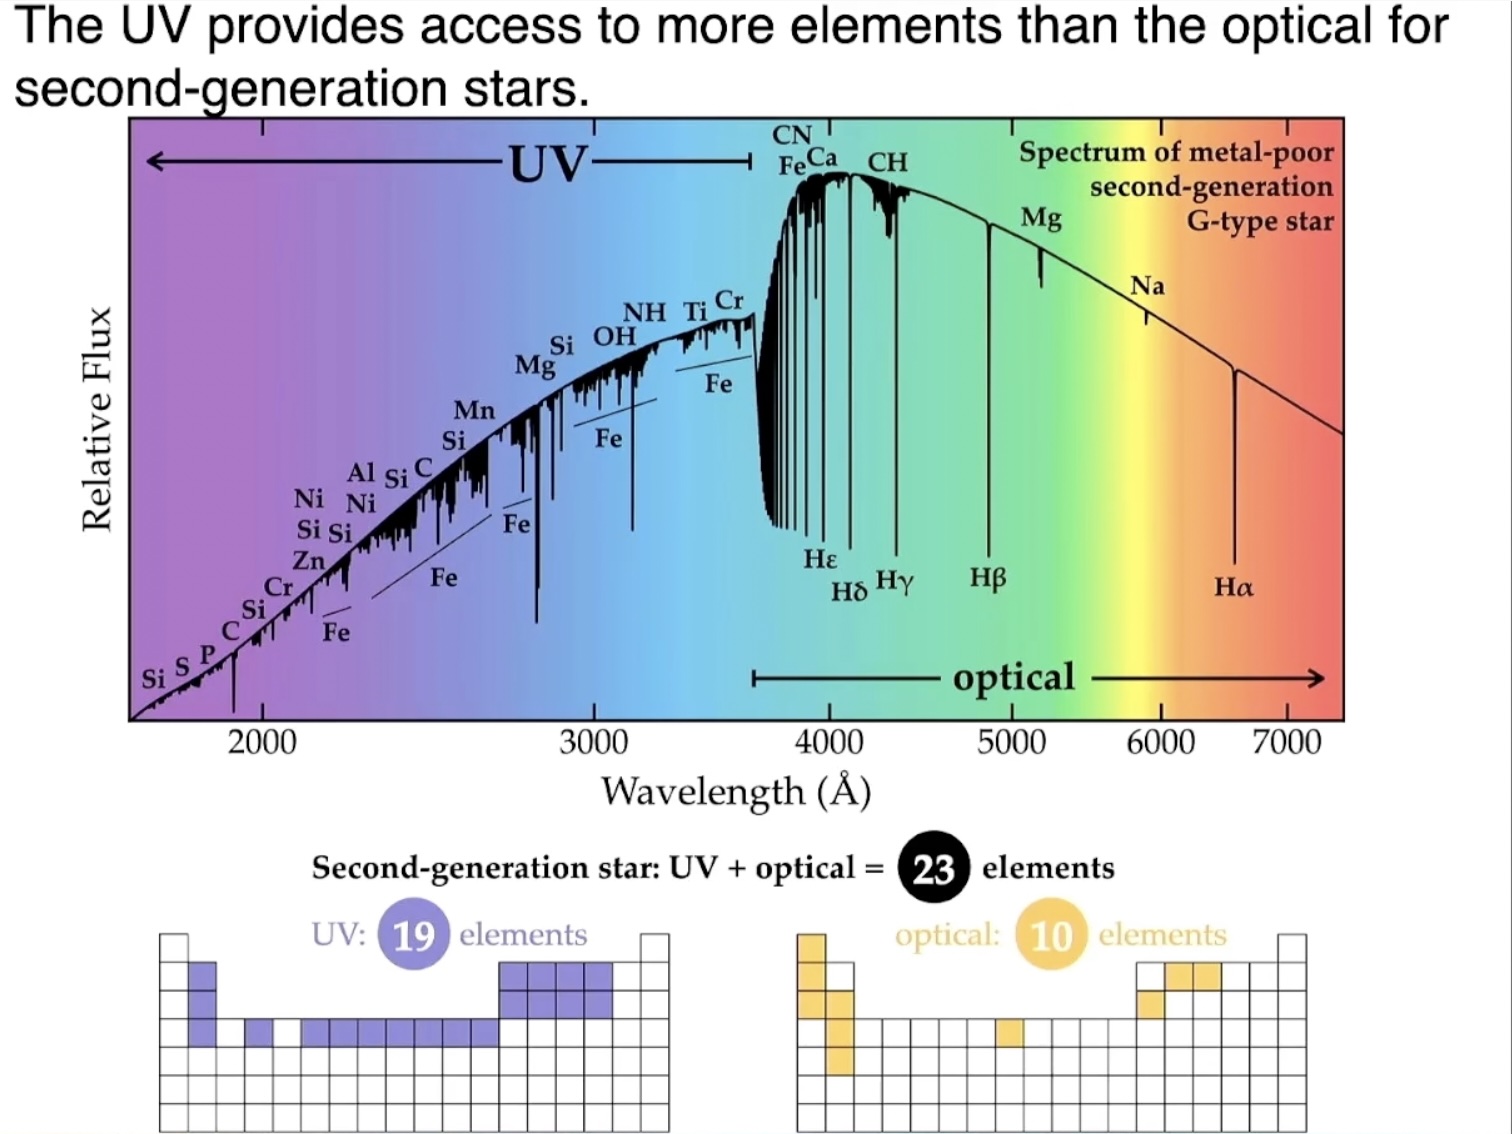
An example spectrum for a second-generation star shows how the UV is critical for identifying a broad range of elements. [Roederer 2026]
Roederer ended his talk with a look ahead at the future of UV spectroscopy and the path to the universe’s first stars. Right now, the only mission we have that produces high-resolution UV spectroscopy is Hubble. NASA’s next big flagship mission with a high-resolution spectrograph, the Habitable Worlds Observatory (HWO), will be transformational in the ability to detect — or verify the absence of — heavy elements in stellar atmospheres. An observatory like HWO will provide our best shot at identifying low-mass, metal-free stars that survive from the first generation of stars in our universe. As Roederer concluded, “The future of studying the origin of the elements is bright in the UV.”
You can read Astrobites’s interview with Ian Roederer here.
The post AAS 248: Day 4 appeared first on AAS Nova.
]]>
A glimpse into the world of high energy density laboratory astrophysics, 40 years of infrared astronomy, the discovery of twin supernova remnants, and more on Day 3 of AAS 248.
The post AAS 248: Day 3 appeared first on AAS Nova.
]]>Editor’s Note: This week we’re at the 248th AAS meeting in Pasadena, CA. Along with a team of authors from Astrobites, we will be writing updates on selected events at the meeting and posting each day. Follow along here or at astrobites.com for daily summaries, or follow @astrobites.bsky.social on Bluesky for more coverage. The usual posting schedule for AAS Nova will resume on 22 June.
Table of Contents:
- Plenary Lecture: Eliza Kempton, Common Worlds, Uncommon Complexity: Sub-Neptune and Super-Earth Atmospheres in the JWST Era
- Press Conference: Stars Reshaping Galaxies: Clusters, Feedback, and Explosive Aftermaths
- Plenary Lecture: George Helou, The Cosmic Infrared Window: Photons, Technology, and People
- Plenary Lecture: Carolyn Kuranz, Creating Astrophysical Conditions at High Energy Density Facilities
- Plenary Lecture: Cara Battersby, Our Galaxy’s Dynamic Center
Plenary Lecture: Eliza Kempton, Common Worlds, Uncommon Complexity: Sub-Neptune and Super-Earth Atmospheres in the JWST Era (by Lexi Gault)
Eliza Kempton began her talk addressing the undergraduates in the room, showing the meeting website from AAS 200, which she attended as an undergraduate in 2002. Searching this page, there were no presentations on exoplanets — a stark difference from the boom of exoplanet science that we see 24 years later at AAS 248, marking how significantly a field can transform from the start of your career.
Situating us outside of the solar system, Kempton showed the quintessential mass–period plot of all 6,000+ detected exoplanets thus far. Strikingly, we have discovered new types of planets that are not seen in our own solar system, but uncovering exoplanet populations is heavily skewed due to detection limits. While it is much easier to find large planets closely orbiting their stars, occurrence rate studies have shown that small planets on close-in orbits are much more common and typically come in two sizes: gas-rich sub-Neptunes and rocky super-Earths. However, actually deciphering their compositions relies on detailed studies of their atmospheres, which is the primary research work Kempton dove into.
How do we study exoplanet atmospheres? Thankfully, JWST provides the wavelength range and collecting area necessary for observing the minute details in exoplanet atmospheres. Beginning with sub-Neptunes, Kempton laid out four important takeaways from recent work coming from her team:
- Sub-Neptune atmospheres composed of heavier elements and molecules are common.
- Clouds and hazes are pervasive for planets that get a moderate amount of light from their host star. Early JWST observations showed signatures that may point to soot formation in sub-Neptune inner atmospheres; this soot can rise, making the upper atmosphere we observe hazy.
- Sub-Neptune atmospheres may provide a window into their interiors. Observed atmosphere compositions may indicate no solid planetary surface, but rather magma, water, and/or gas that can mix more readily with the upper atmosphere.
- Tying atmospheric observations to formation scenarios is still a challenge. Constraints on planets’ bulk composition has not provided clear answers.
Moving down to super-Earths, Kempton introduced the idea of the cosmic shoreline — the empirical relationship between planetary escape velocity and stellar irradiation shows a stark dividing line between planets with and without atmospheres in our solar system. Does this concept of a cosmic shoreline exist for exoplanets? Kempton highlighted three takeaways for the study of super-Earth atmospheres:
- Spectroscopy of super-Earth atmospheres presents degeneracies in determining their characteristics. A featureless spectrum could be due to the presence of heavy molecules and clouds, or it could just mean the planet has no atmosphere.
- Thermal emission is a powerful tool for identifying candidate atmospheres. The eclipse depth of a transiting planet is directly related to the day-side temperature of the planet. Planets with and without atmospheres will have different day-side temperatures — hotter without an atmosphere, cooler with an atmosphere.
- Many (but not all) transiting super-Earths are bare rocks.
Clearly, JWST has allowed astronomers to make significant progress in understanding exoplanet composition and subsequently their possible formation and evolutionary histories. Kempton ended with reminding us where we came from 24 years ago — the field of exoplanet science has boomed, and we can wonder how much we’ll continue to uncover in the next 24 years.
Press Conference: Stars Reshaping Galaxies: Clusters, Feedback, and Explosive Aftermaths (Briefing video) (by Niloofar Sharei)
This press conference brought together four very different views of star-forming environments: the most distant galaxy cluster caught strongly lensing a background galaxy, the dense young star clusters tucked inside the rings of nearby galaxies, the extreme feedback physics inside the closest luminous infrared galaxy merger, and the first known pair of supernova remnants born from a binary star system.
A New Era of Galaxy Cluster Analysis at Cosmic Noon: JWST’s View of a Distant Galaxy Cluster
Kyle Finner (IPAC/Caltech), presented the discovery of strong gravitational lensing in XLSSC 122, the most distant known galaxy cluster, seen as it was about 10.3 billion years ago. When the team got their JWST imaging back, they noticed bright blue arcs around the brightest cluster galaxy, a clear signature of strong lensing from a background galaxy sitting in just the right place behind the cluster. Using those arcs, the team measured the radial dark matter profile and found that XLSSC 122 is much more centrally concentrated than cosmological simulations predict. To check whether the cluster itself is unusual, they combined the JWST result with multiwavelength data. All of those tracers show an elongated structure pointing the same way as the dark matter, which is a strong sign that XLSSC 122 is a merging cluster. But mergers usually lower concentration rather than boost it, so the question of why this early cluster looks so concentrated is still open. The team plans to follow up with more strong-lensing measurements. | Press release
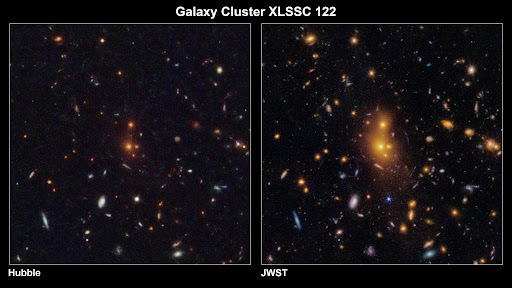
This two-panel image shows a distant galaxy cluster as it has been observed by NASA’s Hubble Space Telescope and JWST. [NASA, ESA, CSA; Kyle Finner (Caltech/IPAC) Image processing: Robert Hurt (Caltech/IPAC-SELab)]
Sajia Shahrin Neha (University of Kentucky) presented a study of young massive clusters in the circumnuclear rings of two nearby galaxies: NGC 3351, a normal spiral, and NGC 1097, which hosts an active galactic nucleus. Young massive clusters are extreme star-forming systems that pack hundreds of thousands to millions of stars into a small region, and the ring-shaped star-forming zones around these galactic nuclei provide exactly the kind of dense gas and dust reservoir these clusters need. Because the clusters are heavily obscured, optical, ultraviolet, and infrared light cannot pass through cleanly, so Neha and collaborators turned to radio continuum imaging with the Atacama Large Millimeter/submillimeter Array and the Very Large Array, which can see through the dust. Their team identified 53 young massive cluster sources across the two rings. They also placed them on an evolutionary sequence: heavily embedded “starless” clumps, newborn clusters that are just starting to become visible, and older “exposed” clusters that have already burned through much of their gas. All evolutionary stages are present in both galaxies, regardless of whether the host has an active nucleus. | NRAO press release | U. Kentucky press release
Dusty and Over-Pressured: Measuring Stellar Feedback in the Closest Luminous Infrared Galaxy
Deb/Debosmita Pathak (The Ohio State University/IPAC) presented new measurements of pre-supernova stellar feedback in NGC 3256, the closest luminous infrared galaxy and a merger between two roughly Milky Way–mass galaxies. NGC 3256 forms stars about 60 times faster than the Milky Way, which makes it a useful nearby laboratory for the intense, clumpy star formation that dominated the early universe. Using JWST plus multiwavelength data, the team measured feedback pressures around roughly 1,700 young star clusters and compared them with what we see in quieter, normal star-forming galaxies. The results break the standard picture in two ways. First, the feedback and interstellar medium pressures in NGC 3256 are about a hundred times higher than what is typical in normal star-forming galaxies. Second, the dominant feedback mode is different: instead of warm ionized gas pressure doing most of the work, ultraviolet and infrared radiation pressure on dust dominates in these much dustier environments. Even at these much higher pressures, most clusters are still over pressured relative to their surroundings, meaning radiation is strong enough to drive expansion against a dense ambient interstellar medium. | NRAO press release | OSU press release
Unveiling the First Binary-System Supernovae
Miltiadis Michailidis (Kavli Institute for Particle Astrophysics and Cosmology (KIPAC)/Stanford University/SLAC National Accelerator Laboratory) closed the session with the discovery of what appears to be the first known supernova remnant pair born from a binary star system. The starting point is IC 443, one of the best-studied supernova remnants and one of the brightest gamma-ray sources in the sky, thanks to its interaction with a dense nearby molecular cloud. Recent eROSITA observations showed that the faint X-ray “shell” long noticed next to IC 443 is in fact a second, overlapping supernova remnant. The question was whether the two are physically related or just a chance alignment on the sky. They used 15 years of Fermi gamma-ray data and modeled and subtracted IC 443’s contribution and uncovered a distinct, hidden gamma-ray source associated with the new remnant.
The gamma-ray emission is strongly spatially segregated: its northern boundary, where it overlaps the same molecular cloud that IC 443 illuminates, is dominated by accelerated protons colliding with dense gas, while its southern boundary is dominated by accelerated electrons. The team also showed that the optical filament along the northern boundary is a radiative shock that has cooled past the point of efficient particle acceleration. Combined with the fact that both remnants sit at the same distance (about 6,000 light-years), and that a population-synthesis run with a million massive binaries reproduces the observed separation and age difference, the team argues that the two remnants are the remains of a true binary pair. | Press release
Plenary Lecture: George Helou, The Cosmic Infrared Window: Photons, Technology, and People (by Kerry Hensley)
George Helou (Caltech) gave a sweeping overview of infrared astronomy over the past 40 years, including the impressive role of the Infrared Analysis and Processing Center, or IPAC, which is celebrating its 40th anniversary.
The infrared portion of the electromagnetic spectrum is broad, encompassing wavelengths from 1 to 1,000 microns. In that wavelength range, there’s a lot going on in our universe: redshifted emission from distant galaxies, stars revealed by the drop in dust extinction, rotational and fine structure lines, molecular transitions, and fully half of the radiation density in the universe.
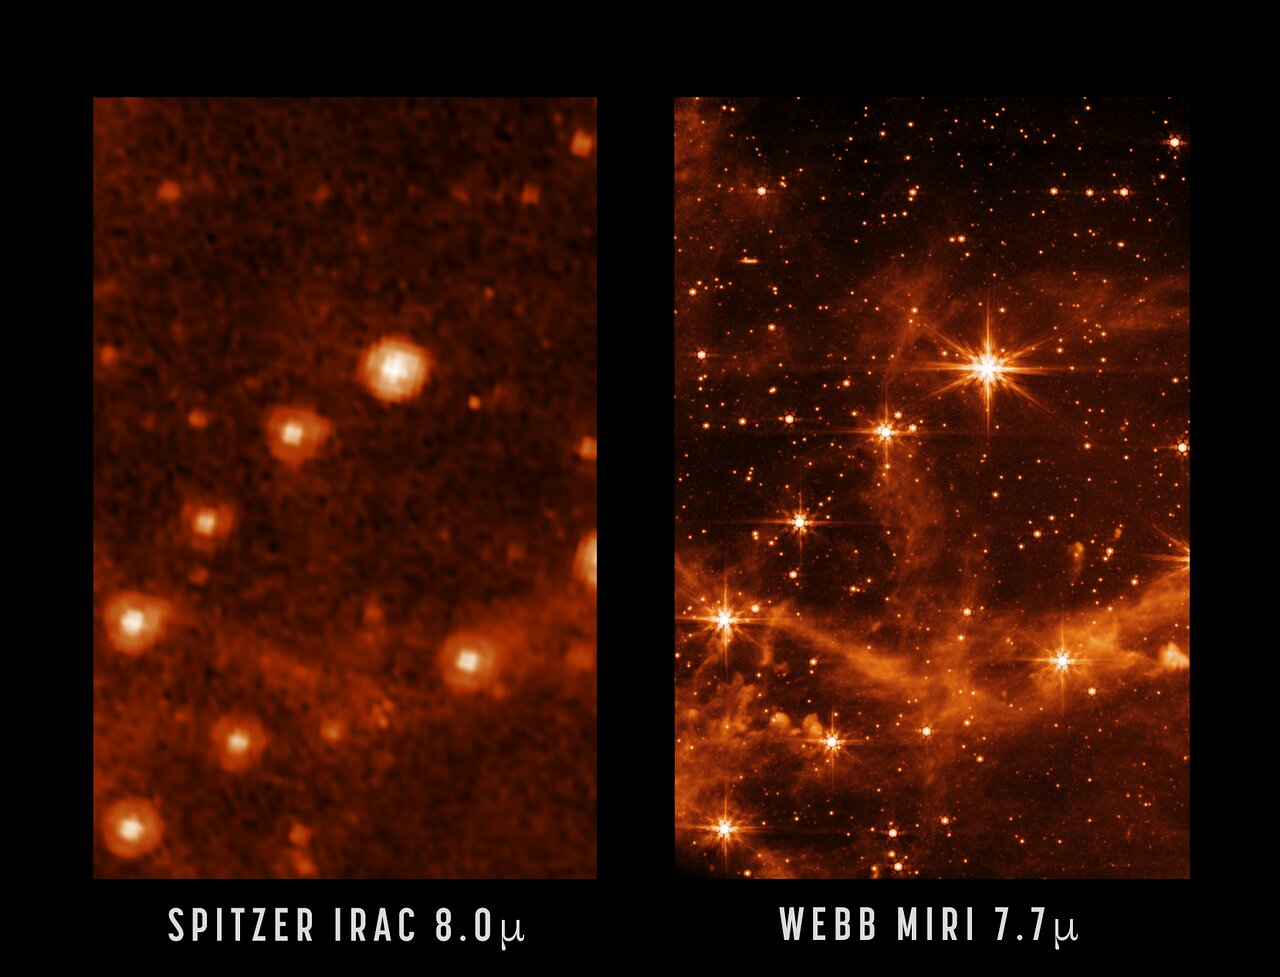
An example of how infrared capabilities have improved over time. [NASA/JPL-Caltech; MIRI: NASA/ESA/CSA/STScI]
Helou introduced a few science areas in which infrared missions have contributed greatly. First was the study of polycyclic aromatic hydrocarbons (PAHs), which are a class of molecules containing interconnected rings of carbon atoms. Thanks to infrared instruments, astronomers showed that various unassigned spectral features arose due to PAHs and that these molecules were important for the heating and cooling of the interstellar medium. As infrared instruments became more capable, observations showed how the fraction of carbon that is locked up in PAHs changes with metallicity and revealed novel species like deuterated hydrocarbon nanoparticles.
In the field of exoplanets, IRAS found evidence of excess infrared emission around Vega, hinting at a disk of debris that was later confirmed. (IPAC was instrumental in this discovery; the star Vega was being used for calibration, and the calibration wouldn’t converge because of the unexpected infrared excess.) Later, ISO used spectroscopy to investigate stellar debris disks and showed that they were similar in properties to solar system comets. Though Spitzer wasn’t initially expected to be used for exoplanet studies, the telescope made the first detection of photons from the surface of a planet and helped to discover several planets in the TRAPPIST-1 system. (Here, IPAC played an integral role again; instrument teams and flight engineers worked to ready the spacecraft for exoplanet observations by modifying the heaters on the spacecraft for pointing stability and finding “sweet spots” for photometric stability.) Today, JWST continues to advance the field with sensitive measurements of exoplanet atmospheres.
Finally, Helou touched on the work that IPAC has done to archive data. IPAC maintains the NASA/IPAC Extragalactic Database, or NED, which receives at least three queries per second. It’s also responsible for the Infrared Science Archive, data from which is used in more than 50% of research articles. IPAC also manages the NASA Exoplanet Archive, showing that the center isn’t limited to infrared astronomy!
As for the future of IPAC and infrared astronomy, it’s clear that there is much left to explore and lots of exciting work to be done; the Roman Space Telescope is scheduled to launch in a few months, and within a few years the Near-Earth Object Surveyor will follow. The Ultraviolet Explorer, for which IPAC will provide the UVEX Science Data Center, is slated to launch in 2030, and the PRobe far-Infrared Mission for Astrophysics (PRIMA) is under final review.
Read Astrobites’s interview with George Helou.
Plenary Lecture: Carolyn Kuranz, Creating Astrophysical Conditions at High Energy Density Facilities (by Lucas Brown)
While astronomy and astrophysics are often considered primarily observational sciences, with most targets of interest being millions to trillions of miles away from us — Carolyn Kuranz’s plenary talk helped to challenge this idea, demonstrating how we can sometimes bring the heavens down to Earth with high energy density (HED) facilities. The basic idea behind Kuranz’s work, and the field of HED laboratory astrophysics more broadly, is that some extreme astrophysical environments, particularly plasmas, can indeed be studied in the lab by producing smaller-scale analogs — so long as we choose the right types of experiments.
Kuranz structured her talk around three big questions she commonly gets asked about her field: firstly, why would astronomers want to do laboratory experiments? Then, what defines the “high energy density” in HED astrophysics? And finally, how do we actually do these experiments in practice? Starting with the why, Kuranz notes that studying systems in astrophysics is inherently difficult as a result of the fact that they are far away, and theoretical models can suffer from a lack of data or missing physics. Experiments can bridge the gap here, providing the ability to collect more data on specific systems of interest, complementing both theoretical models and observations.
While this philosophy can apply to a variety of laboratory astrophysics areas, such as laboratory-based studies of the chemistry of planetary atmospheres, Kuranz focused specifically on the emerging role of HED laboratory astrophysics. Typically, high energy density refers to systems with more than 1 million atmospheres of pressure and temperatures above 1 million K. Generally, this means we’re in plasma territory. In some ways, it’s only natural that studies of these sorts of environments would eventually help astrophysicists, given that around 99.9% of the matter in the universe is in plasma form. Despite this, the laboratory astrophysics side of HED physics has really only emerged over the past 30 years, with its origins being traced to work out of Lawrence Livermore National Lab, the current site of the National Ignition Facility (NIF).
Today, the NIF is only one of a few dozen facilities in which HED laboratory astrophysics experiments are conducted. This is because the type of equipment needed to reproduce environments analogous to various astrophysical systems can vary greatly. This gets to Kuranz’s third question of how these experiments are conducted. The process begins by answering a set of questions, including: do the astrophysical and proposed laboratory environments obey the same governing equations (conservation of mass, momentum, etc.)? Is one able to re-scale the physical parameters in each system (timescale, size, density, pressure, etc.) in a way that retains relevant dynamics like viscosity, Reynolds number, and so on? Once these details have been nailed down, a researcher can assess what types of facilities they may need. For example, the NIF, which uses symmetrical arrangements of lasers to compress and heat up millimeter-scale pellets containing gases that can undergo nuclear fusion, provides a fairly natural environment for studying processes in the cores of stars, which are also hot, dense, and neutron-rich environments where fusion is actively occurring.
As for the future, things look promising for HED laboratory astrophysics — since the NIF achieved “ignition” in 2022, producing a net gain of energy from one of these pellet-crushings for the first time, a huge amount of interest and investment has been flowing into facilities studying HED physics. These facilities range from private companies working to achieve sustained nuclear fusion power generation to longstanding federal research centers working on understanding nuclear weapons and stockpile management, but they all provide astronomers with the opportunity to do what was once unthinkable: bring the universe’s most extreme environments down to Earth.
Plenary Lecture: Cara Battersby, Our Galaxy’s Dynamic Center (by Niloofar Sharei)
Cara Battersby (University of Connecticut) used her plenary to walk us through her group’s ongoing effort to understand one of the most extreme environments in our own galaxy: the central molecular zone (CMZ), which is a dense, turbulent gas reservoir at the heart of the Milky Way. Her talk pulled together large surveys, new high-resolution zoom simulations, and machine-learning methods designed to bridge between the two.
She opened with the PRobe far-Infrared Mission for Astrophysics (PRIMA), the far-infrared probe mission concept she is a co-investigator on. This mission concept was developed in response to NASA’s recent billion-dollar probe mission call, and selection is expected later this year. PRIMA covers roughly 1.8–25 microns with imaging and spectroscopy, and galactic ecosystems make up about a quarter of its science case.
Battersby paused mid-talk to speak directly to early-career people in the audience about work-life balance, including bringing her daughter and sister with her to the meeting, and the SPARK program at UConn that supports women and underrepresented groups in physics. Her message: astronomy should be done from a place of joy, and visible work-life balance is something the community should be more open about.
Battersby framed the Milky Way as the natural laboratory for star formation across a huge range of environments, and briefly reviewed the ALMAGAL survey, which observed roughly 1,000 high-mass star-forming regions across the disk. But her main focus was the CMZ, which she argued is essentially a different kind of galaxy embedded inside our own. About 80% of all the dense molecular gas in the Milky Way sits in the CMZ, and its gas properties — density, turbulence, temperature, and pressure — are extreme compared to the rest of the disk. Because nearby starburst and high-redshift environments share many of these properties, the CMZ is the closest place we can actually resolve individual star-forming cores under conditions that resemble the early universe.
She showed that gas in the CMZ is extremely filamentary across all scales, and that the relationship between dense gas and star formation rate is unusual: when individual clouds in the CMZ actually form stars, they form them much like clouds elsewhere in the galaxy, but a large fraction of the dense gas in the CMZ never engages in star formation at all. Battersby argued that this is likely because so much of that gas is being shaped by flows toward the black hole and the strong turbulence and dynamics of the central environment, and it never cools and collapses into stars.
She closed with the simulation and machine-learning side of the program. Her group runs zoom simulations that can follow individual star-forming regions and can resolve down to CMZ scales while still capturing the full ~5 kpc bar driving gas inward. To extract more from these simulations than just side-by-side image comparisons, the team built a GPU-accelerated radiative transfer code that runs roughly 10,000 times faster than existing codes. They generate hundreds of thousands of synthetic observations and use them to train an encoder–decoder convolutional neural network that learns to predict the top-down structure of a region from the side-on view we actually observe. Applied to the CMZ, the network produces 3D reconstructions that are physically plausible and broadly consistent across independent training runs.
Read Astrobites’s interview with Cara Battersby.
The post AAS 248: Day 3 appeared first on AAS Nova.
]]>
On Day 2 of AAS 248: roasted exoplanets, globular clusters, the cost of losing our dark night skies, and more.
The post AAS 248: Day 2 appeared first on AAS Nova.
]]>Editor’s Note: This week we’re at the 248th AAS meeting in Pasadena, CA. Along with a team of authors from Astrobites, we will be writing updates on selected events at the meeting and posting each day. Follow along here or at astrobites.com for daily summaries, or follow @astrobites.bsky.social on Bluesky for more coverage. The usual posting schedule for AAS Nova will resume on 22 June.
Table of Contents:
- Helen B. Warner Prize Lecture: Kyle Kremer, Globular Clusters: Astronomical Factories of Gravitational-wave and Electromagnetic Transients
- Press Conference: Our Changing Galaxy and the Skies We See
- High Energy Astrophysics Division Early Career Prize Lecture: Carolyn Kierans, Developing Next-Generation MeV Telescopes
- Press Conference: Fire and Ice in Planetary Systems Near and Far
- Solar Physics Division George Ellery Hale Prize Lecture: Yi-Ming Wang, The Sun as a Laboratory for Astrophysical Magnetic Fields
- Plenary Lecture: David Jewitt, The Interstellar Interlopers
Helen B. Warner Prize Lecture: Kyle Kremer, Globular Clusters: Astronomical Factories of Gravitational-Wave and Electromagnetic Transients (by Lucas Brown)
Kyler Kremer (University of California, San Diego) kicked off day two of AAS 248 with a “dynamic” talk on the complex interactions and environments that exist within globular clusters — the most massive category of stellar clusters, which can contain upwards of one billion stars. Because of the extreme stellar density of these environments, they are thought to be good factories of systems ranging from accreting white dwarfs to millisecond pulsars, which are often spun up to high speeds via accretion from companion stars. Such accretion, whether onto pulsars or other compact objects, can often generate bright X-rays, and as Kremer noted early on in his talk, it was in fact these X-ray sources that provided some of the earliest evidence of the abundance of exotic systems within globular clusters. By the early 2000s, hundreds of X-ray sources had been identified in globular clusters.
Along with these brightly emitting compact binary systems, we expect globular clusters to be home to a vast population of darker, more elusive objects — black holes. Kremer noted that because about one out of every thousand stars is thought to be massive enough to evolve into a black hole, older globular clusters are thought to produce tens or hundreds of thousands of black holes over time. These black holes are then expected to gradually sink towards the centers of the clusters through dynamical friction, where they will increasingly find themselves in the company of other black holes, or black hole binaries. As these massive objects swing by each other, they can occasionally merge or eject black holes out of clusters entirely. This leads to a complex evolutionary history, leaving many open questions in regards to how many black holes should persist in globular clusters today and with what properties.
Luckily, strong evidence for the presence of black holes in globular clusters began to come in around the early 2000s as a result of the direct measurements of stellar orbits around an invisible, at least 4-solar-mass object in NGC 3201. Since this discovery, multiple others have been made via similar techniques. The role of black holes in shaping our observation of globular clusters may go well beyond these isolated systems, however. Theoretical work has also shown that the presence of black hole binaries in the centers of globular clusters may contribute to dynamical heating of the overall cluster. This suggests that globular clusters that have not undergone core collapse, which represents over 80% of clusters, should retain significant black hole populations today.
While individual black holes can often be hard to spot, black hole binaries are becoming increasingly easy to hear, thanks to the advent of gravitational wave astronomy. At facilities like LIGO, Virgo, and KAGRA, merging black hole binaries are now regularly detected, creating a population-level catalog of black hole binary properties. While many of these systems can be well explained by black holes formed in the “isolated” channel, meaning originating from a preexisting binary star system, some mergers show signs of a “dynamical” formation history, which can arise in the sort of dense environments globular clusters provide. As one example, there seems to be more black holes in the 40-solar-mass and above range than many models predicted. At these high masses, more potential progenitor stars actually become too large to form black holes thanks to a phenomenon called pair instability. However, such massive black holes could be formed from the repeated mergers of smaller black holes — a hierarchical process that simulations have consistently shown can be highly efficient in globular clusters, especially the most massive ones. On top of this, Kremer noted that individual gravitational wave signals have recently shown other telltale signs of hierarchically formed binary black holes, such as asymmetric masses and spin–orbit misalignment.
Finally, Kremer turned to another class of exotic astrophysical objects to explore other ways globular clusters can generate interesting phenomena: pulsars. Pulsars, like black holes, form from the collapse of massive stars. This rapidly rotating sub-category of neutron stars beams radiation from their poles, which gradually slows them down and depletes the strength of their radio emission over millions or billions of years. Because of this, one would expect older globular clusters to have a slowly rotating and mostly invisible population of pulsars. Instead, we see many rapidly rotating millisecond pulsars in these environments, suggesting that the dense cluster environment allows for many of these systems to be spun back up through accretion from other stars. In contrast, we also see young globular clusters which contain slowly rotating pulsars — another puzzle, yet one that may again be explained by the dense environment. Some researchers believe that these pulsars are formed via the direct merger of multiple white dwarfs, rather than from the collapse of a massive star. Such systems may also be the source of some fast radio bursts; the first fast radio burst associated with a globular cluster was discovered in 2020. It seems like globular clusters may be the gift that just keeps on giving!
Press Conference: Our Changing Galaxy and the Skies We See (Briefing video) (by Niloofar Sharei)
This press conference walked through four very different ways our view of the Milky Way and our skies are changing right now — from extreme gas physics at the Galactic Center, to the hidden stellar populations of a cluster, to the rapid flickers of dying stars, and finally, to a very practical question: what are dark night skies actually worth to the public?
Resolving the Supersonic-to-Subsonic Gas Transition in the Galactic Center for the First Time
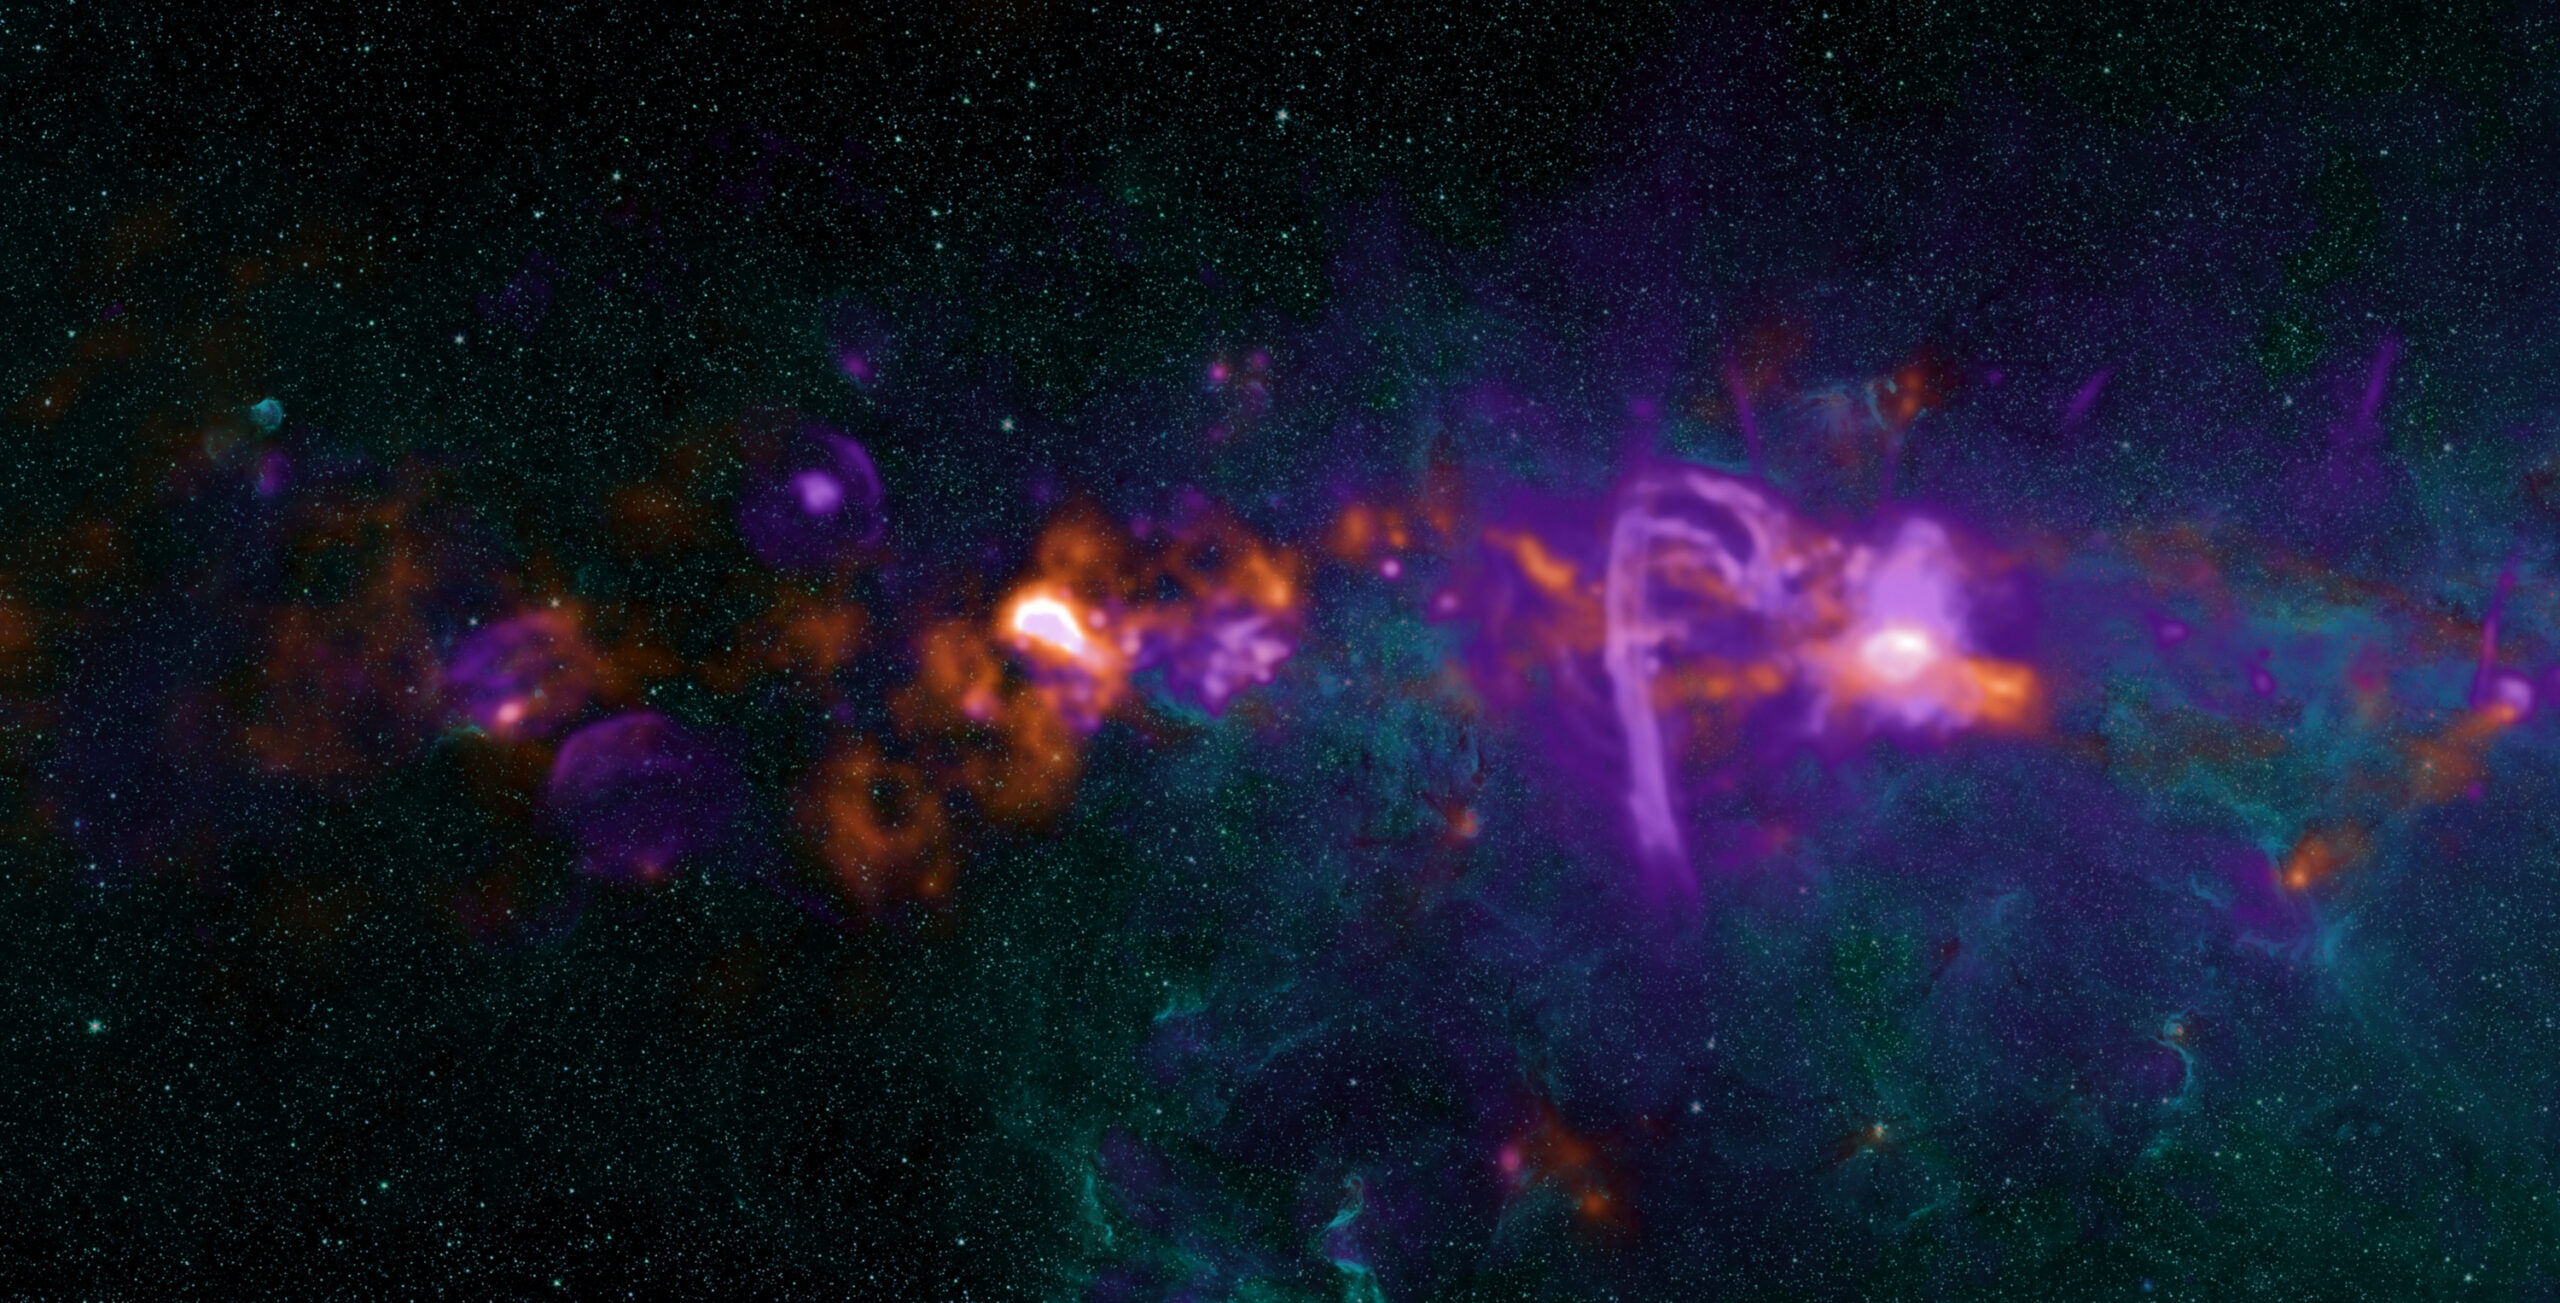
The galactic center and the surrounding central molecular zone make up the most active star formation region in the Milky Way. [NRAO/AUI/NSF; CC BY 4.0]
Buddhacharya mapped how gas transitions from highly turbulent, supersonic motion to calmer, subsonic motion across a region in the CMZ. This transition is well known in nearby clouds, where it usually precedes gravitational collapse, but it had never been clearly resolved in the CMZ before. Their team found a “calm island” of subsonic gas embedded in the otherwise turbulent sea. This is the first observation of its kind in the galactic center.
The Multi-Age Stellar Populations of Terzan 5 as Revealed by JWST
R. Michael Rich (University of California, Los Angeles) presented new JWST and Hubble Space Telescope observations of Terzan 5, an unusual stellar system near the center of the Milky Way that looks like a globular cluster but doesn’t act like one. Earlier work had already shown that Terzan 5 hosts at least two distinct stellar populations with very different ages and chemical abundances, which is unusual for a typical globular cluster.
Because Terzan 5 sits behind a thick screen of foreground stars and dust, separating real cluster members from contamination is one of the hardest parts of the analysis. The team combined JWST and Hubble imaging to measure stellar proper motions, then used a vector point diagram to isolate the stars that move together with the cluster. They identified two additional stellar populations beyond the two already known. Rich argued that Terzan 5 may be a “fossil fragment,” possibly the leftover core of a small galaxy or early bulge structure that was accreted long ago.
Sub-Day Periodic Variability of Two Central Stars of Planetary Nebulae
Gaoyang Du (Dalian University of Technology) reported the discovery of new short-period signals in the central stars of two planetary nebulae. These central stars are the hot, exposed cores left behind by Sun-like stars at the end of their lives, and finding rapid brightness variations in them tells us about their interior structure and pulsation physics.
Short-period signals well under a day are very hard to recover from the ground because Earth’s rotation introduces strong one-day aliasing, so the team turned to the Transiting Exoplanet Survey Satellite, which observes continuously from space. Using a neural-network pipeline designed to handle the crowded, contaminated backgrounds these stars sit in, they recovered the previously known variability in NGC 1501 and detected a new signal at roughly half an hour. Follow-up spectroscopy will be needed to pin down whether the signals come from pulsations, rotation, or something else, but the result opens a new window on the rapid variability of dying-star cores.
Artificial Light at Night Significantly Degrades the Value of Public Lands
Jordan Smith (Utah State University) closed the press conference with a very different kind of measurement: the economic value of dark night skies. While astronomers usually treat light pollution as an observing problem, Smith and his collaborators are asking what the public is actually losing and what people would pay to keep dark skies on public lands. The team surveyed 634 visitors across International Dark Sky-certified parks, asking detailed questions about visitation behavior, motivations, and willingness to pay. Combining those surveys with satellite-based sky-brightness data, they estimated how the actual darkness of a site translates into the value visitors place on a trip. Based on the survey results, they found that visitors were willing to pay $45 more per visit to go to a park with skies one level darker on the Bortle scale. That sounds small per visitor, but scaled across all visits to all dark-sky public lands, it represents a very large economic value tied to a public good that current policy frameworks rarely account for.
An illustration of the Bortle scale, which quantifies the degree of light pollution at a given location. [ESO/P. Horálek, M. Wallner; CC BY 4.0]
High Energy Astrophysics Division Early Career Prize Lecture: Carolyn Kierans, Developing Next-Generation MeV Telescopes (by Niloofar Sharei)
Carolyn Kierans (NASA Goddard Space Flight Center) was awarded the AAS High Energy Astrophysics Division Early Career Prize for her work on developing the next generation of megaelectronvolt (MeV) gamma-ray telescopes. Her talk laid out why the MeV band is so valuable (it contains nuclear emission lines like the 511 keV positron-annihilation line that traces high-energy processes in our galaxy) and why it has been so technologically difficult to observe well, since photons at these energies do not focus easily and the dominant interaction in the detector is Compton scattering. She walked through her work using balloon-borne Compton telescopes to mature the technology, the tools her team has developed in recent years to improve event reconstruction, and the broader roadmap for the next generation of MeV instruments.
Read Astrobites’s interview with Carolyn Kierans.
Press Conference: Fire and Ice in Planetary Systems Near and Far (Briefing video) (by Kerry Hensley)
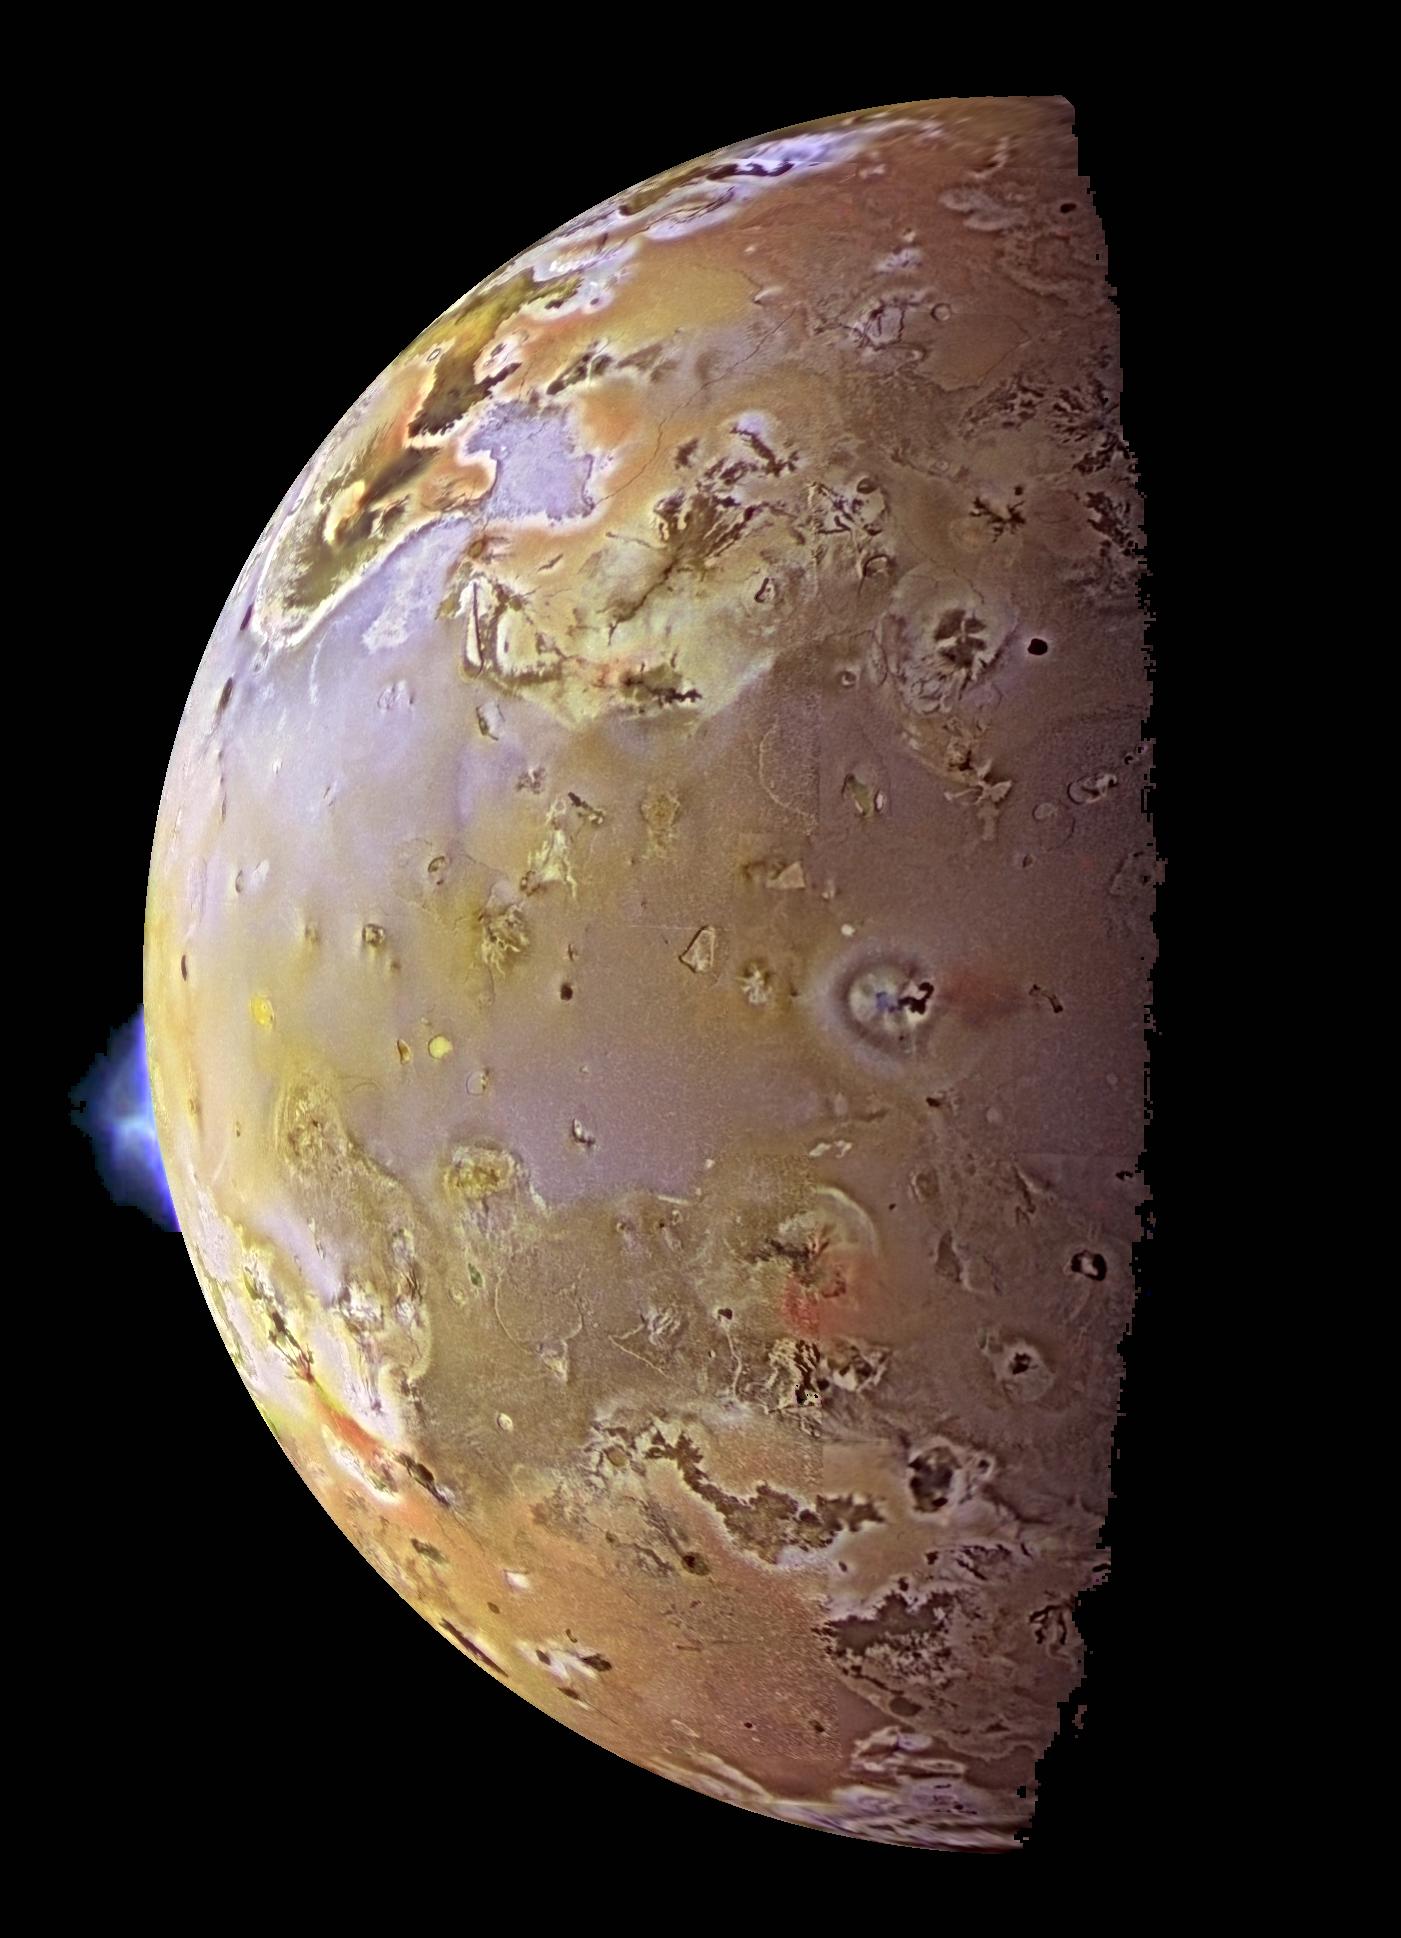
An image from the Galileo spacecraft of a volcanic plume on Jupiter’s moon Io. [NASA/JPL/University of Arizona]
The team modeled Io’s plumes in order to explain the moon’s lack of impact craters, understand how certain plumes have persisted on Io for more than 45 years, and motivate a possible mission concept that includes a plume flythrough and sample return. They modeled the formation of ash as magma rises in a volcanic vent as well as the trajectory of the ash once it’s ejected into the plume, aiming to 1) match the plume observations from the Galileo spacecraft and 2) understand how an ash-filled plume might look different from one filled only with sulfur dioxide. While Turner found that Galileo data couldn’t discern between the two scenarios, ash makes a dramatic difference at the sub-millimeter wavelengths accessible to the Atacama Large Millimeter/submillimeter Array, which the team hopes to use to test this prediction. Finally, returning to the development of the mission concept, Turner proposed using a probe to first fly through the shadow of a plume to assess the particle size before sending the spacecraft through to collect a sample.
Up next, Tunhui Xie (University of California, Los Angeles) turned to Io’s neighbor, Europa. Europa and the other large icy moons of Jupiter are of interest to researchers because they might have subsurface oceans. Observations of Europa from ~30 years ago show that the moon has strange radar properties: its radar albedo is large, and the return signal retains the strong circular polarization of the outgoing signal.
To investigate the moon’s radar weirdness further, Xie’s team observed Europa from 2011 to 2024 and showed that the moon’s albedo (fraction of light reflected from its surface) is roughly constant with longitude. There is some evidence of differences between Europa’s hemispheres, which could be a sign of spiky ice structures called penitentes protruding from the frosty surface; Europa’s trailing hemisphere might be subjected to more particles from Jupiter’s magnetosphere, which could suppress the growth of penitentes in that region and cause a difference in the albedo. Xie also addressed the polarization behavior of the radar signal, showing that this is likely due to the coherent backscatter opposition effect. Finally, Xie showed how observations helped to place an upper bound of 32 meters for the penetration depth of X-band radar photons into Europa’s icy shell.
Penitentes in the Atacama Desert. [ESO/B. Tafreshi (twanight.org); CC BY 4.0]
In some of the earliest spectroscopy taken by a large-aperture telescope, Bolin’s team found cometary volatiles like CN, but not C2 or C3, which are common in comets, giving them a green color. These missing species emerged a couple of months later, which coincided with the comet taking on a greener appearance. As the comet retreated from its encounter with the Sun, these emission features faded. This presentation by Bolin showed how early and continuing monitoring of an interstellar object by a large-aperture telescope can reveal how these objects are affected by their journeys through our solar system.
Moving out of the solar system entirely, Tiffany Kataria (NASA JPL/Caltech) turned the discussion toward exoplanets. Kataria discussed HD 80606b, a 4.1-Jupiter-mass planet on an extremely eccentric (e = 0.93) orbit with a period of 111 days around a solar-type star. Kataria used JWST to observe HD 80606b’s phase curve, which revealed different parts of the planet as it travels along its orbit. Each time the planet makes its extremely close approach to its host star, it gets “flash roasted” and experiences a rapid increase in temperature. This rapid heating event is complex, depending on factors like the planet’s atmospheric chemistry and winds. The JWST data revealed that HD 80606b’s temperature skyrockets an incredible 1,100℉ over the course of its orbit. There’s still much more to learn from the rich spectroscopic dataset from JWST, so keep an eye out for more findings about this flash-roasted exoplanet in the future!
Finally, Aurora Kesseli (IPAC/Caltech) discussed another toasty exoplanet called CoRoT-2b, which is a hot Jupiter on a 1.7-day orbit around its star. Because hot Jupiters orbit their hosts so closely, astronomers expect all of these extreme exoplanets to be tidally locked, with one side of the planet perpetually facing the star and the other side in perpetual darkness. However, CoRoT-2b might be breaking that trend. In 2018, researchers reported that CoRoT-2b had winds that blew in the opposite direction from all other known hot Jupiters. They drew this conclusion from the location of the hottest point on CoRoT-2b, which appeared just after the planet ducked behind its star, rather than just before — unlike all other hot Jupiters studied so far. At the time, researchers hypothesized that the unusual location of the hotspot was due to clouds on one side of the planet, a magnetically induced westward wind, or a lack of tidal locking.
Using new data from the Very Large Telescope and Gemini South, Kesseli found that the planet’s strange properties can be explained best by a lack of tidal locking. CoRoT-2b appears to rotate at 2.24 km/s — far slower than the 4.37 km/s expected if the planet were tidally locked. There are no theories yet that explain why CoRoT-2b wouldn’t be tidally locked, so it remains a mystery for now!
Solar Physics Division George Ellery Hale Prize Lecture: Yi-Ming Wang, The Sun as a Laboratory for Astrophysical Magnetic Fields (by Kerry Hensley)
Yi-Ming Wang (Naval Research Laboratory) gave the AAS Solar Physics Division’s George Ellery Hale Prize Lecture for “sustained, foundational contributions to understanding solar magnetism, the solar cycle, and the solar wind.” Wang is perhaps most known for the Wang–Sheeley–Arge solar wind model, which is widely used in space weather forecasting.
Wang began by musing on how his winding career path brought him to solar physics. Initially a theorist who modeled neutron stars, Wang was later hired to do radio astronomy but arrived for the position later than expected, so he was roped into working on solar physics instead — where he learned many things about magnetic fields that he wished he’d known when working on neutron stars!
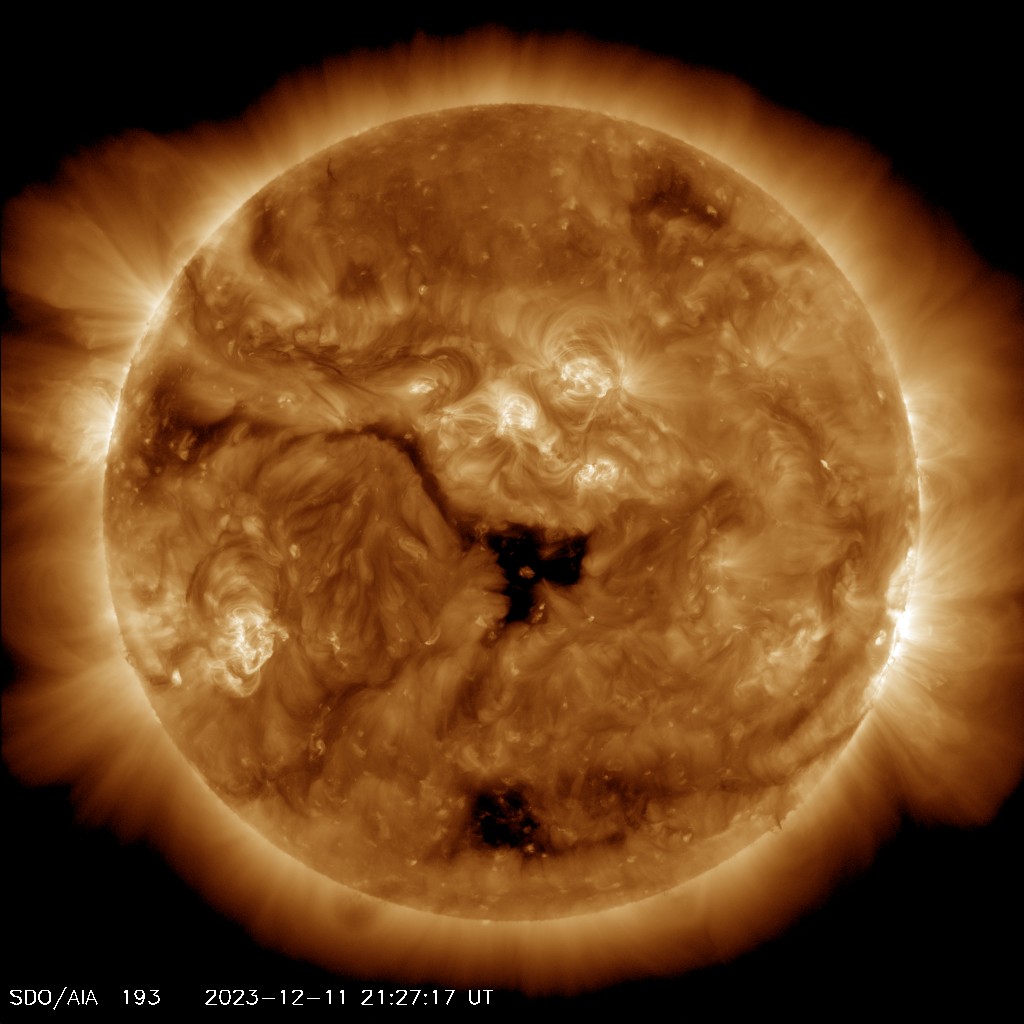
This 19.3-nanometer image, taken by the Solar Dynamics Observatory on 11 December 2023, shows at the center of the Sun’s disk the remnant of a large coronal hole. [NASA/SDO and the AIA, EVE, and HMI science teams]
Next, Wang discussed the source of coronal heating. The solar corona is famously extremely hot, running at a few million degrees compared to the ~6000K solar photosphere. For decades, the Parker nanoflare model has been the leading explanation for how the corona gets so hot. In this model, the places where coronal loops touch down in the solar photosphere are continually wiggled around by random motions of the photosphere, which tangles up the magnetic field lines in the coronal loop. When the current sheets in this system dissipate, the corona is heated. Instead, Wang favors an observationally based model in which the heating comes from magnetic reconnection with underlying small-scale fields.
Finally, Wang briefly touched on the connection between the Sun’s magnetic field and the speed of the solar wind. The solar wind has been measured at Earth since the 1960s, and these measurements have shown that the mass and energy flux density of the solar wind scales with the strength of the footprint magnetic field strength, but the observed solar wind speed is independent of the footprint field strength. Instead, the speed scales inversely with the rate of magnetic flux-tube expansion in the corona. Thus, the solar wind speed at Earth can be calculated from the rate of flux-tube expansion along open magnetic field lines using maps of the photospheric magnetic field.
In the end, Wang’s work on the solar magnetic field did connect back to his earlier work in high-energy astrophysics, with relevance to period changes in binary pulsar systems and other areas. Magnetic fields really do connect all parts of astrophysics!
Read Astrobites’s interview with Yi-Ming Wang.
Plenary Lecture: David Jewitt, The Interstellar Interlopers (by Niloofar Sharei)
David Jewitt focused his plenary talk on a rare kind of small body: the three confirmed interstellar objects that have passed through the solar system so far. He opened with the Oort cloud as a framing device. Comets in the Oort cloud did not form there — they formed near the giant planets and were scattered out by gravitational interactions. The same process leaks comets to interstellar space very efficiently: only about 1–10% are trapped into a star’s own Oort cloud. Across the galaxy, that implies a free-floating population on the order of 1024–1025 objects. Seeing some of them pass through our solar system is exactly what we should expect.
Artist’s impression of the first known interstellar object to visit our solar system. ʻOumuamua. [ESO/M. Kornmesser; CC BY 4.0]
Jewitt then turned to what the three objects tell us as a population. The strongest constraint comes from ʻOumuamua, precisely because its discovery was such a near miss: catching one in that brief visibility window implies roughly 1,000 similar objects crossing the solar system per year. The three objects look very different in size, activity, and composition, which is consistent with sampling a broad galactic population, and their velocity dispersion lines up with the disk-heating picture, in which older galactic populations are kinematically hotter. The leading origin story is the same one he set up at the start: scattering from the protoplanetary disks of giant planets around other stars.
Read Astrobites’s interview with David Jewitt.
The post AAS 248: Day 2 appeared first on AAS Nova.
]]>
Day 1 of AAS 248 in Pasadena, CA: cosmology, early results from Rubin Observatory, a discussion of AI in astronomy, and much more!
The post AAS 248: Day 1 appeared first on AAS Nova.
]]>Editor’s Note: This week we’re at the 248th AAS meeting in Pasadena, CA. Along with a team of authors from Astrobites, we will be writing updates on selected events at the meeting and posting each day. Follow along here or at astrobites.com for daily summaries, or follow @astrobites.bsky.social on Bluesky for more coverage. The usual posting schedule for AAS Nova will resume on 22 June.
Table of Contents:
- Fred Kavli Plenary Lecture: Richard Teague, Revealing the Dynamics of Planet Formation
- Press Conference: The Science of Stellar Remnants
- Plenary Lecture: Sanmi (Oluwasanmi) Koyejo, The Measurement Gap: What AI Can Get Wrong and Why Astronomers Are the Fix
- Press Conference: Variable, Windy, and Disruptive: The Behavior of Supermassive Black Holes
- Plenary Lecture: Mario Juric, Early Results from the Rubin Observatory: Mapping the Solar System and Beyond
- Plenary Lecture: Esra Bulbul, Cosmology and Baryons Across Scales: Probing Halo Mass Function to Cosmic Filaments with eROSITA
Fred Kavli Plenary Lecture: Richard Teague, Revealing the Dynamics of Planet Formation (by Lexi Gault)
Richard Teague (Massachusetts Institute of Technology) gave the Fred Kavli Plenary Lecture on his groundbreaking work in the dynamics of planet formation. The study of planet formation, as Teague introduced, has advanced significantly in the last two decades with the discovery of thousands of exoplanets and the launch of cutting-edge instruments. While planets are found everywhere orbiting a wide variety of stars, not all planetary systems look the same. Our solar system looks very different from other exoplanetary systems, challenging our understanding of planet formation and requiring us to build a picture that works across the board.
Where do we look to build a better understanding of planet formation? Planets are inherently the byproduct of star formation, forming in protoplanetary disks around new stars. These disks are filled with gas and dust, concentrating mass into rings that then eventually form planets. Exactly how this process proceeds is variable, and the resulting planetary system depends on how the material in the protoplanetary disk mixes and combines into planets. Teague compared planets to bread: we know the simple list of ingredients that it takes to make them, but what you end up with depends on how you bring those same ingredients together. We need to study what is happening in the planetary mixing bowls to understand how planets form.
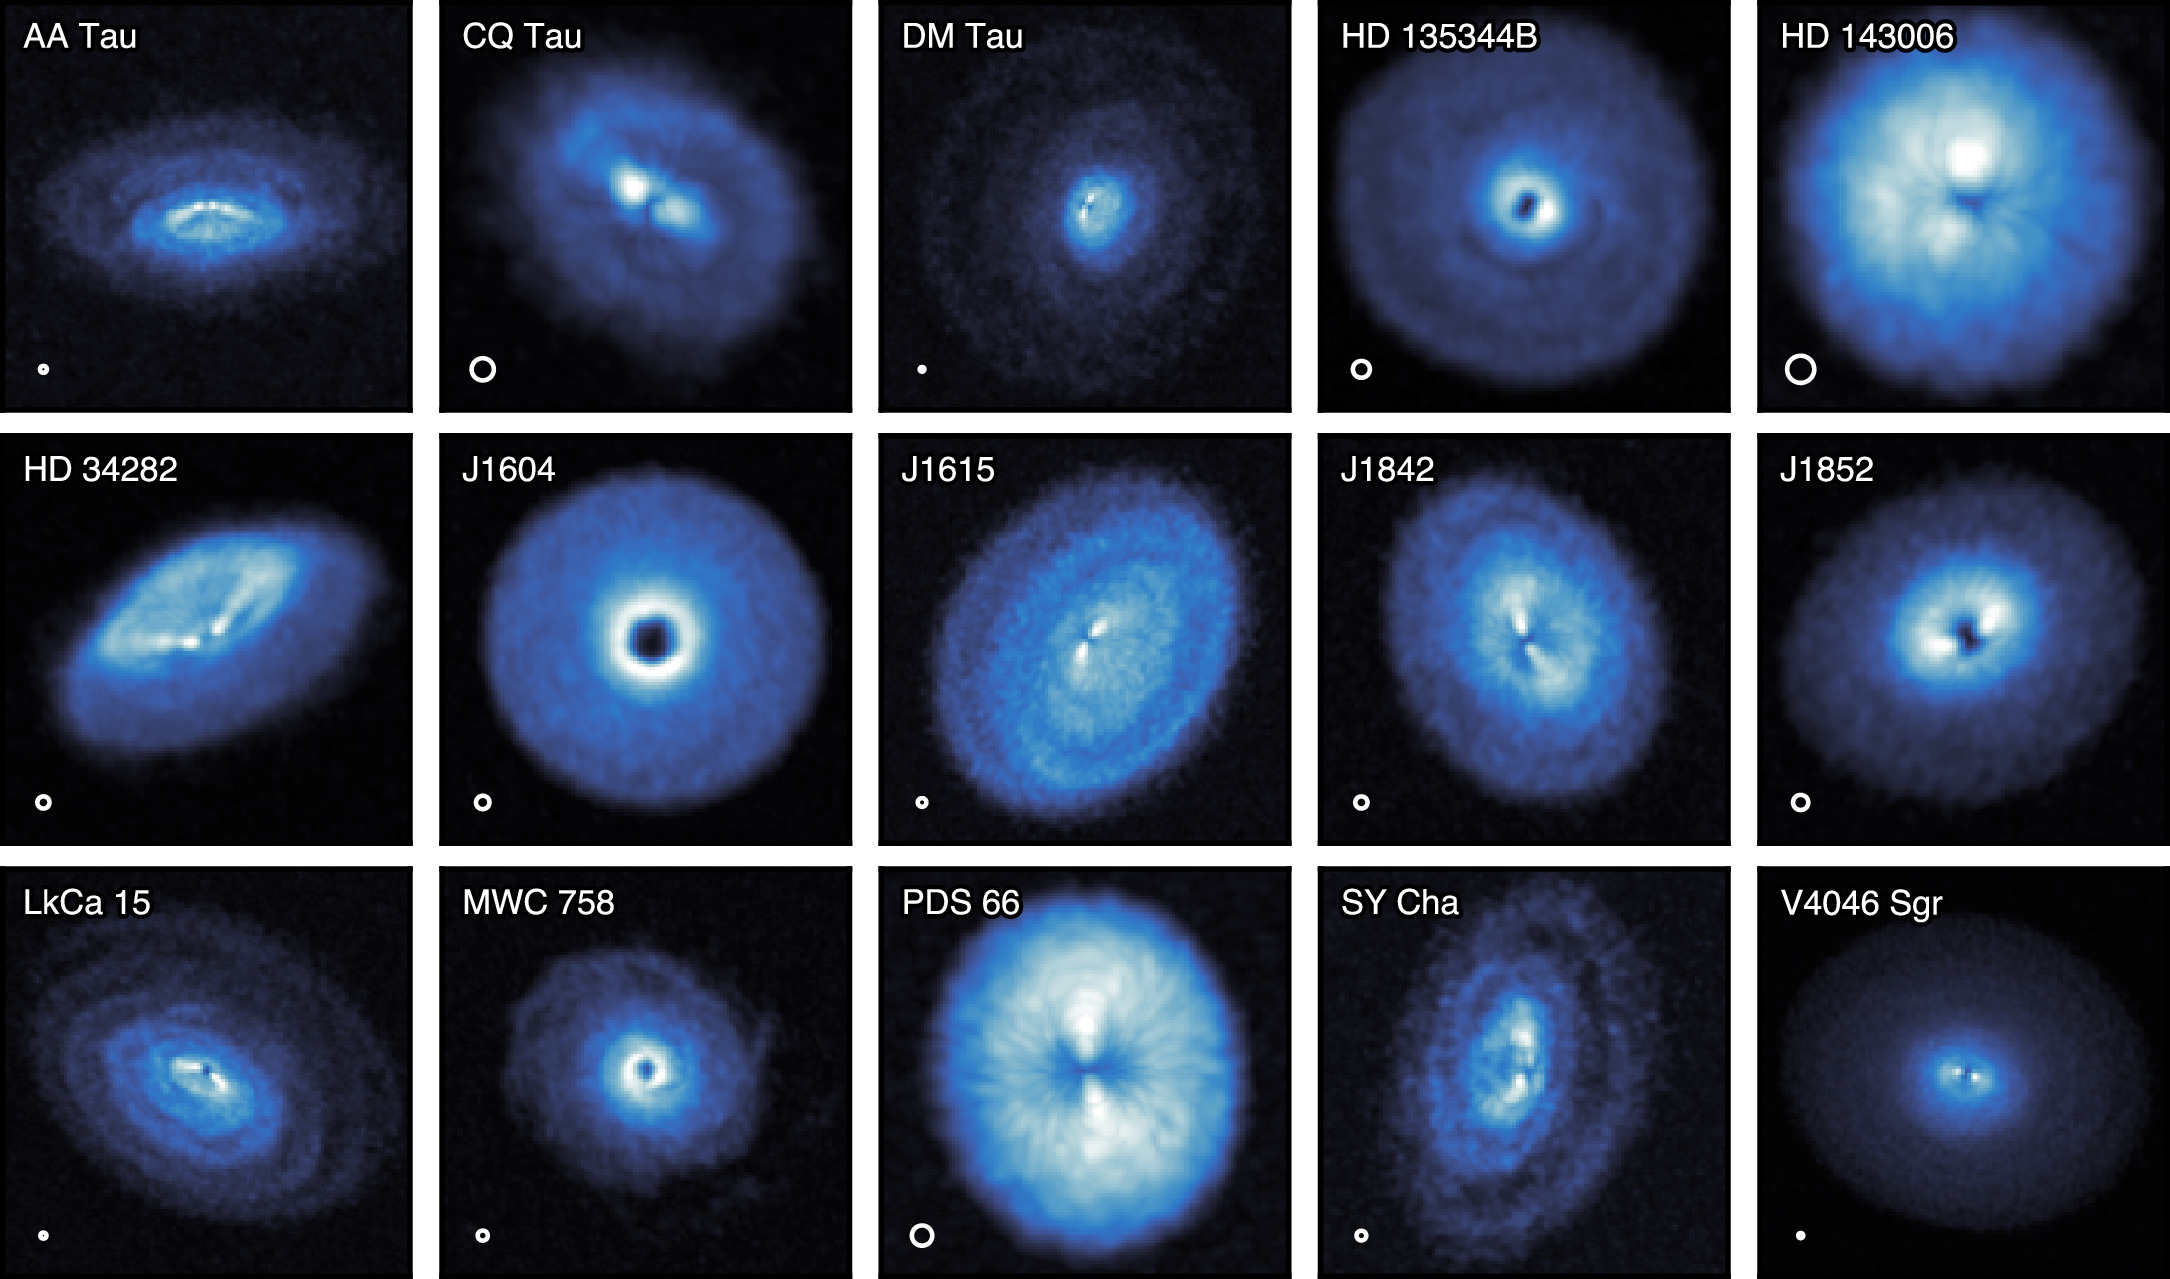
The full exoALMA sample. All 15 disks show evidence of substructure in their gas emission. [Teague et al. 2025]
The first science results from exoALMA have started to reveal that the planet formation process is highly dynamical — precise kinematic measurements uncover dynamical perturbations within protoplanetary disks across their sample. These perturbations point to the impacts protoplanets have on disk kinematics and mass distributions as they continue to form, and the high resolution of ALMA observations unlocks the inner workings of protoplanetary disks.
Looking forward, Teague emphasized that the future is broad for planet formation science. The upcoming Wideband Sensitivity Upgrade on ALMA will enable even more detailed maps of protoplanetary disks, unlocking the mysteries of planet formation while it happens.
Press Conference: The Science of Stellar Remnants (Briefing video) (by Lucas Brown)
In AAS 248’s very first press conference session, we heard from a variety of scientists and research teams on all sorts of stellar remnants: white dwarfs, supernovae, pulsars, and beyond. Basically, if it came from a dying star, it was fair game for this session.
Boron and Beryllium as Unlikely Probes of Extrasolar Planets
First up was Ben Zuckerman (University of California, Los Angeles), who updated us on ongoing research into the presence of boron and beryllium in certain white dwarf systems. For some context, there exist many white dwarf systems in which a companion object — sometimes a planet — can have its material accreted onto the surface of the white dwarf due to tidal disruption during close approaches in its orbit. This deposition of material can then be detected via spectral signatures in observations of the white dwarf.
In 2021, evidence was first presented for two white dwarfs being “polluted” with trace amounts of beryllium, which is a particularly rare element, cosmically speaking. This raises the question of how so much beryllium ended up in these systems. In the hunt for answers, however, another mystery has emerged: missing boron. As Zuckerman went on to describe, boron was also recently discovered in some of these white dwarf systems, but at an abundance roughly equal to that of the beryllium. This is despite boron being about a hundred times more common in the universe, further muddying the waters of what exactly is causing such a strange pattern of heavy metals in these systems. Work remains ongoing to find a physical model that can reconcile these observations.
White Dwarf Kicks via Episodic Mass Ejection from Red Giant Stars
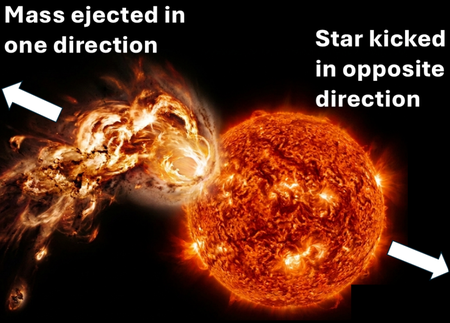
In the model explored by Jim Fuller and collaborators, repeated mass-ejection events can cause red giant stars to be “kicked” up to a relatively high velocity before they collapse to form white dwarfs, explaining the high velocities many white dwarfs are observed to have. [Jim Fuller]
Additionally, this random ejection process predicts that red giants in binary systems will experience a sort of “random walk” in their orbital parameters, not just their overall velocity. This can lead to the complete dissociation of binaries, or to the direct collision of a red giant with its companion — leading to predictions about how many widely spaced white dwarf binary systems should exist. | Press release
Probing Intrabinary Material in a New Spider Millisecond Pulsar
Rebecca Kyer (Michigan State University) gave an update on research into so-called “spider” millisecond pulsars. These rapidly rotating neutron stars are a sub-class of pulsar characterized by their very high spin rate and the presence of a companion from which the pulsar is accreting material. Such systems are further sub-classified as either “Black Widows,” which have very low-mass companions (~3% solar mass), “Redbacks,” which have larger companions at ~10-80% solar mass, and “Huntsmans,” which have more massive red-giant companions. These Huntsman pulsars are the newest category, with only two known cases — until now!
Kyer presented evidence collected by their team that may indicate the discovery of a third Huntsman pulsar. The evidence involves radial velocity measurements of the companion star, which shows an orbital period of 3.64 days and variable H-alpha emission. In these systems, the radio emission typically associated with the pulsar can be blocked from our view for unpredictable amounts of time due to clouds of hot gas and dust that emerges from the complex interaction between the pulsar and red giant winds. Despite this, Kyer hopes that with enough targeted observations with the Green Bank Telescope, a radio signal will eventually be detected, confirming the pulsar’s presence.
Image of Messier 83 in both X-ray and optical light. Prominent X-ray sources can be seen as small colorful blobs strewn throughout the galaxy. Some of these X-ray sources are supernova remnants, a subset of which have recently been found to show variability in their brightness. [X-ray: NASA/CXC/SAO; Optical: NASA/ESA/AURA/STScI, Hubble Heritage Team, W. Blair (STScI/Johns Hopkins University) and R. O’Connell (University of Virginia); Image Processing: NASA/CXC/SAO/A. Jubett, L. Frattare and P. Edmonds]
Finally, we heard from a team of three researchers — Andrea Prestwich (Catholic University of America / NASA Goddard SFC), Roy Kilgard (Wesleyan University), and Zoe Hoiland (Vassar College) — on an unexpected supernova discovery. Traditionally, supernovae are modeled as having a relatively constant or slightly decreasing luminosity, at least after their initial explosion. As the stellar material is blasted away from the progenitor’s core, it interacts with the surrounding interstellar medium and a blob of hot, shocked gas is left over. This blob will eventually cool and dim, but often over a long time period, leading to the aforementioned prediction of constant or slightly decreasing brightness.
However, in 14-year Chandra observations of a supernova remnant in Messier 83, Prestwich and her collaborators actually found significant X-ray variability, with the remnant occasionally even increasing in brightness. In a follow-up study, it was found that supernova remnants in Messier 51 likewise show this up-and-down variability. In contrast, an analysis of remnants in Messier 101 showed zero variable remnants. Notably, the former two galaxies are very actively star-forming, while the latter is not. Some possible theoretical models to explain this variability include the possibility of stellar material falling back on the compact object leftover by the supernova, creating an accretion disk that can generate variable emission. Alternatively, it has been proposed that there could be a neighboring star to the remnant object, forming an accreting X-ray binary system that could also induce variability. | Press release
Plenary Lecture: Sanmi (Oluwasanmi) Koyejo, The Measurement Gap: What AI Can Get Wrong and Why Astronomers Are the Fix (by Lexi Gault)
Sanmi (Oluwasanmi) Koyejo, a professor of computer science at Stanford University, focused this plenary talk on the limitations of AI as it becomes more integrated with science and how astronomers can help solve these problems. Koyejo began by addressing the question of why an AI researcher is talking to astronomers. His research explores how to set AI standards and how to best assess the performance of an AI model, which becomes particularly important when these models are used to do science.
Evaluating the performance of an AI model relies on benchmarks, a fixed set of questions with known answers that are used to score the AI. These benchmarks are simple, reproducible, and comparable, but passing a benchmark does not equate to getting a meaningful scientific result. Benchmarks assume cheap checks, fast feedback, and fixed questions, but science is none of those things; answering astronomy questions relies on telescope time, and ground truth cannot be found quickly.
Much like telescopes, AI benchmarks are measuring instruments with noise that can compound. If you run an AI model many times, the goal is often convergence on an agreed-upon answer, but getting to an agreed-upon answer does not mean that the answer is correct. Koyejo’s recent research found that AI models more often agreed with each other than they did with the actual truth. This is made worse when AI is used to evaluate itself. For example, Koyejo notes the rising number of academic paper submissions due to AI-written papers greatly exceeds the capacity of human reviewers. If AI tools are used to evaluate AI-generated paper submissions, the AI will tend to favor AI-written materials, ignoring the actual scientific merit. Making evaluation of AI an AI problem compounds its failures, straying further from a correct answer.
This is where astronomers come in. Having the expert knowledge of what “correct” looks like, being able to judge which errors matter, access to expensive ground truth (telescope time), and a culture of blind analysis (not knowing exactly what the answer should be), astronomers are well equipped to build standards for AI evaluation. We can define what good AI is for astronomy and use our expertise to help build the standards. Koyejo left the audience with the charge to engage with AI (engagement does not mean endorsement), so that astronomers can help set the standards for appropriate AI use in science.
Read Astrobites’s interview with Sanmi Koyejo.
Press Conference: Variable, Windy, and Disruptive: The Behavior of Supermassive Black Holes (Briefing video) (by Niloofar Sharei)
This press conference focused on what supermassive black holes do to the world around them, from relativistic jets of the most famous black hole, to the multi-phase winds launched from active galactic nuclei, to temperature-shifting coronae, and even the radio burps that are produced years after a black hole tears apart stars.
Chandra Tracks the Evolving Jet from Messier 87’s Black Hole:
Camille Poitras (Laval University) presented the largest Chandra X-ray movie of jet evolution in the famous supermassive black hole Messier 87 (M87). M87 has been studied across the electromagnetic spectrum, but X-ray observations of its jet have always suffered from blur because high-energy photons are hard to focus. Using improved Chandra calibrations and deconvolution techniques, the team produced a 13-year X-ray movie of M87’s jet from 2012 to 2025. Tracking a bright knot within the jet, Poitras’s team saw it split into two components in 2023, with one component moving at an apparent five times the speed of light (which is a known illusion called superluminal motion). That allowed the team to look into where and how the particles are being accelerated to extreme energies along the jet. | Press release
Watching a Black Hole Wind Grow: Chandra and Hubble Reveal the Early Stages of Galaxy
Multiwavelength images of two nearby quasars show that the hot X-ray (red) and warm ionized (green) gas are far more extended in the bottom system. Click to enlarge. [Anna Trindade Falcao]
The three types of wind launched from an accreting supermassive black hole. Click to enlarge. [Xin Xiang]
Xin Xiang (University of Michigan) presented the most detailed X-ray portrait of the winds flowing out of NGC 4151, an active galaxy roughly 16 million light-years away with a 30-million-solar-mass black hole. Every major X-ray observatory has observed this galaxy before, but earlier instruments could not separate its multiple wind components. With the high-resolution X-Ray Imaging and Spectroscopy Mission (XRISM) spectrometer, Xiang resolved three wind populations by velocity: warm absorbers (100–1,000 km/s), very fast outflows (1,000–10,000 km/s), and ultra-fast outflows (over 10,000 km/s). Across 14 XRISM observations over a year, they found that the fast winds turn on three hours after each bright X-ray flare, matching the predicted timescale for magnetically driven wind. | Press release
NuSTAR Reveals a Significantly Variable Active Galactic Nucleus Corona
Xiurui Zhao (Caltech) presented the first observational evidence of significant temperature variation in the corona of an AGN. The corona produces about 90% of all X-ray photons from an AGN, but its temperature can only be measured with X-ray missions sensitive to high-energy spectral curvature like NASA’s NuSTAR. They compared NuSTAR’s observations across multiple years and found that despite having the same luminosity in 2015 and 2024, the 2024 corona was significantly cooler than the 2015 corona. In follow-up observations in 2025, it was back at its earlier temperature. This is the first clear observation of coronal temperature variability in an AGN. | Press release
New Surprises from Radio Observations of Tidal Disruption Event Outflows
Kate Alexander (University of Arizona) presented new radio observations of tidal disruption events (TDEs). TDEs occur roughly once every 100,000 years in a given galaxy. It happens when a star drifts too close to the black hole, is stretched and squeezed into a long stream of debris (a process astronomers call spaghettification) and some of that debris falls onto the black hole while the rest is thrown outward and lights up in radio. Alexander and her team used six years of Very Large Array monitoring of several dozen nearby TDEs. They found that many TDEs unexpectedly turn on in the radio years after the original event, even long after their optical light has faded. Their team combined radio data with X-ray and optical accretion-rate measurements and found that these late-time radio flares appear when the black hole is eating either very quickly or very slowly, but not at moderate rates! This pattern matched what is seen in stellar-mass black holes and this suggests that accretion physics may operate similarly across many orders of magnitude in black hole mass. | Press release
Plenary Lecture: Mario Jurić, Early Results from the Rubin Observatory: Mapping the Solar System and Beyond (by Kerry Hensley)
Mario Jurić (University of Washington; PI of the University of Washington Rubin operations element) began by remarking on how our collective concept of what an astronomer is has been transformed over the past 25 years. While a Google image search for “astronomer” yields an array of people pointing small telescopes at the night sky, today’s version of professional astronomy looks quite different: huge telescopes with enormous cameras covering vast swaths of the sky, with analysis aided by software and data deposited in massive databases.
This rapid transition was first spurred by enterprises like the Sloan Digital Sky Survey, which collected 20 terabytes of raw data from 1.2 billion observations. Now, digital sky surveys are common, and they’re becoming ever larger. The next massive digital sky survey will be the Legacy Survey of Space and Time from the NSF–DOE Vera C. Rubin Observatory — an observatory that can “download the universe” and is poised to transform our understanding of everything from asteroids to dark energy.
Rubin released its first images on 23 June 2025, and among these stunning images is a broad view that contains thousands of galaxies in the Virgo cluster, a golden tangle of four colliding galaxies, a nearby galaxy cluster, a distant galaxy cluster, and a handful of nearby spiral galaxies bursting with star formation. As fantastic as this image is, Jurić emphasized that it’s just one still image in a movie: as Rubin returns to the same fields of view time and time again, it’ll spot things that change brightness (like variable stars and transients) and things that move (like asteroids).
Jurić highlighted four areas in which Rubin has already contributed greatly, focusing on discoveries within our solar system:
-
- Asteroid variability: Rubin has already collected hundreds of thousands of observations of asteroids, resulting in the discovery of extremely fast rotators like 2025 MN45, which must have an extremely high tensile strength not to fly apart.
- Observations of interstellar object 3I/ATLAS: During the observatory’s commissioning survey, the Rubin team realized that they had observed 3I/ATLAS before it was discovered — but in observations that were technically under embargo. Recognizing the high impact of the data, the team found a way to share their findings, leading the 150-person collaboration to write a paper on their findings in a mere three days.
- High-precision asteroid photometry: While analyzing the commissioning data, the Rubin team discovered systematic offsets in the positions of asteroids — but no other types of objects. They found that this effect varied across the sky and was worse in the south. They eventually discovered that because most asteroids are observed from the north, that catalogs of asteroid orbits are systematically biased at a level of 20-40 milliarcseconds. Luckily, Rubin will provide the much-needed southerly data necessary to clean up these catalogs within about a year.
- Outer solar system studies: Researchers discovered 380 new trans-Neptunian objects in Rubin’s commissioning data. (Compare that to just 5,000 known trans-Neptunian objects in total!) In the time since the commissioning data were collected, hundreds more candidate objects were discovered.
With such enormous data yields from Rubin, how do we efficiently turn data into science? Jurić outlined strategies for handling massive datasets using well-crafted data formats, computing tools, and AI. In particular, Jurić highlighted the Astronomical Catalog Inference Driver, or ACID, which he built in four weeks on his phone using Claude. The tool is comparable to “a product developed in >3 years by extremely capable human professionals” and can rapidly handle immense data tables, showing how AI can accelerate the development of tools to handle tomorrow’s datasets.
Read Astrobites’s interview with Mario Jurić.
Plenary Lecture: Esra Bulbul, Cosmology and Baryons Across Scales: Probing Halo Mass Function to Cosmic Filaments with eROSITA (by Lexi Gault)
Esra Bulbul (Max Planck Institute for Extraterrestrial Physics) began her plenary talk at the beginning of time — the Big Bang marked the start of the universe, and from there we attempt to constrain cosmological parameters in order to understand how the universe was born and how it has evolved. Bulbul notes that a lot of work has been done to constrain cosmology from the cosmic microwave background (CMB), and we must compare those early time measurements to those from later times to build a full picture. In cosmology, tensions have arisen between early-time and late-time probes. CMB measurements of the Hubble constant and S8, the “clumpiness” parameter of the universe, do not agree with late time probes that find that the universe is accelerating faster with smaller fluctuations than the CMB predictions. How do we work toward resolving this tension?
The extended ROentgen Survey with an Imaging Telescope Array (eROSITA) is a space telescope that has performed the first imaging all-sky survey in the medium X-ray range, seeking to map the large-scale structures of the universe to better constrain cosmological constants. eROSITA focuses on finding galaxy groups and clusters via the hot X-ray gas within and between them across the last 5-7 billion years of the universe. Since its launch in 2019, eROSITA has completed more than four full-sky surveys. Of the million X-ray sources detected by eROSITA, only 12,247 (1%) are galaxy clusters and groups.
From the observed X-ray emission from the galaxy clusters and groups, the eROSITA team has been able to measure the temperature of the intercluster medium within the sample. Working with weak gravitational lensing surveys, they have been able to measure the masses of the newly discovered clusters and groups. These measurements show that eROSITA has detected sources across three orders of magnitude in mass, reaching from the galaxy level to large-scale clusters.
The galaxy cluster and group observations allow them to constrain a few cosmological parameters including S8 (density fluctuations), Ωm (matter density), and w0 (dark energy). From the impressive eROSITA data, Bulbul showed that they could constrain S8 and Ωm to five times better precision than ever before! These late-time results are fully consistent with what has been measured from the early-time CMB measurements. Additionally, the dark energy measurements agree with what has been measured thus far from the Dark Energy Spectroscopic Instrument survey.
Bulbul then switched us from the exciting cosmological results to those regarding baryon detection. A striking result from eROSITA was the detection of hot gas well beyond what is typically considered the gravitational extent of a galaxy cluster — reaching out to 16 million light-years, often larger than the galaxy cluster itself. This underscores the importance of X-ray surveys in detecting the very extended gas encapsulating the largest-scale structures of the universe.
Looking forward, Bulbul discussed the future work planned for eROSITA. Transitioning now to working with the deepest data of the survey, the team expects to find about 40,000 galaxy clusters with about half of those being used for cosmology. They anticipate obtaining even higher precision on cosmological parameter measurements, comparable to that obtained from CMB observations. The work of eROSITA is revolutionizing cosmology at later times in the universe, and the future is exciting.
Read Astrobites’s interview with Esra Bulbul.
The post AAS 248: Day 1 appeared first on AAS Nova.
]]>
AAS 248 in Pasadena, CA, is underway! Here are some education, outreach, and related sessions that you might want to check out at the meeting.
The post AAS 248: Welcome! appeared first on AAS Nova.
]]>This week, AAS Nova and Astrobites are attending the American Astronomical Society (AAS) summer meeting in Pasadena, CA.
AAS Nova Editors Kerry Hensley and Susanna Kohler and AAS Media Fellow Lexi Gault will join Astrobites Media Intern Niloofar Sharei and Astrobiter Lucas Brown to live-blog the meeting for all those who aren’t attending or can’t make it to all the sessions they’d like. We plan to cover all of the plenaries and press conferences, so follow along here on aasnova.org or on astrobites.org! You can also follow Astrobites on Bluesky at astrobites.bsky.social for more meeting content.
Where can you find us during the meeting? We’ll be at the Astrobites booth in the Exhibit Hall all week — stop by and say hello! You can also find Susanna, Kerry, and Lexi at the press conferences in Ballroom H Monday and Tuesday at 10:15 am and 2:15 pm PDT and Wednesday at 10:15 am PDT. AAS press conferences are open to all attendees, and they can also be found on the AAS Press Office YouTube channel for anyone not attending the meeting.
In addition to the usual press conferences, the AAS Press team has collaborated with Los Angeles’s own Griffith Observatory to arrange a special live recording of the Observatory’s acclaimed astronomy program, All Space Considered. This event is open to all AAS 248 attendees and will take place Wednesday, 17 June, at 2:15 pm PDT in Ballroom H. We hope to see you there!
Finally, you can read the currently published AAS 248 keynote speaker interviews, which were conducted by Astrobiters Niloofar Sharei, Amaya Sinha, Sowkhya Shanbhog, Katya Gozman, and Natalie Price. Be sure to check back all week as the remainder are released!
Education, Outreach, and More at AAS 248
AAS 248 features a broad range of sessions related to education and outreach. For a comprehensive and curated list of sessions, check out this post from AAS Director of Education Programs Tom Rice. Here are a few highlights (all times PDT; must be logged in to aas.org for links to work correctly); note that times and locations are subject to change:
On Monday, kick off the meeting with the Astronomy Education, Outreach, and Night-Sky Stewardship iPoster session, 9:00–10:00 am in Exhibit Hall A. Wrap up your day by attending the Reception for Astronomy Educators from 6:30 to 8:00 pm in Room 107.
Tuesday morning, hear about pressing issues relating to climate change at the Special Session What Astronomers Can Do About Climate Change: Infrastructure, Education, and Communication, from 10:00 to 11:30 am in Ballroom G. That afternoon from 2:00 to 3:30 pm, tune in to the Pathways into Modern Space Science oral session in Ballroom C.
On Wednesday, learn how to Make Your Voice Heard as an Advocate for Science in a Special Session co-sponsored by the AAS and the American Institute of Physics from 10:00 to 11:30 am in Ballroom G. Throughout the week, check in with the League of Women Voters in the Exhibit Hall — they’ll be conducting a voter registration drive during the meeting.
Thursday, the final day of the meeting, closes with a look at a local institution in the 40 Years of Community Engagement at IPAC: Lessons Learned Special Session from 2:00 to 3:30 pm in Ballroom F.
If you’re sticking around Pasadena after the meeting, consider heading to Griffith Observatory for their open house on Saturday, 20 June, 2:00–10:00 pm, which will showcase accessible observing techniques like tactile images, 3D models, live camera feeds, and sonification.
And remember, you can find a longer curated list of education-related sessions here!
The post AAS 248: Welcome! appeared first on AAS Nova.
]]>
AAS Publishing will be attending the upcoming AAS meeting in Pasadena. Here's where you can find the publishing team during the conference.
The post AAS Publishing at AAS 248 in Pasadena appeared first on AAS Nova.
]]>The 248th meeting of the American Astronomical Society, to be held in Pasadena, CA, 14–18 June, is nearly here. The AAS Publishing team looks forward to connecting with meeting attendees, and you can find representatives from the publishing and journals’ editorial staff at the AAS booth in the Exhibit Hall in the Pasadena Convention Center. AAS Director of Scholarly Publishing Kerry Kroffe will be available at the AAS Publishing booth, so be sure to stop by to say hello, chat about the journals, and pick up some swag!
AAS Nova Editors Kerry Hensley and Susanna Kohler, AAS Media Fellow Lexi Gault, Astrobites Media Intern Niloofar Sharei, and the rest of the Astrobites team will also be available periodically at the Astrobites booth in the Exhibit Hall. We look forward to seeing you there!
AAS Peer Review Workshop
This workshop led by the scientific editors of the AAS journals will teach participants about the peer review process, give them the opportunity to see both poor and exemplary referee reports, and provide them with hands-on experience in writing a peer review report. Participants will receive a graduation certificate. While signups for the AAS 248 peer review workshop are closed, more workshops are planned for future AAS meetings, so keep an eye out for more information about upcoming opportunities!
Open Science, Data, and AI in Astronomy: Sessions to Look for at AAS 248
Note: The links in this section take you to the corresponding entries in the AAS 248 block schedule. You must be logged in for the links to work correctly; otherwise, they will take you to the main block schedule page. Note that times and locations are subject to change.
The upcoming AAS meeting has a number of sessions, workshops, and lectures for those interested in open-source tools, data management strategies, and AI’s role in astronomy. Sunday, 14 June, will feature a trio of data-related workshops. (Note that these workshops require an additional fee and can be added to your registration.) The “Euclid Data in the Cloud: Access, Analysis, and Science Opportunities” workshop (10:00 am – 11:30 pm PDT in Room 101) will introduce participants to accessing and analyzing data from Euclid, a European Space Agency mission with NASA participation. The overlapping workshop “High Energy Science Analysis with HEASARC Services” (10:00 am – 12:00 pm PDT in Room 102), organized by the High Energy Astrophysics Science Archive Research Center (HEASARC), is targeted toward early-career scientists and anyone curious about HEASARC services. The workshop will begin with an overview of available services before transitioning into hands-on experimentation with these tools. Finally, “An Introduction to Fornax: Scalable Data and Compute for Scientific Analysis” (2:00–4:00 pm PDT in Room 101) will introduce attendees to NASA’s new Astrophysics Science Platform through live demonstrations and guided exercises.
Of particular interest regarding AI in astronomy is Monday morning’s plenary lecture from Sanmi (Oluwasanmi) Koyejo titled “The Measurement Gap: What AI Can Get Wrong and Why Astronomers Are the Fix.” This session will take place from 11:40 am to 12:30 pm PDT in Ballroom DE.
The “AI-Driven Science in the Survey Era” Special Session will take place on Tuesday, 16 June, from 2:00 pm to 3:30 pm in Ballroom F. This session will highlight recent breakthroughs in a broad range of astronomical sub-fields that have greatly benefited from the use of AI and machine-learning techniques. Also on Tuesday, check out recent work on imaging and data-handling methods at the “Observational Imaging Methods and Data Pipelines” iPoster session from 5:00 pm to 6:00 pm in the Exhibit Hall.
The post AAS Publishing at AAS 248 in Pasadena appeared first on AAS Nova.
]]>
A recent study presents the first strong evidence of an old, low-mass hypervelocity star flung from the galactic center.
The post Shot from the Heart of the Milky Way: Discovery of an Old Hypervelocity Star appeared first on AAS Nova.
]]>Zooming through the galaxy faster than they should, hypervelocity stars are a curious population of stars whose origins are often difficult to determine. A recent study presents the first evidence of an old, low-mass hypervelocity star launched from the Milky Way’s center, providing clues into this elusive set of fast-moving stars.
Flinging Fast Stars
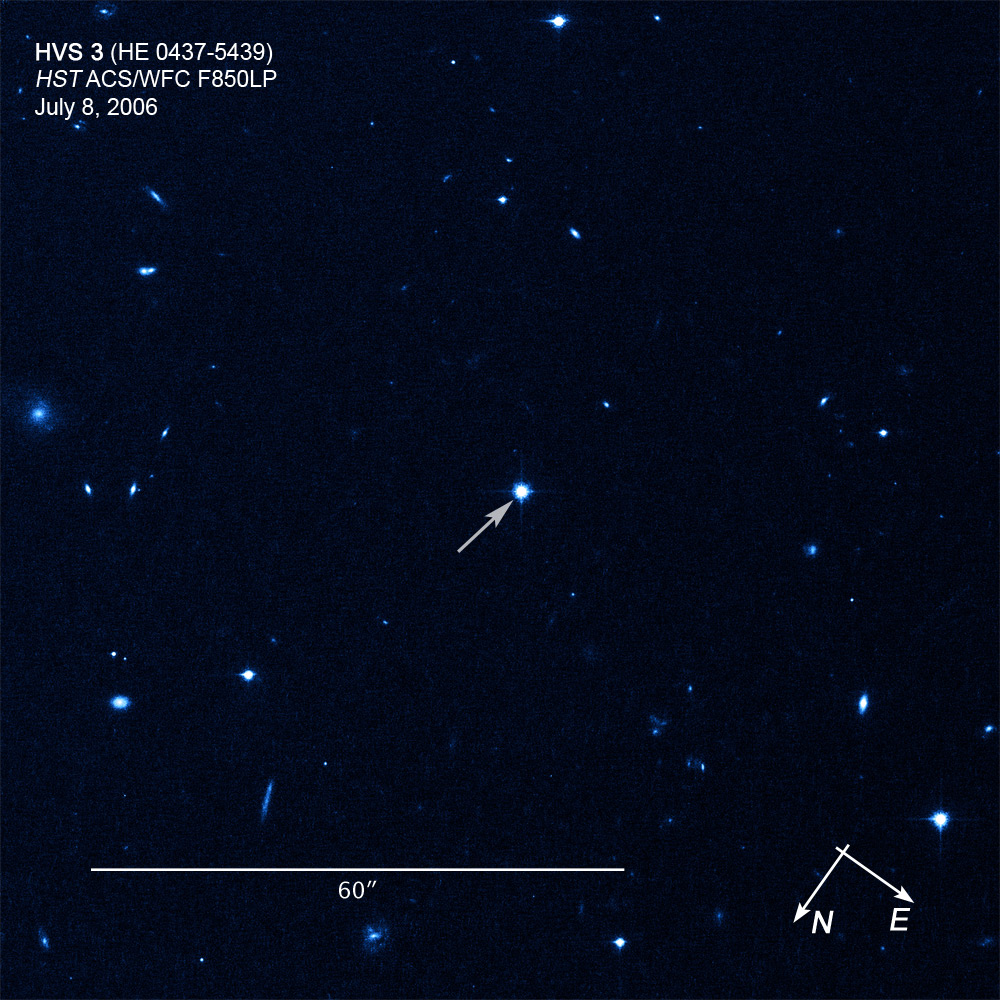
Image of the hypervelocity star HE 0437-5439 that was launched from the Milky Way’s core. [Illustration: NASA, ESA, and Z. Levay (STScI); Science: NASA, ESA, O. Gnedin (University of Michigan, Ann Arbor), and W. Brown (Harvard-Smithsonian Center for Astrophysics, Cambridge, Mass.)]
However, constraining a hypervelocity star’s origin to the galactic center is limited by uncertainties in distances and proper motions, muddling how well researchers have been able to trace their orbits backward. Among a number of candidate galactic center–origin hypervelocity stars, only one has been confidently identified as having been kicked from the galaxy’s center. Intriguingly, this hypervelocity star and most galactic center–origin candidates are young, massive stars — old, low-mass hypervelocity stars from the galactic center have yet to be identified.
What does this dearth of old, low-mass zooming stars mean? Either stars in the galactic center are preferentially young and massive, with fewer than expected old and small stars, or low-mass hypervelocity stars are missed by selection effects, challenging to detect in current surveys. Searching for hypervelocity stars with higher precision and sensitivity may allow astronomers to tease out this missing population and trace back more zooming stars to a Hills mechanism origin.
Discovering An Old Hypervelocity Star
Leveraging high-quality spectra from the Dark Energy Spectroscopic Instrument (DESI) survey and precise astrometry from Gaia, Shunhong Deng (University of Chinese Academy of Sciences; China West Normal University) and collaborators reported the discovery of the hypervelocity star DESI-HVS1. From the spectroscopic and astrometric analyses, the authors determined that DESI-HSV1 is a ~14-billion-year-old low-metallicity star with a mass about 80% that of the Sun’s, moving through the galaxy at 523 km/s.
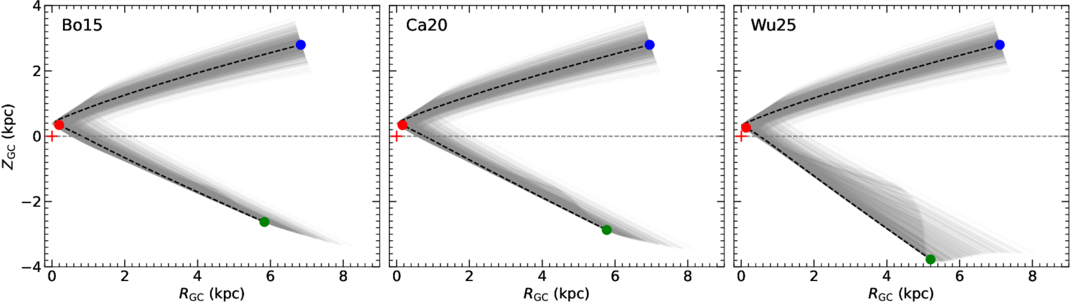
Backward-integrated orbits of DESI-HVS1 for three different galactic potential models. The blue, red, and green points show the star’s current position, closest approach to the galactic center, and position 50 million years ago, respectively. Click to enlarge. [Deng et al 2026]
While more refined galaxy models and comparison to other candidate galactic center–origin hypervelocity stars are necessary to fully confirm its origins, DESI-HVS1 provides the first compelling evidence for an old, low-mass hypervelocity star candidate consistent with a galactic center launch. This suggests that the observed lack of such stars is likely not a reflection of the Milky Way’s central stellar population, but rather a consequence of observational constraints making such small hypervelocity stars particularly difficult to detect. As large spectroscopic and astrometric surveys continue to advance, the sample of galactic-center hypervelocity star candidates will grow, enabling further exploration of the stellar environment and dynamical processes at the Milky Way’s core.
Citation
“An Old, Low-mass, Metal-poor Hypervelocity Star Candidate Consistent with Galactic Center Origin,” Shunhong Deng et al 2026 ApJL 1003 L9. doi:10.3847/2041-8213/ae6505
The post Shot from the Heart of the Milky Way: Discovery of an Old Hypervelocity Star appeared first on AAS Nova.
]]>
The gamma-ray burst GRB 250702B displayed several unusual behaviors that researchers are still finding ways to explain.
The post Could a White Dwarf–Black Hole Pair Explain the Longest Gamma-Ray Burst Ever Seen? appeared first on AAS Nova.
]]>What’s the story behind the longest gamma-ray burst ever observed? Researchers explore how repeated interactions between a white dwarf and an intermediate-mass black hole could explain GRB 250702B’s unusual properties.
An Exceptional Gamma-Ray Burst
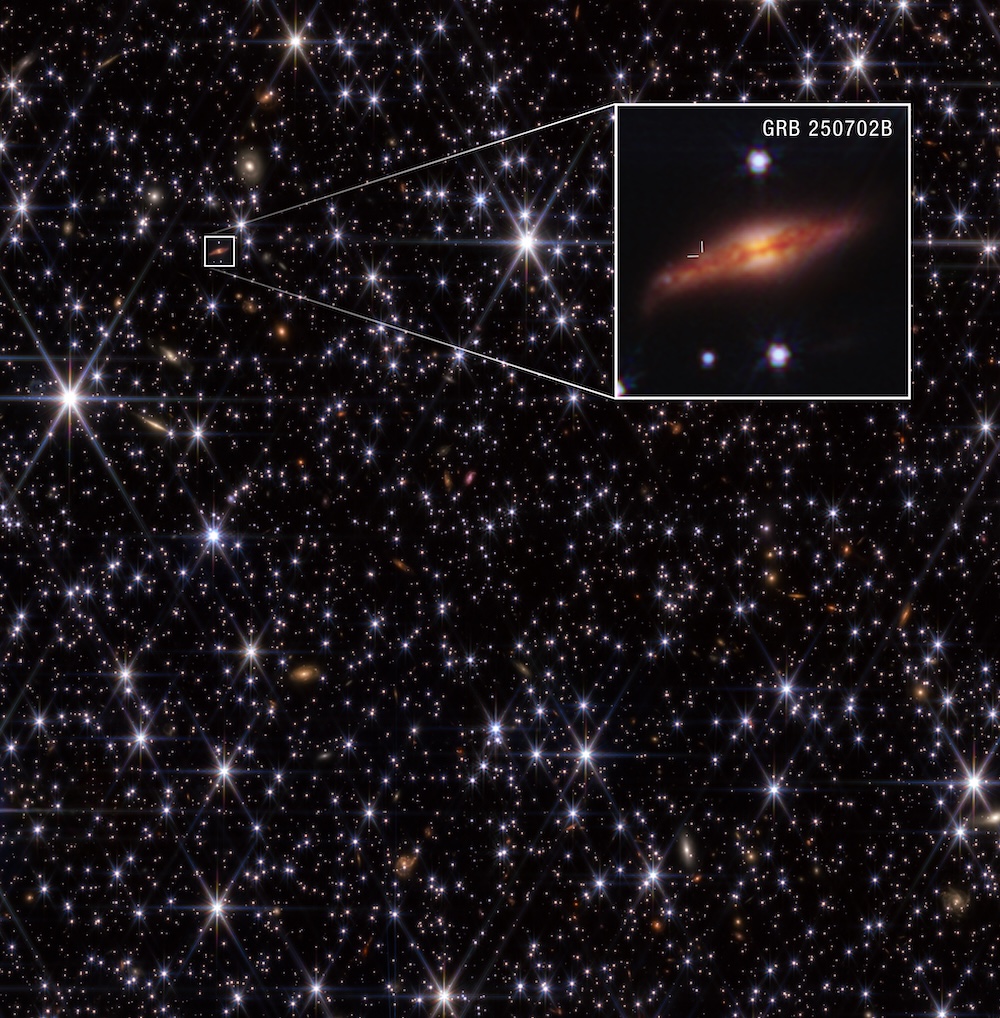
An image of GRB 250702B’s location within its host galaxy. [NASA, ESA, CSA, H. Sears (Rutgers). Image Processing: A. Pagan (STScI)]
These characteristics have been challenging to explain with typical models of long gamma-ray burst formation, such as collapsing massive stars, but researchers have developed numerous promising alternatives. In a new research article, astronomers have shown how GRB 250702B’s behavior might be explained by repeated close encounters between a white dwarf and an intermediate-mass black hole.
Eccentric Close Encounters
Yuri Sato (Tohoku University) and collaborators modeled the source of GRB 250702B as a white dwarf that has been captured into orbit around an intermediate-mass black hole. In their model, the white dwarf travels on an extremely eccentric orbit, drawing close to the black hole roughly once an hour. Each time the white dwarf ventures close, the black hole’s tidal forces strip away part of the star until, after about 40 such encounters, the white dwarf is completely destroyed.
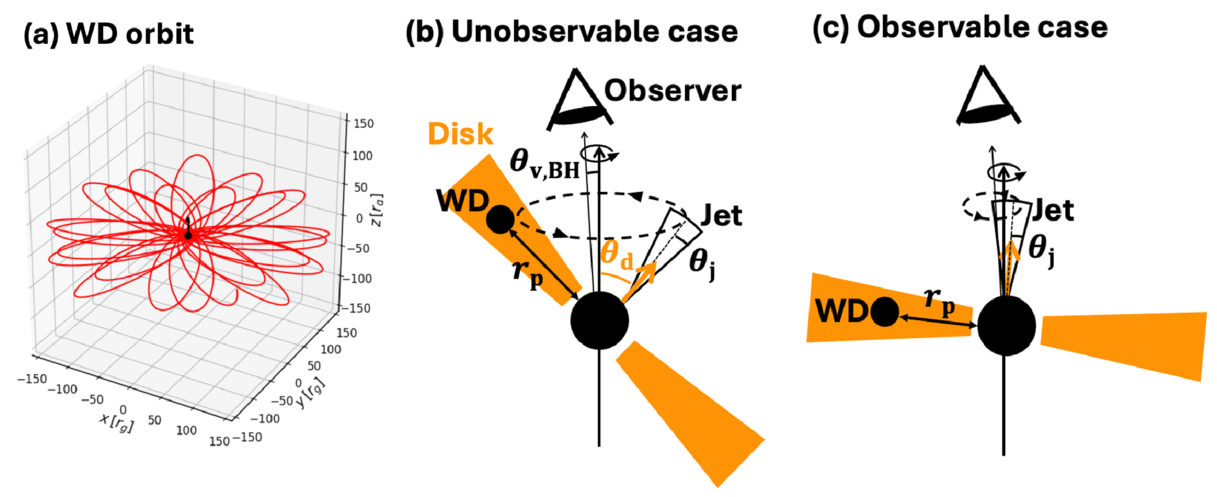
Schematics showing the orbit of the white dwarf (WD; left) and the geometries that produce observable and unobservable jets. Click to enlarge. [Sato et al. 2026]
Jet Precession and Model Predictions
The discrepancy can be resolved if the angle between the jet and the black hole’s spin axis precesses over time so that only some of the jets are pointed toward us. This can occur if the accretion disk is misaligned relative to the black hole’s spin. As an alternative, disk instabilities or other processes could keep all but a few of the expected jets from being launched.
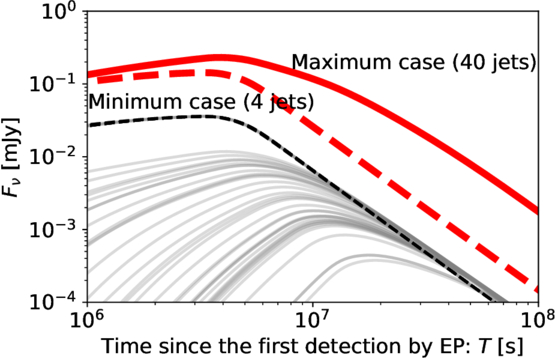
Predicted strength of the radio afterglow for the jet precession case (maximum case) and the case in which only four jets were launched due to disk instabilities or jet choking (minimum case). The x-axis shows the time since the burst was detected in X-rays by the Einstein Probe (EP). [Sato et al. 2026]
This work by Sato and collaborators demonstrates how the repeated partial tidal disruption of a white dwarf by an intermediate-mass black hole can match the properties of one of the most remarkable recent transient sources — one that has pushed astronomers to consider new ways of producing gamma-ray bursts.
Citation
“Successive Partial Disruptions with Orbital Precession in a White Dwarf–Black Hole System for Repeating GRB 250702B,” Yuri Sato et al 2026 ApJL 1003 L44. doi:10.3847/2041-8213/ae6a8f
The post Could a White Dwarf–Black Hole Pair Explain the Longest Gamma-Ray Burst Ever Seen? appeared first on AAS Nova.
]]>
Astrobites reports on an explanation for the appearance of Saturn's A ring.
The post Shining a Light on the Shadowy Movements in Saturn’s Rings appeared first on AAS Nova.
]]>Editor’s Note: Astrobites is a graduate-student-run organization that digests astrophysical literature for undergraduate students. As part of the partnership between the AAS and astrobites, we occasionally repost astrobites content here at AAS Nova. We hope you enjoy this post from astrobites; the original can be viewed at astrobites.org.
Title: Dynamics of Planetary Rings Under Thermal Forces
Authors: Wen-Han Zhou et al.
First Author’s Institution: The University of Tokyo
Status: Published in ApJL
If you ask anyone what their favourite planet is, the answer you’ll most likely hear is Saturn. Why? Why else than the beautiful and intricate ring system surrounding the gas giant. The other gas and ice giants in our solar system — Jupiter, Uranus, and Neptune — have ring systems themselves but none quite as striking as Saturn’s. Would it surprise you to learn that astronomers’ best models have not yet totally explained why Saturn’s rings look the way they do?
In contrast, it may not surprise you to hear that people have been trying to explain the rings for as long as we have seen them with telescopes. We now know that planetary rings are collections of relatively small particles (think micrometre up to metre sized), most likely having once been the material of a larger body that was disrupted either by collisions or tidal forces. This material, due to the gravity of its local planet, is sculpted into a flat disc where more subtle interactions then lead to substructure forming within the disc such as gaps and ringlets. Many of these substructures are explained by well-understood physics — for example gaps being carved by embedded moonlets or resonances sculpting ring edges — though there remain some outstanding problems in our understanding.
The authors of today’s article set their sights on the problematic inner edge of Saturn’s A ring (Figure 1). They describe some mechanisms — namely the collisions of micrometeoroids within the rings — by which a sharp ring edge can be maintained, but there exists a gap in the understanding of how such an edge can form in the first place. All hope is not lost, though, as today’s authors reintroduce a physical process they call the “eclipse–Yarkovsky” effect, which seems to explain these phenomena.

Figure 1: A horizontally sliced image of Saturn’s rings shows the rich substructure and gaps within the various rings. Saturn, which is not shown here, would be to the left of the image. The authors of today’s article are particularly concerned with the bright and sharp inner (left side) edges of the A and B rings. Click to enlarge. [NASA/JPL/Space Science Institute]
Billions of Rocket-Powered Bumper Cars
The idea behind this process revolves entirely around light. When sunlight hits a particle within a planetary ring, non-absorbed sunlight imparts a little “bump” onto a particle, ever so slightly altering its trajectory. At the same time, some of the sunlight is absorbed into the particle, which heats it up; light is soon re-emitted via thermal radiation, which, again, can slightly change the trajectory of these tiny particles. From a point on the surface of each ring particle (see rightmost side of Figure 2), the photons from this thermal radiation are all emitted in random directions; however, across the whole surface of the particle there is a net force! These tiny particles are spinning, and so the side just near “sunset” is hottest and emitting the most thermal photons. In this way, the pressure from the sunlight plus the thermal radiation of each particle imparts a net torque on the ring itself which changes the angular momentum of the ring.
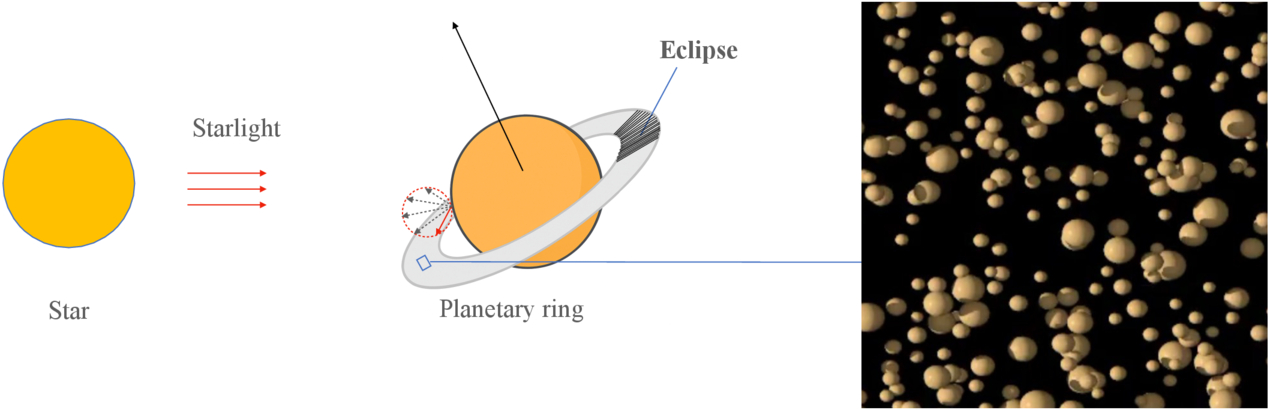
Figure 2: Starlight is the main source of light onto the particles that make up a planetary ring (right panel) though reflected light from the planet’s surface hits it too. This light “heats up” the ring and forms an asymmetry as the ring is eclipsed by the planet, which produces a net force. [Zhou et al. 2026]
After today’s authors detailed all of the math involved in this process (and there is a lot), they put it into practice to try to help explain Saturn’s curious rings. Including the eclipse–Yarkovsky effect together with other known effects that drive ring evolution allowed them to reproduce the optical depth profile (how thick the ring looks) of Saturn’s A ring better than ever before (notably the sharp inner edge in Figure 3). On top of this, the effect provides another avenue for moonlet formation in the outer edges of ring systems as the positive torque from the effect drives material out toward and away from the Roche limit.
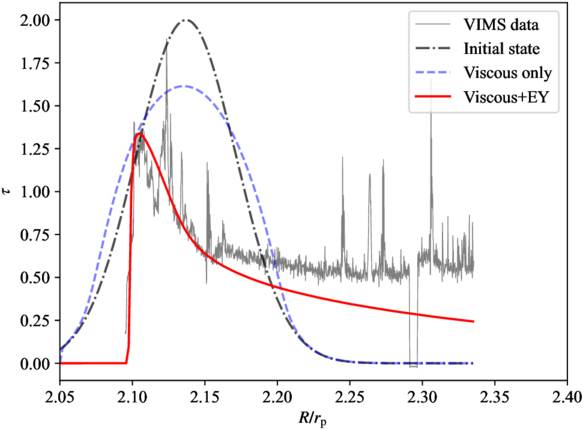
Figure 3: The authors try to explain the current structure of Saturn’s A ring by initialising it with a Gaussian profile of optical thickness versus radius (black dot-dashed line) and evolving it for 81 million years under different effects. When viscous effects are included (blue dashed line), the ring spreads out, but it’s only when the eclipse–Yarkovsky (EY) effect is included (red line) that the model closely matches the observed data (grey line). [Zhou et al. 2026]
Original astrobite edited by Wasi Naqvi.
About the author, Ryan White:
I am a first-year PhD student at Macquarie University in Australia, working mainly on binary/multiple systems with massive stars (Wolf–Rayets in particular!). Outside of study, I’m probably drinking coffee, baking, reading, or going for a run. You can also find me procrastinating on Bluesky @astroryan.bsky.social.
The post Shining a Light on the Shadowy Movements in Saturn’s Rings appeared first on AAS Nova.
]]>
Although 3I/ATLAS stayed clear of Earth during its passage through the solar system, astronomers repurposed a spacecraft around Mars for a good look as it flew by.
The post Courtside Seats on Mars appeared first on AAS Nova.
]]>When the third known object from the galactic space beyond our Sun barreled through the solar system last year, Earth was in a terrible spot to view its flyby. Thankfully, however, a spacecraft that was previously busy mapping Mars took advantage of much better positioning for a closer look.
Cheap Seats
Astronomers have now observed three interstellar objects as they’ve flown through the solar system: 1I/ʻOumuamua, which shocked astronomers in 2017; 2I/Borisov, which followed in 2019 and behaved almost identically to a solar system comet; and now 3I/ATLAS, which was found buzzing toward the Sun in July 2025. As soon as 3I/ATLAS was spotted, pretty much every telescope on the planet took a look. The data swiftly revealed much that intrigued astronomers: while 3I/ATLAS was behaving essentially like a standard comet, its chemistry was nothing like its solar system counterparts, and its coma and dust outflow were strangely shaped. Among other oddities, it seemed to counterintuitively have a dust tail that pointed toward the Sun.
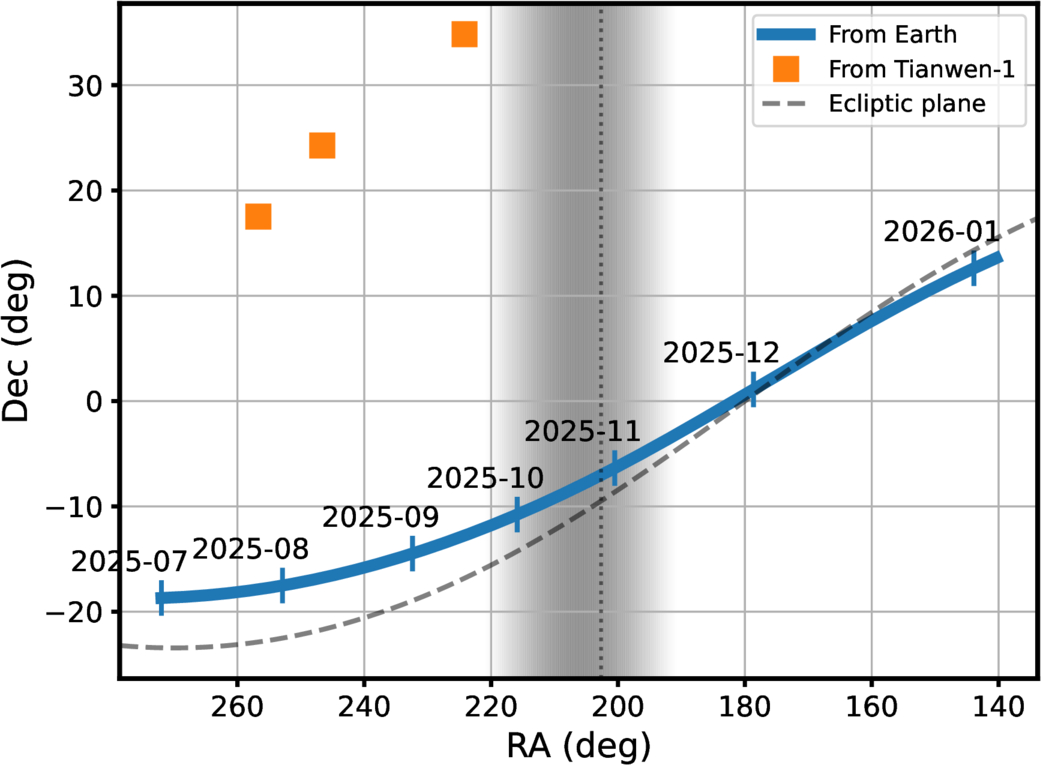
3I/ATLAS’s path across the sky as seen from Earth versus the clearer line of sight from Mars. The shaded region represents the times where the comet was too close to the Sun for viewing. [Xin Ren et al. 2026]
Better View from Mars
The Tianwen-1 spacecraft, which entered Martian orbit in early 2021 and has been diligently mapping the Red Planet ever since, has a high-resolution camera that’s normally pointed at the planet’s surface. By spinning the spacecraft around, a team of researchers led by Xin Ren (National Astronomical Observatories, Chinese Academy of Sciences) repurposed the camera to act as a small telescope when 3I/ATLAS flew by. In another cosmic coincidence, 3I/ATLAS happened to pass very near Mars last fall, and this close approach gave Tianwen-1 a great out-of-plane view of the coma. The orbiter managed to capture 57 images of 3I/ATLAS over three days last fall, representing China’s first-ever observations of an object from an asset in deep space.
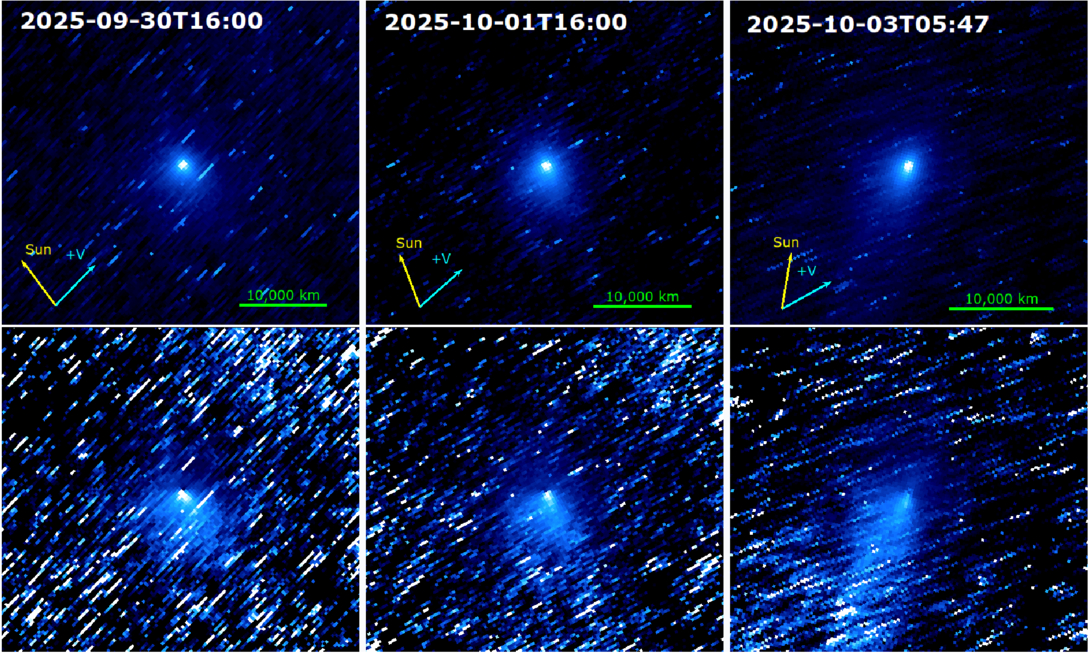
Stacked images of 3I/ATLAS from the Tianwen-1 orbiter across three epochs; the tail’s apparent shape shifts as the viewing geometry changes. Click to enlarge. [Xin Ren et al. 2026]
As new surveys begin to turn up interstellar interlopers more often, this improvised observation makes a tidy point: the spacecraft already scattered across the solar system can double as a fleet of opportunistic comet-watchers, each offering a view we simply can’t get from home.
Citation
“Interstellar Object 3I/ATLAS Observed from Mars by China’s Tianwen-1 Spacecraft,” Xin Ren et al 2026 ApJL 1003 L10. doi:10.3847/2041-8213/ae61b3
The post Courtside Seats on Mars appeared first on AAS Nova.
]]>
Stars gobbling up their close-in planets is likely common throughout the universe. Researchers explore the chemical signatures of these events and where they're most likely to be seen.
The post Now That’s Metal: How to Spot Stars That Have Swallowed Their Planets appeared first on AAS Nova.
]]>Planets that get too close to their host stars are liable to be engulfed and consumed. New research explores how to identify stars that have had a planetary snack.
It’s Snack Time
Being a planet that closely orbits its star is dangerous, and various dynamical processes can draw a planet inward past the point of no return. When a planet vanishes beneath the surface of its host, it eventually disintegrates within the star, its atoms mixing into the blazing stellar soup.
This outcome is likely extremely common across the universe, and researchers have begun to see evidence for it: stars that appear to have absorbed angular momentum from their planets, white dwarfs with uncanny metals in their spectra, and stars with chemical abundances that don’t match those of their siblings. Now, in a recent publication led by Kaitlyn Lane (Vanderbilt University), researchers seek to find observational signatures of planetary engulfment of rocky exoplanets by main-sequence stars.
Modeling Engulfment
Lane’s team focused on main-sequence stars in the range of 0.5 to 1.4 solar masses, using one-dimensional analytical models to determine which of these stars will most readily display signs of having engulfed a planet. They simulated the stars as they consumed either an Earth-like planet or a super-Earth with the same composition as Earth but 15 times its mass.
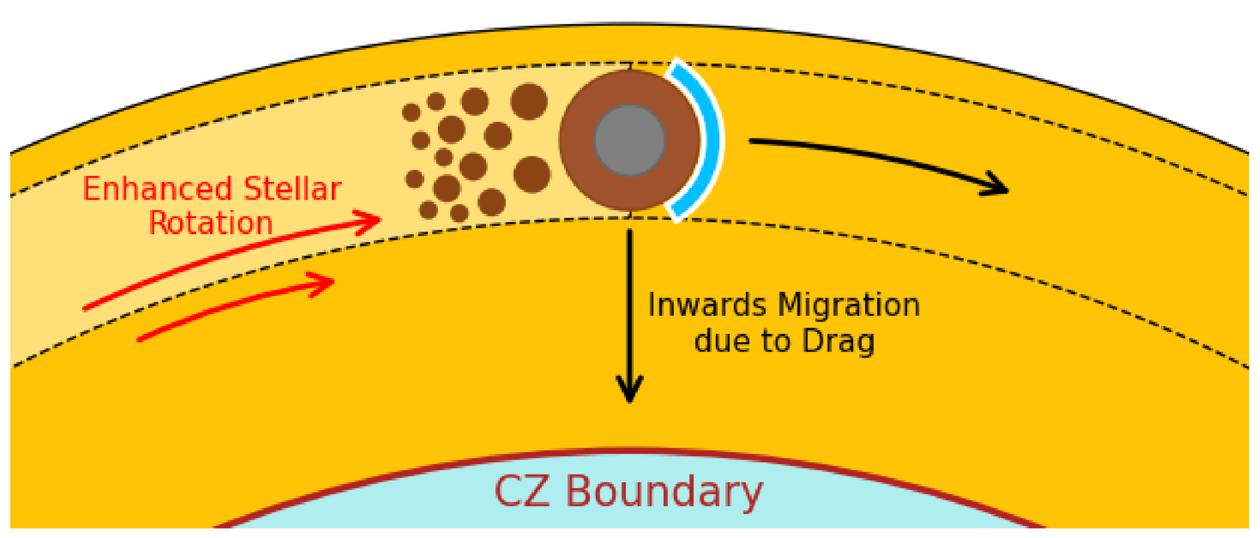
Diagram showing a planet being engulfed by its star and beginning to disintegrate before migrating inward. The boundary between the star’s outer convective zone (CZ) and inner radiative zone is shown. Click to enlarge. [Lane et al. 2026]
After that relatively lengthy phase, the process proceeds rapidly: as the planet inches deeper into its star, the drag forces grow stronger and the planet’s demise accelerates, with the planet disintegrating over the course of hours. In the last phase, the planet makes its final plunge and is destroyed in a half hour.
Signs of Planets Past
Lane’s team found that the planets tended to be destroyed fully within the outer convective layer of their stars, except in the case of the most massive stars studied here. For more massive stars, the outer convective zone is shallower than it is for the less massive stars, allowing a chunk of each planet to survive the passage through the convective zone to reach the radiative zone below.
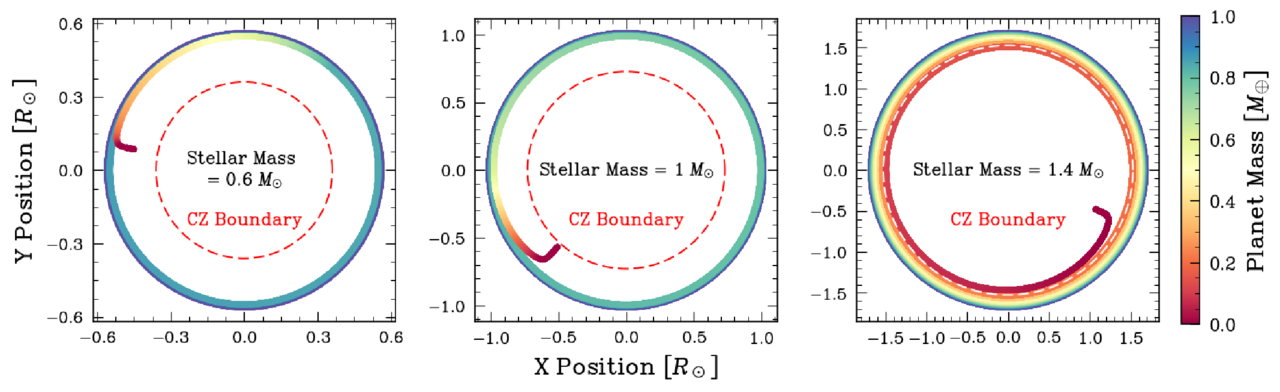
The trajectories of three example cases, showing how the planet loses mass as it spirals inward. In the 1.4-solar-mass case, part of the planet survives to reach the radiative zone, but the shallowness of the star’s convective zone means that the disintegrated planetary material is easier to observe. Click to enlarge. [Lane et al. 2026]
While the authors acknowledge that there’s more work to be done — they plan to investigate the impacts of planetary engulfment on stellar structure more closely, for example — this work represents an important foray into identifying targets for future studies of stars that have eaten their planets.
Citation
“Observable Metal Pollution in Main-Sequence Stars: Simulations of Rocky Planets Engulfed by Stars in the 0.5 to 1.4 M⊙ Range,” Kaitlyn T. Lane et al 2026 ApJ 1003 67. doi:10.3847/1538-4357/ae5b9a
The post Now That’s Metal: How to Spot Stars That Have Swallowed Their Planets appeared first on AAS Nova.
]]>
Astrobites reports on how researchers have taken advantage of the unique TOI-3884 system to directly probe a starspot with JWST.
The post The First Starspot Spectrum Revealed by JWST appeared first on AAS Nova.
]]>Editor’s Note: Astrobites is a graduate-student-run organization that digests astrophysical literature for undergraduate students. As part of the partnership between the AAS and astrobites, we occasionally repost astrobites content here at AAS Nova. We hope you enjoy this post from astrobites; the original can be viewed at astrobites.org.
Title: A Panchromatic JWST Spectrum of a Giant Starspot on the Fully Convective M Dwarf TOI-3884
Authors: C. A. Murray et al.
First Author’s Institution: University of Colorado Boulder
Status: Published in ApJ
We often picture stars as smooth, glowing spheres, as if they’ve been run through an Instagram filter. But real stars have spots: cooler, darker regions on a star’s surface caused by strong magnetic fields.
Annoyingly, these spots can seriously interfere with how we study exoplanet atmospheres.
How to Probe a Planetary Atmosphere
Planetary atmospheres are often probed through transmission spectroscopy. When a planet transits its star, some starlight passes through the planet’s atmosphere before reaching us. We can distinguish the light that has passed through the planet’s atmosphere by comparing the star’s light in transit versus out of transit. In doing so, we can isolate the atmospheric spectrum and look for absorption features of species like water or oxygen.
Easy, right?
How Starspots Get in the Way
Things get more complicated once we stop thinking of the star as if it’s been smoothed out by an Instagram filter. Starspots are cooler than the surrounding stellar surface, which means they emit a different spectrum. They are also constantly changing: new spots can form, old ones can disappear, and the star’s rotation carries them in and out of view. This changes things.
First of all, your star’s spectrum changes over time, which could mean that the star’s spectrum out of transit is not the same as the star’s spectrum during transit. On the other hand, the planet may transit across a starspot instead of a “normal” stellar region. In this case, the light we measure during the transit is affected by the spot, and it is no longer accurate to directly compare it with the overall stellar light outside the transit.
Ultimately, absorption features that we thought were from the planetary atmosphere could actually be coming from starspot contamination instead.
Starspot Models: Our Solution?
To deal with this, astronomers build starspot models, where they vary the spots in terms of the following:
- The surface covering fraction: this parameter tells us how much of the stellar surface is covered in spots
- The temperature contrast: this parameter tells us how much cooler (in ratio) the spot is compared to the rest of the stellar surface, and by proxy how much dimmer
These models are promising, but how do we know that we have chosen the right parameters?
A Unique Laboratory: TOI-3884
The TOI-3884 system is a unique laboratory for testing our starspot models. As seen in Figure 1, it has very convenient starspot geometry, with a large starspot located close to its pole. On top of that, we observe this star almost completely pole-on, which means that we always see this starspot, no matter how much the star rotates. To top this all off, the star hosts a close-in planet, which orbits the star from pole to pole.
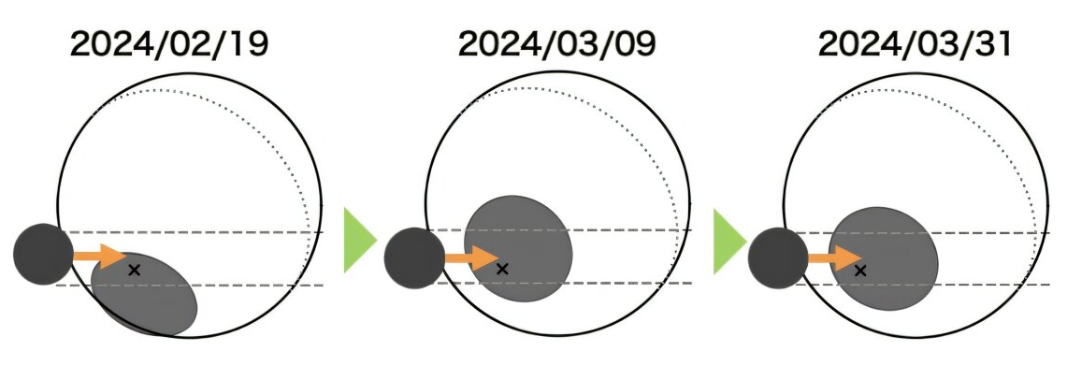
Figure 1: Illustration of the TOI-3884 system. The pole (and rotation axis) of the star is indicated with a black “x,” indicating that we see the star almost pole-on. The polar starspot is indicated in grey, and the transiting planet TOI-3884b is indicated in black. Different dates are shown, illustrating how the system evolves over the span of a few weeks. [Adapted from Mori et al. 2025]
So… How Good Are Our Models?
From the JWST observations, the authors extract a starspot spectrum for the first time. Figure 2 shows this as the spot contrast (how much dimmer the spot is than the surrounding stellar surface) plotted across different wavelengths. To see how well our models are doing, they compare this observed spectrum to two commonly used starspot models. The difference between the data and the models (the residual) is plotted in the lower panel.
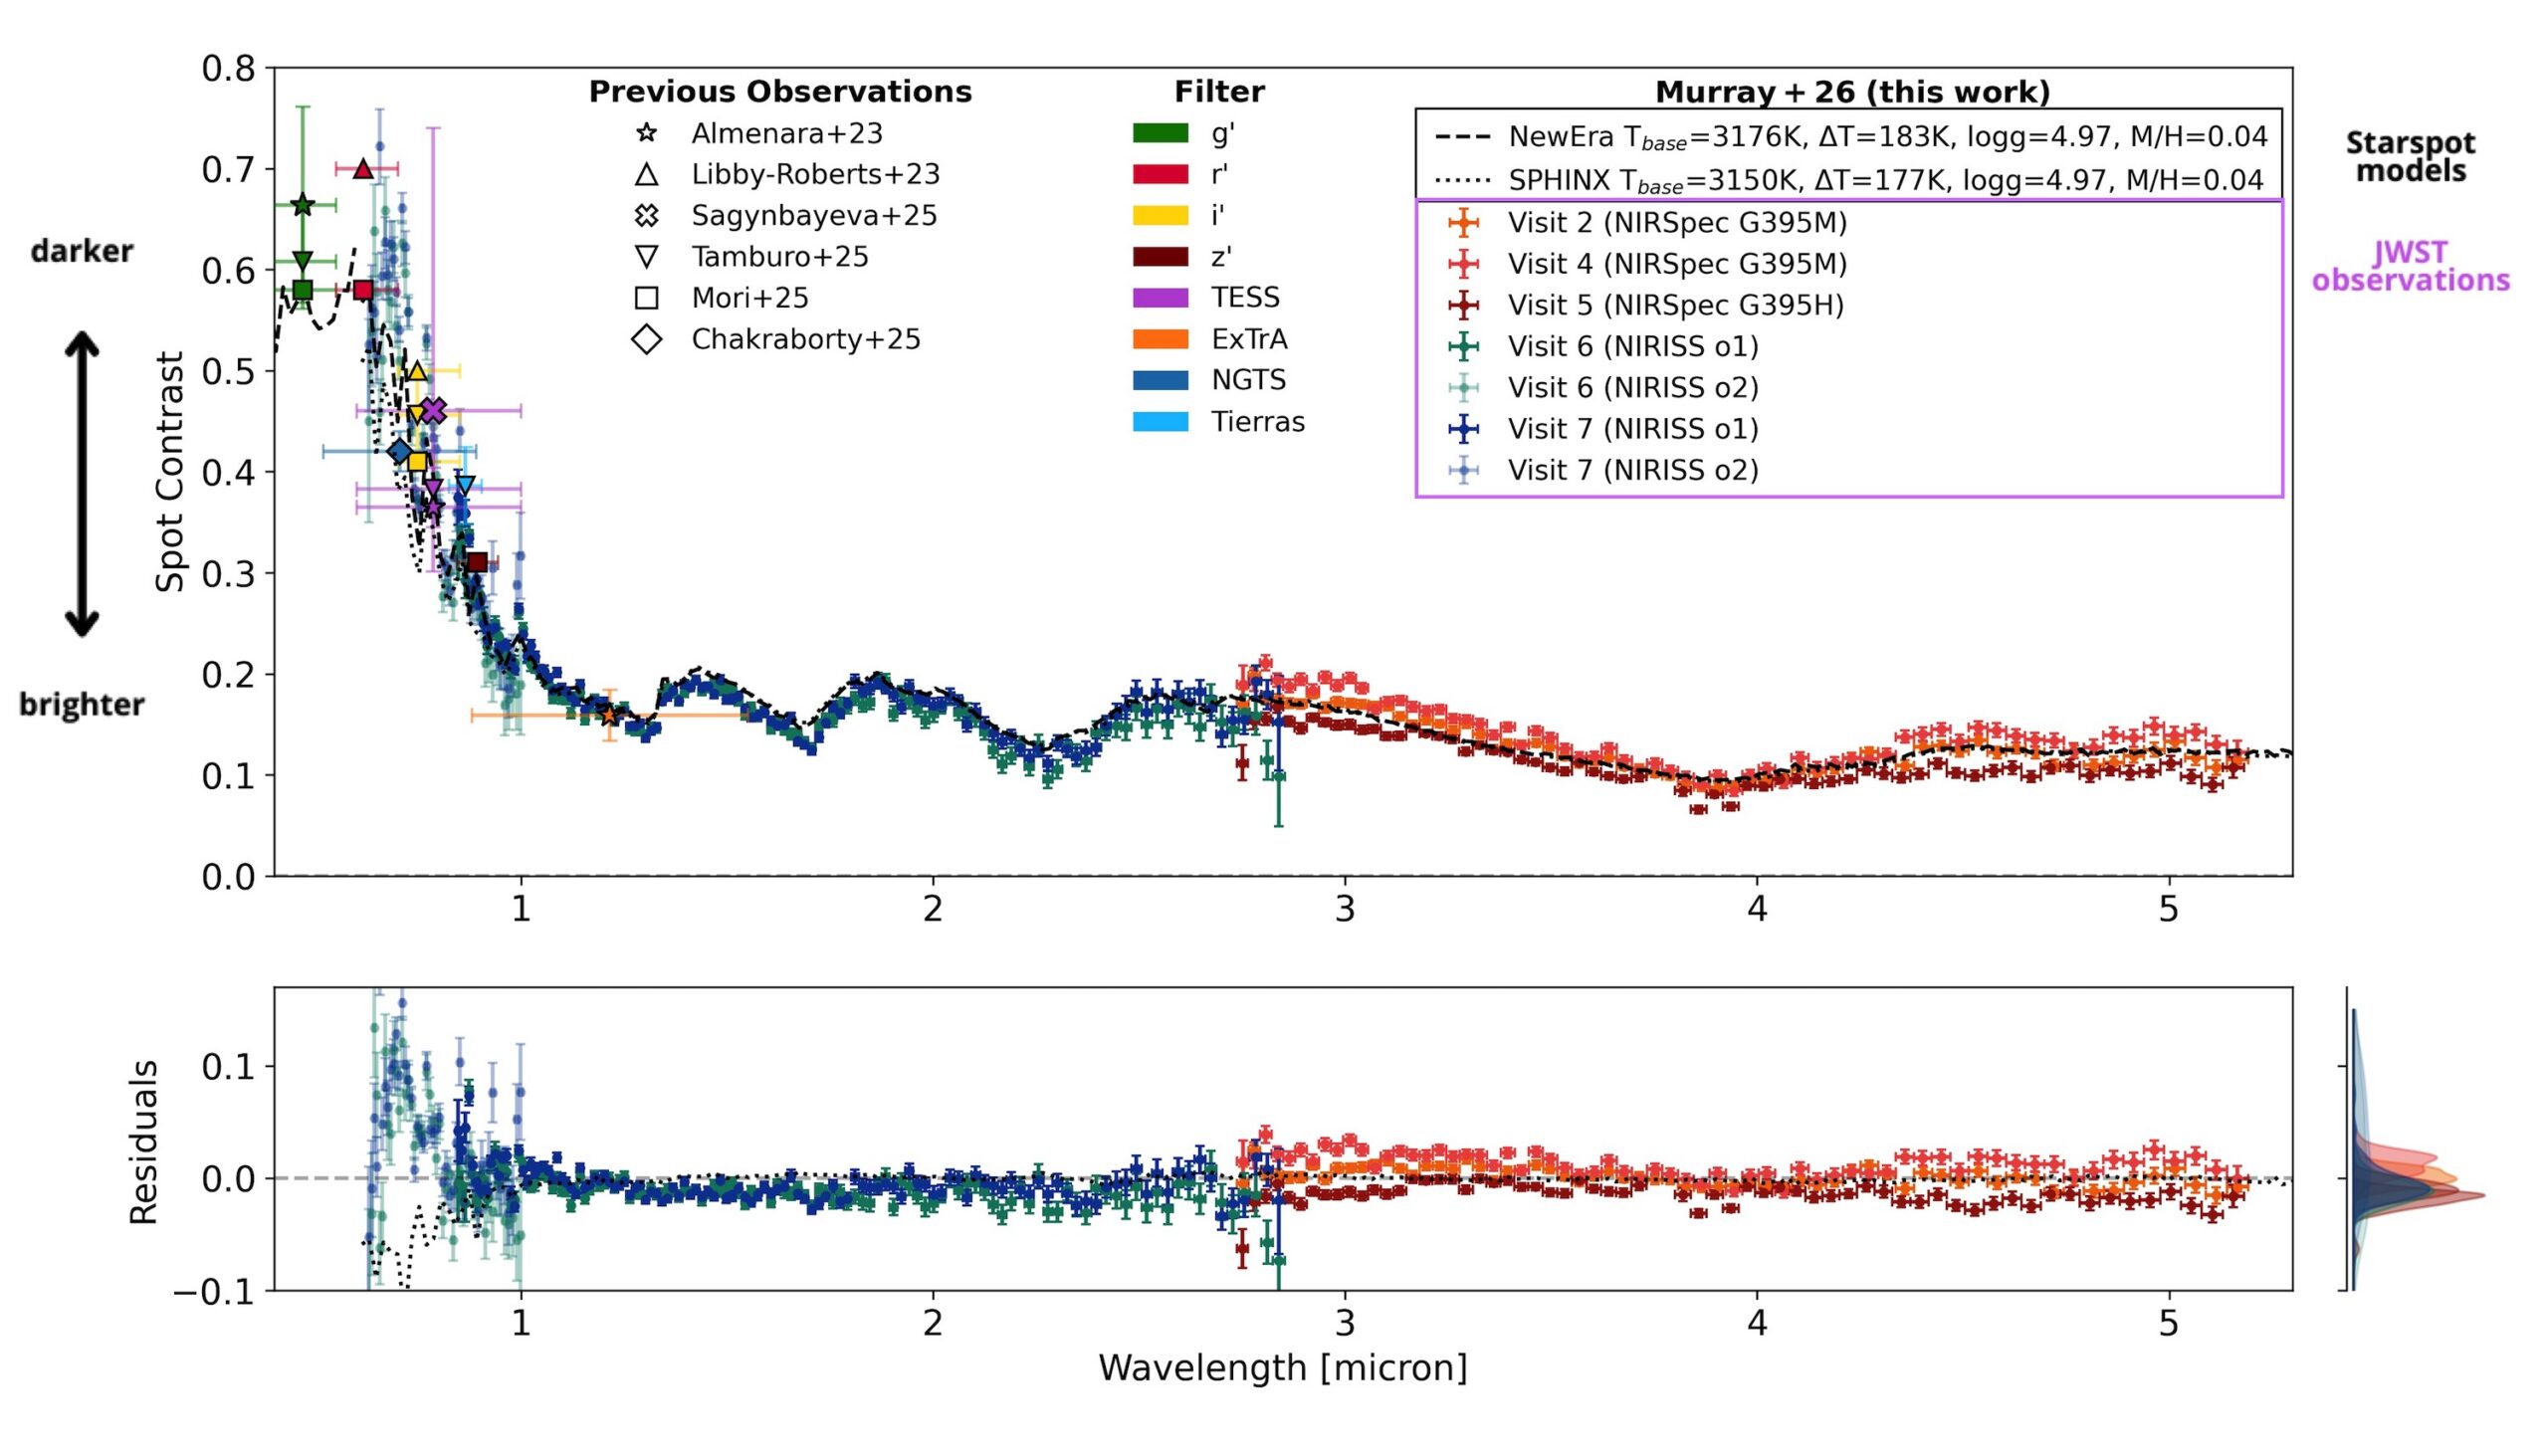
Figure 2: The spectrum of TOI-3884’s starspot. The y-axis in the upper panel, the spot contrast, indicates how much dimmer the starspot is compared to the “normal” stellar surface. Different observations taken with JWST are indicated in different colored crosses, and other previous observations are overplotted in various other shapes. Model starspot spectra are shown in dashed or dotted black lines. The residuals between the model spectra and the JWST observations are shown in the bottom panel. [Adapted from Murray et al. 2026]
There’s still work to be done before we can confidently probe planetary atmospheres at optical wavelengths without worrying about stellar contamination, and this observed starspot spectrum provides a unique benchmark to test future starspot models. For now, the near-infrared remains a safer and more reliable window for planet atmosphere studies.
Original astrobite edited by Natalie Price.
About the author, Elise Koo:
I’m a PhD student at the University of Amsterdam, working to detect magnetic interactions between stars and their planets using radio and spectroscopic observations. Outside of research, I like to try out a variety of sports.
The post The First Starspot Spectrum Revealed by JWST appeared first on AAS Nova.
]]>
JWST peers through dusty, knotted gas to uncover young star clusters in the interacting Antennae galaxies.
The post Featured Image: Massive Young Star Clusters, Revealed appeared first on AAS Nova.
]]>The Antennae galaxies are a nearby pair of interacting galaxies, shown in optical light from the Hubble Space Telescope (left) and in infrared light from JWST (right) in the image above. Between the two galaxies’ bright nuclei, there is a vast and dusty molecular cloud complex that harbors a large number of massive young star clusters — and in a recent article led by Rupali Chandar (University of Toledo), researchers have worked to pin down exactly how many clusters are embedded within the dusty whorls of the Antennae galaxies. The team used JWST to search for emission from star clusters too thickly blanketed with dust to be visible in previous observations by Hubble. They ultimately identified 45 sources, 40 of which were seen for the first time in this study. These star clusters mostly inhabit the overlap region between the two galaxies, are less than 2.5 million years old, and each contain roughly 104–106 solar masses. To learn more about how JWST’s infrared capabilities unveiled young star clusters in these interacting galaxies, be sure to check out the full article linked below.
Citation
“Nowhere Left to Hide: Uncovering All of the Massive Young Embedded Star Clusters in the Antennae with JWST,” Rupali Chandar et al 2026 ApJ 1002 64. doi:10.3847/1538-4357/ae56e8
The post Featured Image: Massive Young Star Clusters, Revealed appeared first on AAS Nova.
]]>
Researchers have discovered six faint millisecond pulsars by stacking FAST radio observations.
The post Stacking Up the Discovery of Six Millisecond Pulsars appeared first on AAS Nova.
]]>The fastest spinning pulsars in the universe are often quite difficult to detect. Leveraging multiple observations from the largest single-dish telescope in the world, researchers have discovered six previously undetected pulsars.
Millisecond Pulsars in Globular Clusters
Globular clusters, compact collections of tens of thousands to millions of stars, are highly dense and rife with dynamical interactions. These active environments are ideal factories for the formation of millisecond pulsars — the extremely fast-spinning cores of once-massive stars, shining beams of radio emission from their poles. One way millisecond pulsars are thought to form is when a pulsar in a binary system steals mass from its companion star, transferring angular momentum and causing the pulsar to spin up. The densely packed environment in a globular cluster provides ample opportunity for a pulsar to acquire a companion to siphon.
However, millisecond pulsars in distant globular clusters are notoriously difficult to detect. Traditional pulsar searches that rely on a single observation tend to miss millisecond pulsars, many of which have signals too faint to be distinguished from noise or radio interference. Instead, researchers must rely on a different method to find these fast-spinning pulsars.
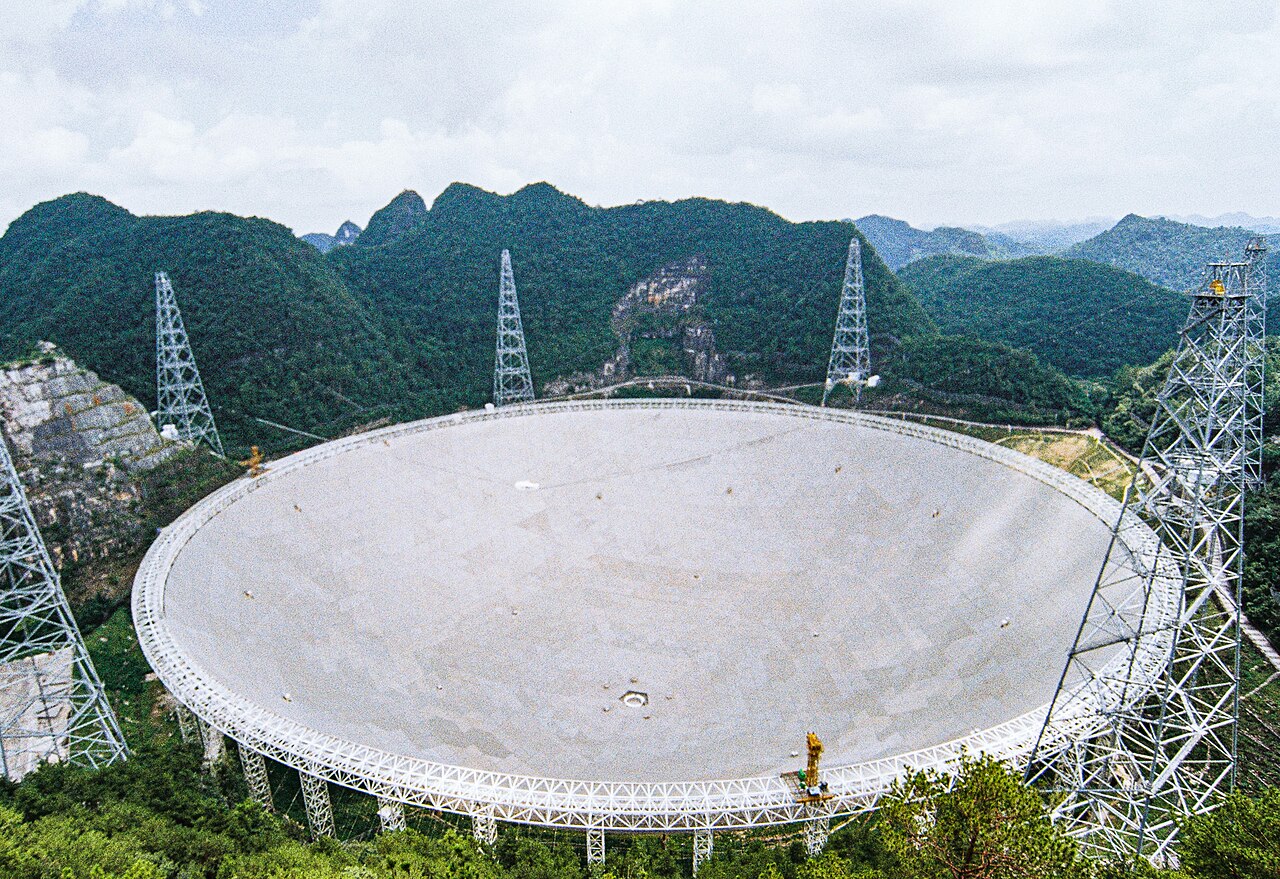
FAST, the 500-meter single-dish radio telescope located in southwestern China. [Wikipedia user SCJiang; CC BY 4.0]
Stack Search Success
To find faint millisecond pulsars, researchers have developed the stack search method, in which multiple radio observations are combined to tease out faint signals and decrease noise. Reliably stacking observations across epochs requires stability; isolated millisecond pulsars, now no longer spinning up after losing their companion, have very stable rotation periods, making them ideal targets for the stack search method. To date, the stack search method has successfully identified nine isolated globular cluster millisecond pulsars using data from the Arecibo, Parkes, and Green Bank radio telescopes.
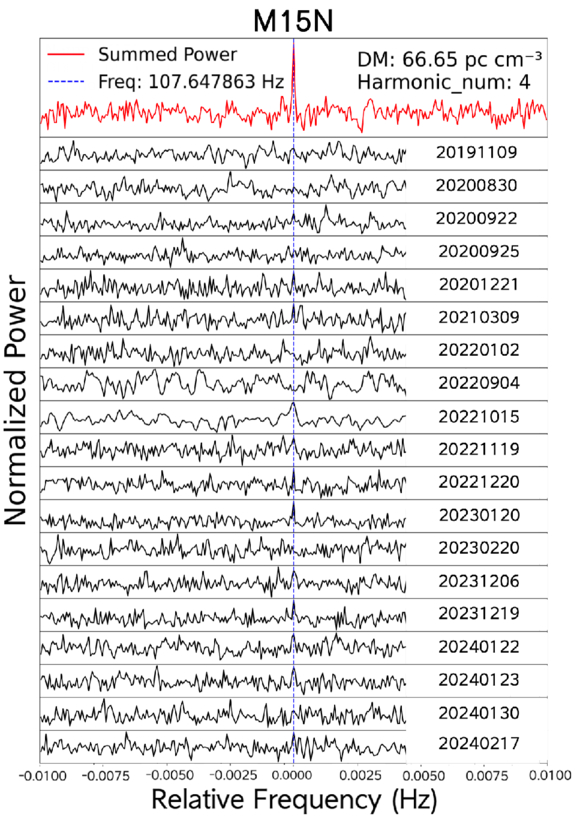
Power spectra from a discovered millisecond pulsar M15N. The black solid lines show the 19 individual observations of the pulsar, and the red solid line in the top panel shows the stacked spectrum. The stack search method pulls out a clear pulsar signal. [Dai et al. 2026]
While previous studies identified brighter pulsars in the targeted globular clusters, the authors confirmed that all six newly discovered pulsars are too weak to be reliably recovered from single-epoch searches, underscoring the importance of the stack search method. In particular, this search increased the known pulsar populations of NGC 6517 and M15 by 27% and 18%, respectively, suggesting that a meaningful fraction of globular cluster pulsars are easily missed in traditional pulsar searches. Future studies employing this stack search method will continue to detect faint millisecond pulsars, unlocking this elusive population for further exploration.
Citation
“The Stack Search Tests on FAST Data: Discovery of Six Faint Isolated Millisecond Pulsars in NGC 6517 and NGC 7078 (M15),” Yinfeng Dai et al 2026 ApJL 1002 L31. doi:10.3847/2041-8213/ae5dbb
The post Stacking Up the Discovery of Six Millisecond Pulsars appeared first on AAS Nova.
]]>
With hundreds of pairs of merging black holes now detected via gravitational waves, researchers can investigate the sites of black hole mergers across the universe.
The post Third Star’s the Charm: Most Merging Black Holes Might Be in Triple Systems appeared first on AAS Nova.
]]>Where do black hole mergers happen? Recent research finds evidence that most black hole mergers occur in triple systems containing a close inner binary and a more distant third party.
Assembling Merging Black Holes
Thanks to the combined efforts of the LIGO, Virgo, and KAGRA gravitational wave detectors, we’ve now collected the subtle signals from several hundred pairs of merging stellar-mass black holes. As this collection of spacetime ripples continues to grow, researchers are seeking to understand how these merging black hole pairs were assembled.
In the simplest scenario, pairs of high-mass stars independently evolve into black holes, lose momentum by emitting gravitational waves, and meld into one another. But the population of merging black holes likely contains contributions from multiple sources, including multiple-star systems, the disks surrounding accreting supermassive black holes, and black holes that have already experienced a merger. Which of these merging populations is reflected in our catalog of gravitational wave events?
Modeling Challenges
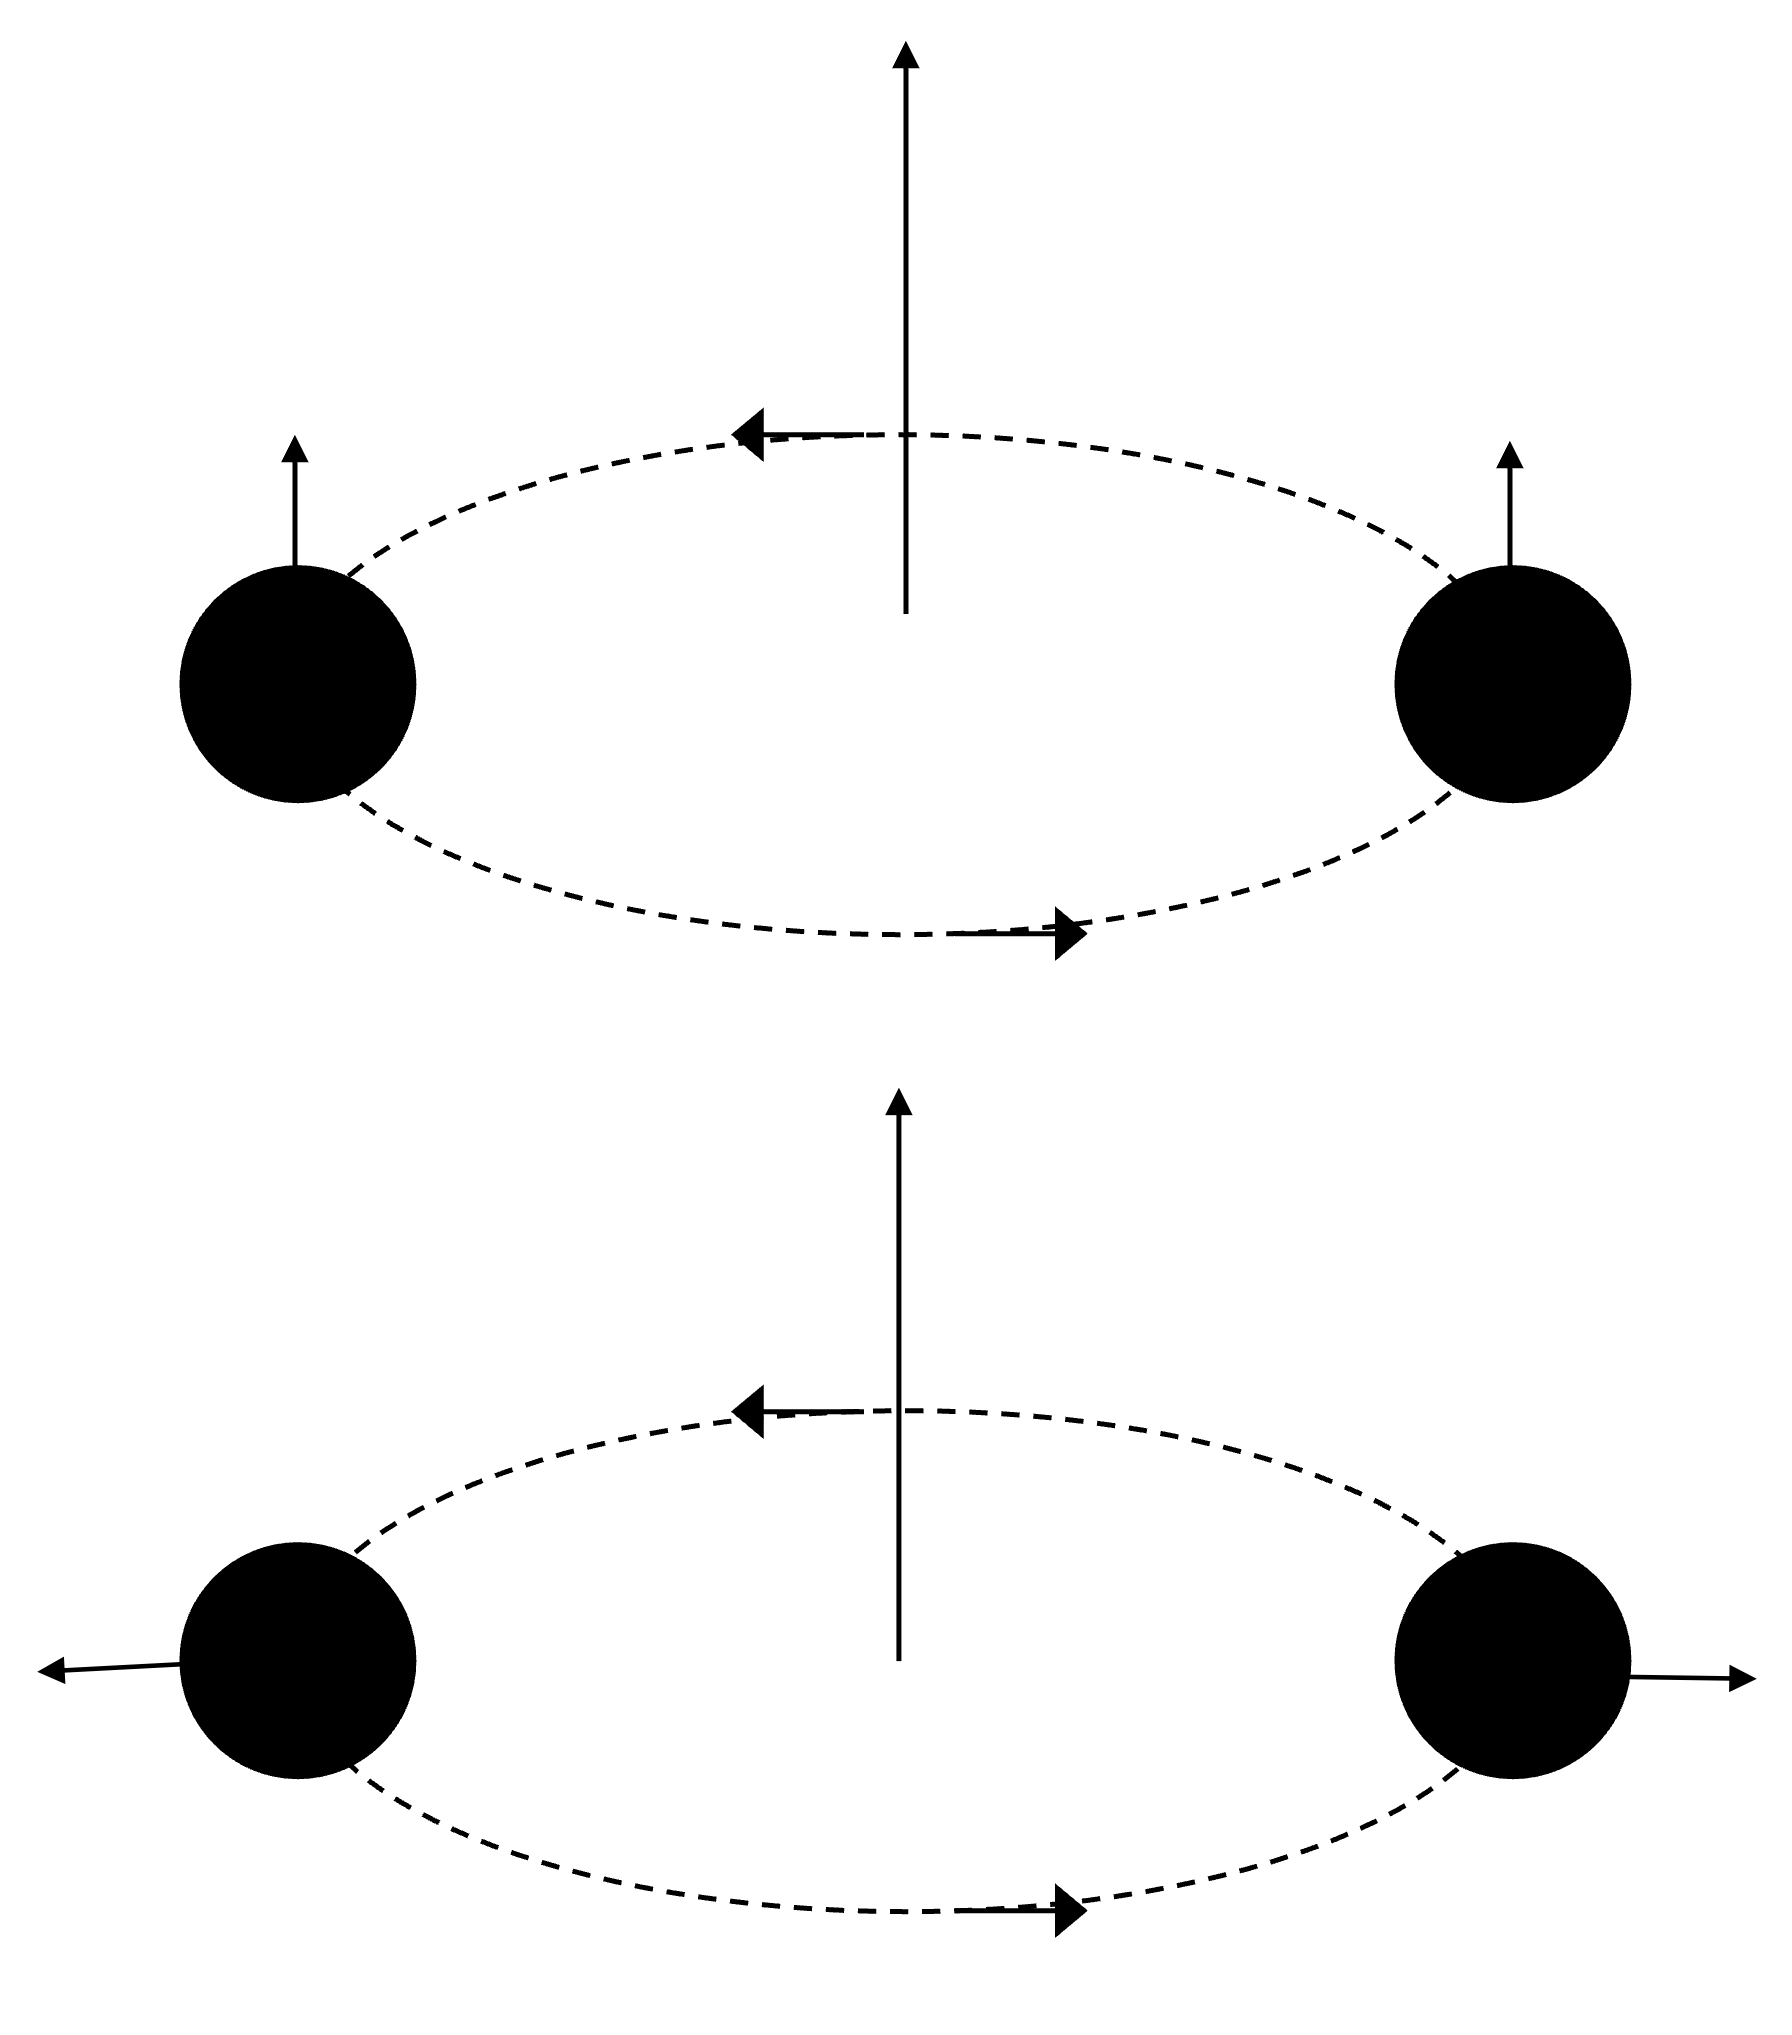
A black hole binary system with aligned spins and orbit (top) and a binary with spins tilted by 90 degrees (bottom). [AAS Nova/Kerry Hensley]
So far, the increasingly large pool of gravitational wave detections tentatively points to a feature that could illuminate the sites of black hole mergers: a peak in the spin–orbit tilt distribution around 90 degrees. This feature has been most confidently extracted from nonparametric analyses, which do not make assumptions about the population of merging black holes, but it has also been hinted at in parametric analyses, which do make population-level assumptions.
Triple-System Feature
To investigate this feature further, a team led by Jakob Stegmann (Max Planck Institute for Astrophysics) performed a new, astrophysically motivated parametric analysis of the most recent catalog of gravitational wave detections from LIGO, Virgo, and KAGRA.
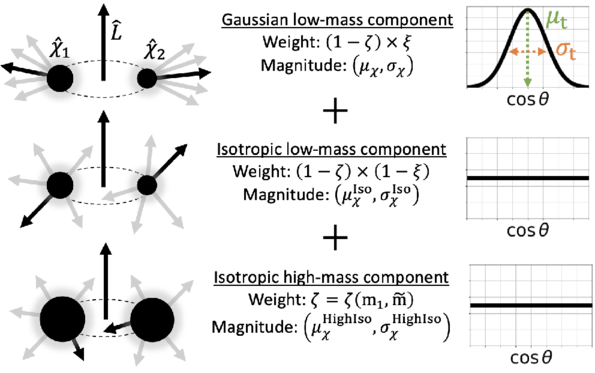
The three populations in the team’s modeling. [Stegmann et al. 2026]
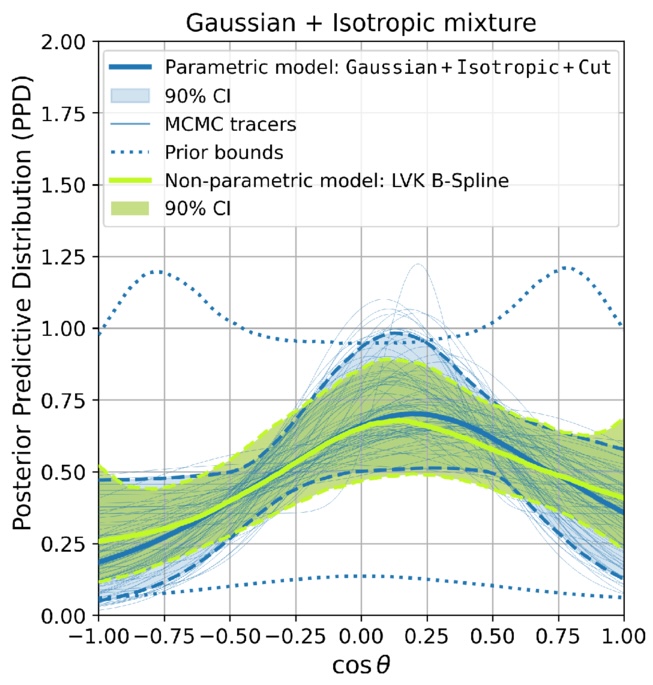
Posterior predictive distribution of black hole spin–orbit tilts. Both the authors’ modeling (solid blue line) and the nonparametric modeling performed by the LIGO–Virgo–KAGRA collaboration (solid green line) find evidence for a peak in the spin–orbit tilt distribution near cosθ = 0. [Adapted from Stegmann et al. 2026]
Stegmann and collaborators pointed out that the triple-system scenario aligns well with other properties of the observed population of black hole mergers, such as the mass and effective spin distributions. This scenario may also be necessary to explain certain merging pairs that might have had slightly eccentric orbits at the moment of merging. If future gravitational wave observations strengthen the evidence for a peak in the spin–orbit tilt distribution near 90 degrees, it will have profound implications for how and where black holes merge in our universe.
Citation
“Gravitational-Wave Observations Suggest Most Black Hole Mergers Form in Triples,” Jakob Stegmann et al 2026 ApJL 1000 L59. doi:10.3847/2041-8213/ae52ec
The post Third Star’s the Charm: Most Merging Black Holes Might Be in Triple Systems appeared first on AAS Nova.
]]>
Astrobites reports on a surface biosignature called the vegetation red edge and how we might find it on other worlds.
The post Life on the (Red) Edge appeared first on AAS Nova.
]]>Editor’s Note: Astrobites is a graduate-student-run organization that digests astrophysical literature for undergraduate students. As part of the partnership between the AAS and astrobites, we occasionally repost astrobites content here at AAS Nova. We hope you enjoy this post from astrobites; the original can be viewed at astrobites.org.
Title: Retrieving the Red Edge on Earth-Like Planets with Heterogeneous Clouds and Surfaces
Authors: Zachary Burr et al.
First Author’s Institution: Jet Propulsion Laboratory; ETH Zurich
Status: Published in ApJ
In the next 25 years, astronomers could find signs of life on other planets with the launch of the Habitable Worlds Observatory. Atmospheric signs of life, known as atmospheric biosignatures, are how astronomers currently search for life on other planets. Figure 1 shows examples of atmospheric biosignatures with pictures of each chemical’s origin on Earth. Before E.T. can phone home, though, we have to understand what chemicals make up a planet’s atmosphere. To do this, astronomers can use spectroscopy to observe a planet’s atmosphere in different wavelengths and measure the types and quantities of chemicals present.
Figure 1: Atmospheric biosignatures present in Earth’s atmosphere. More abundant biosignatures include oxygen and ozone (byproducts of photosynthesis in plants and bacteria) and nitrous oxide (byproduct of bacteria that don’t need oxygen to survive). Less abundant biosignatures include isoprene (released from the breakdown of leaves that have fallen from trees) and sulfur gases (byproducts of cyanobacteria). [Kaz Gary]
But are atmospheric biosignatures the only way to tell if life exists on other planets? Short answer: absolutely not. Let’s take Earth as an example. If we imagine Earth as a directly imaged exoplanet and take spectra of the light it reflects, you’ll find that around near-infrared wavelengths (~700 nanometers or just past the red part of the visible light spectrum), the light reflected off of Earth increases sharply. This sharp increase is called the vegetation red edge and is caused by plant and ocean life on Earth’s surface as shown in Figure 2. This is made possible because chlorophyll (the thing that makes plants green) absorbs nearly all visible light but reflects near-infrared light. The vegetation red edge is an example of a surface biosignature. In today’s article, the authors determine if the vegetation red edge will be visible in spectra of Earth-like exoplanets!
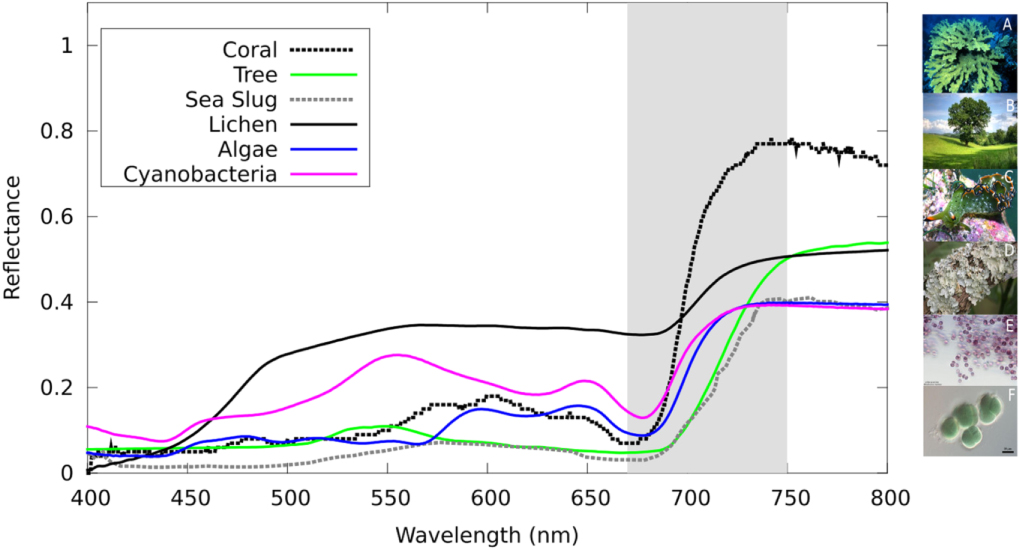
Figure 2: Spectra of different sources of the vegetation red edge on Earth. The vegetation red edge is highlighted in gray where the spectra rapidly increase and then level off beyond the visible light part of the spectrum. Each color represents a different source with pictures of each source on the right-hand side of the plot. [O’Malley-James and Kaltenegger 2019]
Snapshots
Planets rotate; that’s how we have morning, noon, and night in 24 hours guaranteed. This means that different parts of the surface will be visible at different times when we take spectra. Sometimes, we may see more ocean than land, other times not. To determine if the vegetation red edge would be visible at all points in Earth’s day, the authors simulated nine different spectra of modern-day Earth representing nine snapshots of Earth’s rotation. Additionally, they also simulated a time-averaged spectrum that shows an entire Earth day in one snapshot without the time variability. These spectra are shown in Figure 3.
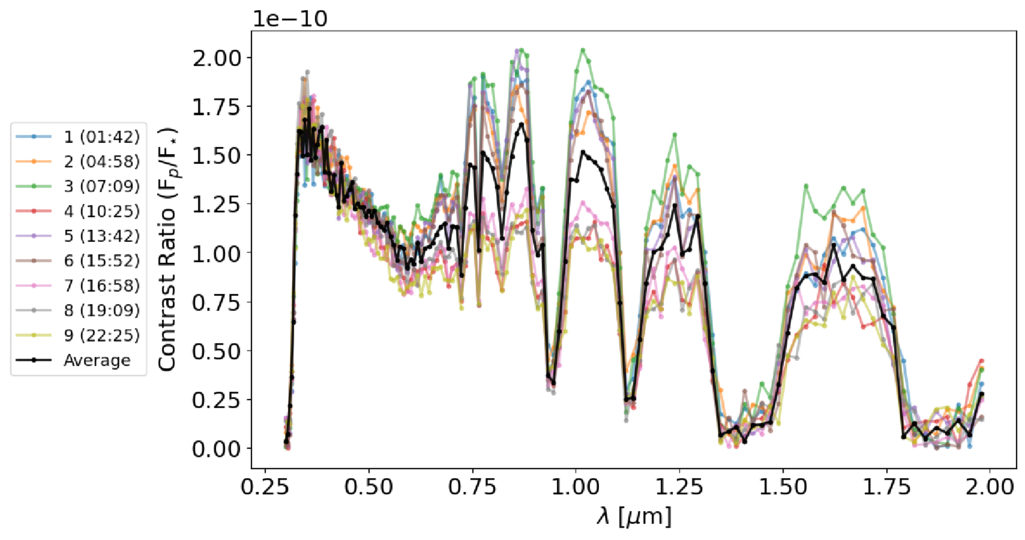
Figure 3: Spectra of a directly imaged modern-day Earth at nine different times in its rotation. The y-axis is the ratio of the planet’s signal to the star’s signal and the x-axis is wavelength in microns. Each color represents a time in UTC and the black curve represents the time-averaged spectrum. [Burr et al. 2026]
Arr! There Be… Vegetables?
After running the models, the authors were able to detect a sharp increase in the surface albedo value in every spectrum, including the time-averaged one. This result is shown in Figure 4. The authors take this result one step further in order to validate that the vegetation red edge is actually a result of surface variation of vegetation. They re-run models on each of their spectra but instead include a constant surface albedo instead of a time-varying one. This resulted in incorrectly measured radii, chemicals, and surface gravity in nearly all of the models. Without the vegetation red edge and surface features, the models could not accurately determine if life was present on Earth.
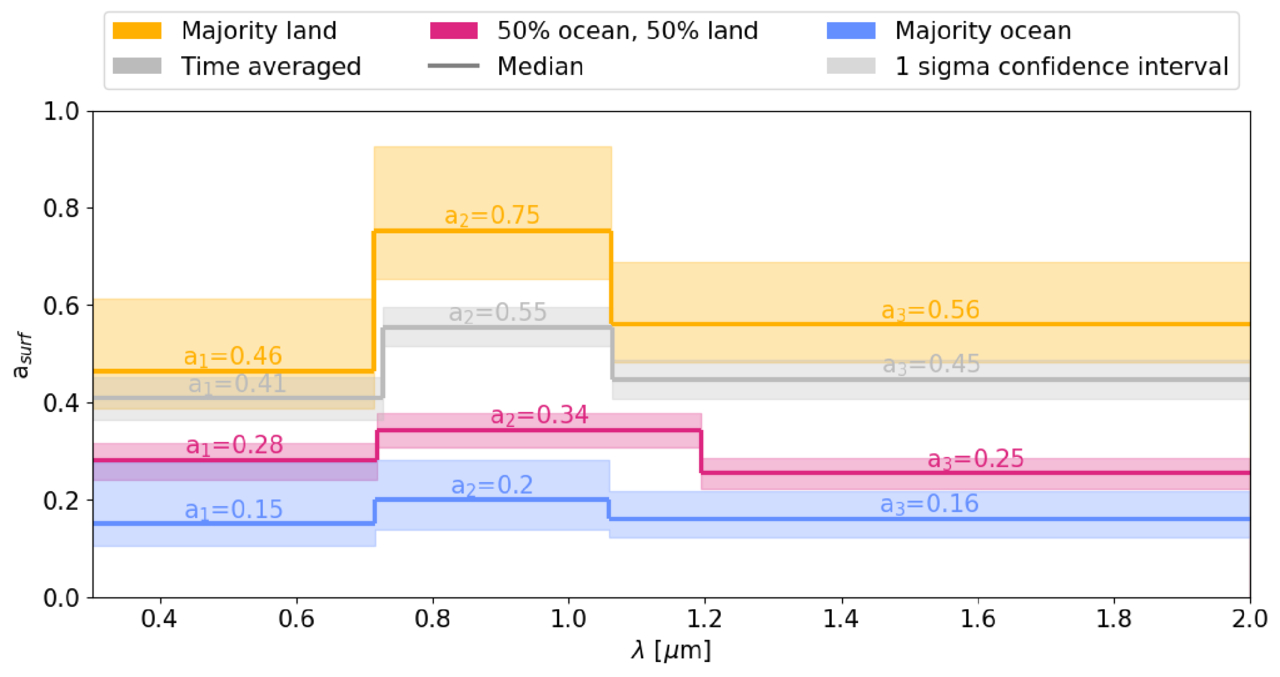
Figure 4: Retrieved surface albedos for the nine time-varying spectra. The surface albedo is broken down into three different values (a₁, a₂, a₃). Each of these values represents a change in the surface albedo at different wavelengths (i.e., how reflective the surface is at three different wavelengths). The nine spectra were broken down by the amount of surface that was visible at that time and color-coded for each category. The time-averaged spectrum is shown in gray. Each category of spectra was able to retrieve an increase in reflected light from the surface at vegetation red edge wavelengths. The spectra that had the majority land visible have the biggest increase in the surface albedo. This makes sense since the amount of visible vegetation is the largest with majority-land planets. [Burr et al. 2026]
Original astrobite edited by Madison VanWyngarden.
About the author, Kaz Gary:
I am a fourth-year PhD candidate at The Ohio State University with a passion for planets. My current work focuses on modeling exoplanet observations for the Habitable Worlds Observatory and understanding planetary atmospheres. Outside of research, I help develop planetarium shows and love all forms of science communication. In my free time, I enjoy playing tabletop RPGs, painting, watching terrible reality TV, and hanging out with my pet hedgehog.
The post Life on the (Red) Edge appeared first on AAS Nova.
]]>
A new study suggests that warm and hot Jupiters, despite looking different today, underwent the same dynamical evolution when they were younger.
The post Playing Pool with Planets appeared first on AAS Nova.
]]>Each Jupiter-size planet in the galaxy falls into one of three distinct categories: hot, warm, or cold. A new study suggests that despite the apparent differences between these populations, they may have all formed from the same underlying dynamical process: a game of pool played at planetary scales.
A Diversity of Jupiters
Though our solar system has only one Jupiter-size planet, elsewhere in the galaxy we have found three different species of these massive gas giants. Cold Jupiters closely resemble their namesake and orbit far from their host stars; hot Jupiters are the opposite and are found whipping around their stars on extremely close-in orbits. In between these are the warm Jupiters, which tend to orbit in the intermediate space between 0.1 and 1.0 au.
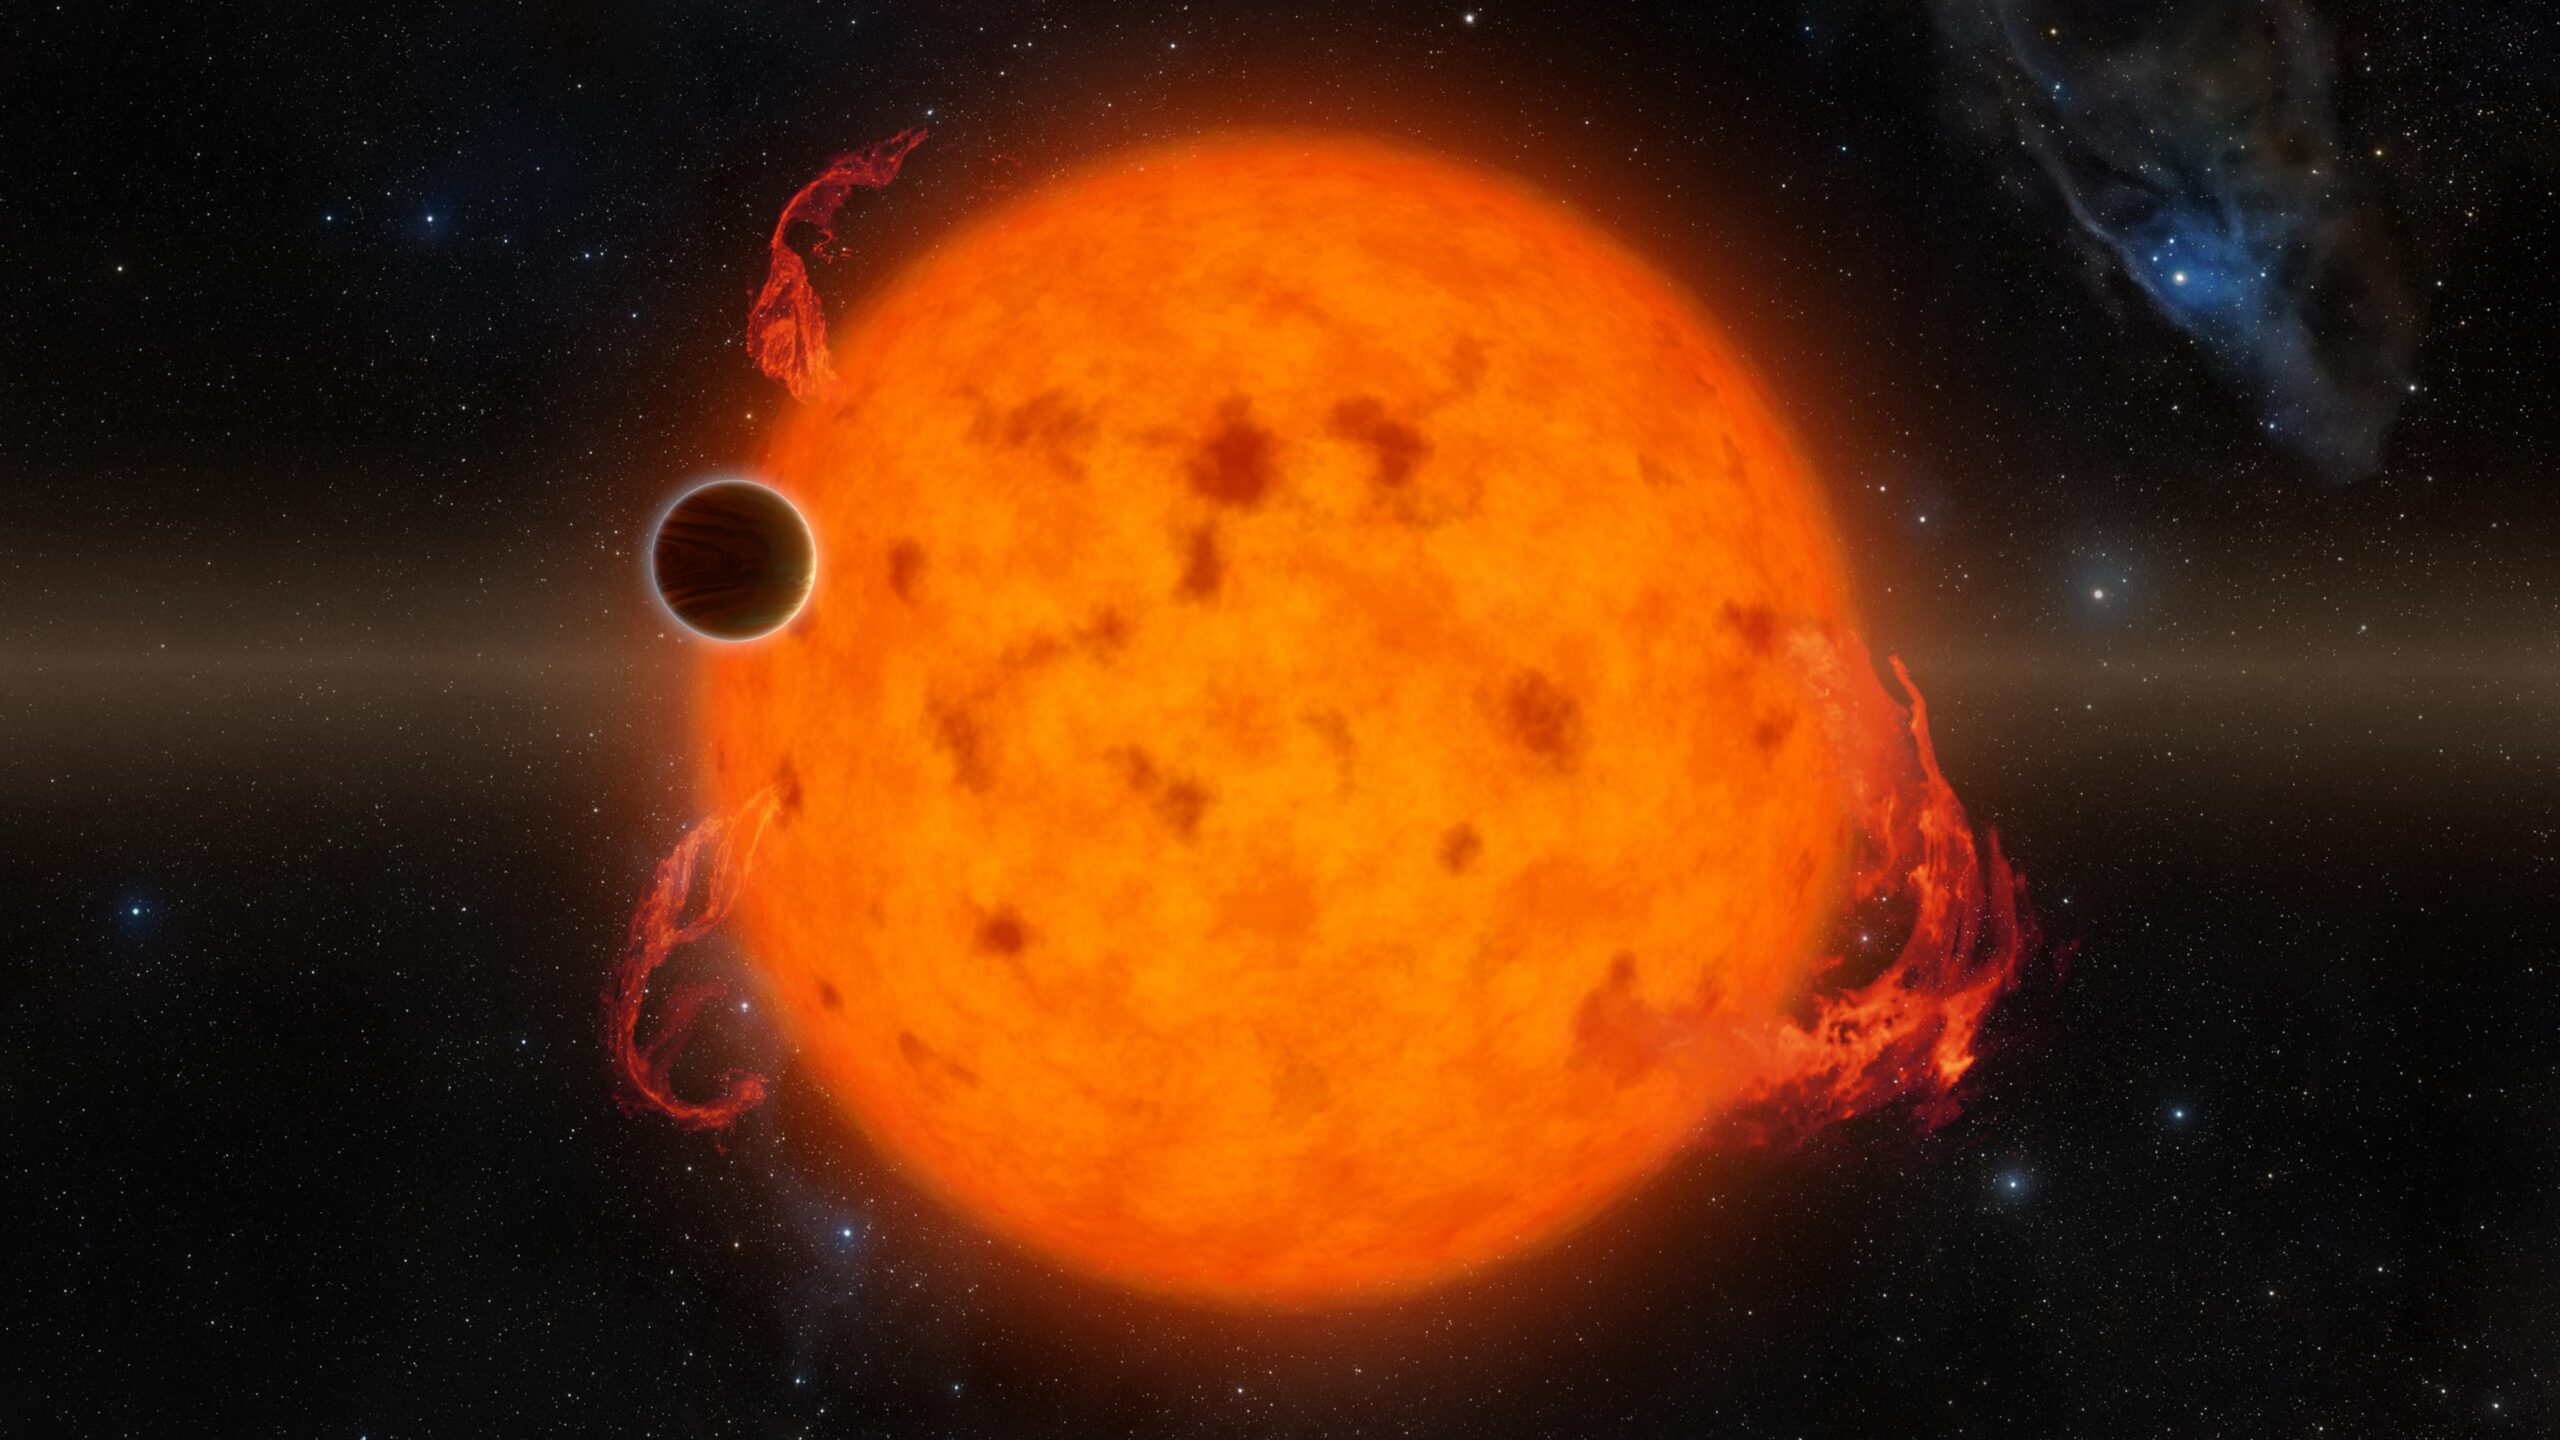
An artist’s depiction of a hot Jupiter. These planets orbit extremely close to their host stars, but likely got to their locations by scattering inward from more distant orbits. [NASA/JPL-Caltech]
Given these differences, it’s often thought that each of these populations arrived at its current location through different dynamical processes and that the history of the warm Jupiters is likely quite different from the history of the hot Jupiters. However, a new study led by Julia Esposito (Georgia Institute of Technology) has proposed an alternative view. Maybe these populations, though they appear different now, were all created by the same process: planet–planet scattering.
Virtual Planetary Billiards
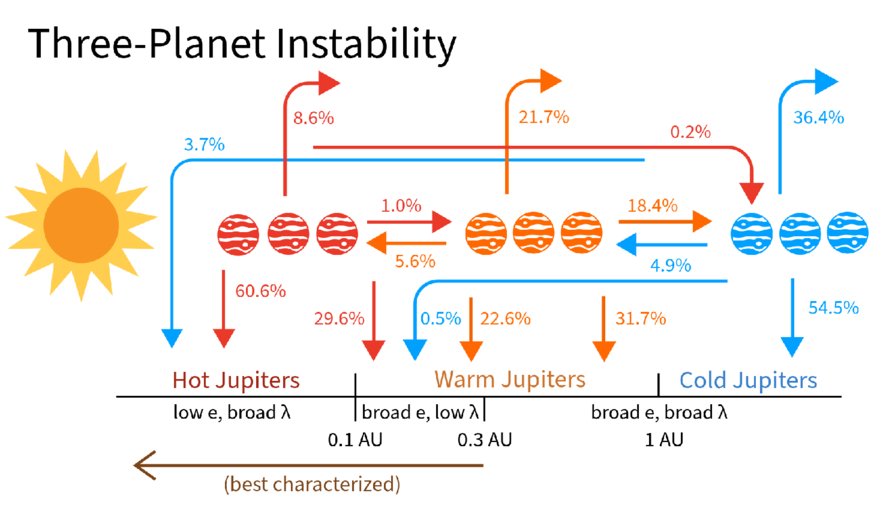
A schematic showing where different planets ended up as a function of where they scattered from during their evolution. Click to enlarge. [Esposito et al. 2026]
At the end of the simulation, the team surveyed the digital carnage. Almost every virtual system ended with only two planets after either ejecting one away from the star or having two planets collide. But, remarkably, the remaining two-planet systems looked tantalizingly similar to what we actually observe, with a mix of hot, warm, and cold Jupiters. Even more exciting, the end populations were highly correlated to where the violent scattering event took place.
For example, the warm Jupiters were almost all produced by “warm scattering” simulations, where the scattering took place between 0.1 and 1.0 au. The planets that survived the simulations and ended up as warm Jupiters matched all of the properties of the real warm Jupiter population: they had nearby companions, were moderately eccentric, and were mostly aligned with their stars. The hot Jupiters, meanwhile, were almost all produced by “cold scattering” events where the flybys happened far from the star and resulted in one planet hurtling inwards. These also matched all of the observed properties of real hot Jupiters.
The researchers concluded that planet–planet scattering can produce both the warm and hot Jupiter populations so long as you let the planets scatter from a variety of different distances. This exciting theoretical insight, if correct, would mean that astronomers could stop searching for different pathways to create each population. Happily, this model also provides testable predictions, and the authors lay out how the theory could be supported or disproven with additional data. Through virtual experiments like these, astronomers continue to build up an understanding of how the wide range of planetary architectures observed across the galaxy came to be.
Citation
“Unified Formation Channel of Hot and Warm Jupiters via Planet–Planet Scattering,” Julia Esposito et al 2026 ApJL 1003 L3. doi:10.3847/2041-8213/ae61b0
The post Playing Pool with Planets appeared first on AAS Nova.
]]>
The new observations show that the asteroid will safely pass by the Moon at a distance of more than 20,000 kilometers.
The post Asteroid 2024 YR4 Won’t Hit the Moon, New JWST Observations Show appeared first on AAS Nova.
]]>Discovered in December 2024, the roughly 60-meter-wide asteroid 2024 YR4 was initially thought to have a slim chance of striking Earth in 2032. Further observations ruled out an Earth impact but left open the possibility of a Moon impact. New JWST observations show that 2024 YR4 will speed past both Earth and the Moon without a collision.
Another Update on 2024 YR4
In April 2025, we featured a Research Note that described March 2025 JWST observations of 2024 YR4 and characterized the asteroid’s size and albedo. At the close of that article, the authors suggested that further JWST observations in early 2026 could help to refine our understanding of the asteroid’s trajectory and determine whether it would strike the Moon.
On 18 and 26 February 2026, JWST carried out those critical observations. In this dataset, the asteroid is bright enough to be detected confidently, and the background is peppered with a sufficient number of reference stars — two factors necessary to determine the precise track of the asteroid as it zipped through space.
Trajectory Refinement
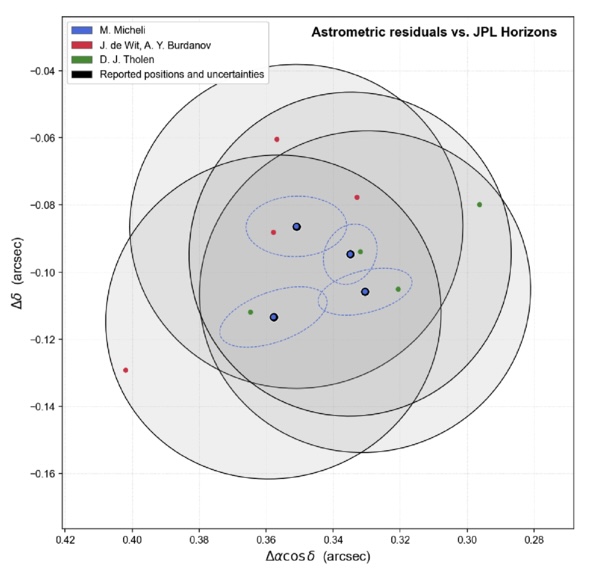
Difference between the position of 2024 YR4 determined in this work using three different reduction methods (red, blue, and green circles) and the position drawn from the existing orbit from the JPL Horizons database. The different analysis methods yielded consistent results. [Adapted from De Wit et al. 2026]
Combining the latest JWST observations with existing data stretching back to the asteroid’s discovery, de Wit and coauthors determined a new, highly precise orbit for the object — one that definitively shows that the asteroid will safely pass by the Moon at a distance of 22,900 ± 800 km in 2032. In addition to ruling out the upcoming lunar impact, the team also ruled out any collisions with Earth in the next 100 years. Phew!
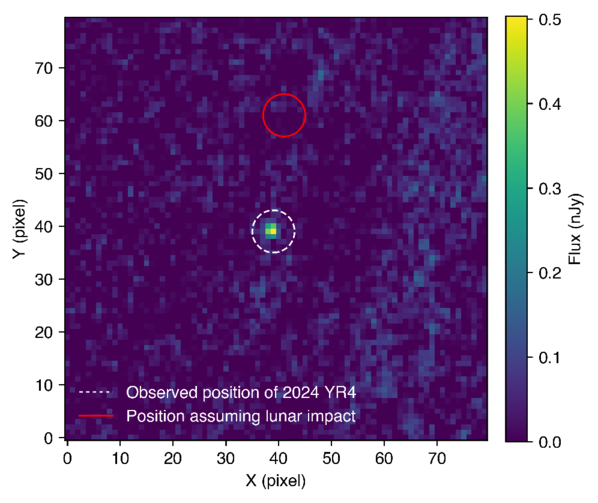
Position of 2024 YR4 as seen by JWST in February 2026 (white dashed circle) compared to the asteroid’s location estimated from existing data (red circle). [De Wit et al. 2026]
High-Impact Science
This work highlights JWST’s potential as a tool for planetary defense. The February 2026 observations detailed here represent the faintest-ever detection of a near-Earth object, and JWST can detect objects far fainter than ground-based telescopes can. This ability allows JWST to observe potentially hazardous asteroids over a larger swath of their orbits, which translates to earlier trajectory estimation — JWST pinned down 2024 YR4’s orbit two years before the asteroid would have become bright enough for ground-based telescopes to do so.
JWST’s role may be even more important for smaller objects that rapidly become undetectable after discovery. De Wit’s team demonstrated this for a 10-meter-diameter 2024 YR4 clone on the same trajectory; for an object of this size, JWST would be able to rule out an Earth impact before the asteroid became undetectable, but ground-based telescopes could not. With surveys from facilities like Vera C. Rubin Observatory and Near-Earth Object Surveyor set to discover hundreds of thousands of new near-Earth objects, JWST’s role as a hazard assessor will likely be in high demand.
Citation
“JWST Observations of Asteroid 2024 YR4 Rule Out a 2032 Lunar Impact and Demonstrate a New Regime for Planetary Defense Follow-Up,” Julien de Wit et al 2026 ApJL 1003 L21. doi:10.3847/2041-8213/ae6a95
The post Asteroid 2024 YR4 Won’t Hit the Moon, New JWST Observations Show appeared first on AAS Nova.
]]>
Astrobites reports on new mid-infrared observations that allow researchers to probe the structure of active galactic nuclei.
The post I Spy with My Large Binocular Eyes: A Dusty Torus Around a Supermassive Black Hole? appeared first on AAS Nova.
]]>Editor’s Note: Astrobites is a graduate-student-run organization that digests astrophysical literature for undergraduate students. As part of the partnership between the AAS and astrobites, we occasionally repost astrobites content here at AAS Nova. We hope you enjoy this post from astrobites; the original can be viewed at astrobites.org.
Title: Shocks, Winds, and a Torus: The Large Binocular Telescope Interferometer (LBTI) Resolves the Active Nucleus of NGC 4151
Authors: Jacob W. Isbell et al.
First Author’s Institution: University of Arizona
Status: Published in ApJ
At the centre of nearly every galaxy lies a supermassive black hole that dominates this innermost region. Not only is there this millions-of-solar-masses dark beast, but usually too a whole bunch of stuff — stars, gas, dust, and more — which is often quite bright! When there is plenty of this material quite close to the black hole, we believe physics takes control to flatten it into a family of disk and toroidal structures in what we call the unified model of active galactic nuclei (AGNs; see Figure 1).
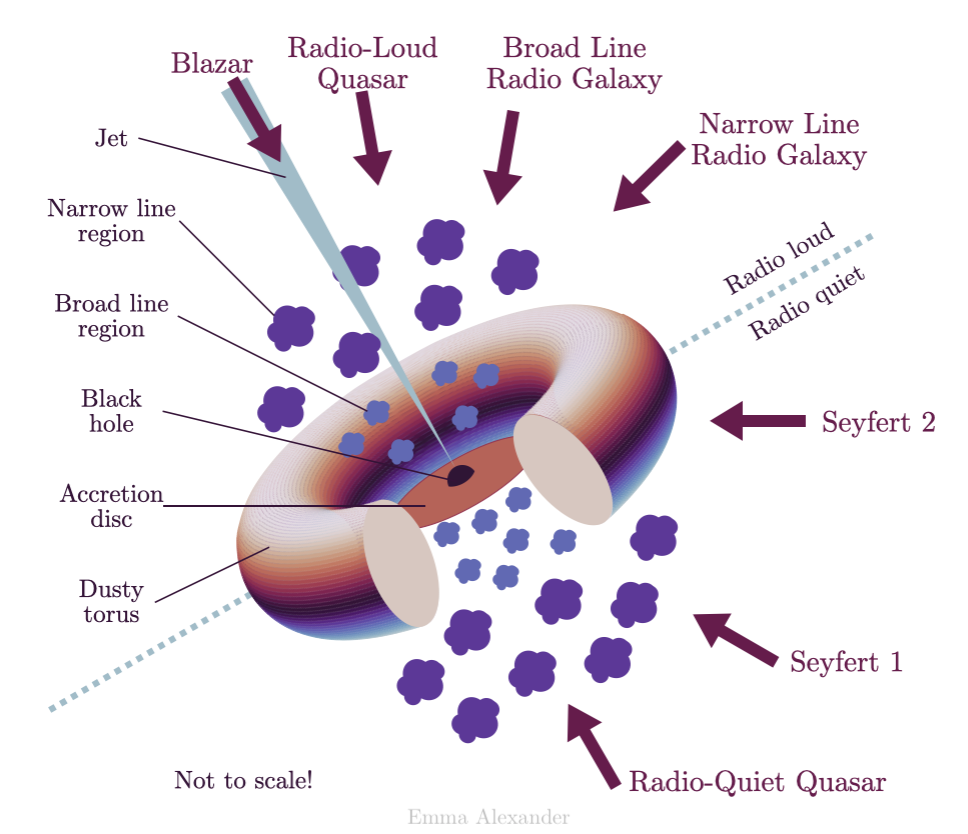
Figure 1: The unified model of AGNs asserts that there is an inner accretion disk, surrounded by a dusty torus that cohabitates with clouds moving at different velocities (the so-called broad and narrow line regions), and sometimes even relativistic jets extending from the accretion disk to galactic scales; you can read more about AGN structure in this Astrobites guide. [Emma Alexander; CC BY 4.0]
The cores of AGNs are often imaged at the smallest scales (e.g., their accretion disks, viewed with interferometers like the Very Large Telescope Interferometer) and the largest scales (e.g., their relativistic jets, viewed with radio interferometers), but comparatively less effort has gone to directly observing the predicted dusty tori in the mid-infrared. That is exactly what today’s authors set out to do using the Large Binocular Telescope Interferometer (LBTI) — a pair of 8.4-metre-aperture mirrors separated by just over 14 metres and combined to simulate a telescope effectively 29 metres wide. This lets astronomers take direct images at a much higher resolution than a smaller-aperture telescope, and hence directly peer into the region around AGNs where this dusty torus should lie.
Today’s authors turn the LBTI towards NGC 4151, a medium-luminosity AGN. With the large effective aperture of the LBTI, they were able to resolve scales in the AGN region as small as 4.4–9.1 pc, about 14–30 light-years depending on the wavelength (see Figure 2), in the mid-infrared. These observations revealed warm dust emission in a complex structure around the central supermassive black hole. The authors note a central bar at all wavelengths, with a significant extension of cool dust arcing to the west (right in the image) and warmer dust localised to the centre (as evident by 3.7- and 4.8-micron emission only nearest to the supermassive black hole and its accretion disk).
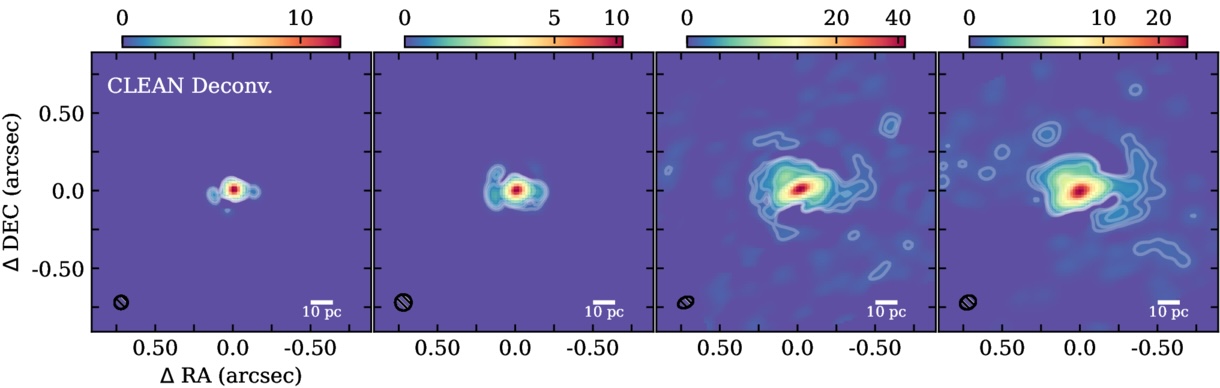
Figure 2: The deconvolved images of the AGN core of NGC 4151 show a very bright central source (the innermost region around the supermassive black hole), as well as some complex surrounding structure particularly at long wavelengths. The interpreted morphology is described in Figure 3. These images are deconvolved, meaning that known optical effects are corrected for on the raw data to produce a sharper image. [Adapted from Isbell et al. 2026]
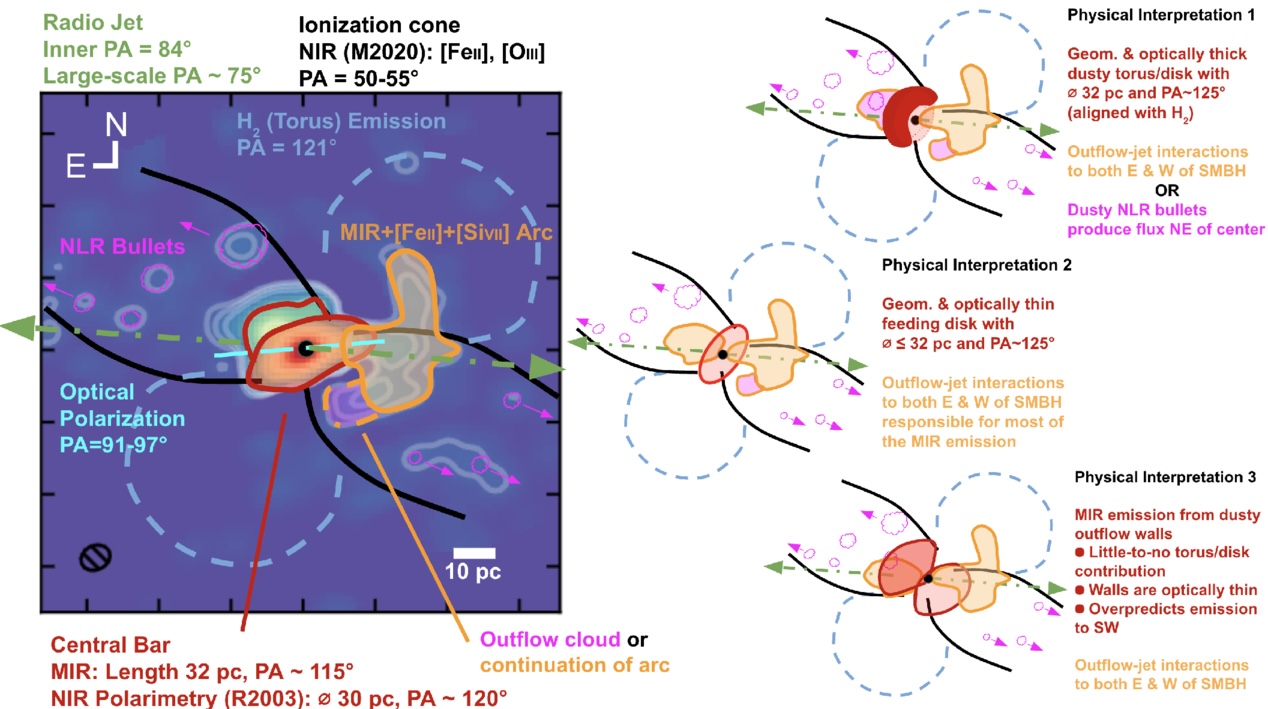
Figure 3: Three interpretations of the observed morphology are presented by the authors. The left panel illustrates the different regions surrounding the supermassive black hole (together with the results of other studies cited in the article). The right panel shows the suggested interpretations explaining the morphology. [Isbell et al. 2026]
The second interpretation aligns with a different version of the unified model: one in which a geometrically thin disk replaces a thick torus around the AGN core. Provided the disk is optically thin too, the authors favour this approach as it is consistent with the geometry of ionised emission that worked against the first interpretation. While other studies suggest that this thin disk should be optically thick, this morphology is at least better aligned with what we see in other AGNs.
The third interpretation suggests that the emission comes from only the radiation pressure–driven wind emanating from the AGN core. The authors disfavour this explanation, citing previous radiative transfer simulations that show that the flux should fall off with distance from the core too quickly to be consistent with the observations.
No matter the interpretation, these LBTI observations are an important glimpse into the future of mid-infrared AGN studies that will be done with 30-metre-class telescopes (such as the European Southern Observatory’s Extremely Large Telescope). This article, together with the group’s similar study on NGC 1068, is challenging and refining an accepted view of AGN morphology — the consequences of which apply to galaxies near and far — and poses new questions perfect for sophisticated hydrodynamic and radiative simulations.
Original astrobite edited by Margaret Verrico.
About the author, Ryan White:
I am a first-year PhD student at Macquarie University in Australia, working mainly on binary/multiple systems with massive stars (Wolf–Rayets in particular!). Outside of study, I’m probably drinking coffee, baking, reading, or going for a run. You can also find me procrastinating on Bluesky @astroryan.bsky.social.
The post I Spy with My Large Binocular Eyes: A Dusty Torus Around a Supermassive Black Hole? appeared first on AAS Nova.
]]>
Researchers observed Weywot, the largest moon of the dwarf planet Quaoar, as it briefly blotted out the light from a star.
The post Featured Image: Chasing Weywot’s Shadow appeared first on AAS Nova.
]]>The outer solar system is inhabited by swarms of small objects that are challenging to observe and characterize. When one of these objects travels in front of a star, from our perspective, the passage provides a brief chance to study these distant, icy denizens of our solar system. In a recent article, Estela Fernández-Valenzuela (University of Central Florida) and coauthors described how they predicted and observed stellar crossings by Weywot, the largest moon of the dwarf planet Quaoar, which lies roughly 44 au from the Sun. In the image above, the black dashed lines indicate the areas where Weywot was predicted to briefly blot out the light from a star, and the blue lines show the updated regions based on Hubble Space Telescope observations. In each panel, the green squares and red circles show where the occultation was and was not detected, respectively. There were five successful detections of Weywot’s passage across a star, allowing the team to constrain Weywot’s diameter to 116–172 km. The team also found that Weywot is much darker than the body it orbits, which has important implications for how the system formed. To learn more about the planning process for and results of these observations, be sure to check out the full research article linked below.
Citation
“Weywot, an Unusually Low-Albedo Satellite in the Trans-Neptunian Region,” Estela Fernández-Valenzuela et al 2026 ApJL 1002 L37. doi:10.3847/2041-8213/ae6076
The post Featured Image: Chasing Weywot’s Shadow appeared first on AAS Nova.
]]>
A recent study looks at the star and dust morphologies across samples of massive galaxies to understand how dusty star-forming galaxies fit into the picture of massive galaxy evolution.
The post Hints for Massive Galaxy Evolution from Dusty Star-Forming Galaxies appeared first on AAS Nova.
]]>How do massive galaxies form and evolve? A recent study traces the stellar and dust distributions across evolutionary phases of massive galaxies to better understand how massive dusty star-forming galaxies fit into the picture.
Dusty Massive Galaxies
Massive galaxies, like the Milky Way or even larger, undergo phases of active star formation and quiescent phases of inactivity, but exactly how these galaxies evolve through these stages is not yet fully understood. Dusty star-forming galaxies, which are undergoing a period of intense star formation and shrouded in dust, might be the missing evolutionary step between star-forming and quiescent phases of massive galaxy evolution.
Currently, the leading explanation for massive galaxy formation and evolution is inside-out growth — star formation and quenching start in the inner regions of a galaxy and progress outward. However, it’s not clear whether dusty star-forming galaxies also follow the favored inside-out pathway, or if they instead proceed outside-in, first growing their disks and then assembling a central bulge.
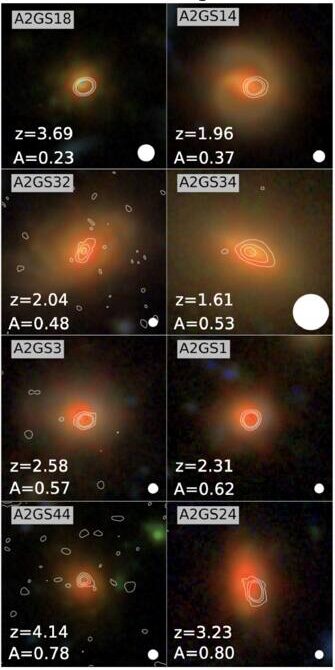
Example of JWST NIRCam images with ALMA contour lines overlaid for select dusty star-forming galaxies in the sample. [Modified from Bodansky et al 2026]
Multiwavelength Morphological Comparisons
To directly compare the star and dust morphologies across massive galaxies, Sarah Bodansky (University of Massachusetts, Amherst) and collaborators selected a sample of 33 dusty star-forming galaxies from the GOODS-ALMA 2.0 survey that searched the sky for 1.1-mm dust emission as well as star-forming and quiescent comparison samples drawn from JWST observations. Combining the ALMA survey data with JWST imaging, the authors studied the rest-frame optical (stars) and rest-frame near-infrared (dust) morphologies of dusty, star-forming, and quiescent galaxies at redshifts around cosmic noon (a few billion years after the Big Bang).
When comparing optical morphologies, the authors found that dusty star-forming galaxies and typical star-forming galaxies had similar distributions, but their near-infrared morphologies showed clear differences. Dusty galaxies tended to show more compact near-infrared emission, with dust tracing their stellar populations and more concentrated in the galaxies’ central regions. Though clearly different from star-forming galaxies, the authors noted striking similarities between the near-infrared morphologies of the dusty star-forming and quiescent galaxies, especially within their centers.
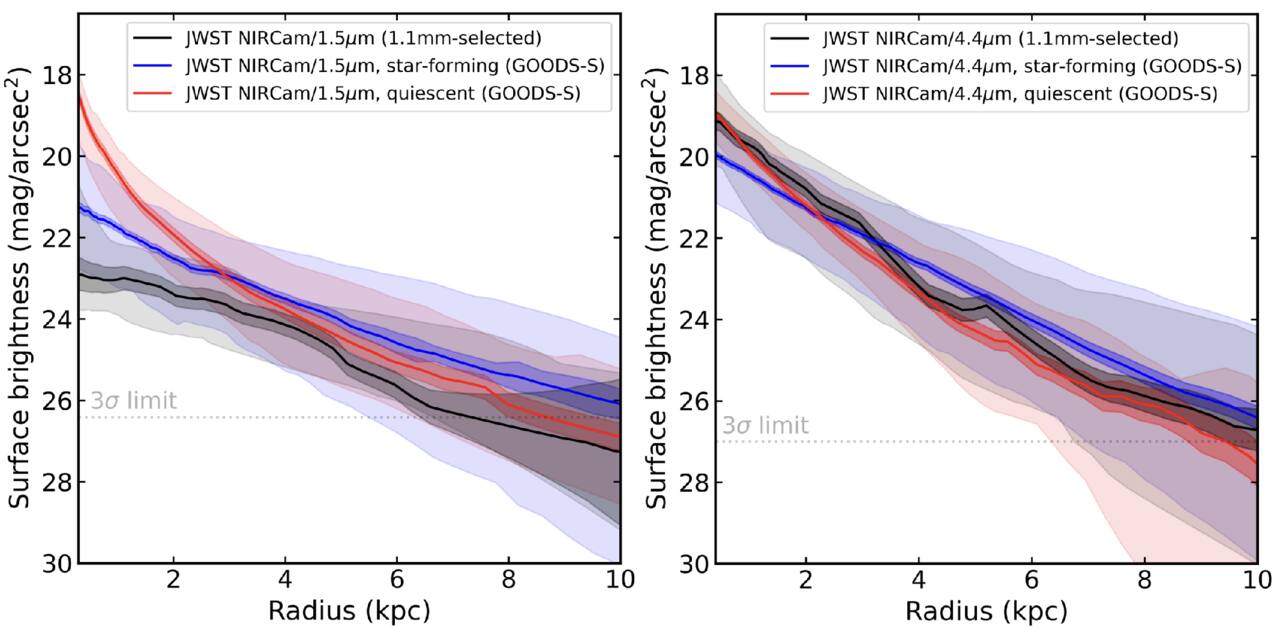
Average surface brightness profiles for the rest-optical (left) and rest-near-infrared (right) for the dusty (black), star-forming (blue), and quiescent (red) galaxies. In the near-infrared, the dusty star-forming galaxy profile appears very similar to the quiescent galaxy profile. [Bodansky et al 2026]
Citation
“JWST+ALMA Reveal the Buildup of Stellar Mass in the Cores of Dusty Star-forming Galaxies at Cosmic Noon,” Sarah Bodansky et al 2026 ApJ 1001 235. doi:10.3847/1538-4357/ae4f64
The post Hints for Massive Galaxy Evolution from Dusty Star-Forming Galaxies appeared first on AAS Nova.
]]>
During its commissioning phase, the highly anticipated Vera C. Rubin Observatory serendipitously spotted the third known interstellar object.
The post Interstellar Comet 3I/ATLAS Through the Eyes of Rubin Observatory appeared first on AAS Nova.
]]>The NSF–DOE Vera C. Rubin Observatory has yet to begin its 10-year Legacy Survey of Space and Time, but it’s already keeping an eye on the sky. Astronomers recently described Rubin’s serendipitous spotting of 3I/ATLAS days before the interstellar object’s discovery.
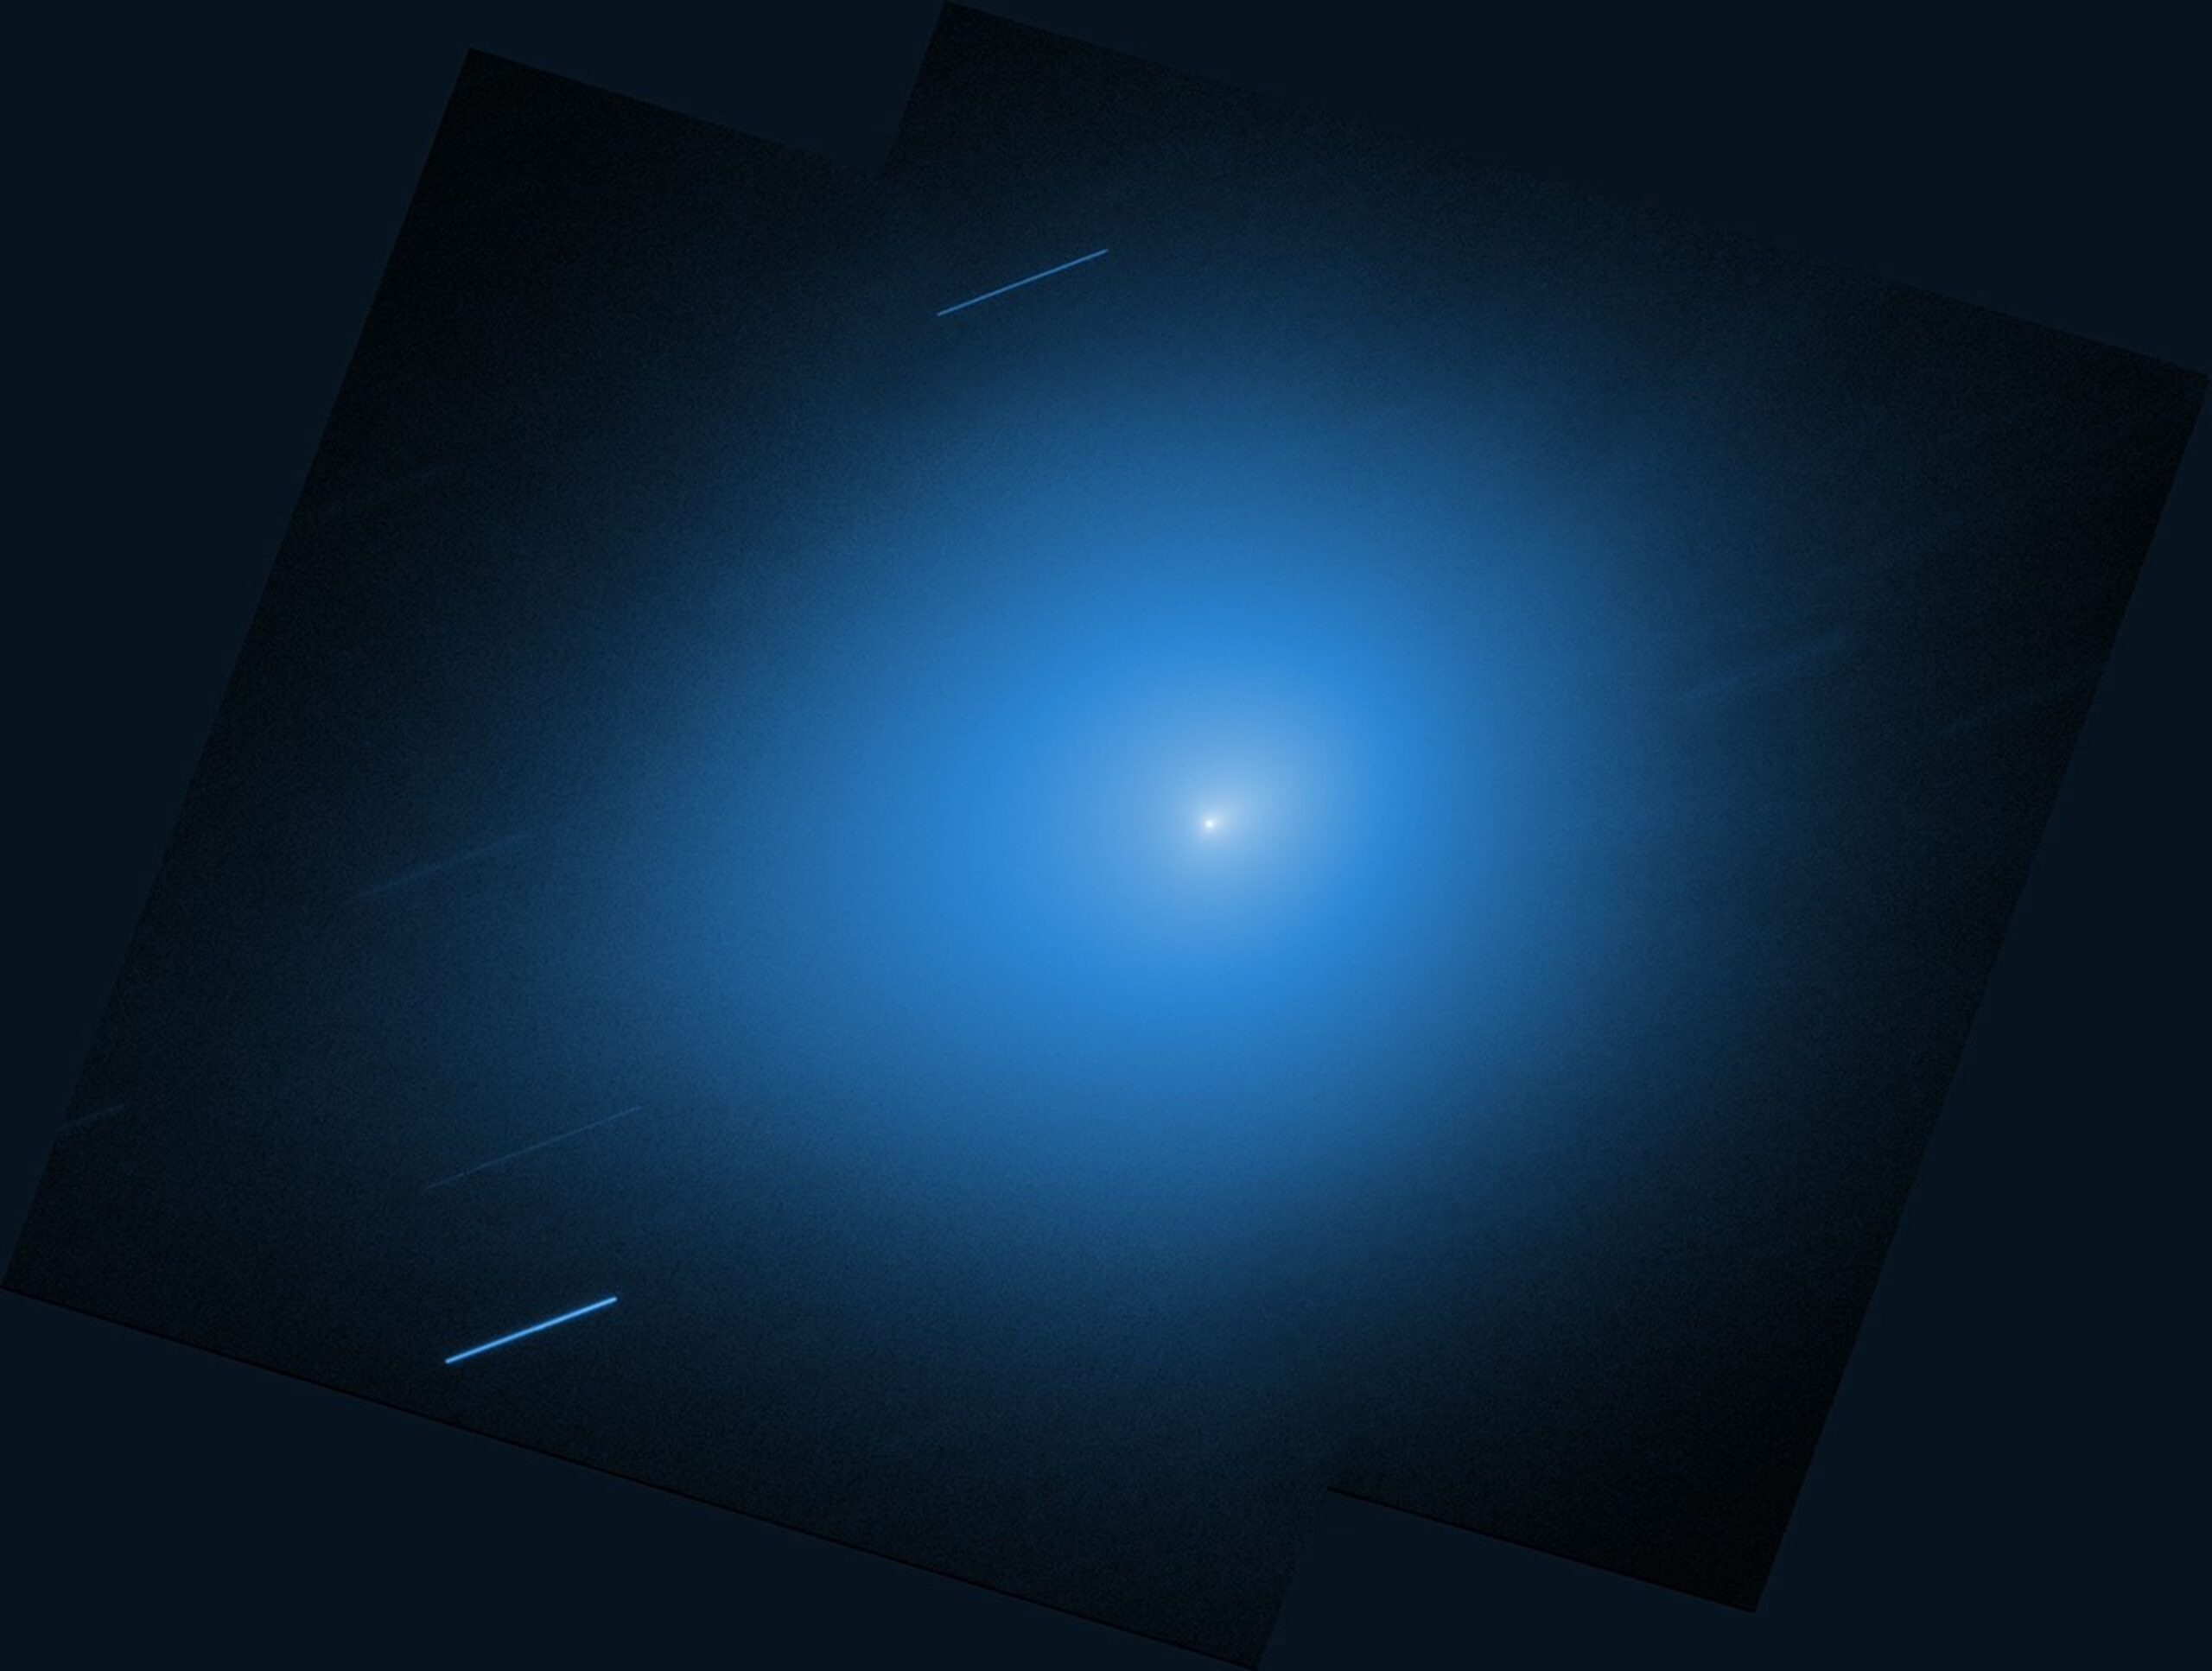
Interstellar comet 3I/ATLAS as seen by the Hubble Space Telescope on 30 November 2025. [NASA, ESA, STScI, D. Jewitt (UCLA), M.-T. Hui (Shanghai Astronomical Observatory). Image Processing: J. DePasquale (STScI)]
Welcome, 3I/ATLAS
Our solar system has been playing host to a rare interstellar tourist: 3I/ATLAS. Just the third known interstellar object to have passed through our star system, 3I/ATLAS was discovered on 1 July 2025 by the robotic telescope network of the Asteroid Terrestrial-impact Last Alert System (ATLAS). After making its closest approach to the Sun in October 2025, 3I/ATLAS is now journeying out of the solar system and is currently located beyond the orbit of Jupiter.
While astronomers would likely grumble about hosting a human guest for nearly a year, they’ve been thrilled with 3I/ATLAS’s lengthy visit and have turned countless telescopes toward the rare interstellar object. They’ve also turned to the archives, searching for pre-discovery sightings of the object — and finding them in the commissioning data from one of the most highly anticipated observatories on the planet: Rubin Observatory.
A Serendipitous Sight
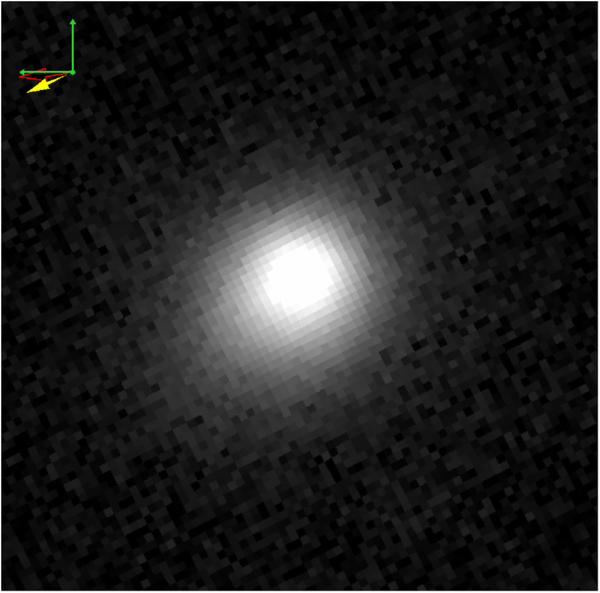
3I/ATLAS as seen by Rubin Observatory on 3 July 2025. [Chandler et al. 2026]
For most of 2025, Rubin was in its commissioning phase, carrying out science validation observations — a critical period during which instruments, procedures, and pipelines are fine tuned, and the quality and quantity of data collection can vary. On 20 June 2025, the very first night of its science validation survey, Rubin happened to turn toward the small patch of sky containing the as-yet undiscovered 3I/ATLAS.
More to Come
In a recent article, Colin Orion Chandler (LSST Interdisciplinary Network for Collaboration and Computing Frameworks; University of Washington) and collaborators described how they tracked down 3I/ATLAS in Rubin’s commissioning data after the object’s discovery was announced. In total, the observatory serendipitously spotted 3I/ATLAS nine times between 21 June and 2 July, then several more times — some on purpose, some by chance — between 3 and 20 July.
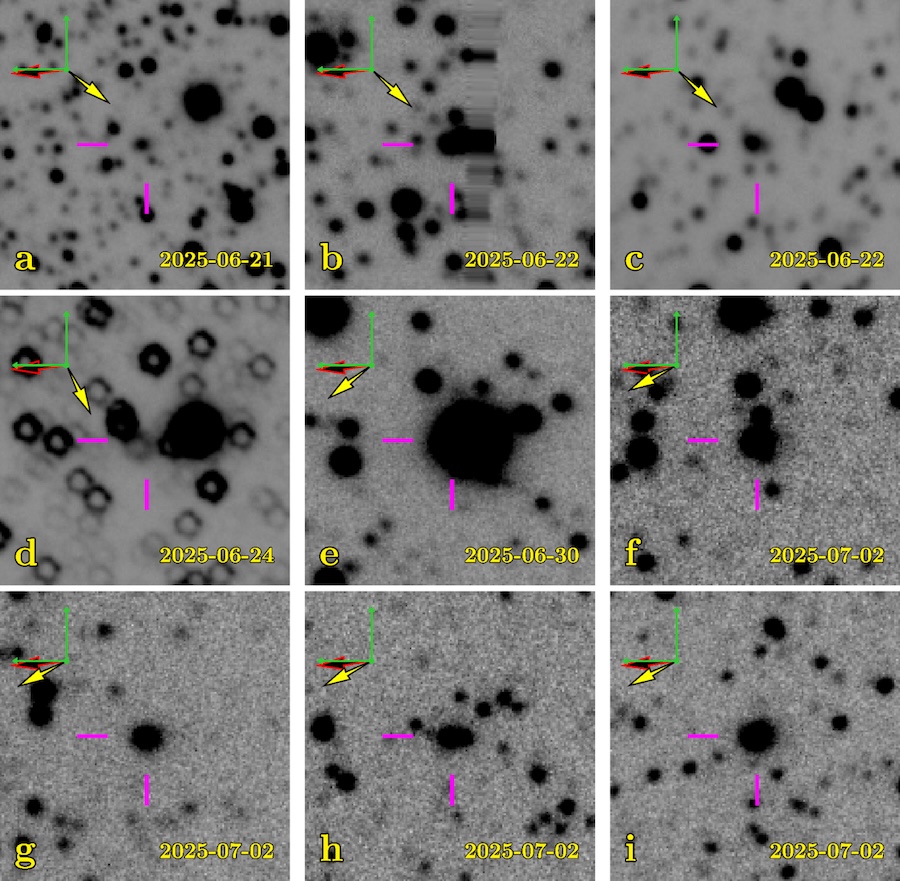
Serendipitous observations of 3I/ATLAS by Rubin. [Chandler et al. 2026]
In their analysis of Rubin’s observations of 3I/ATLAS, Chandler and collaborators found that had the science validation survey started sooner, and had the analysis pipelines been operational, Rubin might have been the first to welcome humanity’s third interstellar visitor. Findings like these heighten the anticipation for the start of the Legacy Survey of Space and Time, during which Rubin will surely build upon its already impressive record of interstellar object observations.
Citation
“NSF-DOE Vera C. Rubin Observatory Observations of Interstellar Comet 3I/ATLAS (C/2025 N1),” Colin Orion Chandler et al 2026 ApJL 1001 L35. doi:10.3847/2041-8213/ae4b3a
The post Interstellar Comet 3I/ATLAS Through the Eyes of Rubin Observatory appeared first on AAS Nova.
]]>
Astrobites reports on how JWST may be the key to finding moons around planets beyond our solar system.
The post Hunting for Exomoons Around a Lonely Planet appeared first on AAS Nova.
]]>Editor’s Note: Astrobites is a graduate-student-run organization that digests astrophysical literature for undergraduate students. As part of the partnership between the AAS and astrobites, we occasionally repost astrobites content here at AAS Nova. We hope you enjoy this post from astrobites; the original can be viewed at astrobites.org.
Title: A Deep Search for Exomoons Around WISE 0855 with JWST
Authors: Mikayla J. Wilson et al.
First Author’s Institution: University of California, Santa Cruz
Status: Published in AJ
The “Moon”-umental Question
The solar system hosts hundreds of moons, ranging from volcanic worlds like Io around Jupiter, to icy objects like Enceladus around Saturn, to captured objects like Neptune’s retrograde moon Triton. Moons are essential to our model of how the solar system formed and also offer some of the best chances we have for finding life beyond Earth.
Astronomers also expect exomoons, or moons orbiting planets outside the solar system, to be abundant around other giant exoplanets. But how common are exomoons? How do they compare to the moons in our solar system?
In order to begin answering those questions, we must first detect an exomoon, which has proved difficult despite decades of searching by astronomers. Fortunately, JWST presents a new opportunity to uncover the exomoon population by looking at lonely free-floating planets as they drift through space.
Why Free-Floating Planets?
One proposed method for searching for exomoons is by looking for their transits in front of their host planets, characterized by the dips in brightness of the planet as the moon passes in front, blocking the planet’s light. Looking for exomoon transits around planets orbiting stars is quite difficult, as the bright starlight can easily drown out the small signals of exomoon transits. Free-floating planets solve this issue by removing the star entirely, increasing our sensitivity to such detections. (See this bite for a good review.)
The authors of today’s article directed the exomoon hunt towards the free-floating WISE J085510.83-071442.5 (or WISE 0855). It has the prestige of being the coldest known brown dwarf (250–285K) while also sitting at a relatively low mass (3–10 Jupiter masses). Notably, it is also one of our closest neighbors at a distance of only 7.4 light-years, making it ideal for high-precision observations despite its faintness. Even though brown dwarfs are technically distinct from planets, the authors opt to refer to companions around WISE 0855 as moons given WISE 0855’s “planetary-mass” status. (It’s complicated…)
Repurposing JWST Data… for Moons!
The JWST observations used in this study contain 11 hours of near-infrared (2.87–5.27 microns) time-series spectra originally intended to study water clouds and weather on WISE 0855. Time-series brightness monitoring can also be used for transit searches, which the authors take advantage of.
One complication is that WISE 0855 is variable, meaning its intrinsic brightness changes over time. Variability is likely driven by clouds and other dynamic processes within its atmosphere. So how do the authors distinguish between a passing moon and a turbulent atmosphere? The key idea is that variability is wavelength dependent, meaning that the brightness of WISE 0855 will fluctuate differently depending on the observed wavelength. In contrast, transits are “gray,” meaning that the same amount of light is blocked at all wavelengths, producing a consistent feature across the entire spectrum.
Finding Moons with Statistics!
The authors apply this idea and pick out two wavelength regions of WISE 0855’s spectrum that contain two distinct variability patterns, which should both contain an identical moon transit signal (if present). They then generate a light curve (how brightness changes over time) for these two regions (see Fig. 1).
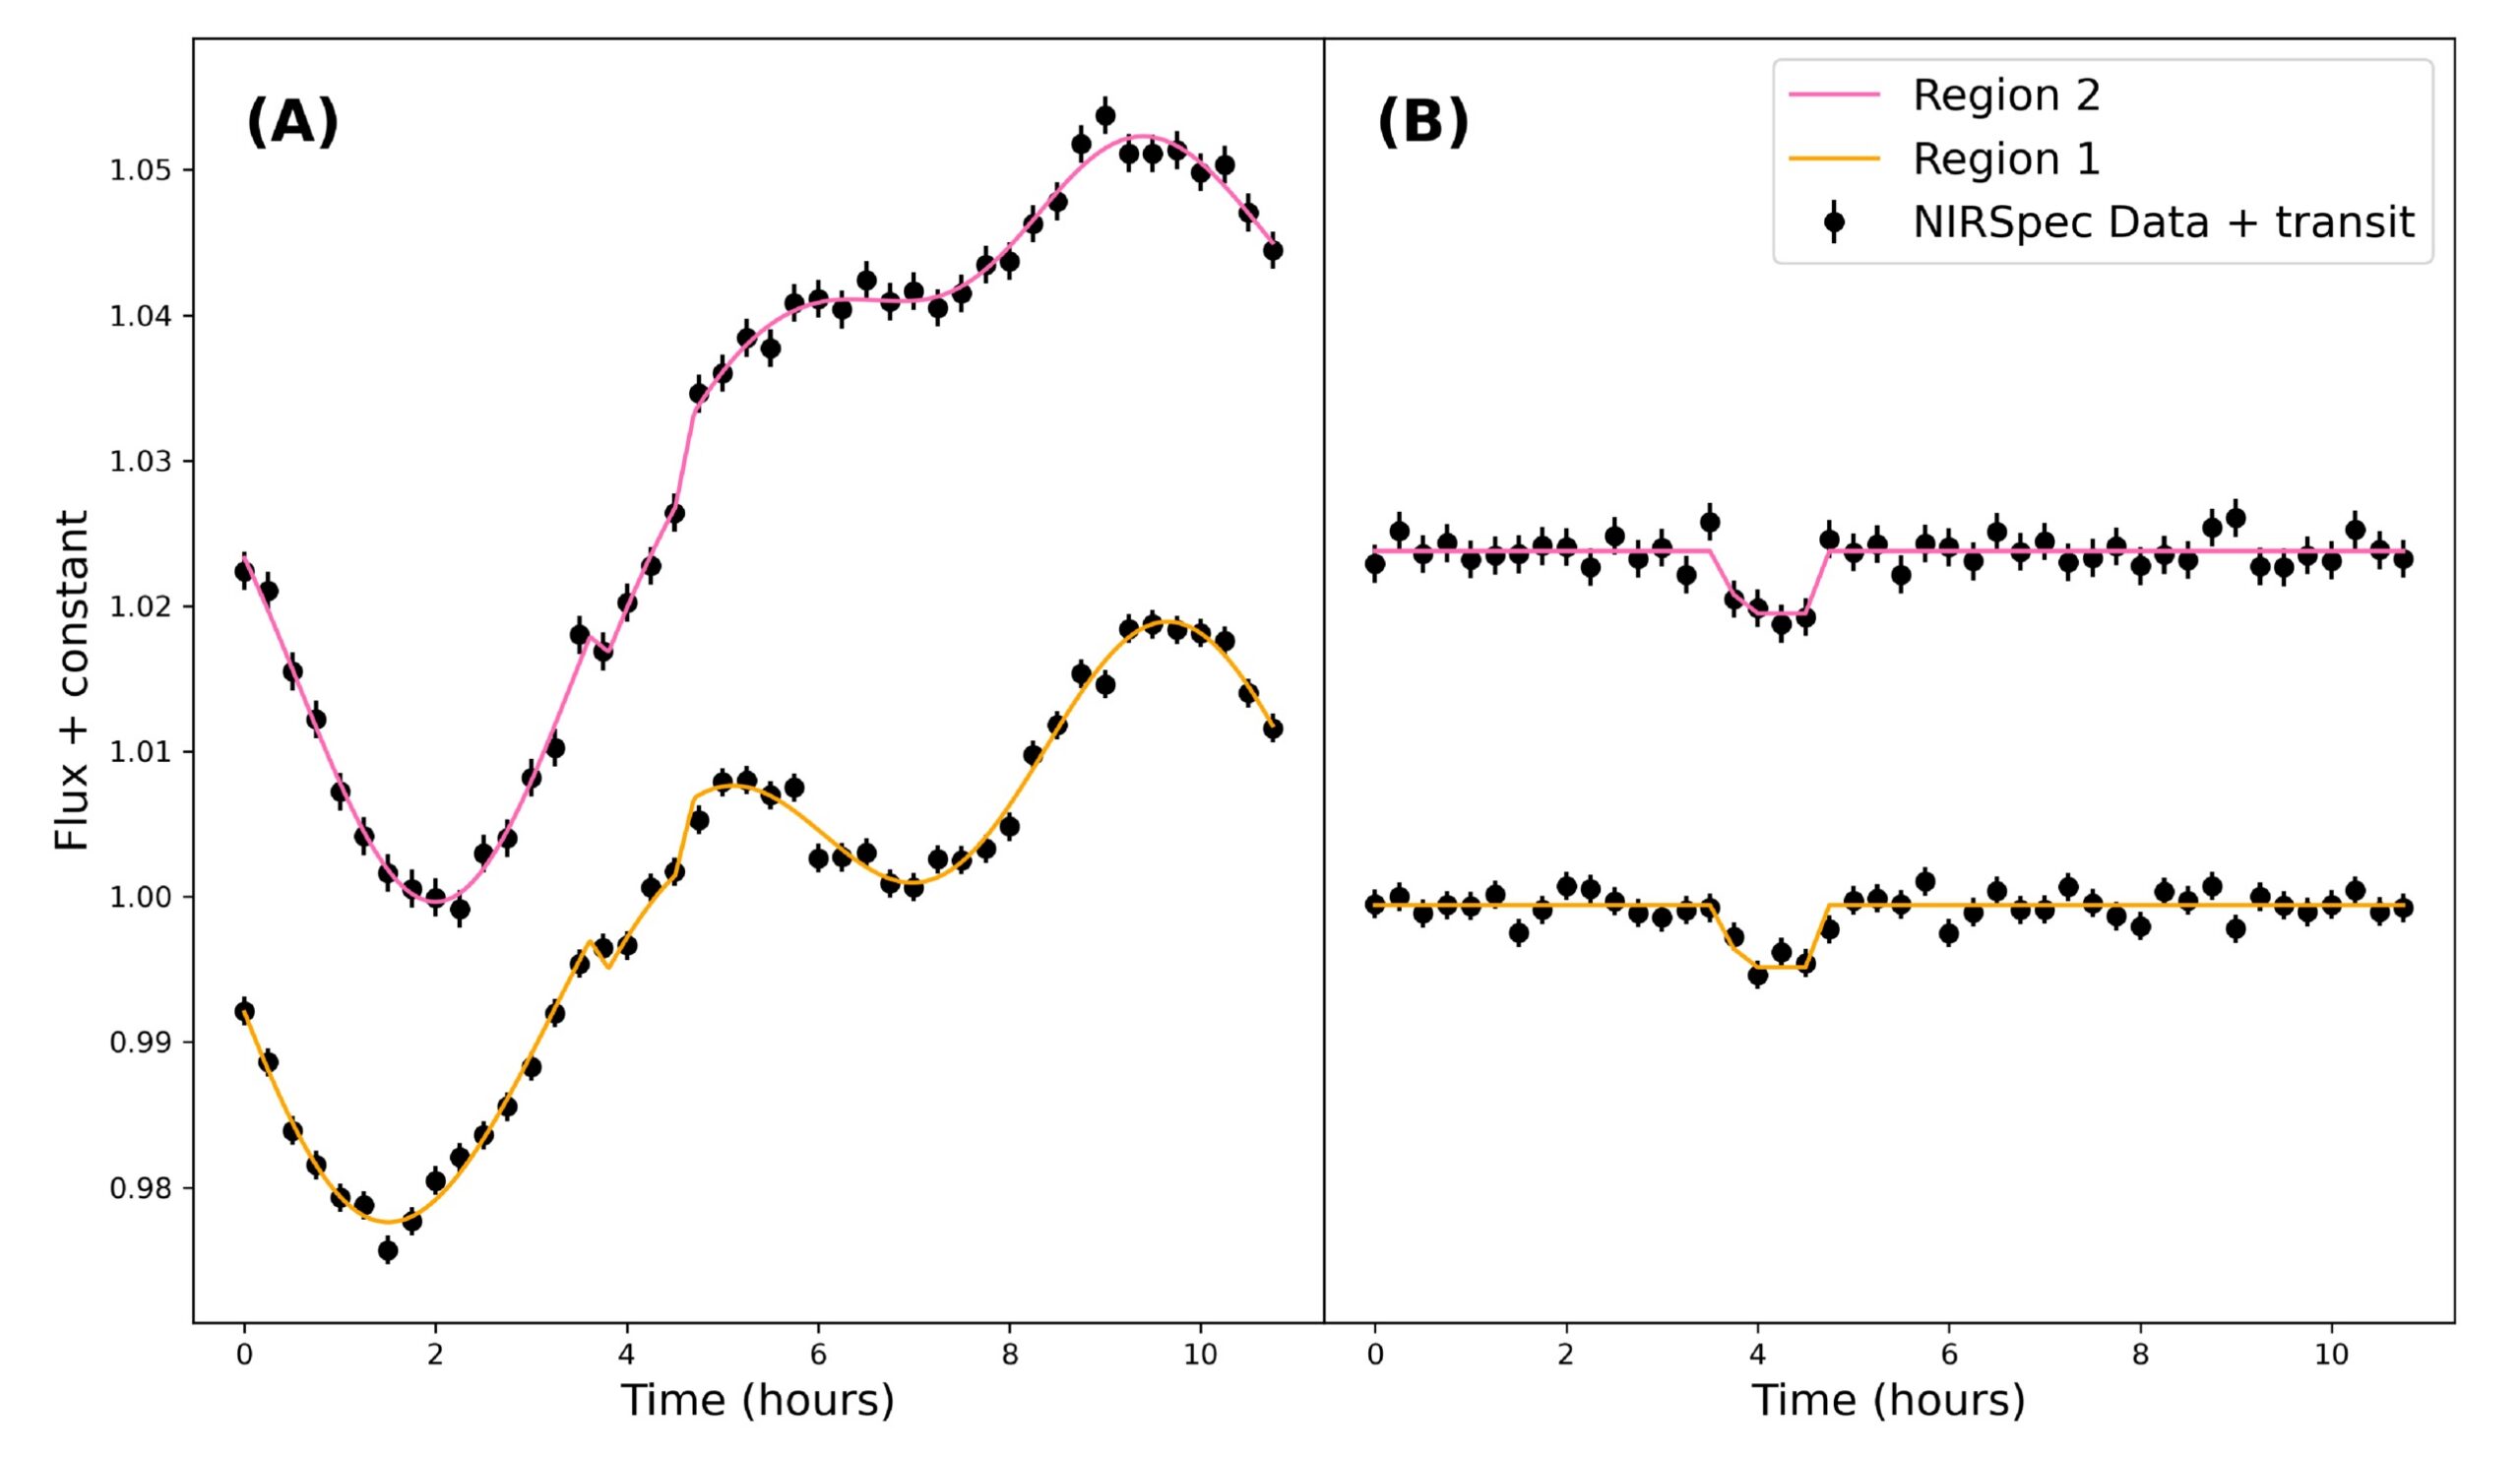
Figure 1: (A) Light curves from two selected wavelength regions of WISE 0855’s spectrum with injected transit signals. Also plotted is the best-fit Gaussian processes + transit model for the two light curves. (B) Light curve data after subtracting the Gaussian processes portion of the best-fit model, revealing the example injected transit signals. [Wilson et al. 2025]
- Gaussian processes–only model: Assumes that all observed variability is intrinsic to the planet itself
- Gaussian processes + transit model: Includes a simple trapezoidal exomoon transit signal that is simultaneously fit in both light curves
Using Bayesian evidence (a measure of how well each model explains the data), they determined which model was favored. So, what do they find?
The Bad News and the Good News
Based on Bayesian evidence, the authors conclude that there are no statistically significant detections of exomoons in the data. The results suggest very weak evidence for a ~0.53-Earth-radius moon at a wide separation from WISE 0855 — an unlikely scenario given that transit probability decreases at greater separations (and therefore longer orbital periods).
Yet, the study goes further: What kinds of moons is JWST able to detect, if any? To answer this, the authors performed injection and recovery tests, where they injected artificial transit signals of varying depths (exomoon sizes) into the data and tested how well their models were able to recover them (results shown in Fig. 2). They find that JWST is capable of detecting 96% of transits with depths ≥0.5%, equivalent to a Titan-like moon. Smaller Io-like moons were also detectable more than half of the time. This means that if a Titan analog had actually transited during these observations, we would almost certainly have seen it!
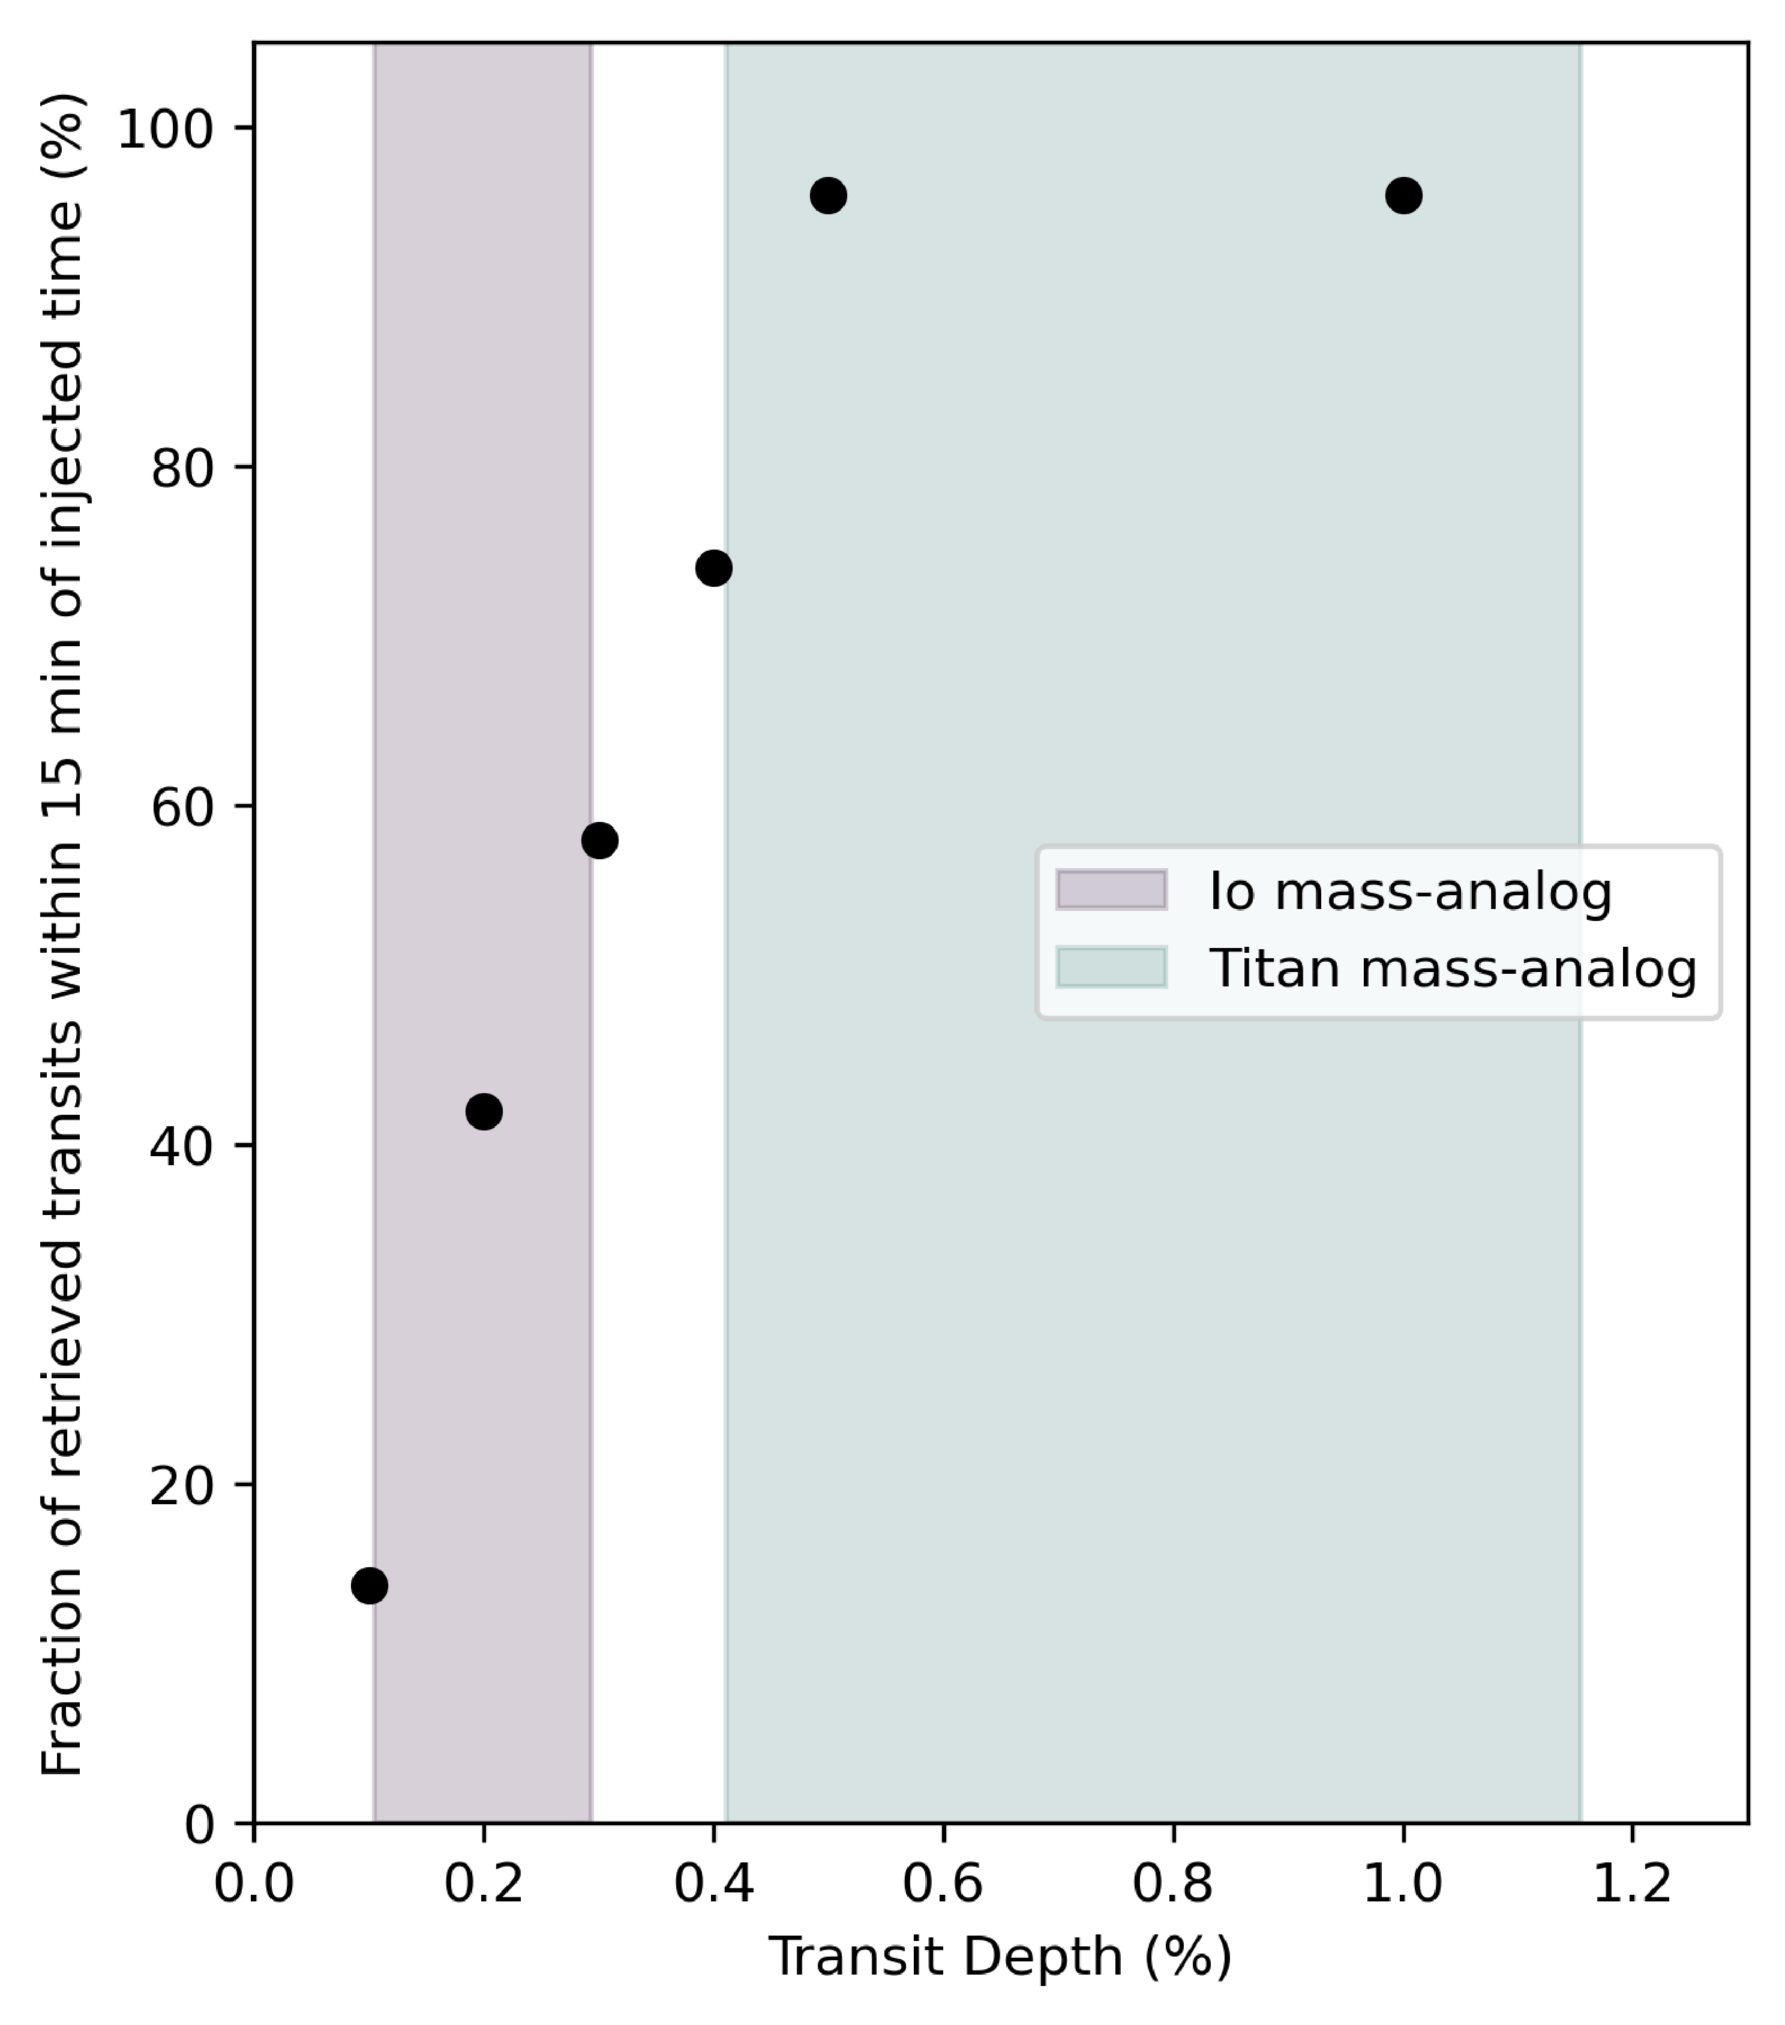
Figure 2: Results showing the number of successful detections for the transit injection and recovery tests. Fifty transit injections are done for transit depths of 1%, 0.5%, 0.4%, 0.3%, 0.2%, and 0.1%. The transit depths represent different exomoon sizes, with the shaded regions representing Io-like and Titan-like moons. [Wilson et al. 2025]
Original astrobite edited by Kelsie Taylor.
About the author, Jared Bull:
I am a 2nd-year PhD student at Johns Hopkins University. I study brown dwarf variability and am interested in using time-series observations to uncover dynamic processes within their atmospheres. In my free time I like to read, cook, and do astrophotography.
The post Hunting for Exomoons Around a Lonely Planet appeared first on AAS Nova.
]]>
New observations from JWST and the Very Large Telescope illuminate the dark feature at the center of a galaxy cluster's brightest occupant.
The post Into the Void: Investigating the Heart of a Giant Elliptical Galaxy appeared first on AAS Nova.
]]>The core of the brightest galaxy in the cluster Abell 402 contains a curious void. New observations suggest that an ultra-massive black hole could have excavated this feature.
At the Center of the Center of a Cluster
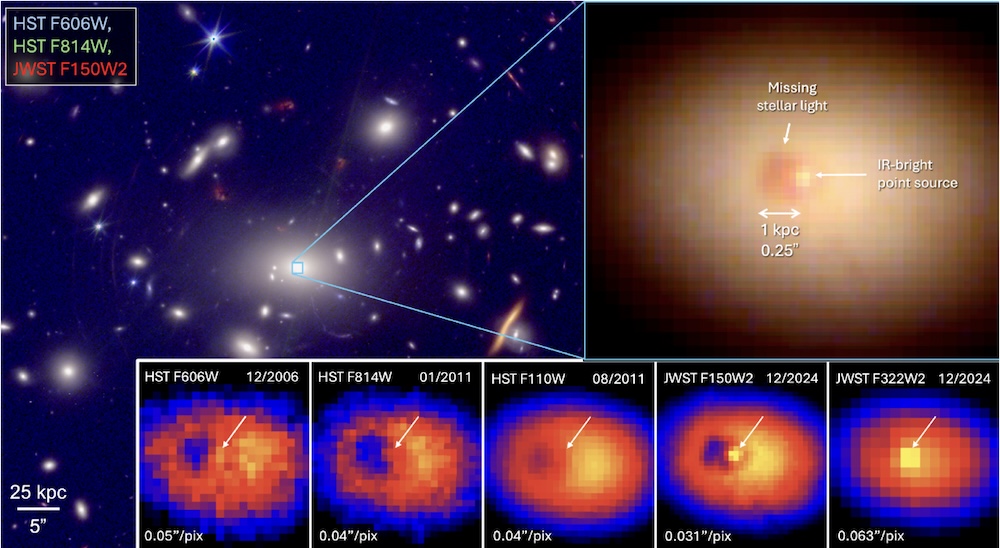
JWST and Hubble observations of A402-BCG. In addition to the dark cavity previously seen by Hubble, the galaxy’s center hosts an infrared-bright source. Click to enlarge. [McDonald et al. 2026]
In a recent research article, a team led by Michael McDonald (Massachusetts Institute of Technology) investigated this dark region to test the dust-cloud hypothesis and explore other explanations.
McDonald’s team compiled new JWST Near-Infrared Camera data, archival Hubble imaging, and spectroscopy from the Multi Unit Spectroscopic Explorer (MUSE) on the Very Large Telescope. The new JWST images show a prominent dark feature at the center of A402-BCG, plus a bright source directly beside it.
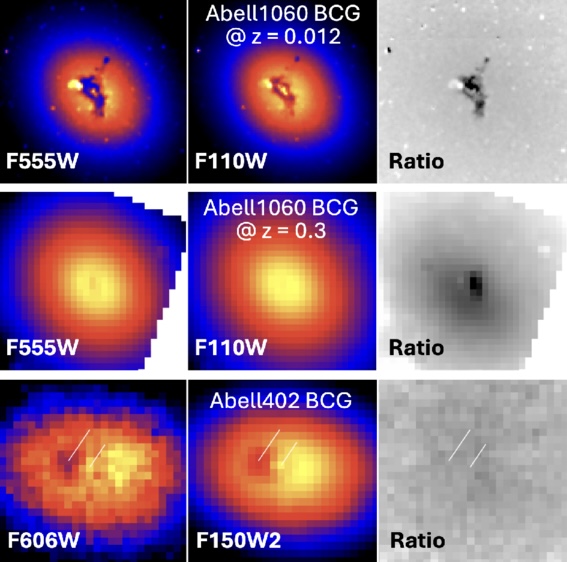
Comparison of the cavity in A402-BCG (bottom row) to the dust ring in Abell 1060’s central galaxy (top row). In the middle row, simulated observations show Abell 1060’s central galaxy at A402-BCG’s redshift. The appearance of the dust ring is wavelength dependent, but the appearance of A402-BCG’s cavity is not. [Adapted from McDonald et al. 2026]
Not Hidden, but Missing
If the dark feature at the center of A402-BCG is a dust cloud, the cloud would be less obscuring at the near-infrared wavelengths captured by JWST than at the optical wavelengths sampled by Hubble. However, the feature was equally dark in the JWST images, leading the team to rule out the dust-cloud hypothesis.
Instead, they favor a scenario in which the dark feature is due to an absence of stars rather than the presence of obscuring dust. The team estimated that 2 billion solar masses of stars are missing — equivalent to 1% of the stellar mass of the galaxy. What’s more, the cavity is situated in a larger region of constant surface brightness called a core, in which there are fewer stars than expected.
The Dynamical History of A402-BCG
McDonald and coauthors suggested that the missing stars in A402-BCG’s core and cavity were ejected by at least one supermassive black hole binary. They estimated that the core region, which is roughly 6,500 light-years across, was excavated by a 50 billion solar mass black hole. This epic black hole may be the result of a past merger and is likely located at the infrared-bright spot on the border of the cavity, as this source’s spectral energy distribution resembles that of an actively accreting black hole.
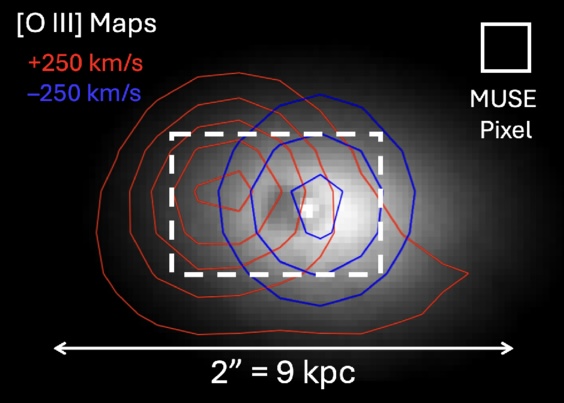
MUSE observations of highly ionized gas in A402-BCG. The blueshifted source on the right coincides with the infrared-bright source, while the redshifted source on the left appears to be embedded within a larger ionized envelope. [Adapted from McDonald et al. 2026]
The team favors a scenario in which these black holes are slowly spiraling toward one another, ejecting stars from the galaxy’s center as they move and carving out a deep deficit of stars. This stellar cavity sits within a larger region of stellar scarcity that was scooped out by a past supermassive black hole merger that created the ultra-massive black hole present in the galaxy today. Simulations suggest that only about 0.5% of massive galaxies are in this phase of evolution at a time, so we may have caught A402-BCG in a fascinating moment — one that provides new clues about how to search for ongoing black hole mergers in other galaxies.
Citation
“A Kiloparsec-Scale Stellar Cavity in the Center of A402-BCG May Be Caused by Dynamic Interactions with an Ultramassive Black Hole,” Michael McDonald et al 2026 ApJL 1002 L19. doi:10.3847/2041-8213/ae5bbe
The post Into the Void: Investigating the Heart of a Giant Elliptical Galaxy appeared first on AAS Nova.
]]>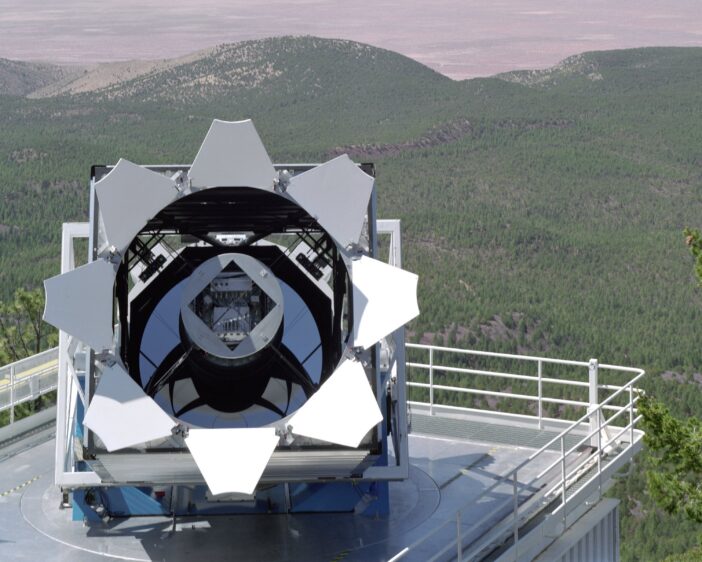
More than a quarter century ago, the Sloan Digital Sky Survey fundamentally changed the way modern astronomy research is done. The collaboration recently released their summary of the fifth generation of their landmark survey.
The post A New View of the Spectroscopic Universe appeared first on AAS Nova.
]]>The Sloan Digital Sky Survey (SDSS) fundamentally changed the way modern astronomy research is done. This “grand and bold thing” is not frozen in a museum exhibit, however: instead, the SDSS telescopes and team have continued to iterate. The collaboration recently described the fifth generation of this groundbreaking survey in The Astronomical Journal.
Roots in History
Astronomy is now without question a “big data” science. While a lucky few researchers still occasionally travel to distant mountaintops to sojourn with the stars, most astronomers who can describe their work as “observational” rarely ever leave their laptops. Petabytes of historical data, including images, spectra, enormous simulation archives, and more, are available the instant one’s fingers touch a keyboard. As a result, the speed of discovery has increased exponentially, and the barriers to cutting-edge research have dramatically shrunk.
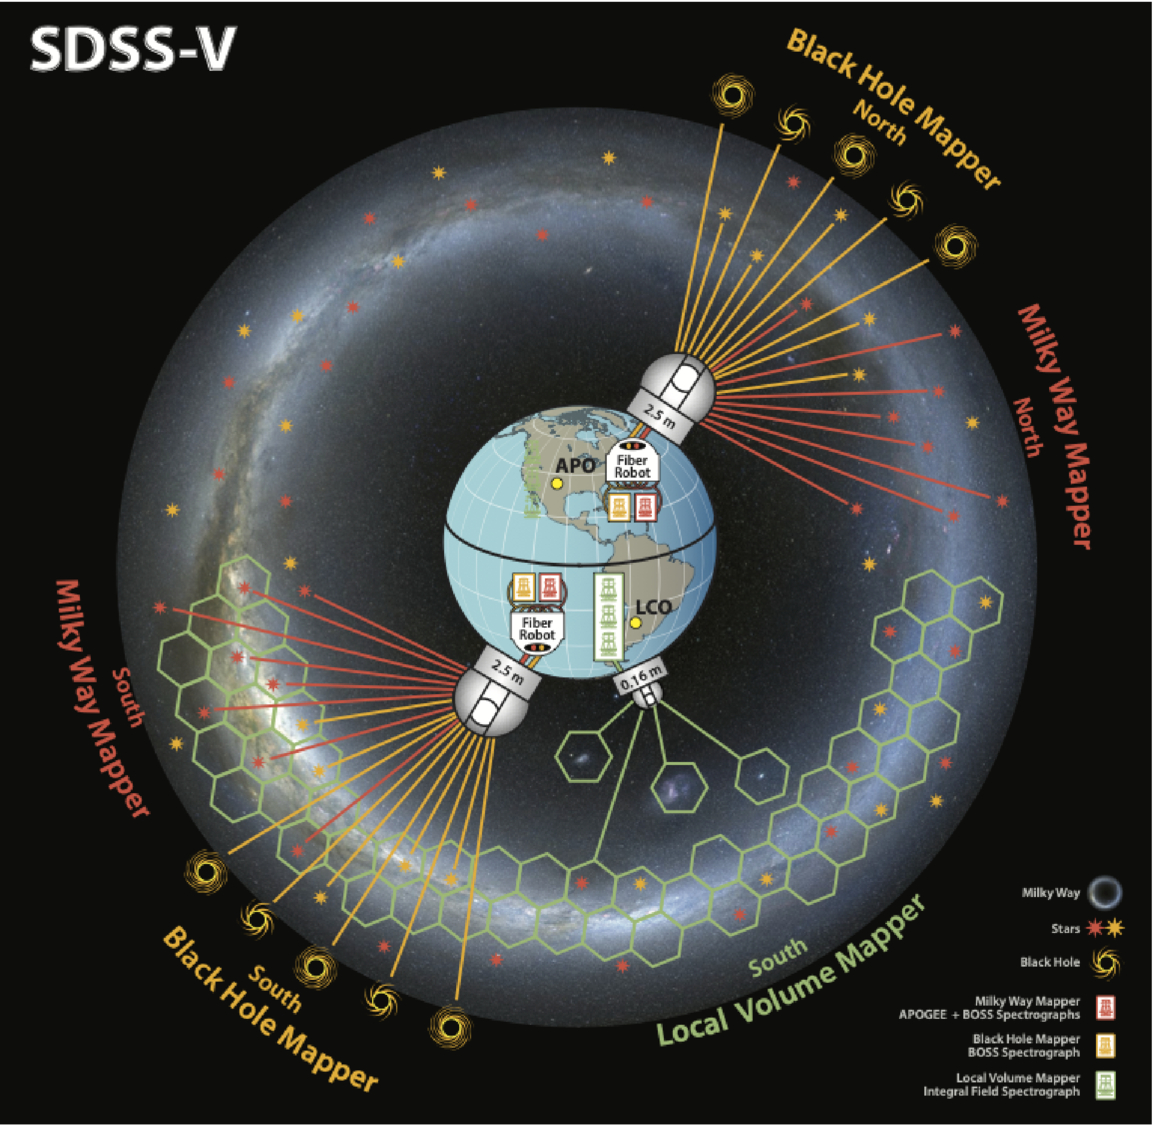
A schematic of the SDSS-V survey facilities and targets. Click to enlarge. [Kollmeier et al. 2026]
While SDSS’s twin 2.5-meter telescopes (one in New Mexico and one in Chile, allowing the survey to observe the entire sky) are dwarfed by Rubin’s 8-meter mirror, there is still thrilling science to be done with these moderate-sized observatories. This is especially true after a series of upgrades to the spectrographs and thanks to a deep expertise in not only survey-style science, but also in project management and survey planning. In 2021, in the middle of COVID-19 delays and distancing requirements, the team began upgrades to their existing facilities and construction of a brand new telescope to kick off the latest survey, SDSS-V.
The Next Generation
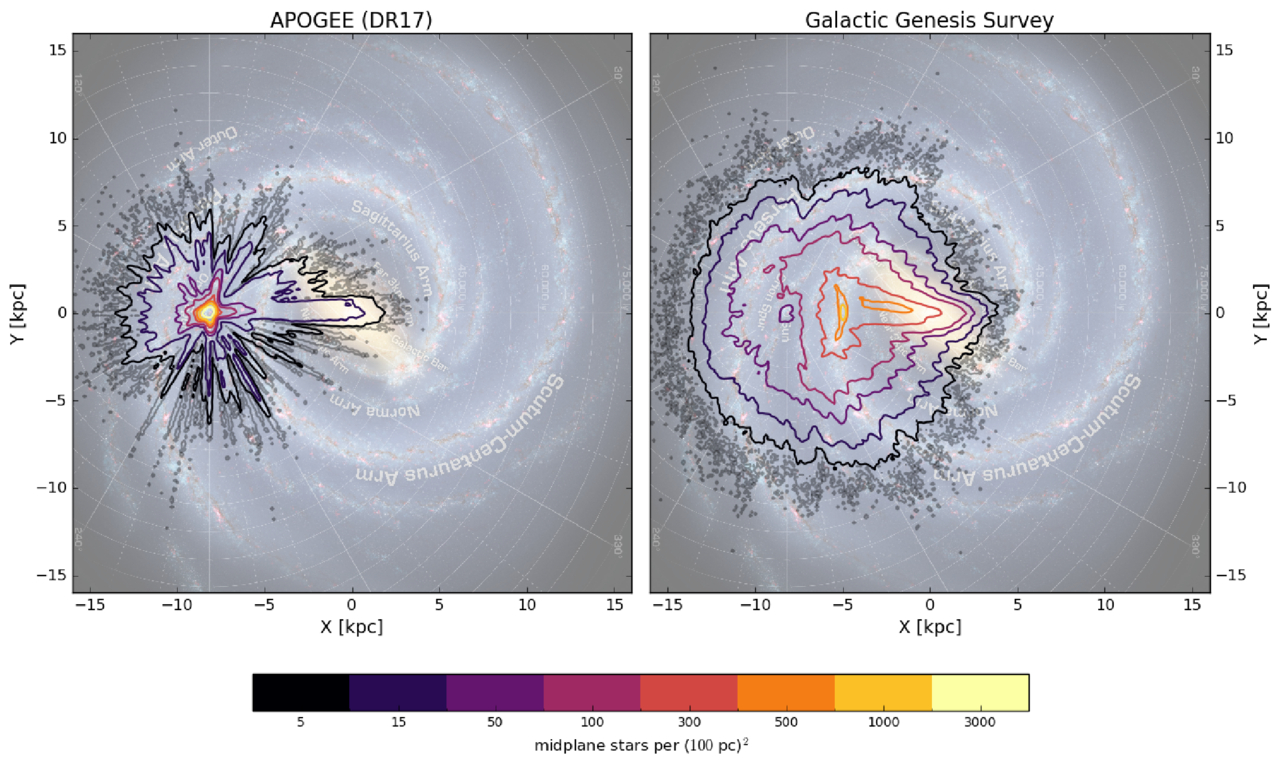
The density of target stars for the SDSS-V survey compared to a previous spectroscopic survey. Click to enlarge. [Kollmeier et al. 2026]
By the end of the survey, SDSS-V will have collected optical and near-infrared spectra for roughly 6 million objects spread across the whole sky, as well as time-series spectra from about a million of these sources. This dataset, which is unprecedented in both its spatial and temporal coverage, will allow researchers to probe questions ranging from how quasars evolve over time to how commonly young stars have brown-dwarf companions. Long since SDSS initiated the era of industrial survey astronomy, this latest publication shows how the survey continues to lead the way.
Citation
“Sloan Digital Sky Survey. V. Pioneering Panoptic Spectroscopy,” Juna A. Kollmeier et al 2026 AJ 171 52. doi:10.3847/1538-3881/ae0576
The post A New View of the Spectroscopic Universe appeared first on AAS Nova.
]]>
Recent work explores whether a commonly assumed source of data–model disagreement in simulations of stellar interiors is really to blame.
The post Simulations of Turbulent Mixing Close One Gap but Open Another appeared first on AAS Nova.
]]>Nature sometimes behaves in ways that are difficult to recreate in simulations. New research tackles the computational challenge of turbulent mixing and rules out a commonly assumed source of data–model disagreement.
Mixing Up Stellar Interiors
What do Earth’s oceans, red giant stars, and white dwarfs have in common? These are all sites of thermohaline mixing, a form of turbulent mixing that takes place when there is a vertical gradient in both temperature and chemical composition. For example, in Earth’s oceans, water near the surface is warmer and saltier than water in the depths below, setting up an unstable situation prone to mixing.
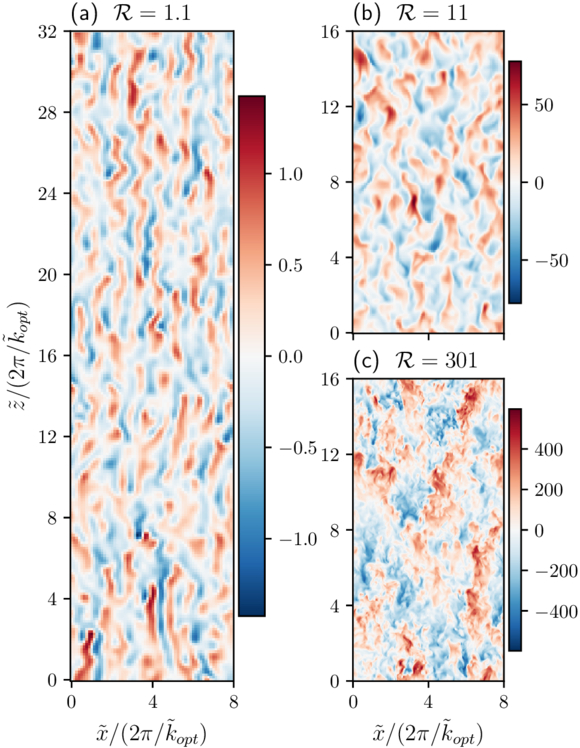
Examples of simulated thermohaline convection. These snapshots show the vertical velocity across a slice through the simulation volume. Click to enlarge. [Fraser 2026]
One of the most important parameters for modeling mixing is the Prandtl number, Pr, which is the ratio of viscosity to thermal diffusivity (in other words, a way of describing whether momentum or heat diffuses more quickly within a fluid). For stellar interiors, Pr is around 10−6, but computational limitations have prevented modelers from setting this value lower than around 10−2. When tensions between models and reality arise, this gap between simulated and realistic Pr values is often assumed to be the source of the mismatch.
Bridging the Prandtl Number Gap
In a recent research article, Adrian Fraser (University of Colorado Boulder) aimed to test this assumption. Fraser carried out 3D simulations of thermohaline mixing, using a semi-implicit modeling technique that lowered the computational cost and allowed the simulations to probe Pr values of 10−1, 10−2, 10−3, 10−6, and 0.
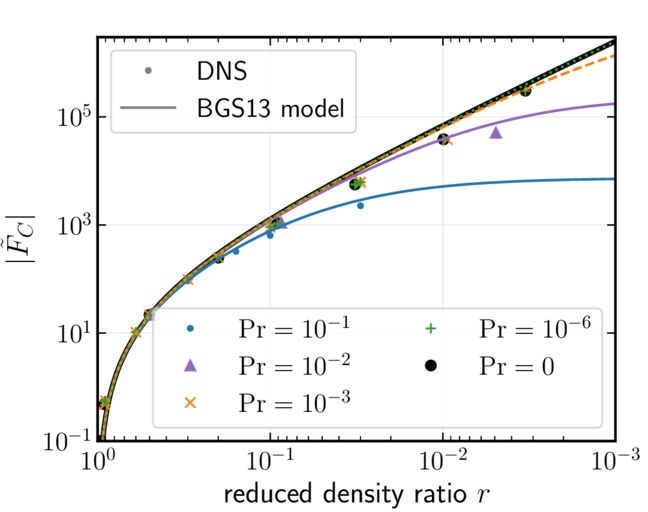
Turbulent compositional flux as a function of reduced density ratio for the simulations from this work (DNS) and the benchmark model of thermohaline convection (BGS13). Click to enlarge. [Adapted from Fraser 2026]
Recreating Reality
Where does this leave modelers attempting to recreate the reality of stellar interiors? First, a silver lining of this investigation: Fraser found that setting Pr = 0 delivered nearly identical results to Pr = 10−6. This suggests that valid results can be attained in a much less computationally intensive way, since setting Pr = 0 lowers the complexity of the simulation. While simulations with Pr = 0 may not be appropriate for all scenarios, including systems with strong magnetic fields, it may provide a way forward in certain situations.
For modeling of red giants and white dwarfs, Fraser suggested that incorporating magnetic fields, stellar rotation, or additional sources of mixing may resolve the current discrepancies. In fact, some modeling work has shown that magnetic fields could entirely close the gap between observations and models for red giant surface abundances — suggesting that bringing models and observations into agreement may be within reach.
Citation
“Bridging the Prandtl Number Gap: 3D Simulations of Thermohaline Convection in Astrophysical Regimes,” Adrian E. Fraser 2026 ApJL 1001 L22. doi:10.3847/2041-8213/ae5796
The post Simulations of Turbulent Mixing Close One Gap but Open Another appeared first on AAS Nova.
]]>
Astrobites reports on whether cosmic clumps are "homegrown" or fueled by fresh inflows.
The post Feed the Fire, Fade the Metals appeared first on AAS Nova.
]]>Editor’s Note: Astrobites is a graduate-student-run organization that digests astrophysical literature for undergraduate students. As part of the partnership between the AAS and astrobites, we occasionally repost astrobites content here at AAS Nova. We hope you enjoy this post from astrobites; the original can be viewed at astrobites.org.
Title: Metal-Poor Star-Forming Clumps in Cosmic Noon Galaxies: Evidence for Gas Inflow and Chemical Dilution Using JWST NIRISS
Authors: et al.
First Author’s Institution: Arizona State University
Status: Published in ApJ
If you want to reconstruct a galaxy’s life story, one of the best “fossil records” is its metallicity. In astronomy this refers to the abundance of elements heavier than helium, which are made in stars and returned to a galaxy’s gas through winds and supernovae. Over time, more star formation usually means more metals mixed into the gas.
Now zoom to Cosmic Noon (roughly when the universe was most actively forming stars). Many galaxies in this epoch look “clumpy”; their star formation is concentrated in several bright knots scattered across the disk. The big question is where those clumps come from. Do they form from the galaxy’s own gas via internal disk instabilities, or do they light up when fresh, metal-poor gas flows in and both fuels star formation and dilutes the local metallicity?
The authors try to answer that question with JWST by measuring the metallicity of each clump relative to its immediate surroundings, rather than comparing clumps to a single galaxy-wide number (which can be misleading if the galaxy has a metallicity gradient).
They use JWST/Near Infrared Imager and Slitless Spectrograph (NIRISS) slitless grism spectroscopy from the CAnadian NIRISS Unbiased Cluster Survey (CANUCS) to study 20 lensed galaxies at redshift 0.6 < z < 1.35. (Lensing effectively acts like a zoom lens, helping to resolve smaller structures.) They focus on emission lines that trace star-forming gas, especially Hα (a star formation tracer) and sulfur lines [SII] and [SIII] (needed for their metallicity method).
Slitless spectra come with a headache: because there is no slit, different parts of a galaxy can overlap in the dispersed image. To make reliable emission-line maps from slitless data, the authors use a forward-modeling code called Sleuth, which allows the continuum to vary across the galaxy.
The authors identify clumps using the Hα map together with rest-frame ultraviolet imaging because these tracers are sensitive to star formation on different timescales: Hα highlights gas ionized by the youngest massive stars, while ultraviolet light traces young stellar light over longer periods. As a result a clump can be bright in one and not the other, especially if dust is involved.
To estimate gas-phase metallicity, they use the “strong-line” method, which infers metallicity from ratios of bright emission lines calibrated using models and empirical samples. Their main diagnostic is S23 = ([SIII] + [SII]) / Hα. Because some line ratios also depend on the ionization state (how strongly the gas is being ionized by young stars), they also use the sulfur ratio S32 = [SIII]/[SII] as a check and iterate to a self-consistent solution.
So, Are Clumps Really Chemically Different from Their Surroundings?
For each clump, the authors measure the metallicity inside the clump and compare it to an annulus just outside the clump (masking neighboring clumps to avoid mixing). When they plot “clump metallicity” versus “local disk metallicity,” most points fall below the 1-to-1 line, meaning the clumps are more metal poor than their surroundings (Figure 1). The mean offset is about 0.1 dex, which corresponds to roughly 20% dilution in the clump gas.
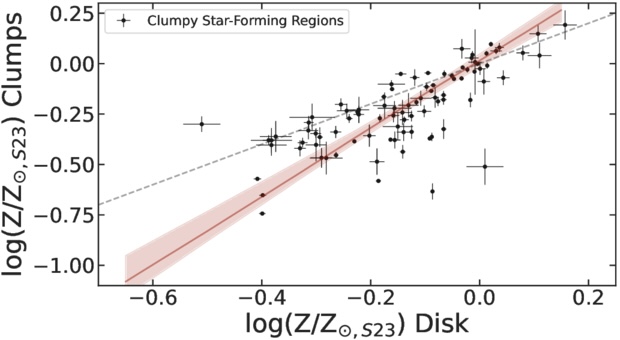
Figure 1: Each point compares a star-forming clump’s gas-phase metallicity to the metallicity of the nearby disk region immediately surrounding it. If clumps and disks had the same metallicity, they would lie on the dashed 1-to-1 line. Instead, most clumps sit below it, showing a typical ∼0.1 dex metallicity deficit, consistent with local chemical dilution. (The solid red line shows a best-fit linear trend to the clump measurement.) [Adapted from Estrada-Carpenter et al. 2025]
If inflow is really the driver, you should expect a link: the more strongly a clump is forming stars relative to its surroundings, the more diluted its metallicity should be. That is exactly what the authors find. The clumps that are most boosted in star formation are also the most metal diluted.
The article also emphasizes that clumps are not chemically uniform blobs. In at least one detailed example, the peaks in Hα (highest star formation) coincide with local minima in metallicity along a cut through the galaxy (Figure 2), suggesting internal star formation rate and metallicity gradients that reinforce the same story, intense star formation goes hand in hand with lower metallicity in the clump regions.
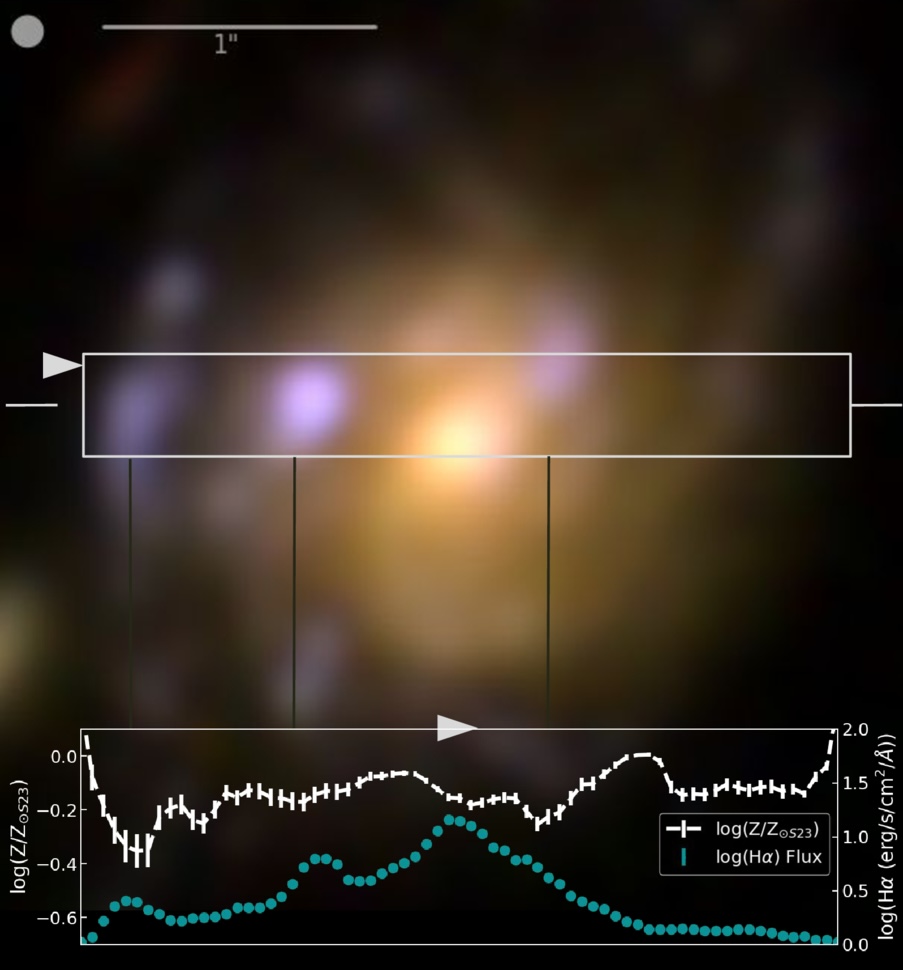
Figure 2: Example galaxy from this study illustrating the clump-scale link between star formation and metallicity. The color image shows the galaxy with a rectangular strip marking the region used for a 1D cut. In the bottom panel, the turquoise line shows the Hα flux (a tracer of recent star formation), while the white line shows the metallicity along the same cut. Peaks in Hα flux line up with local dips in metallicity, showing that the brightest star-forming clumps are also the most chemically diluted compared to nearby regions. [Adapted from Estrada-Carpenter et al. 2025]
Are These Clumps Really “In Situ,” or Could They Be Small Satellites?
A reasonable alternative is that some clumps are actually small companion galaxies projected onto the disk. These could also look metal poor, because low-mass galaxies tend to be low metallicity. The authors look for evidence using face-on systems and find that more massive clumps tend to sit closer to galaxy centers, which is consistent with in-situ clumps that form in the disk and migrate inward, though it does not rule out satellites. They argue that kinematics from JWST/NIRSpec IFU will be needed for a definitive separation.
Why This Matters
Gas inflow, star formation, and feedback, together known as the baryon cycle, are key drivers of how galaxies grow. What this article adds is a spatially resolved view that compares each clump to its local environment, showing that regions of elevated star formation also tend to be locally metal poor. That pairing is hard to explain as a simple metallicity gradient or a galaxy-wide averaging effect, and it is exactly what you would expect if at least some clumps are being fueled by relatively metal-poor inflows. In short, these clumps may be snapshots of galaxies refueling in real time.
Original astrobite edited by Ryan White.
About the author, Niloofar Sharei:
I’m an astronomy PhD candidate at UC Riverside studying how galaxies grow through star-forming clumps. I track how these clumps emerge, evolve, and sometimes survive long enough to reshape their galaxies. When I’m not thinking about cosmic blobs, I’m reading, hiking, or listening to Bach.
The post Feed the Fire, Fade the Metals appeared first on AAS Nova.
]]>
Are galaxies that travel through space in groups any different from those that fly solo? A new look at local galaxies provides clues.
The post Featured Image: Galaxies Caught in Transition appeared first on AAS Nova.
]]>How does environment shape a galaxy’s growth and evolution? This is the question explored in a recent study led by Gissel Montaguth (University of São Paulo). Montaguth’s team examined nearly 4,000 galaxies in low-mass, high-mass, and compact galaxy groups, as well as galaxies adrift in the field without belonging to a group. The sampled galaxies were classified as early-type, late-type, transition (generally disk galaxies with quenched star formation), or other (generally elliptical but with lingering star formation). The image above shows six transition galaxies from the sample, three of which show signs of past disturbances (top row). The team found that early-type and “other” galaxies were resilient to changes in environment, but late-type and transition galaxies could be affected by life in close groups. Late-type galaxies in compact groups tended to be somewhat smaller than their loosely grouped or field galaxy counterparts, while transition galaxies showed a significantly steeper stellar mass–size relation in group environments and smaller sizes in groups than in the field. This suggests that transition galaxies are strongly influenced by interactions, mergers, and processes like disk truncation. To learn more about the impact of environment on galaxy properties, be sure to check out the full article linked below.
Citation
“Galaxies Caught in Transition: The Role of Group Environment in Shaping the Mass–Size Relation in the Local Universe,” Gissel P. Montaguth et al 2026 ApJ 999 160. doi:10.3847/1538-4357/ae42ca
The post Featured Image: Galaxies Caught in Transition appeared first on AAS Nova.
]]>
Gas flowing into a galaxy is hard to detect, but a recent study simulated a dusty galaxy to understand how we might be able to uncover inflows with emission line ratios.
The post In or Out? Using Balmer Emission to Distinguish Inflows from Outflows appeared first on AAS Nova.
]]>Galaxies pull in and pump out gas as they form and evolve, but distinguishing between the two directions is tricky. A recent study used emission lines and dust absorption to try to pin it down.
Inflow or Outflow?
Throughout their lives, galaxies churn gas into stars, stars fuse new metals, supernovae blow enriched material back out, and the cycle repeats. To maintain this process and sustain star formation, a galaxy must fuel up by accreting gas from its surroundings. However, catching galactic gas accretion has proven difficult — both emission from gas falling into the galaxy (inflows) and gas blown out by supernovae (outflows) can appear blueshifted or redshifted along an observer’s sight line, depending on if the flowing material is in front of or behind the galaxy.
While direct evidence of inflows has been identified in the Milky Way, only a few direct detections of inflowing gas in other galaxies exist due to the degeneracy of inflow and outflow emission-line features. Relying on additional absorption measurements, some studies have teased out inflows in other galaxies, but these star formation fuel pumps remain overwhelmingly evasive. The angle at which we observe a galaxy also limits our ability to detect both inflows and outflows, with face-on galaxies best oriented to detect these shifted spectral features. How then do we uncover this critical component of a galaxy’s evolution?
Breaking Through with the Balmer Decrement
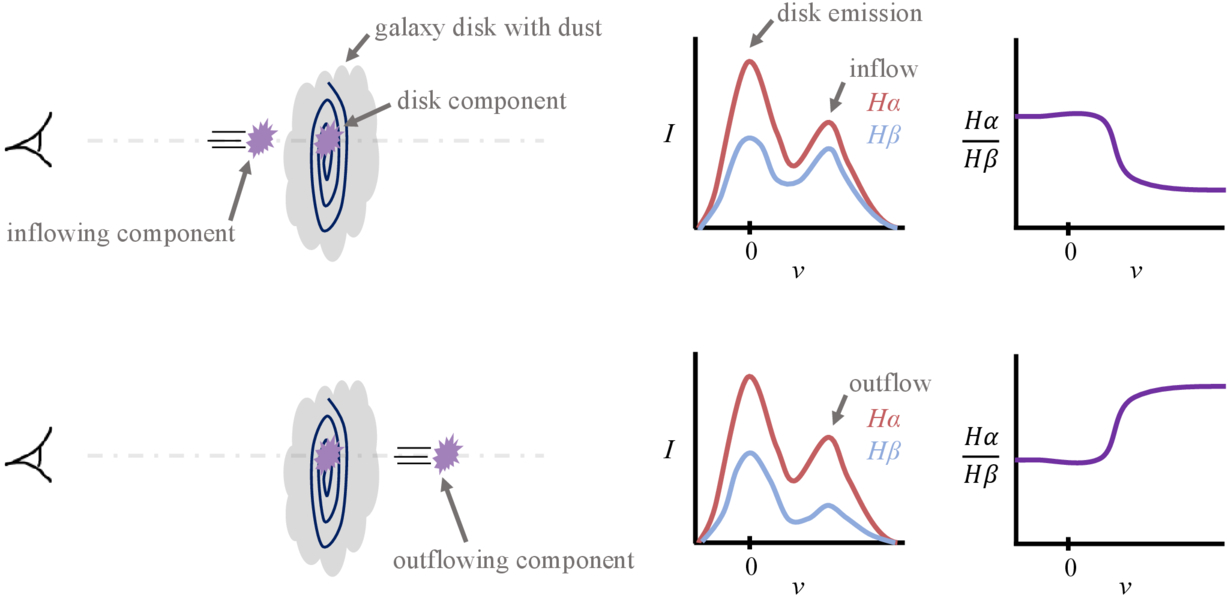
A diagram illustrating the degeneracy in emission spectra of galaxies, with the top panel showing an inflowing component and the bottom panel showing an outflowing component. While the Hα emission is similar, the Hβ emission is more affected by extinction due to dust in the galaxy’s disk, making it possible to identify inflow versus outflow based on the Balmer decrement. Click to enlarge. [Sitaram et al 2026]
Testing this idea, the authors performed a hydrodynamic simulation of an isolated, face-on Milky Way–like galaxy and tracked inflows and outflows over a billion years. From the simulation, they extracted mock spectral observations to measure the ionized gas motions and Hα and Hꞵ emission lines along different sight lines throughout the galaxy. Separating gas components into three categories — inflow, outflow, and in the disk — the authors found that dust extinction does cause noticeable differences in the Balmer decrement depending on a component’s location with respect to the disk.
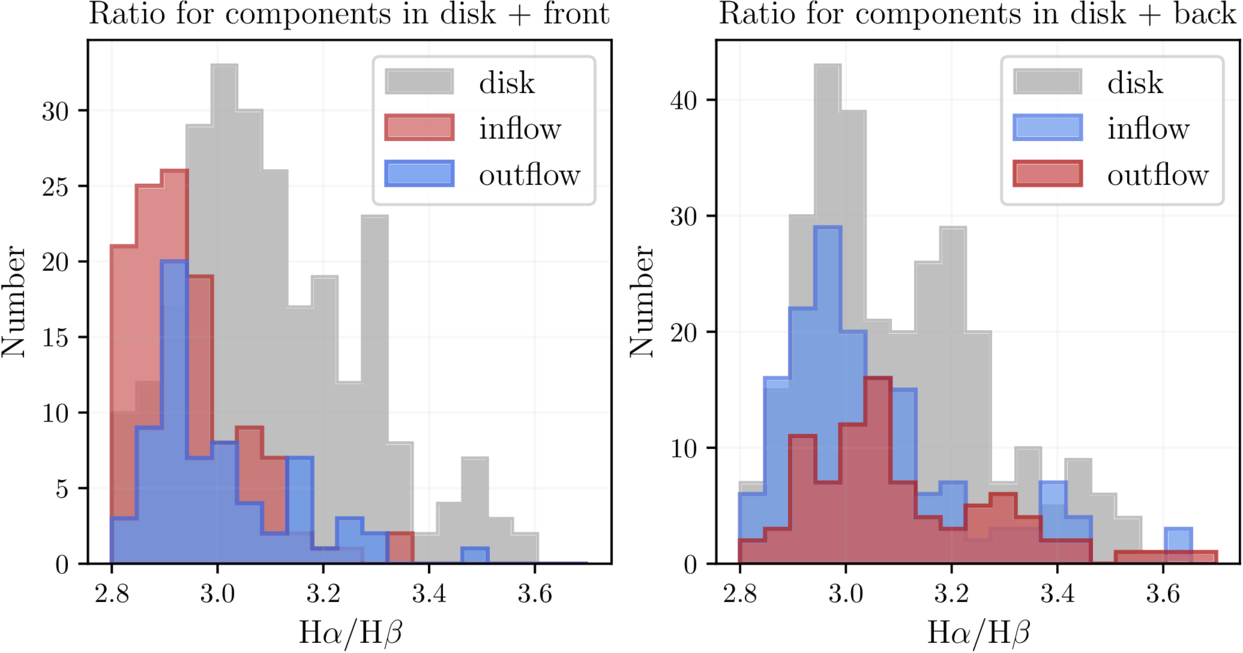
The distribution of Balmer ratios between different components in the interstellar medium and in front of the galaxy (left) and behind the galaxy (right). Material in front of the galaxy shows lower Hα/Hβ ratios. Click to enlarge. [Sitaram et al 2026]
Front Inflow Finds
What does this mean for identifying the inflows that provide galaxies with star-forming fuel? The authors reported that components in front of the galaxy — redshifted inflows and blueshifted outflows — tend to exhibit lower Hα/Hꞵ ratios compared to components behind the disk, aligning with the expectation that dust in the disk absorbs Hꞵ. In particular, these front inflows appear to be the most readily distinguished from gas in and behind the galaxy’s disk.
However, things get more complicated for gas behind the galaxy. Because the dust in the simulation is distributed nonuniformly in small clumps throughout the galaxy, it is difficult to distinguish between disk gas and gas behind the galaxy. While future simulations with improved dust modeling are necessary to resolve this issue, this study offers a useful method to distinguish inflow and outflow in dusty face-on galaxies.
Citation
“Identifying Signatures of Inflow onto Face-On Galaxies Using Balmer Decrement,” Meghna Sitaram et al 2026 ApJ 1001 87. doi:10.3847/1538-4357/ae5222
The post In or Out? Using Balmer Emission to Distinguish Inflows from Outflows appeared first on AAS Nova.
]]>
A supermassive black hole awakened seven years ago, and it's now behaving in a way astronomers can't explain.
The post A Black Hole’s Puzzling X-Ray Bursts appeared first on AAS Nova.
]]>In 2019, a supermassive black hole in a galaxy 300 million light-years away woke up. Now, it’s puzzling astronomers with an unexpected slowdown in its X-ray bursts.
The fuzzy yellow galaxy at the center of this image is home to ZTF19acnskyy. [Sloan Digital Sky Survey]
Ansky Awakens
Nearly seven years ago, the Zwicky Transient Facility saw the galaxy SDSS J133519.91+072807.4 suddenly brighten at optical wavelengths, with the source given the moniker ZTF19acnskyy or “Ansky.” Within the next few years, Ansky brightened at other wavelengths, possibly signaling the first recorded case of a slumbering supermassive black hole grumbling to alertness.
In 2024, Ansky entered a new phase of behavior, exhibiting a series of semi-regular X-ray flares called quasi-periodic eruptions. The leading explanations for these flares, which have been detected from several nearby galaxies, involve a star-sized object spiraling toward a supermassive black hole. The repeating X-ray flares arise when the object crashes through an accretion disk around the black hole, or when the object loses mass each time it passes closest to the black hole. In either scenario, the time between flares is expected to decrease over time — but as new work shows, Ansky is behaving in ways that fail to fit existing theories of quasi-periodic eruptions.
An Unexpected Slowdown
Soft X-ray observations of Ansky’s bursts from 2024 to 2026. These plots clearly show that in 2025 and 2026, the peak luminosities of the bursts have remained roughly constant while the time between bursts has increased. Click to enlarge. [Chakraborty et al. 2026]
This X-ray monitoring campaign spanned from January 2025 to January 2026 and captured 23 bursts, including 19 consecutive bursts — the most seen from a quasi-periodic eruption source to date. The bursts each lasted about three days, and the burst luminosity and total energy remained roughly constant, but the time between bursts increased smoothly from 9.9 days in January 2025 to 13.5 days in January 2026.
Possible Explanations
What physical process can produce X-ray bursts that are roughly consistent in energy and peak luminosity, last for approximately three days, and become more spaced out over time? The team considered five possibilities:
- A star orbiting a black hole could transfer a bit of mass to the black hole each time it draws close… but it’s not clear whether the energy of each burst would remain the same as the star loses mass, nor is it clear how a three-day eruption duration could be achieved.
- A star partially disrupted by a black hole could be kicked progressively farther from the black hole due to asymmetric mass loss or the reformation of its core… but this scenario cannot explain the bursts’ consistent energies and luminosities.
- An object orbiting a black hole with an accretion disk could be experiencing general relativistic precession… but no combination of known sources of precession can reproduce Ansky’s behavior.
- A second supermassive black hole could cause reflex motion of the inner black hole, changing how far the signal must travel… but even though this scenario can increase the time between bursts, the rate of increase is three orders of magnitude too small.
- Instabilities in the black hole’s accretion disk could trigger recurrent bursts of accretion… but it’s not yet clear how an instability scenario could produce such predictable behavior.
While none of these models can fully solve the mystery of Ansky’s slackening X-ray flares, this work provides new avenues for exploration. In the meantime, we may get new clues simply from waiting to see what this source does next!
Citation
“A Positive Period Derivative in the Quasiperiodic Eruptions of ZTF19acnskyy,” Joheen Chakraborty et al 2026 ApJL 1001 L6. doi:10.3847/2041-8213/ae548b
The post A Black Hole’s Puzzling X-Ray Bursts appeared first on AAS Nova.
]]>
Astrobites reports on whether JWST's most extreme high-redshift galaxy candidates aren’t galaxies at all, but the explosive deaths of the very first stars.
The post The Oldest Starlight appeared first on AAS Nova.
]]>Editor’s Note: Astrobites is a graduate-student-run organization that digests astrophysical literature for undergraduate students. As part of the partnership between the AAS and astrobites, we occasionally repost astrobites content here at AAS Nova. We hope you enjoy this post from astrobites; the original can be viewed at astrobites.org.
Title: Hunting for the First Explosions at the High-Redshift Frontier
Authors: Junehyoung Jeon et al.
First Author’s Institution: The University of Texas at Austin
Status: Published in ApJ
Back in the 1920s, astronomers discovered that we live within just one of many, many galaxies in the big, wide universe. Since then, we’ve been racing to search for the most distant galaxy that can be observed — in other words, searching for the oldest starlight we can see, since the light from these distant sources has been travelling towards us for most of the age of the universe. (Remember: more distant = higher redshift = longer lookback time.)
This race to the redshift frontier has had a pretty eventful history (see a great overview video here), which became even more eventful with the launch of JWST. JWST rapidly smashed the previous redshift (z) record of z = 10.6 by discovering a galaxy at z = 13.2, and then it broke its own record twice more. The current title holder sits at z = 14.4, observed less than 300 million years after the Big Bang.
Several galaxy candidates (to date unconfirmed) have now even been proposed at z ~ 25–32 (e.g., Capotauro), only 100 million years after the Big Bang! If real, these sources would pose a serious challenge to our understanding of the formation of the first galaxies, as galaxies shouldn’t really be observable at such early times. In today’s article, the authors put forward an intriguing alternative: what if some of these ultra-high-redshift candidates aren’t galaxies at all, but transient explosions from the universe’s first stars?
The First Stars and Their Explosive Endings
The earliest generation of stars (Population III; see my previous bite on these here) formed from pristine hydrogen and helium gas. Without metals to cool the gas efficiently, theory predicts that these stars were extremely massive, often exceeding 100 solar masses. While such stars would be short-lived, their deaths could be spectacular.
Population III stars of sufficient mass are predicted to end their lives as hyper-energetic pair-instability supernovae (PISNe). This is a long-winded name for a rapid, intensely hot explosion that leaves no remnant behind — not even a trace of the pre-existing star. Whilst nothing would remain of the star, the light emitted in that explosion could be bright enough to masquerade as a high-redshift galaxy candidate in current JWST surveys, but only if three key conditions are met:
- JWST must observe a sufficiently overdense region, where lots of Population III stars can form very early.
- A PISN must occur while JWST is “watching.”
- The explosion must be bright enough to rise above JWST’s detection limits.
Simulating a (Biased) Universe
To address the likelihood of these conditions having already been met by existing JWST observations, the authors turn to cosmological simulations. Rather than simulating an “average” patch of the universe, they focus on an extremely overdense region (Fig. 1). This creates a rare but important environment where structures collapse earlier than usual. These regions are exactly where large numbers of Population III stars are expected to form at the highest redshifts.
Figure 1: A projection of the gas density in the simulated overdense region at z = 30.4. The densest structures stand out clearly, tracing the locations where the first stars are able to form. Black dots mark newly formed groups of stars, while the most massive dark matter halo in the region is highlighted with an orange circle. The figure illustrates that in such an unusually dense patch of the early universe, star formation can already be underway just 100 million years after the Big Bang, creating the conditions needed for early Population III stars and their explosive deaths. [Adapted from Jeon et al. 2026]
Catching a Cosmic Explosion in the Act
So, we can tick off condition #1: it’s possible that a sufficiently overdense region has already been observed by JWST. Next up, how lucky do we have to be to catch an explosion in the act (condition #2), so to speak? For this condition, cosmic time dilation actually works in our favour. A PISN explosion at z > 20 that lasts only months in its own rest frame can last for decades in the observed frame. (This whole time-being-relative thing sounds wacky because it is — please join me, Neil deGrasse Tyson, and countless others in struggling to imagine this.)
But would any such explosion be bright enough (condition #3)? Using theoretical PISN spectra, the authors show that these explosions could reach observed magnitudes of ~28–29 at z ~ 30 — right at the depth of current JWST deep surveys (Fig. 2). In fact, the predicted brightness and colours are somewhat comparable to those of some proposed z ~ 30 candidates (Fig. 3), raising the possibility that these objects could be PISNe rather than galaxies.
Figure 2: This plot compares the predicted brightness of PISNe originating from different types of extremely massive stars to the depth reached by existing JWST surveys, showing that these explosions could remain detectable for ~20 years at peak brightness in the observed frame. [Jeon et al. 2026]
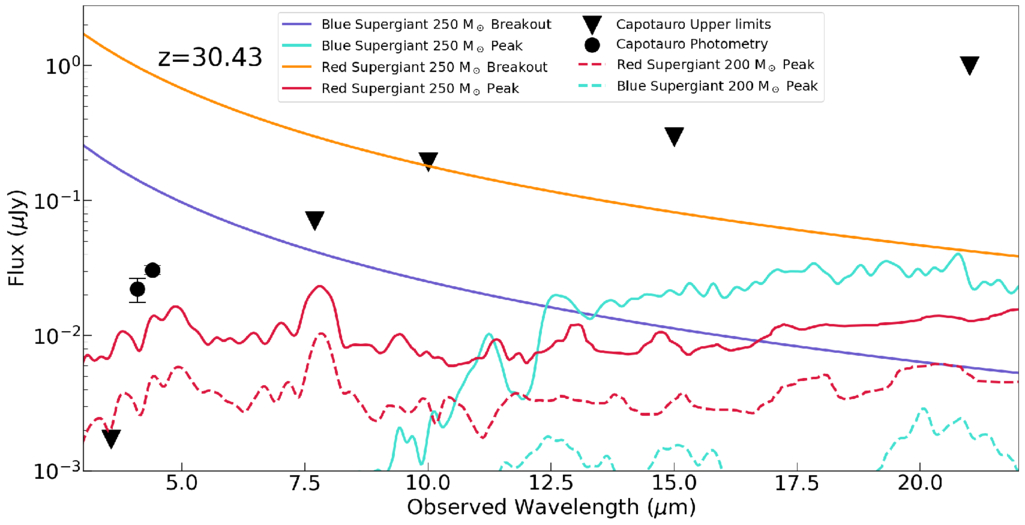
Figure 3: A comparison of theoretical PISNe spectra with the observed photometry of one proposed z ≈ 32 source (Capotauro). The coloured curves show model spectra for PISNe originating from extremely massive stars, at different stages of the explosion, while the data points represent the observed brightness of the high-redshift candidate across multiple JWST filters. [Jeon et al. 2026]
So… Are We Seeing the First Stars Die?
It’s not time to throw a party just yet. The authors note there are several caveats and uncertainties. The nature of Population III stars is still highly uncertain, JWST does not continuously monitor the same patch of sky, and identifying a PISN at such high redshift would be extremely challenging. Thanks to time dilation, these explosions would fade very slowly, making them hard to distinguish from steady sources using photometry alone. Alternatively, there are other plausible explanations for these ultra-high-redshift candidates: lower-redshift interlopers (a rather infamous example is CEERS-93316), local brown dwarfs, or even nearby exoplanets.
Still, the idea is exciting. If JWST were to detect a genuine PISN at z > 20, it would represent a direct glimpse of the very first stars, pushing observational astronomy into truly uncharted territory. For now, the most distant explosions in the universe may already be hiding in JWST images; we just have to learn how to recognise them.
Original astrobite edited by Nathalie Korhonen Cuestas.
About the author, Lucie Rowland:
I’m a fourth (and final!) year PhD student at Leiden Observatory in the Netherlands, studying massive, star forming galaxies in the early universe with ALMA and JWST. It’s a really exciting time to be interested in astronomy, so I hope to make groundbreaking new research more accessible!
The post The Oldest Starlight appeared first on AAS Nova.
]]>
Researchers search for the tiniest coronal jets, explore the Sun's behavior from centuries ago, and examine space weather forecasts in this month's Roundup.
The post Monthly Roundup: Science of the Sun appeared first on AAS Nova.
]]>The Sun’s activity history, the sources of tiny jets, and how magnetic fields might impact space weather forecasts: today’s Monthly Roundup introduces a trio of recent research articles from the Astrophysical Journal that tackle hot topics in solar physics.
From 1755 to 2020: Reconstructing Centuries of Solar Activity
Since the 1970s, regular monitoring of the Sun’s magnetic field has allowed researchers to decipher the Sun’s behavior as it cycles through periods of low and high activity. But what resources exist for studying the Sun’s past behavior? To investigate the long-term behavior of the Sun, researchers reach for historical records of sunspots, which stretch back to the 1700s.
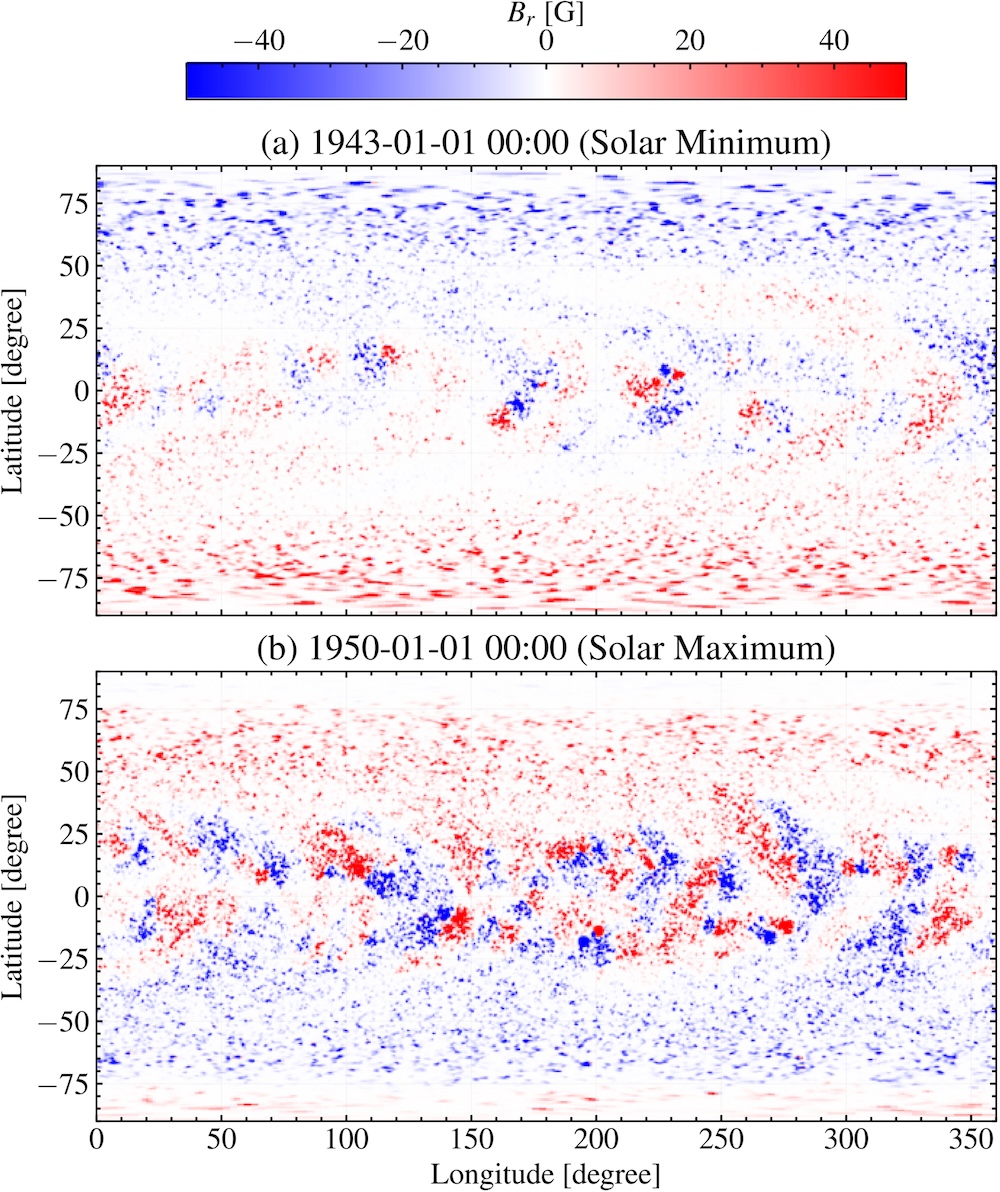
Example maps of the simulated photospheric radial magnetic field during a period of low (top) and high (bottom) solar activity. Click to enlarge. [Jha et al. 2026]
Jha and coauthors found that this method successfully reproduced the expected large-scale behavior of the Sun’s magnetic field across multiple solar cycles, such as the reversal of the polarity of the solar magnetic field near the peak of the activity cycle. While this work highlights the impressive results obtained from combining historical sunspot records with modern sunspot statistics, the team pointed out that this method cannot accurately reproduce all quantities because of the nonlinear nature of the underlying physics. Future work will refine the model further, and in the meantime, the team’s simulated historical magnetic field maps will be made publicly available.
Where Do the Tiniest Coronal Jets Come From?
The Sun’s atmosphere is filled with an ever-shifting maze of magnetic field lines, which reconfigure and release pent-up magnetic energy in a process called magnetic reconnection. Magnetic reconnection can launch particles and heat plasma, and it’s thought to be responsible for driving jets on a variety of scales in the Sun’s tenuous outer atmosphere, or corona. Annu Bura (Indian Institute of Astrophysics; Pondicherry University) and coauthors investigated the physical origins of the smallest of these reconnection driven jets, picoflare jets, using data from the Extreme Ultraviolet Imager on board Solar Orbiter. Solar Orbiter has ventured within 0.3 au of the Sun, and its Extreme Ultraviolet Imager has returned exceptionally precise high-energy images of our home star.
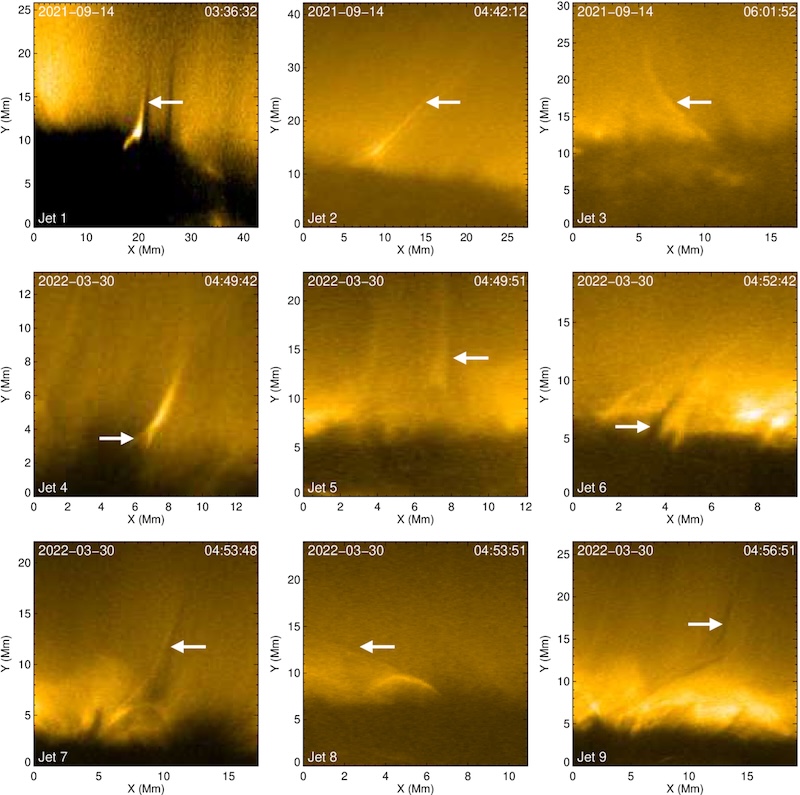
Examples of jets identified in this study. You can see an animation of this figure. [Bura et al. 2026]
Using radiation magnetohydrodynamics simulations, the team explored the origins of their sample of jets. The simulations suggested that the bright features arose from hot, tenuous coronal plasma, while the accompanying dark features were due to cooler, denser plasma venturing upward from deeper in the Sun’s atmosphere, in the chromosphere. Overall, the simulations and observations support a picture in which picoflare-scale jets are driven by magnetic reconnection after magnetic flux emerges through the Sun’s surface. This echoes the formation route of larger coronal jets, suggesting that this process may apply to a wide range of physical scales.
Investigating the Influence of the Solar Polar Magnetic Field
The vast majority of our observations of the Sun have come from within a few degrees of the ecliptic plane, either from telescopes situated on Earth’s surface or from spacecraft that stuck close to the plane of our solar system. With rare but notable exceptions — the Ulysses spacecraft, which measured the Sun’s magnetic field and plasma environment from a near-polar orbit, and Solar Orbiter, which took the first-ever image of the Sun’s poles in November 2025 — the Sun’s poles have remained hidden from our instruments.
Our limited knowledge of the Sun’s polar magnetic field has consequences for our ability to model space weather events like coronal mass ejections. A team led by Xiao Zhang (Chinese Academy of Sciences; University of Chinese Academy of Sciences) has used numerical simulations to investigate how solar polar magnetic field conditions influence the propagation of a coronal mass ejection (CME) through the solar system.
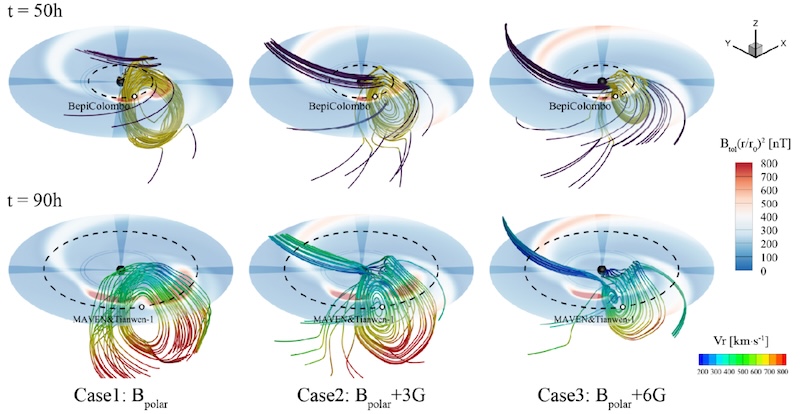
Simulation results showing how the propagation and expansion of a CME are affected by the polar magnetic field strength. Click to enlarge. [Zhang et al. 2026]
Citation
“Historical Reconstruction of Solar Surface Magnetism from Cycles 1–24 Using the Synthetic Active Region Generator and the Advective Flux Transport Model,” Bibhuti Kumar Jha et al 2026 ApJ 997 279. doi:10.3847/1538-4357/ae279a
“On the Origin of Coronal Picoflare Jets,” Annu Bura et al 2026 ApJ 1000 94. doi:10.3847/1538-4357/ae48e6
“Influence of Solar Polar Magnetic Fields on the Propagation of Coronal Mass Ejections,” Xiao Zhang et al 2026 ApJ 1000 200. doi:10.3847/1538-4357/ae4c54
The post Monthly Roundup: Science of the Sun appeared first on AAS Nova.
]]>
A massive survey of images collected by JWST is shedding light on how galaxies grow and evolve.
The post How Galaxies Grow Up appeared first on AAS Nova.
]]>How do galaxies grow? A massive survey from JWST can help astronomers answer that fundamental question about galaxy evolution.
Time Machines
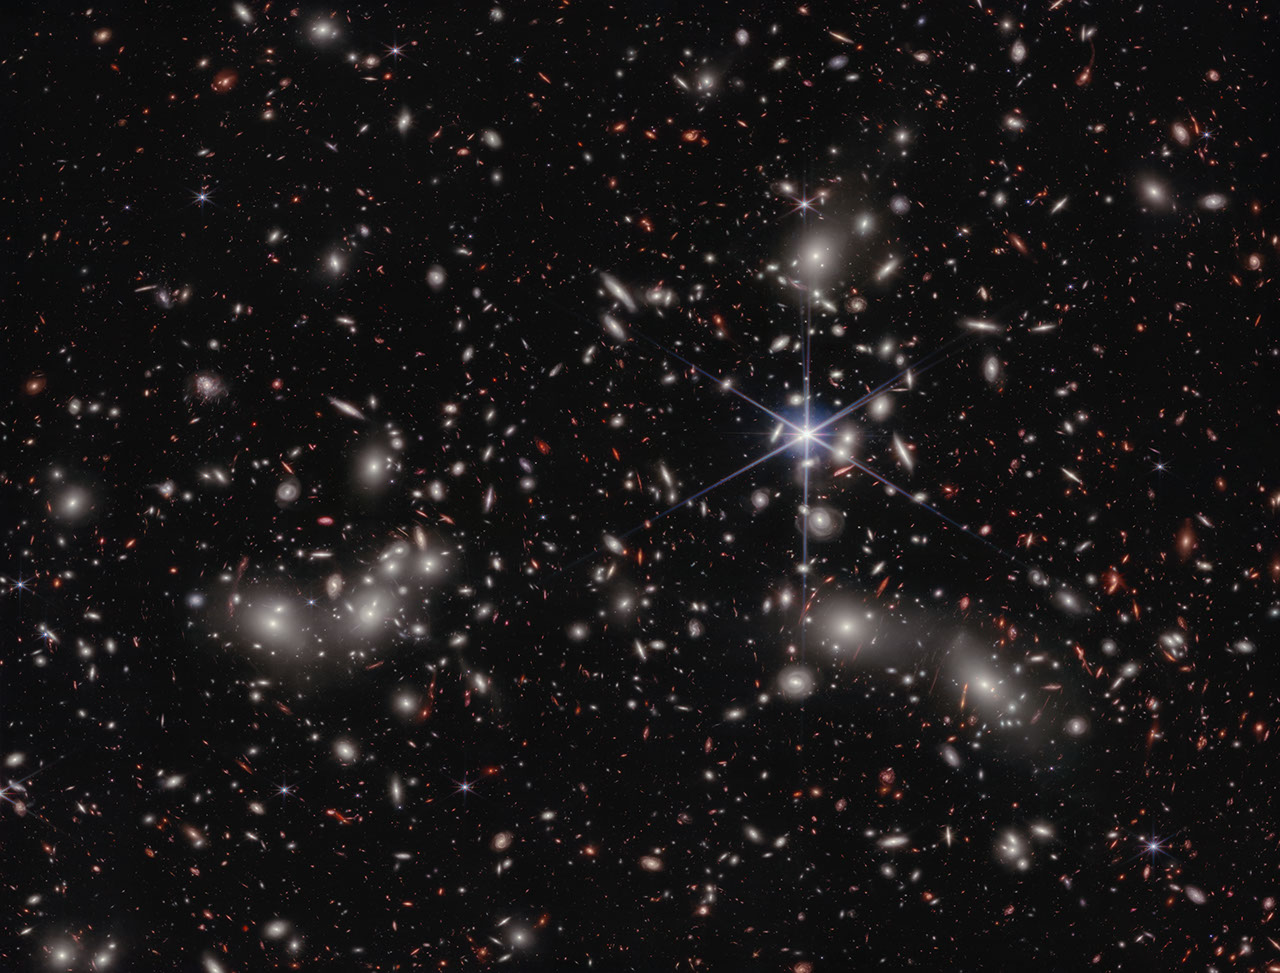
An image taken by JWST’s NIRCam instrument, the primary instrument behind the COSMOS-Web survey, of Pandora’s Cluster. Click to enlarge. [NASA, ESA, CSA, Ivo Labbe (Swinburne), Rachel Bezanson (University of Pittsburgh); Image Processing: Alyssa Pagan (STScI)]
One way astronomers could go about answering these deep, fundamental questions in galaxy evolution would be to look at many galaxies spread across different distances. Famously, since the speed of light is fairly slow (cosmically speaking), we can only see distant objects as they appeared in the past. (This is why any aliens looking toward Earth from 65 million light-years away — from within the Virgo Cluster, perhaps — would see our planet as it was when dinosaurs roamed free.) In principle, then, by looking at a progression of galaxies farther and farther away, astronomers could convert these still images into a sort of movie of how typical galaxies look moving further and further back in time.
Seeing Red
There is a complication to this strategy, however. The farther away an object is, the more the light it emits is stretched towards redder wavelengths. As a consequence, any telescope designed to detect visible light won’t see anything; to take pictures of these galaxies, we need to build detectors that are specifically sensitive to stretched-out, near-infrared light.
This is one of the primary reasons that JWST was designed, constructed, and flung into space. It was purpose-built to collect and analyze near-infrared light from distant galaxies, and now after several years of observations and data crunching, astronomers are finally getting some answers to those fundamental questions.
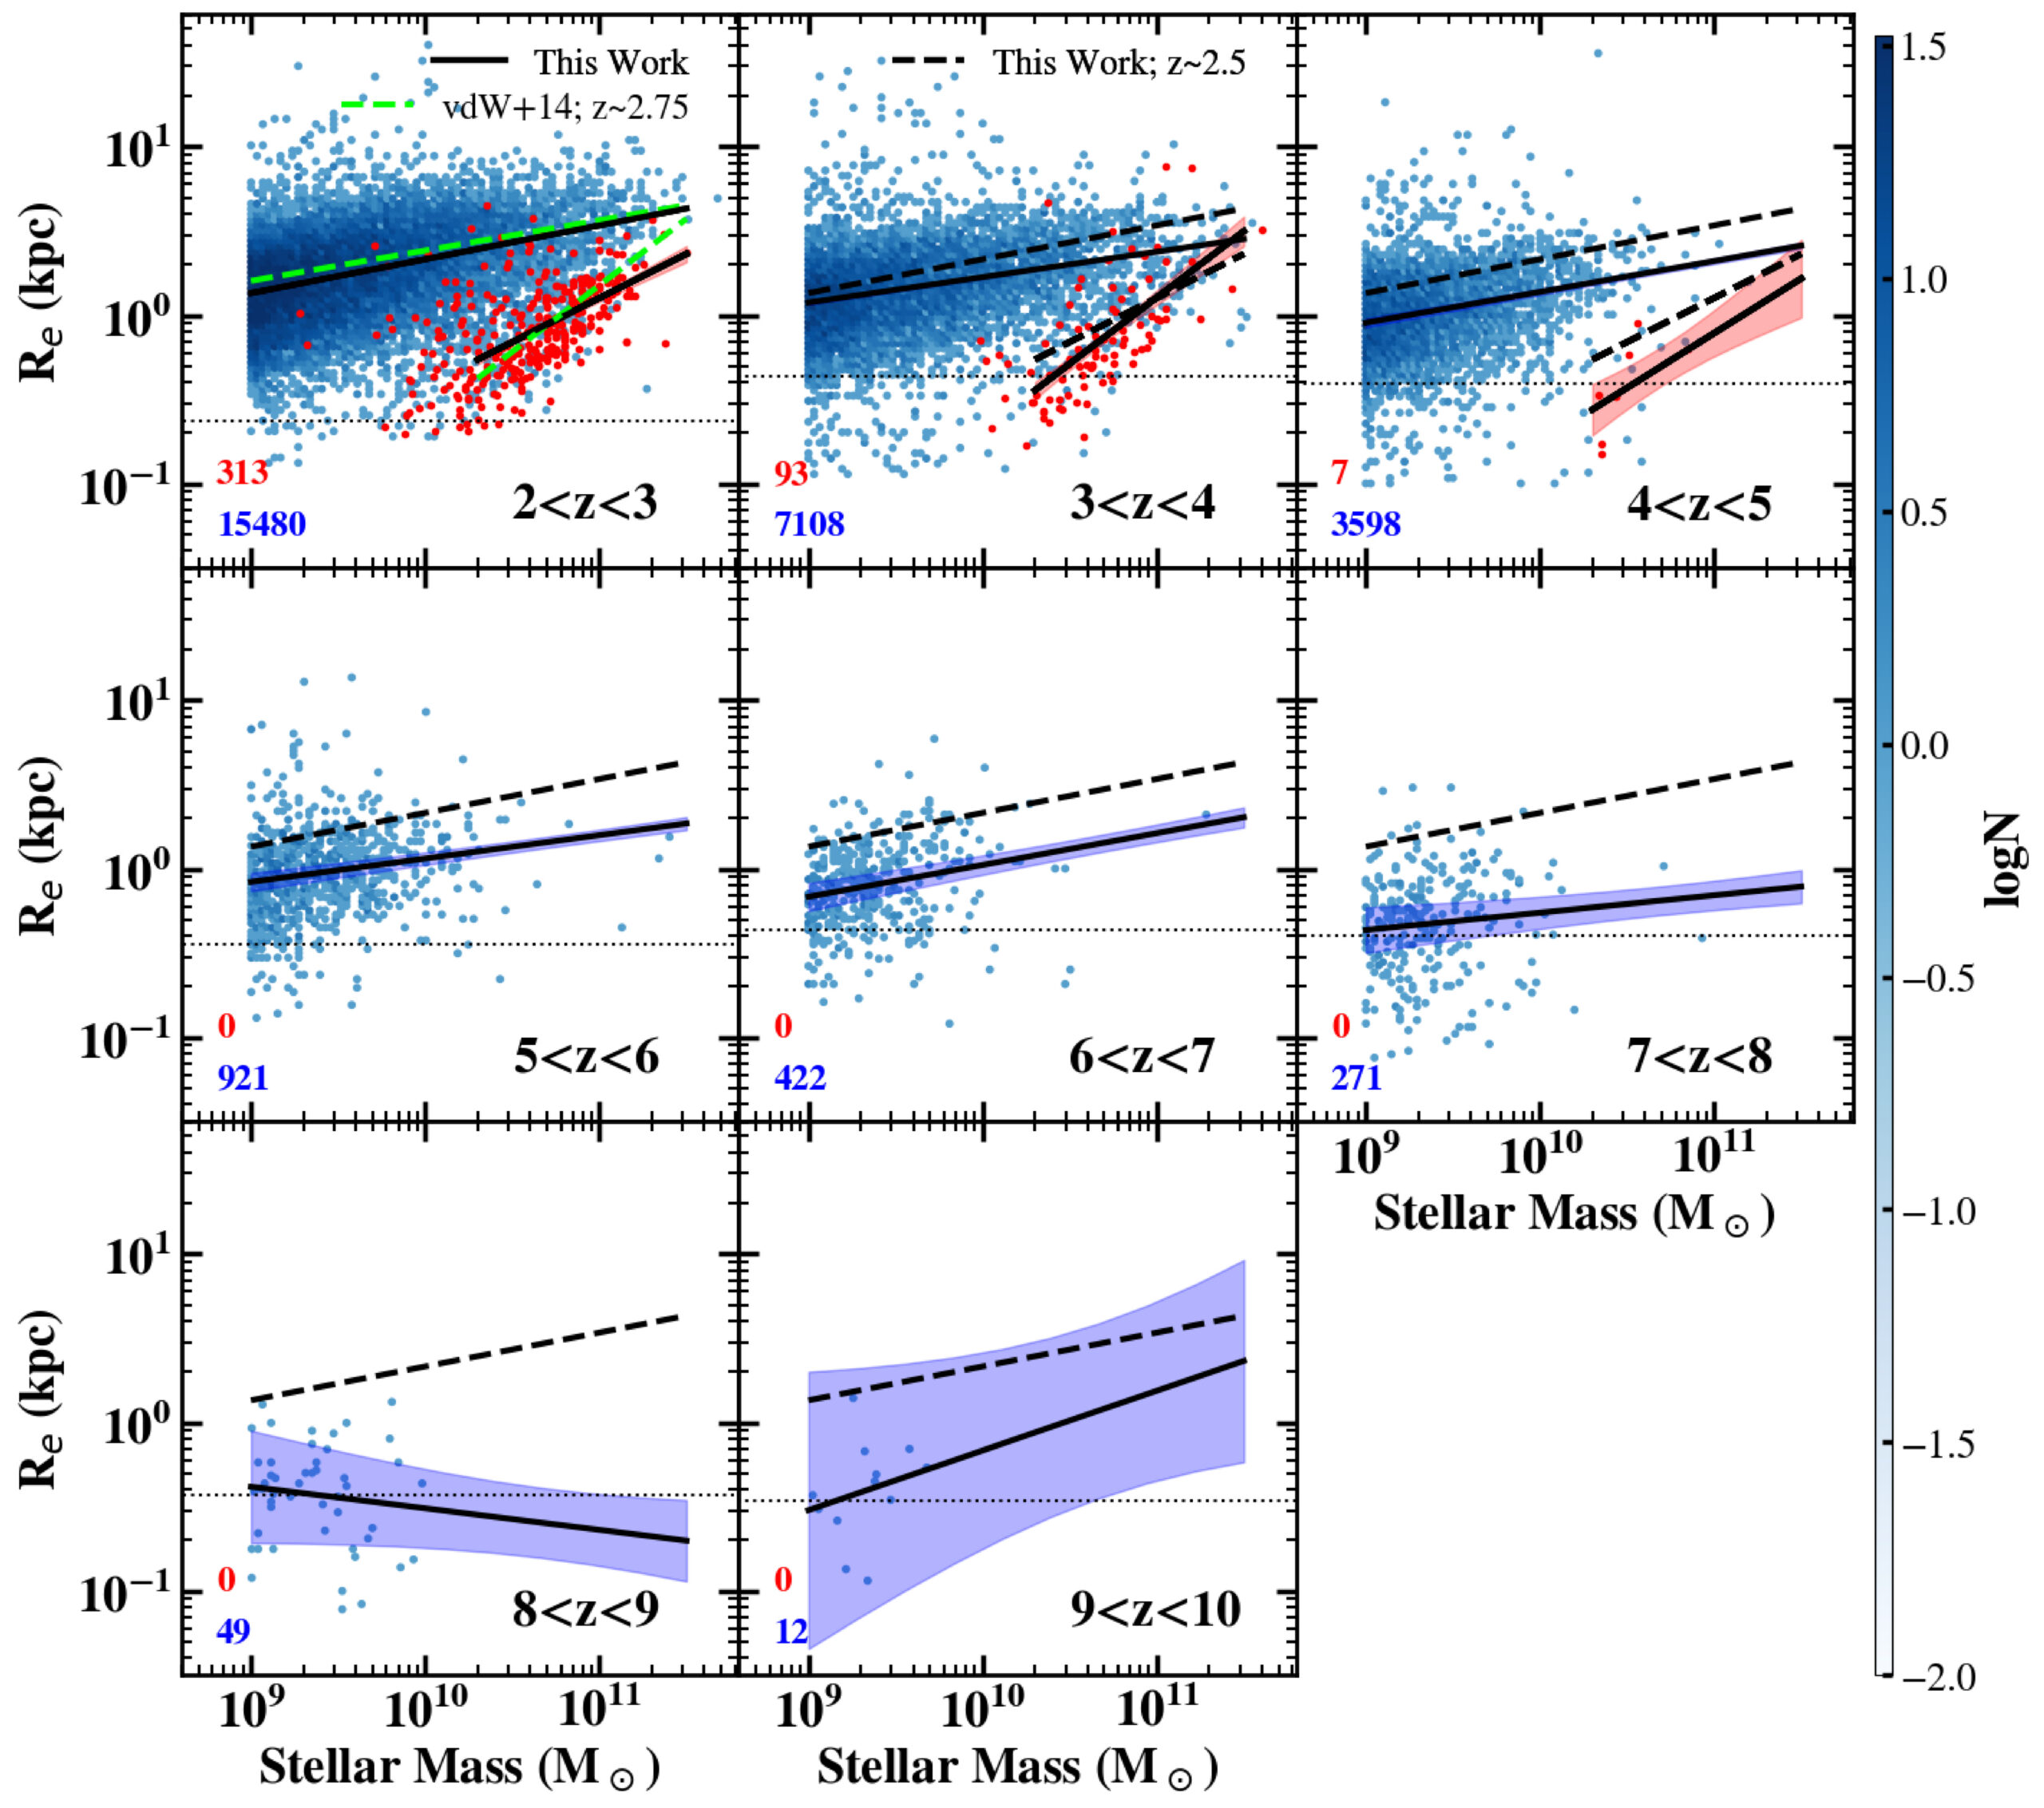
The results of how galaxies’ masses relate to their total size in different redshift bins. Click to enlarge. [Yang et al. 2025]
A Massive Survey
Recently, a team led by Lilan Yang, Rochester Institute of Technology, released their analysis of one of the earliest and largest surveys JWST has undertaken, a program called COSMOS-Web. The researchers mined a patch of sky about the size of the full Moon and extracted more than 30,000 distant galaxies, most of which had never before been seen by human eyes. They measured the brightness and size of each one and grouped them according to their redshift (a proxy for their distance) and whether they were actively forming stars or not.
The team found that, unsurprisingly, galaxies tend to grow over time. Excitingly, however, they also found that for star-forming galaxies, the relationship between a galaxy’s mass and its size is fairly constant for redshifts of z = 2–8. The scaling law between them also nicely matches up with measurements taken by the Hubble Space Telescope at smaller redshifts. Beyond that, though, for redshifts of z = 8–10, it’s possible that the scaling changes, though the authors emphasize that their sample is much smaller in these distant bins.
While more data are needed to confirm whether the youngest of these galaxies grow at a different pace than their later counterparts, we can be comforted that studies like this represent just our very first peek into a whole new era of galactic evolution, and that many more insights are sure to come as JWST keeps snapping images.
Editor’s Note: This article previously contained an error relating to the distance at which aliens would see Earth as it was when inhabited by dinosaurs. This error was corrected on 4 May 2026.
Citation
“COSMOS-Web: Unraveling the Evolution of Galaxy Size and Related Properties at 2 < z < 10,” Lilan Yang et al 2025 ApJS 281 68. doi:10.3847/1538-4365/ae0e1b
The post How Galaxies Grow Up appeared first on AAS Nova.
]]>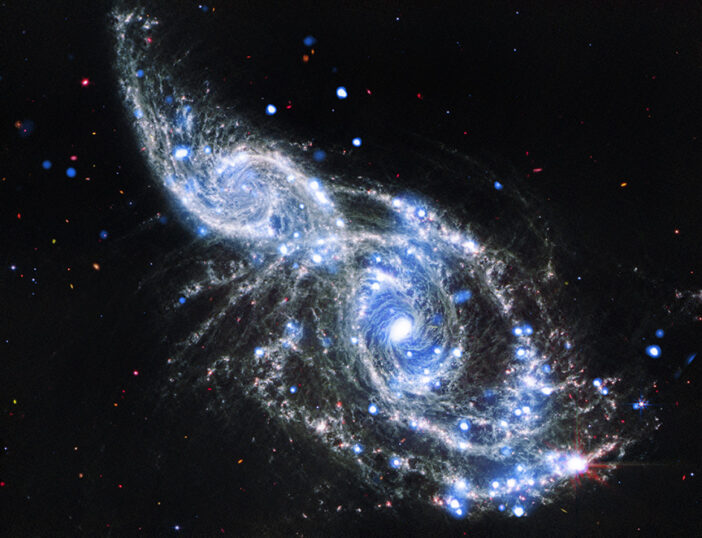
Researchers explore how the tilt of merging galaxies can impact the eventual collision of their supermassive black holes.
The post How Tilted Orbits Impact Supermassive Black Hole Collisions appeared first on AAS Nova.
]]>What factors impact how long it takes for a supermassive black hole binary to merge? New research investigates the influence of orbital inclination on the population of merging black holes in our universe.
One Merger Leads to Another
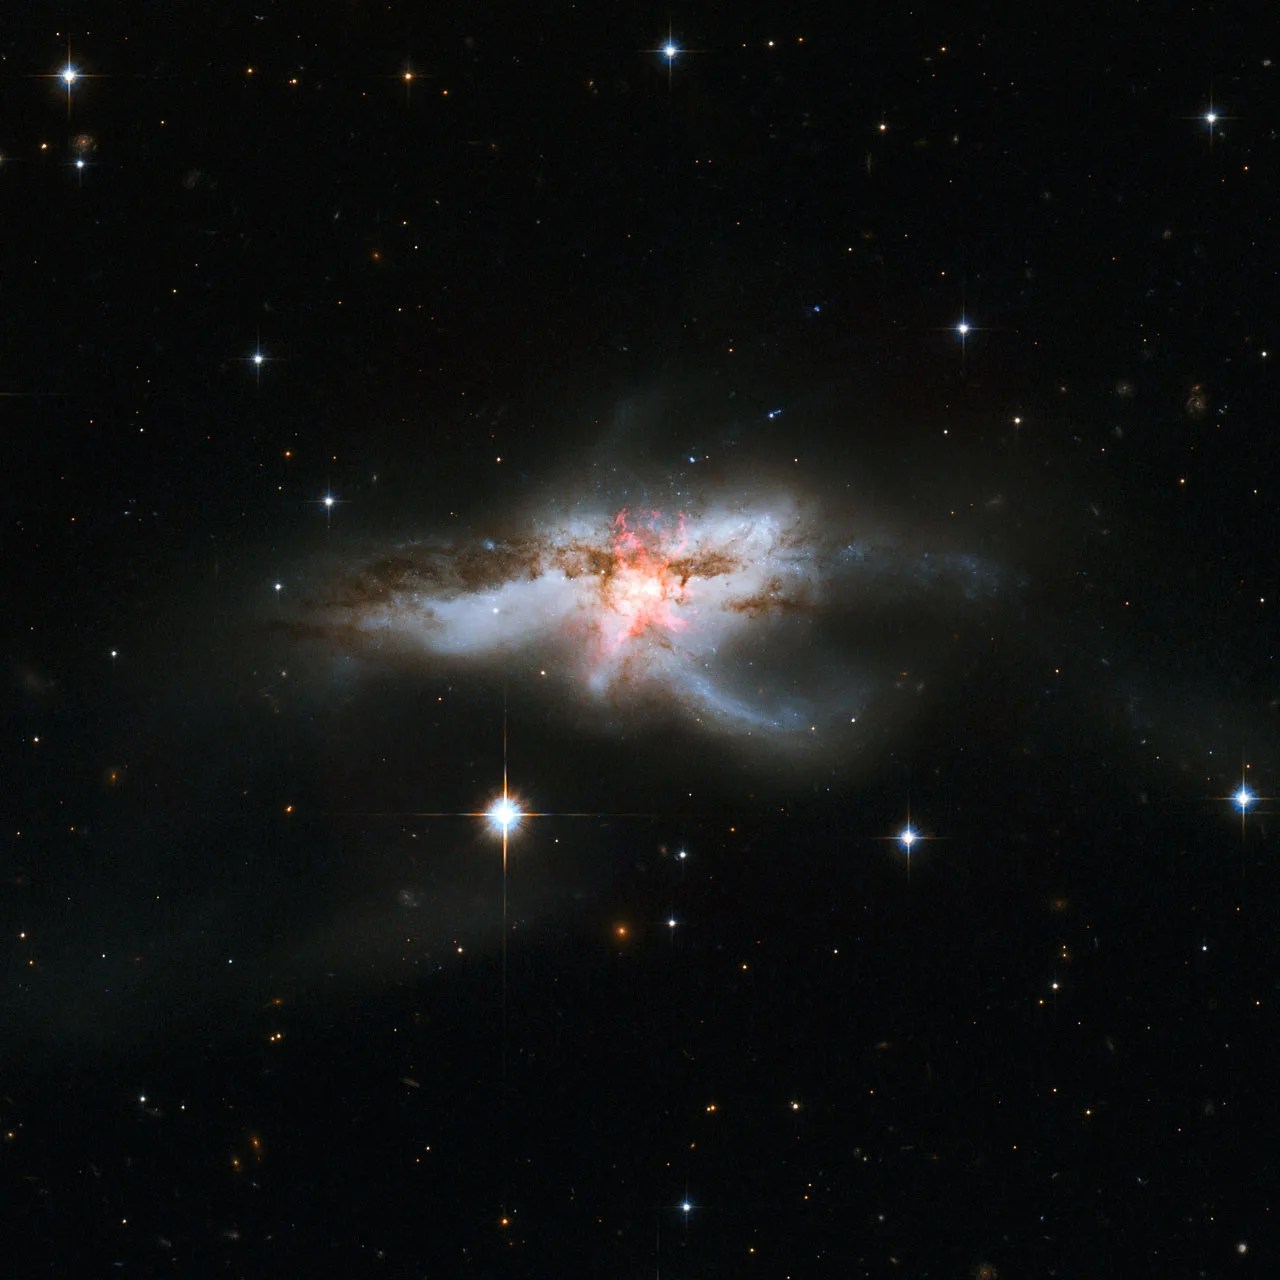
This image from the Hubble Space Telescope shows NGC 6240, the result of a three-galaxy merger that contains three nuclei, two of which appear to have active supermassive black holes. [NASA, ESA, the Hubble Heritage (STScI/AURA)-ESA/Hubble Collaboration, and A. Evans (University of Virginia, Charlottesville/NRAO/Stony Brook University)]
With observational evidence for supermassive black hole mergers taking shape, theorists are exploring the details of these mergers. One aspect of this process that hasn’t yet been examined fully is how the relative inclination of the merging galaxies impacts the time it takes for their central black holes to merge — a factor that has the potential to shape the demographics of merging supermassive black holes across our universe.
Ready, Set, Spiral
Sena Ghobadi (Georgia Institute of Technology) and collaborators used 3D dynamical models to explore how the angle at which galaxies collide — and therefore how the black holes’ orbits are tilted relative to one another — impacts the time it takes the supermassive black holes at their centers to merge.
In the simulations, Ghobadi’s team placed a 106–108-solar-mass black hole at the center of a disk galaxy. Then, they sent a second, smaller black hole spiraling toward it from a distance of 1 kiloparsec (3,300 light-years).
The team varied the inclination of the incoming black hole’s orbit relative to the disk of the target galaxy from 0 to 75 degrees. They also explored the impact of changing the black hole masses and the galaxy’s central gas density, disk rotation speed, and gas mass fraction. For each simulation, they recorded how long it took for the incoming smaller black hole to get within 10 parsecs of the larger black hole.
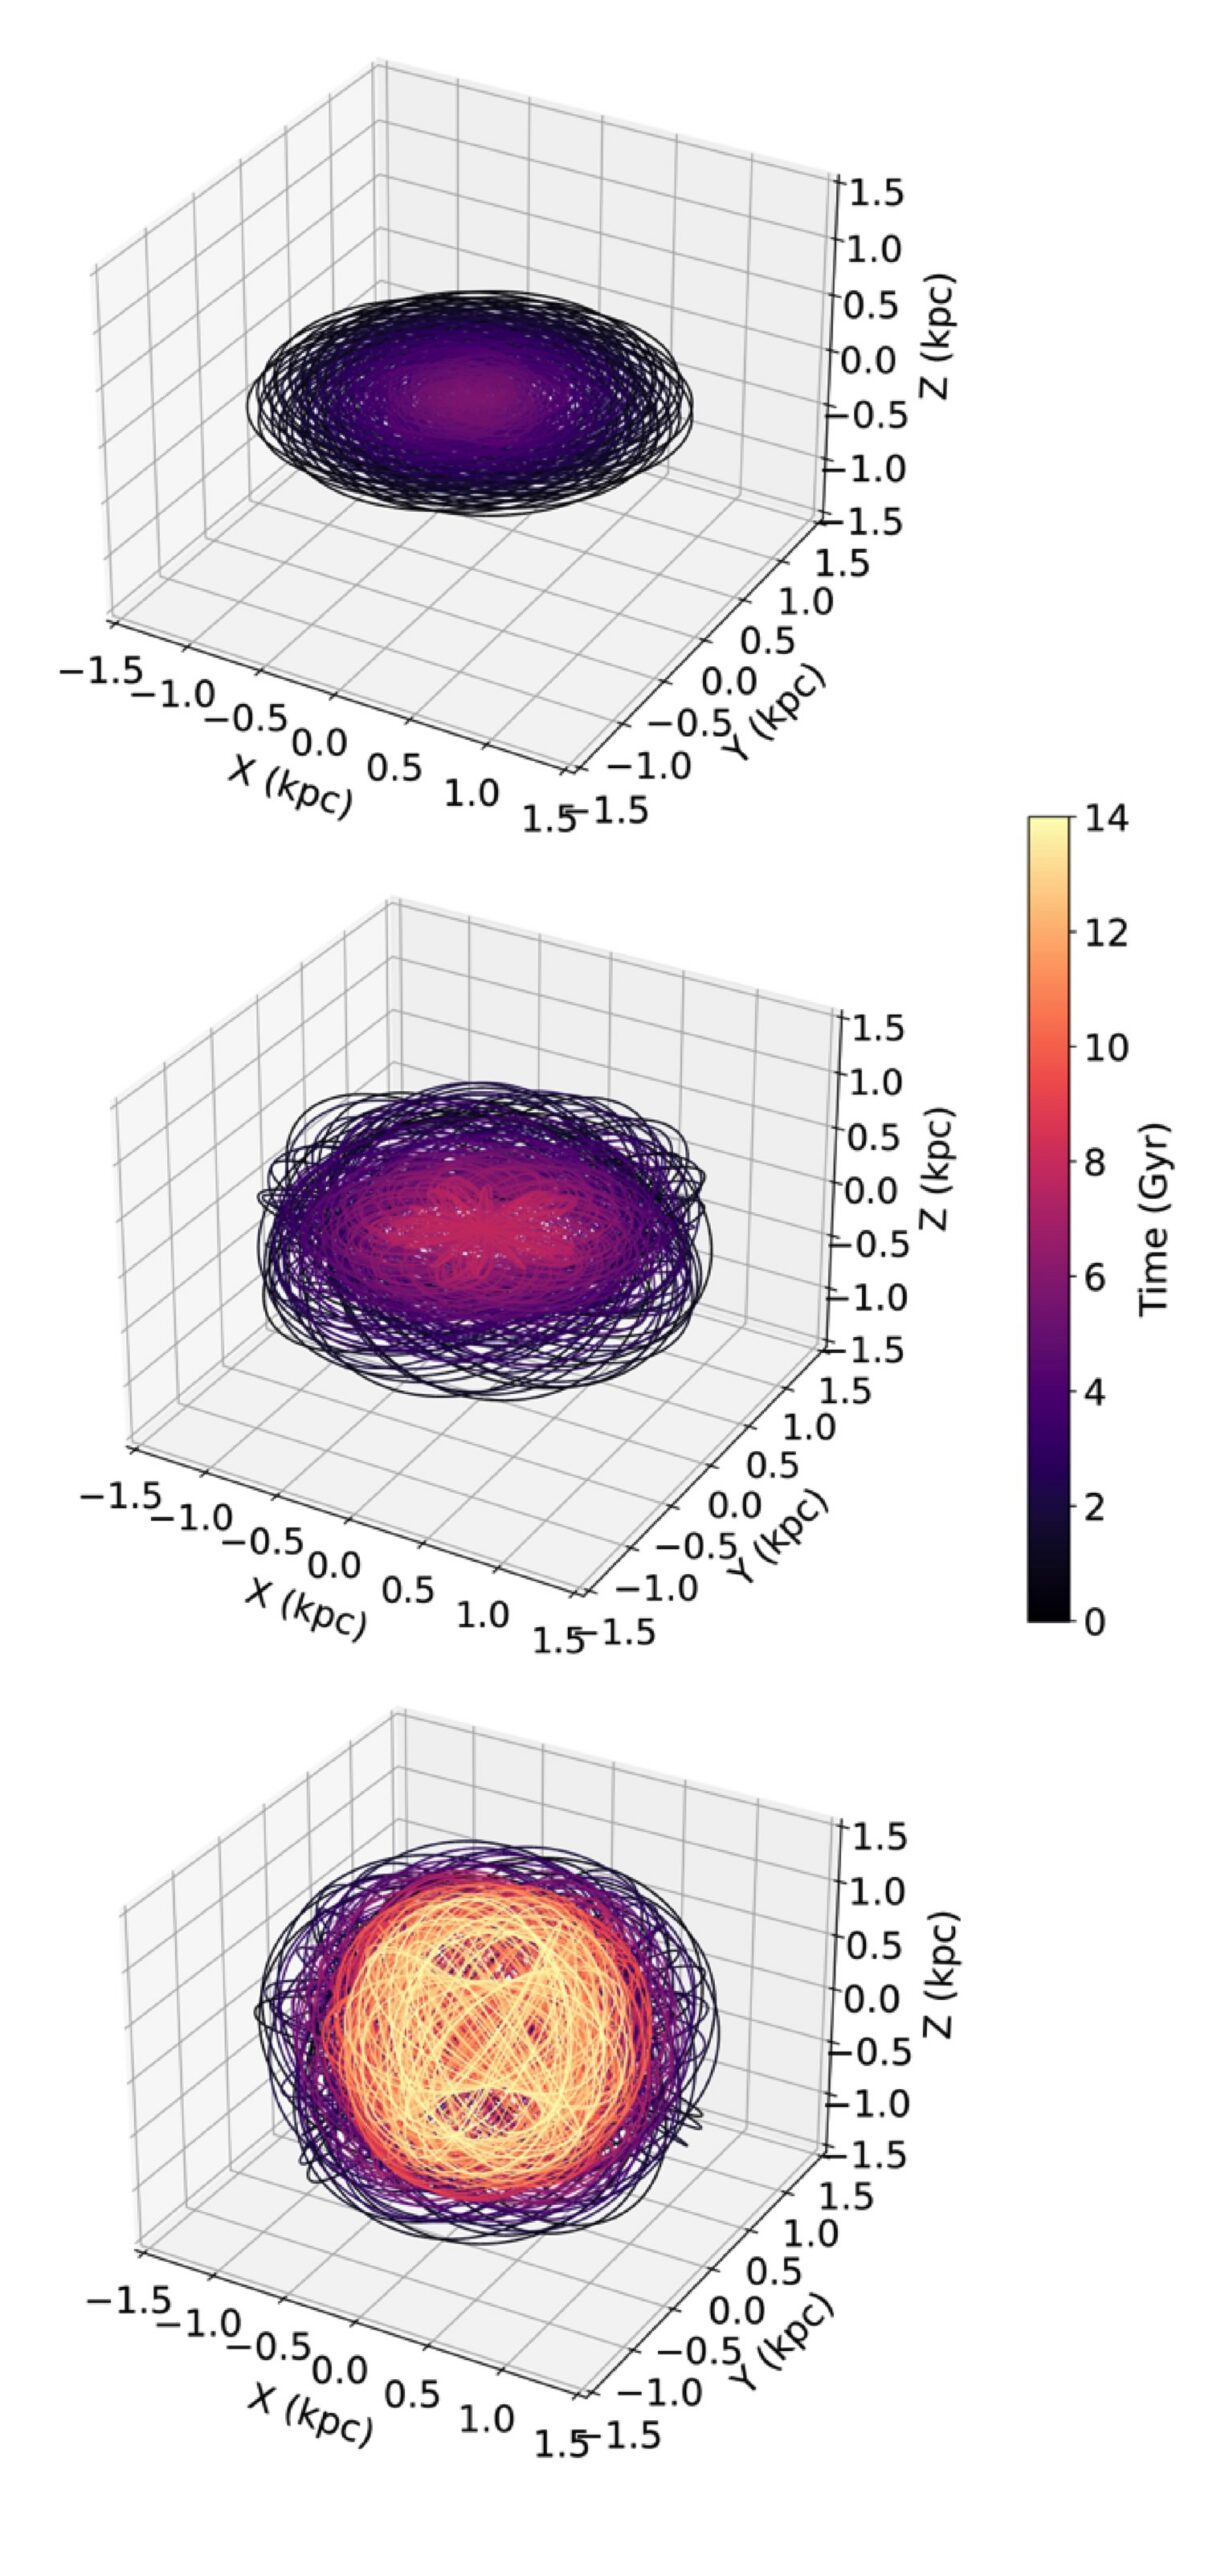
Simulated orbits of black holes with initial inclinations of 0 (top), 25 (center), and 45 (bottom) degrees. For the 0-degree simulation, the black holes merge in 5.75 billion years. For the 25-degree simulation, the merger occurs at 7.90 billion years. The 45-degree simulation fails to merge within the lifetime of the universe. [Adapted from Ghobadi et al. 2026]
(Dis)inclined to Merge
The simulations showed a clear trend with changing inclination: a black hole with an orbital inclination greater than 20 degrees took longer to merge than those with inclinations of 0–20 degrees. For black holes approaching the merger on slightly inclined orbits, dynamical friction between the black hole and the stars and gas of the galaxy worked to drag the black hole down into the disk, decreasing its inclination over time and guiding it toward a merger. Aside from the influence of inclination, the team also found that higher-mass supermassive black holes and more rapidly rotating galactic disks tended to lead to faster mergers.
For inclinations greater than roughly 45 degrees, a dramatic transition took place, with the orbits of the incoming black holes becoming more inclined over time rather than settling down into the disk. These simulated black holes failed to merge in the allotted time of 14 billion years.
With highly inclined binaries failing to merge within the lifetime of the universe, this suggests that the dual active galactic nuclei and the supermassive black hole binaries that produce gravitational waves in the universe today are the result of binaries with initial inclinations of 20 degrees or less.
Citation
“Evolution of Supermassive Black Hole Pairs on Inclined Orbits in Postmerger Galaxies,” Sena Ghobadi et al 2026 ApJ 999 131. doi:10.3847/1538-4357/ae40bc
The post How Tilted Orbits Impact Supermassive Black Hole Collisions appeared first on AAS Nova.
]]>
Astrobites reports on a new method to find the galaxies hosting the universe’s first generation of stars.
The post A Possible GLIMPSE of the Universe’s First Stars appeared first on AAS Nova.
]]>Editor’s Note: Astrobites is a graduate-student-run organization that digests astrophysical literature for undergraduate students. As part of the partnership between the AAS and astrobites, we occasionally repost astrobites content here at AAS Nova. We hope you enjoy this post from astrobites; the original can be viewed at astrobites.org.
Title: GLIMPSE: An Ultrafaint ≃105 M⊙ Pop III Galaxy Candidate and First Constraints on the Pop III UV Luminosity Function at z ≃ 6–7
Authors: Seiji Fujimoto et al.
First Author’s Institution: University of Toronto; The University of Texas at Austin
Status: Published in ApJ
You, me, your laptop, my $8 matcha, and just about everything else on Earth was forged in the fiery bellies of dying stars. Generations of stars had to live and die before the universe became enriched with any elements heavier than helium (what astronomers call “metals”). The first stars to undergo this cosmic cycle are known as Population III (Pop III) stars. Though their existence has been hypothesized since the 1960s, astronomers have failed to observe these distant metal-free stars or the faint, low-mass galaxies that host them.
The first Pop III stars likely formed around 100 million years after the Big Bang in pristine pockets of hydrogen gas. Although these are too distant for us to observe, we expect that as the universe started to become metal enriched, there were still existing pockets of gas introverted enough to survive unpolluted and form metal-free Pop III stars up to a redshift of z ~ 6–7 (when the universe was around 900 million years old)!
JWST is the perfect instrument to search for these systems. You can read other astrobites on the search for possible Pop III systems with JWST here and here. The authors of today’s article seek to develop the most efficient way of using JWST’s Near-Infrared Camera (NIRCam) to find the galaxies hosting Pop III stars. Using their selection method on existing NIRCam data, the authors identified one promising Pop III galaxy candidate.
I’m Not Like Other Galaxies
In order to find a Pop III galaxy, we need to take a look at galaxies’ spectral energy distributions (SEDs). These are graphs that show the energy emitted by a galaxy at different wavelengths of light. Pop III galaxies are expected to have SEDs that differ from your everyday, metal-enriched galaxy. NIRCam will be especially sensitive to three key spectral features that show up in the SEDs of Pop III galaxies: an absent [O III] line (light emitted by doubly ionized oxygen atoms), a strong H-alpha line (light emitted when a hydrogen atom transitions from its third to its second energy level), and a significant Balmer jump (light absorbed to ionize electrons in the second energy level of a hydrogen atom). To identify these key SED characteristics, the authors use SED fitting and color–color diagrams to execute an efficient Pop III search with NIRCam.
The first selection method involves SED fitting. Astronomers create template SEDs that represent different types of galaxies and then compare these templates to the observed SEDs to see which one matches best. In this work, the authors use metal-rich galaxy templates and Pop III templates to fit the galaxies observed with NIRCam. They then calculate the chi-squared χ2 (a statistical measure of best fit) between the data and all the SED templates. A galaxy is selected as a Pop III candidate if the Pop III model provides a good fit (χ2 < 10) to the photometry and is significantly better than any metal-rich model. It’s kind of like looking for Cinderella by making every woman in the kingdom try on the glass slipper.
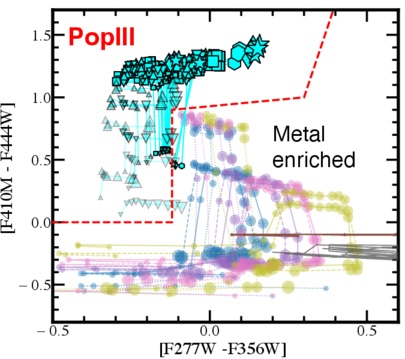
Figure 1: Color–color diagram for selecting Pop III galaxies where the x and y-axes show the different NIRCam filters being subtracted. The cyan symbols are different Pop III models while the other colored dots are different metal-rich galaxy models. [Adapted from Fujimoto et al. 2025]
O Pop III, Pop III, Wherefore Art Thou?
The authors apply their fresh new selection criteria to publicly available NIRCam data from large surveys. And (drum roll please) the slipper fits! The Pop III galaxy candidate GLIMPSE-16043 is an ultra-faint galaxy at z = 6.5. It was imaged in the GLIMPSE survey, which uses the technique of gravitational lensing to observe faint and distant galaxies.
The GLIMPSE survey targeted a massive galaxy cluster, Abell S1063. The cluster bends the light from distant galaxies and, like a giant lens, magnifies faraway objects, providing some of the deepest JWST imaging to date. The Pop III candidate passes both tests: it resides in the Pop III region of the color–color diagram, and its SED is best fit by a Pop III model, not a metal-rich galaxy model (see Figure 2). Next, spectroscopic follow-up is needed to ensure that this galaxy is truly metal free and not just extremely metal poor.
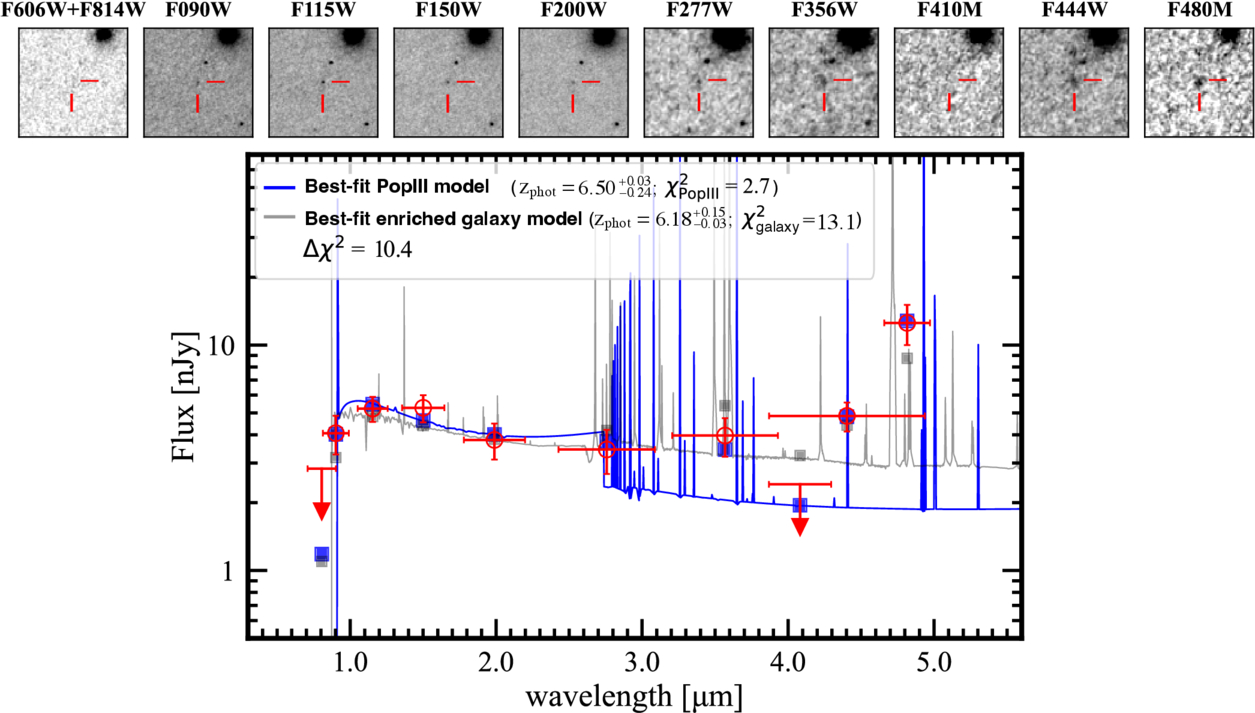
Figure 2: SED of GLIMPSE-16043 with the best-fit Pop III template (blue) and best-fit metal-enriched template (gray). The top panel is the galaxy imaged in different filters from NIRCam and the Hubble Space Telescope. [Fujimoto et al. 2025]
Original astrobite edited by Chris Layden and Margaret Verrico.
About the author, Madison VanWyngarden:
I am a first-year PhD student in astronomy and NSF Graduate Research Fellow at the University of Arizona. I study galaxy formation and evolution in the distant universe and am particularly interested in dusty star-forming galaxies. In my free time, I love reading, hiking, and baking bread!
The post A Possible GLIMPSE of the Universe’s First Stars appeared first on AAS Nova.
]]>
Interacting galaxies, sparkling starbursts, and strange structures abound in new images from the Hubble Arp Galaxy Survey.
The post Featured Image: Disequilibrium on Display appeared first on AAS Nova.
]]>Notice anything unusual about these galaxies? Each of the scenes above is crafted from observations from the Hubble Arp Galaxy Survey, which turned the talents of the Hubble Space Telescope toward 216 targets in the Arp and Arp–Madore catalogs. These catalogs contain galaxies that are visibly out of equilibrium, either caught in the middle of an interaction with another galaxy, sporting strange structures, or illuminated by brilliant starbursts. Julianne Dalcanton (Flatiron Institute; University of Washington), Meredith Durbin (University of Washington; University of California, Berkeley), and Benjamin Williams (University of Washington) designed the survey to create an archive of previously unobserved sources in these catalogs of peculiar galaxies. In addition to providing a new high-resolution view of these sources, the team hopes that the survey will serve as a launchpad for new investigations and complementary observations from facilities like JWST and the Atacama Large Millimeter/submillimeter Array. To learn more about the Hubble Arp Galaxy Survey and see more of the new images, be sure to check out the full article linked below.
Citation
“The Hubble Arp Galaxy Survey,” Julianne J. Dalcanton et al 2026 ApJS 283 25. doi:10.3847/1538-4365/adfc67
The post Featured Image: Disequilibrium on Display appeared first on AAS Nova.
]]>
Researchers have detected water vapor around a B[e] supergiant star for the first time, indicating a likely binary companion for LHA 115-S 18.
The post Water Vapor Around a Sizzling Supergiant: High-Resolution Spectroscopy of B[e] Supergiant LHA 115-S 18 appeared first on AAS Nova.
]]>Prior to exploding, massive stars advance through action-packed evolutionary stages that are exciting but often difficult to fully decipher. A recent study focuses on a unique late-stage star to better understand its properties and evolution.
To B[e] a Supergiant
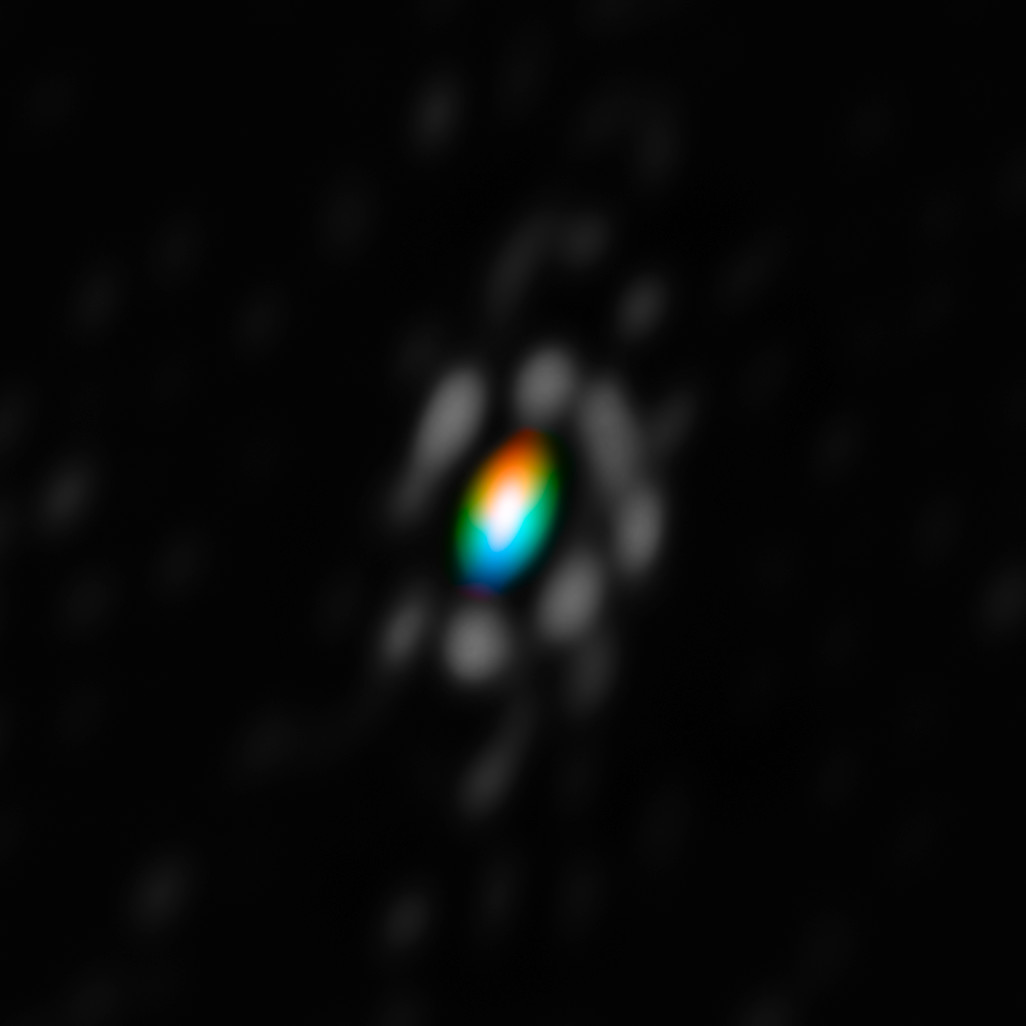
Very Large Telescope Interferometer image of the circumstellar disk around the B[e] supergiant star HD 62623. The colors indicate the rotation of the disk with blue coming toward us and red going away. [ESO/F. Millour; CC BY 4.0]
One particularly interesting B[e] supergiant, LHA 115-S 18, has been the subject of numerous studies but remains poorly constrained. The star exhibits significant variability both in brightness and emission features on timescales of days to years, and previous works have suggested that the star may have an as-yet unconfirmed binary companion. Molecular line emission from CO and TiO have been identified in LHA 115-S 18, indicating a circumstellar disk, but to date, water vapor emission has not been identified in any B[e] supergiant. Identifying more complex oxygen-bearing molecules like water will further reveal the physical properties and possible binary companion of LHA 115-S 18.
Identifying Emission in LHA 115-S 18
To characterize the emission around LHA 115-S 18, María Laura Arias (Institute of Astrophysics La Plata; National University of La Plata) and collaborators obtained high-resolution near-infrared spectroscopy of the star using the Immersion Grating Infrared Spectrometer on the Gemini South telescope. From the high-resolution spectra, the team identified several atomic emission lines indicative of the star’s gaseous envelope, revealing the structure of material around the star: an inner hot disk of ionized material and an outer cool disk of neutral material. Looking at molecular emission from carbon monoxide — a tracer of both gas motions and stellar age — the authors confirmed the presence of a rotating ring of gas around LHA 115-S 18 and determined that the star is an evolved, post–red supergiant object.
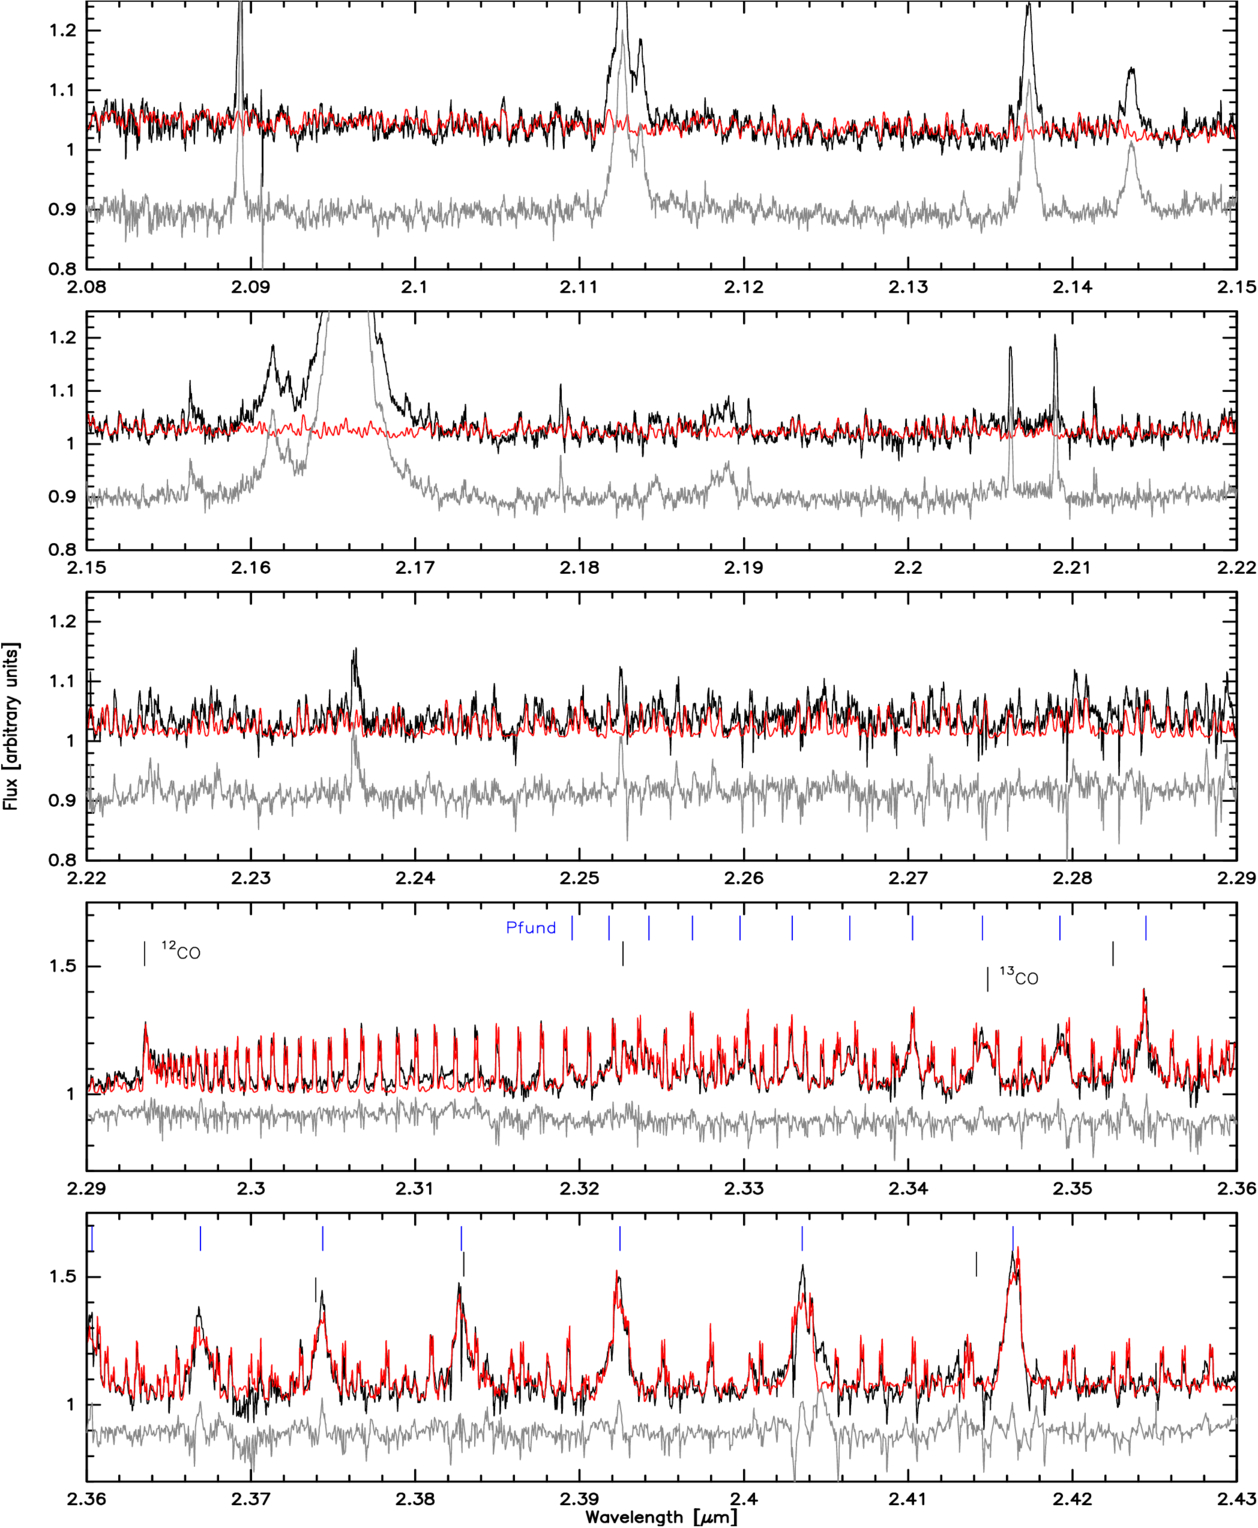
Spectrum of LHA 115-S 18 (black) with the model spectrum composed of water vapor (red, top three panels) and water vapor, CO, and hydrogen emission (red, bottom two panels) overplotted as well as residuals (gray). [Arias et al 2026]
Sustaining a cool disk around such a hot star indicates that the circumstellar environment around LHA 115-S 18 is complex and likely shaped by binary interaction. With emission features characteristic of both cool and hot evolved stars, this particular B[e] supergiant presents itself as a unique object holding critical insights into the late-stage evolution of massive stars. Further multiwavelength observations of LHA 115-S 18 will constrain its potential binarity and reveal a possible evolutionary link between B[e] supergiants and other late-stage evolutionary phases of massive stars.
Citation
“High-resolution Near-Infrared Spectroscopy of the B[e] Supergiant LHA 115-S 18: Discovery of Hot Water Vapor Emission,” María Laura Arias et al 2026 ApJL 1000 L49. doi:10.3847/2041-8213/ae524a
The post Water Vapor Around a Sizzling Supergiant: High-Resolution Spectroscopy of B[e] Supergiant LHA 115-S 18 appeared first on AAS Nova.
]]>
Event Horizon Telescope images are already some of the sharpest in all of astronomy. A new algorithm might be able to squeeze even more information out of them with complex statistical modeling.
The post Enhancing the Sharpest Images appeared first on AAS Nova.
]]>The Event Horizon Telescope (EHT), the facility that delivered humanity’s first-ever picture of a black hole, can produce some of the sharpest images in all of astronomy. But turning the EHT’s raw data into images is a complex process involving messy statistics and powerful algorithms. Recent work presents a potential upgrade to that process: for the first time in long-baseline interferometry, it may be possible to model everything everywhere all at once.
The Hardest Eye Test
The EHT has some of the sharpest eyes in all of astronomy. With its effective resolution of just 20 microarcseconds, in principle you could use it to read a newspaper in New York while sitting at a cafe in Paris. But this planet-spanning instrument (it relies on data from radio telescopes on four continents) doesn’t snap pictures like an ordinary camera. Instead, each pair of telescopes measures something called an “interferometric visibility,” which is related to a single Fourier component of the actual underlying image.
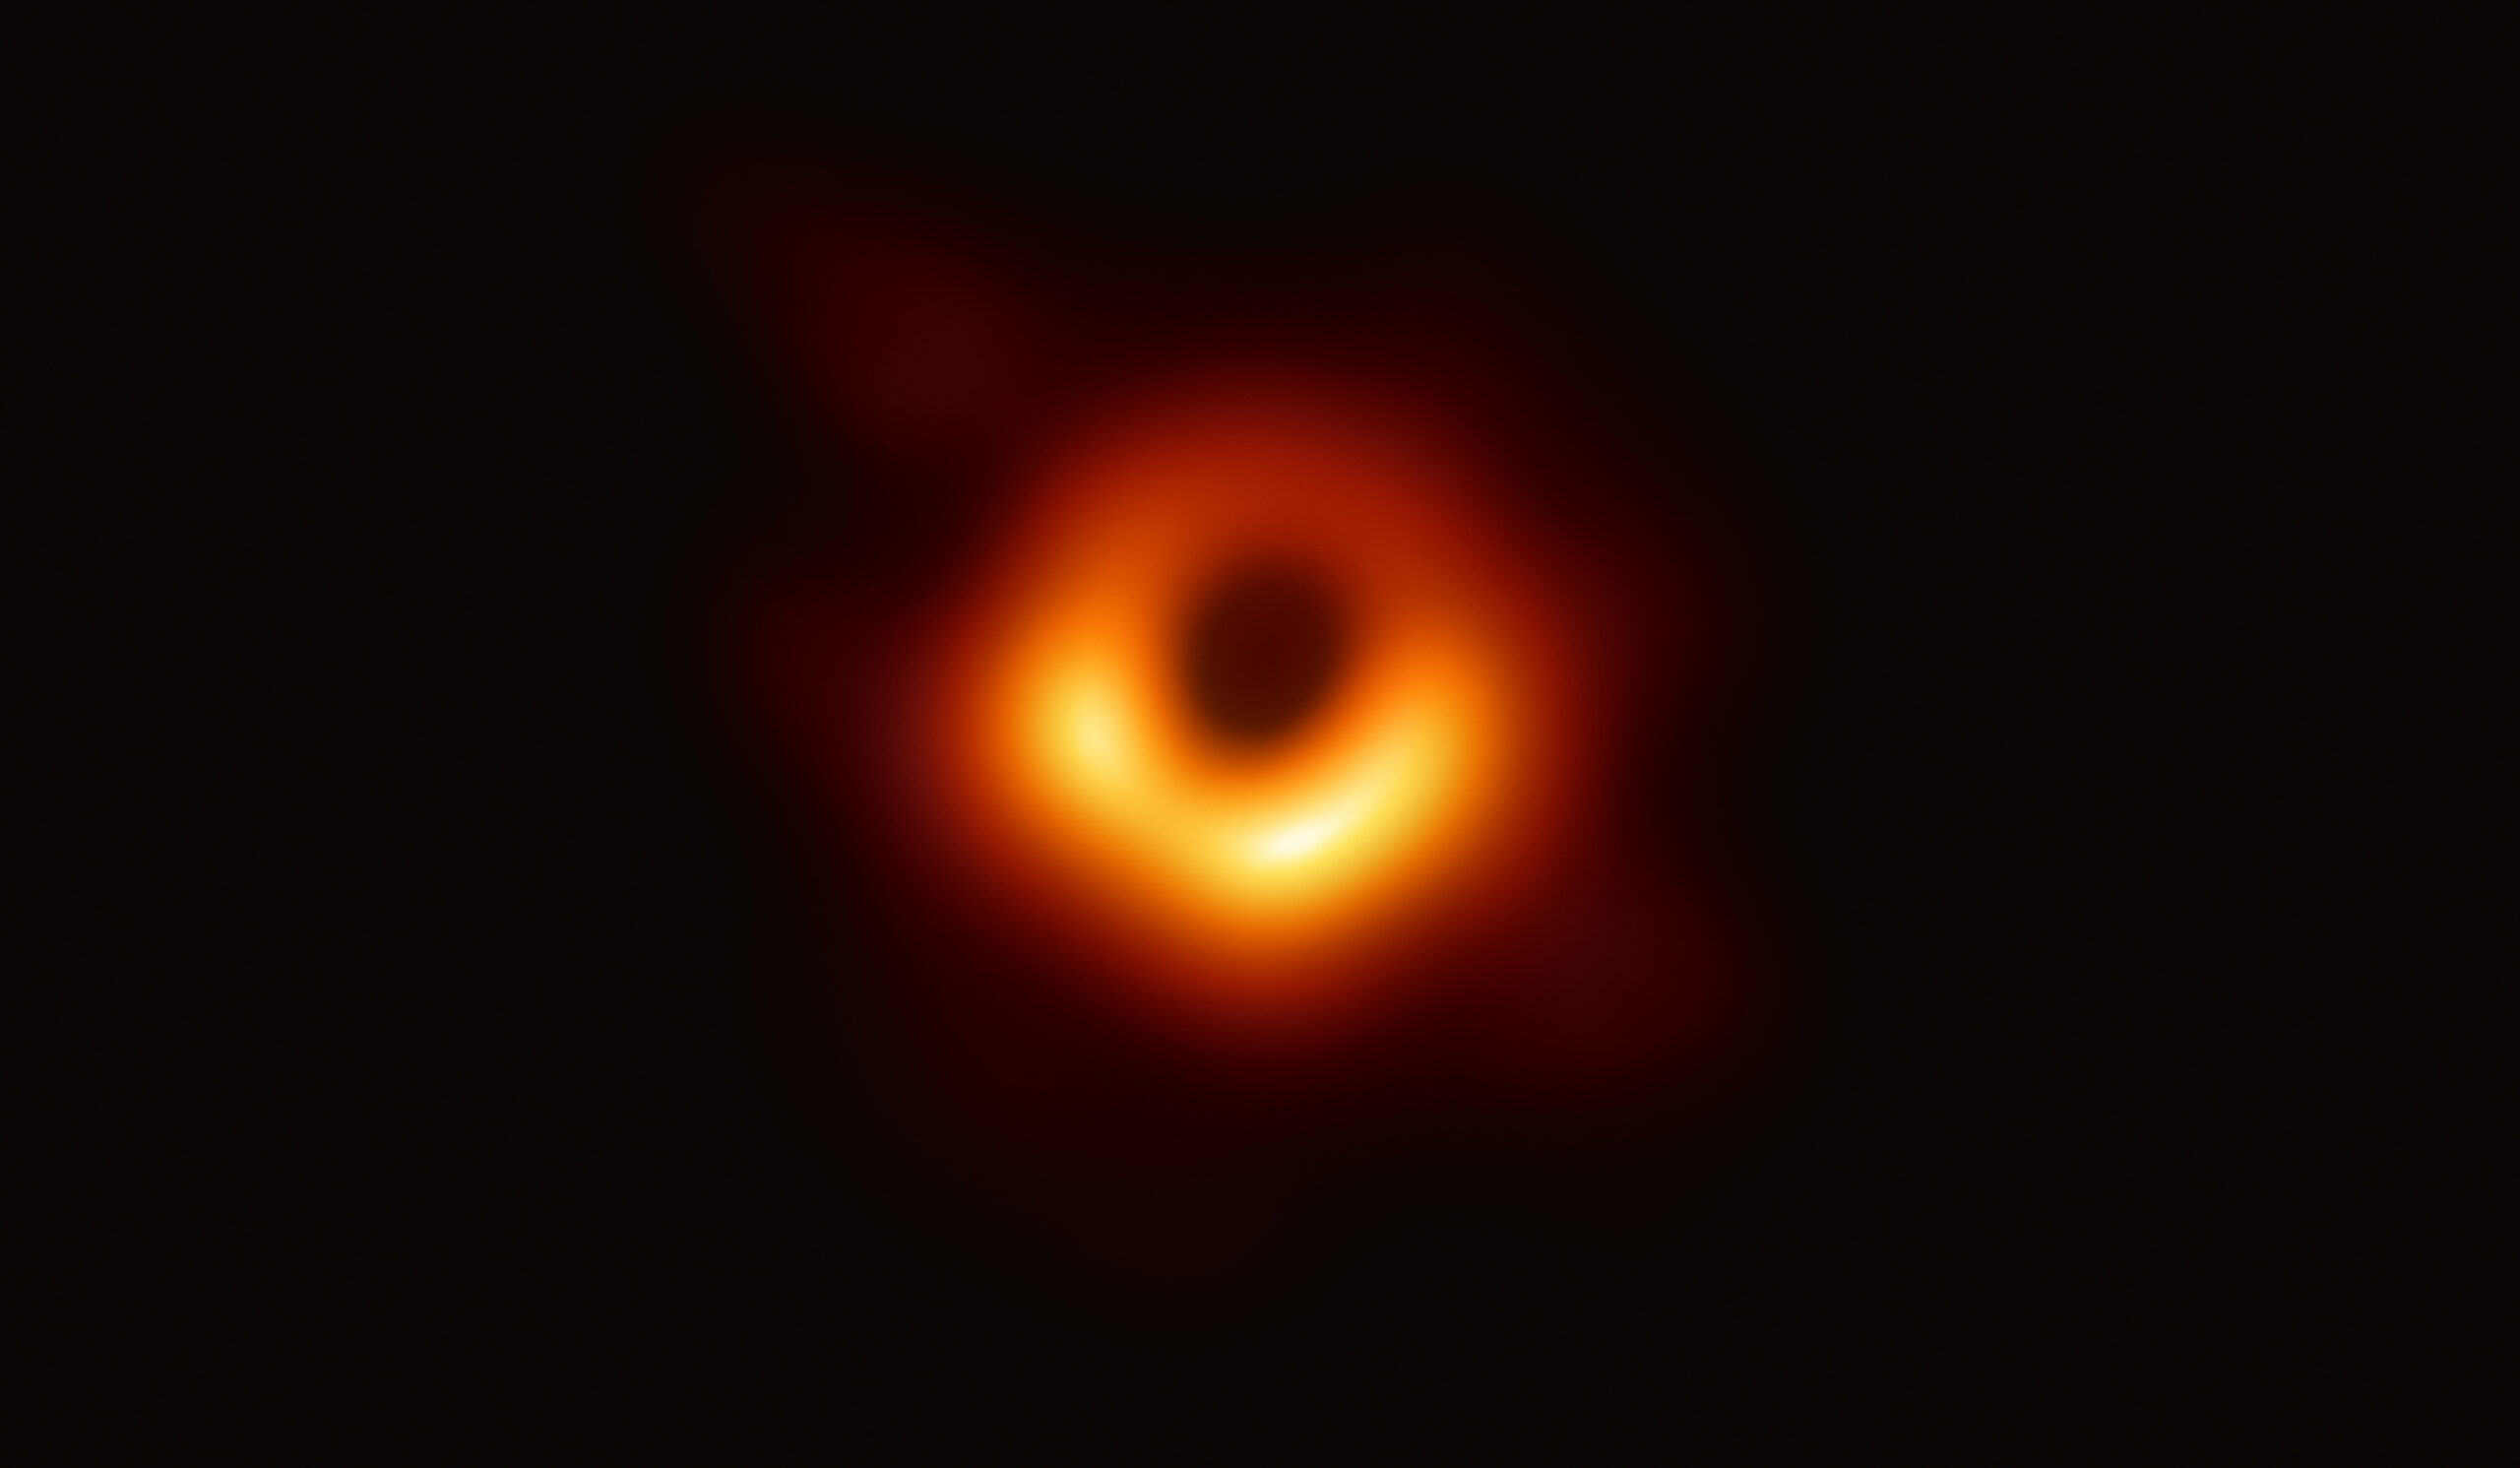
The first image of a black hole, constructed from Event Horizon Telescope data taken in 2017. [EHT Collaboration; CC BY 4.0]
Typically researchers break the problem down into several stages: first calibrate the data, then regularize and construct the best-fitting image, then analyze that image to constrain the actual physics you care about like the width of the ring surrounding a black hole. This is how the original EHT publications went about their groundbreaking work on the now-iconic glowing ring around the supermassive black hole in the galaxy Messier 87 (M87*).
A New Approach
Recent work led by Paul Tiede (Black Hole Initiative at Harvard University) suggests an alternative process. Instead of separating the stages of analysis as described above, the team demonstrated that one could fit everything simultaneously in a framework they call hierarchical interferometric Bayesian imaging, or HIBI.
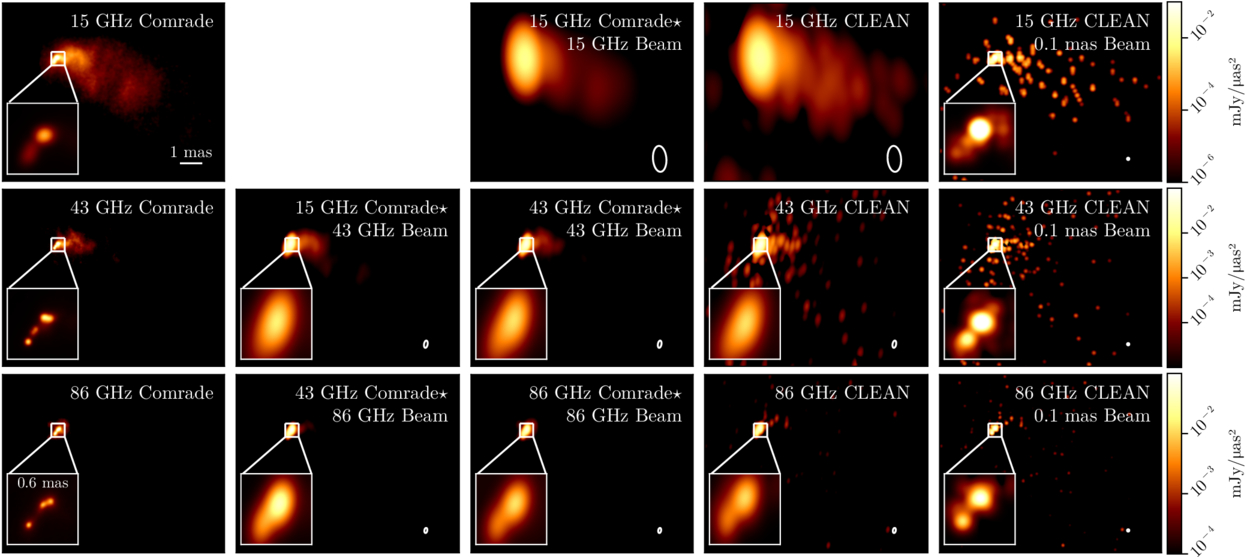
A comparison of the new HIBI technique (referred to as “Comrade” here) and a traditional algorithm called CLEAN. Click to enlarge. [Tiede et al. 2026]
Even more exciting, the team demonstrated that it’s possible to skip the image construction step altogether and go straight to the science. By fitting parameters describing the physics underlying a scene, the team was able to constrain the width of the ring around M87* without any reference to a picture. They predict that this technique could be crucial for extracting information when future instruments like the Next Generation Event Horizon Telescope observe more distant black holes that are only marginally resolved. Though we’ll likely have to wait years for these next-generation telescopes, work like this ensures that astronomers will be able to squeeze as much science from them as possible once these new facilities are ready.
Citation
“Hierarchical Interferometric Bayesian Imaging,” Paul Tiede et al 2026 ApJ 997 262. doi:10.3847/1538-4357/ae2749
The post Enhancing the Sharpest Images appeared first on AAS Nova.
]]>
Astrobites reports on a study of galaxies that are on the brink of entering their "quiet" phase.
The post Observing the End of Star Formation in Galaxies appeared first on AAS Nova.
]]>Editor’s Note: Astrobites is a graduate-student-run organization that digests astrophysical literature for undergraduate students. As part of the partnership between the AAS and astrobites, we occasionally repost astrobites content here at AAS Nova. We hope you enjoy this post from astrobites; the original can be viewed at astrobites.org.
Title: Searching Within Galaxies for the Earliest Signs of Quenching With Spatially Resolved Star Formation Histories in UVCANDELS
Authors: Charlotte Olsen et al.
First Author’s Institution: New York City College of Technology
Status: Published in ApJ
How and Why Do Galaxies Stop Forming Stars?
Galaxies serve as important laboratories for many subfields of astrophysics. As such, astrophysicists are interested in the full galactic life cycle, from how galaxies are born to the end of their formation. Whereas young galaxies in the distant universe are actively forming stars, many nearby galaxies are much quieter, with little or no ongoing star formation. Astronomers like to describe these galaxies as “red and dead” because their stars are older and therefore appear redder in color. The process by which galaxies shut down their star formation is known as quenching, and it causes galaxies to become quiescent. Understanding the origin of quiescent galaxies is a fundamental question in galaxy evolution. Studying this process is challenging, however, because star formation is intertwined with many other factors that shape galaxies, including their environments and supermassive black holes.
Star formation occurs on scales that are much smaller and over timescales much shorter than the global properties and overall lifetime of a galaxy. By observing star formation on these smaller scales over time, astronomers can gain a clearer picture of how star formation ceases in a galaxy, and they can determine whether this process is driven from the inside out — starting with the supermassive black hole in the galactic center — or from the outside in, influenced by environmental effects. In today’s article, the authors use the Cosmic Assembly Near-Infrared Deep Extragalactic Legacy Survey with high-resolution ultraviolet coverage (UVCANDELS) to examine eight “golden” galaxies, shown in Figure 1. They then reconstruct the star formation histories within small regions of each galaxy to detect the “earliest signs of quenching.”
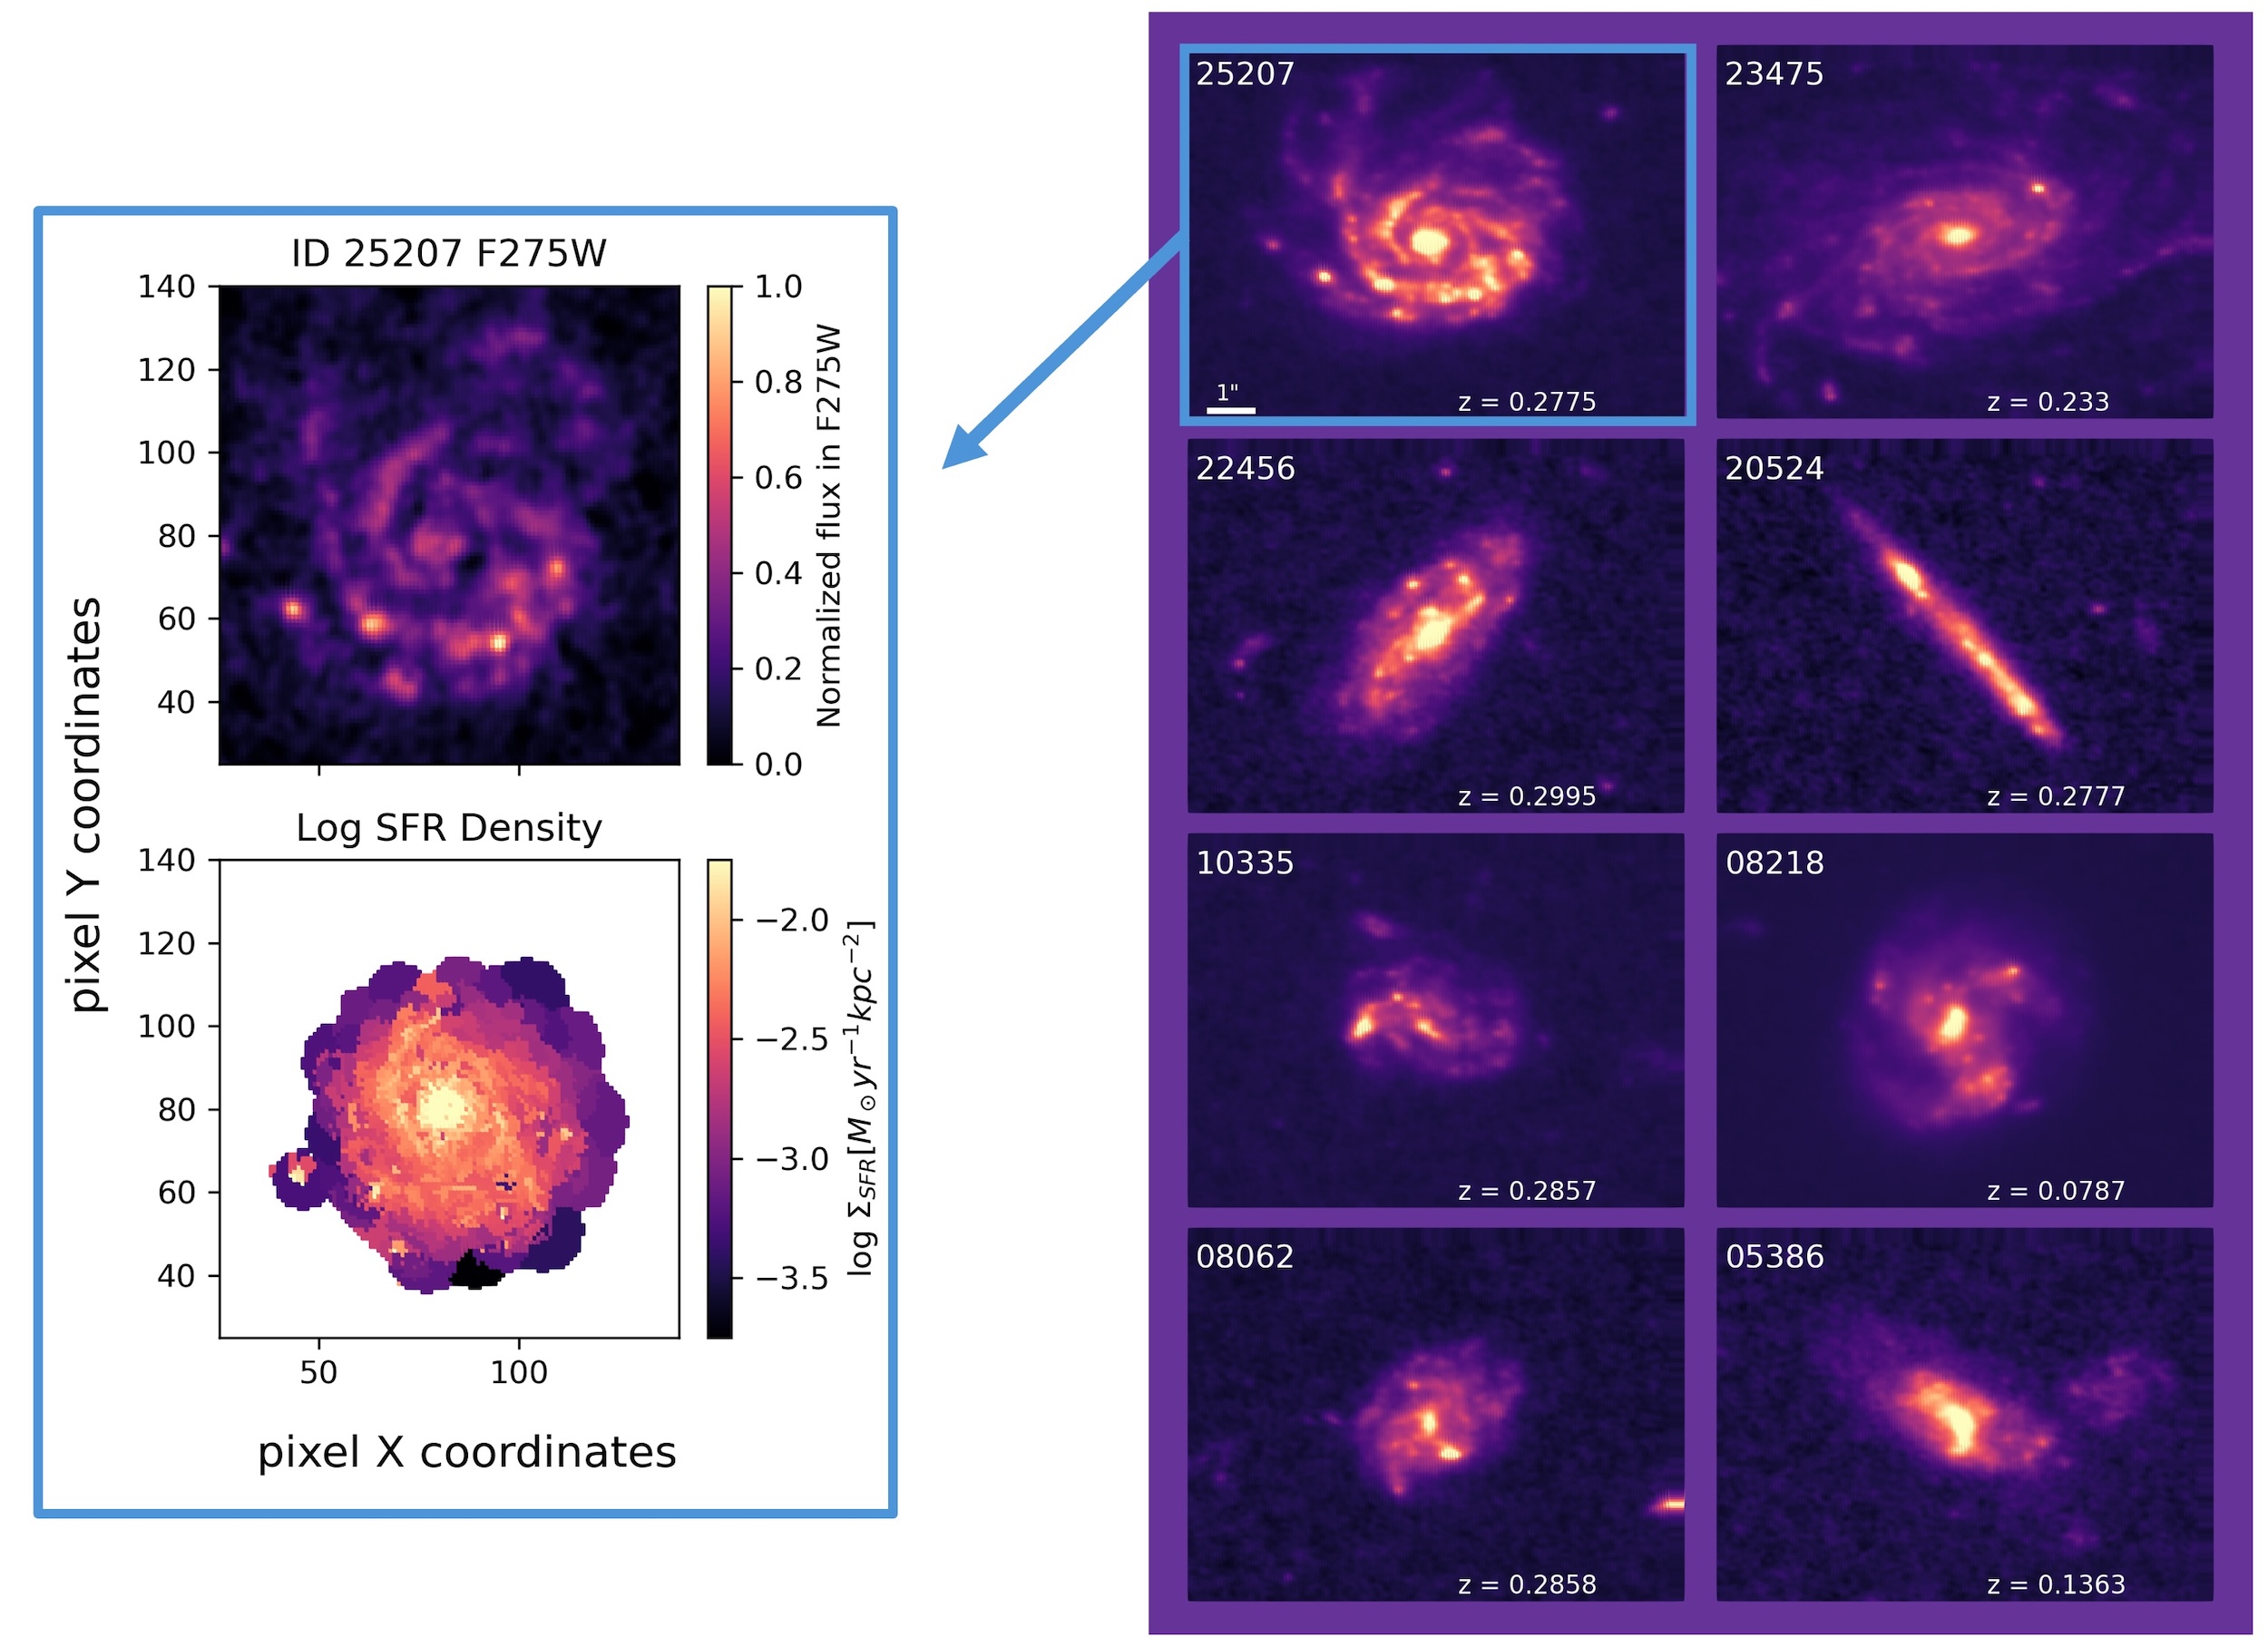
Figure 1: Images of the eight galaxies in the “Golden Sample” of galaxies studied in this work (right). These galaxies were chosen because of their clear detection, and they show a range of edge-on to face-on views as well as shapes. The authors divided each galaxy into small, resolved regions in which they measured the star formation (example shown on left). [Adapted from Olsen et al. 2026]
Characterizing the Star Formation Histories
To trace a galaxy’s star formation over cosmic time, today’s authors model its integrated light — which encodes the many episodes of past star formation — using spectral energy distribution (SED) fitting. By comparing a galaxy’s light across many wavelengths to computer models, SED fitting can estimate the ages of its stars and when they formed. This approach allows astronomers to study how a galaxy’s star formation rate evolves as a function of its stellar mass, known as the SFR – Mstellar relation. Note that the article considers the star formation rate and stellar mass in individual regions of each galaxy, so it analyzes these properties as surface densities, ΣSFR and ΣMstellar, instead of the total values.
Using SED fitting, the authors determine the expected star formation rate and stellar mass of the regions from 250 million to 1 billion years before the time of observation. Figure 2 shows the line of best fit for the SFR – Mstellar relation of the regions for each galaxy, before and at the time of observation. The SFR – Mstellar relations are very similar across the sample 1 billion years before the observations; however, by the time of observation, the overall star formation rates have decreased slightly, indicating that the galaxies are beginning to quench. They also exhibit increased variation suggesting that each galaxy is quenching in a different way.
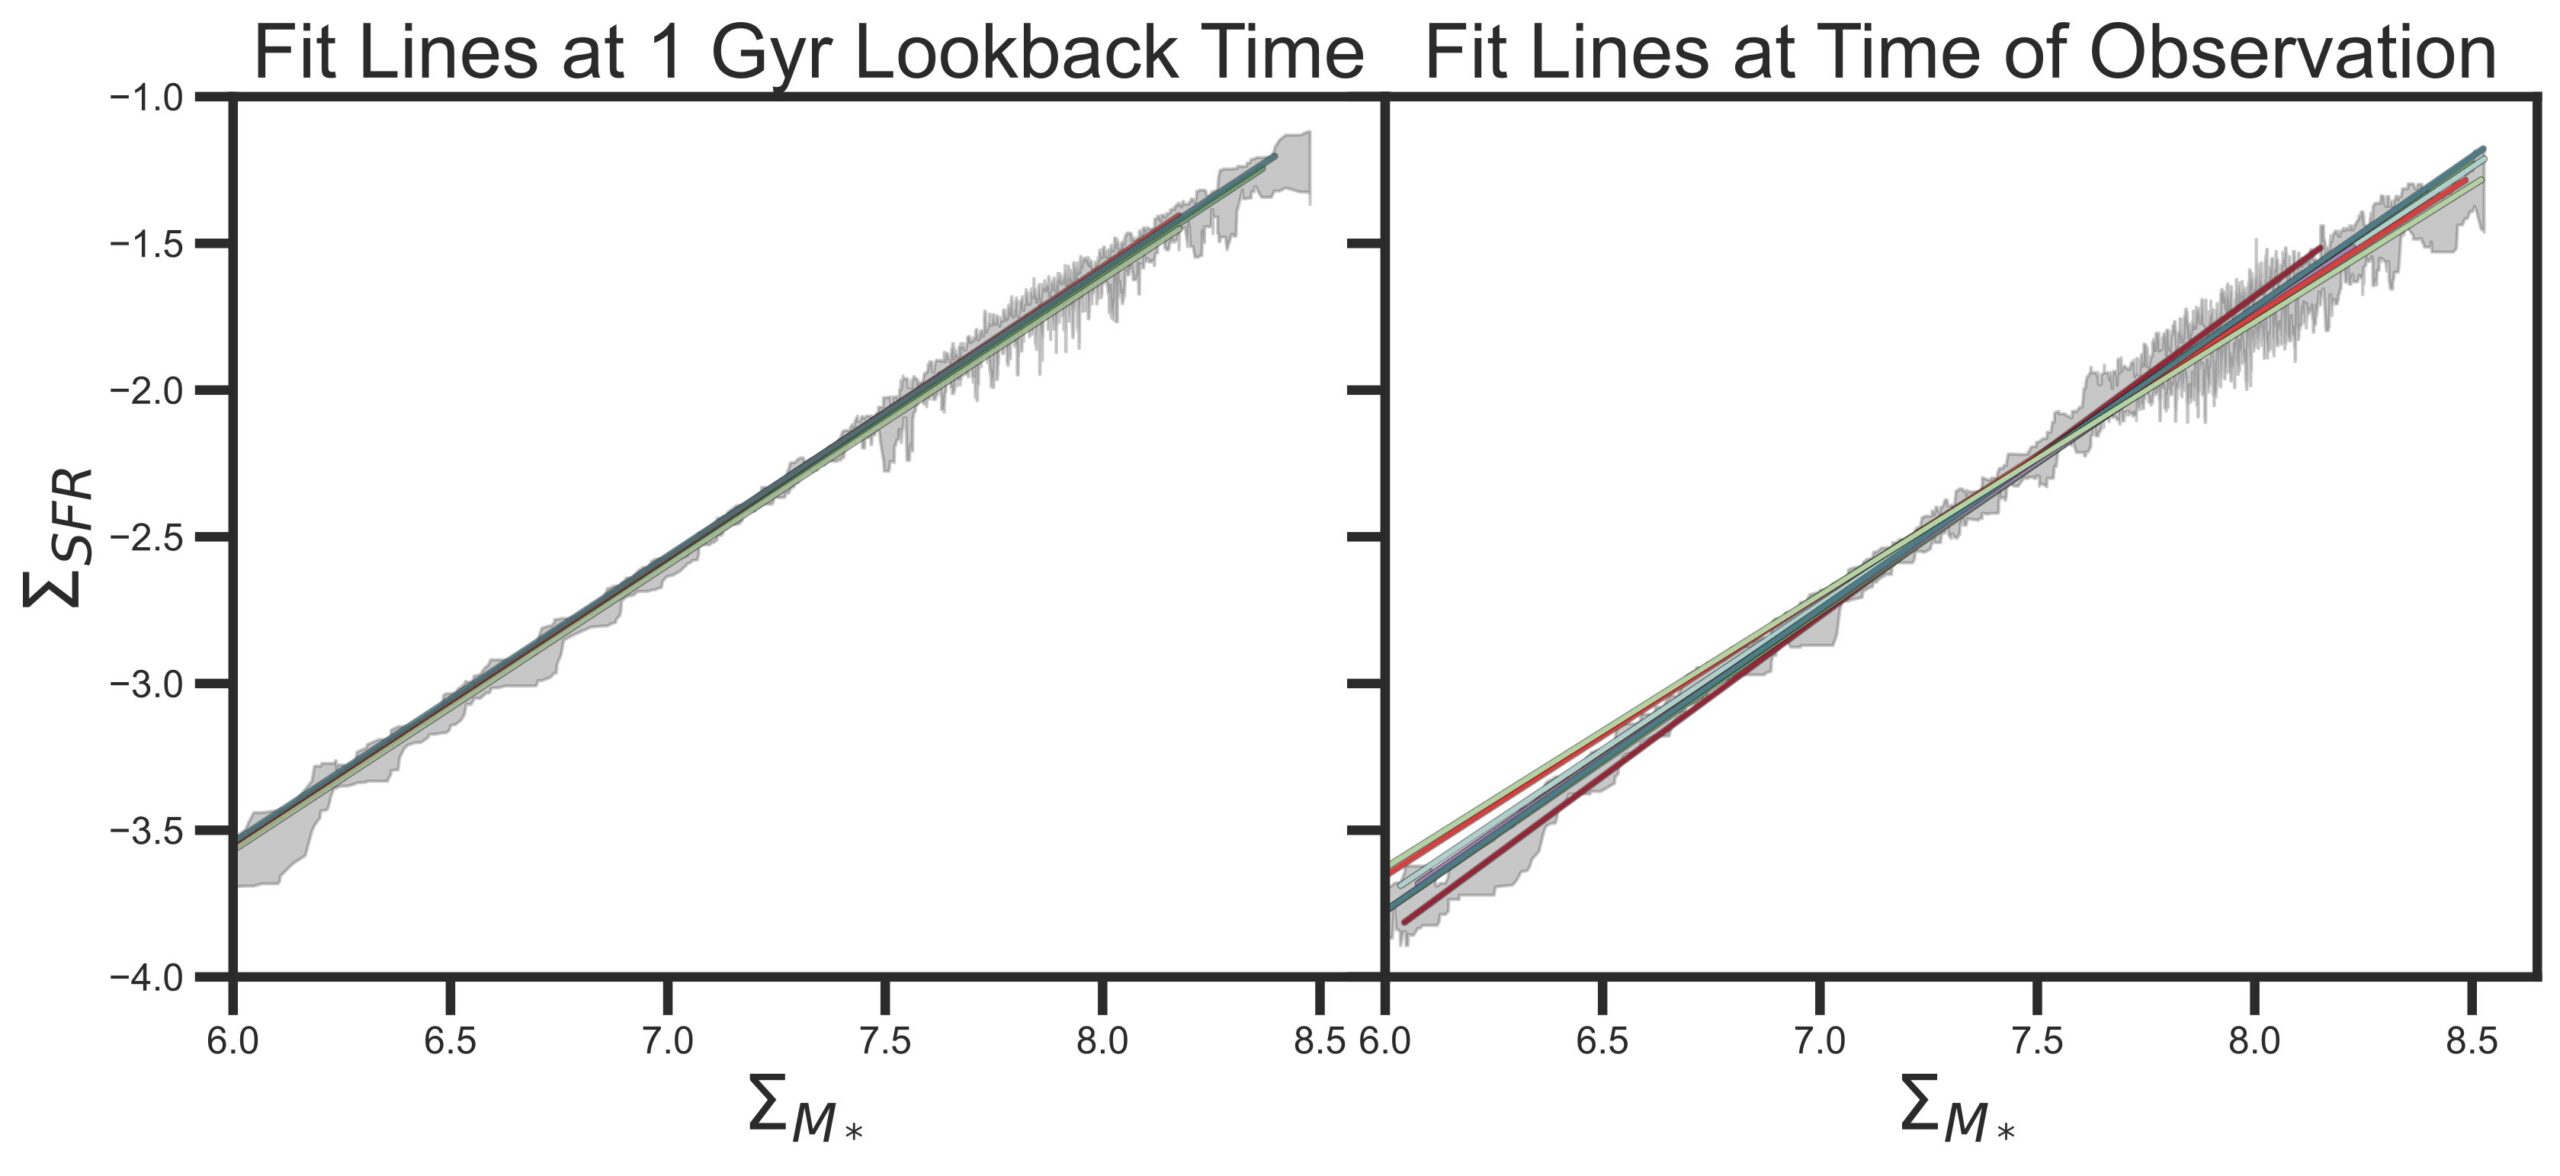
Figure 2: The best-fit SFR – Mstellar relation of the regions for each galaxy, represented by the different colored lines, 1 billion years (1 Gyr) before and at the time of observation (left and right panels, respectively). At 1 billion years before the observation, the galaxies appear to have the same relation, but their variation at the time of observation suggests that the galaxies have begun quenching in different ways. [Olsen et al. 2026]
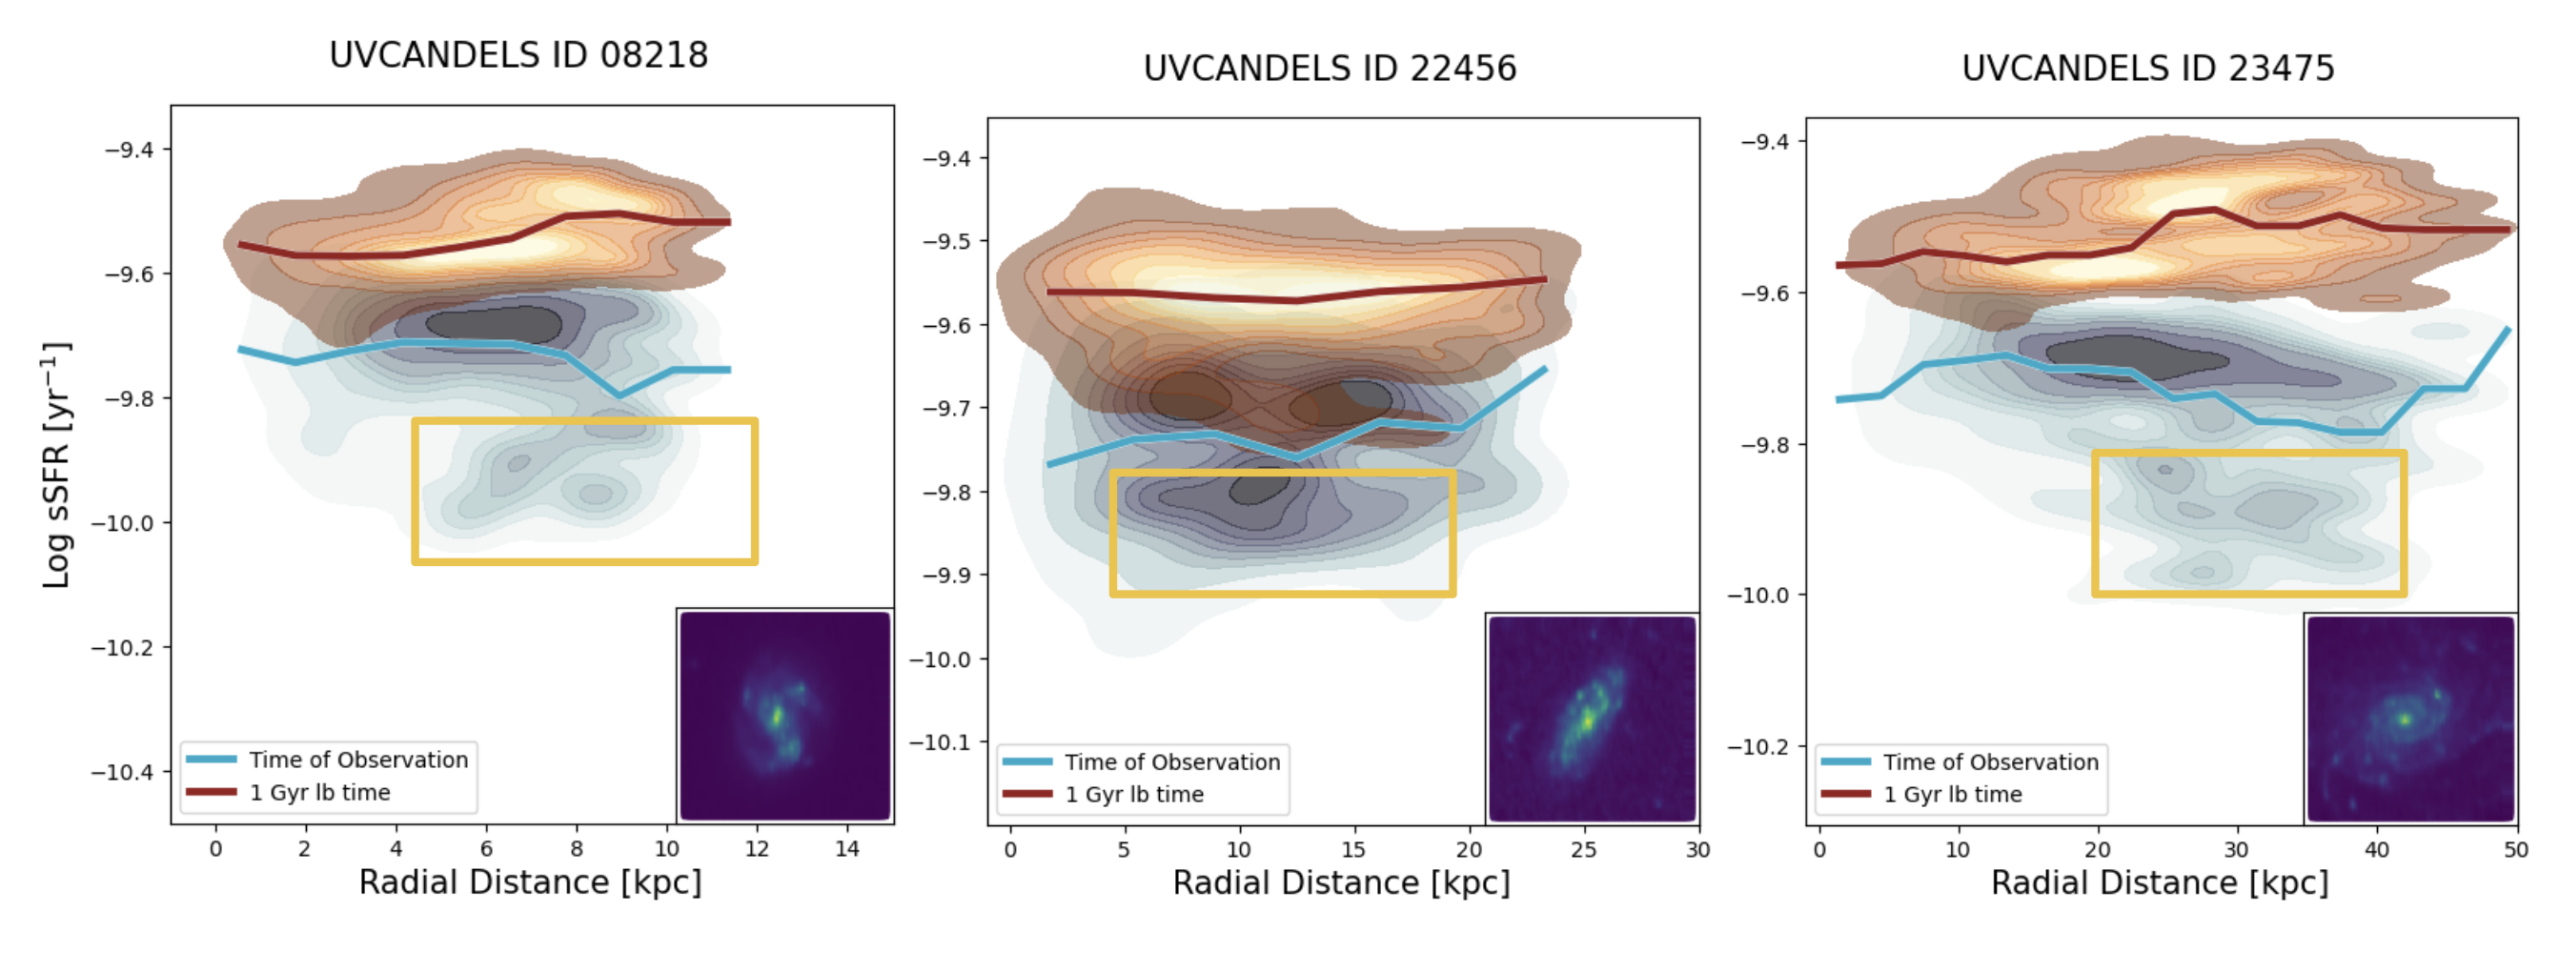
Figure 3: The specific star formation rate of the regions as a function of their distance from the center for three of the galaxies in the sample. Overall, the star formation rate decreases from 1 billion years before the observation (red) to the time of observation (blue). However, the regions where the star formation decreases most significantly (indicated with the yellow boxes) vary from galaxy to galaxy. [Olsen et al. 2026]
Detecting the Earliest Signs of Quenching
It should be noted that all of the galaxies in this study are still forming stars. However, they are on the verge of having their star formation suppressed, offering valuable insight into how quenching begins and how diverse the process can be. New telescopes are pushing the boundaries of what we can observe. On one hand, JWST can capture galaxies at exceptionally high resolution; on the other, the Vera C. Rubin Observatory and the Nancy Grace Roman Space Telescope will deliver vast datasets containing billions of galaxies. Future investigations leveraging these facilities could reveal more about the physical processes that quench galaxies on small scales, shedding light on the mechanisms that drive galaxy evolution.
Original astrobite edited by Catherine Slaughter.
About the author, Shalini Kurinchi-Vendhan:
After studying astrophysics and literature at Caltech, I moved onto a Fulbright Fellowship in Heidelberg, Germany. I’m passionate about using computer simulations to explore supermassive black holes and galaxy evolution — but I also love poetry and traveling.
The post Observing the End of Star Formation in Galaxies appeared first on AAS Nova.
]]>
A comet tangled with a coronal mass ejection and lost part of its tail in the process.
The post Comets Are Lizards: Watching C/2023 P1 Regrow Its Tail appeared first on AAS Nova.
]]>Researchers tracked the tail of comet C/2023 P1 (Nishimura) as it interacted with a string of coronal mass ejections, leading to the first-ever quantitative analysis of a cometary tail detachment event.
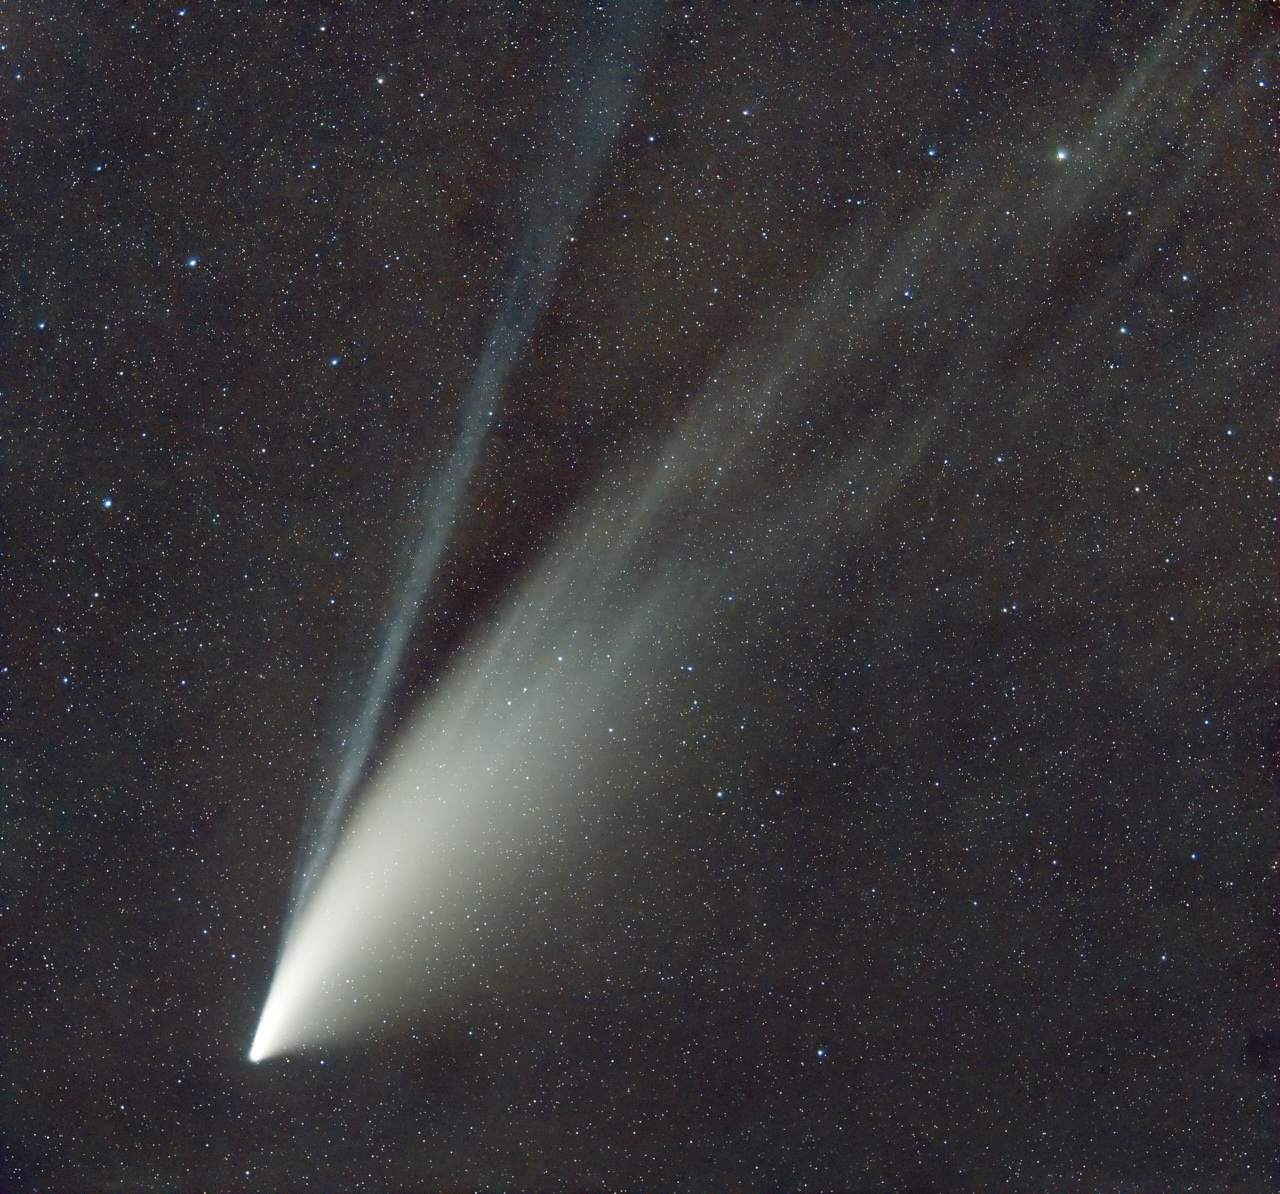
A photo of comet C/2020 F3 (NEOWISE) showing its narrow bluish ion tail and broader white dust tail. [Juan lacruz; CC BY-SA 4.0]
A Comet’s Journey
When comets journey into the inner solar system, they tend to do so sporting two tails: a dust tail that sweeps back from the comet along its curved trajectory and an ion tail that points away from the Sun, in the direction of the interplanetary magnetic field.
The ion tail, which forms when ultraviolet light from the Sun ionizes gas in a comet’s fuzzy coma, interacts with structures in the solar wind, causing it to shift, sputter, and sometimes even disconnect entirely. Now, for the first time, researchers have quantified the timescales involved when a comet loses — and regrows — its tail.
The Tale of a Tail
Shaheda Begum Shaik (George Mason University; US Naval Research Laboratory) and collaborators studied this phenomenon in observations of the comet C/2023 P1 (Nishimura) from 1 to 14 September 2023. In high-resolution images from the Solar Orbiter Heliospheric Imager, Shaik’s team analyzed the dynamics of C/2023 P1’s tail as the comet braved blustery solar wind conditions in the inner solar system.
In a two-week period, the comet underwent four separate tail disconnection events, in which the connection between the ion tail and the comet was severed. Each of these events coincided with the passage of a coronal mass ejection: a tangled mass of solar plasma and magnetic fields ejected from the Sun’s outer atmosphere.
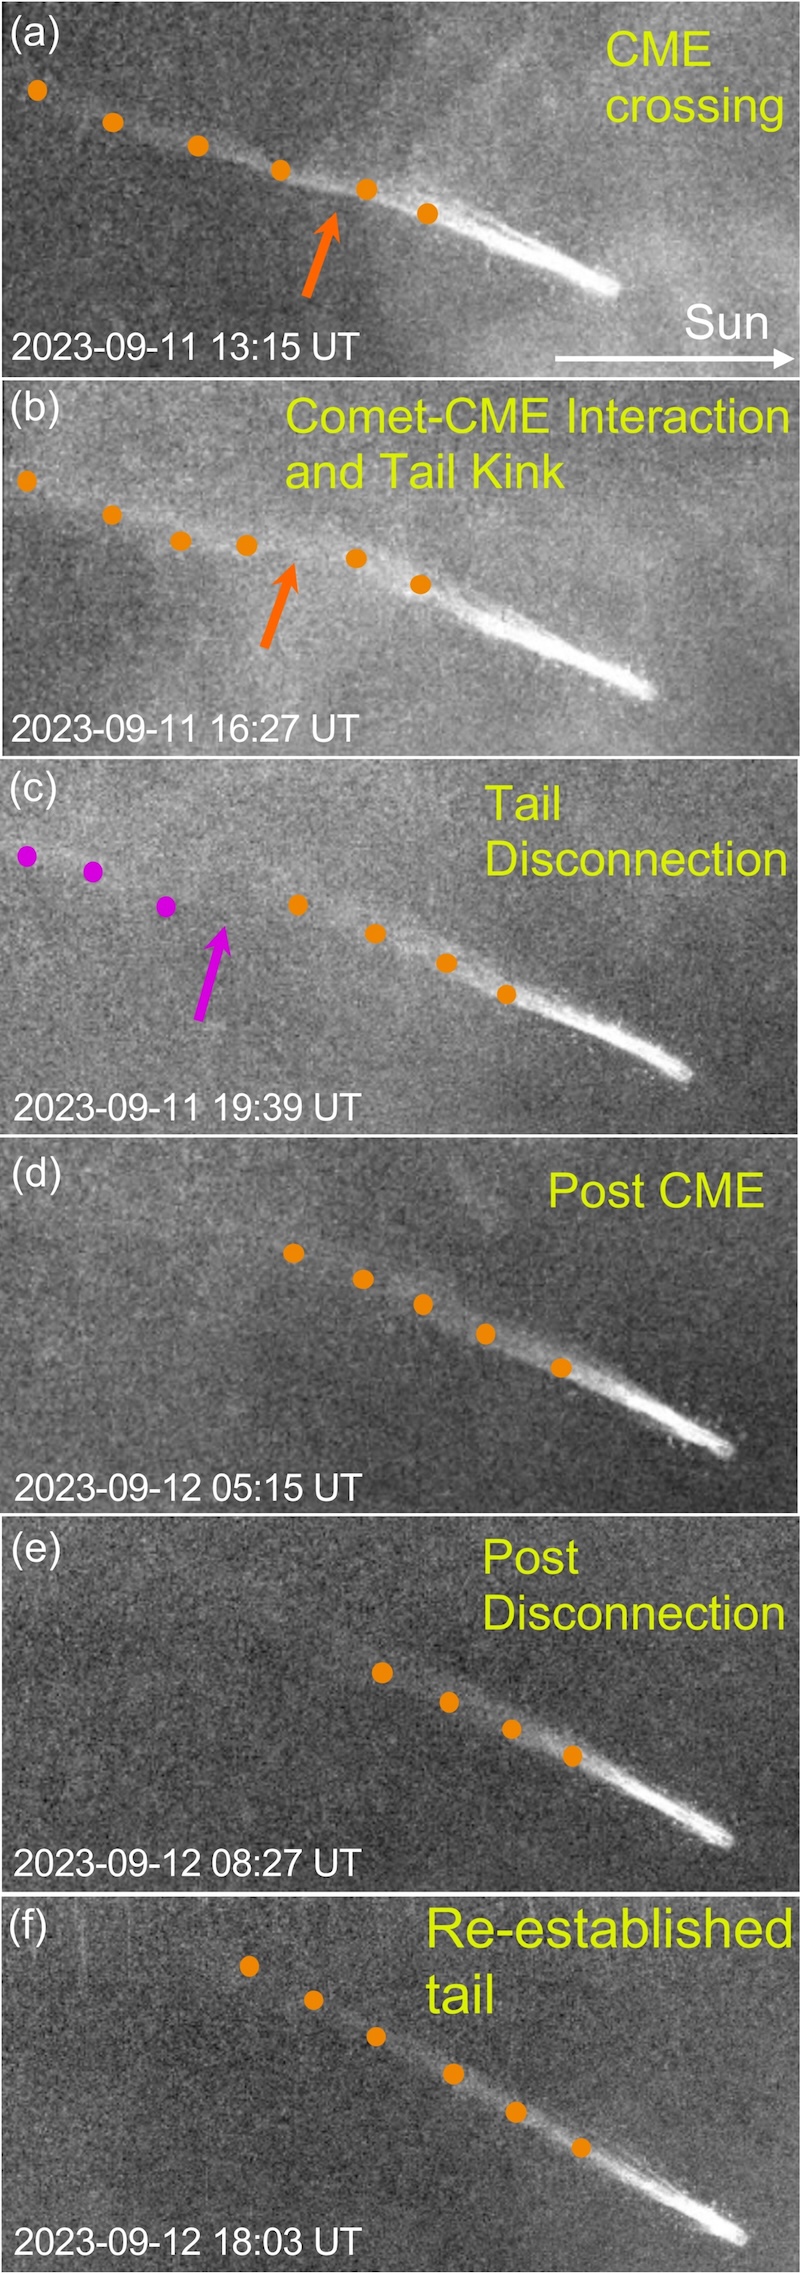
Solar Orbiter Heliospheric Imager observations of the 11 September 2023 tail disconnection event, which was driven by a passing coronal mass ejection (CME). [Shaik et al. 2026]
Lizard-Like Regrowth
Focusing on the tail disconnection event with the highest-resolution and highest-cadence data, Shaik’s team observed constant small-scale fluttering of the ion tail, reflecting the buffeting of the tail by the solar wind. The tail then developed a kink, which the team speculated is due to compressed solar wind plasma piling up in front of an oncoming coronal mass ejection. The wide-field images show the coronal mass ejection advancing upon the comet and the comet’s tail seemingly being sliced in two.
The free-floating tail segment sped away from the comet at roughly 295 km/s, likely indicating that the tail became caught up in and was transported by the flank of the coronal mass ejection as it barreled past the comet. The timescale and geometry of the event suggest that the interaction of the coronal mass ejection’s magnetic field with the comet’s tail was responsible for the disconnection.
Over the following 24 hours, the comet’s tail slowly regrew at a rate of 86 km/s to its original length of 1.9 million kilometers. The rate of regrowth is likely determined by several factors, such as the rate at which the comet produces ions and the local magnetic field configuration. This work represents a first look at the quantitative behavior of a tail disconnection event, paving the way for future investigations of cometary behavior and a greater understanding of the complex magnetic and plasma environment of the inner solar system.
Citation
“The First Quantitative Study of Cometary Tail Regrowth Following a Coronal Mass Ejection-Driven Disconnection Event,” Shaheda Begum Shaik et al 2026 ApJ 999 60. doi:10.3847/1538-4357/ae3bdb
The post Comets Are Lizards: Watching C/2023 P1 Regrow Its Tail appeared first on AAS Nova.
]]>
JWST examines one of the most active star-forming regions in the Milky Way, where two massive protoclusters are shaping 10,000 solar masses of gas into new stars.
The post Featured Image: Massive Stars in the Making appeared first on AAS Nova.
]]>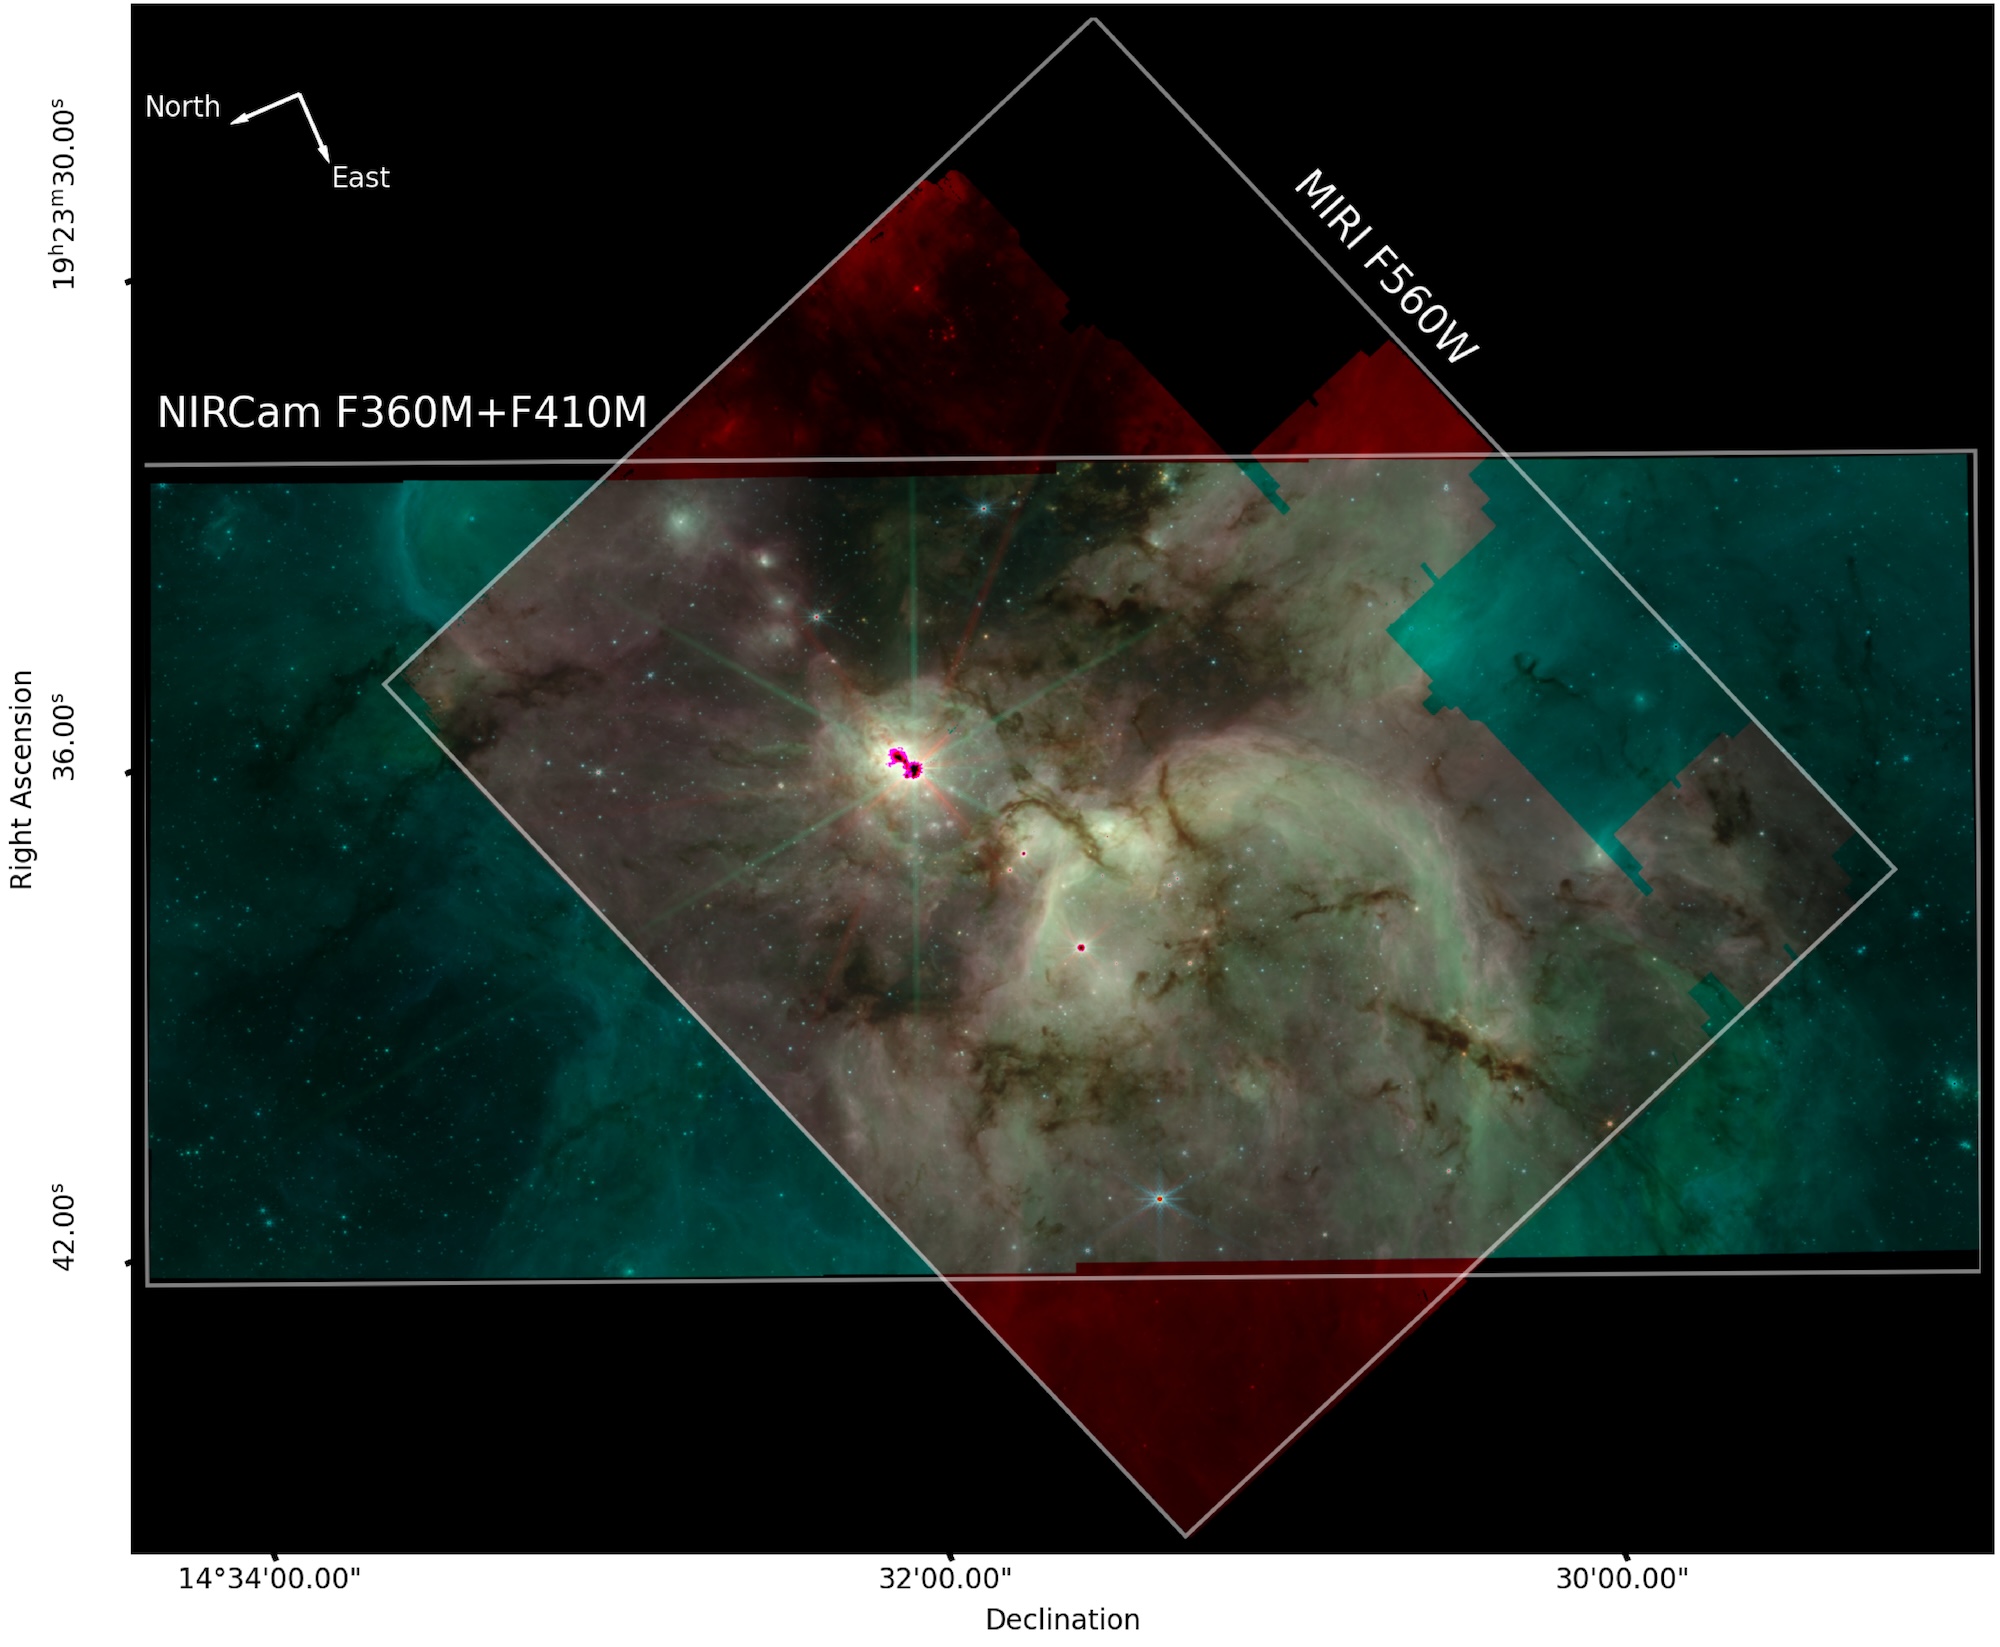
The full view of the study region, showing the NIRCam and MIRI footprints. [Yoo et al. 2026]
Citation
“A JWST NIRCam/MIRI View of the W51A High-Mass Star-Forming Region,” Taehwa Yoo et al 2026 AJ 171 208. doi:10.3847/1538-3881/ae40b7
The post Featured Image: Massive Stars in the Making appeared first on AAS Nova.
]]>
Are you an astronomy graduate student who’s interested in science communication? Apply for the AAS Media Fellowship by June 26!
The post AAS Media Fellowship Now Open for Applications appeared first on AAS Nova.
]]>Are you an astronomy graduate student who’s interested in science communication? Do you wish you had the opportunity to explore that interest and gain professional development without having to take time off from your graduate studies? Do you want to write for AAS Nova, report on astronomy meetings, help organize and run press conferences, and learn the ins and outs of academic publishing?
Then the AAS Media Fellowship might be for you! This position was developed in 2017 by the American Astronomical Society to provide training and experience for graduate students in the astronomical sciences who are interested in science communication. The fellowship is a remote, quarter-time, one-year (with the possibility of extension to two years) position intended to be filled by current graduate students at US institutions. This year, for the first time, we intend to hire two Media Fellows. The new AAS Media Fellowship term will begin in Fall 2026.
If this sounds like a good fit for you, you can get more information below or at the job register posting. Apply by 26 June 2026 by submitting your contact information, a cover letter, and a short CV to personnel@aas.org. See the job register posting for the full application details.
Essential Duties & Responsibilities
The AAS Media Fellow(s) will report to the AAS Communications Manager. The Fellow(s) will work the equivalent of one day per week (on a schedule that will be jointly developed and agreed upon by the Fellow(s), the AAS Director of Communications & Media Relations, and the AAS Communications Manager) and be responsible for a wide range of duties. The Fellow(s) will be expected to do the following:
- Assist in sharing astronomy press releases via AAS press office channels.
- Regularly (nominally 2–3 times per month) write and publish articles for AAS Nova.
- Occasionally help to prepare other written communications such as AAS or Division press releases.
- Assist in managing AAS communications such as social media accounts, postings to the AAS website, and emails to members or authors.
- Serve as backup to the AAS Director of Communications & Media Relations or the AAS Communications Manager during absences for daily tasks like distributing press releases and publishing AAS Nova posts.
- In the lead-up to and at the AAS winter and summer meetings, help the AAS Director of Communications & Media Relations plan and run press conferences; help represent AAS Nova; and help organize and participate in the live-blogging coverage of the meeting by Astrobites and AAS Nova.
Qualifications
Each Fellow must:
- Be a graduate student in good standing in the astronomical sciences or a related field at a US institution.
- Receive the approval of their advisor or department chair to apply.
- Receive their primary support from their home institution.
- Have a keen eye for detail and accuracy.
- Have the ability to absorb complex material, synthesize information, and write short articles that concisely reflect key points of the material to a target audience.
- Have good working knowledge of, and/or ability to quickly master, tools such as WordPress, Drupal, Microsoft Office, and Adobe Creative Suite.
Compensation
The stipend for this position is $7,500 per year for the equivalent of one day of work per week, payable on a quarterly basis. Travel support will also be provided for travel to one AAS meeting each year.
The post AAS Media Fellowship Now Open for Applications appeared first on AAS Nova.
]]>
Astrobites reports on an intriguing new object that may be an early universe supermassive black hole shedding its gas cocoon.
The post A Potential New Piece of the “Little Red Dot” Puzzle appeared first on AAS Nova.
]]>Editor’s Note: Astrobites is a graduate-student-run organization that digests astrophysical literature for undergraduate students. As part of the partnership between the AAS and astrobites, we occasionally repost astrobites content here at AAS Nova. We hope you enjoy this post from astrobites; the original can be viewed at astrobites.org.
Title: The X-Ray Dot: Exotic Dust or a Late-Stage Little Red Dot?
Authors: Raphael E. Hviding et al.
First Author’s Institution: Max Planck Institute for Astronomy
Status: Published in ApJL
What Are Little Red Dots?
One of the most intriguing results produced by JWST was the serendipitous discovery of a new class of object: “little red dots” (LRDs). These objects started popping up everywhere in our early universe observations. Surprisingly, they look like compact (little) red dots in imaging data (astronomers are an incredibly creative bunch). The number of LRDs we observe drops drastically at redshifts less than about z = 4 (about 12 billion years ago), implying that LRDs are likely evolving into something else entirely. The luminous, compact nature of LRDs, paired with their disappearance from the cosmic stage, has continuously puzzled astronomers in recent years.
At least part of the LRD population has routinely been explained as a new class of active galactic nuclei (AGN). AGN are the central engines of many galaxies — luminous regions powered by actively accreting supermassive black holes. Recent evidence has increasingly pointed towards LRDs being a new class of AGN: black hole stars, or black holes surrounded by dense cocoons of gas. Naturally, this raises questions surrounding the placement of LRDs in our understanding of supermassive black hole and galaxy evolution across cosmic time.
A hallmark of typical AGNs is their X-ray brightness. X-rays are one of the most energetic types of electromagnetic radiation, and they are primarily produced by the most extreme astrophysical situations (think neutron star mergers). One of the key challenges in explaining the nature of LRDs has been their lack of X-ray emission. Their lack of emission in this regime is a piece of evidence pointing towards a black hole star scenario — dense gas can block the X-rays being produced by the black hole. However, the lack of LRDs in the present-day universe implies that they likely shed their cocoons at some point. Catching an LRD in the act of shedding its cocoon would thus provide an important piece of evidence surrounding their nature and evolution. Thankfully, today’s authors may have done exactly that! They report the discovery of what they call the “X-ray dot” (XRD): an LRD-like object that is also X-ray luminous at a redshift of approximately z = 3.28.
New JWST Observations of the XRD
While archival observations of the XRD with the Hubble Space Telescope, the Canada France Hawaii Telescope, the Spitzer Space Telescope, and the Chandra X-ray Observatory existed, new spectral data from JWST were needed to study the system in depth. Spectral data have a huge advantage over photometric observations when it comes to modeling the system. With a good quality spectrum, astronomers can use sophisticated modeling tools to try and pin down the physical nature of the emission we’re observing, and thus understand its intrinsic nature.
Figure 1 showcases the archival data from Hubble, Spitzer, and Chandra, along with the XRD’s spectrum from JWST (black curve, bottom panel). Photometric observations of the source indicate that it is incredibly compact (radius ≲ 250 pc, about 100 times more compact than the Milky Way) and shows similarities to LRD spectra, but with some key differences. (An example LRD spectrum is shown as the red curve in Figure 1.) The impressive X-ray luminosity of the XRD — typical of standard AGNs — is another key difference between it and standard LRDs.
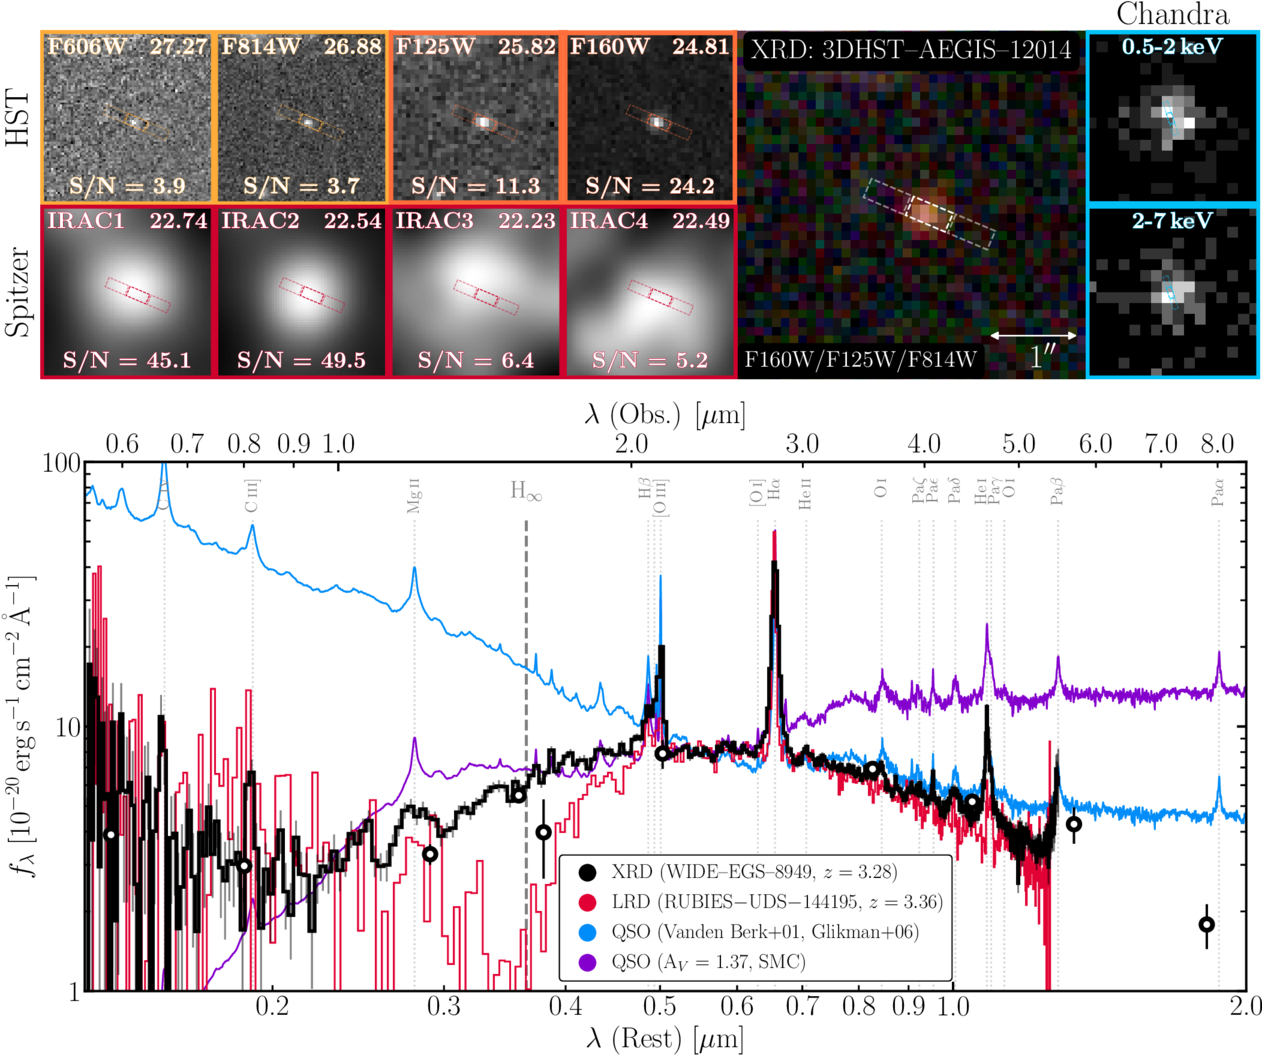
Figure 1: Top: Image cutouts from various Hubble, Spitzer, and Chandra observations of the XRD. Bottom: The spectrum of the XRD (black) shown alongside a similar LRD spectrum (red) and two quasar spectra (blue and purple), one of which has been reddened due to the presence of dust (purple). [Hviding et al. 2026]
So…What’s the Deal with the XRD?
To understand the nature of the XRD, the authors fit a variety of models describing a wide range of physical systems to the available data. Surprisingly, their best-fit models indicate that if the XRD is simply a typical AGN heavily obscured by astrophysical dust, its dust properties are drastically different from those of typical galaxies and AGN. Instead, trying to explain the system as an AGN embedded in a cocoon of gas (the black hole star model) provides better results (more aligned with observed LRDs), but it still isn’t perfect.
Notably, the emission in the ultraviolet-to-optical regime of the electromagnetic spectrum differs greatly from that of LRDs. In LRDs, this emission is indicative of a single dense gas component around the supermassive black hole, while in the XRD the authors find evidence suggestive of a patchier, less uniform distribution of gas. However, in order for this explanation to match the data, physical conditions of the model must be finely tuned, suggesting that this model may need to be refined further. These factors seem to suggest that the XRD is poorly understood in the context of our current paradigm of models describing AGNs and LRDs. The potentially patchy nature of the XRD’s gas envelope could suggest that this object is an LRD in the process of shedding its outer envelope, evolving into a typical AGN.
Regardless of its true nature, the XRD opens up new doors in our understanding of AGNs and LRDs. It provides an exciting glimpse at AGN evolution in action — a transitional fossil for early universe black holes. With a new piece of the puzzle slotted into our picture of AGN evolution, it’s only a matter of time before astronomers fully contextualize the stubbornly enigmatic LRDs.
Original astrobite edited by Ansh R. Gupta.
About the author, Drew Lapeer:
Drew is a first-year PhD student at the University of Massachusetts Amherst. They are broadly interested in the evolution of galaxies, with a focus on the impact of cosmic feedback on the galactic ecosystem. In their free time, they enjoy reading, rock climbing, hiking, and baking!
The post A Potential New Piece of the “Little Red Dot” Puzzle appeared first on AAS Nova.
]]>
Researchers investigate the possibility that the off-center black hole and double nucleus of NGC 4486B can be traced to a recent supermassive black hole merger.
The post Signs of a Supermassive Black Hole Merger in NGC 4486B appeared first on AAS Nova.
]]>The galaxy NGC 4486B appears calm and collected, but its center may have been roiled by a recent merger of supermassive black holes. New modeling explores the stellar dynamics that support this hypothesis.
Strange Center
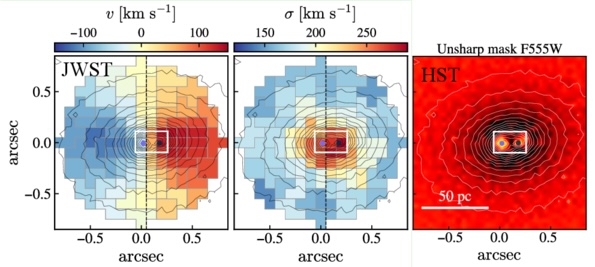
Kinematic maps of NGC 4486B showing the locations of the two peaks of its double nucleus. Click to enlarge. [Adapted from Tahmasebzadeh et al. 2026]
Now, a team led by Behzad Tahmasebzadeh (University of Michigan; Villanova University) has investigated the possibility that NGC 4486B’s double nucleus and off-center black hole can be traced to the aftermath of a supermassive black hole merger.
Simulating Kinematics
In this scenario, the black hole is displaced from the galaxy’s center because of a “kick” it received when it underwent a merger. The double nucleus is a sign of an eccentric nuclear disk: a central disk of stars on aligned elliptical orbits created when merging supermassive black holes disturb an initially orderly disk of stars.
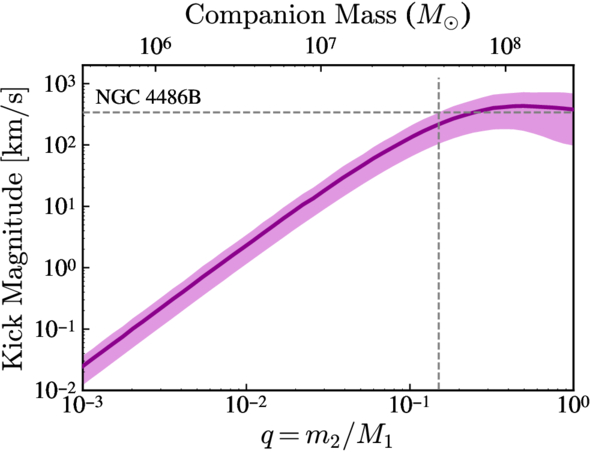
Estimated black hole kick magnitude as a function of the initial mass ratio of the black hole binary. Click to enlarge. [Tahmasebzadeh et al. 2026]
To explore this scenario further, the team carried out N-body simulations of the post-merger black hole’s behavior. These simulations showed that after being booted from the galactic center by the post-merger kick, the black hole returns to the center quickly — within 10–80 million years, depending on the kick strength. Because NGC 4486B’s supermassive black hole is notably off center, this suggests that the merger occurred recently.
Galaxy Merger Versus Black Hole Merger
Tahmasebzadeh’s team tested two other theories that could explain the appearance of NGC 4486B’s nucleus: dynamical buoyancy and a pre-merger supermassive black hole binary. Neither of these scenarios could reproduce the offsets seen in the center of the galaxy.
The team noted that NGC 4486B appears to be in equilibrium, with no sign of a recent merger that could have plunked a second supermassive black hole into the galaxy. How can this fact be reconciled with the evidence for a recent black hole merger? Turning again to simulations, the team found that if the black hole binary’s orbit was aligned with the galaxy’s rotation, the binary could have become trapped in a resonance that greatly delayed the merger of the black holes. This makes it possible that NGC 4486B underwent a galaxy merger in the distant past, but its central black hole merged only recently, leaving signs of a long-ago merger that has otherwise faded from view.
Citation
“JWST Observations of the Double Nucleus in NGC 4486B: Possible Evidence for a Recent Binary SMBH Merger and Recoil,” Behzad Tahmasebzadeh et al 2026 ApJL 1001 L14. doi:10.3847/2041-8213/ae52ef
The post Signs of a Supermassive Black Hole Merger in NGC 4486B appeared first on AAS Nova.
]]>
A recent study uses high-resolution JWST observations to perform an atmospheric analysis of a rare exoplanet orbiting a dead star.
The post Characterizing the Atmosphere of Exoplanet WD 0806b with JWST appeared first on AAS Nova.
]]>Orbiting a white dwarf, the exoplanet WD 0806b is the subject of a recent study using JWST to measure the atmospheric conditions governing the planet.
Directly Imaged Exoplanet WD 0806b
Most of the 6,000 and counting exoplanets discovered thus far have been detected due to their impacts on their host star — passing in front of the star and causing it to dim, or gravitationally tugging on the star and causing it to wobble. On rare occasions, though, astronomers have been able to catch the exoplanet itself through direct imaging. Directly imaged exoplanets offer key insights that cannot be obtained through indirect detection methods. Luminosity measurements and spectral emission features allow astronomers to more directly measure planet mass, radius, and composition otherwise inferred from the host star.

NIRCam image showing host star WD 0806 circled in orange and the location of exoplanet WD 0806b marked by the orange arrow. [Lew et al 2026]
WD 0806b’s Atmospheric Abundances from JWST
Aiming to characterize the physical properties and atmospheric composition of WD 0806b, Ben W.P. Lew (Bay Area Environmental Research Institute; NASA Ames Research Center) and collaborators used JWST’s Near-Infrared Camera (NIRCam) and Near-Infrared Spectrograph (NIRSpec) to obtain high-resolution imaging and spectroscopy of the exoplanet. Combining these observations, prior lower-resolution observations, and evolutionary planet models, the authors estimated the physical properties of WD 0806b including mass, radius, surface gravity, and effective temperature.

NIRSpec spectrum of WD 0806b with best-fit model spectra overlaid. [Lew et al 2026]
This study highlights how high-precision JWST data can reveal a rich collection of atmospheric conditions, chemical composition, and physical processes occurring in cold giant planets. With such a wide orbit from its host white dwarf, WD 0806b serves as an interesting case study for how giant planet composition may reflect the formation and evolutionary history of the overall system. Future observations of and comparisons to similarly cold giant planets will further uncover how atmospheric characterization may fit into our understanding of exoplanets and their histories.
Citation
“JWST Spectral Retrieval of Cold Directly Imaged Planet WD 0806b and the First Measurement of Altitude-dependent Kzz in Exoplanet Atmospheres,” Ben W.P. Lew et al 2026 AJ 171 227. doi:10.3847/1538-3881/ae4747
The post Characterizing the Atmosphere of Exoplanet WD 0806b with JWST appeared first on AAS Nova.
]]>
Neutron stars contain some of the most extreme matter in the universe, and researchers are exploring a promising but challenging way to probe their interiors.
The post A Mysterious Spectral Feature Could Help Crack the Case of Neutron Star Structure appeared first on AAS Nova.
]]>Neutron stars are composed of some of the most extreme material in the universe, and their internal properties are challenging to determine. Recently, researchers investigated an unusual spectral feature that may help to probe the interiors of neutron stars.
Examining Extreme Matter
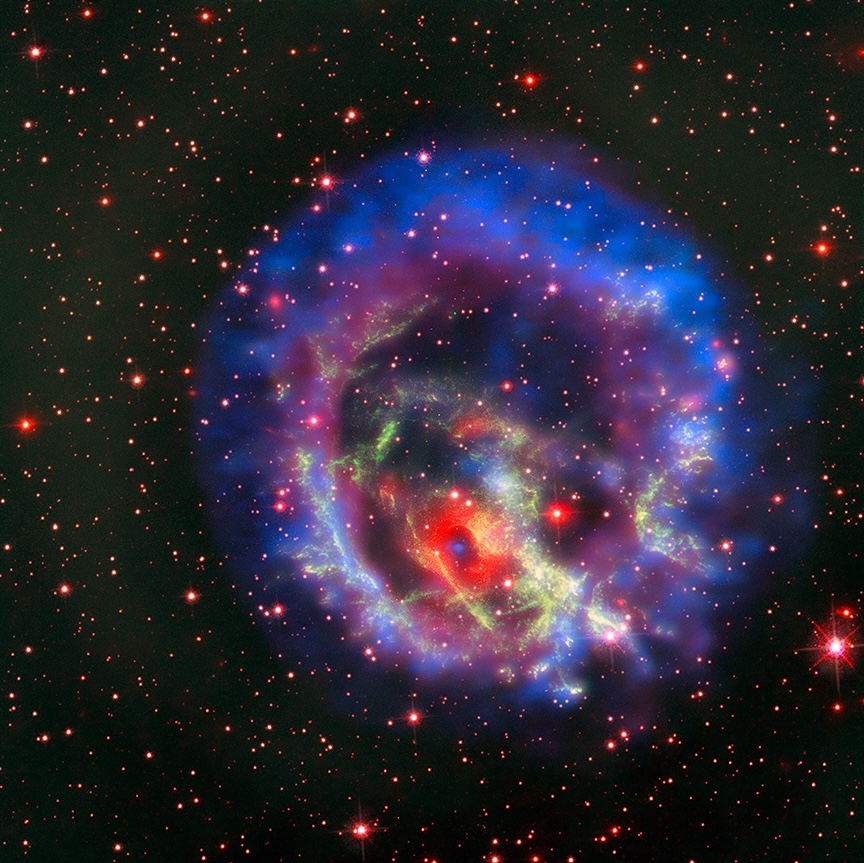
This composite X-ray and optical image shows the supernova remnant 1E 0102.2-7219. The blue source at the center of the bright red ring inside the remnant is a neutron star that was created in the supernova explosion. [X-ray (NASA/CXC/ESO/F.Vogt et al); Optical (ESO/VLT/MUSE & NASA/STScI)]
By observing neutron stars, astronomers attempt to pin down their equation of state, or the relationship between their interior density and pressure. In a recent research article led by Rosario Iaria (University of Palermo) described a promising way to probe the interior of a neutron star.
This method relies on measurements of a spectral line that originates near the neutron star’s surface and is gravitationally redshifted as it escapes from the intense gravitational pull of the star. The gravitational redshift provides a direct measurement of the compactness of the neutron star, or the ratio of its radius to its mass. Despite the promise of this method, definitive identification of gravitationally redshifted absorption lines has been challenging.
Directly Measuring Compactness
Iaria’s team identified potential evidence of this phenomenon in Neutron star Interior Composition Explorer (NICER) observations of 4U 1820-30, a close binary system containing a neutron star that is accreting matter from a white dwarf companion. (4U 1820-30 is famous for having one of the most rapidly rotating neutron stars known, with a blistering rate of 716 rotations per second.)
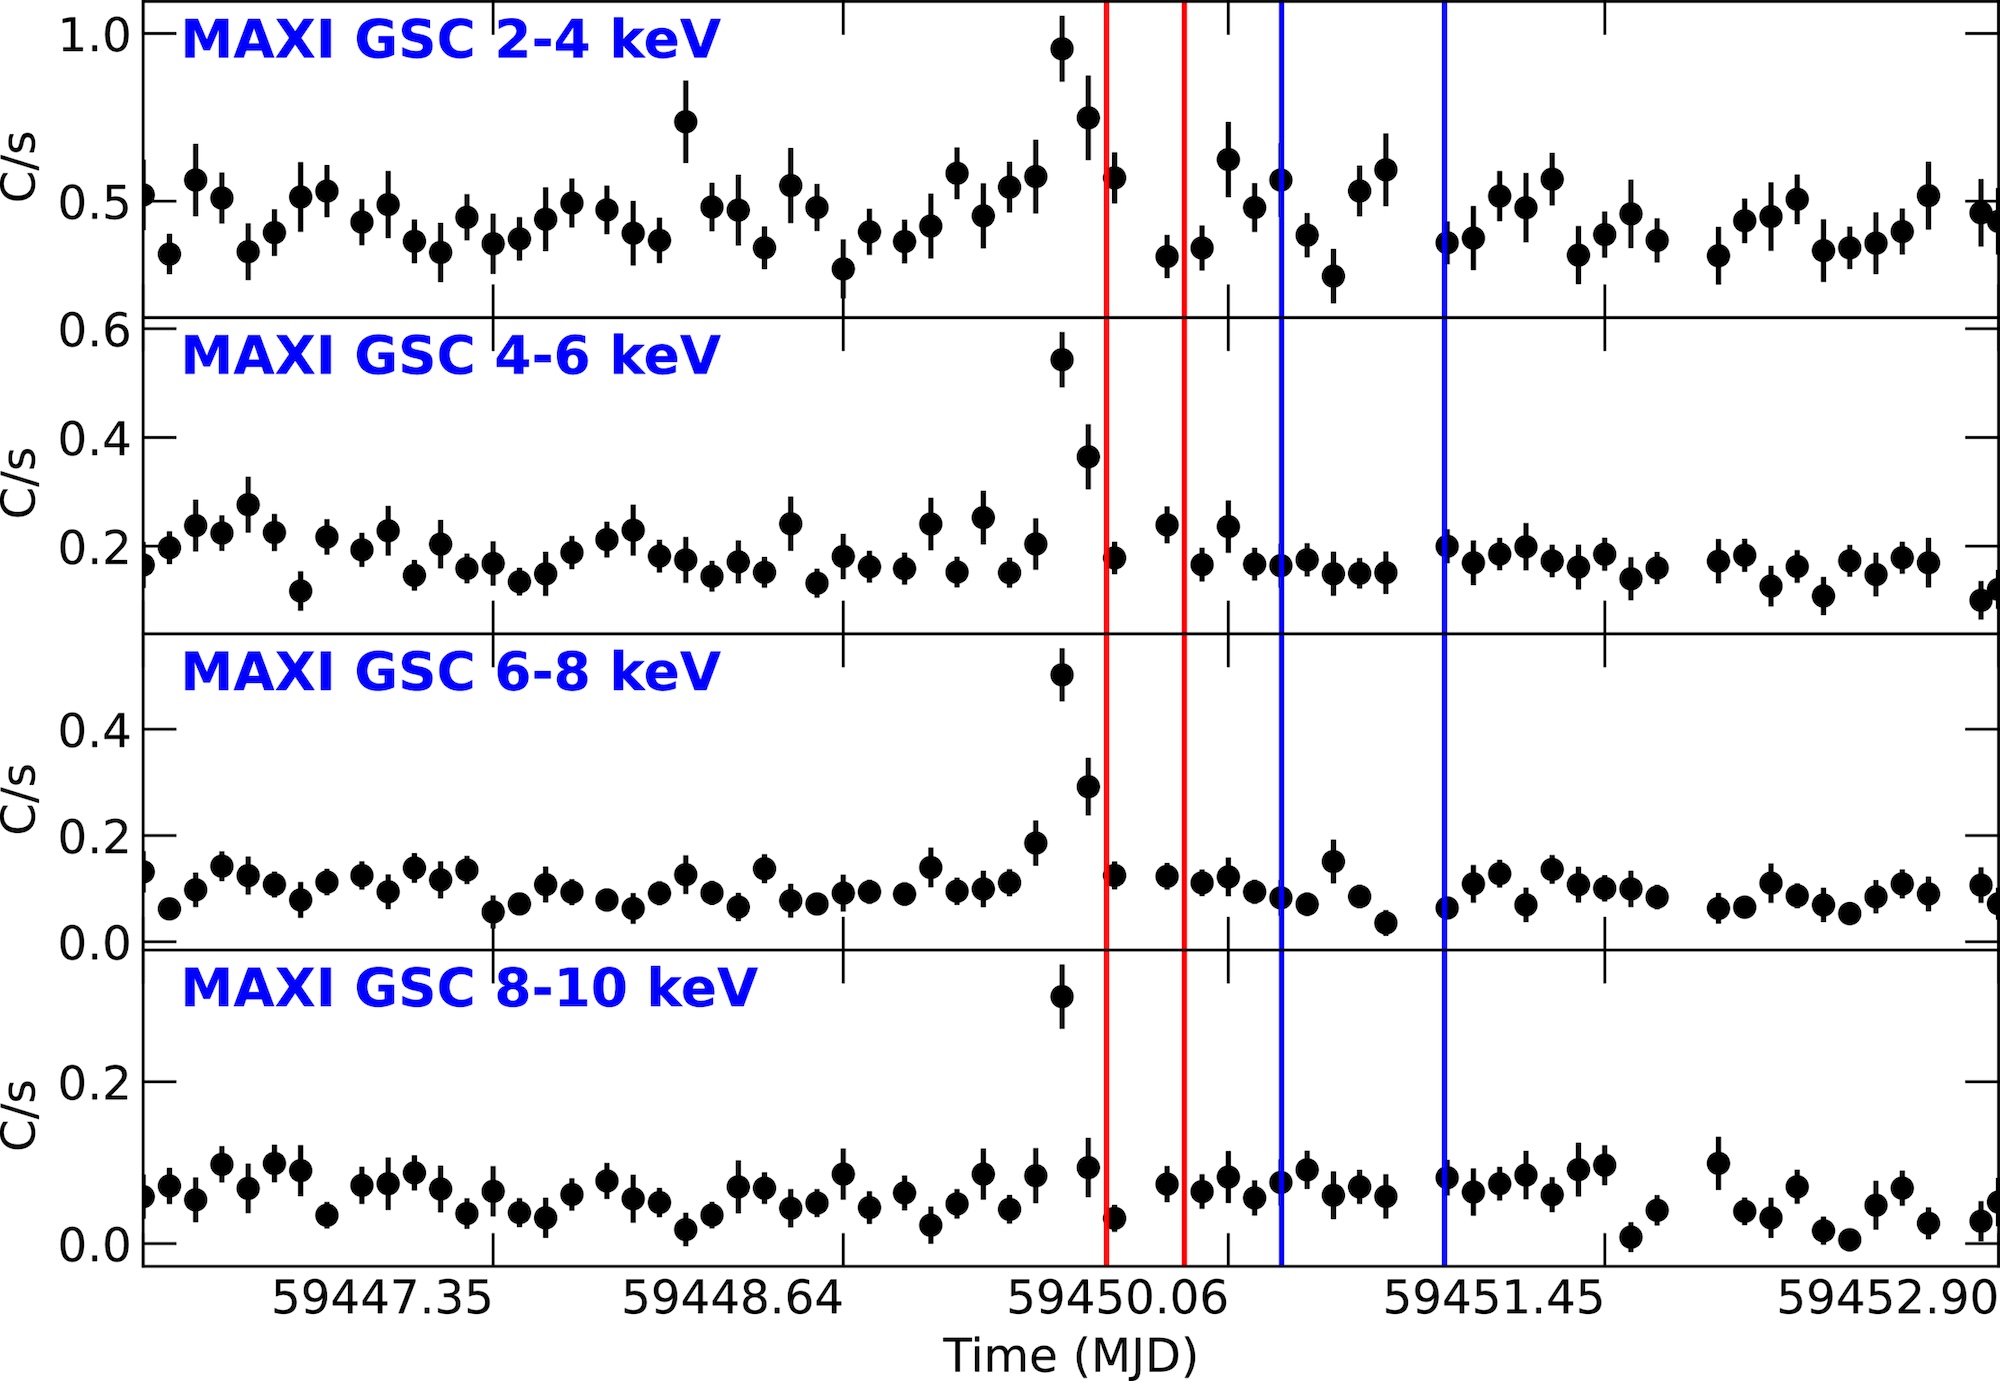
Observations of 4U 1820-30 from the Monitor of All-Sky X-ray Image (MAXI) showing the sudden increase in counts during the superburst, which was followed by two observing epochs by NICER, marked with red and blue vertical lines. Click to enlarge. [Iaria et al. 2026]
The team proposed that the rare superburst paved the way for the gravitationally redshifted absorption line to appear. During the superburst, a powerful radiation-driven wind swept away most or all of the neutron star’s corona, a diffuse cloud of plasma floating above and below the accretion disk. After the superburst ended and the wind subsided, but before the obscuring corona reformed, the tell-tale absorption line was visible for a short time.
Cracking the Mystery of Neutron Star Structure
By interpreting the 3.8 keV absorption feature as a gravitationally redshifted spectral line arising near the neutron star’s surface, Iaria and collaborators measured a redshift of 1 + z ≅ 1.72. This corresponds to a compactness of 4.46 kilometers per solar mass, which translates to a radius of 6.4 km for a typical mass of 1.4 solar masses or a mass of 2.2 solar masses for a typical radius of 10 km.
The interpretation of the 3.8 keV absorption line as a gravitationally redshifted iron line is still tentative. Further measurements with NICER, or with future facilities like the Advanced Telescope for High-ENergy Astrophysics (Athena) X-ray observatory (planned launch in 2037) or the enhanced X-ray Timing and Polarimetry (eXTP) mission (planned launch in 2030), may help to advance the study of neutron star interiors using this technique.
Citation
“A Mysterious Feature in the NICER Spectrum of 4U 1820-30: A Gravitationally Redshifted Absorption Line?” R. Iaria et al 2026 ApJ 998 58. doi:10.3847/1538-4357/ae2758
The post A Mysterious Spectral Feature Could Help Crack the Case of Neutron Star Structure appeared first on AAS Nova.
]]>
Astrobites reports on the detection of complex molecules around a protostar in the Large Magellanic Cloud.
The post Detecting New Icy Molecules Around a Newly Forming Star with JWST appeared first on AAS Nova.
]]>Editor’s Note: Astrobites is a graduate-student-run organization that digests astrophysical literature for undergraduate students. As part of the partnership between the AAS and astrobites, we occasionally repost astrobites content here at AAS Nova. We hope you enjoy this post from astrobites; the original can be viewed at astrobites.org.
Title: Protostars at Subsolar Metallicity: First Detection of Large Solid-State Complex Organic Molecules in the Large Magellanic Cloud
Authors: Marta Sewiło et al.
First Author’s Institution: NASA Goddard Space Flight Center
Status: Published in ApJL
Stars and planets form when clouds of molecules collapse in on themselves due to the overwhelming force of gravity (which, relatable). This process is quite mysterious, as these clouds will only live for a couple million years before collapsing, and the newly forming protostars only live for about half a million years before becoming main-sequence stars.
But we are able to find some protostars in the Milky Way and in the Small and Large Magellanic Clouds near us, and observing the molecules around these protostars can help us understand how protostars form.
To look for molecules around protostars, astronomers take spectra of the protostars in the infrared, which is a wavelength region where molecules emit a lot of light. As better instruments are being built, astronomers are more often able to look for what are called complex organic molecules, which are carbon-bearing molecules with at least six atoms.
These complex organic molecules can be detected in different states: most detections have been of gaseous molecules in and around protostars or planet-forming disks, but they can also be found in a solid state on the surfaces of dust grains in the interstellar medium in a galaxy. In this state, they are called complex organic molecule “ices.” These “ices” were rarely found pre-JWST, but since its launch, detections have been more numerous, mainly in the Milky Way. Observing these complex molecules on the surfaces of dust grains tells us more about protostellar dust chemistry, which is an important but still mysterious aspect of star formation.
In this study, researchers look outside of our own galaxy to explore the complex organic molecules in the Large Magellanic Cloud (LMC). The LMC is an interesting place to look for these molecules because it has lower metal content (i.e., elements heavier than hydrogen and helium) than the Milky Way, as well as a harder radiation field. This means photons flying around in the LMC generally have higher energies than photons flying around in the Milky Way, and elements like carbon, oxygen, and nitrogen are less abundant. This is important because these conditions are more similar to what typical galaxies were like in the early universe. Thus the LMC is a better test bed to look at protostars than the Milky Way if we want to understand how stars formed in the early universe.
The authors of this study have found signatures of complex organic molecules in protostars forming in the LMC. They focus on the protostar ST6 in the LMC, shown in the right image in Figure 1. They used JWST’s Mid-Infrared Instrument to take spectra of the region around ST6.

Figure 1: The LMC (left) and a zoomed-in view of region N158 (right) containing protostar ST6, the focus of this study. In the inset panel of the right picture, contours of carbon monoxide emission are shown. [Sewiło et al. 2025]
Spectroscopic Signatures of Molecules on Dust Grains
The researchers used the Python tool called dEcompositioN of Infrared Ice features using Genetic Modelling Algorithms (ENIIGMA) to fit the spectroscopy. This code compares the spectra to laboratory data of these complex organic molecules at the temperatures we see in the LMC. The authors fit for complex organic molecules they might expect to see, and they detect methanol (CH3OH), acetaldehyde (CH3CHO), ethanol (CH3CH2OH), methyl formate (HCOOCH3), and acetic acid (CH3COOH); of these, acetaldehyde, ethanol, and methyl formate have never before been detected outside of the Milky Way. Interestingly, this is the first time acetic acid has been definitively detected in any astrophysical environment. The spectral contribution from each molecule is shown in Figure 2; all the individual contributions added together make up the observed spectrum.

Figure 2: Model fits to the spectrum of the protostar ST6 using the code ENIIGMA. Molecules and their fitted emission are given in the legend. [Sewiło et al. 2025]
When the authors compared the abundances of these ices to other protostars in the Milky Way galaxy, they found that the abundances are slightly lower around the LMC protostar. This may happen because the dust temperatures are generally higher in the LMC due to the higher-energy photons, which affect the chemistry happening on the dust. Some species they found, however, do have similar abundances to the Milky Way protostars, indicating that the harder radiation field of the LMC does not affect how these species form. Finding more complex organic molecules in the Magellanic Clouds will help us understand further how these compounds form on dust grains and how the galactic environment may affect their formation.
Original astrobite edited by Shalini Kurinchi-Vendhan.
About the author, Caroline von Raesfeld:
I’m a third-year PhD student at Northwestern University. My research explores how we can better understand high-redshift galaxy spectra using observations and modeling. In my free time, I love to read, write, and learn about history.
The post Detecting New Icy Molecules Around a Newly Forming Star with JWST appeared first on AAS Nova.
]]>
Jets, variability, and neutrinos: dive into three recent investigations of active galactic nuclei.
The post Monthly Roundup: Investigating Active Galactic Nuclei appeared first on AAS Nova.
]]>Many galaxies, including our own, have a central supermassive black hole. In certain galaxies, gas becomes ensnared in the black hole’s gravitational pull and collects in a disk that feeds the black hole, forming an active galactic nucleus (AGN). An AGN can feast on this disk of gas and dust for millions to billions of years — glowing across the electromagnetic spectrum, brandishing relativistic jets, and creating a brilliant, variable light show visible from billions of light-years away.
Today’s Monthly Roundup investigates the connection between AGNs and neutrinos, considers the question of AGN variability, and explores modeling techniques for relativistic environments.
A Search for Neutrinos from X-Ray-Bright AGNs
Where do neutrinos — neutral, nearly massless elementary particles — come from? AGNs have emerged as one likely source; in 2022, the IceCube collaboration reported evidence for neutrinos from the nearby galaxy Messier 77, which hosts an X-ray-bright AGN, and earlier observations potentially linked a neutrino to the blazar TXS 0506+056.
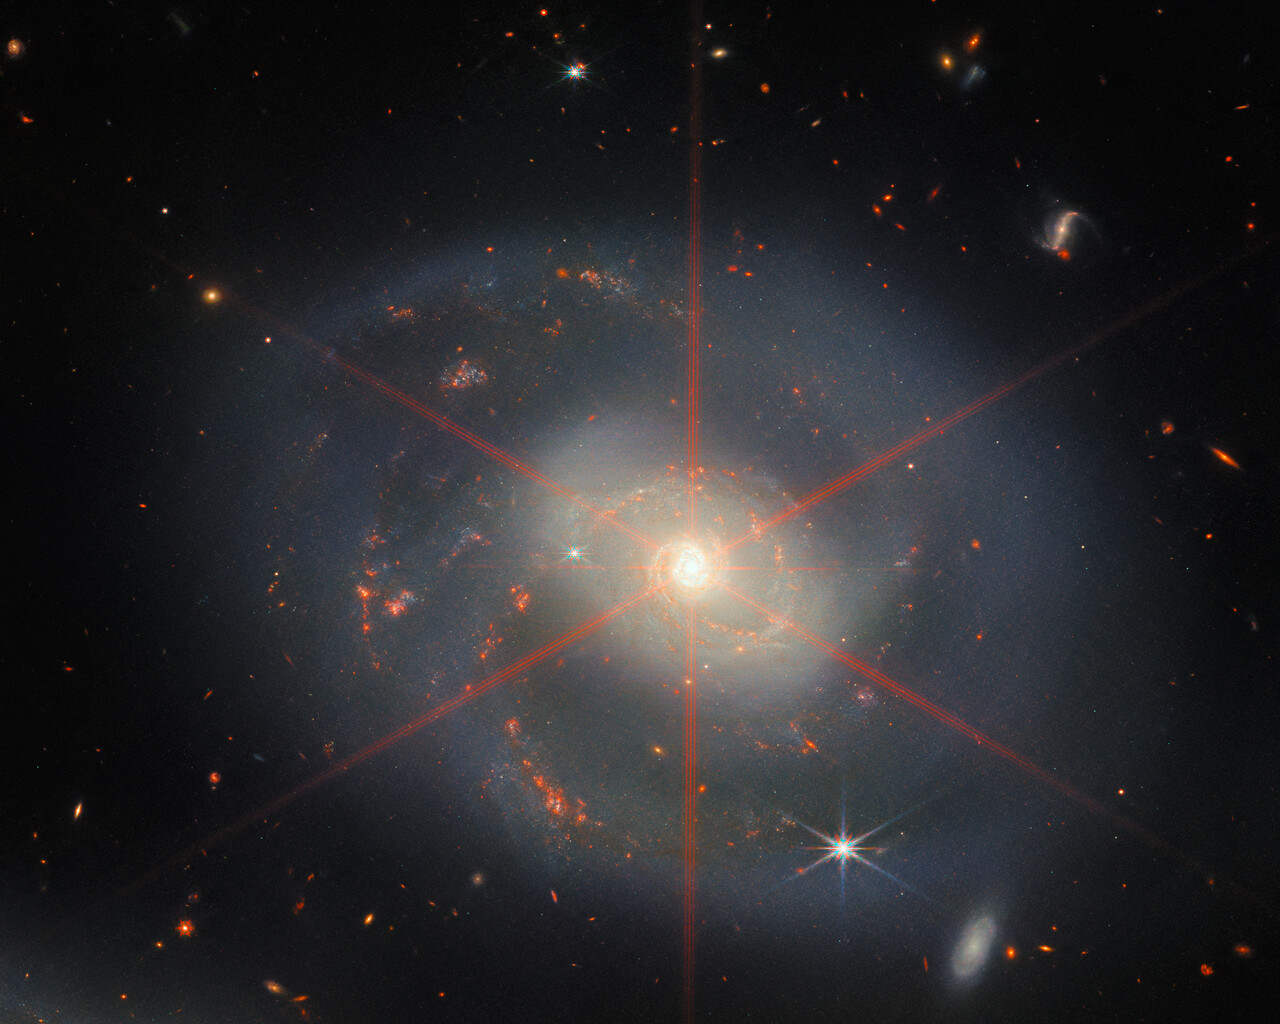
The spiral galaxy NGC 7469, shown here in this JWST image, contains an AGN that may be a source of neutrinos. [ESA/Webb, NASA & CSA, L. Armus, A. S. Evans; CC BY 4.0]
This result suggests that X-ray-bright AGNs are indeed a plausible source of neutrinos. As for the specific physical origin of these AGN-generated neutrinos, the data provide a few clues. The X-ray emission of an AGN is thought to arise from a billion-degree cloud of plasma called the corona. The interaction of coronal X-rays with high-energy protons is thought to produce neutrinos in the energy range of 1–10 teraelectronvolts — roughly the energies of the neutrinos associated with Messier 77 in this study. However, NGC 7469 was associated with neutrinos more energetic than this range, suggesting that not all AGN-produced neutrinos have a coronal origin. Thus, though the body of evidence suggesting that X-ray-bright AGN are a source of neutrinos, the precise mechanism through which these neutrinos are produced remains unknown.
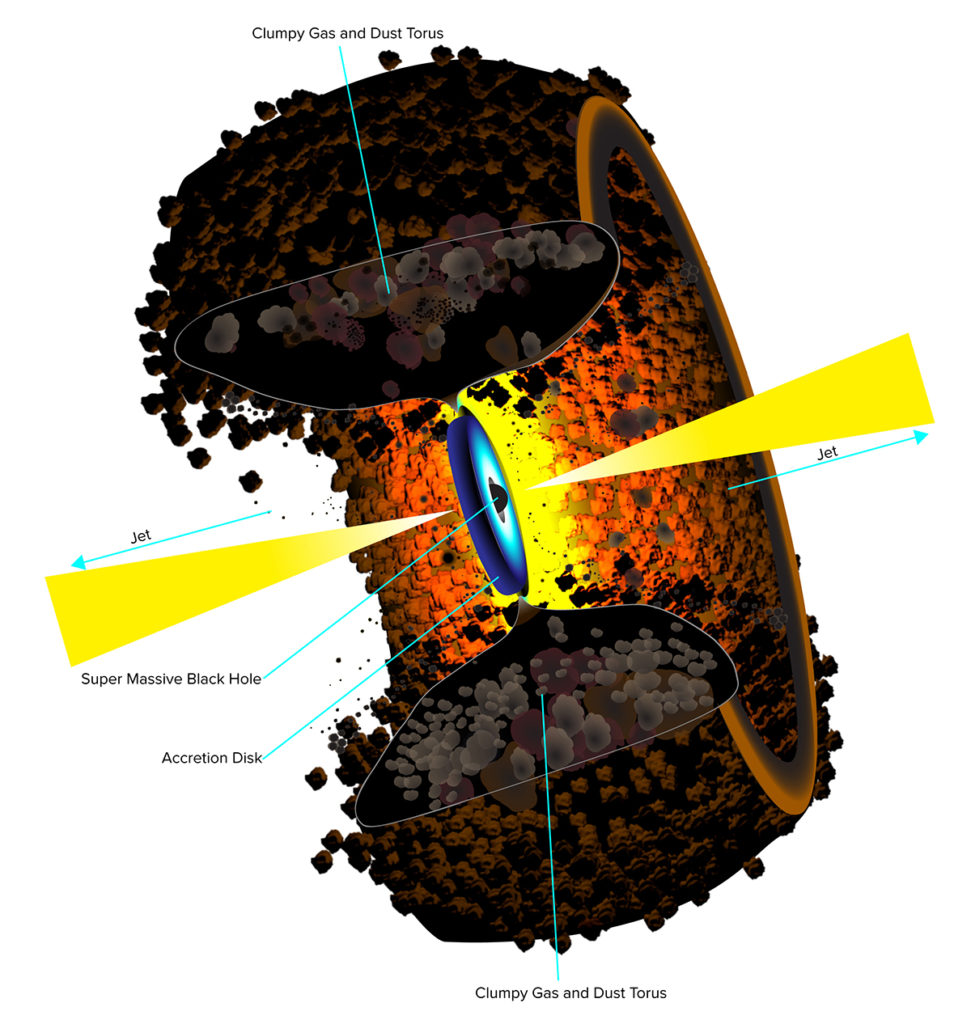
A diagram of the unified model of active galactic nuclei, showing an accretion disk, dusty torus, and jets. Click to enlarge. [B. Saxton NRAO/AUI/NSF; CC BY 4.0]
Disk or Jet: Which Varies More?
If there’s one constant when it comes to AGNs, it’s change; observations show that the emission from active galaxies varies on timescales from minutes to decades. Though both the accretion disk and the jet contribute to the overall multiwavelength behavior of an AGN, it’s not yet clear which of these structures is a greater contributor to an AGN’s variability.
Vineet Ojha (Peking University) and coauthors considered AGN variability at optical and mid-infrared wavelengths. Ojha’s team collected a sample of AGN that lie at similar redshifts and fall into one of three categories: narrow-line Seyfert 1 galaxies detected in gamma rays, narrow-line Seyfert 1 galaxies not detected in gamma rays, and broad-line Seyfert 1 galaxies detected in gamma rays. These three classes are distinguished by the presence or absence of relativistic jets as well as their accretion rate; gamma-ray-detected Seyfert 1s likely host jets, and narrow-line Seyfert 1s likely have higher accretion rates than broad-line Seyfert 1s.
Using optical data from the Zwicky Transient Facility and mid-infrared data from the Wide-field Infrared Survey Explorer, the team separated statistical wiggles from true variability and determined which sample of AGNs was most variable. They found that broad-line AGNs detected in gamma rays are the most variable, suggesting that jets are major contributors to AGN variability. Narrow-line AGNs detected in gamma rays are next in line, likely because these AGNs have jets but also have a strong thermal emission component from their accretion disks due to their high rate of accretion. Narrow-line AGNs not detected in gamma rays are the least variable, lacking a jet and dominated by thermal emission. Taken together, these results suggest that AGN variability is mostly jet driven, with some contribution from accretion disk instabilities.
More on AGN Jets: The Slow-Light Effect
The galaxy Messier 87 (M87) hosts one of the most studied AGN jets. M87’s jet is visibly structured, and it exhibits superluminal motion, in which the relativistic plasma appears to move faster than the speed of light. Because the plasma accelerated by an AGN moves so quickly, researchers attempting to model this plasma may opt to use the slow-light approach, in which the evolution of the ambient plasma is modeled simultaneously with the propagation of light through the medium. Though more computationally intensive than the fast-light approach, in which photons zip through a static medium, slow-light techniques are needed in regions of relativistic flows or strong acceleration.
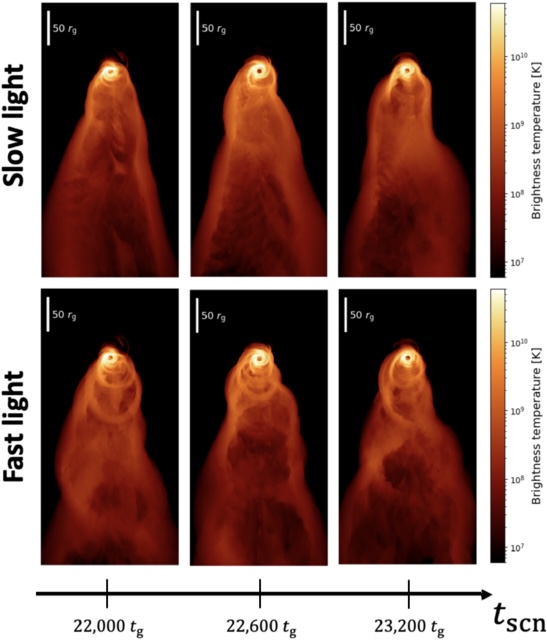
Comparison of the jet morphology from the slow-light (top row) and fast-light (bottom row) methods. [Adapted from Tsunetoe et al. 2026]
The team found that slow-light images tended to be smoother, lacking the looping, helical structures within the jet seen in fast-light images. Slow-light images show more evidence for the superluminal motion that is observed in relativistic jets like M87’s, as well as greater limb brightening and less wobbling motion. The team also investigated the effects of changing the black hole spin, finding greater wobbling in the jet for slow black hole spins and a straighter, wider jet for rapid black hole spins. Overall, Tsunetoe and coauthors found that the slow-light approach generated images that are more consistent with the properties of M87’s jet, demonstrating that the slow-light approach is necessary to capture the behavior of relativistic jets.
Citation
“Evidence for Neutrino Emission from X-Ray-Bright Active Galactic Nuclei with IceCube,” R. Abbasi et al 2026 ApJL 1000 L26. doi:10.3847/2041-8213/ae4aad
“The Relative Contributions of Accretion Disk Versus Jet to the Optical and Mid-Infrared Variability of Seyfert Galaxies,” Vineet Ojha et al 2025 ApJ 994 84. doi:10.3847/1538-4357/ae0a38
“Slow-Light Effect in the Jet-Launching Region of M87,” Yuh Tsunetoe et al 2026 ApJ 1000 29. doi:10.3847/1538-4357/ae43e7
The post Monthly Roundup: Investigating Active Galactic Nuclei appeared first on AAS Nova.
]]>
Hoping to find the second kilonova to be detected in both gravitational waves and light, astronomers ended up with a supernova instead.
The post An Impostor Explosion appeared first on AAS Nova.
]]>Over many centuries of observing the night sky, astronomers have found only a single visible afterglow of a collision between neutron stars. For a few days in the summer of 2025, it seemed like observers may have found another of these treasured but elusive prizes; unfortunately, the promising candidate turned out to be a supernova in disguise.
A Rare Prize
These images from the Hubble Space Telescope show the fading light of the kilonova associated with the gravitational wave event GW170817. [NASA and ESA Acknowledgment: A. Levan (U. Warwick), N. Tanvir (U. Leicester), and A. Fruchter and O. Fox (STScI)]
That one kilonova, found back in 2017, taught astronomers much about how heavy elements are formed and left the scientific community hungry for more data. Since then, each time a gravitational wave detector like LIGO reports that it may have spotted a neutron star merger, telescopes across the world scramble to look in the probable region of the sky, hoping to find the short-lived electromagnetic counterpart.
Too Good to Be True
On 18 August 2025, the LIGO/Virgo/KAGRA collaboration sent out an alert that it may have detected a neutron star–neutron star merger. The odds that their signal was real weren’t great, and the researchers gave it just a 29% chance of being a genuine astrophysical signal. Still, given the potential payoff of finding the next kilonova, several telescopes quickly began searches for the optical counterpart. The gravitational wave signal suggested that the event likely came from a curved patch of sky delightfully referred to as the “northern banana,” and after trawling that region for a few nights, astronomers hauled in 47 new transients. Any one of these could have been the kilonova, and all of them received extensive follow-up observations.
A team led by James Gillanders (University of Oxford) recently summarized some of these follow-up observations carried out with the Pan-STARRS and ATLAS telescopes. In the initial exciting few days after the alert went out, one candidate transient stood out as the most promising. Named AT2025ulz, it was first spotted by the Zwicky Transient Facility and initially started fading rapidly and changing colors, just as models of kilonovae predict. For four days, it seemed like the world may have witnessed its second-ever kilonova. But then the telescopes began their fifth night of observations.
Supernova Unmasked

The light curve of SN2025ulz. Note that the source appeared to grow brighter again after about 5 days. Click to enlarge. [Gillanders et al. 2025]
Frustrating as this particular result may be, the effort was far from wasted. The team could use their non-detection of the true kilonova to place limits on its timing and peak magnitude, assuming it existed in the first place. And, as gravitational wave detectors grow more sensitive and alerts like this more common, hindsight will likely frame this scramble as a dress rehearsal for an ultimately successful kilonova recovery effort. Until then, astronomers will keep searching, and will keep their guard up against cosmic impostors.
Citation
“Pan-STARRS Follow-Up of the Gravitational-Wave Event S250818k and the Light Curve of SN2025ulz,” J. H. Gillanders et al 2025 ApJL 995 L27. doi:10.3847/2041-8213/ae2125
The post An Impostor Explosion appeared first on AAS Nova.
]]>
JWST's mysterious little red dots may be evidence of black hole stars in the early universe.
The post Starring in the Early Universe: Black Hole Stars and Little Red Dots appeared first on AAS Nova.
]]>JWST has uncovered a peculiar population of very distant objects known as “little red dots.” The mechanisms powering these objects’ peculiar properties — high luminosities, compact radii, and “V”-shaped spectra — remain uncertain. Could little red dots be the result of supermassive stars, galaxy mergers, or, as a recent study explores, black hole stars?
Direct-Collapse Black Holes and Little Red Dots
Since their discovery, little red dots have been the subject of many studies, but a complete explanation for their unique combination of properties remains elusive. Multiple studies have explored the growing population of peculiar dots, with some postulating that they are the result of stars thousands of times the mass of the Sun, supermassive stars entrenched in gas from a galaxy merger, or black holes embedded in dense accretion disks.
Even more recently, studies have proposed that little red dots may be the remnants of direct-collapse black holes. In this scenario, a large cloud of gas in the early universe directly collapses into a stellar-mass black hole, and the remaining gas envelops the black hole, forming what is known as a quasi-star (or black hole star). Researchers have suggested that little red dots may be the late stage of this process when the black hole has accreted at least 10% of the total mass of the system. Direct comparisons between quasi-star evolutionary models and JWST observations of little red dots have yet to be explored but are necessary to confirm the potential of quasi-star origins.
Evolutionary Models of Quasi-Stars
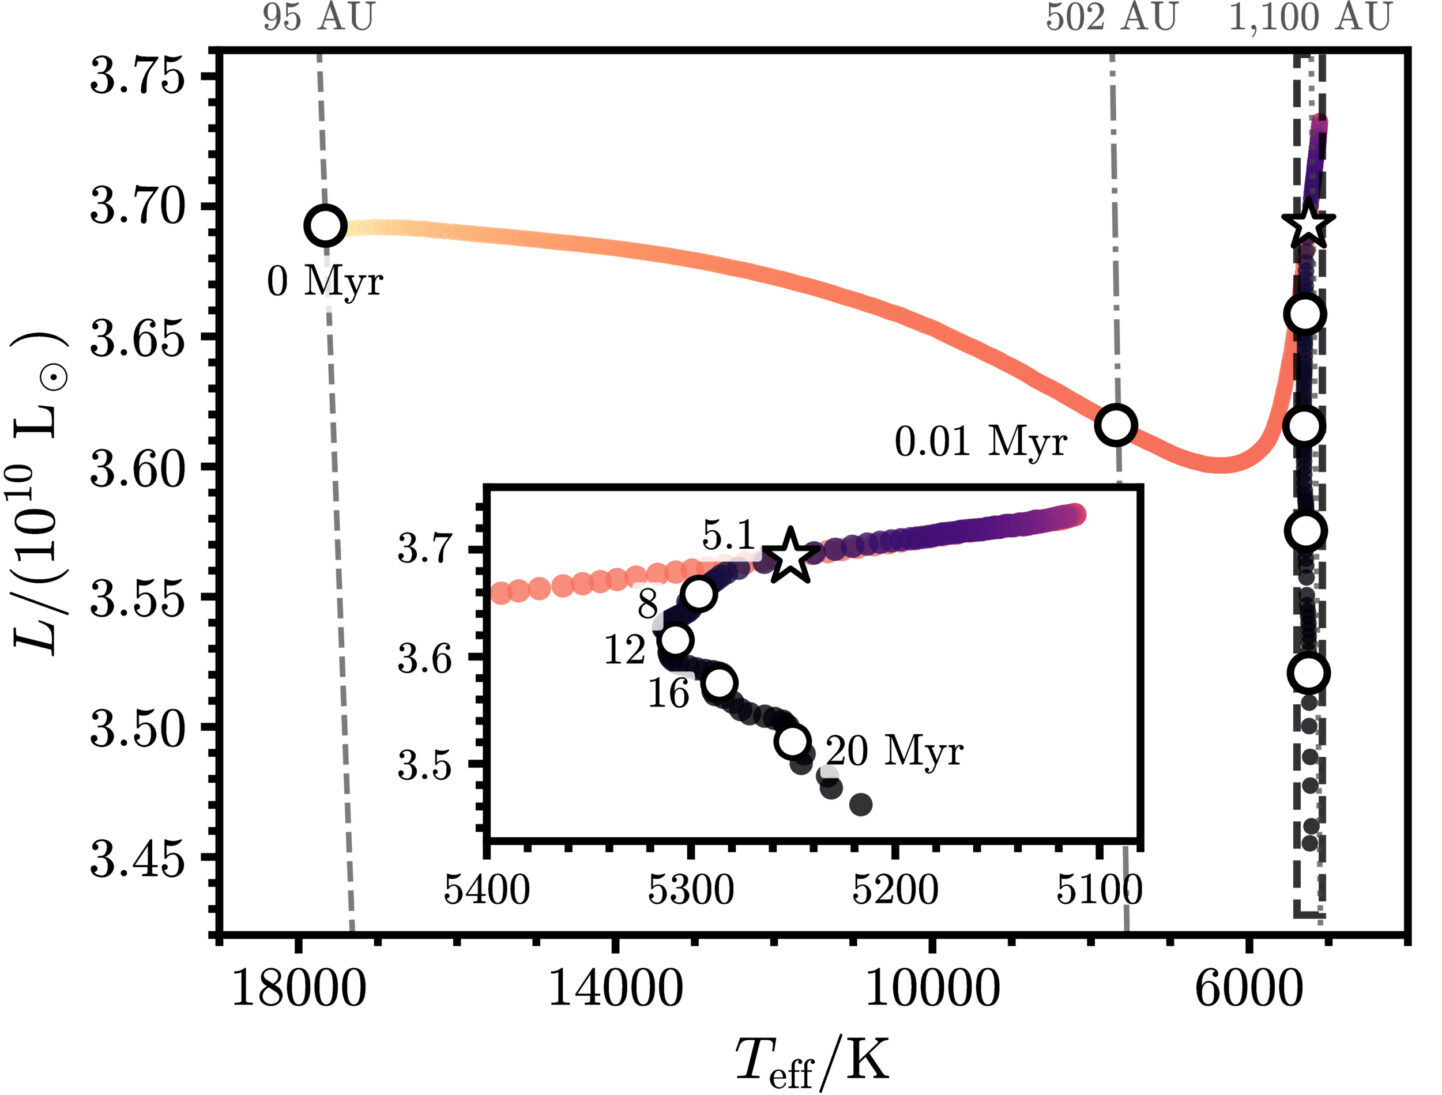
Evolution of a theoretical quasi-star model on a Hertzsprung–Russell diagram. [Modified from Santarelli et al 2026]
After a short initial phase of contraction lasting around 10,000 years, the quasi-star spends the rest of its approximately 20–40-million-year lifetime in the “late stage” as the central black hole continues to eat up the surrounding envelope. In the end, the quasi-star becomes a supermassive black hole a million times the mass of the Sun.
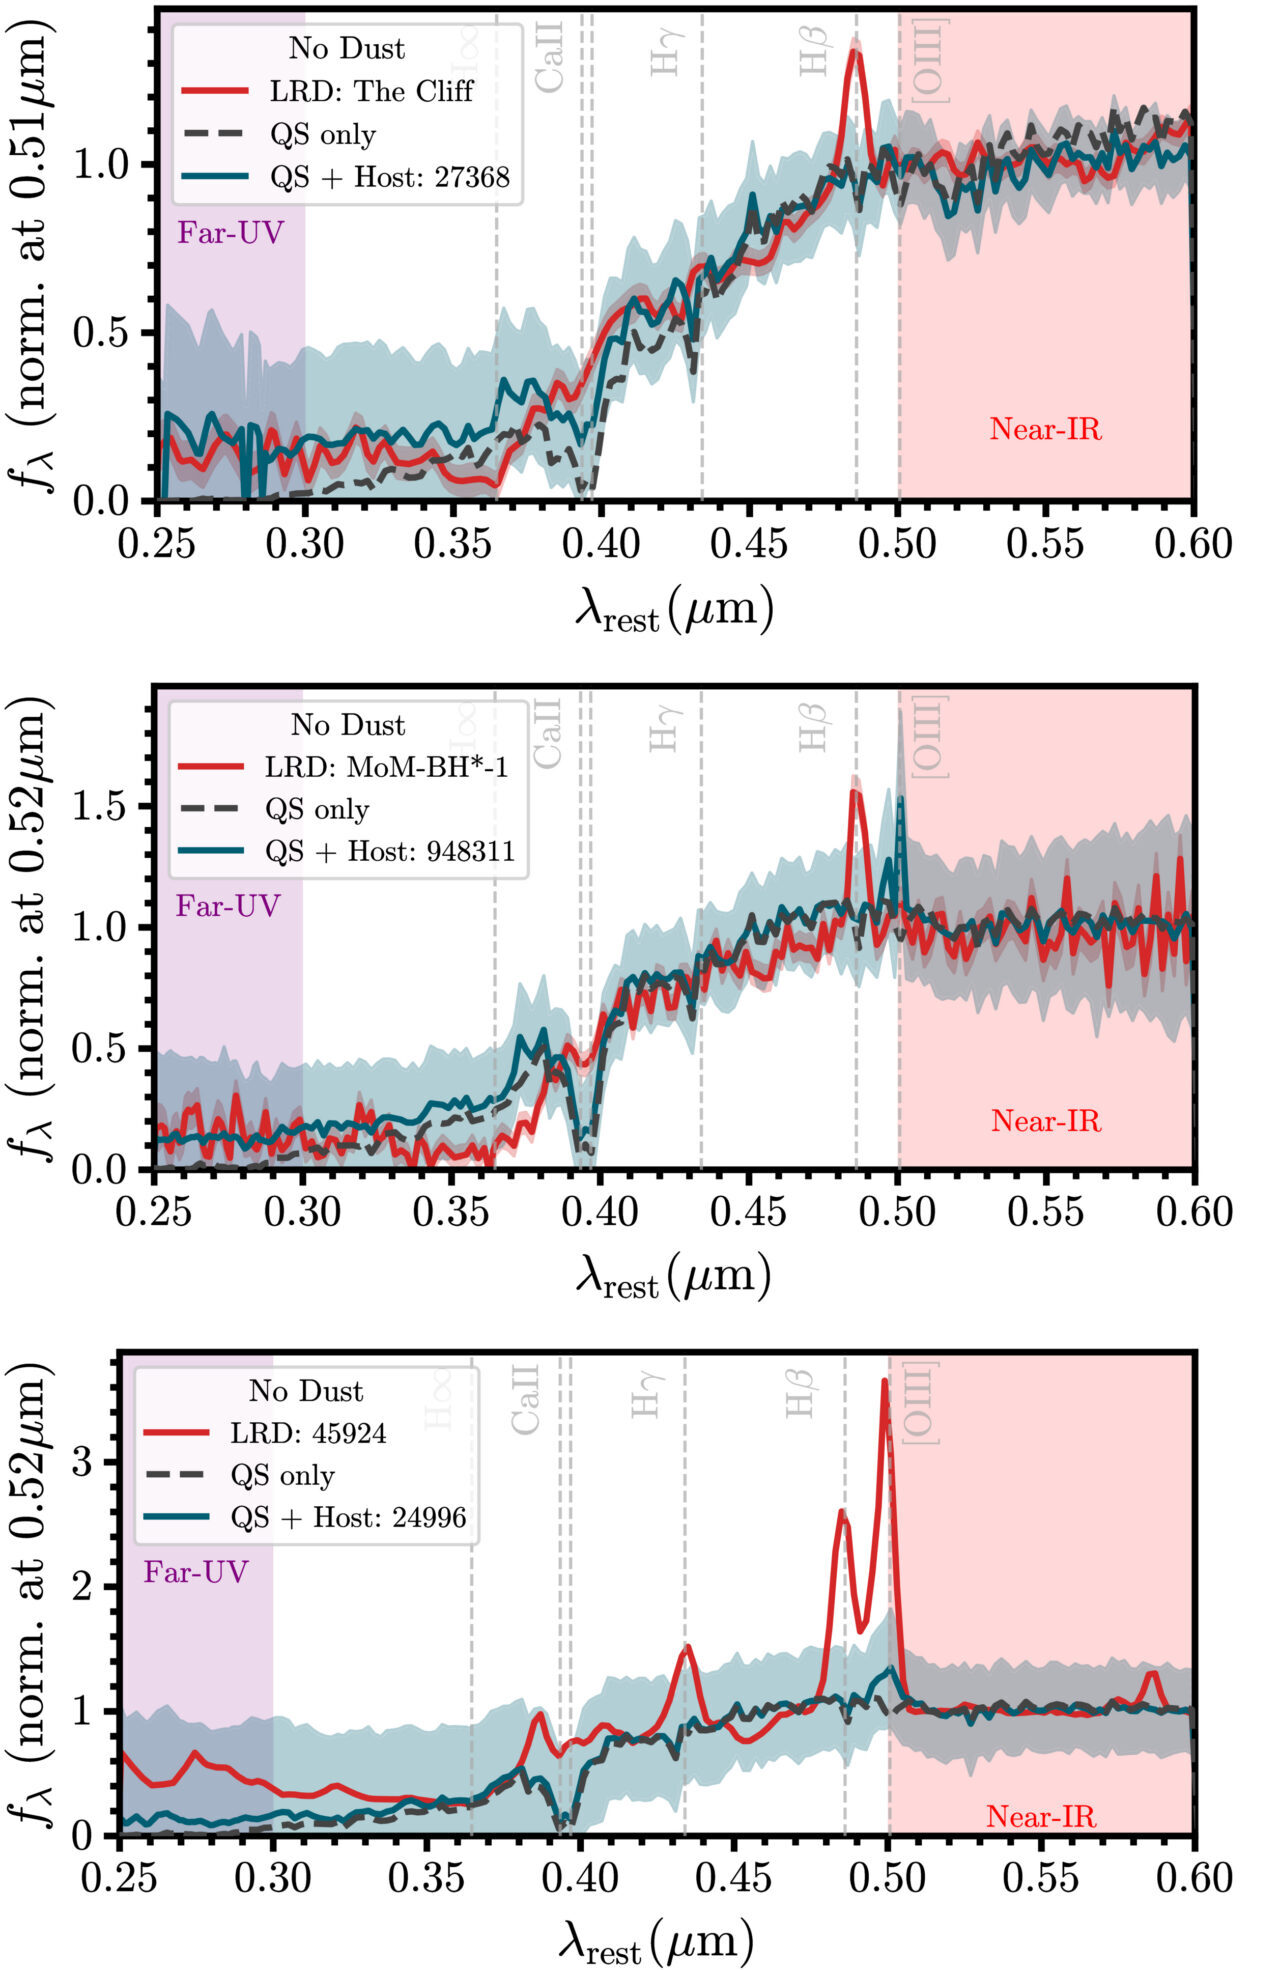
Predicted spectral energy distributions of 1 million solar mass, late-stage quasi-stars both alone (black dashed line) and embedded in a host galaxy (solid blue line). Each panel compares the quasi-star to a little red dot observed by JWST. [Modified from Santarelli 2026]
Plausible Progenitors
The results of this study indicate that late-stage quasi-stars can naturally produce the defining continuum features of little red dot spectra. While further modeling is required to trace specific emission line features, the initial modeling presented in this study establishes quasi-stars as plausible progenitors of not only little red dots but also the universe’s first supermassive black holes.
As the authors noted, the short lifetimes of quasi-stars shown in their models in conjunction with the observed number density of little red dots implies that a significant fraction of supermassive black holes formed through this mechanism. Continued observations of little red dots and advanced modeling of direct-collapse black holes will aid in determining if these peculiar dots are showing off the birth of supermassive black holes in the universe.
Citation
“Evolutionary Tracks and Spectral Properties of Quasi-stars and Their Correlation with Little Red Dots,” Andrew D. Santarelli et al 2026 ApJL 998 L4. doi:10.3847/2041-8213/ae3713
The post Starring in the Early Universe: Black Hole Stars and Little Red Dots appeared first on AAS Nova.
]]>
Astrobites reports on whether a distant companion in a triple-star system could push the inner binary toward merging into a remnant object that emits fast radio bursts.
The post Triple Double: Do Merging White Dwarfs Produce Fast Radio Burst–Emitting Remnants? appeared first on AAS Nova.
]]>Editor’s Note: Astrobites is a graduate-student-run organization that digests astrophysical literature for undergraduate students. As part of the partnership between the AAS and astrobites, we occasionally repost astrobites content here at AAS Nova. We hope you enjoy this post from astrobites; the original can be viewed at astrobites.org.
Title: Fast Radio Bursts from White Dwarf Binary Mergers: Isolated and Triple-Induced Channels
Authors: Cheyanne Shariat et al.
First Author’s Institution: California Institute of Technology
Status: Published in ApJL
The History of Fast Radio Bursts
Since the discovery of the Lorimer Burst in 2007, astronomers have studied fast radio bursts (FRBs) in extreme detail. However, these extragalactic millisecond-duration radio transients have remained an enigma. Like many astrophysical phenomena, their discovery was serendipitous. The most prolific FRB-discovery instrument, CHIME, was not originally built to study them; the acronym stands for “Canadian Hydrogen Intensity Mapping Experiment,” reflecting its original (and ongoing) mission to map the cosmological distribution of hydrogen in the primordial universe. Since its construction, CHIME has discovered several thousand FRBs and even identified a smaller fraction that are known to repeat, some with consistent periods and others that are sporadic and seemingly random. (Check out their live catalog of repeating sources.)
Despite having thousands of sources to study, the only thing we know fairly confidently about FRBs is that many of them are extragalactic, and some others are even at cosmological distances. If we don’t understand how FRBs are produced, how can we know their distance? FRBs display a unique signature in their radio spectra, where higher frequencies arrive at the telescope first and lower frequencies arrive later, delayed by an inverse frequency-squared relationship. In a “dynamic spectrum,” this makes the pulse actually appear like a sweep from high to low frequency that follows the shape of a parabola; for example, the brightest pixels in Figure 1 of this Bite display this sweeping shape. This effect results from the FRB propagating through an ionized plasma with a specific density. Since the FRB is ultimately an electromagnetic wave, this slows down the speed of the FRB as a function of frequency. Measuring this effect, called dispersion, allows us to infer that the FRB signal passed through more plasma than can be accounted for within our own Milky Way galaxy, indicating that the FRB must have originated from much farther away. So far, there is only one example of an FRB from within our own galaxy, which was identified as originating from a magnetar, a highly magnetic pulsar.
FRB Progenitor Candidates
Although we know that most FRBs are located at extragalactic or even cosmological distances, it’s still not clear what objects that can generate them. Since magnetars and other compact objects are often considered reliable progenitors of FRBs, understanding their populations and comparing them with observed FRBs may reveal the origin of FRBs. Candidate FRB progenitor systems are usually divided into “prompt” channels — like the collapse of a star into a magnetar during a core-collapse supernova — and “delayed” channels where the FRB engine is formed on longer timescales, like accretion-induced collapse of white dwarfs or compact-object mergers. Figure 1 displays several of these channels, particularly those considered in today’s article, in which stellar evolution results in the transfer of material from one star to another (accretion-induced collapse) or gravitational radiation allows two objects to inspiral and merge. These events could create highly magnetized white dwarfs or magnetars that may produce FRBs.

Figure 1: Three different pathways and their associated fractions for producing an FRB candidate. Depending on the mass and composition of the merging objects, an FRB candidate may be produced instead of causing the white dwarf to explode in a Type Ia supernova. These are the systems of interest in today’s article. [Shariat et al. 2026]
Simulating Hierarchical Triples
In today’s article, we’re considering the role of hierarchical triple star systems in producing FRB-emitting objects. A hierarchical triple consists of an inner binary and a distant, tertiary star; see the first panel of Figure 1. These systems may play an important role because many stars that become white dwarfs of at least 0.8 solar mass exist in hierarchical triples: 35% of 2-solar-mass stars and 50% of 8-solar-mass stars are in triples. Stars of both masses will end their lives as white dwarfs.
The tertiary star plays an essential role in increasing the likelihood of the inner binary interacting: the eccentric Kozai–Lidov (EKL) mechanism causes the inner orbit to oscillate between highly inclined (with respect to the orbit of the tertiary star) and highly eccentric. Unlike isolated binaries that aren’t excited in this way, the eccentric orbit phase causes the inner stars to pass much closer to each other, increasing the likelihood of interaction or even a merger that could produce an FRB-emitting remnant.
The authors of today’s article produced a realistic population of triple systems by sampling from empirically measured distributions of masses, periods, and orbital eccentricities. These distributions were derived from observations collected by the Gaia satellite, an all-sky optical telescope that has now observed more than one billion stars in the Milky Way. The authors also created a “control” sample of isolated binaries by removing the tertiary star from the same sample of systems. The systems were then evolved for an age randomly selected between 0 and 12.5 billion years to simulate “constant” star formation similar to that in the Milky Way. Finally, they reapply these simulations at three different “metallicities” — the fraction of elements other than hydrogen or helium relative to that of the Sun.
Figure 2 displays these two populations: the isolated binaries are shown as filled histograms, and the hierarchical triples are shown as histograms with dashed lines. Each column represents the three different progenitor classes considered in Figure 1. At solar metallicity, the delays to merging are greater in triples than in secular binaries, leading to more mergers overall (top left panel). At lower metallicities, there are fewer mergers in all progenitor pathways in triples than in isolated binaries due to changes in stellar evolution attributed to weaker winds and larger pre-white dwarf masses.

Figure 2: The number of mergers as a function of time from the hierarchical triple’s formation, given different three metallicities (rows) and the three primary formation pathways for FRB-emitting merged remnants considered in Figure 1. Filled histograms are isolated binaries, dashed histograms are triples. [Shariat et al. 2026]
A Cosmic Population of FRBs
Since we can’t realistically track individual star systems from their formation to the end, we need to convert the delay-time distributions shown in Figure 2 to an observable. To do this, the authors combine the results of their simulations with measurements of the cosmic star formation rate — how many stars form per unit time as a function of the universe’s age — and the evolution of the universe’s metallicity as stars fuse hydrogen into heavier elements and return this material to the interstellar medium as these stars end their lives in shedding red giants or supernovae. This analysis produces the number of FRBs that should be observed as a function of distance or lookback time into the universe’s history, which is displayed in Figure 3.
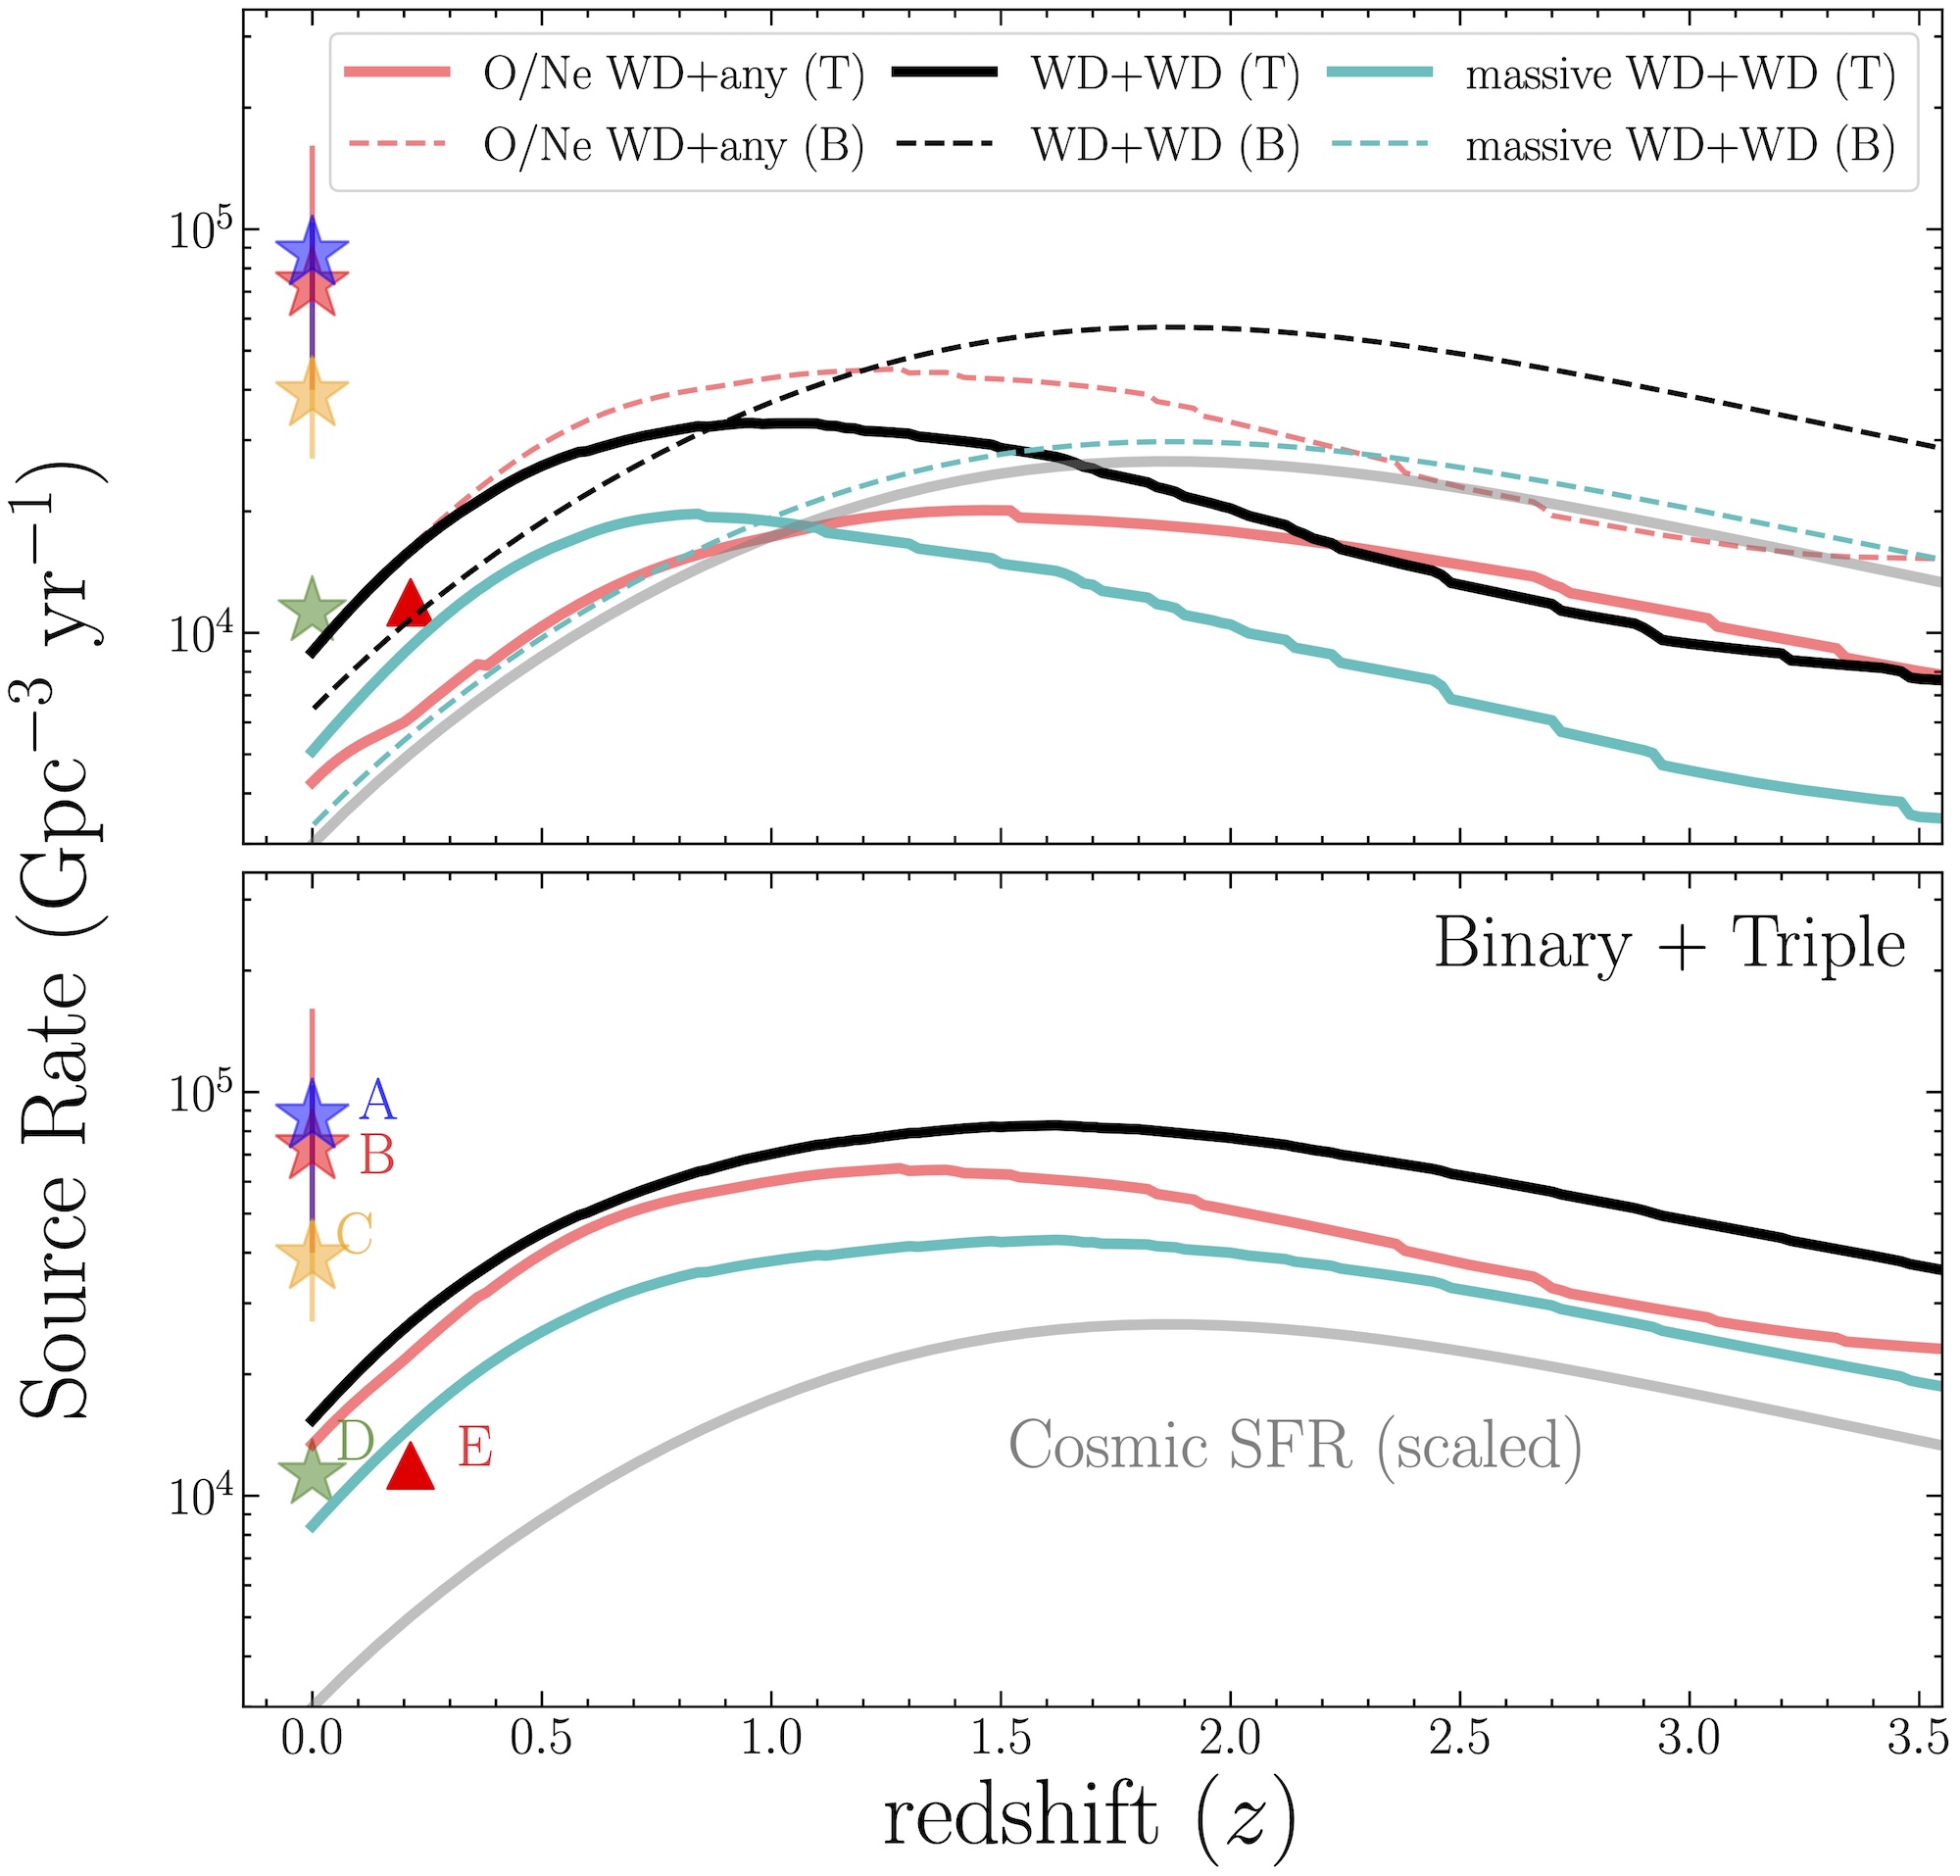
Figure 3: The number of FRBs expected as a function of cosmological redshift. The present is to the left, the distant and early universe is on the right. The top panel shows the three formation channels, with binary and triple systems separated. The bottom panel displays the composite rate and compares it with empirical estimates from existing FRB observations. [Shariat et al. 2026]
Original astrobite edited by Catherine Slaughter.
About the author, Will Golay:
I am a graduate student in the Department of Astronomy at Harvard University and the Center for Astrophysics | Harvard & Smithsonian, advised by Edo Berger. I study radio emission from transient astrophysical objects like tidal disruption events.
The post Triple Double: Do Merging White Dwarfs Produce Fast Radio Burst–Emitting Remnants? appeared first on AAS Nova.
]]>
Observations of a galaxy cluster during the universe's star-formation heyday give clues to the cluster's history.
The post Featured Image: An Active Galaxy Cluster Merger at Cosmic Noon appeared first on AAS Nova.
]]>This image from JWST shows the galaxy cluster XLSSU J021744.1-034536. The cluster is at a redshift of z = 1.98, placing it at cosmic noon, when the universe’s star formation was at its peak. To study the formation and evolution of this cluster, Zachary Scofield (Yonsei University) and collaborators collected wide-ranging clues, including signs of weak gravitational lensing, the glow of gas in between the galaxies of the cluster, and an analysis of the cluster members. The image above (click for the full view) indicates the galaxies that are members of the cluster. The brightest galaxy in the cluster is marked with a yellow square, and the remaining cluster members are circled, with the color indicating whether the galaxy’s cluster membership was assigned photometrically (magenta) or spectroscopically (green). Combining all available lines of evidence, Scofield’s team found that XLSSU J021744.1-034536 is undergoing a merger, giving a rare glimpse into this stage of cluster formation. To learn more about this work and what it tells us about galaxy clusters at cosmic noon, be sure to check out the full article linked below.
Citation
“An Active Galaxy Cluster Merger at Cosmic Noon Revealed by JWST Weak Lensing and Multiwavelength Probes,” Zachary P. Scofield et al 2026 ApJL 999 L1. doi:10.3847/2041-8213/ae447a
The post Featured Image: An Active Galaxy Cluster Merger at Cosmic Noon appeared first on AAS Nova.
]]>
The Lucy mission has provided insights into the craters, boulders, and other surface features of the asteroid Dinkinesh and its small satellite, Selam.
The post Details on Dinkinesh and Its Surprise Satellite from the Lucy Mission appeared first on AAS Nova.
]]>The Lucy spacecraft, en route to its primary mission targets, zipped past the main-belt asteroid Dinkinesh and revealed its tiny satellite, Selam. New research examines the surfaces and histories of these small rocky worlds.
A Stop Along the Way
In 2021, the Lucy spacecraft embarked on a 12-year mission to study several Jupiter trojan asteroids, which share Jupiter’s orbit. The spacecraft won’t have its first encounter with a Jupiter trojan until 2027, but it hasn’t been idle during its long journey. In November 2023, Lucy performed a dress rehearsal of its trojan-encounter maneuvers during a flyby of a 738-meter-wide main-belt asteroid called (152830) Dinkinesh.
Two images of Dinkinesh from the Lucy mission. The second image features its satellite, Selam. [Bierhaus et al. 2025]
Craters and Boulders
In a recent research article, Edward Bierhaus (Lockheed Martin Space) and collaborators analyzed Lucy flyby images to study the surfaces of Dinkinesh and Selam. The team analyzed global features like troughs and ridges and measured visible craters and boulders.
Locations of craters on Dinkinesh and Selam. The blue lines indicate the most confidently identified craters; orange and green lines mark craters identified less confidently. Click to enlarge. [Bierhaus et al. 2025]
The size–frequency distribution of Dinkinesh’s boulders, on the other hand, is somewhat steeper. This discovery may mean that S-type (stony) asteroids like Dinkinesh have different boulder size distributions than C-type (carbonaceous) asteroids.
Possible Histories
An analysis of the collisional timescales in the main asteroid belt suggests that Dinkinesh is a fragment of a larger asteroid that was split apart at least once, though it’s not yet possible to say which parent body it might have come from. After splitting off from its parent asteroid, Dinkinesh appears to have been subjected to the Yarkovsky–O’Keefe–Radzievskii–Paddack (YORP) effect. This effect arises when sunlight falls on a small asymmetric asteroid, creating a torque that can alter its spin rate. In extreme cases, the YORP effect can crank up an asteroid’s spin rate so much that it sheds some of its surface material or flies apart altogether.
Locations of Sumak Fossa (top) and Fab Dorsum (bottom) indicated with arrows. [Adapted from Bierhaus et al. 2025]
With Lucy en route to its primary objective, there’s still much for us to learn from this mission about the small bodies of our solar system. In the meantime, be sure to check out the full article linked below, as there are far more details about Dinkinesh and Selam than could be included in this short summary!
Citation
“The Geology of a Small Main-Belt S-Class Binary Asteroid System: Dinkinesh and Its Contact Binary Satellite Selam as Observed by the Lucy Mission,” E. B. Bierhaus et al 2025 Planet. Sci. J. 6 299. doi:10.3847/PSJ/ae1968
The post Details on Dinkinesh and Its Surprise Satellite from the Lucy Mission appeared first on AAS Nova.
]]>
Astronomers search for spacetime ripples from a possible supermassive black hole binary at the heart of the elliptical galaxy 3C 66B.
The post A Search for a Supermassive Black Hole Binary appeared first on AAS Nova.
]]>Researchers have undertaken a new search for a supermassive black hole binary, placing limits on its properties and exploring a promising technique for simultaneously analyzing electromagnetic and gravitational wave data.
Narrowing the Search for Supermassive Black Hole Binaries
In 2023, astronomers announced the discovery of compelling evidence for the gravitational wave background: the collective murmurs and rumblings of distant supermassive black hole binaries. The time may now be ripe for the natural next phase of discovery: the detection of gravitational waves from an individual supermassive black hole binary.
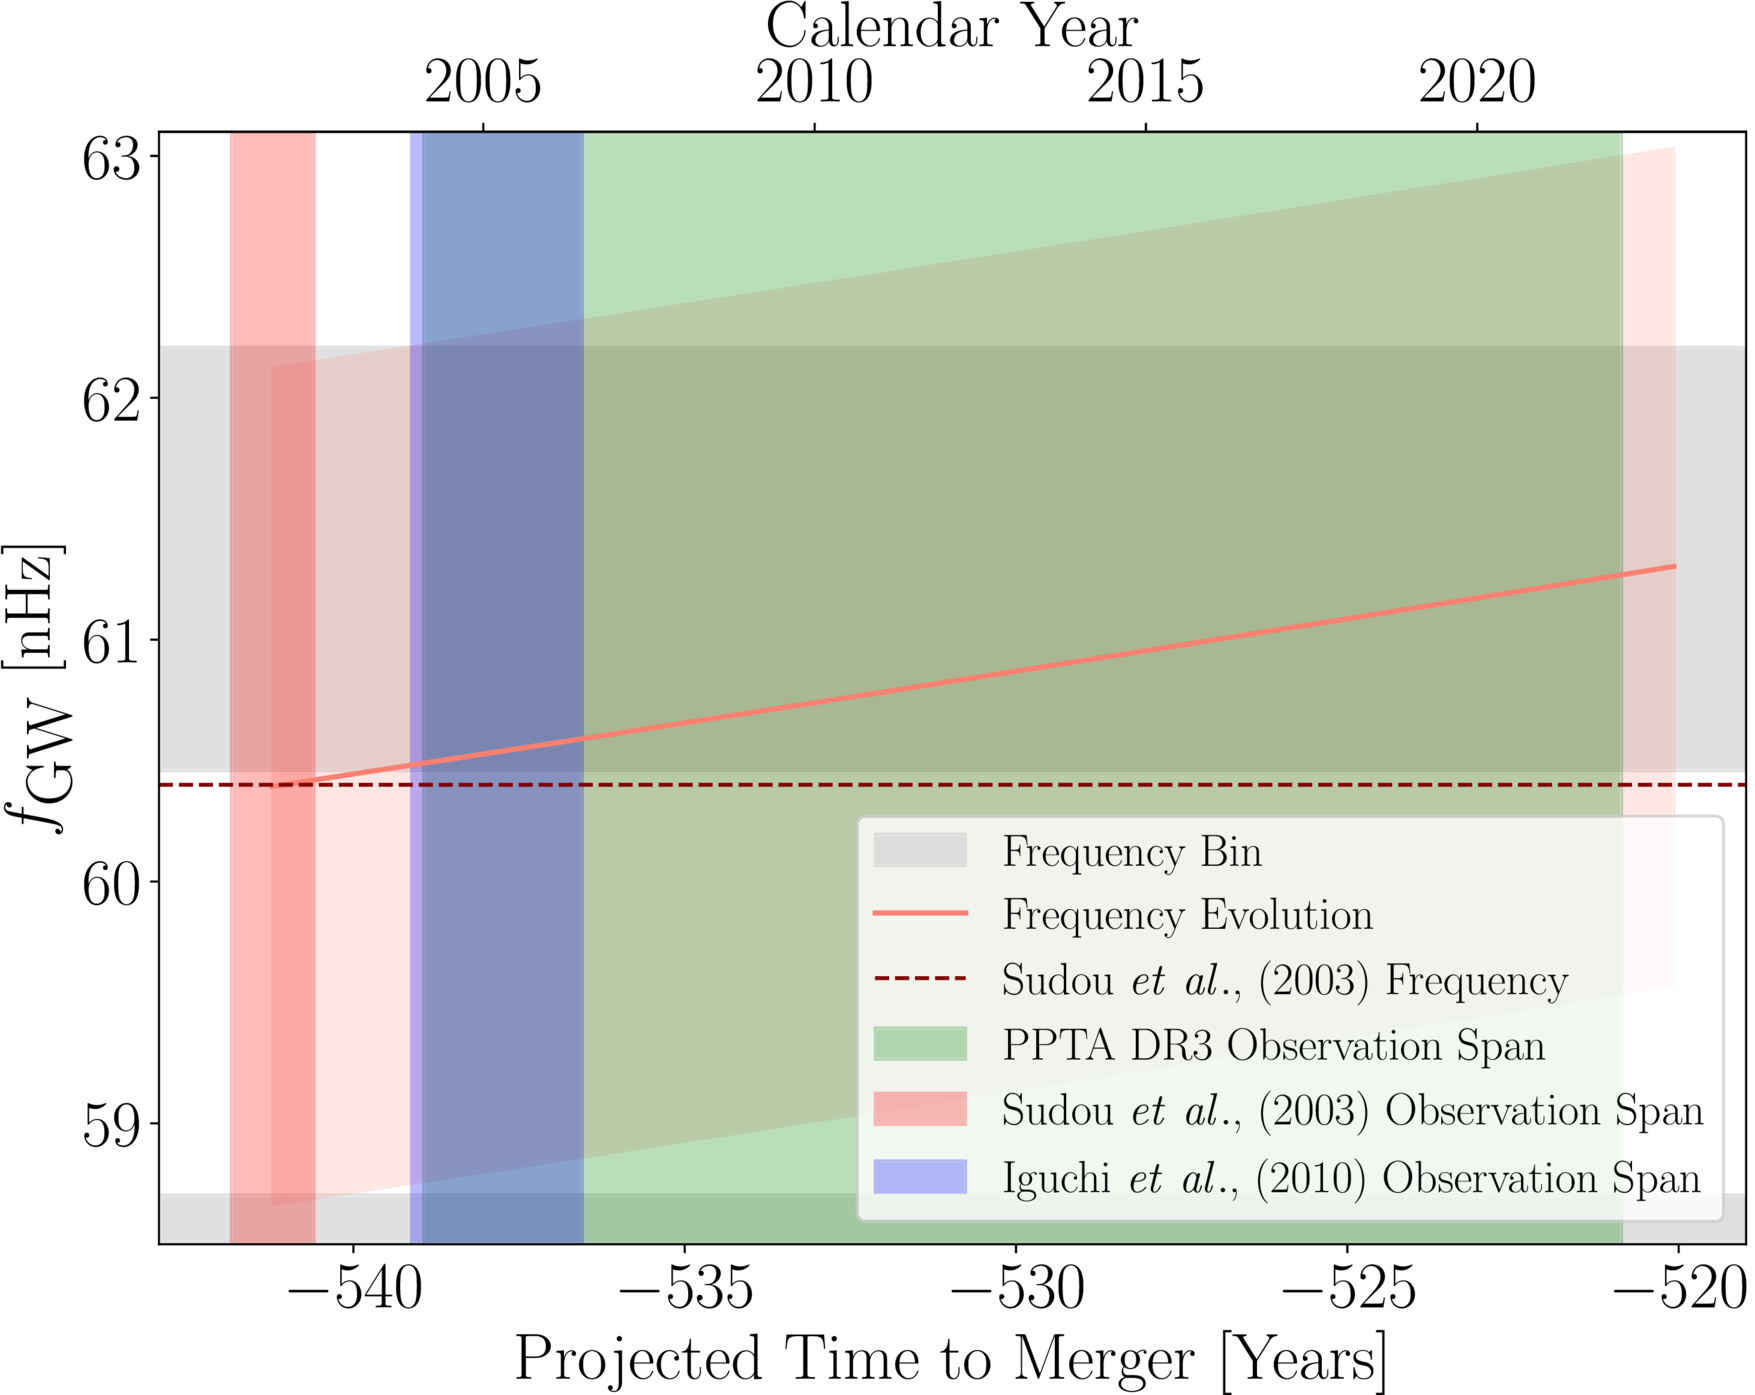
The predicted frequency evolution of gravitational waves from the black hole binary candidate in 3C 66B. Click to enlarge. [Cardinal Tremblay et al. 2026]
Pulsar Timing Array
Jacob Cardinal Tremblay (Max Planck Institute for Gravitational Physics and Leibniz University Hannover) and collaborators conducted a search for gravitational waves from the candidate supermassive black hole binary in 3C 66B using the Parkes Pulsar Timing Array (PPTA).
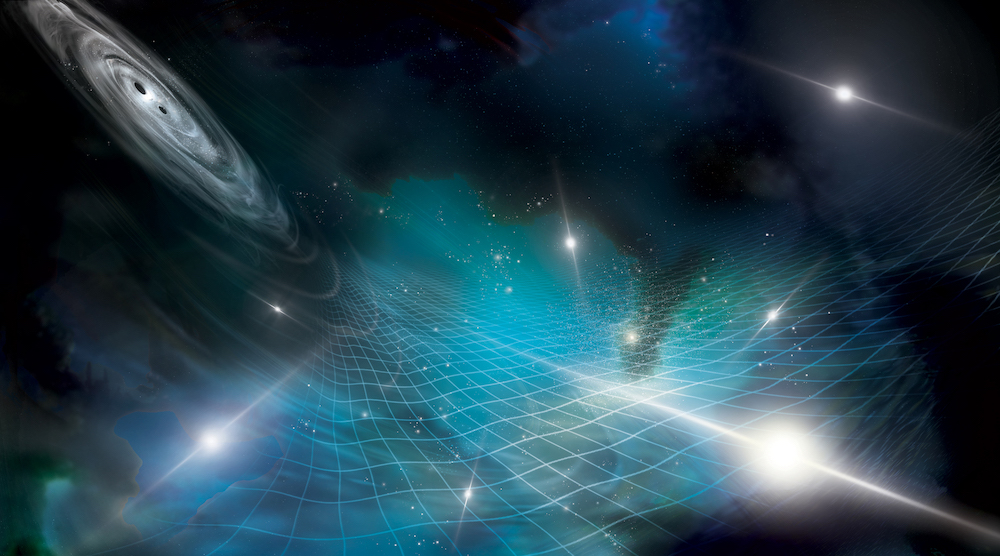
Artist’s impression of a supermassive black hole binary generating gravitational waves that sweep across an array of pulsars. [Aurore Simonnet / NANOGrav; CC BY 4.0]
Researchers have previously searched for gravitational waves from 3C 66B in data from other pulsar timing arrays, such as the North American Nanohertz Observatory for Gravitational Waves, and no black hole binary has been detected. This is the first search of the third PPTA data release, which contains measurements of 32 pulsars over 18 years, providing a long baseline to search for the slow undulations of low-frequency gravitational waves.
Placing Limits
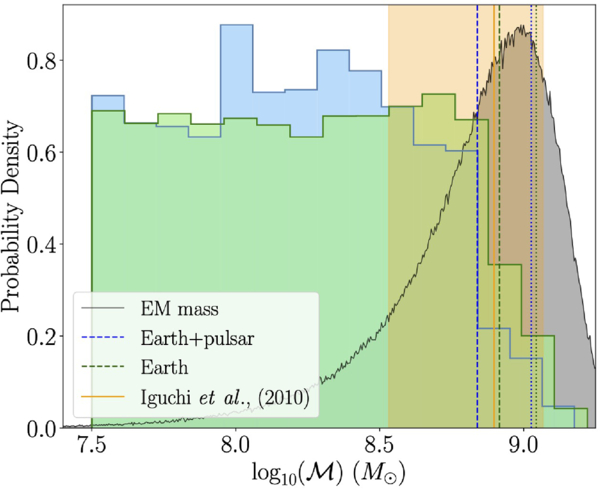
Constraints placed on the chirp mass by this work (blue and green histograms) compared to constraints from electromagnetic observations (gray and peach shaded areas). Click to enlarge. [Cardinal Tremblay et al. 2026]
While this analysis didn’t result in the first-ever detection of gravitational waves from a single supermassive black hole binary, it did allow the team to test a new method that could someday play a role in precision cosmology. This method simultaneously analyzes electromagnetic and gravitational wave data from known supermassive black hole binaries, establishing these sources as “standard sirens” that can complement standard candles like Type Ia supernovae for measurements of the expansion rate of the universe.
Citation
“A Multimessenger Search for the Supermassive Black Hole Binary in 3C 66B with the Parkes Pulsar Timing Array,” Jacob Cardinal Tremblay et al 2026 ApJL 998 L42. doi:10.3847/2041-8213/ae3c98
The post A Search for a Supermassive Black Hole Binary appeared first on AAS Nova.
]]>
Astrobites reports on an investigation of a runaway star that may have survived its companion going supernova.
The post I Survived a Type Ia Supernova, and All I Got Was This Kick Velocity appeared first on AAS Nova.
]]>Editor’s Note: Astrobites is a graduate-student-run organization that digests astrophysical literature for undergraduate students. As part of the partnership between the AAS and astrobites, we occasionally repost astrobites content here at AAS Nova. We hope you enjoy this post from astrobites; the original can be viewed at astrobites.org.
Title: Supernova Ia Remnants with M-Dwarf Surviving Companions
Authors: Kuo-Chuan Pan (潘國全), Pilar Ruiz-Lapuente, and Jonay I. González Hernández
First Author’s Institution: National Tsing Hua University
Status: Published in ApJ
Type Ia supernovae are important tools astronomers use to measure distances in space. Despite their important role as “standardizable candles,” their origins remain hotly debated. It’s long been theorized that a Type Ia supernova can develop from one of two pathways: the single-degenerate channel or the double-degenerate channel. In the single-degenerate channel, a white dwarf and a non-degenerate star (such as a red giant or main-sequence star like our Sun) orbit each other in a close binary system. The white dwarf accretes material from the outer surface of the non-degenerate star until it reaches a critical mass and explodes. The double-degenerate channel begins instead with two white dwarfs orbiting each other. Most explosion mechanisms from this channel result in the complete obliteration of the secondary, less-massive white dwarf. However, one theoretical explosion mechanism, called the dynamically driven double-degenerate double-detonation (D6) channel, might allow the secondary companion star to survive an explosion from a double-degenerate Type Ia supernova.
Generally, due to the immense energy from a supernova explosion, we expect these surviving companion stars to be “kicked” away from the blasts at high velocities. Fortunately, astronomers have found evidence of these surviving companion stars. As covered in a previous Astrobite, three hypervelocity white dwarfs have been found in Gaia data and traced back to the locations of double-degenerate Type Ia supernovae. Given the prevalence of Type Ia supernovae, however, astronomers are led to question why we haven’t seen many more of these candidates. It’s additionally important to wonder what similar “runaway” companions might look like for the single-degenerate channel.
Recent observations by the Gaia spacecraft near the supernova remnant G272.2-3.2 show an M-dwarf star, MV-G272, with an unusually high velocity around 240 km/s and a trajectory tracing back to the center of the supernova remnant. Is it possible for this M dwarf to be the runaway companion to the remnant’s original supernova? The authors of today’s article look at simulations of potential companion stars from single-degenerate Type Ia supernovae and compare their results to this observed potential companion candidate.
Because this work focuses on the potential for M-dwarf companions, the authors explored a range of simulated companion-star masses and radii characteristic of M dwarfs: 0.5, 0.6, and 0.7 solar mass and 0.396, 0.454, and 0.483 solar radius, respectively. To make these models, they used the stellar evolution code Modules for Experiments in Stellar Astrophysics (MESA) to construct and evolve a number of simulated stars with these specifications.
After setting up the models in MESA, they used the magnetohydrodynamics code FLASH to perform 2D and 3D simulations of the supernova explosion and the subsequent impact of the exploding star’s ejecta (or hot material) on its M-dwarf companion. After the explosion and impact were modeled, the companion star’s evolution was further followed in MESA.
Figure 1 shows the density of the supernova’s ejecta, or exploding material, as it impacts the companion star. (You can think of this figure as if you were looking at the companion star out in space.) After roughly 100 seconds, you can see a bow shock develop around the top of the companion (or the “front” of the star) as it wraps around the companion. This impact causes significant compression of the companion star and rips away upwards of 50% the companion’s mass. The impact of this shock is what gives the companion star its “kick,” sending it hurtling through space.
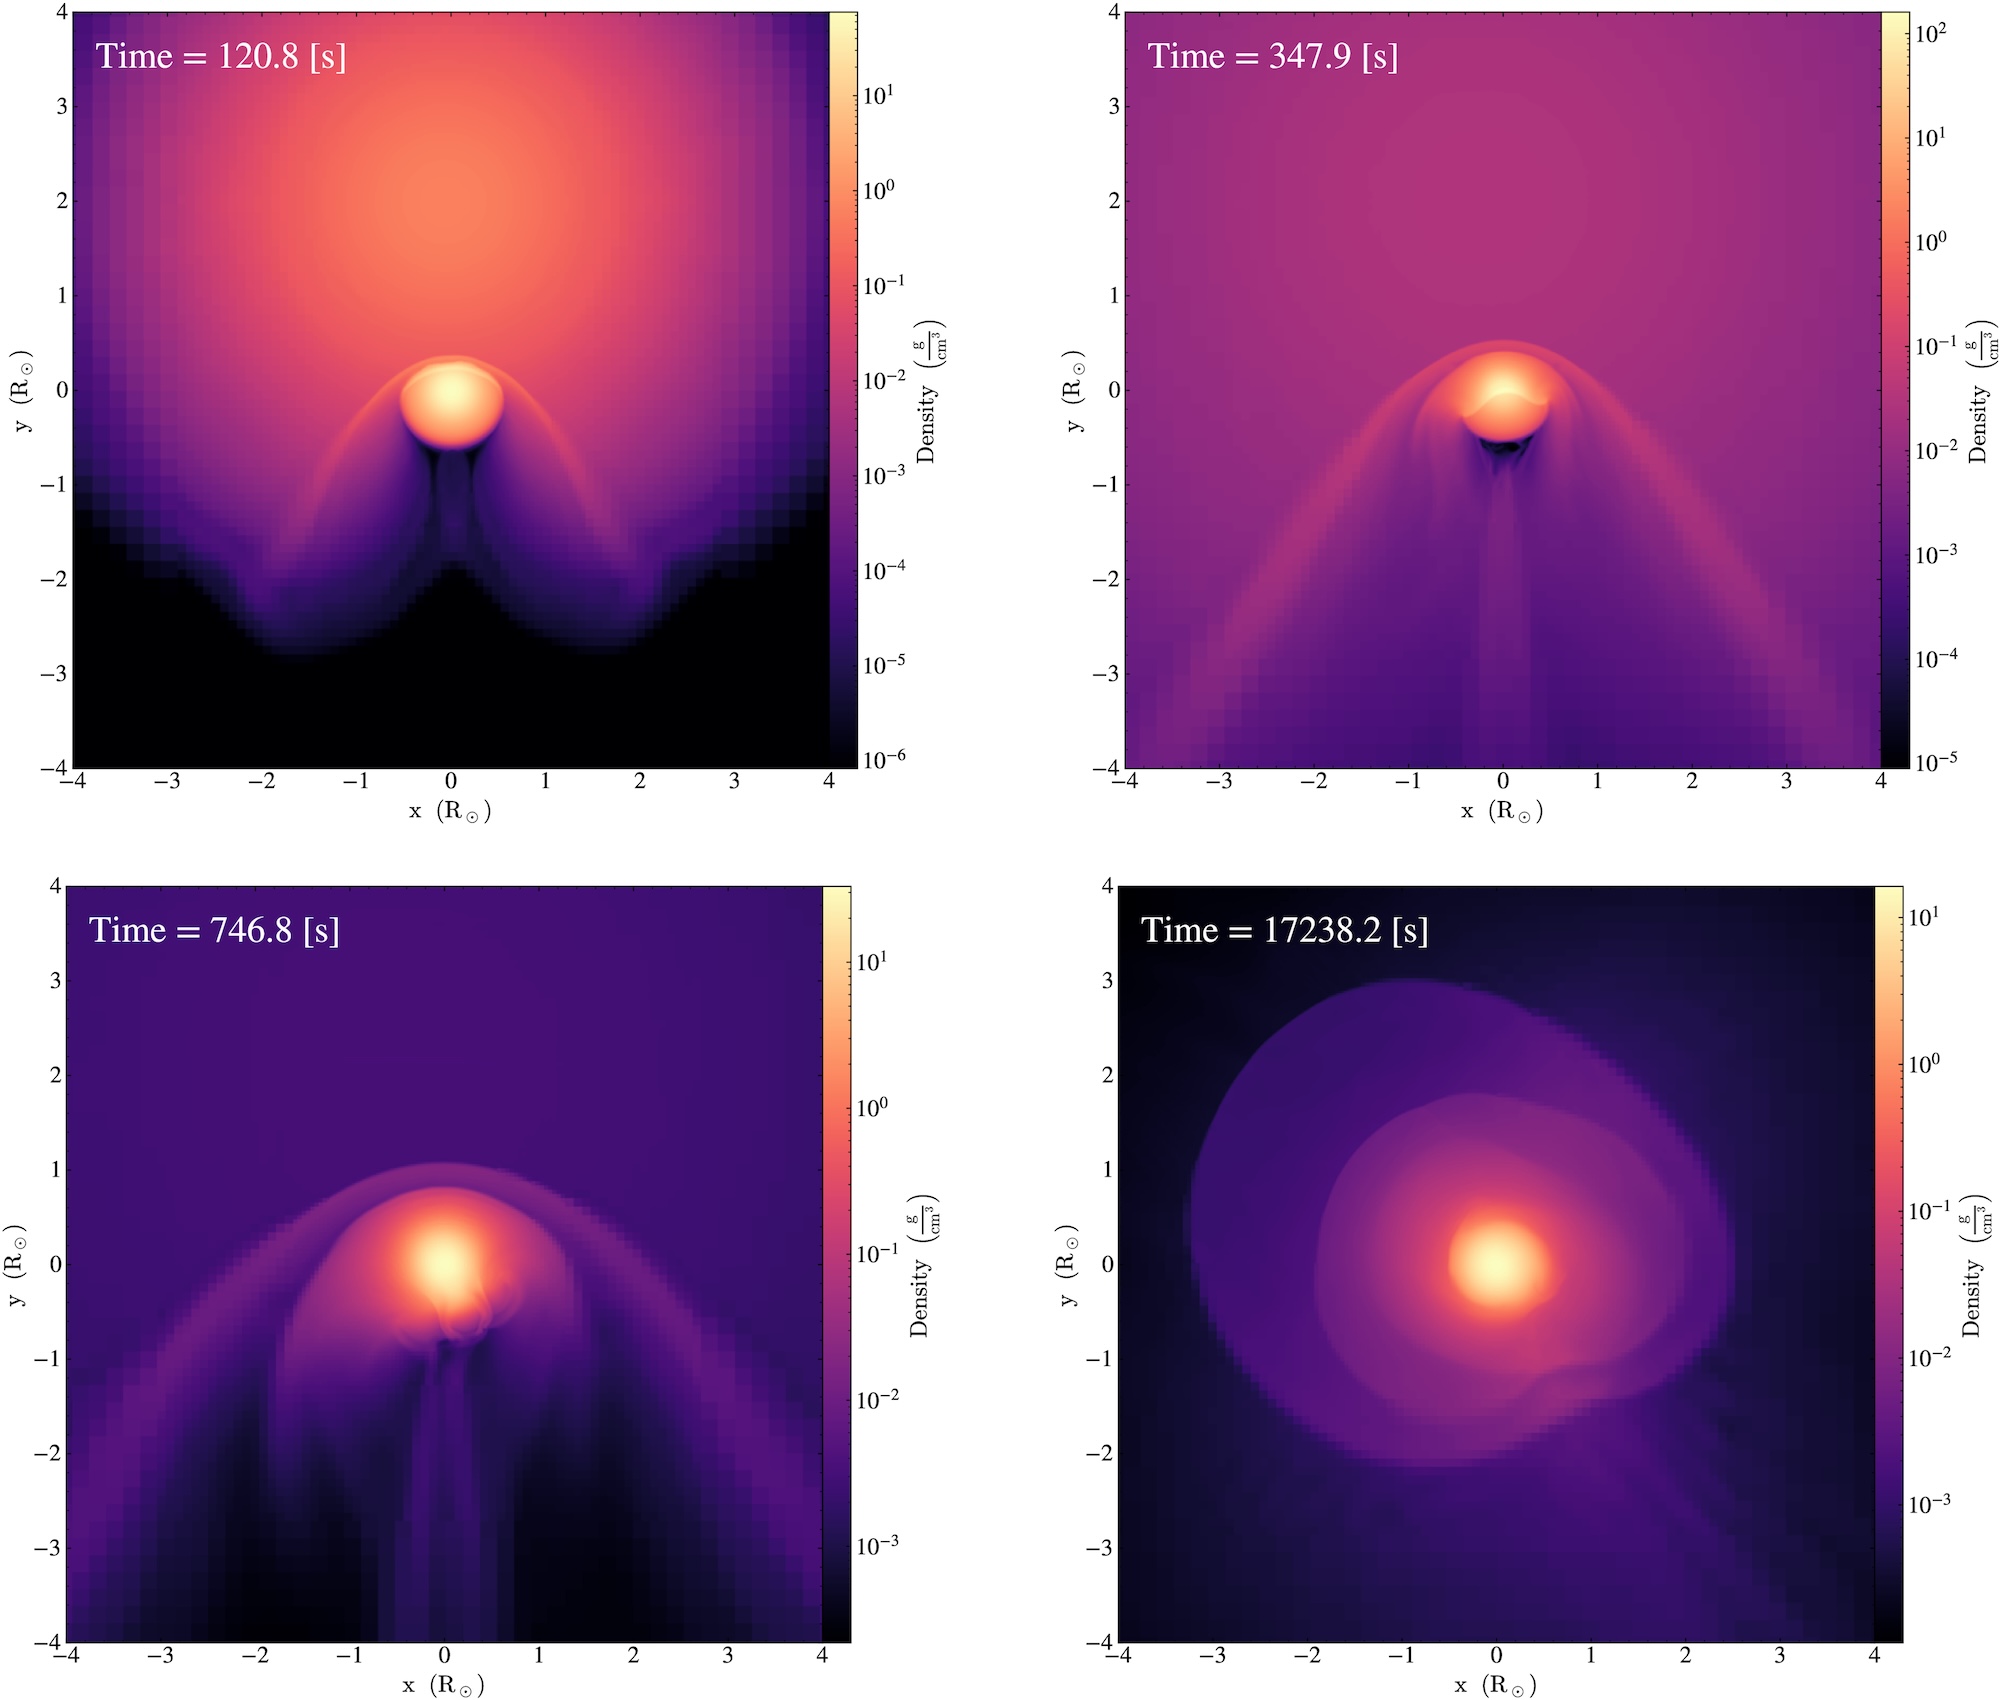
Figure 1: Visual of the density of the companion star (center of each plot) and the supernova ejecta over time. In the top row of plots and the bottom-left plot, you can see the higher-density bow shock bent around the top (or front) of the companion star. In the bottom-right plot, you can see some of the supernova ejecta and unbound mass from the companion star settling around the companion star. [Pan et al. 2025]
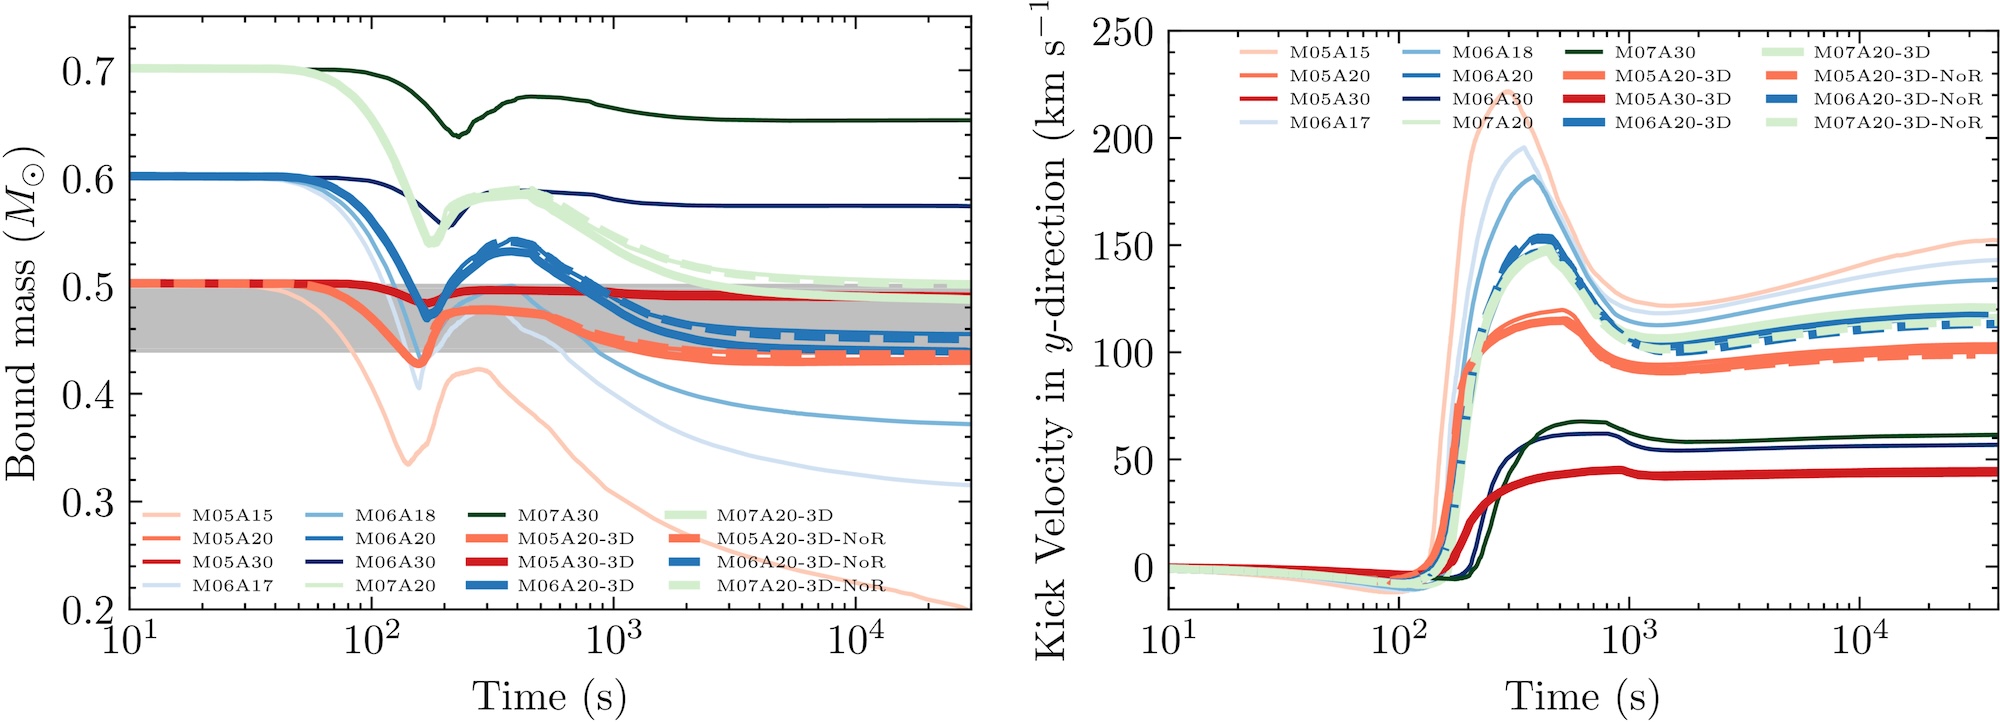
Figure 2: The different models shown in both plots indicate different initial masses and separation distances between the companion and the exploding star. Left: how the companion’s gravitationally bound mass evolves over time. The plot can be read left to right. The dip around 102 seconds indicates the impact of the supernova shock, which unbinds layers of the companion’s mass. Some of that mass becomes bound again to the companion after the shock passes. Right: how the companion star’s kick velocity changes based on initial mass and separation distance between companion and exploding star. The peak in values between 102 and 103 seconds indicates the impact, or “kick,” from the supernova. [Pan et al. 2025]
Notably, runaway companion stars of these Type Ia supernovae seem to retain information from the initial explosion. Given the final velocities of these companions, astronomers might be able to figure out the companion’s initial mass and trace back its trajectory to the system it originated from. Overall, the fact that MV-G272 has a trajectory that tracks back to the center of a supernova remnant makes it a good companion candidate. These results support the feasibility of M-dwarf runaway companions from single-degenerate Type Ia supernova systems. Now that we know what these companions might look like — and how fast they can be going — astronomers can hopefully better search for these high-velocity stars in the future.
Original astrobite edited by Catherine Slaughter.
About the author, Mckenzie Ferrari:
I’m currently a PhD student in the geophysical sciences program at the University of Chicago. While I now study the atmosphere and oceans of Earth, most of my previous research focused on simulations of Type Ia supernovae and galaxy formation and evolution. In my free time, I foster cats for a local organization, enjoy cooking, and can often be found running along Lake Michigan.
The post I Survived a Type Ia Supernova, and All I Got Was This Kick Velocity appeared first on AAS Nova.
]]>
Could a recent collision between the two largest satellites of the Milky Way explain the disrupted state of the Small Magellanic Cloud?
The post Disrupted Dwarf Galaxy: Investigating the History of the Small Magellanic Cloud appeared first on AAS Nova.
]]>Researchers show that the highly disrupted state of the Small Magellanic Cloud can be attributed to a long history of interactions with its neighbor, the Large Magellanic Cloud.
A Disrupted Dwarf Galaxy?
The Small Magellanic Cloud (SMC) is one of the largest and nearest satellites of the Milky Way. At a distance of just 200,000 light-years, the SMC has long been used as an accessible analog for low-metallicity star-forming galaxies in the early universe.
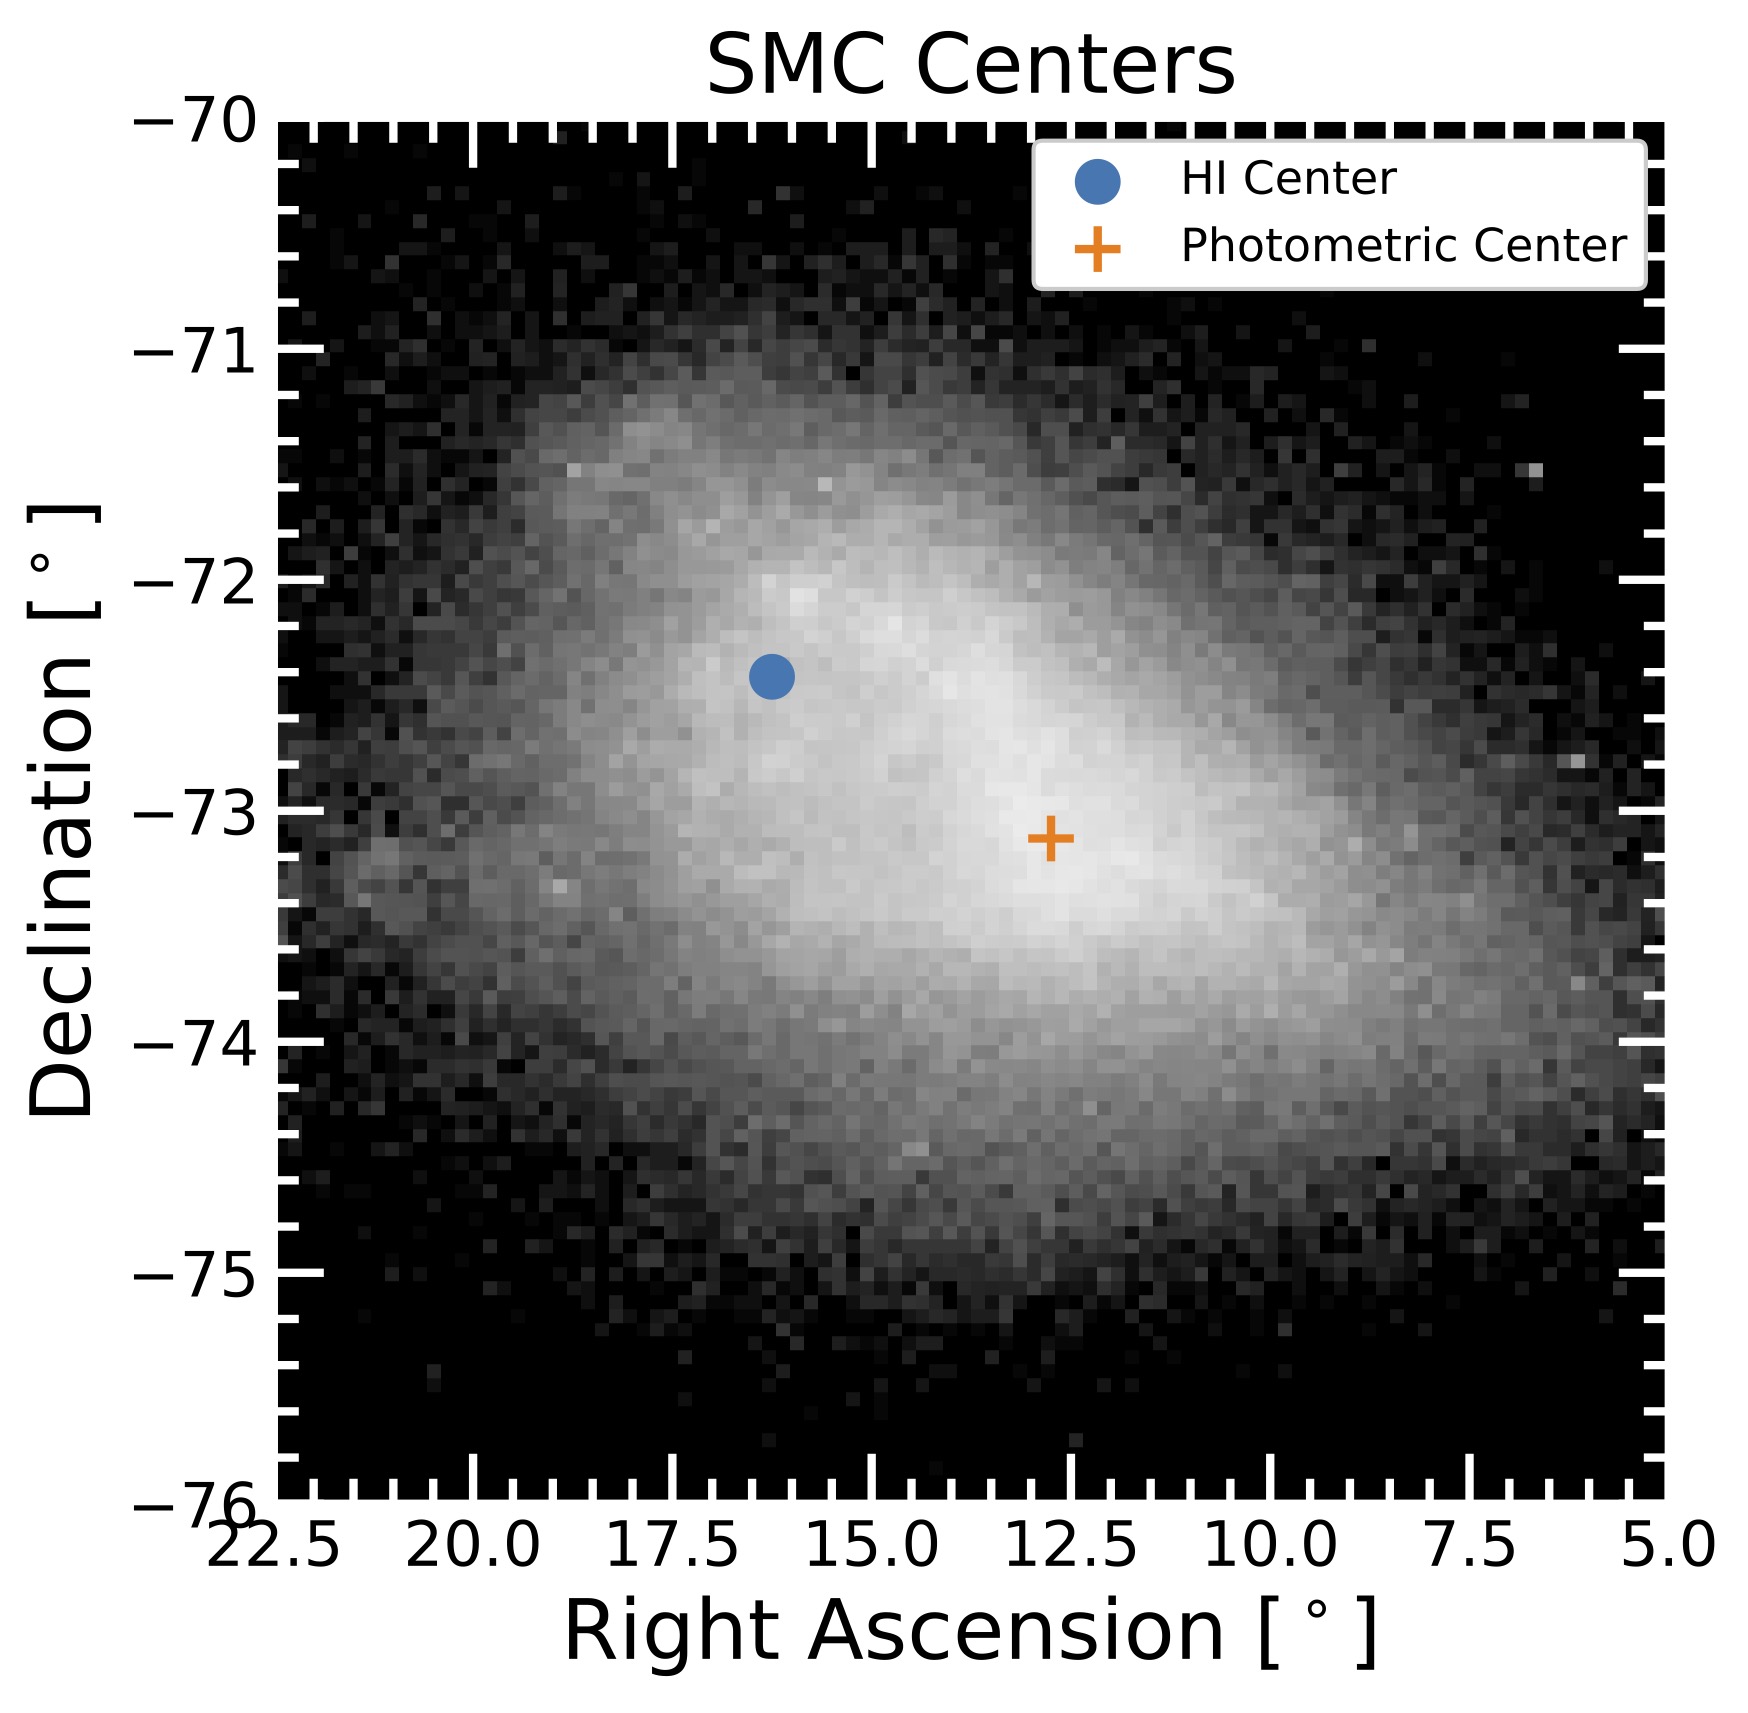
Locations of the SMC’s photometric center and hydrogen gas kinematic center. The two locations are separated by several thousand light-years. [Adapted from Rathore et al. 2026]
The source of this disequilibrium might be the Milky Way’s largest satellite, the Large Magellanic Cloud (LMC). As the SMC inches along its orbit around the Milky Way, it also engages in a gravitational dance with the LMC. These galaxies may be clumsy dance partners, with data suggesting a potential direct collision between the SMC and LMC within the past 200 million years.
Modeling the Magellanic Clouds
To understand how a potential collision between the Magellanic Clouds might have impacted the present-day properties of the SMC, Himansh Rathore (University of Arizona) and collaborators used hydrodynamical simulations to explore the interconnected histories of the SMC, the LMC, and the Milky Way.
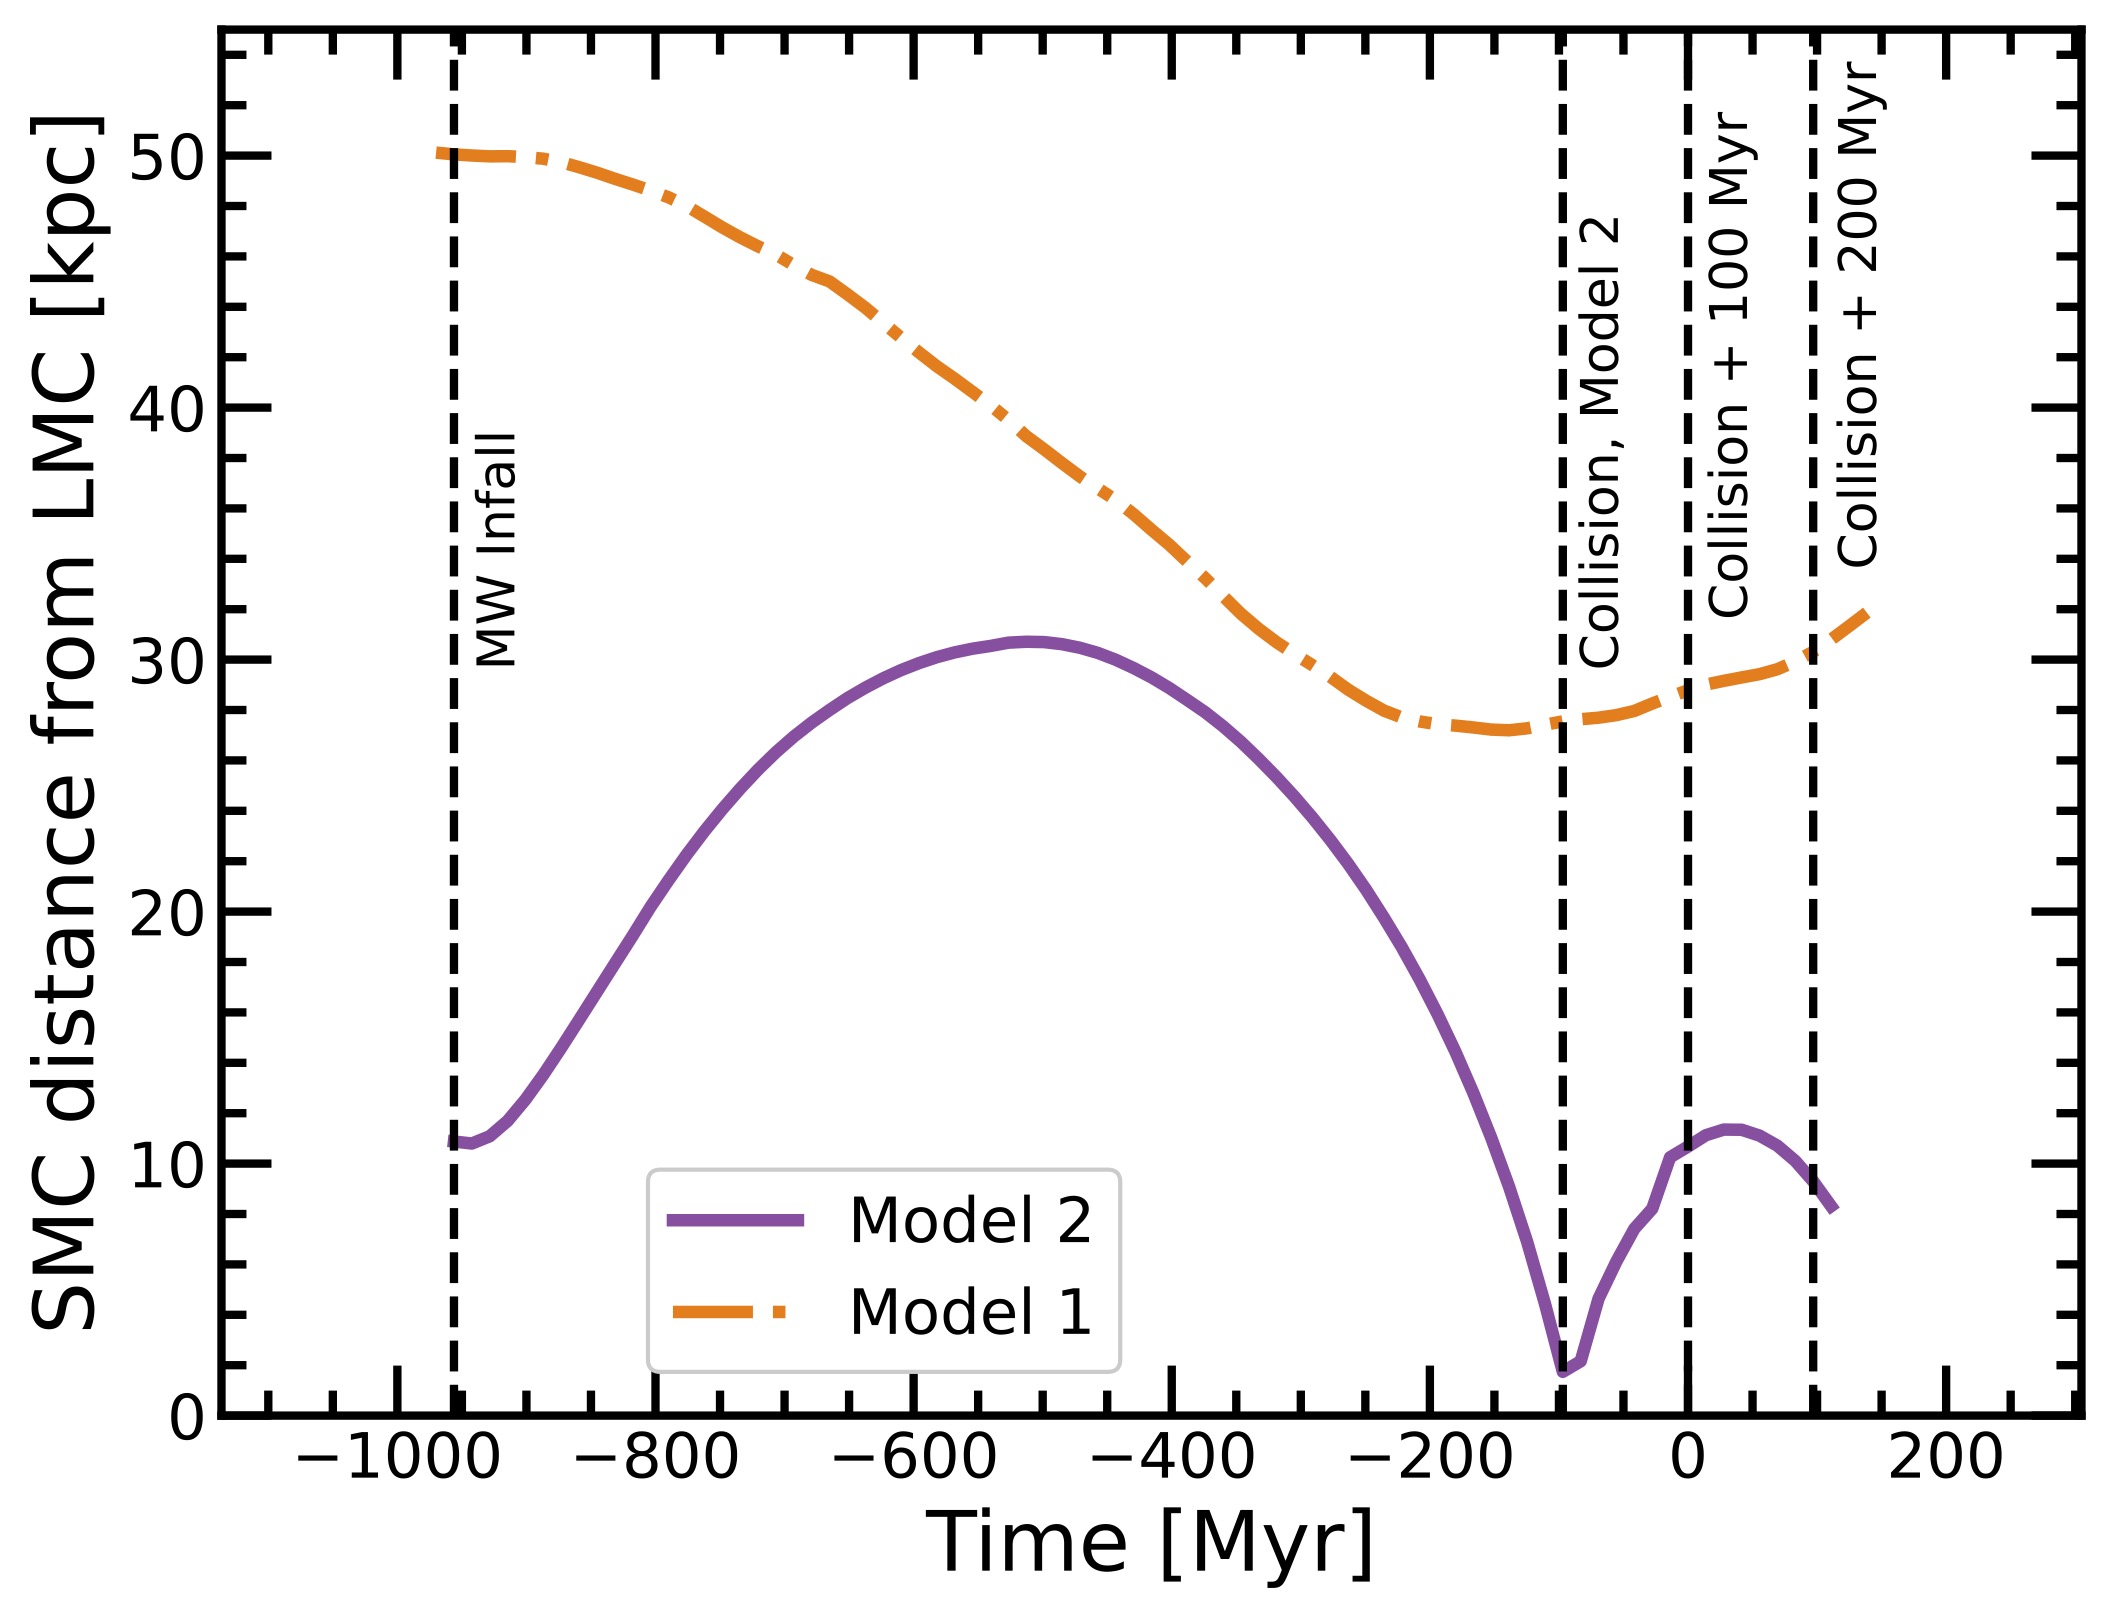
SMC–LMC separation over time in the control model (orange dot-dashed line) and the collision model (purple solid line). Click to enlarge. [Rathore et al. 2026]
Both of these model scenarios reproduced certain features of the SMC–LMC system, such as the bridge of gas that spans the distance between them. Only the collision scenario, though, can explain the apparent discrepancy between the SMC’s stars and gas.
An Impactful Collision
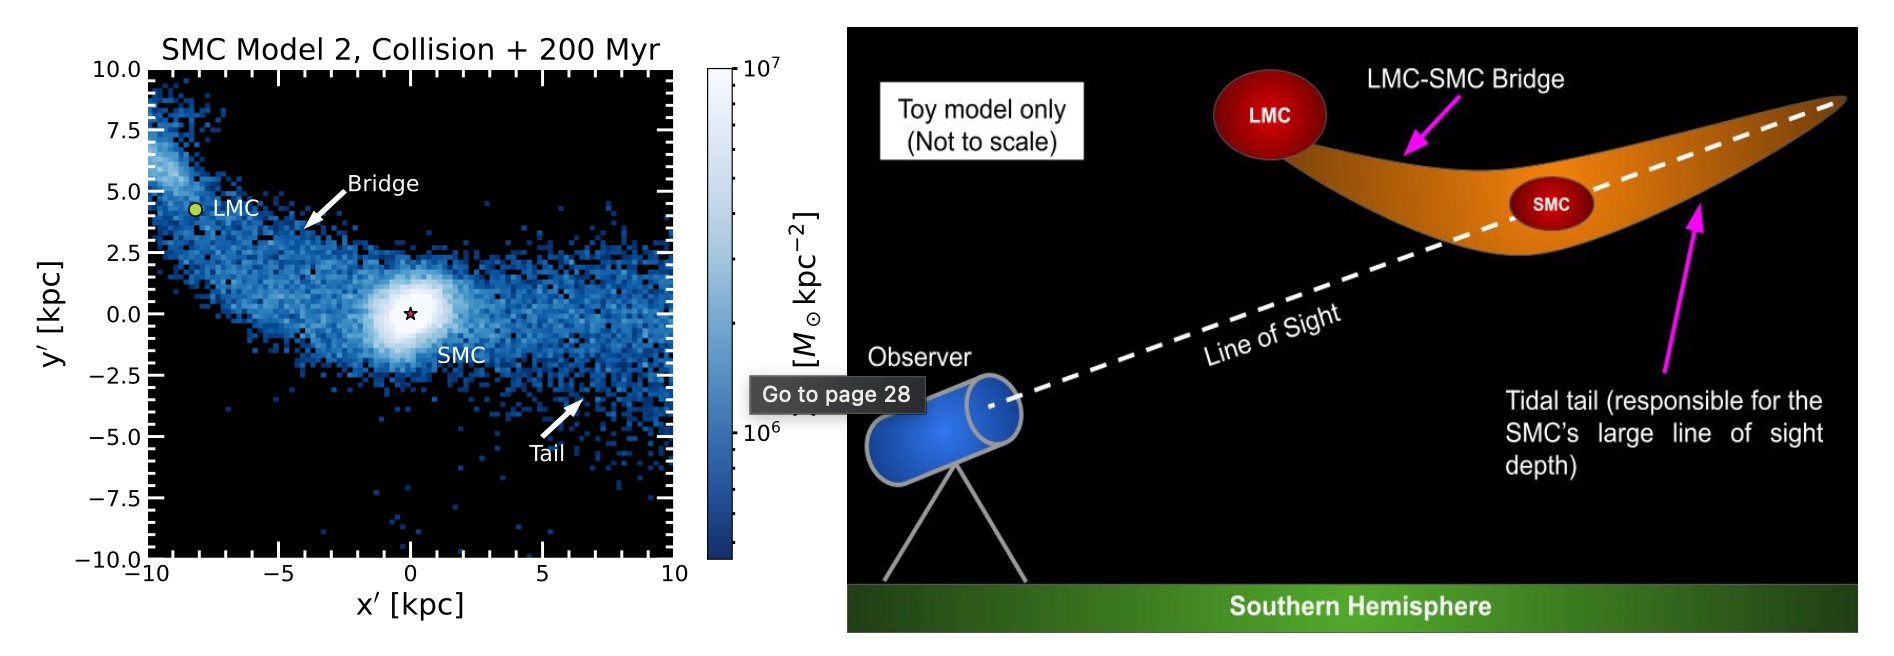
Left: Simulated stellar density 200 million years post-collision. Right: A schematic of our likely perspective on the post-collision SMC–LMC system. Click to enlarge. [Rathore et al. 2026]
In terms of the galaxy’s rotation, only the stars nearest the SMC’s center rotate, while the rest move radially outward, swayed by the tidal pull of the LMC. This radial motion is also present in the galaxy’s gas. While previous work has interpreted the observed velocity dispersion of the SMC’s gas as a sign of rotation, Rathore’s team showed that radial expansion, viewed from an inclined angle, can mimic a rotational signature.
The team also showed that the gas is far more disturbed than the stars, reflecting the pressure exerted by the LMC’s gas when the two galaxies collided. This type of interaction can transform an irregular dwarf galaxy into an ellipsoidal or spheroidal dwarf galaxy — a transition that Rathore’s team argues is underway for the SMC.
Ultimately, these simulations demonstrate that the SMC is a profoundly disrupted galaxy, likely still reeling from a recent collision with its larger neighbor. Viewing the SMC through this lens is critical to understanding its role as an analog to early universe galaxies.
Citation
“A Galactic Transformation — Understanding the SMC’s Structural and Kinematic Disequilibrium,” Himansh Rathore et al 2026 ApJ 1000 50. doi:10.3847/1538-4357/ae4507
The post Disrupted Dwarf Galaxy: Investigating the History of the Small Magellanic Cloud appeared first on AAS Nova.
]]>
Astronomers knew that Jupiter's upper atmosphere could be strangely warm, but only now do they have global maps showing just where those hot spots are and how long they last.
The post Jupiter’s Atmosphere Holds Steady appeared first on AAS Nova.
]]>Jupiter’s upper atmosphere is hundreds of degrees hotter than it has any right to be, and for decades astronomers could only study it in brief, seemingly chaotic glimpses. New global maps built from years of observations have finally revealed the big picture — and it is surprisingly calm.
Order from Chaos
Although we’re well acquainted with Jupiter, having sent eight spacecraft on close passages and lived with it dominating the night sky for millennia, some of its simplest characteristics continue to puzzle us. For example, high above Jupiter’s cloud bands, temperatures exceed 800 K — far hotter than we’d expect given the meager sunlight that reaches that distance. Astronomers have long suspected that this excess is deposited by energy from the planet’s brilliant polar auroras, but previous observations provided only localized, sporadic snapshots that collectively painted a confusing picture of an ever-changing landscape.
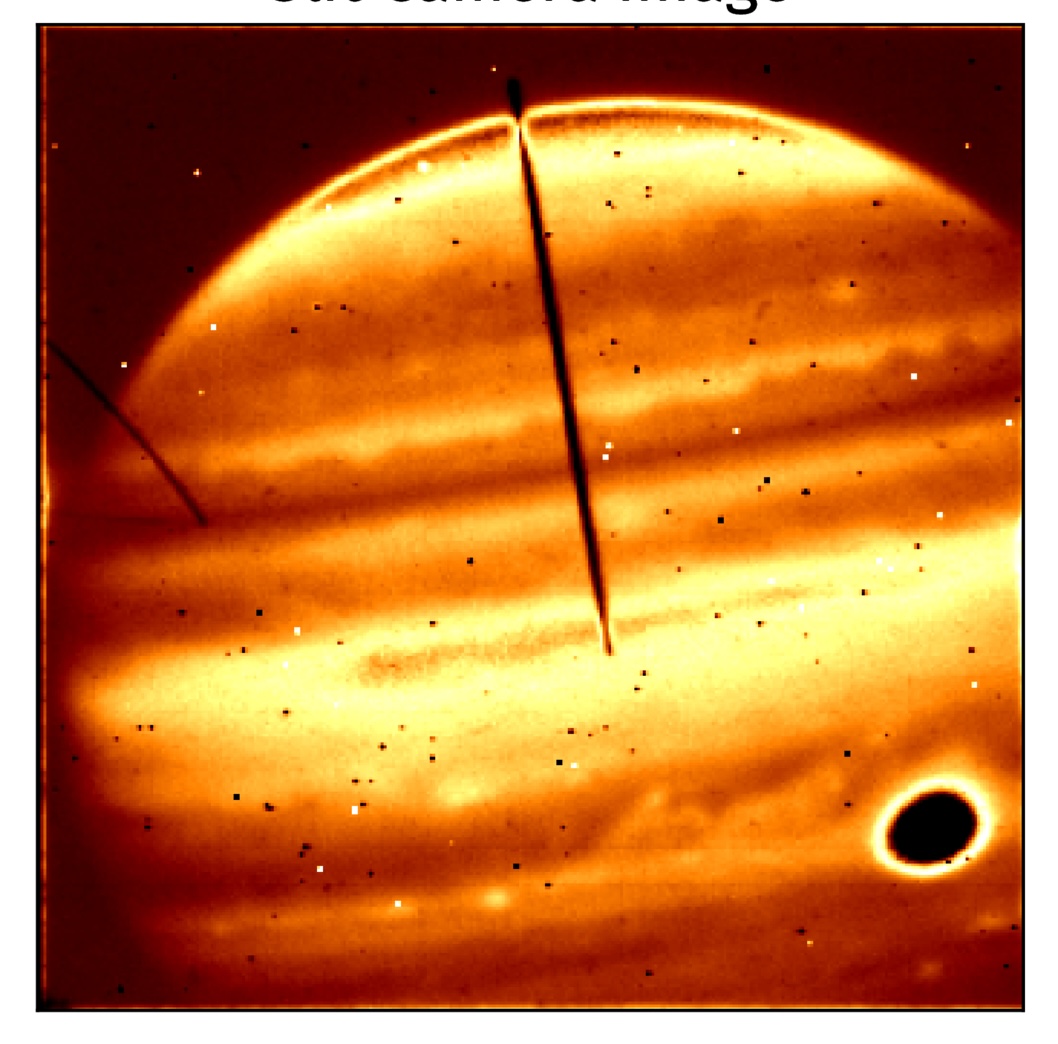
Jupiter as seen by the slit camera on the Keck telescope during one of the team’s observations. The spectrograph slit is the dark vertical band stretching from the equator to the north pole, and the Great Red Spot appears in black at the lower right. [Adapted from Roberts et al. 2026]
Consistency is Key
A look at how the maps evolved over time revealed striking order: the spatial patterns remained nearly constant, and the temperatures barely changed even over years. In general, the team noted that temperature decreases smoothly from the auroral regions near the poles (~1,150 K) to the equator (~750 K) at every longitude, and that although there is some night-to-night temperature variation, things stay remarkably steady over the years-long baseline.
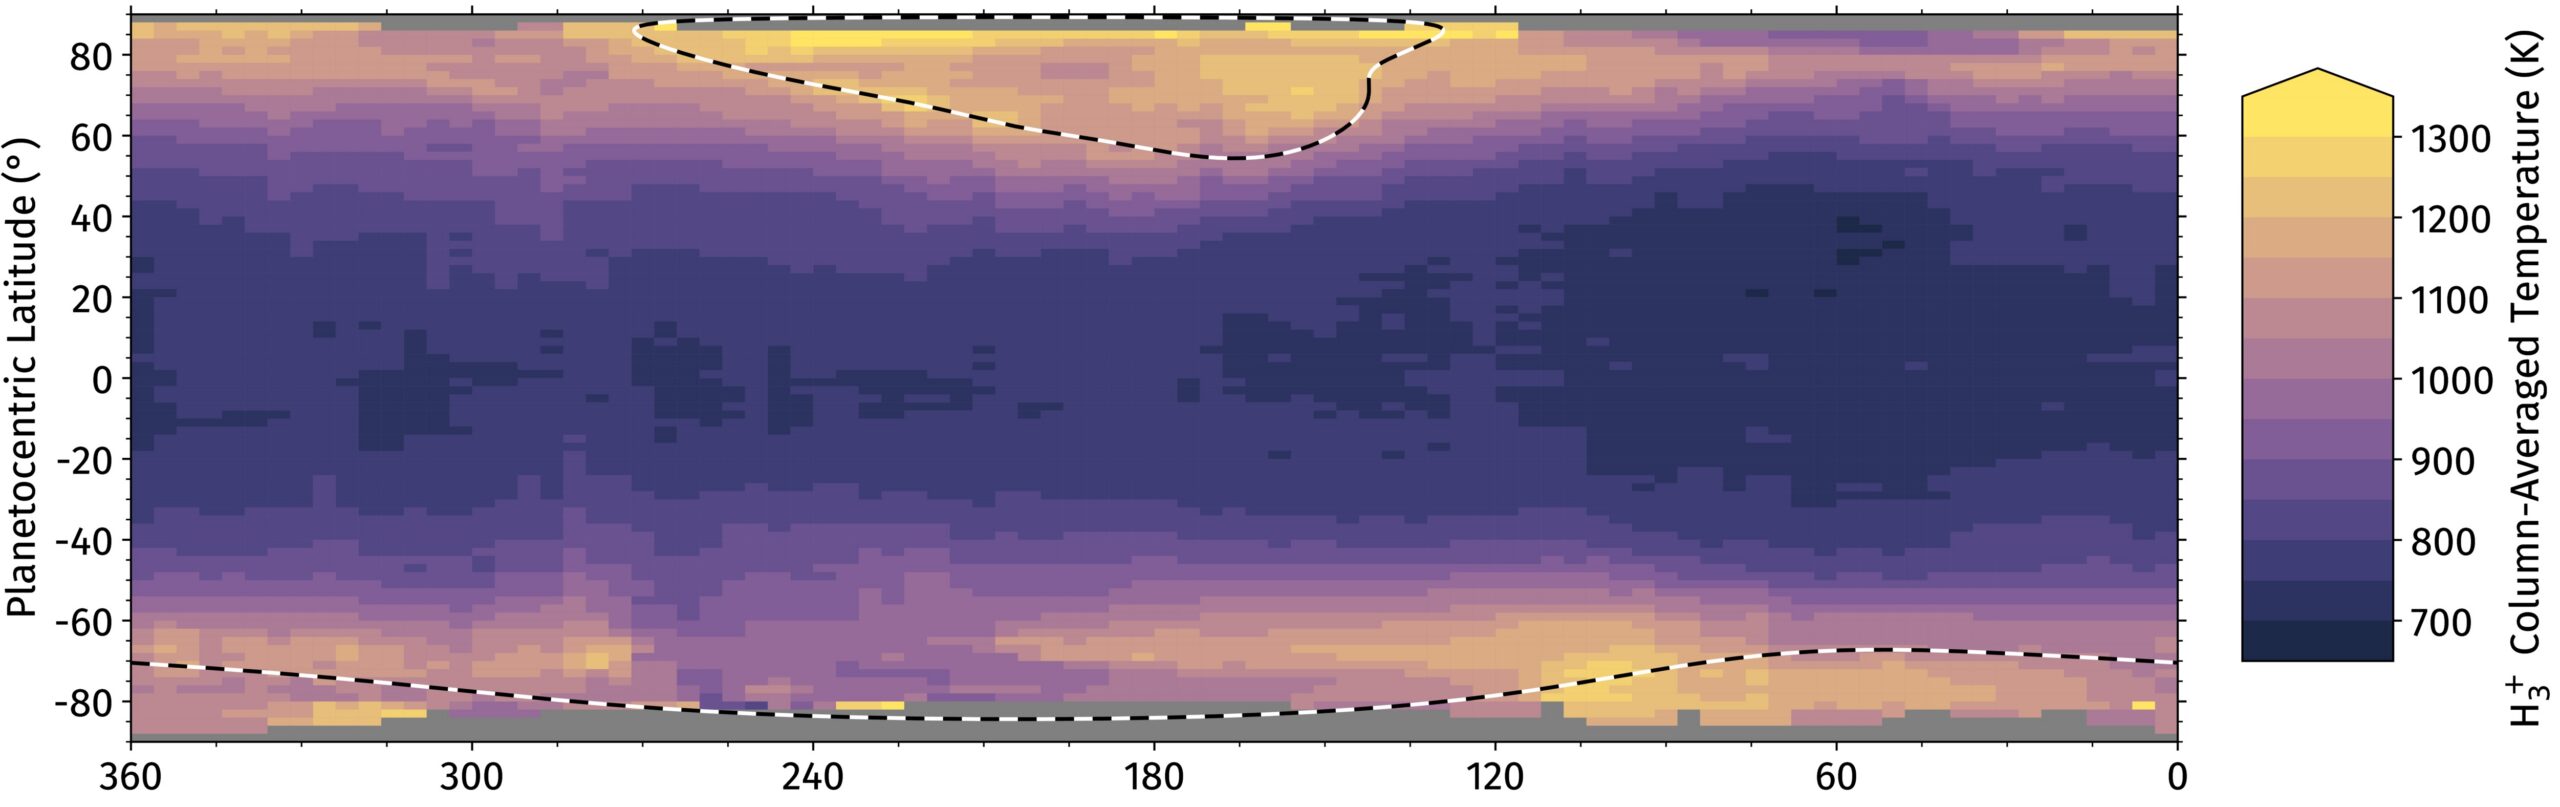
A map of the average temperature of Jupiter’s upper atmosphere, as measured by the new Keck NIRSPEC data. Click to enlarge. [Adapted from Roberts et al. 2026]
The conclusion that the upper atmosphere is complex but steady has implications beyond just Jupiter, as the team notes that JWST has already observed spatial patterns in the temperatures of the upper atmospheres of both Uranus and Neptune. As Roberts and colleagues note, “similar physical mechanisms could give rise to comparably stable structures” on those distant ice giants, meaning this analysis could ground our understanding of the upper atmospheres of giant worlds across the solar system.
Citation
“A Global View of Jupiter’s Upper Atmosphere Through H3+,” Kate Roberts et al 2026 ApJL 998 L13. doi:10.3847/2041-8213/ae3c9b
The post Jupiter’s Atmosphere Holds Steady appeared first on AAS Nova.
]]>
Thanks to increasingly high-resolution images of the Sun, researchers are catching magnetic reconnection as it happens.
The post Astronomers See Braided Magnetic Fields Above a Sunspot appeared first on AAS Nova.
]]>Revealed in high resolution, researchers have spotted complex twisting and braiding motions in fine threads of plasma suspended above a sunspot. The flow of material that followed this braiding provides evidence for magnetic reconnection.
Heating Up the Corona
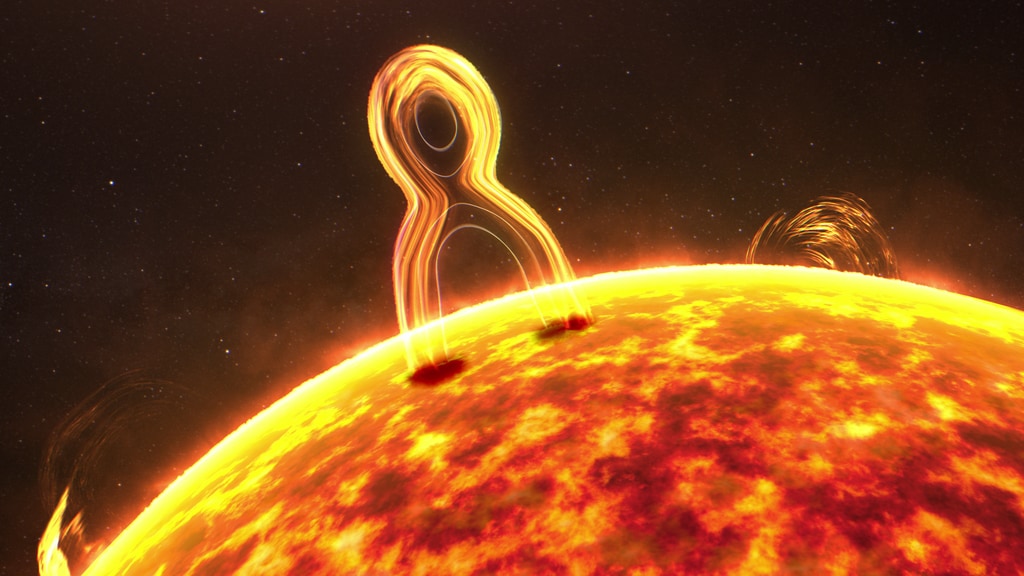
Magnetic reconnection is common throughout the universe, from Earth’s magnetic field to the jets of supermassive black holes. This illustration shows magnetic reconnection happening on the Sun. [NASA’s Conceptual Image Laboratory]
One way for magnetic reconnection to heat the corona is along magnetic fields that loop up into the corona and are anchored to the solar photosphere. The footprints of these field lines — the spots where they land in the photosphere — wiggle around in random ways. As this happens, the arcing magnetic field lines become braided together, and the twisted magnetic field can then undergo magnetic reconnection, heating the corona.
Braiding and Unbraiding
This process has been explored theoretically, but it’s been challenging to observe directly. As increasingly capable Sun-studying instruments have come online, though, researchers have been able to attain the high resolution needed to see this process at work.
Recently, Hechao Chen (Yunnan University; Peking University; Yunnan Key Laboratory of Solar Physics and Space Science) used data from the New Vacuum Solar Telescope, the Interface Region Imaging Spectrograph, and the Solar Dynamics Observatory to study the braiding and unbraiding of fine magnetic structures above a sunspot.
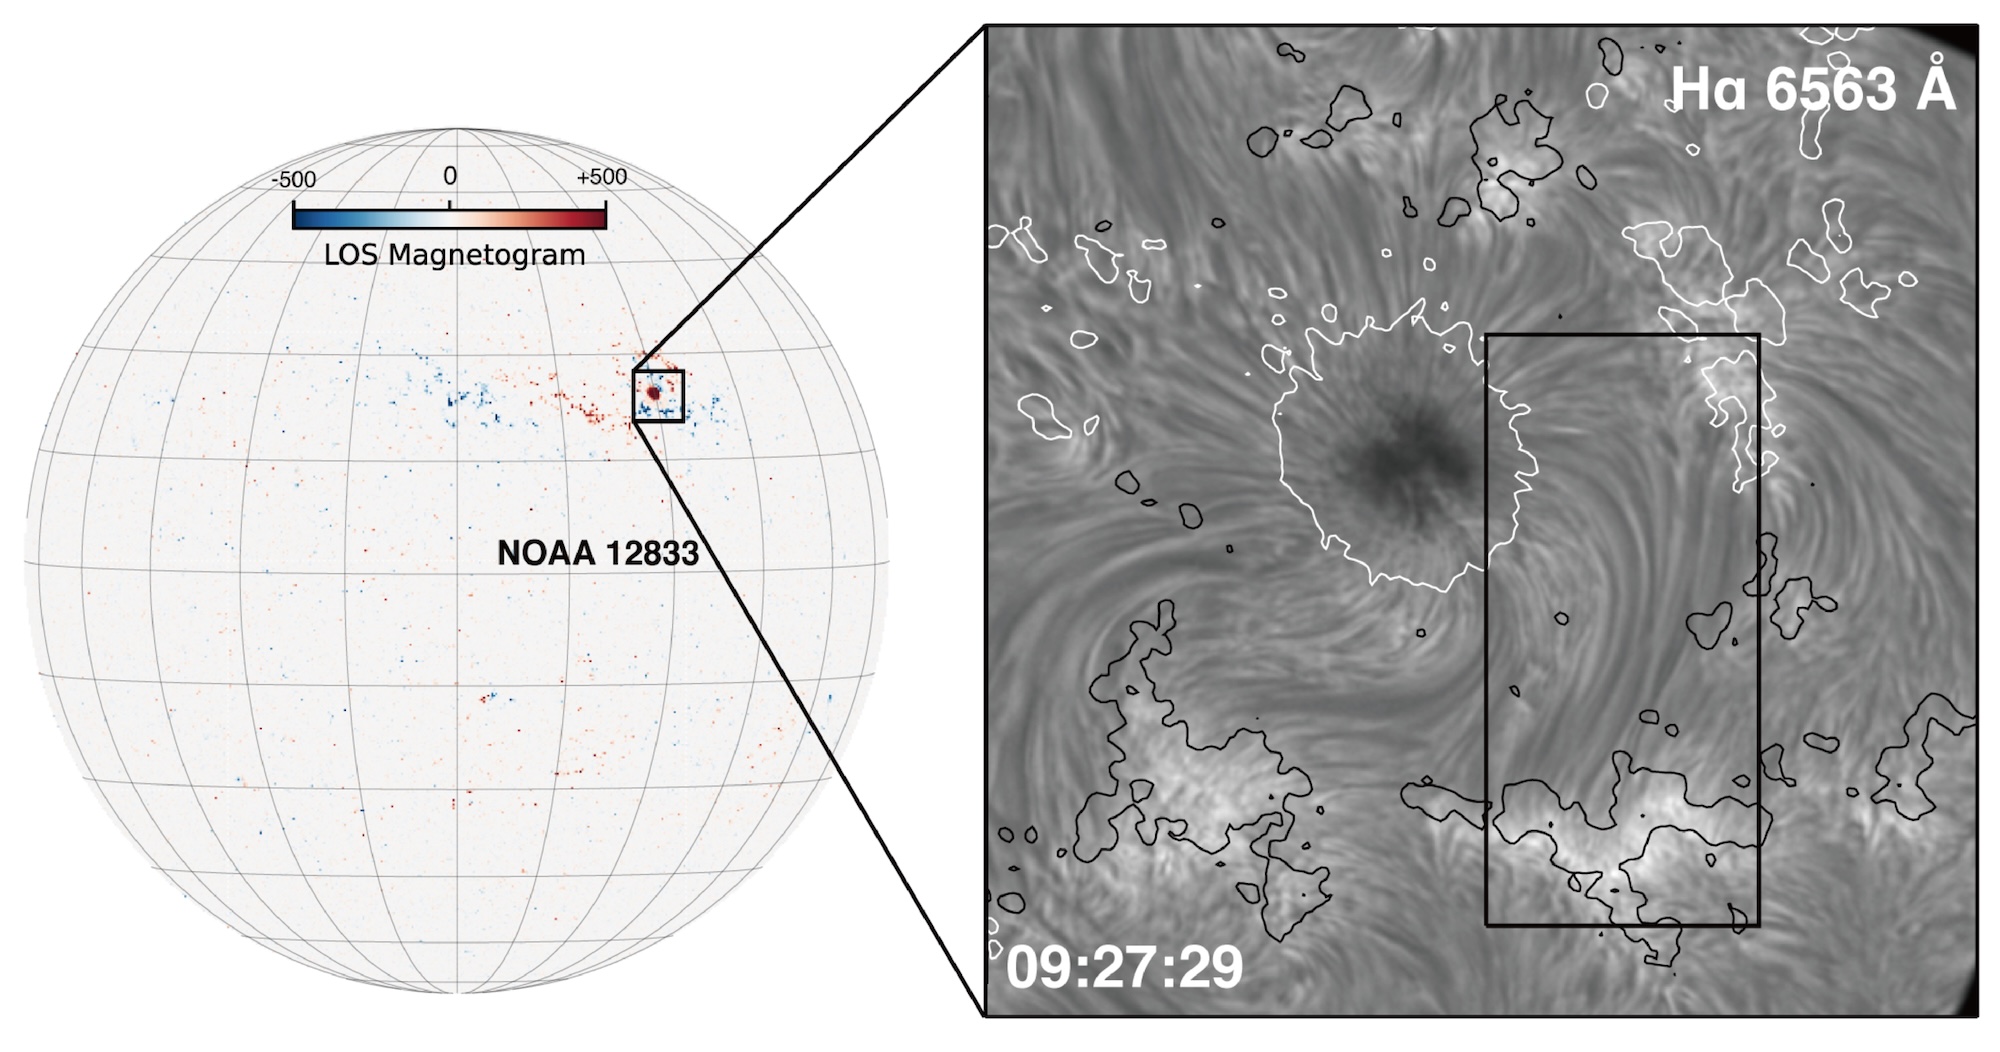
Location of the sunspot featured in this study, plus a closeup of the strands of plasma around the sunspot. Click to enlarge. [Adapted from Chen et al. 2025]
Driven by Reconnection
The plasma threads appear to lie nearly parallel to one another at the beginning of the observation. Images from all three facilities showed the plasma threads intertwining, providing evidence for the twisting of magnetic field lines predicted to happen when their footprints move around. (As further evidence for this footprint motion, the team also observed complicated flow patterns near one of the footprints.) This intertwining was followed by a sudden brightening where the threads were most tightly knotted, creating two bright “blobs” that traveled outward toward the footprints. Afterward, the threads resumed their nearly parallel state.
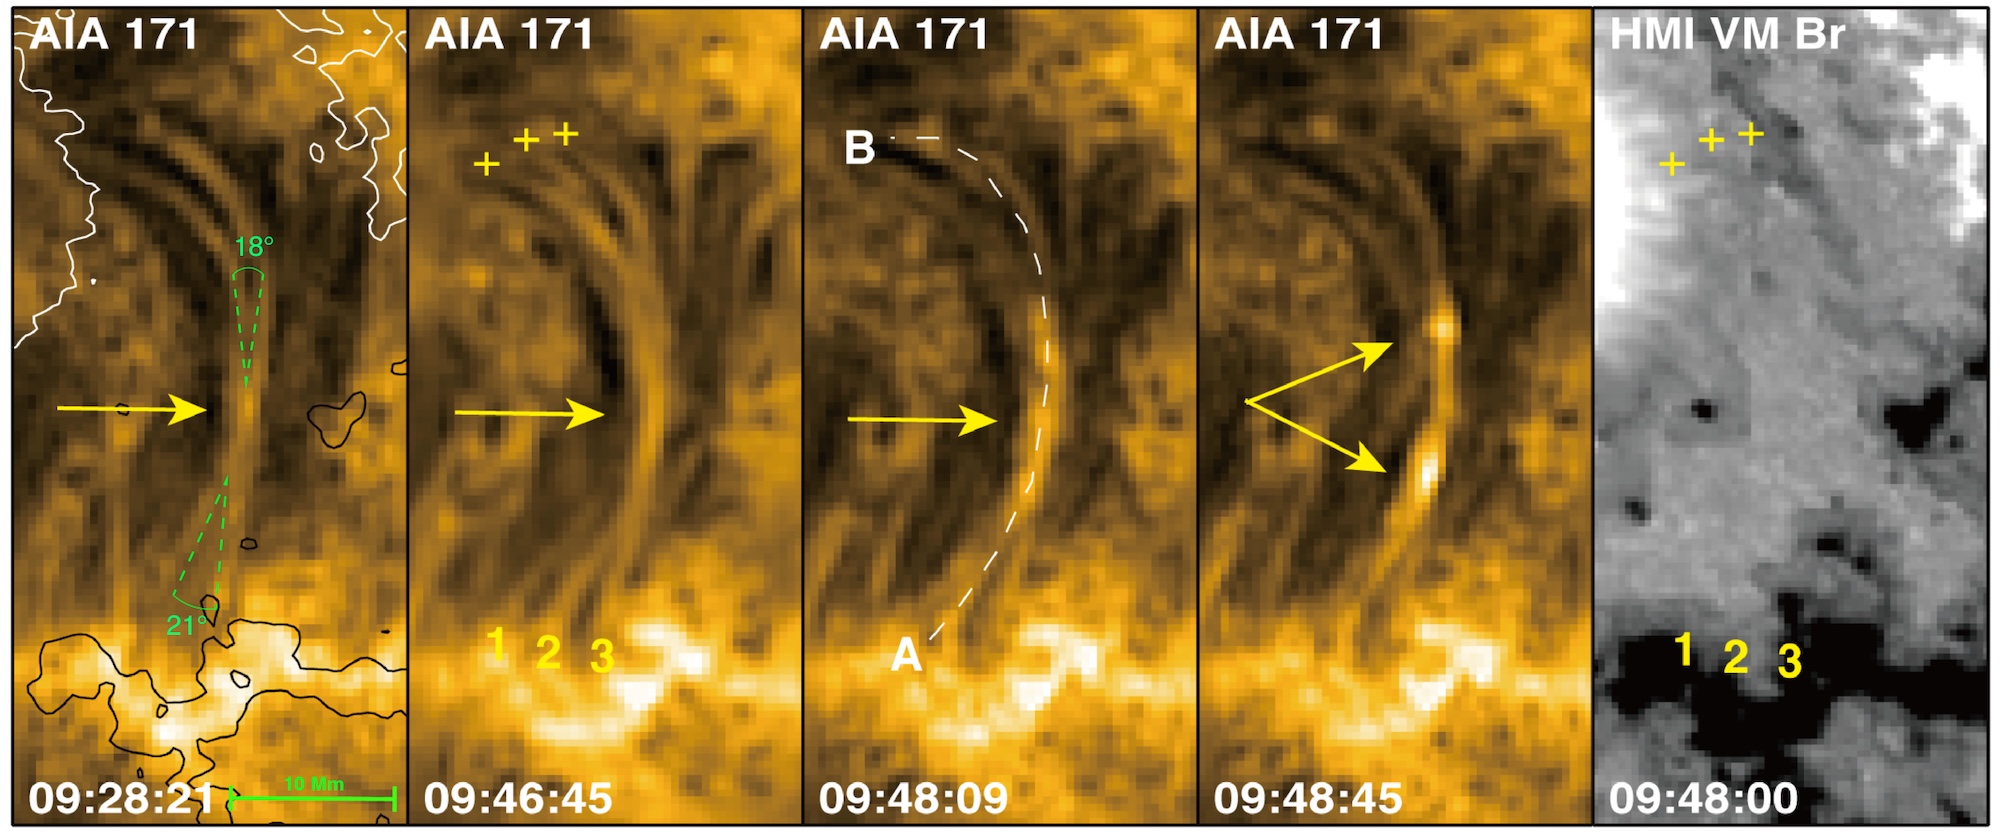
Images from Solar Dynamics Observatory. The first four images show the Sun at a wavelength of 17.1 nanometers, and the final image shows the radial magnetic field. The arrows indicate the location of the magnetic field braiding and the plasma “blobs.” Click to enlarge. [Adapted from Chen et al. 2025]
This work beautifully illustrates the process of magnetic reconnection on the Sun, showing how random motions can set the stage for the buildup of magnetic tension. The heating and acceleration of plasma that follows demonstrates how small-scale reconnection events like the ones shown here can provide the energy needed to heat the solar corona.
Citation
“Witnessing Magnetic Reconnection in Tangled Superpenumbral Fibrils Around a Sunspot,” Hechao Chen et al 2025 ApJ 995 94. doi:10.3847/1538-4357/ae12e9
The post Astronomers See Braided Magnetic Fields Above a Sunspot appeared first on AAS Nova.
]]>
Astrobites reports on a black hole that's far too massive for its host galaxy, and whether this system could ever reach "normal" proportions.
The post Forever Alone: A Black Hole Destined to Stay Too Big appeared first on AAS Nova.
]]>Editor’s Note: Astrobites is a graduate-student-run organization that digests astrophysical literature for undergraduate students. As part of the partnership between the AAS and astrobites, we occasionally repost astrobites content here at AAS Nova. We hope you enjoy this post from astrobites; the original can be viewed at astrobites.org.
Title: The z = 7.08 quasar ULAS J1120+0641 May Never Reach a “Normal” Black Hole to Stellar Mass Ratio
Authors: Meredith A. Stone et al.
First Author’s Institution: University of Arizona
Status: Published in ApJ
The first galaxies in the universe emerged out of an archaic age of darkness. Like luminous factories, they started rapidly churning out stars, spilling light into the cosmos. This process of star formation continues to the present day. In some galaxies, it occurred at astonishing rates, with the equivalent of thousands of times the mass of the Sun being assembled into stars in a single year. At other times, it came to a slow crawl, with all fresh reserves of star-building gas seemingly exhausted. Yet when the gears of star formation ground to a halt, certain events were able to send them spinning again.
One of the most spectacular of these is a merger, a train-wreck collision between two galaxies. Images of these events are often breathtaking, showing arms of light twisting together and vast stellar streams being violently cast away. Mergers directly increase the stellar mass (the mass of all stars) of galaxies by combining two into one. The intense gravitational interactions between the galaxies involved can also disrupt stagnant pools of gas, igniting a new burst of star formation. Thus, interactions between galaxies can be a significant driver of their growth.
Sometimes, a reservoir of matter is driven toward the center of a galaxy due to a “secular” process (one that occurs without external intervention) or from a merger. At the galactic nucleus, the infalling streams of matter encounter a supermassive black hole. The matter falls into a swirling accretion disk, heating to extreme temperatures and furiously glowing. If the black hole is massive enough and the gas falls in quickly enough, the accretion disk can outshine all of the stars in the galaxy, and we call such a source a quasar. The intense radiation produced by a quasar can impact the entire rest of the galaxy, either suppressing the formation of new stars or sometimes igniting it.
Thus, a galaxy has an important role in the growth of its central supermassive black hole, and vice versa. This connection manifests in complicated ways. Most strikingly, it is thought to be the cause of the correlation between a galaxy’s stellar mass and its central black hole mass. In the nearby universe, galaxies have stellar masses around a thousand times greater than their black hole masses. JWST, our most powerful tool for investigating early galaxies, has given us unprecedented insight into whether this holds up in the distant universe. Though the jury is still out, many researchers are convinced that the answer is a resounding no. We’ve found distant black holes that appear to be nearly equal in mass to their host galaxies, something that’s unfathomable in the local universe.
However, this raises a key question. Black holes and their galaxies grow together, and they started on nearly equal footing. So why do all of the galaxies in the nearby universe appear so much more massive than their black holes? Today’s article underscores this puzzle, pushing it to the breaking point. The authors examine a well-studied quasar, ULAS J1120+0641 (hereafter J1120), which we see as it appeared just 750 million years after the Big Bang. This source has a supermassive black hole containing an astounding 20% the mass of its host galaxy. The shocking part is that, even after carefully accounting for all of the ways this galaxy could grow in the future, there appears to be no way for J1120 ever to reach “normal” proportions.
Through the Looking Glass, ULAS J1120
First, the authors analyze the key observations of J1120 obtained to date. In addition to observations from JWST, this source has been targeted by some of the most powerful astronomical facilities, including the Hubble Space Telescope (optical and near-ultraviolet), the Chandra and XMM-Newton observatories (X-rays), the Atacama Large Millimeter/submillimeter Array (radio/millimeter), and numerous other ground-based telescopes. This incredible dataset provides a detailed picture of J1120 across the electromagnetic spectrum, spanning X-rays to radio emission.
The authors compare various measurements of the black hole’s mass and find that multiple methods yield a similar result of about a billion and a half times the mass of the Sun. Turning to the host galaxy, they estimate the mass of the visible stars, which is more complicated than it sounds — you can’t exactly count them, since the enormous distance between us and J1120 causes it to appear as just a fuzzy blob. They combine this mass with the mass of newly forming stars that are buried in dust and obscured from our view. The mass of a nearby galaxy that’s actively merging with J1120 is added to this sum. Finally, the authors compute how many stars could form in the future from all of the gas left in the galaxy, and they throw this into the total.
Even with all of these components, the host galaxy would only be 10 times more massive than the black hole at the center. This ratio is a far cry from the factor of a thousand we expect for normal galaxies in the local universe!
A Train Wreck of Train Wrecks
Well, if one merging galaxy won’t do it, what if J1120 merges with literally every single other nearby galaxy? The authors use new JWST data to count all sources near the quasar (Figure 1) and measure their stellar masses. Going further, they estimate how many galaxies their technique may have missed and add all of these to the pile. Not done yet, they finally conclude by making a rough approximation of how much loose gas is in these nearby galaxies, and compute how much extra mass could exist in stars born from this fresh material. Assuming that J1120 survives the full-frontal assault, being battered by mergers from each of its neighbors in turn, its total stellar mass would grow by quite a large factor.
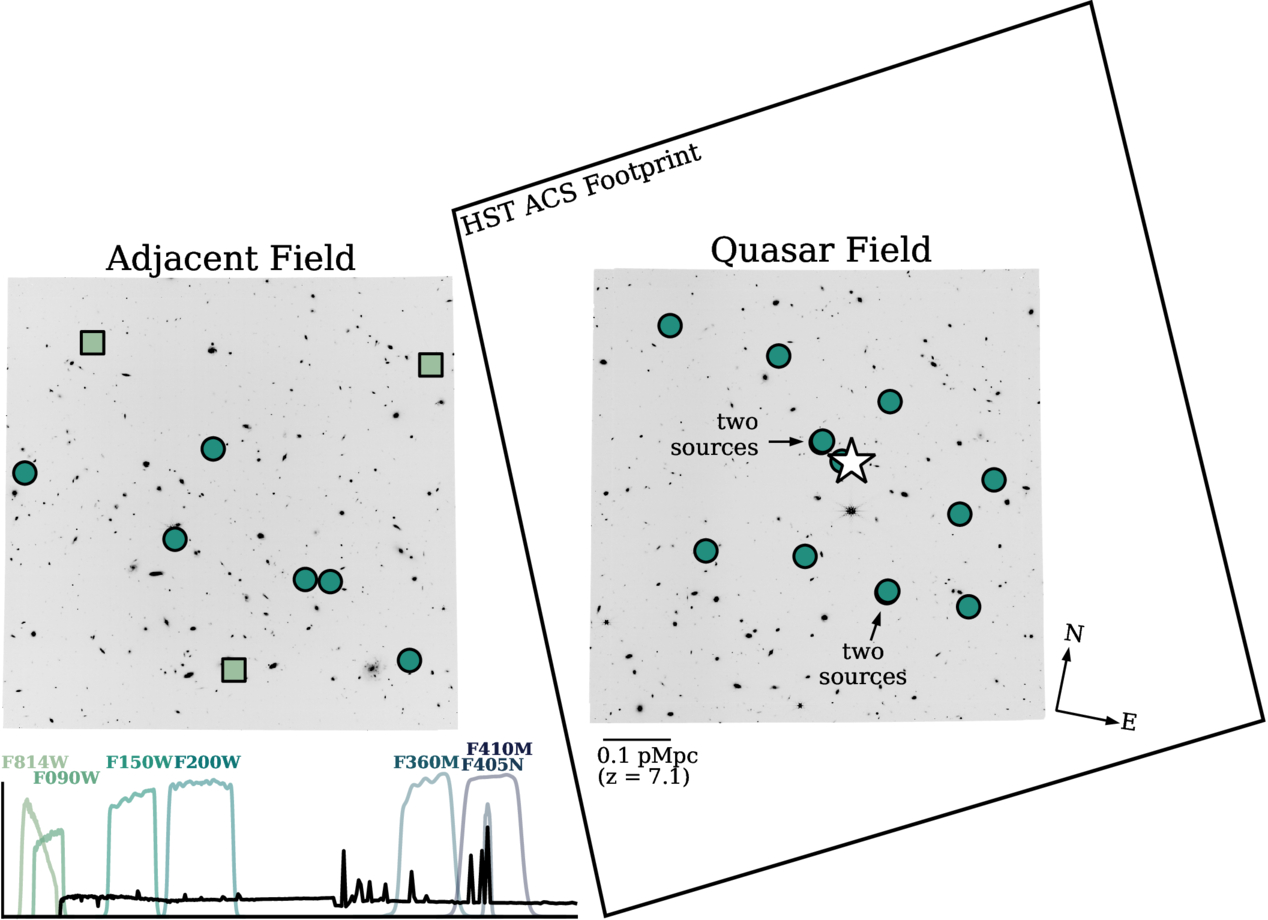
Figure 1: All of the galaxies found by JWST that are close enough to J1120 to potentially merge with it in the future. The circles mark confident detections, whereas the squares represent galaxies for which the exact distances couldn’t be measured confidently. What would happen if all of these galaxies crashed into J1120? [Stone et al. 2025]
A fascinating final possibility is that galaxies like this one do exist in the nearby universe. With their black hole switched off, all we would be able to see is a relatively small package of stars. Place such an object far enough away, and we might miss it entirely! Whether galaxies like J1120 achieved normal proportions through unknown mechanisms or are lurking in the far fringes of the local universe, studies like this one shine light on the amazing connection between black holes and their host galaxies. In the future, they will be one key piece in the puzzle of the endlessly complicated past of our own galaxy and the universe at large.
Original astrobite edited by Will Golay.
About the author, Ansh Gupta:
I’m an astronomy graduate student at the University of Texas at Austin working with Steven Finkelstein. I use data from JWST to study the formation and growth of the first galaxies and black holes in the universe. In my spare time, I enjoy playing piano, reading, and making YouTube videos.
The post Forever Alone: A Black Hole Destined to Stay Too Big appeared first on AAS Nova.
]]>
Using a neural network, researchers have discovered 3,500 candidate strong gravitational lenses in data from the Dark Energy Spectroscopic Instrument.
The post Featured Image: A Treasure Trove of Strong Lenses appeared first on AAS Nova.
]]>The seemingly warped and stretched galaxies in the image above show the work of gravitational lensing, in which the powerful gravitational pull of galaxies or galaxy clusters bends the light from background objects. Xiaosheng Huang (University of San Francisco and Lawrence Berkeley National Laboratory) and coauthors have used a neural network to amass a sample of 3,500 gravitational lensing candidates in data from the Dark Energy Spectroscopic Instrument (DESI) Legacy Surveys. Now, the team has used the Hubble Space Telescope to confirm some of the most promising candidates. Four of the newly confirmed systems are presented in the image above, with the DESI data shown in color and the higher-resolution Hubble data in black and white. Huang and collaborators also demonstrated the ability of their forward-modeling pipeline, GIGA-Lens, to constrain lens properties rapidly, even for large images like those from Hubble. Ultimately, Huang and coauthors hope to identify lensing systems that can be used to search for low-mass dark matter halos and test our theories of cosmology, as well as those that can be monitored for signs of lensed supernovae — providing a way to measure the expansion rate of the universe. To learn more about this sample of gravitational lenses and what the team plans to do next, be sure to check out the full research article linked below.
Citation
“DESI Strong Lens Foundry. I. HST Observations and Modeling with GIGA-Lens,” Xiaosheng Huang et al 2026 ApJ 998 69. doi:10.3847/1538-4357/ae22d2
The post Featured Image: A Treasure Trove of Strong Lenses appeared first on AAS Nova.
]]>
After the DART spacecraft smashed into Dimorphos, a cloud of ejecta expanded outward. A recent study builds a 3D reconstruction of the ejecta and determines that it's more complex than previous models considered.
The post Pulling Back the Curtain on DART Ejecta appeared first on AAS Nova.
]]>In September 2022, the Double Asteroid Redirection Test (DART) mission served as the first attempt at redirecting a near-Earth asteroid — an experiment testing humanity’s ability to fend off any threatening Earth-bound asteroids. A recent study presents the first 3D reconstruction of the impact ejecta, suggesting that the blown-out material is more complex than previous models considered.
DART-ing into Dimorphos
The DART spacecraft intentionally smashed into Dimorphos, the small and unassuming moon of the larger asteroid Didymos. This space-based crash test aimed to determine if kinetic impactors like DART could successfully change an asteroid’s course through the solar system. Dimorphos’s orbit was indeed shortened by roughly 30 minutes, confirming that ramming an asteroid with a spacecraft could be a viable method of planetary defense. However, determining exactly how much an asteroid’s path will be altered is not necessarily straightforward. When a spacecraft collides with an asteroid, the impactor imparts momentum to the target, and any material excavated from the impact site can also alter the asteroid’s course.
DART’s impact launched a significant spray of rubble, or what researchers call an ejecta curtain. The ejecta curtain is typically modeled as a cone, using a simple geometry to determine its contribution to momentum transfer. However, when looking closely at imaging taken soon after the collision, the real physical structure of the ejecta appears to be more complex. Untangling the true 3D distribution of the ejecta is necessary to understand how momentum was actually distributed among escaping ejecta, better estimate the total mass ejected from Dimorphos, and improve modeling of the Didymos system’s orbit after impact.
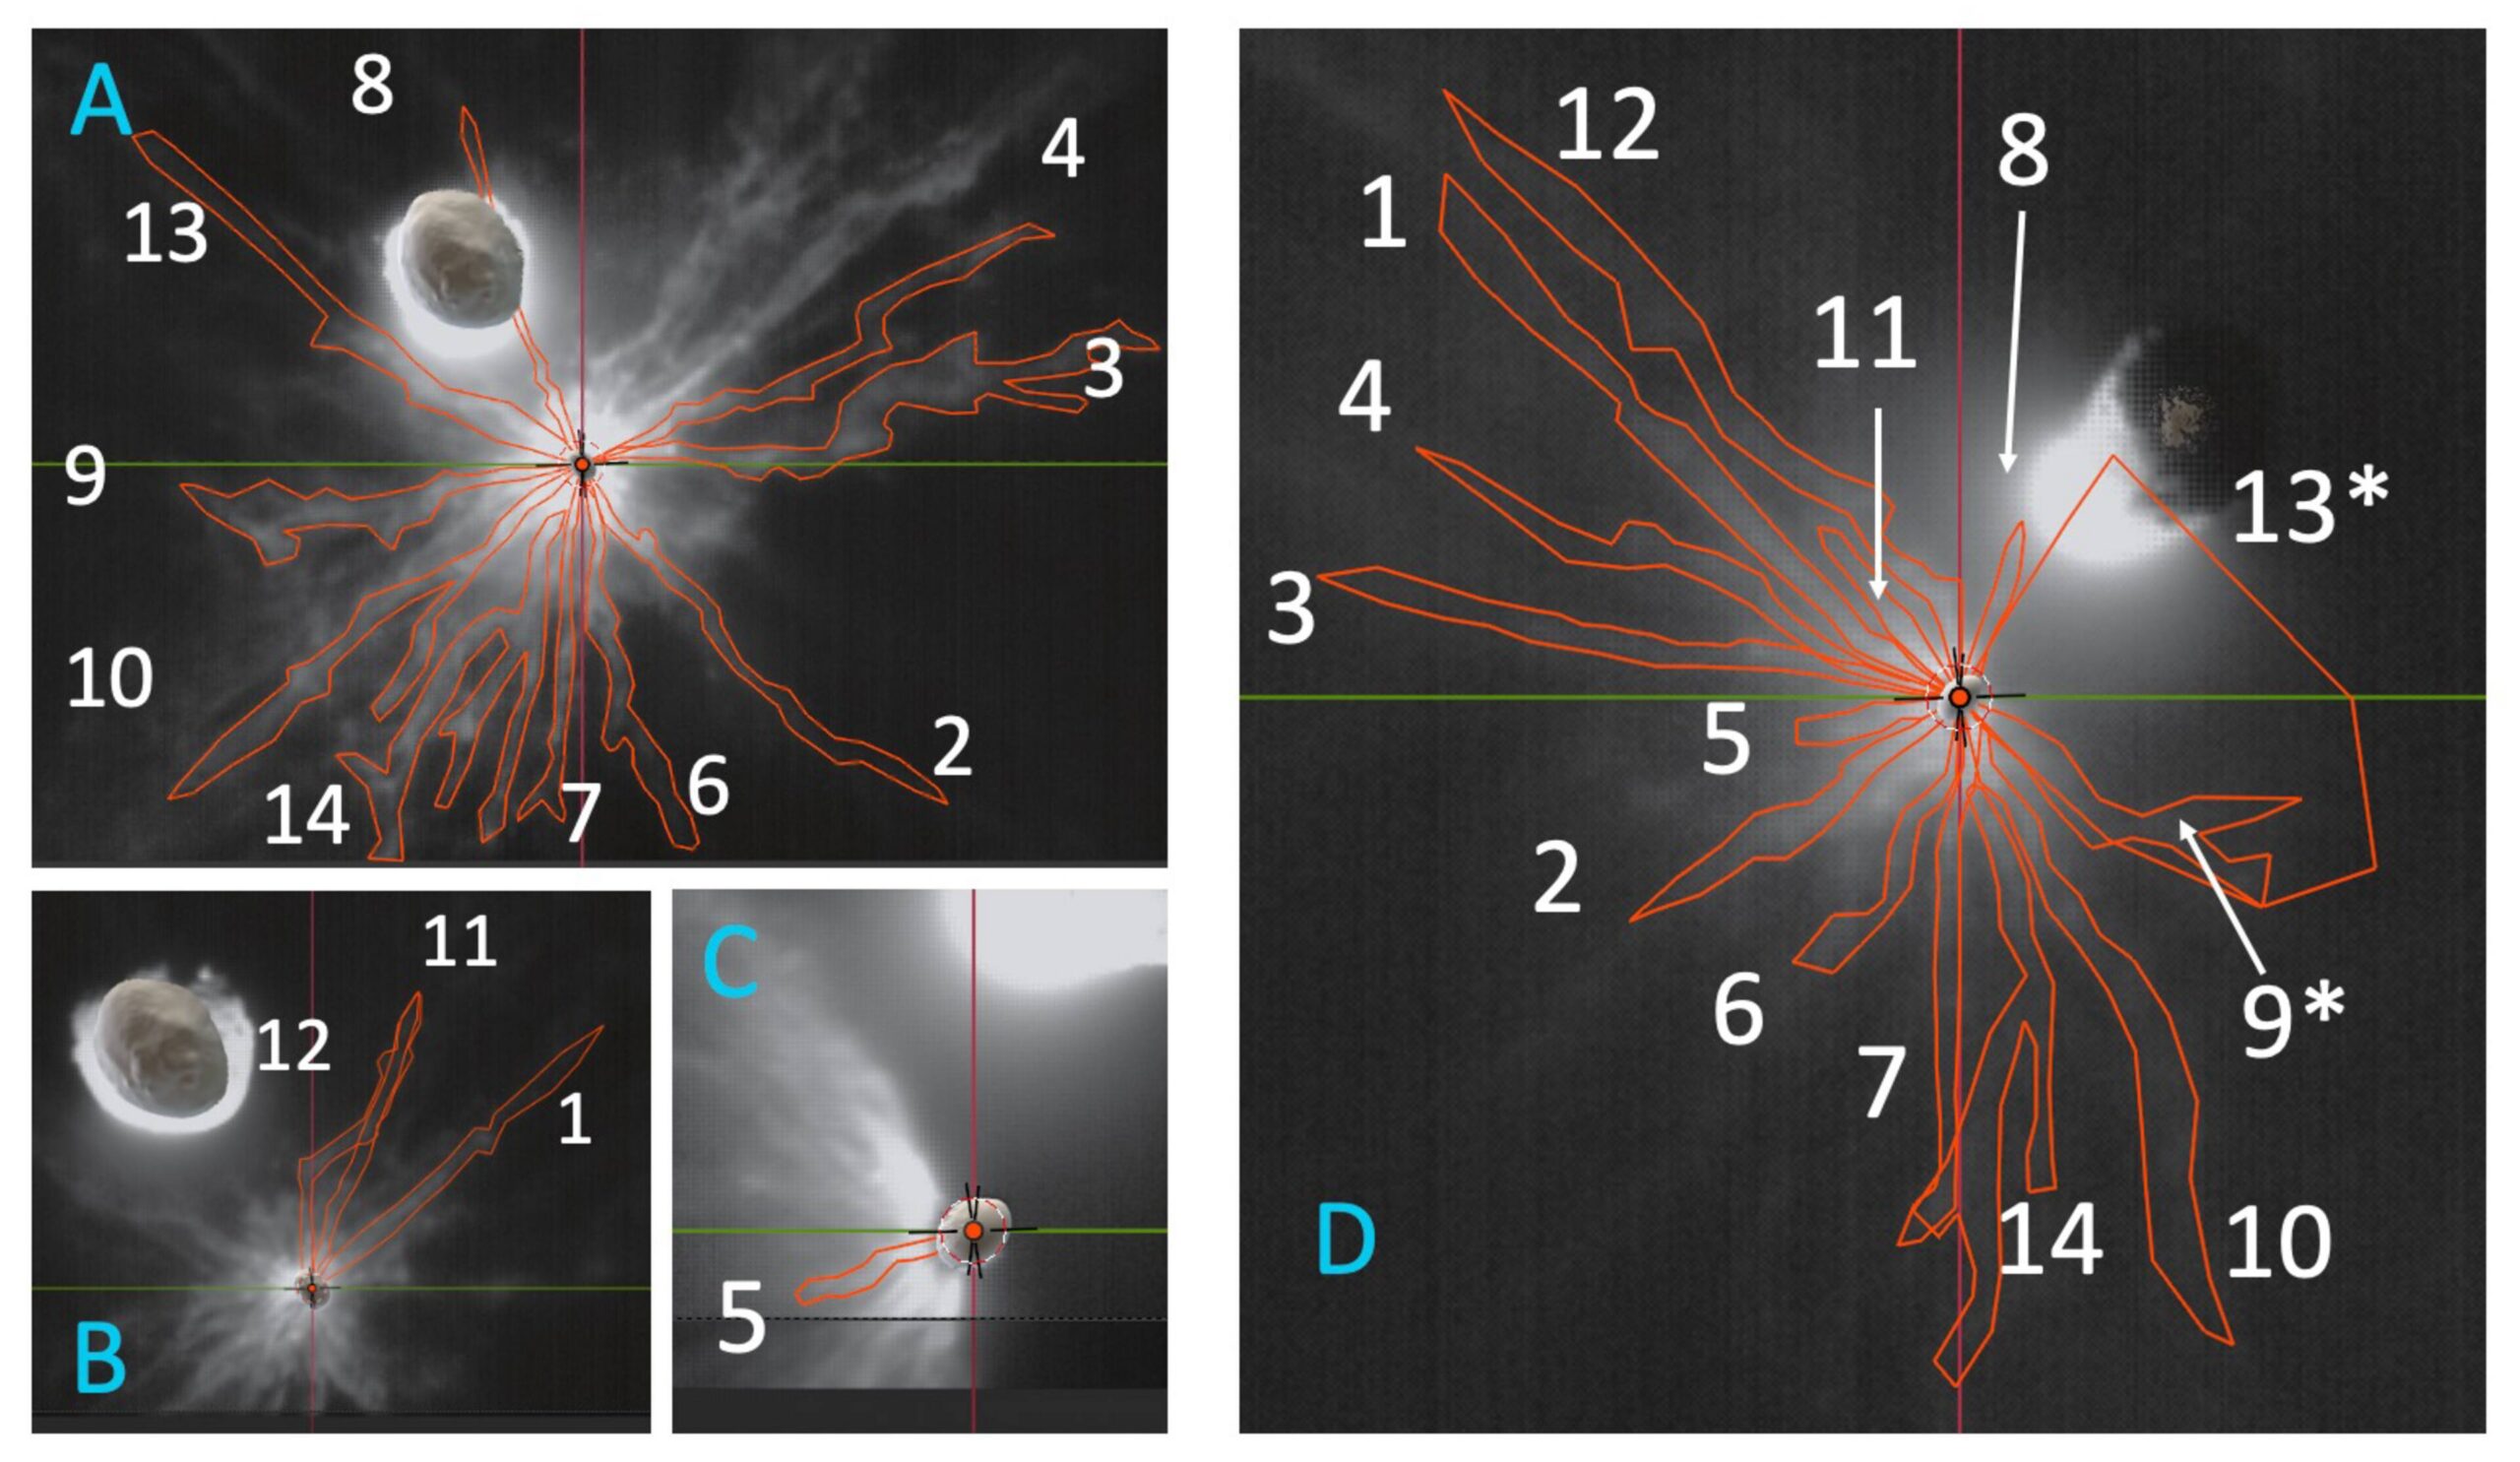
LICIACube images of the DART ejecta curtain with the 14 distinct features identified in this study outlined in red. Click to enlarge. [Deshapriya et al 2026]
Determining Debris Distribution
Seeking to better characterize the ejecta curtain, a team led by J. D. P. Deshapriya from Italy’s National Institute for Astrophysics used data from the Light Italian CubeSat for Imaging of Asteroids (LICIACube) that flew behind the DART spacecraft to capture images of the system shortly after the impact. After careful image handling to bring out diffuse and faint material, the researchers identified 14 distinct ejecta features across the flyby imaging. LICIACube viewed the aftermath both side on and face on, providing valuable 3D information about the distribution and motion of the ejecta.
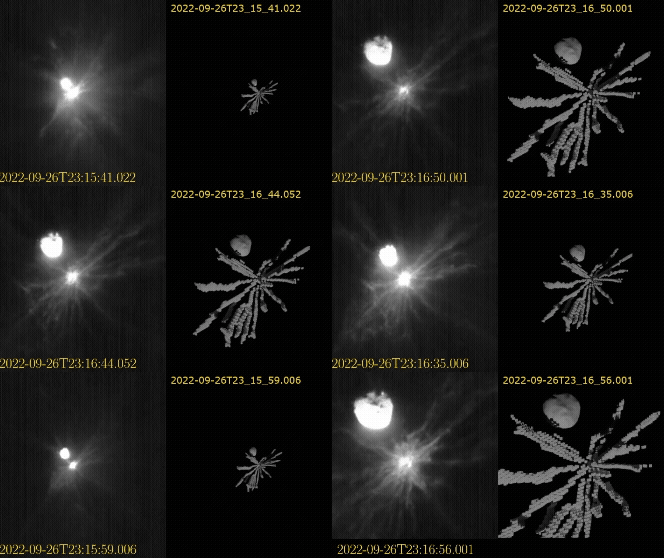
Animation of the DART ejecta as the LICIACube spacecraft approached the impact. The left shows the images taken by the spacecraft, and the right shows the 3D model produced for the ejecta. Click to play animation. [Deshapriya et al 2026]
Planetary Defense
What does this mean for planetary defense? While simplified symmetric cone models provide helpful approximations for kinetic impactor missions, they do not fully capture the true complexity of the impact. This study shows that local variations in an asteroid’s surface and interior properties can directly influence the resulting ejecta distribution and motion. The true momentum imparted to the target asteroid depends heavily on the specific ejecta material, and these details inform how effective planetary defense missions can be in redirecting asteroids. Incorporating realistic, observation-driven ejecta distributions into modeling frameworks is essential to achieve reliable predictions for future planetary defense missions.
Citation
“3D Reconstruction of DART Ejecta at Dimorphos Reveals an Anisotropic, Filamentary Structure,” J. D. P Deshapriya et al 2026 Planet. Sci. J. 7 4. doi:10.3847/PSJ/ae2c64
The post Pulling Back the Curtain on DART Ejecta appeared first on AAS Nova.
]]>
Did the disappearance of a star in the Andromeda Galaxy signal the creation of a black hole? New infrared and X-ray data help to discern what remained after the star disappeared.
The post Black Hole Baby Photos: JWST and Chandra Observe M31-2014-DS1 appeared first on AAS Nova.
]]>One of the most luminous supergiant stars in the Andromeda Galaxy, M31-2014-DS1, has disappeared, potentially leaving behind a black hole shrouded in dusty gas. What do new infrared and X-ray observations tell us about this event?
Failure to Explode?
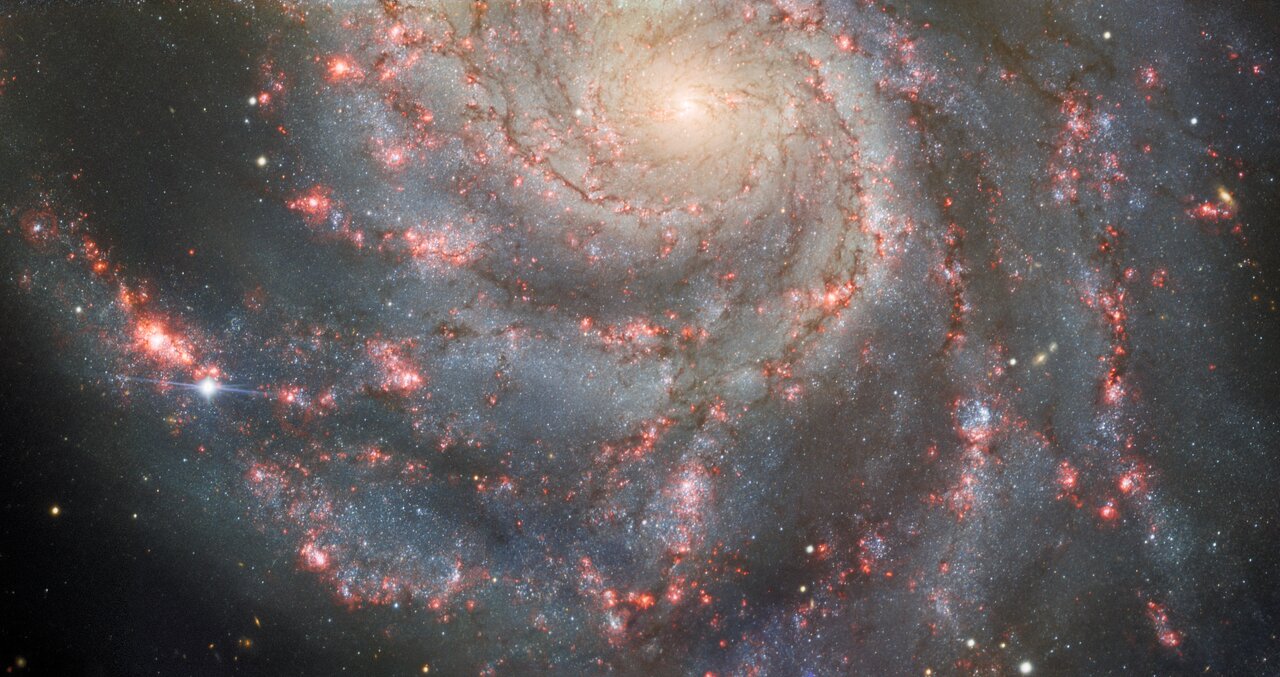
This image from Gemini North shows the supernova SN 2023ixf along one of the spiral arms of Messier 101. Though less showy than core-collapse supernovae, “failed” supernovae may be another way to form stellar-mass black holes. [International Gemini Observatory/NOIRLab/NSF/AURA; CC BY 4.0]
But a splashy supernova explosion may not be the only way for a massive star to go out. As observations have begun to suggest, some massive stars may — for reasons not yet fully understood — quietly collapse in upon themselves, going out with a whimper rather than a bang. Though less spectacular and far harder to spot, these “failed” supernovae highlight a possible pathway for the formation of stellar-mass black holes.
A Newborn Black Hole in a Dense, Dusty Blanket
Just last month, researchers reported their discovery of a potential failed supernova. The supergiant M31-2014-DS1 suddenly brightened in 2014 before fading to obscurity, leading researchers to suspect that the star had experienced a failed supernova and created a black hole. The event shared similarities with another failed supernova candidate, NGC6946-BH1.
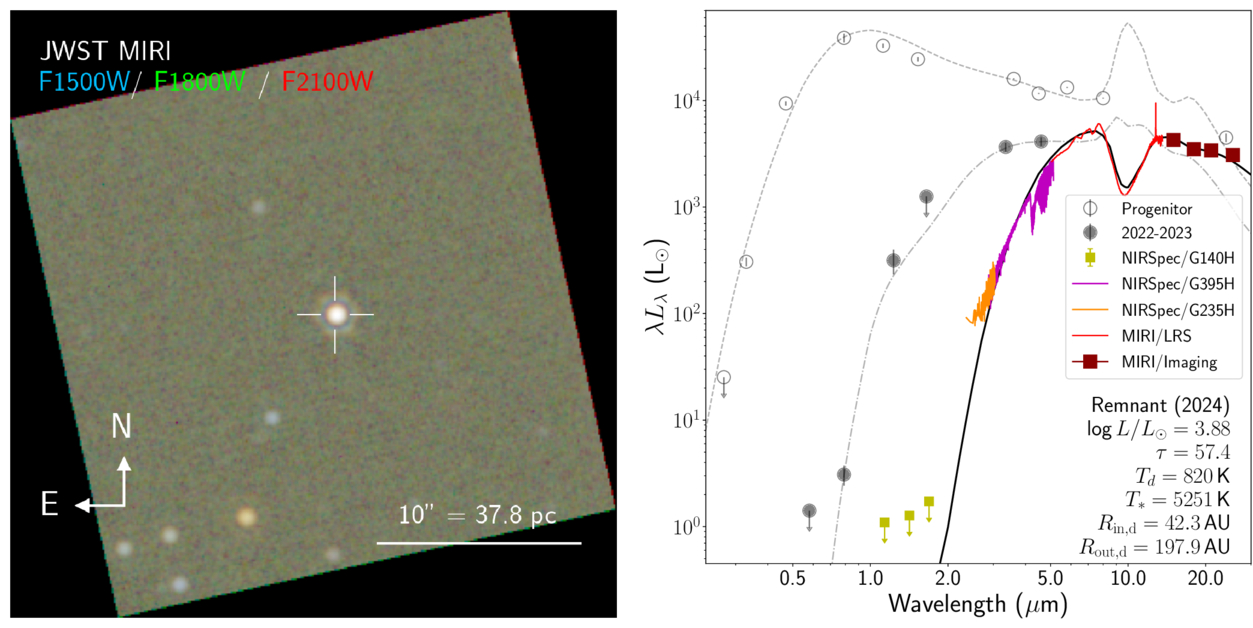
Left: A JWST image of M31-2014-DS 1. Right: Spectral energy distributions of the progenitor star/the remnant using data from 2005 to 2012 (empty circles), 2022 to 2023 (filled circles), and 2024 (colored lines). Click to enlarge. [De et al. 2026]
Together, these observations support a model in which the collapsing star ejected its outer layers in a relatively low-energy event (somewhere in the broad ballpark of one hundred-millionth to one ten-thousandth the energy of a typical core-collapse supernova) and formed a black hole. Some of the ejected material fell backward and fed the newborn black hole, while the remainder created a dense blanket that blocked the light from the accreting black hole from view.
Continued Evolution
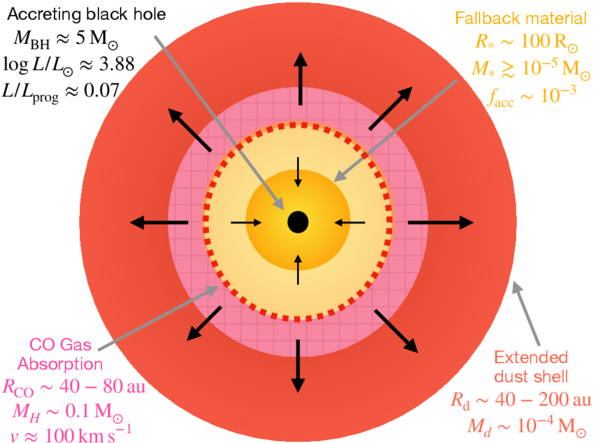
Cartoon showing the authors’ model and the model parameters inferred from the observations. Click to enlarge. [De et al. 2026]
Thanks to its location in a neighboring galaxy, M31-2014-DS1 has granted astronomers a front-row seat to a poorly understood pathway for black hole formation. Going forward, we can expect further insights into M31-2014-DS1 and, hopefully, the discovery of many more sources like it.
Citation
“Fading into Darkness: A Weak Mass Ejection and Low-Efficiency Fallback Accompanying Black Hole Formation in M31-2014-DS1,” Kishalay De et al 2026 ApJL 999 L25. doi:10.3847/2041-8213/ae468d
The post Black Hole Baby Photos: JWST and Chandra Observe M31-2014-DS1 appeared first on AAS Nova.
]]>
Astrobites reports on how astronomers are using JWST to figure out if star clusters are really as old as they seem.
The post Astronomers Hate Them! This Star Formation Ingredient Makes Clusters Look 300 Million Years Older appeared first on AAS Nova.
]]>Editor’s Note: Astrobites is a graduate-student-run organization that digests astrophysical literature for undergraduate students. As part of the partnership between the AAS and astrobites, we occasionally repost astrobites content here at AAS Nova. We hope you enjoy this post from astrobites; the original can be viewed at astrobites.org.
Title: Characterizing The Star Cluster Populations in Stephan’s Quintet Using HST and JWST Observations
Authors: P. Aromal et al.
First Author’s Institution: University of Western Ontario
Status: Published in ApJ
On 12 July 2022, the first images taken with JWST were released to the public. All of the astronomers in my department gathered together to watch the images be revealed in real time. It was exciting for everyone, from graduate students getting to see a glimpse into the future possibilities of their fields, to retired professors getting to see the fruits of their decades-long labor in advocating for the telescope to be built.
One image that was showcased was of Stephan’s Quintet (Figure 1), an actively interacting galaxy group. We were all immediately impressed by the clarity of the star-forming regions in the dense gas between the galaxies in the image. Now, more than three years later, the authors of today’s article lay out a comprehensive study of the star clusters in those same regions, taking advantage of JWST’s multi-wavelength imaging capabilities.
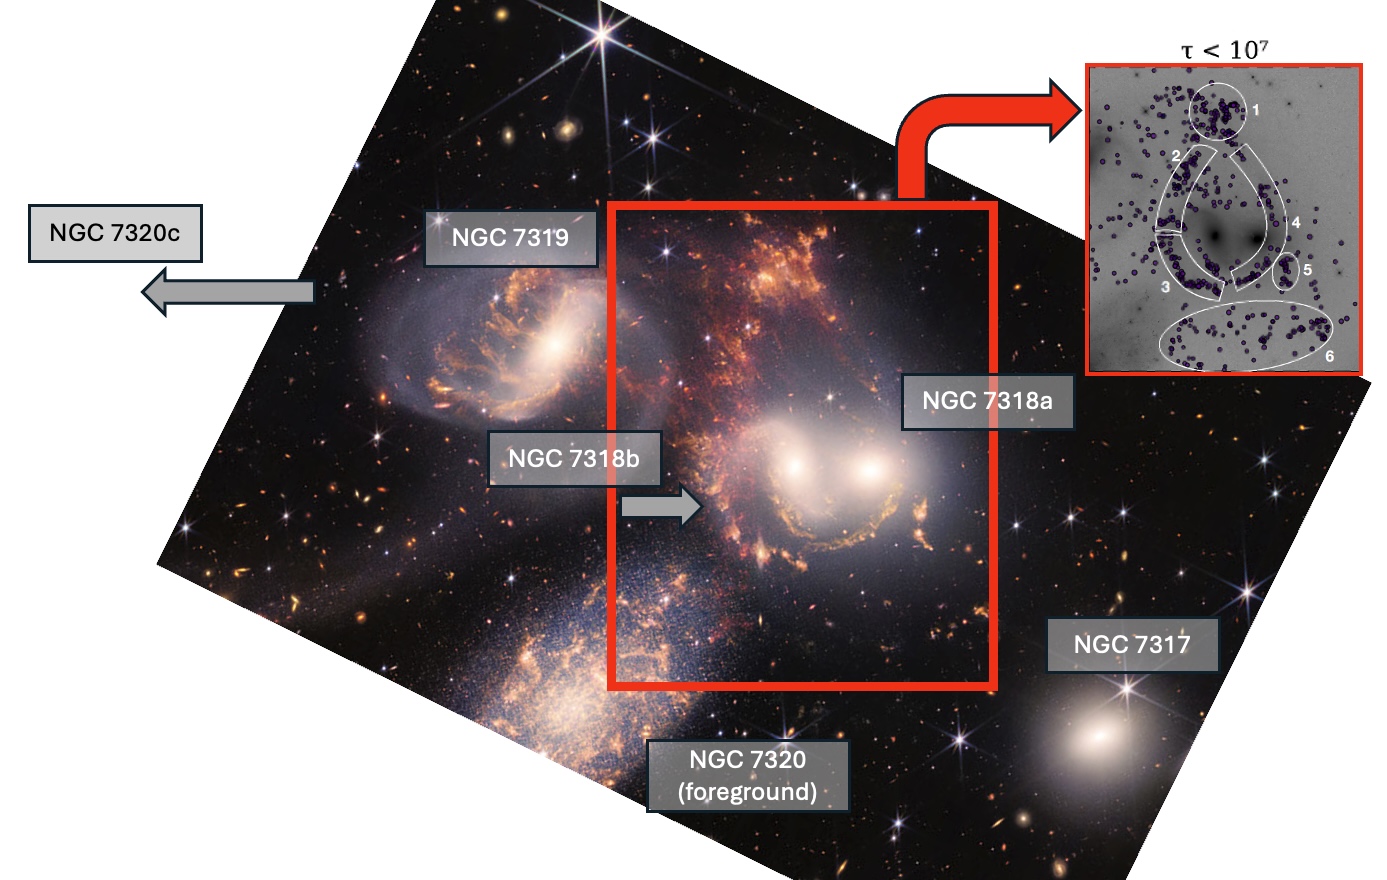
Figure 1: The JWST imaging of Stephan’s Quintet with member galaxies labeled (including NGC 7320C, which is outside of the field of view). Gray arrows indicate the direction the associated galaxy is moving. The inlaid image shows the distribution of young star clusters in relation to the six main tidal features in the group. [Inset image: Adapted from Aromal et al. 2025; Background image: NASA, ESA, CSA, STScI]
HST + JWST = OMG!
While JWST’s depth and resolution are exciting for those studying high-redshift galaxies, for local-universe astronomers JWST really shines when used in combination with the Hubble Space Telescope (HST). The star clusters in Stephan’s Quintet were already cataloged in 2015 using HST, but the filters used in the imaging only captured optical and very-near-infrared wavelengths. If you want to get enough data to be able to accurately estimate the ages of these star clusters, especially accounting for reddening caused by surrounding dust, you need to push your imaging further into the infrared.
Unlike HST, JWST can take images in two wavelength filters at once, meaning you can get more data with roughly the same observing time. Here the authors imaged the same star clusters that HST looked at with five new JWST filters, all at longer infrared wavelengths than HST. Together, the authors had flux measurements at 10 different wavelengths across the optical and infrared spectrum for each star cluster, meaning they could perform spectral energy distribution fitting.
Go Ahead, Guess My Age
The best way to estimate an unresolved star cluster’s age is to get its full spectrum of light and fit spectroscopic models with varying ages to it until the model matches the observations. But, if you have individual brightness measurements at many different, spread-out wavelengths, you can still fit spectral models to the measurements and make a best guess despite the gaps in your full spectrum. Here the authors compare their multi-wavelength data to Code Investigating GALaxy Emission (CIGALE) spectral energy distribution models, allowing both the cluster ages and amount of dust extinction to vary.
This is where the long-wavelength JWST imaging is most necessary, because it is sometimes difficult to determine a cluster’s age with this method. For instance, is the light a cluster is giving off mostly red because its stars are very old, or is it because its stars are actually bluer and younger and the cluster just appears red due to foreground dust?
Infrared imaging can “see through” any dust and break this age–extinction degeneracy. For most of the clusters, the authors found that the original HST-only age estimates were accurate, but for 121 clusters in the sample (about 8% of the total), the JWST imaging made a significant change in the age estimates, shifting them to younger ages.
Where Do the Hip, Young Star Clusters Hang Out?
Once the authors had their updated ages for the clusters, they then mapped out where the clusters were located in Stephan’s Quintet and how these clusters traced the known tidal structures in the group. Tidal structures are structures, usually consisting of gas, dust, and stars, that are formed from the tidal forces galaxies exert on one another as they interact and merge. The authors found that throughout all tidal regions of Stephan’s Quintet, there were many young, low-mass star clusters, all about 3–5 million years old. This timescale lines up with previous studies’ estimates of when NGC 7318B was thought to first fall into Stephan’s Quintet, compressing the gas in the group and creating tidal shocks that would trigger star formation.
Additionally, the authors’ star cluster age distribution for the group (see Figure 2) has a second, broader peak of higher-mass clusters with ages around 200 million years. This would correspond to when the most recent encounter between NGC 7320C (which has now passed through the group and is out of frame in Figure 1) and NGC 7319 is estimated to have occurred.
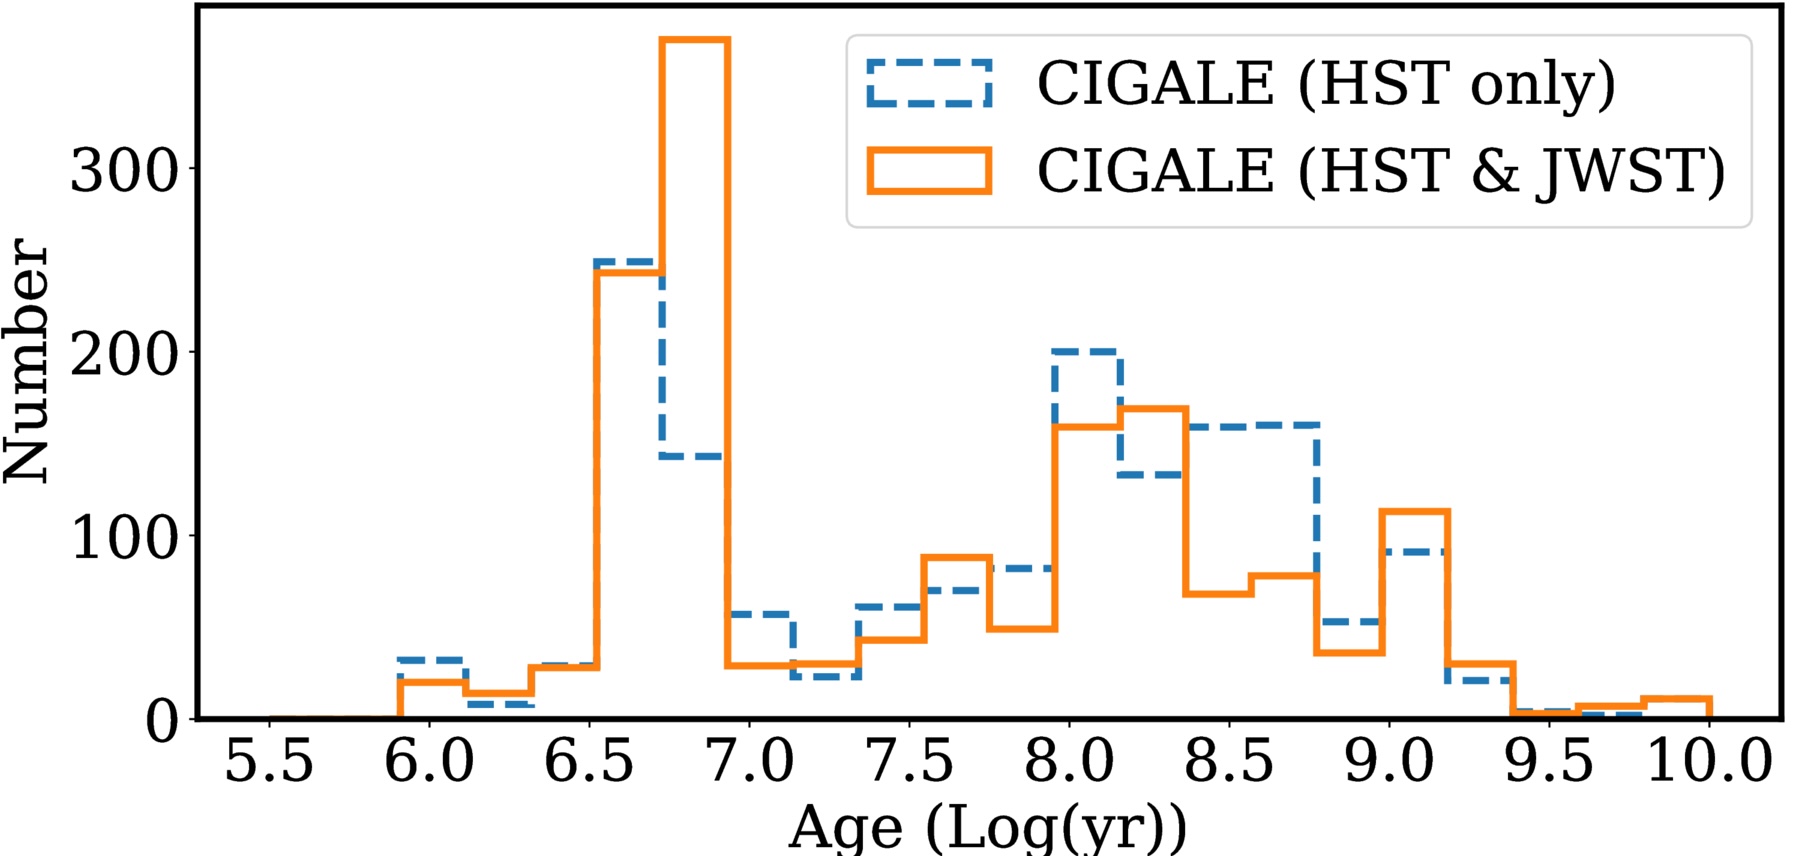
Figure 2: A histogram of the ages of all the star clusters in Stephan’s Quintet. The blue dashed line shows the estimates using only the HST data, and the orange solid line shows the estimates using both HST and JWST together. Notice how a lot of the clusters around 108 years old turned out to be less than 107 years old. [Adapted from Aromal et al. 2025]
Taken together, the updated age measurements of the star clusters in Stephan’s Quintet provide not only a study of star formation history, but also of the galaxy–galaxy interaction history in the system!
Looking Ahead
While the authors have improved the age estimates of the clusters in Stephan’s Quintet, there are still limitations to their analysis. Their estimated star formation rate for the group is much lower than that estimated with other tracers, such as H-alpha emission, meaning this study may still be missing a fraction of very young star clusters. The most likely culprits are embedded clusters that haven’t had enough time to expel the surrounding gas from the massive clouds they formed within.
Future work will attempt to identify these embedded clusters using near-infrared JWST imaging, since in this study the authors focused only on the previously HST-identified clusters. In addition, combining their JWST data with high-resolution radio observations taken with the Atacama Large Millimeter/submillimeter Array will allow them to study the gas in the group more closely and understand how it influences the star formation.
This work highlights JWST’s excellent application to star cluster observations, building on the data we already have from decades of HST use, and it looks like we’re only just getting started!
Original astrobite edited by Skylar Grayson.
About the author, Veronika Dornan:
Veronika is a postdoctoral research associate at the University of Edinburgh. Her research is in observations of globular star clusters and how they can be used to study the evolution of their host galaxies.
The post Astronomers Hate Them! This Star Formation Ingredient Makes Clusters Look 300 Million Years Older appeared first on AAS Nova.
]]>
Researchers investigate whether the Milky Way's smallest known satellite is a tiny dwarf galaxy or a star cluster.
The post Ursa Major III/UNIONS 1: Dwarf Galaxy or Star Cluster? appeared first on AAS Nova.
]]>The smallest satellite of the Milky Way, Ursa Major III/UNIONS 1, has posed a mystery since its discovery. Is this smattering of stars a dwarf galaxy or a star cluster?
The Milky Way’s Mysterious Companion
In 2024, researchers discovered a small group of stars orbiting the Milky Way at a distance of about 33,000 light-years in data from the Ultraviolet Near Infrared Optical Northern Survey (UNIONS). This collection of stars amounts to just 16 solar masses and shines with only 11 times the Sun’s luminosity, making it 4–5 times less massive than the next faintest Milky Way satellite.
Considering its small stellar population and small size (its half-light radius is 10 light-years, which is typical for a globular cluster), this satellite appeared at first glance to be an ordinary star cluster. But early data also suggested that the stars had an unusually high velocity dispersion, which could mean that they are nestled within a dense and massive dark matter halo — making the satellite not a star cluster but a dwarf galaxy.
Reflecting this uncertainty, the satellite has two names: Ursa Major III (its dwarf galaxy designation) and UNIONS 1 (its star cluster classification). Can new data clear up the confusion?
New Dispersion Data
In a recent research article, William Cerny (Yale University) and collaborators described new observations of 16 stars in Ursa Major III/UNIONS 1 with the Keck II telescope.
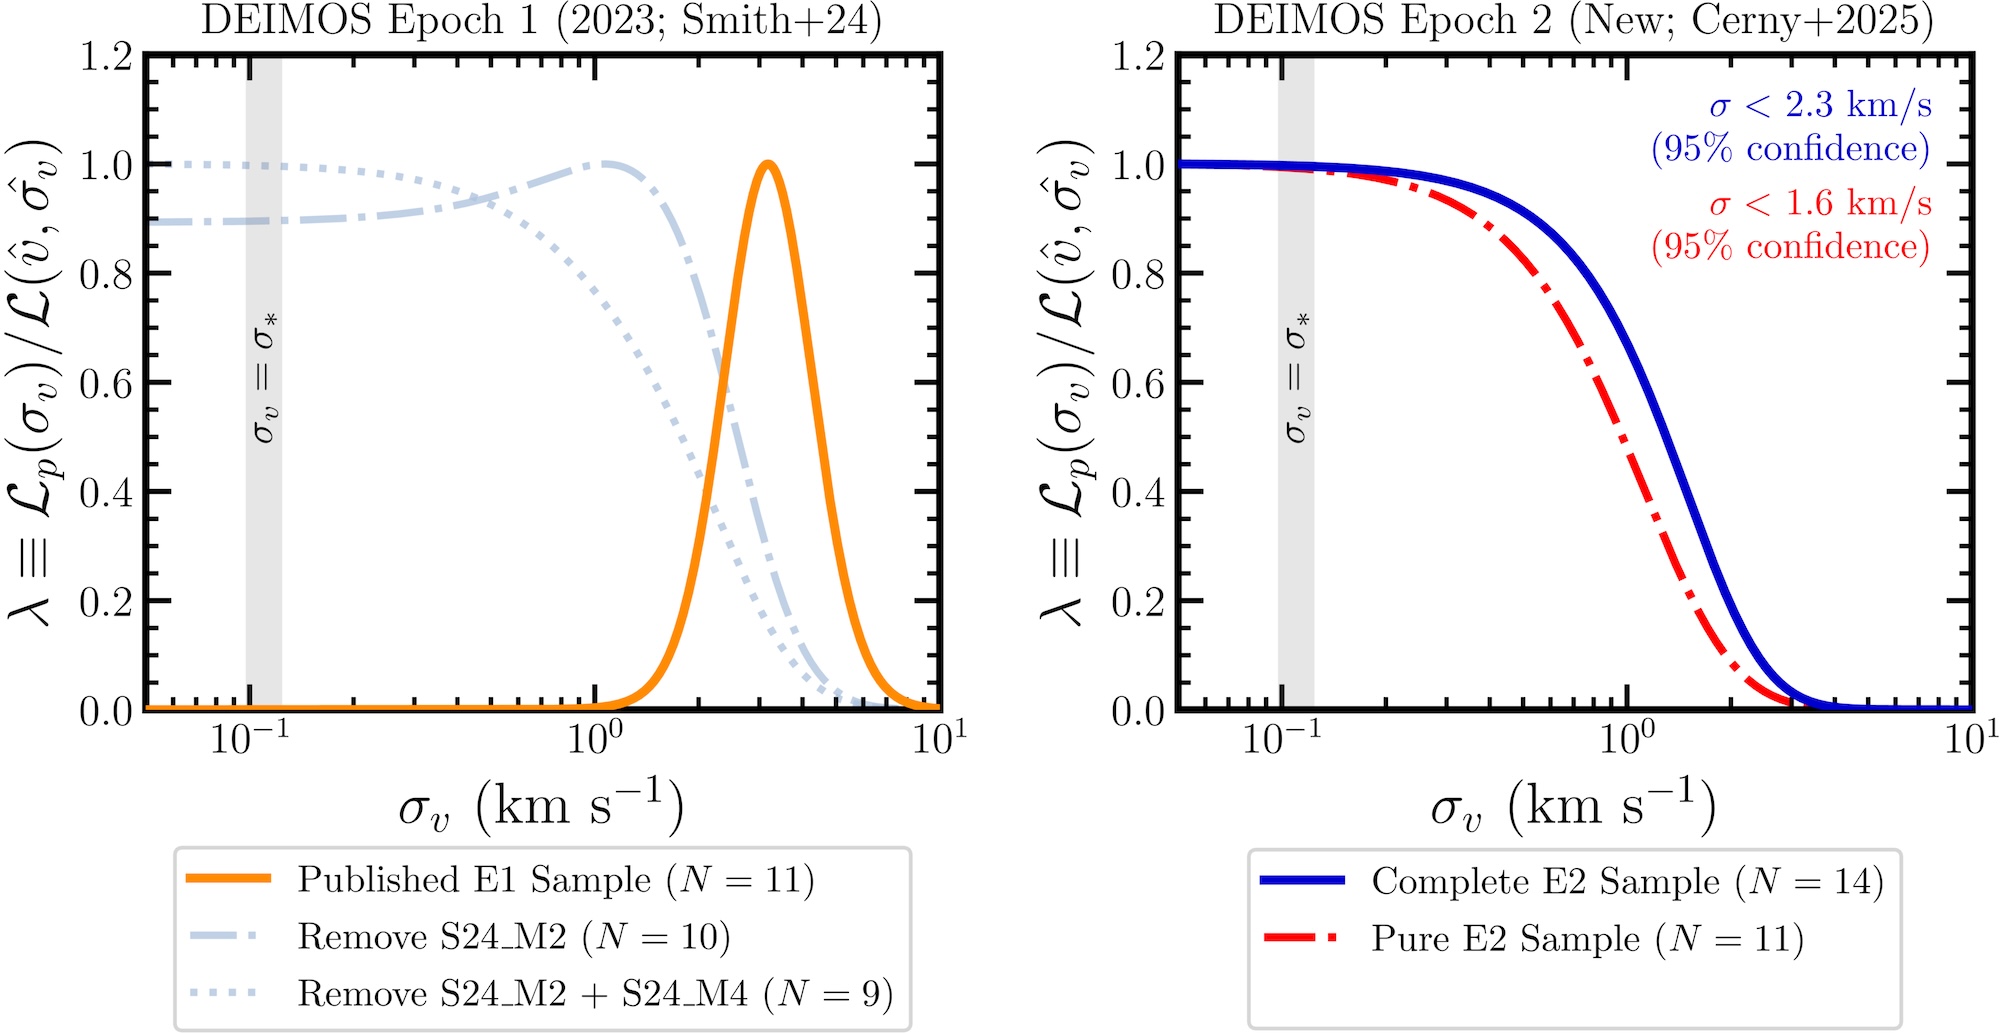
Normalized likelihoods for the velocity dispersion based on the initial data (left) and the new data (right). The initial velocity dispersion measurement of 3.7 km/s is ruled out by the new measurements. Click to enlarge. [Cerny et al. 2026]
These observations also helped to confirm one candidate binary pair and identify three new binary candidates. (This large binary fraction, though interesting, isn’t diagnostic, as both star clusters and dwarf galaxies are known to host high proportions of binary stars.)
Further Evidence
Cerny’s team conducted a further test of the Ursa Major III/UNIONS 1’s identity by measuring the metallicities of its 12 brightest stars. They found that the stars are metal poor and have little metallicity dispersion. This finding again points to a star cluster, in which stars form in a single epoch, rather than a dwarf galaxy, which may feature multiple generations of stars with different degrees of chemical enrichment.
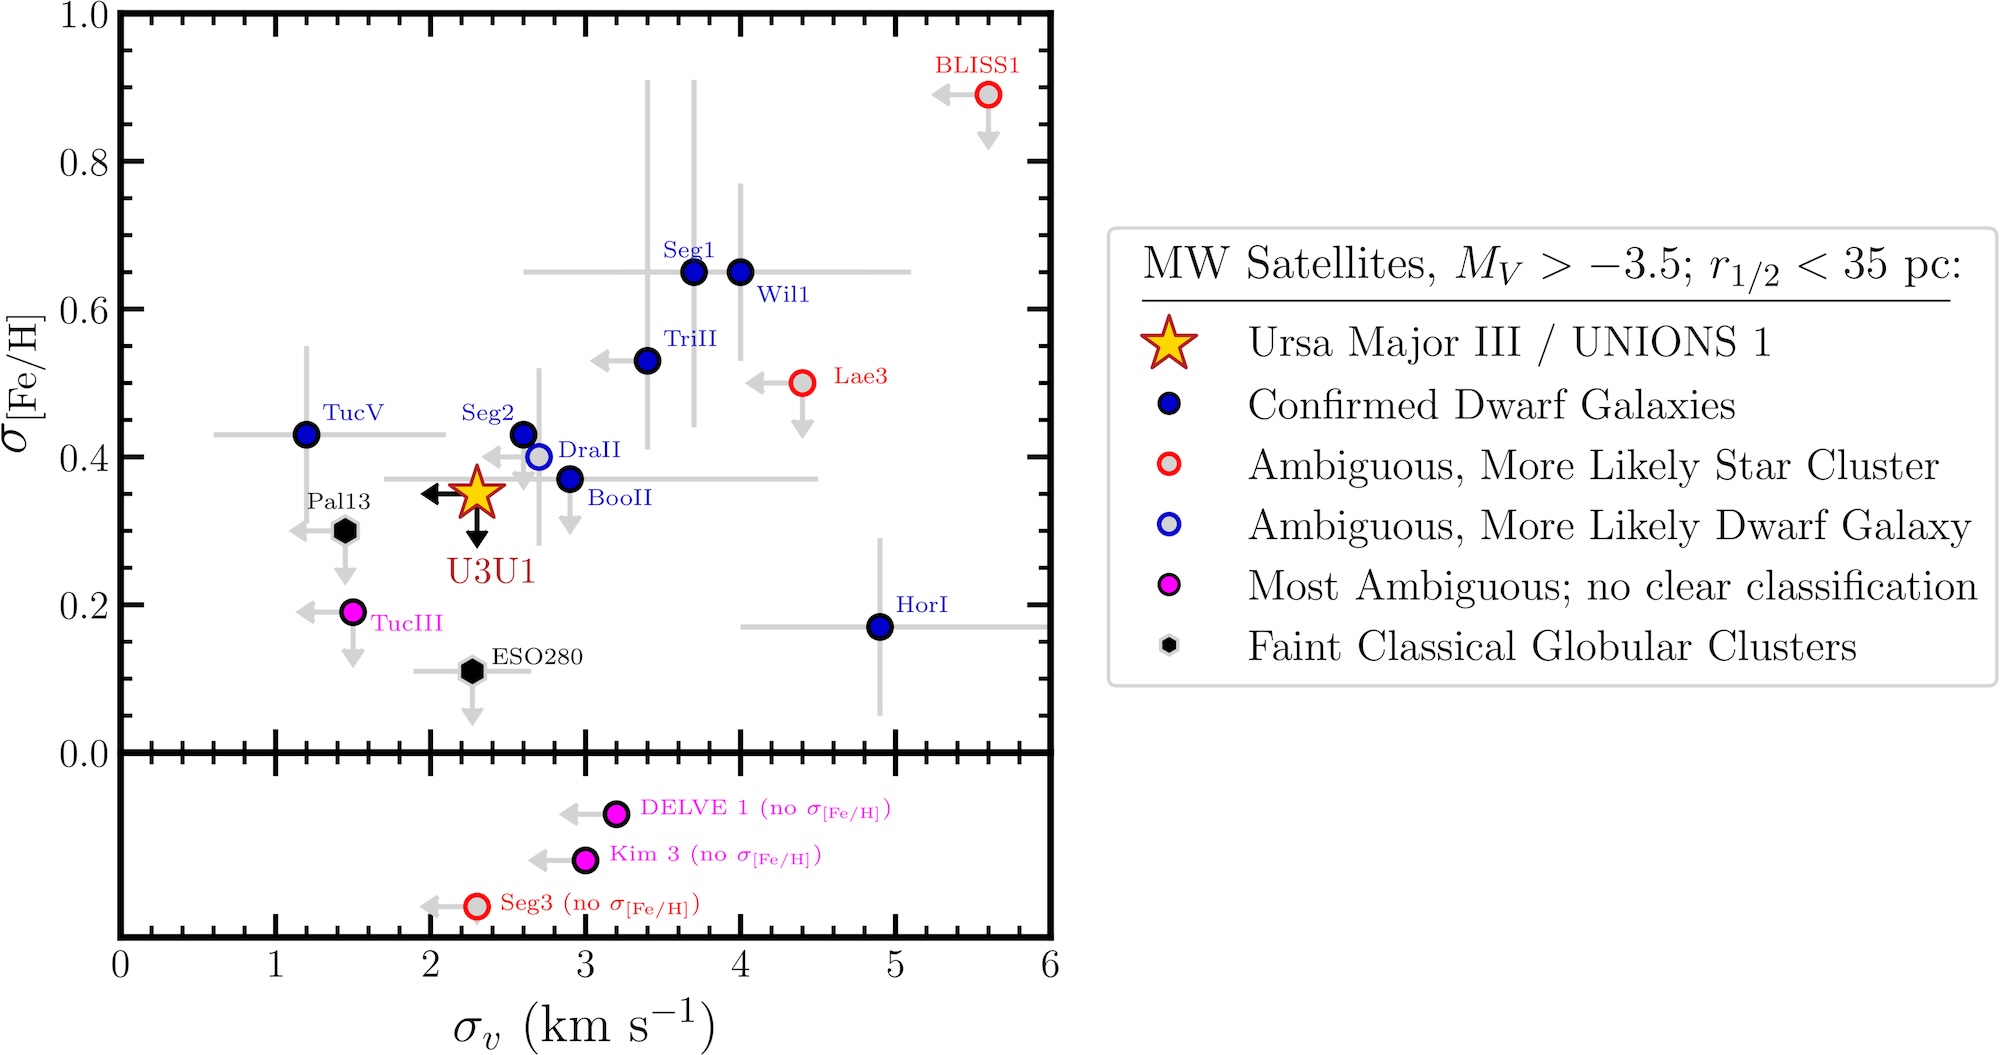
Upper limits on velocity dispersion and metallicity dispersion for Ursa Major III/UNIONS 1 compared to other faint Milky Way satellites. There are no confirmed dwarf galaxies for which the metallicity dispersion and velocity dispersion are both lower than for Ursa Major III/UNIONS 1. Click to enlarge. [Cerny et al. 2026]
Going forward, further chemical abundance measurements of Ursa Major III/UNIONS 1 may still sway the argument one way or another. And as facilities like the Vera C. Rubin Observatory and the Euclid space telescope continue to collect data, other extreme Milky Way satellites may come to light.
Citation
“No Observational Evidence for Dark Matter Nor a Large Metallicity Spread in the Extreme Milky Way Satellite Ursa Major III/UNIONS 1,” William Cerny et al 2026 ApJL 999 L8. doi:10.3847/2041-8213/ae29b8
The post Ursa Major III/UNIONS 1: Dwarf Galaxy or Star Cluster? appeared first on AAS Nova.
]]>
What's new with AT 2024wpp, GRB 250702B, and GW231123? Get updates on these three exceptional astrophysical transients in today's Monthly Roundup.
The post Monthly Roundup: Updates on Three Notable Transients appeared first on AAS Nova.
]]>Across the universe and across the electromagnetic spectrum, flares, bursts, and waves are making their mark on the sky. Today, we’re giving an update on three exceptional transients that have been discussed previously on AAS Nova: AT 2024wpp, GRB 250702B, and GW231123.
The Most Luminous Known Fast Blue Optical Transient, AT 2024wpp
Discovered in September 2024, AT 2024wpp burst onto the scene as the most luminous example of a fast blue optical transient (FBOT) — a growing class of events that are more luminous, more rapidly evolving, and bluer than supernovae. In October 2025, astronomers published their findings on AT 2024wpp’s X-ray and radio evolution. Just last month, a research team led by Natalie LeBaron (University of California, Berkeley) described the results of a complementary investigation of the transient’s ultraviolet, optical, and near-infrared behavior.
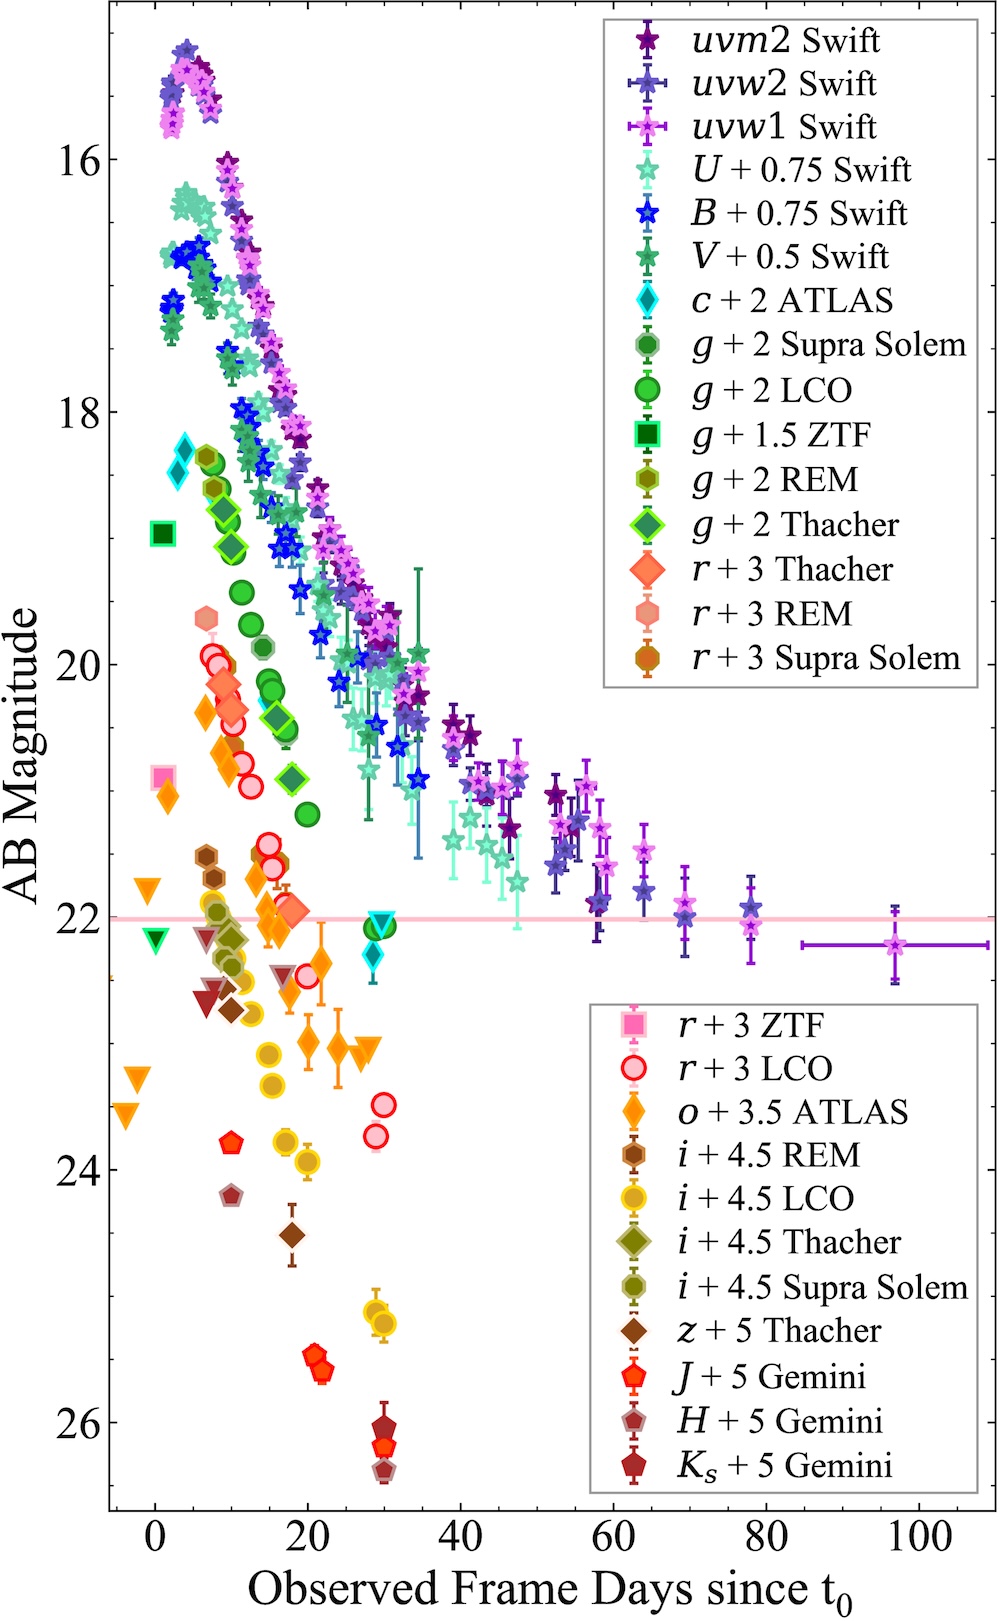
The ultraviolet through infrared light curve of AT 2024wpp. Results from different filters are offset vertically for clarity. [LeBaron et al. 2026]
The observations point to a luminous central energy source that continuously injects energy into its surroundings, powers multiple outflows, and ionizes the ejected material. These features can be explained by the rapid accretion of material by a neutron star or a black hole, in which the accreted material forms a disk and is ejected in both a fast-moving polar outflow and a slower-moving equatorial outflow.
Though the exact nature of the central object powering AT 2024wpp’s intense radiation isn’t known — the extreme luminosity of this event points to a stellar-mass black hole as the central object, but a neutron star cannot be ruled out — the overall picture of this event matches what has been found for previous FBOTs. Upcoming instruments and surveys will discover more FBOTs and spot them earlier in their evolution, transforming our understanding of these rare transients.
An Ultra-Long X-Ray and Gamma-Ray Transient, GRB 250702B
GRB 250702B is an exceptional gamma-ray burst: an intense flash of gamma rays lasting anywhere from a few milliseconds to several hours. GRB 250702B is unprecedented among events in this class because it features several bursts arising over the course of roughly 7 hours, plus X-ray precursor emission going back 24 hours before discovery. We’ve previously covered JWST follow-up observations of GRB 250702B, and today we’re taking a look at its high-energy evolution.

Swift (black circles) and Chandra (blue circles) observations of GRB 250702B. Click to enlarge. [Adapted from O’Connor et al. 2025]
O’Connor’s team found that GRB 250702B didn’t fit neatly into either category. While many of the event’s properties closely resembled those of ultra-long gamma-ray bursts, the hours-long gamma-ray emission and the precursor X-ray emission were outliers. Certain features are more easily reconciled with the tidal disruption of a main-sequence star by an intermediate-mass black hole, but others are similarly hard to account for. Finding the smoking gun for a tidal disruption event — an abrupt shutoff to the X-ray emission — will require long-term X-ray monitoring.
Because GRB 250702B has features that align with both ultra-long gamma-ray bursts and tidal disruption events, O’Connor and coauthors proposed scenarios that combine aspects of both possibilities: either a stellar-mass black hole tidally disrupting a star or the merger of a helium star with a stellar-mass black hole.
The Most Massive Gravitational Wave Source, GW231123
When compact objects like neutron stars and black holes merge, their collisions produce ripples in spacetime that are accessible to detectors on Earth. One of the most exciting events so far from the fourth gravitational wave transient catalog is GW231123, which appears to be caused by the merger of two black holes, each at least 100 times the mass of the Sun. The LIGO, Virgo, and KAGRA (LVK) collaborations reported a total mass of 238 solar masses for the event, which would make it the most massive binary black hole merger yet observed.
In a recent article, Ilya Mandel (Monash University and OzGrav) urged caution when interpreting seemingly extreme events like GW231123. Mandel’s argument is a statistical one, highlighting how certain aspects of the Bayesian techniques used to estimate GW231123’s mass could have skewed that estimate toward an artificially high value.
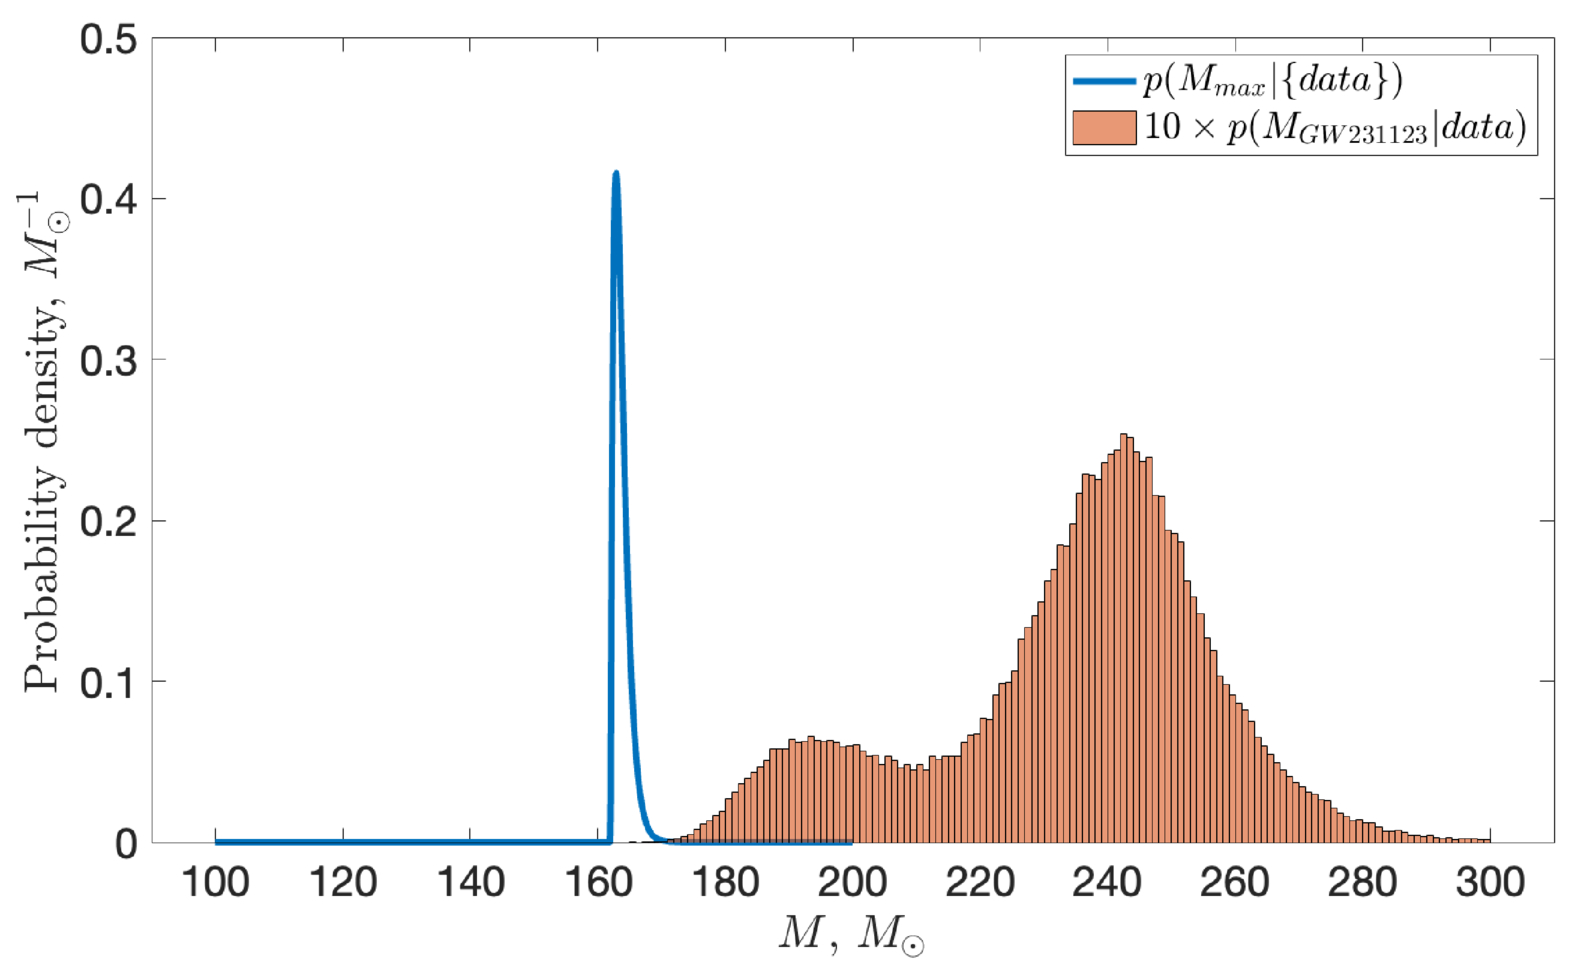
The posterior probability distribution on the maximum mass as derived from the total LVK catalog (blue), compared to the posterior for GW231123 (orange; multiplied by 10 for visibility). Click to enlarge. [Mandel 2026]
Mandel also demonstrated how considering the population of black hole mergers detected by LVK as a whole can provide a different perspective on GW231123’s likely mass. By analyzing this entire sample together, Mandel showed that the maximum mass for the population of merging black holes appears to be considerably lower than the mass estimated for GW231123, again raising the possibility that the true mass of the event is lower than the current estimate.
Ultimately, Mandel pointed out that at present it’s impossible to distinguish between three possibilities: that GW231123 is a true outlier among the population of merging black holes, representing a member of a new, unexplored population; that it’s a member of the same population as other black hole mergers seen by LVK but inhabits an extreme high-mass tail; or its high mass estimate is a statistical artifact.
Citation
“The Most Luminous Known Fast Blue Optical Transient AT 2024wpp: Unprecedented Evolution and Properties in the Ultraviolet to the Near-Infrared,” Natalie LeBaron et al 2026 ApJL 997 L10. doi:10.3847/2041-8213/ae2910
“Comprehensive X-Ray Observations of the Exceptional Ultralong X-Ray and Gamma-Ray Transient GRB 250702B with Swift, NuSTAR, and Chandra: Insights from the X-Ray Afterglow Properties,” Brendan O’Connor et al 2025 ApJL 994 L17. doi:10.3847/2041-8213/ae1741
“What Is the Most Massive Gravitational-Wave Source?” Ilya Mandel 2026 ApJL 996 L4. doi:10.3847/2041-8213/ae278d
The post Monthly Roundup: Updates on Three Notable Transients appeared first on AAS Nova.
]]>
Researchers search for a connection between short-lived black hole accretion events and neutrinos — elusive, neutral, nearly massless particles.
The post Do Black Hole Flares Generate Neutrinos? appeared first on AAS Nova.
]]>Where do the mysterious cosmic messengers called neutrinos come from? Researchers search for a connection between neutrinos and accretion flares from black holes.
Seeking Connections
The IceCube Laboratory at the Amundsen-Scott South Pole Station in Antarctica. [Felipe Pedreros, IceCube/NSF]
Thus far, researchers have discovered a compelling connection between neutrinos and distant active galactic nuclei, which are powered by the accretion of gas onto supermassive black holes. The active galactic nucleus phase of a black hole tends to be long lived, with activity lasting hundreds of thousands of years or more, making these nuclei lasting sources of neutrinos.
Sampling Flares
Recently, researchers have found tentative evidence for coincident neutrinos from short-lived accretion events like tidal disruption events, in which a star is torn apart and accreted by a black hole. These studies have uncovered a potential connection between neutrinos and tidal disruption events with mid-infrared echoes, signaling the presence of obscuring dust.
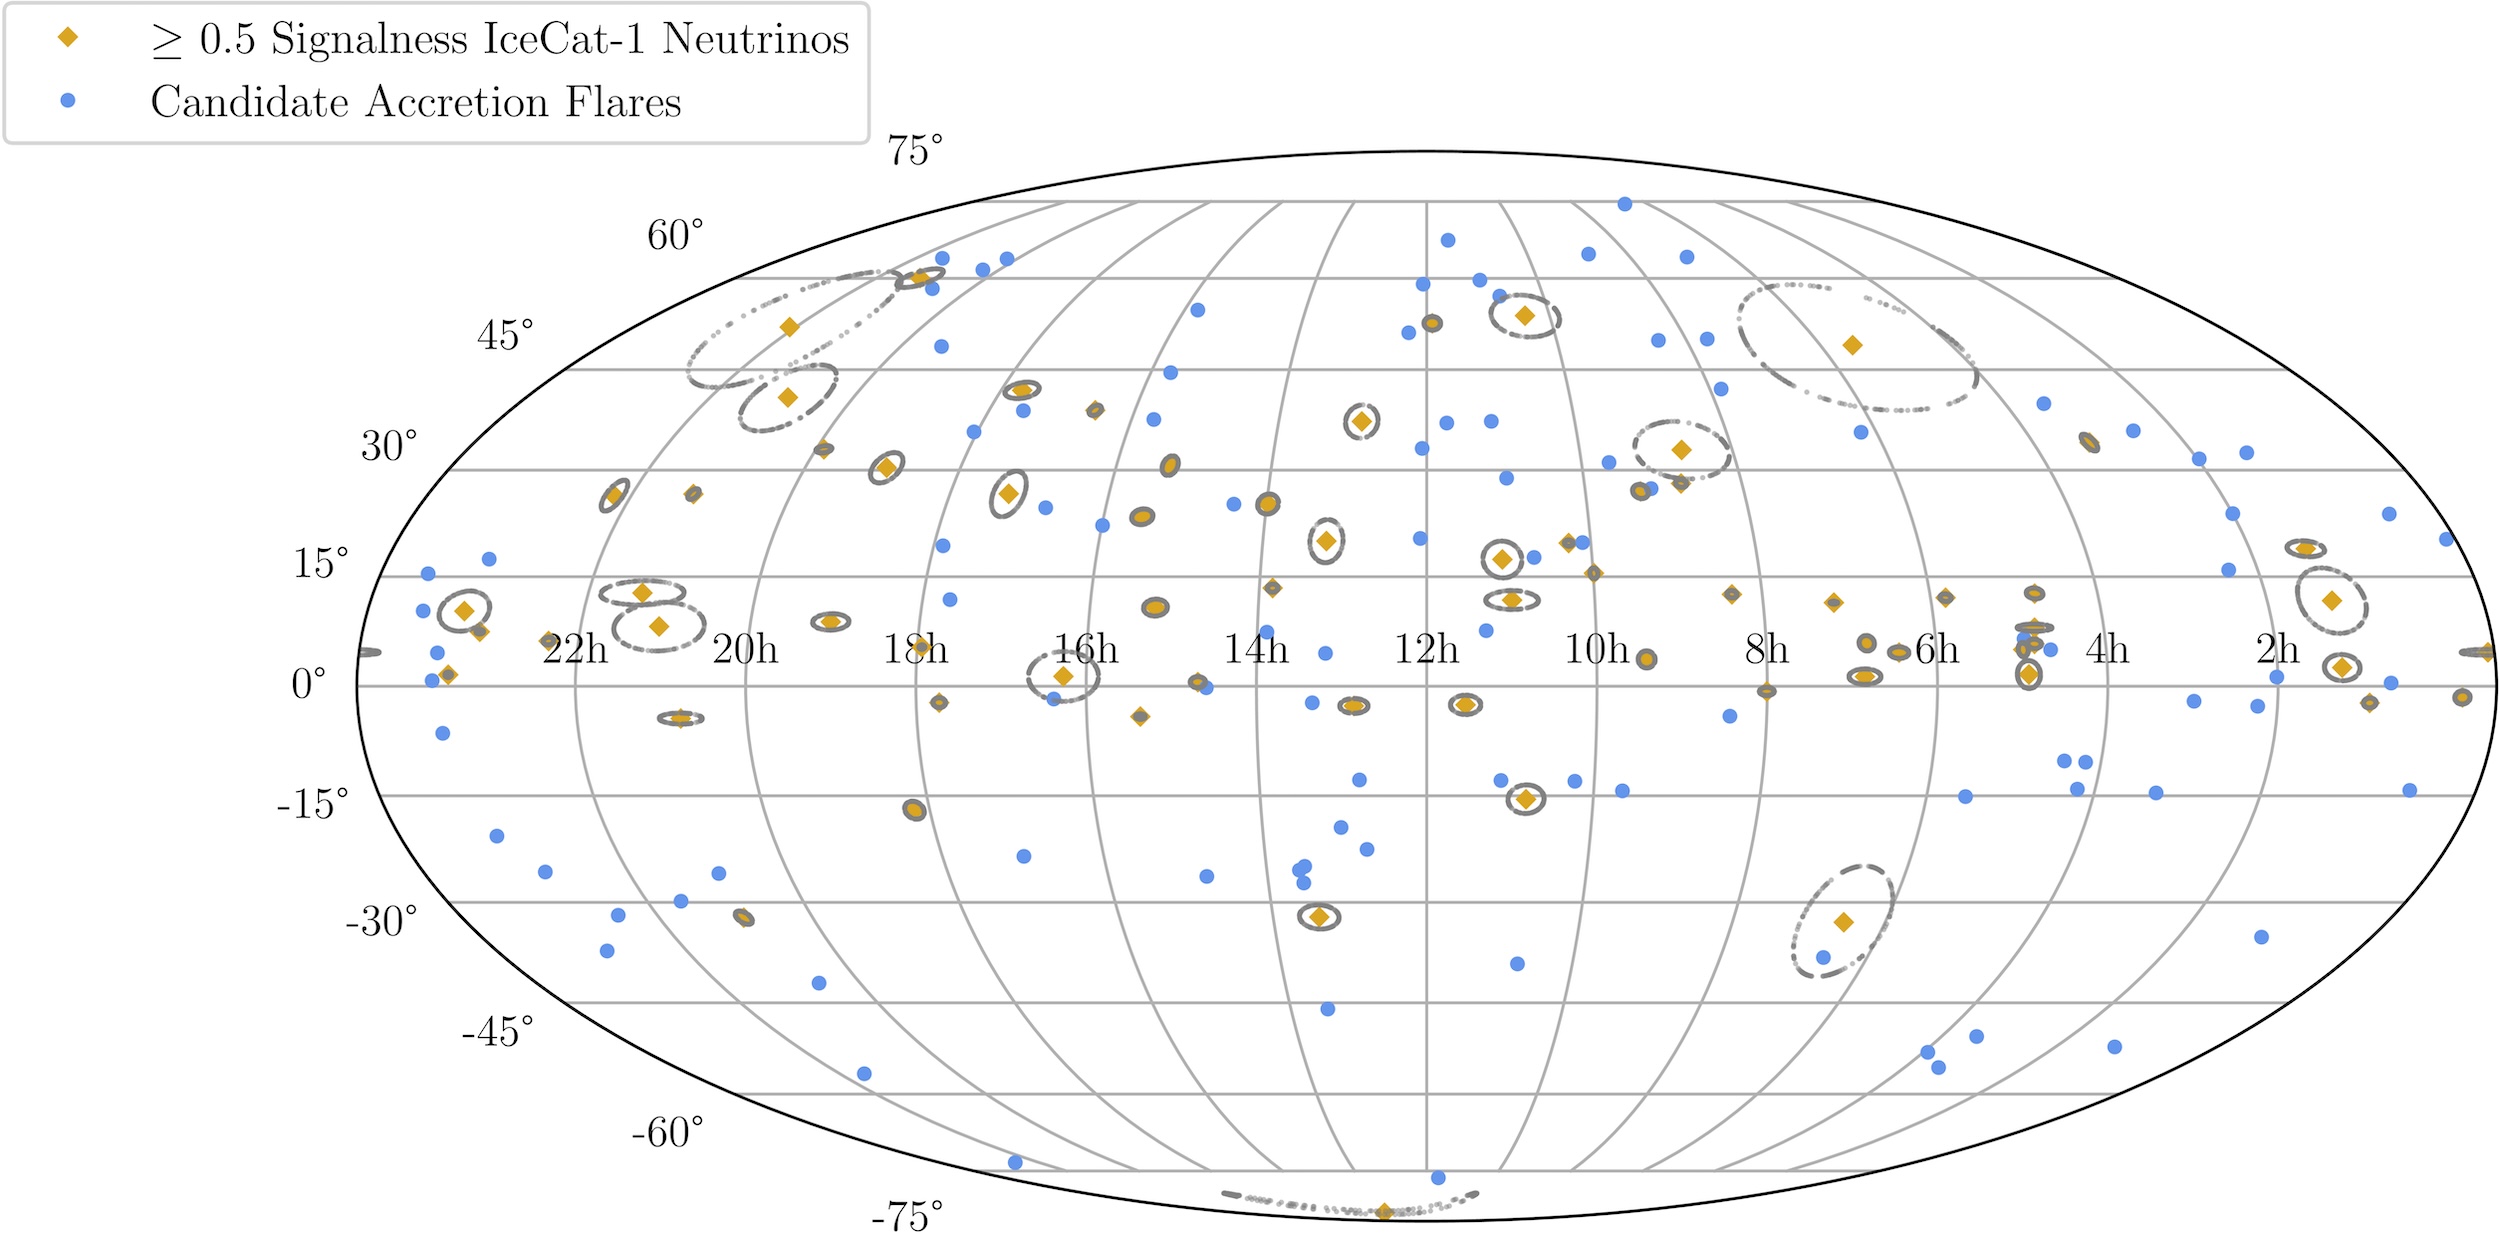
A map of the locations of the neutrinos (yellow diamonds) and black hole flares (blue circles) on the sky. Click to enlarge. [Wang et al. 2026]
For the neutrino side of the equation, Wang’s team turned to IceCube’s most recent catalog of neutrino events from astrophysical sources. In total, they compiled a sample of 68 events for which the odds of the source being astrophysical was greater than 50%, and for which the directional uncertainty was below 50.
No Coincidences
For a flare and a neutrino to be considered spatially and temporally coincident, the neutrino must arrive within one year of the flare, and the flare must fall within the 90% certainty contours of the neutrino. Ultimately, Wang’s team found no neutrinos that fulfilled both criteria and only one that was spatially but not temporally coincident with a black hole flare.
This result appears to be at odds with previous studies that found several neutrinos that were coincident with tidal disruption events. Wang and collaborators noted that while this work finds no association between neutrinos and black hole flares, it’s possible that the team is studying a different population of accretion events.
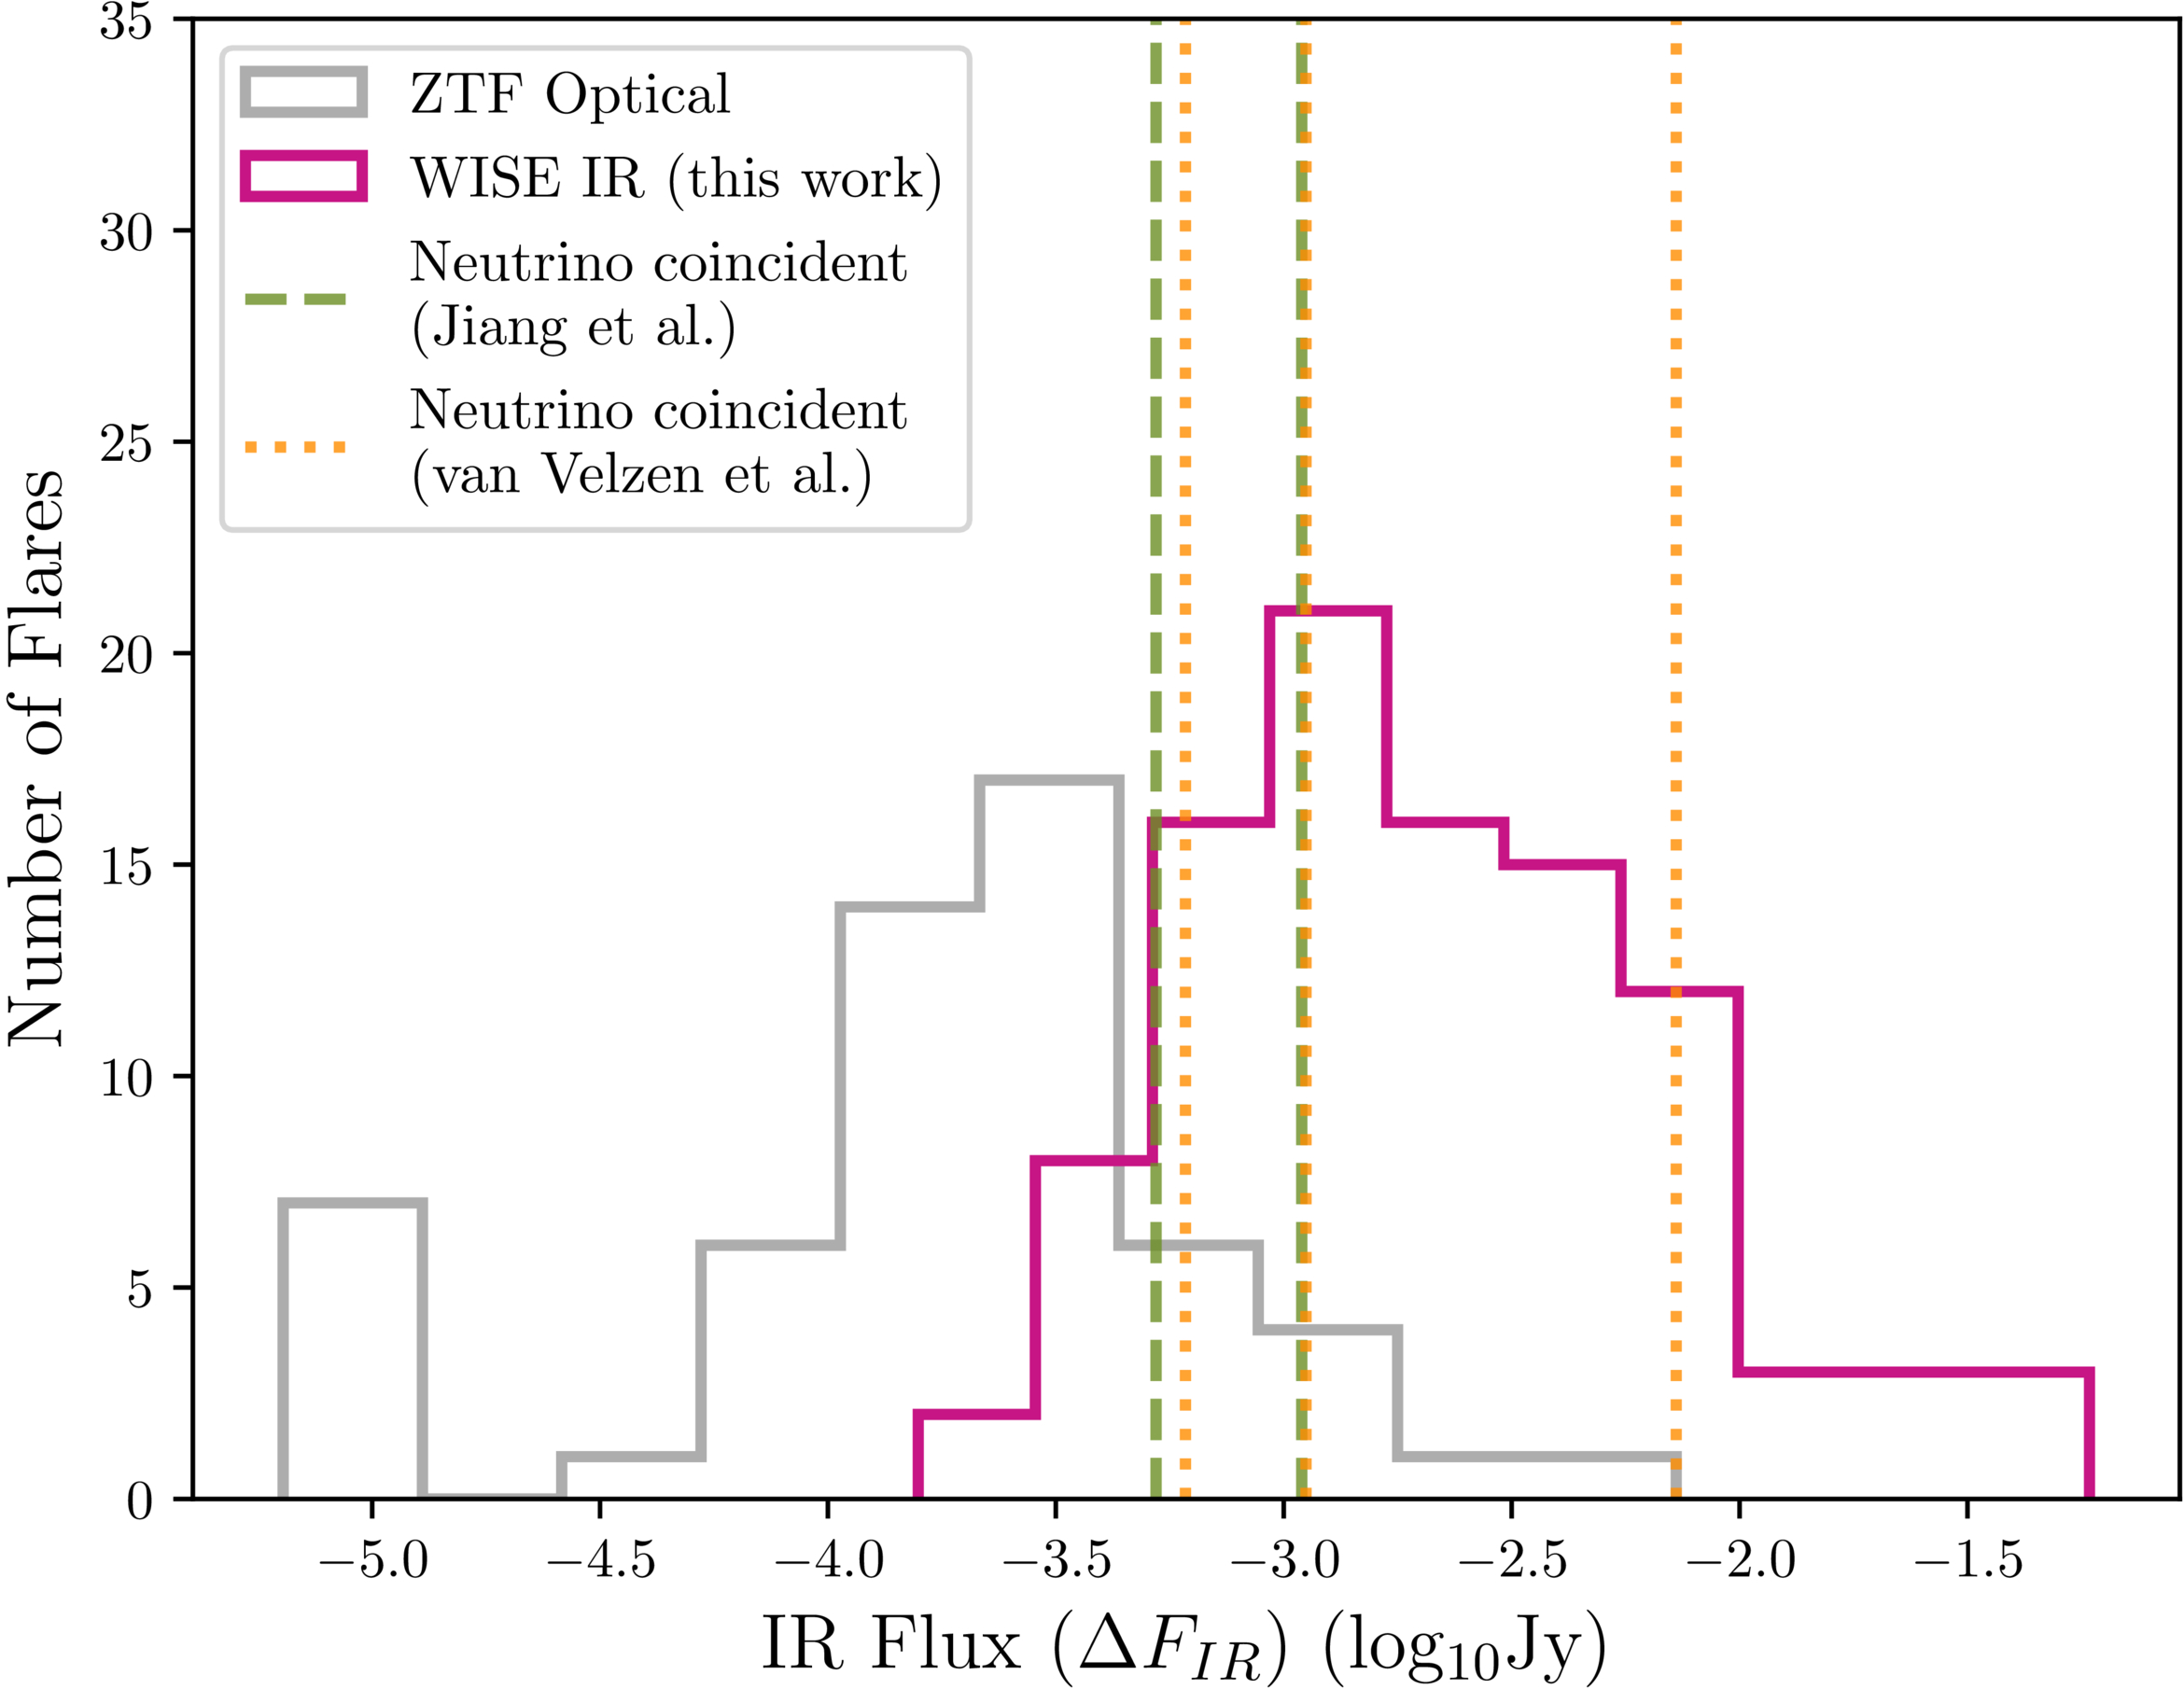
Infrared fluxes of the flares sampled in this study (magenta), optically identified flares (gray), and the tidal disruption events thought to have coincided with neutrino detections (green and gold dashed lines). [Wang et al. 2026]
Future work, including studies that leverage upcoming datasets from the Vera C. Rubin Observatory, the Roman Space Telescope, and the NEO Surveyor, can address this question further and search for connections with specific populations of black hole flares.
Citation
“Testing the Association of Supermassive Black Hole Infrared Flares and High-Energy Neutrinos,” Megan Wang et al 2026 ApJL 998 L29. doi:10.3847/2041-8213/ae3f90
The post Do Black Hole Flares Generate Neutrinos? appeared first on AAS Nova.
]]>
Astrobites reports on simulations that might help astronomers identify double-detonation supernovae early in their evolution.
The post Ia’m Just Getting Started: A Type Ia Supernova’s First Day appeared first on AAS Nova.
]]>Editor’s Note: Astrobites is a graduate-student-run organization that digests astrophysical literature for undergraduate students. As part of the partnership between the AAS and astrobites, we occasionally repost astrobites content here at AAS Nova. We hope you enjoy this post from astrobites; the original can be viewed at astrobites.org.
Title: The First Day of a Type Ia Supernova from a Double-Degenerate Binary
Authors: Gabriel Kumar, Logan J. Prust, and Lars Bildsten
First Author’s Institution: University of California, Santa Barbara
Status: Published in ApJ
Much like distance markers along the highway, Type Ia supernovae have long been used as distance indicators in space. These supernovae were originally theorized to form in binary systems. In this system, a white dwarf (a dense, collapsed remnant of a star) steals surface material from a non-degenerate star like our Sun and then explodes. Because of the initial conditions and properties of those two stars, the explosion would shine with the same intrinsic brightness regardless of the binary system’s location in space.
Research and observations, however, show that this is not entirely true; not all Type Ia supernovae are equally luminous. There are various theories regarding the different formation scenarios and explosion mechanisms that might create a Type Ia supernova. Developing ways to sleuth out the origins of these systems can be useful because it may tell us more about their luminosity.
One emerging theory of formation is the “double-detonation scenario.” In this case, two white dwarfs exist in a binary system. The more massive primary (the “accretor”) steals material from the less massive white dwarf secondary (the “donor”). After the primary steals the donor’s outer thin shell of helium, the helium surrounding the accretor detonates. This explosion induces a shock wave that travels into the dense core of the accretor and causes another detonation. The two detonations — one on the surface and one in the core — produce enough energy to explode the star into a supernova, a powerful stellar explosion. When the material from the exploding star reaches its companion star, it forms a mysterious, conical wake within the gaseous material, or “ejecta,” expelled from the accretor. This wake might be an important clue for distinguishing a supernova’s origins.
Since these explosions are incredibly powerful and would be difficult (and dangerous!) to perform in a lab, astronomers turn to computer simulations to model these events. Hydrodynamical simulations, in particular, are helpful for researchers because they model how fluids “flow” by solving complex equations that are too tricky to do by hand. (Remember that stars are just balls of gas, and hence fluid!) The authors of today’s article ran hydrodynamical simulations of the explosion and subsequent evolution of the ejecta from a double-detonation scenario.
In the diagram of the team’s setup (see Fig. 1), you can see a “bow shock.” This shock is from the wave produced in the accretor’s detonation and is bowed since it bends around the donor star. This shock moves quickly through the cone of ejecta, modifies its structure, and leaves clues within the ejecta as it settles.
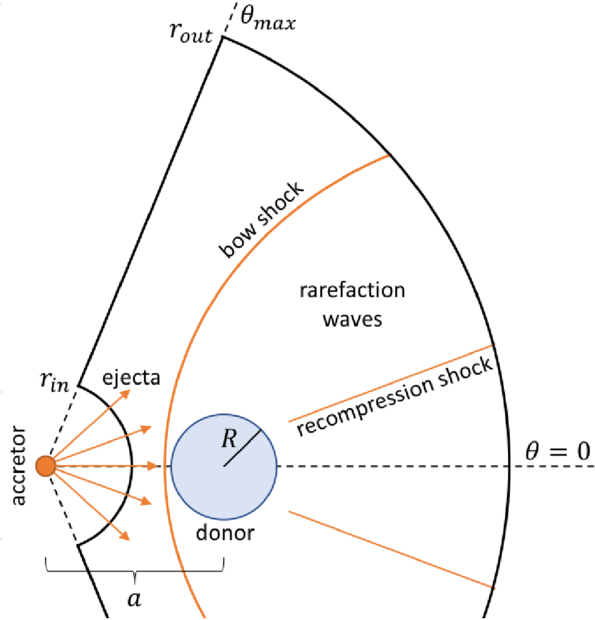
Figure 1: A visual schematic of the simulation setup. The accretor is the exploding star, which produces a “bow shock” from the detonation. The bow shock and recompression shock modify the structure of the ejecta, which fills the space between rout and rin. The ejecta is full of gaseous stellar material. [Kumar et al. 2025]
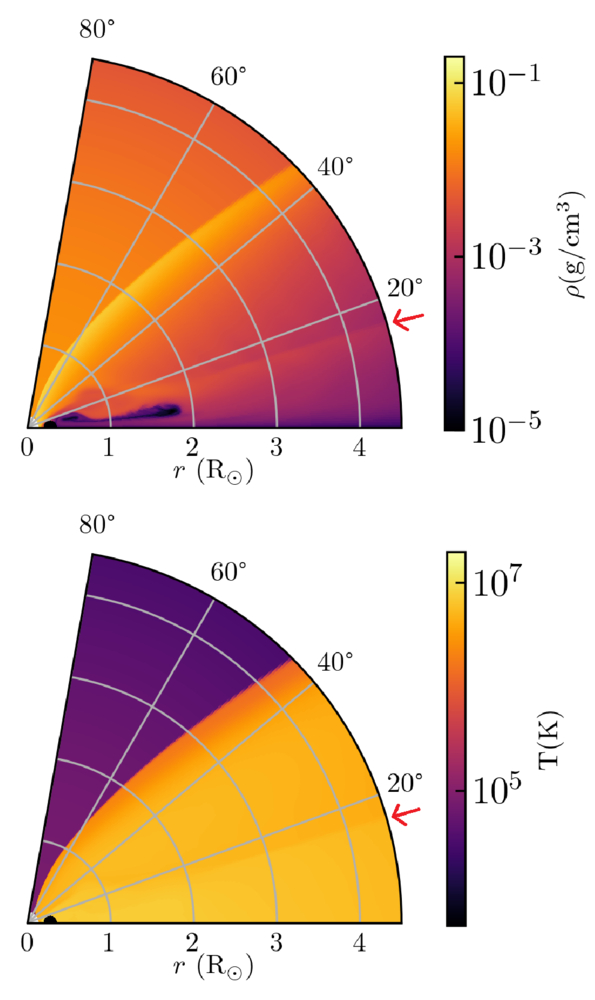
Figure 2: A visual “slice” of the ejecta surrounding the donor star just 200 seconds after detonation. The bottom-left corner (r = 0) has a faint white spot, indicating the donor. The density (top) and temperature (bottom) of the ejecta are shown. The faint line marked by the red arrow indicates the secondary shock from the explosion, highlighting changes in both density and pressure. [Kumar et al. 2025]

Figure 3: A slice of the simulation taken later, at 2 hours of simulation time. The ejecta in the shocked region has flown out farther than the ejecta in the unshocked region. Note that the horizontal scale has changed from Figure 2. [Kumar et al. 2025]
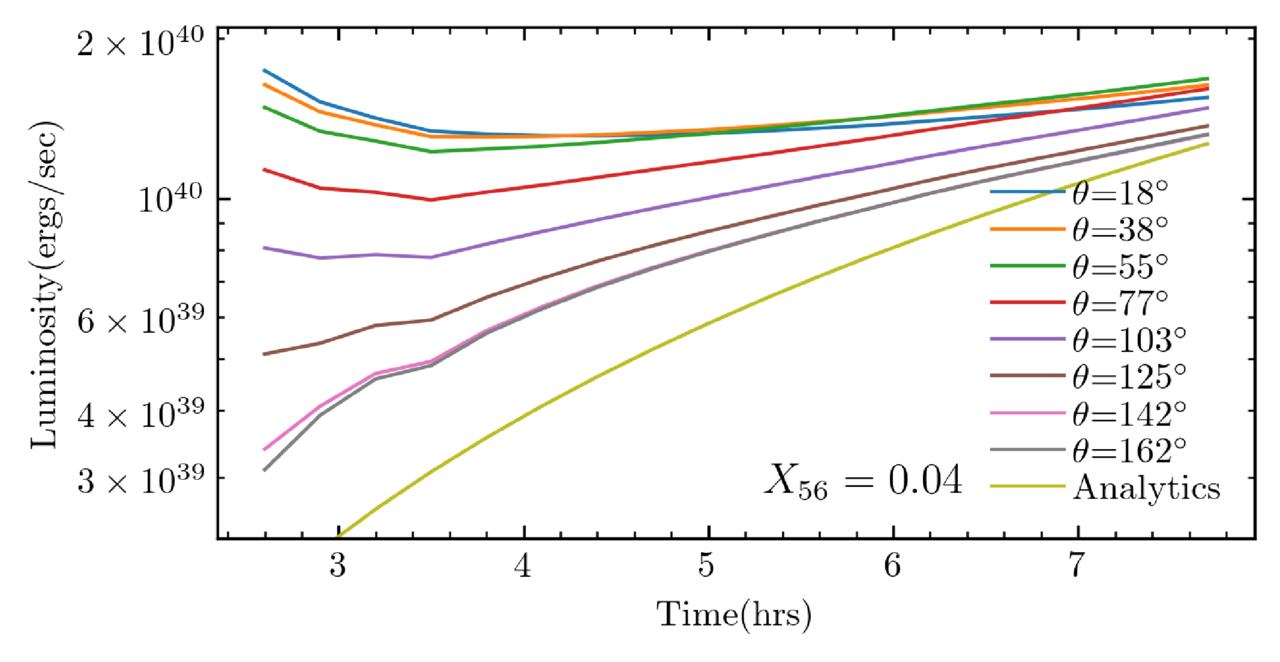
Figure 4: A comparison of luminosity vs. time over the course of 6 hours shortly after detonation. The different lines indicate different viewing angles from the axis of explosion. The line “Analytics” describes a light-curve prediction by Piro (2012) for a supernova that was not shock-heated. The luminosities for this model span almost one order of magnitude. [Kumar et al. 2025]
While there is always more work to be done, this work presents a first step at identifying double-detonation Type Ia supernovae from early observations. With an influx of observations from new observatories, like the Vera C. Rubin Observatory, we should expect to see many more early supernova detections.
Original astrobite edited by Ansh Gupta.
About the author, Mckenzie Ferrari:
I’m currently a PhD student in the geophysical sciences program at the University of Chicago. While I now study the atmosphere and oceans of Earth, most of my previous research focused on simulations of Type Ia supernovae and galaxy formation and evolution. In my free time, I foster cats for a local organization, enjoy cooking, and can often be found running along Lake Michigan.
The post Ia’m Just Getting Started: A Type Ia Supernova’s First Day appeared first on AAS Nova.
]]>
How do giant low-surface-brightness galaxies form? New research investigates two galactic specimens to search for clues.
The post Featured Image: Rare Giant Galaxies appeared first on AAS Nova.
]]>Giant low-surface-brightness galaxies are rare and unusual members of the galactic menagerie. They host the largest galactic disks currently known, have baryonic masses of order 100 billion solar masses, and sport narrow, tightly wound spiral structures. The origins of these vast galaxies — they can be up to 10 times larger than the Milky Way — are unknown, though various theories involving mergers, accretion, and strange dark matter halos exist. Research also suggests that there may be a connection between these galaxies and compact ellipticals, which are small, dense, and contain old stars. In a recent article, a team led by Anna Saburova (Sternberg Astronomical Institute) investigated two giant low-surface-brightness galaxies with compact elliptical companions. In the image above, the colored circles represent the oxygen abundance at each location in AGC 192040 (left) and UGC 1382 (right). The red arrows point to the compact elliptical companions. Using the chemical abundance information to investigate possible formation mechanisms, Saburova and collaborators found that the two galaxies likely formed in different ways. UGC 1382 appears to be the result of multiple mergers, while AGC 192040 may have accreted gas from its halo or a galactic filament before undergoing a merger of its own. To learn more about this study of two rare galaxies, be sure to check out the full research article linked below!
Citation
“MUSE Study of Two Giant Low-Surface-Brightness Galaxies with Compact Satellites,” Anna S. Saburova et al 2026 ApJ 998 19. doi:10.3847/1538-4357/ae3139
The post Featured Image: Rare Giant Galaxies appeared first on AAS Nova.
]]>
A satellite-rich dwarf galaxy poses a potential problem for current cosmological models.
The post Satellite Surplus Around Dwarf Galaxy DDO 161 appeared first on AAS Nova.
]]>Small galaxies are expected to have even smaller companion galaxies, according to current cosmological models. A recent study takes a look at one dwarf galaxy and finds more tiny companions than anticipated.
Cosmology Predicts Satellite Galaxies
Critical to our understanding of dark matter and galaxy formation, satellite galaxies are small, faint galaxies surrounding a larger host galaxy. The leading cosmological model, known as lambda cold dark matter (ΛCDM), predicts dark matter halos of all masses to host smaller dark matter subhalos whose luminous counterparts make up satellite galaxies.
While the satellite systems of Milky Way-like galaxies are well characterized, the companions of dwarf galaxies are less well studied. Despite being significantly smaller, dwarf galaxies should also host even smaller satellites galaxies around them. These satellites push the limits of observations — extremely faint and hard to distinguish from background sources, dwarf galaxy satellites require innovative imaging techniques to discover.
In recent years, new surveys have identified a number of satellites around dwarf galaxies that appear broadly consistent with ΛCDM predictions, though the sample size is still small. Continuing the search for little galaxies’ little galaxies is critical to testing the ΛCDM framework and will further our understanding of galaxy formation on the smallest scales.
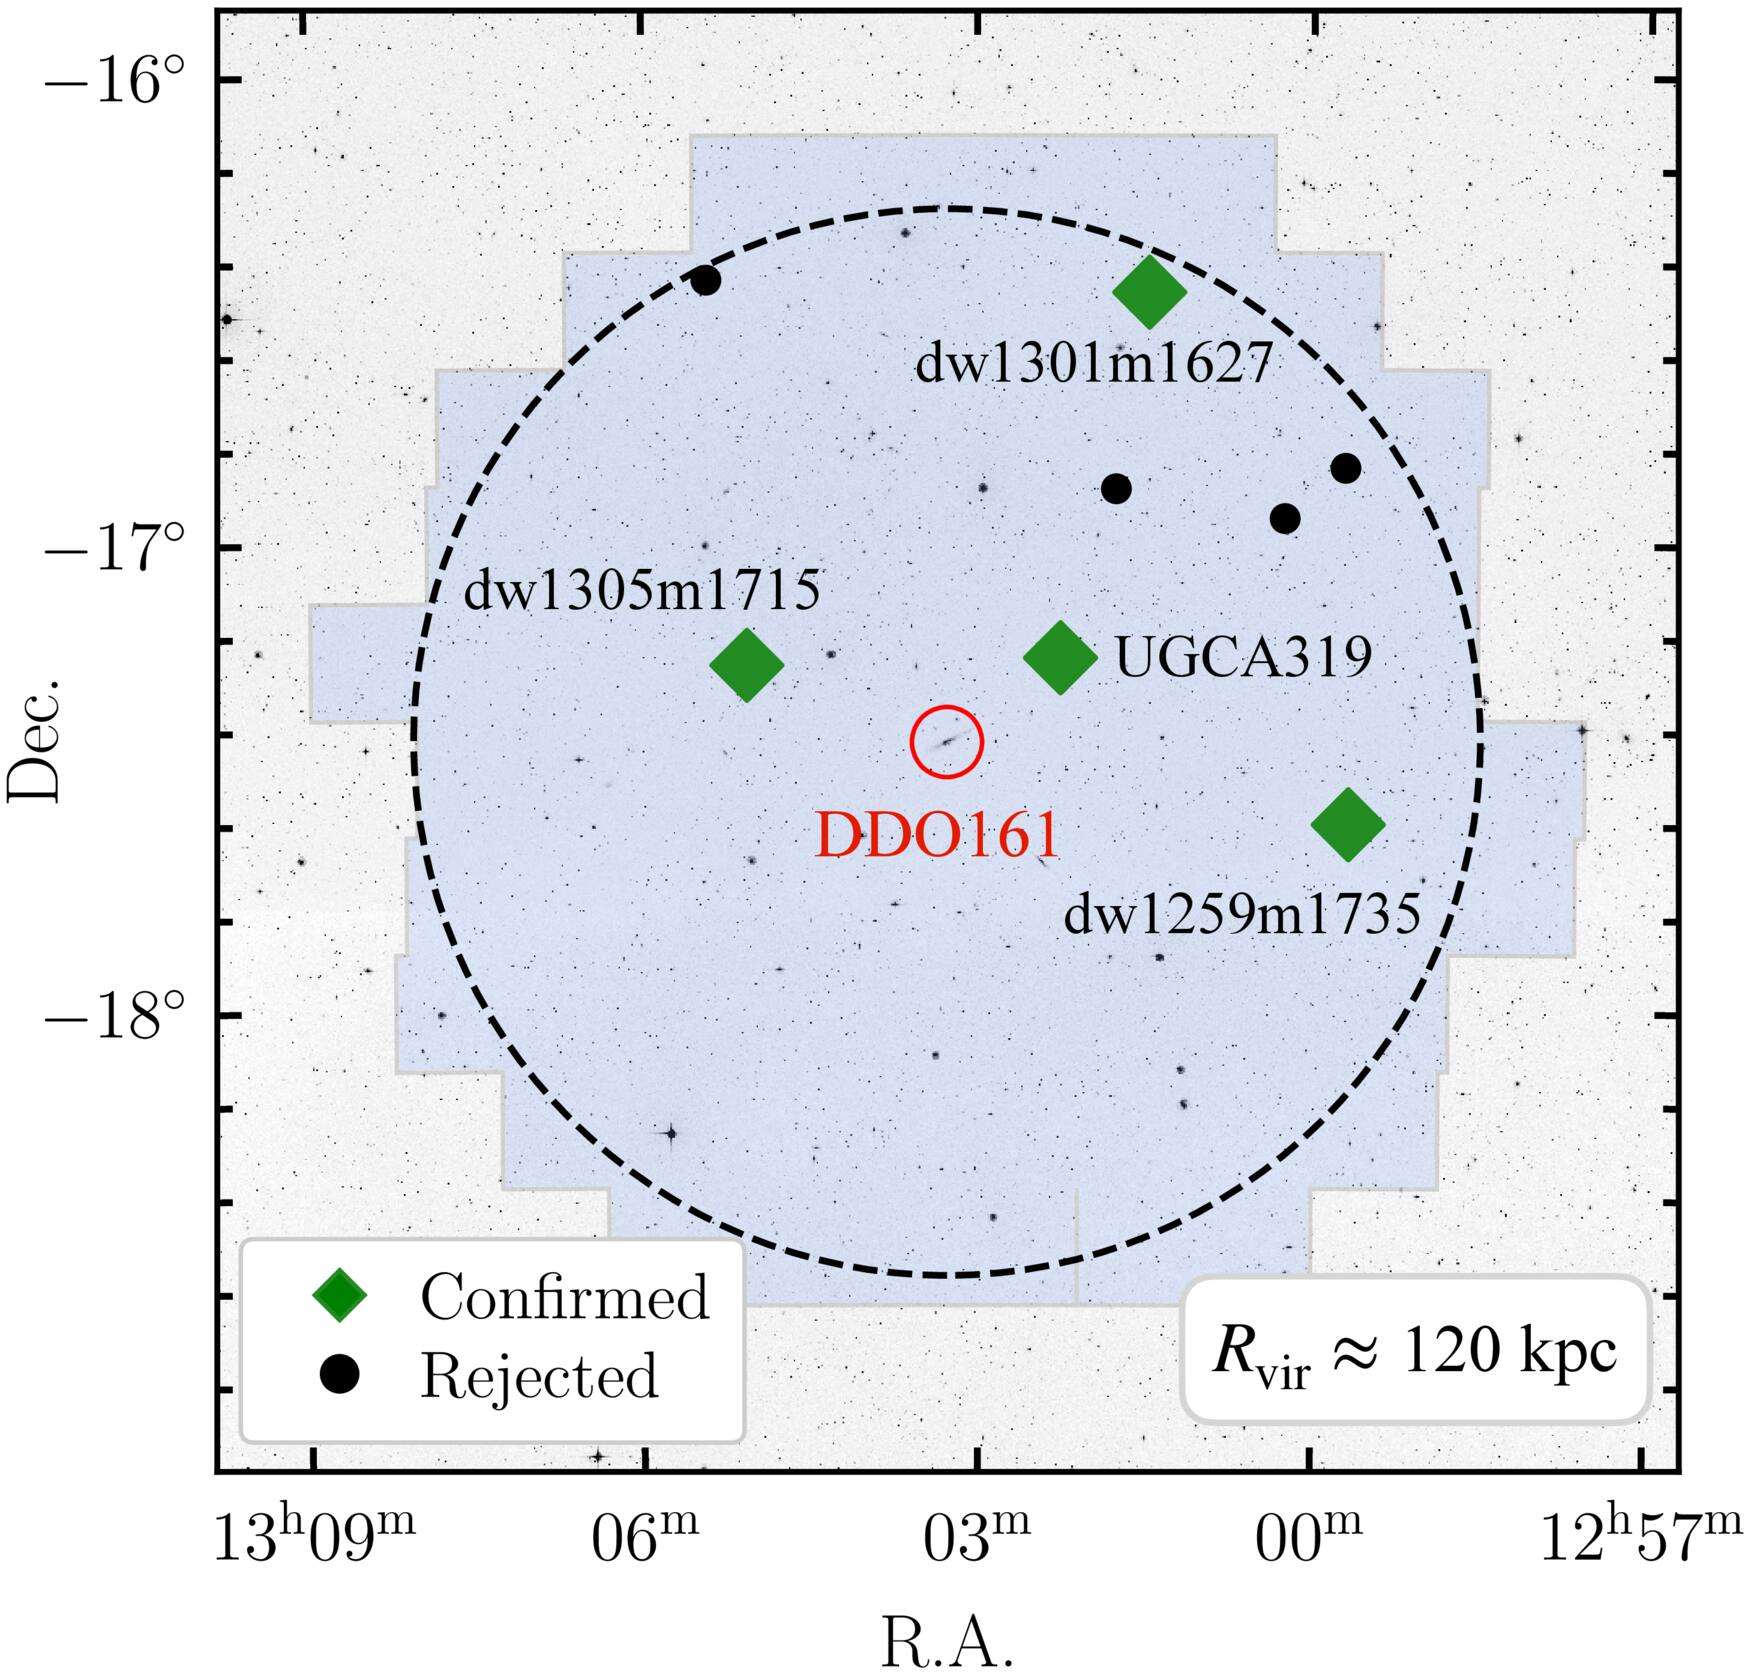
Satellite candidates around DDO 161 as they appear on the sky. Click to enlarge. [Li et al 2026]
Searching for Satellites Around DDO 161
Diving into a specific system, a team led by Jiaxuan Li (李嘉轩) from Princeton University began an in-depth search for satellites around the dwarf galaxy DDO 161. Prior to this study, DDO 161 was known to have one companion, UGCA 319, that is about 10 times smaller than its host.
The authors used data from the Legacy Surveys to search for satellites within about 400,000 light-years of DDO 161 — the expected reach of DDO 161’s gravitational influence. After removing bright sources and smoothing the image to bring out very faint objects, they found eight satellite galaxy candidates including UGCA 319.
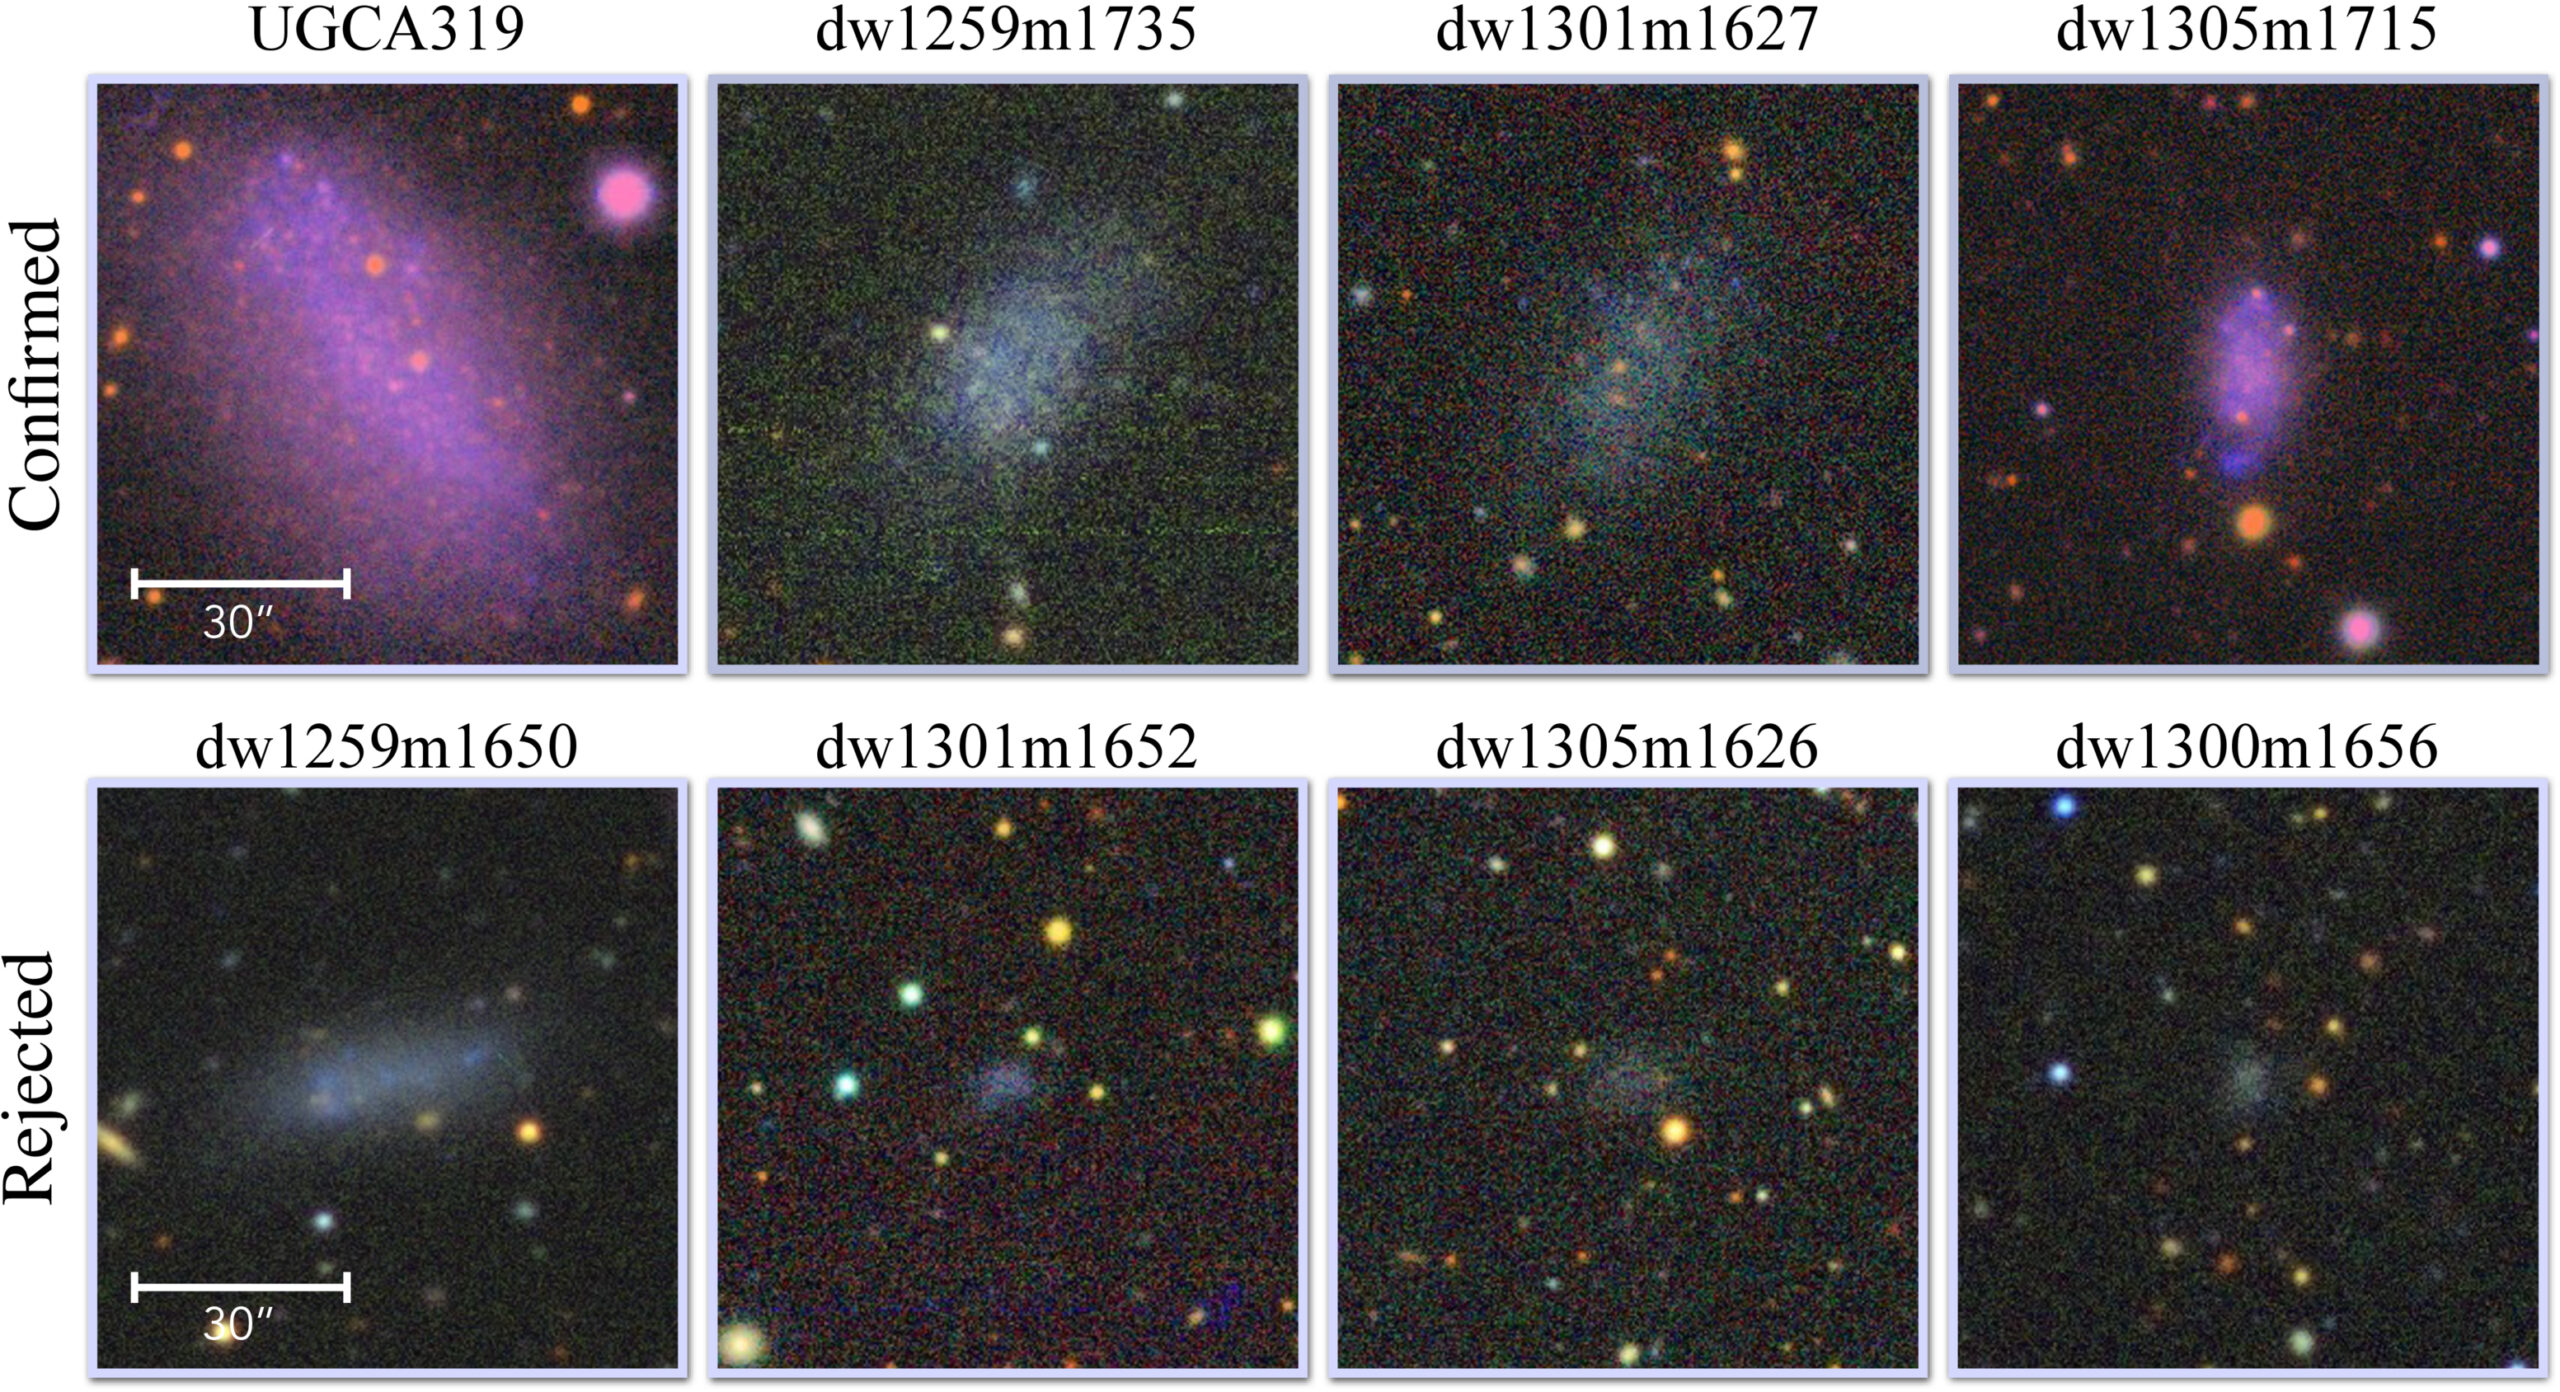
Images of the satellite candidates of DDO 161 from the Legacy Surveys. The top row shows the confirmed satellites, and the bottom row shows the rejected satellites. Click to enlarge. [Li et al 2026]
Too Many Satellites
How does DDO 161 compare to theoretical predictions for galaxies of its size? The authors ran cosmological simulations to quantify the expected satellite populations around galaxies of similar size to DDO 161. Just as it is an outlier observationally, DDO 161 is also an outlier when compared to the simulation results that predicted fewer satellite galaxies in similarly massive host systems.
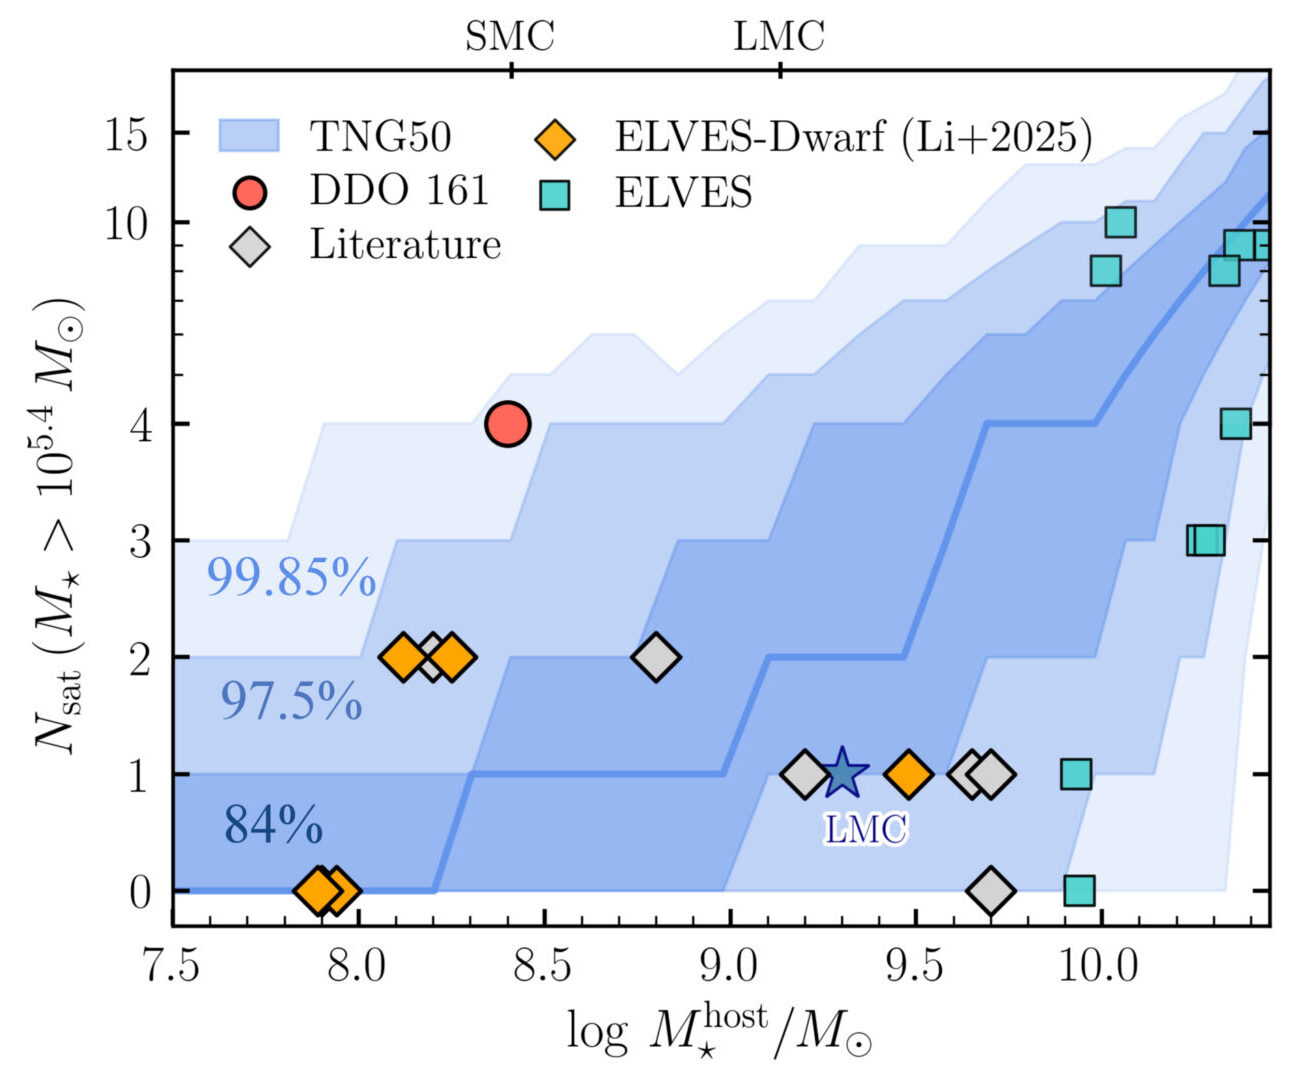
Number of satellites versus host galaxy stellar mass for DDO 161 (red circle) compared to other observed low-mass galaxy satellite systems (data points) and predicted ranges from simulations (blue regions). DDO 161 is a clear outlier, having a high number of satellites for the host galaxy’s stellar mass. Click to enlarge. [Modified from Li et al 2026]
Citation
“A Possible ‘Too-many-satellites’ Problem in the Isolated Dwarf Galaxy DDO 161,” Jiaxuan Li et al 2026 ApJL 998 L24. doi:10.3847/2041-8213/ae3ddd
The post Satellite Surplus Around Dwarf Galaxy DDO 161 appeared first on AAS Nova.
]]>
JWST spectra illuminate the composition of the debris disk around GD 362, one of the most polluted white dwarfs known.
The post Investigating a Polluted White Dwarf appeared first on AAS Nova.
]]>Roughly 25–50% of the white dwarfs in the solar neighborhood are “polluted,” showing signs of accretion of metal-rich planetary material. New JWST observations reveal the contents of the debris disk surrounding one of the most polluted white dwarfs in the solar neighborhood.
Heavy-Metal Pollution
A white dwarf is faintly visible at the center of this Hubble Space Telescope image, tucked between the two brightest stars. [NASA, ESA and H. Richer (University of British Columbia); CC BY 4.0]
One of the most impressively metal-polluted white dwarfs known is GD 362, which is surrounded by a dusty debris disk and shows evidence for at least 16 accreted elements. GD 362 is a helium-atmosphere white dwarf, but previous observations have also shown that it has an unusually large amount of hydrogen in its atmosphere — a possible sign that the star has consumed one or more bodies containing water or ice.
Disk Investigation
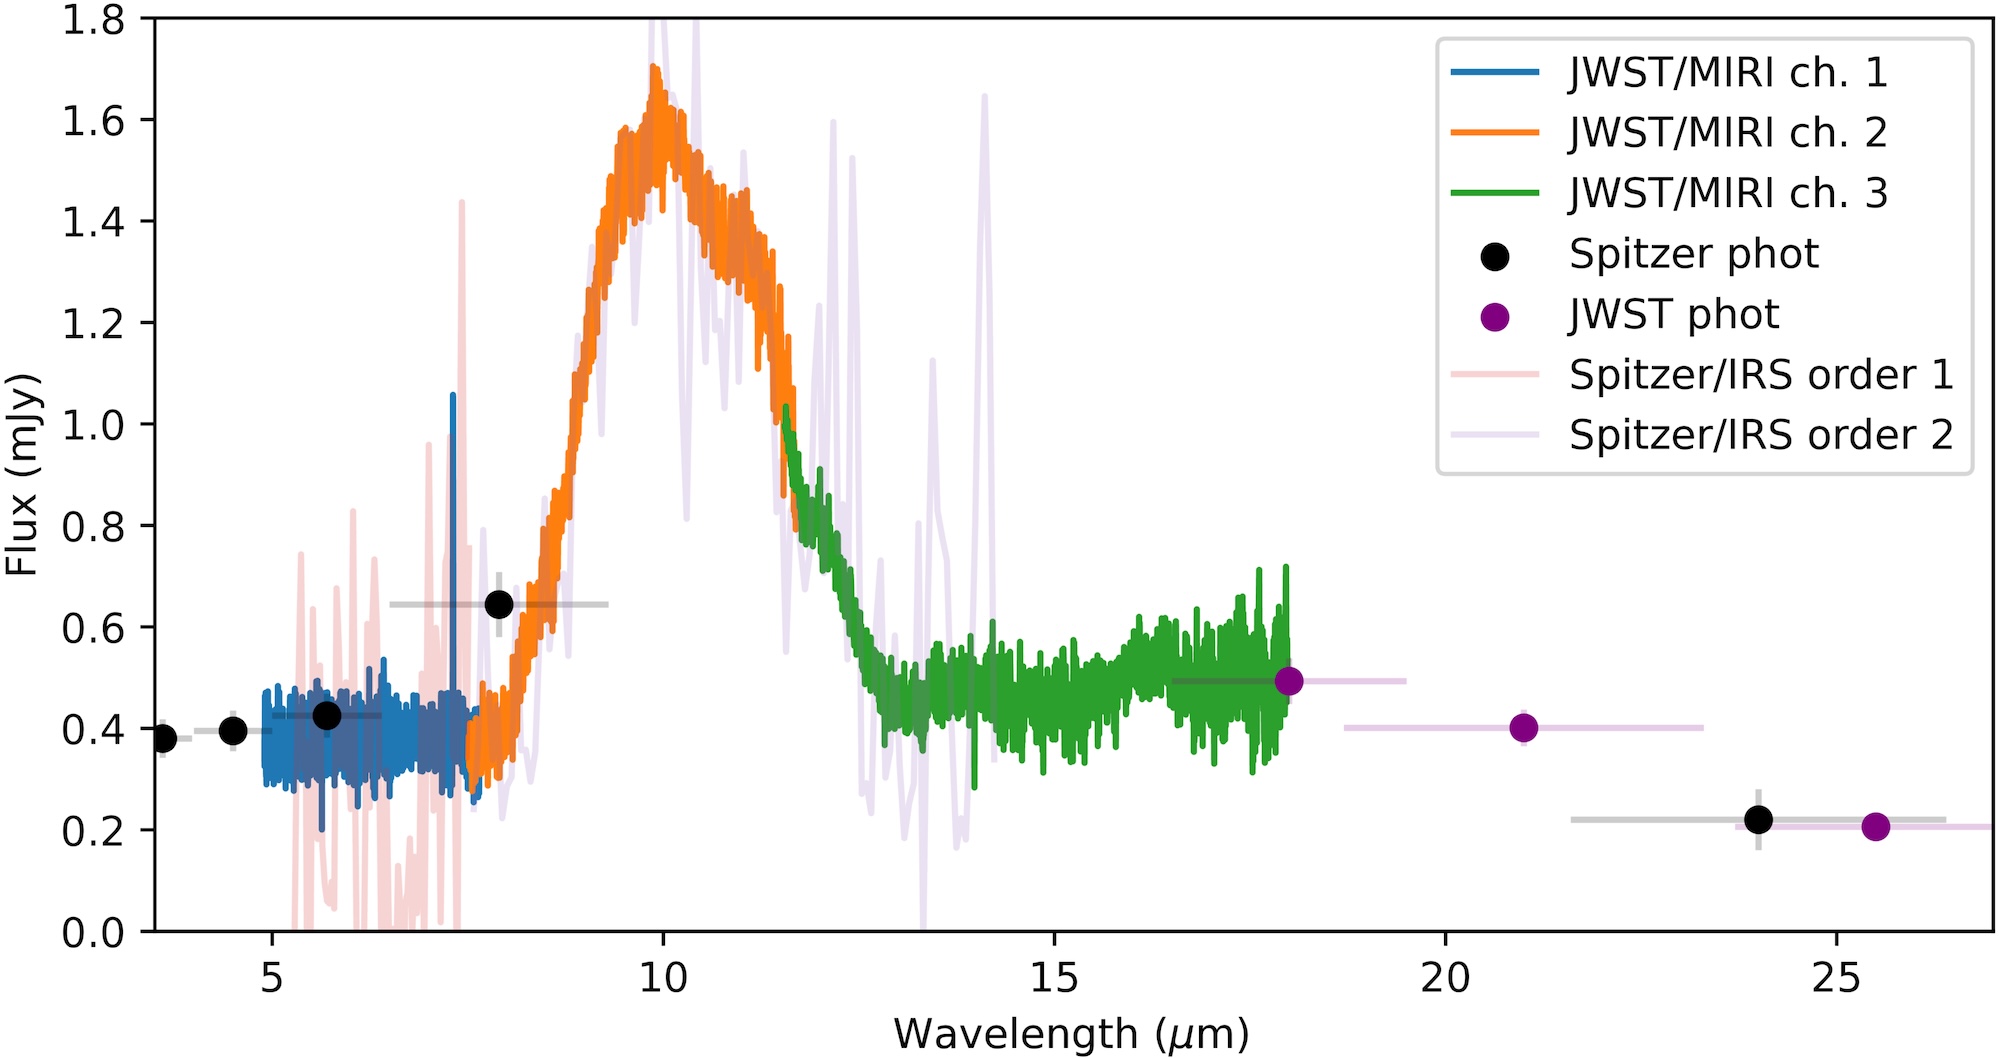
Mid-infrared JWST spectrum and photometry of GD 362, with additional spectral and photometric data from the Spitzer Space Telescope. Click to enlarge. [Reach et al. 2025]
Reach’s team modeled the JWST spectra to constrain the mineralogy of the disk and its physical attributes. They found that the disk likely stretches from 140 to 1,400 times the white dwarf’s radius and contains both silicates and carbon, with the prominent emission feature pointing to olivine and pyroxene silicate minerals. The elements seen in the white dwarf’s atmosphere are generally similar to those observed in the disk, strengthening the connection between accretion from the disk and the metals present in the white dwarf’s spectrum.
Hydrogen Mismatch
The new JWST data furthered the investigation of GD 362’s atmospheric hydrogen and the possibility that it’s accreting water- or ice-rich material. Though water molecules have spectral features in the range studied, none of these features appeared in the JWST spectra of GD 362. This isn’t necessarily a surprise; the team showed that water molecules in the disk would quickly be split apart by GD 362’s high-energy radiation.
Left column: Three JWST images of GD 362. Right: The same images with the white dwarf’s point spread function subtracted. [Reach et al. 2025]
In addition to investigating GD 362’s disk, Reach and collaborators searched for planets orbiting the white dwarf. Though they found none, they were able to rule out the presence of companions with masses greater than 25 times the mass of Jupiter.
Citation
“Composition of Planetary Debris Around the White Dwarf GD 362,” William T. Reach et al 2025 ApJ 994 195. doi:10.3847/1538-4357/ae11a9
The post Investigating a Polluted White Dwarf appeared first on AAS Nova.
]]>
Astrobites reports on a cosmic drama in action: three active black holes, tangled jets, and fading light.
The post A Triple Black Hole System Caught in the Act of Self-Quenching appeared first on AAS Nova.
]]>Editor’s Note: Astrobites is a graduate-student-run organization that digests astrophysical literature for undergraduate students. As part of the partnership between the AAS and astrobites, we occasionally repost astrobites content here at AAS Nova. We hope you enjoy this post from astrobites; the original can be viewed at astrobites.org.
Title: Episodic Feedback in Triple Active Galactic Nucleus Candidate SDSS J0849+1114 Revealed by Extended Ionized Gas
Authors: Xiaoyu Xu (许啸宇) et al.
First Author’s Institution: Nanjing University
Status: Published in ApJ
When Galaxies Collide
Galaxies are social creatures; they interact and merge (more astrobites talking about this are here and here)! When galaxies collide, the gravitational chaos acts like a funnel, driving massive amounts of cold gas toward the center. This gas rush has two major consequences: it triggers intense bursts of star formation (known as starbursts), and it feeds the central supermassive black holes, activating them as active galactic nuclei (AGNs).
But the story doesn’t end there. These powerful AGNs don’t just sit and feast on the gas. They launch high-velocity winds or jets that push back against the incoming gas, a process known as AGN feedback. (Read more about it in Astrobites here and here.) This feedback is thought to be the key mechanism by which supermassive black holes regulate their host galaxies, either by heating and expelling the gas (negative feedback, which starves star formation) or, in some cases, by compressing it (positive feedback, which promotes star formation).
While binary AGNs (two AGNs in one merging system) are rare, finding systems with three AGNs in one system is fascinatingly rare. The galaxy SDSS J0849+1114 (J0849+1114) is one such system, featuring three Seyfert 2 AGNs, a type of active galaxy with a bright, compact nucleus whose spectrum shows only narrow emission lines, within a tight region of about 5 kiloparsecs (kpc) or 16,000 light-years. Studying this system gives us a front-row seat to how multiple black holes interact and regulate their host environment during a complex merger. Very Large Array observations reveal that nucleus A (see Figure 1) contains two jets, inner and outer. In contrast, nucleus C has one jet, providing further evidence for the presence of an AGN.
Figure 1: Left: Hubble Space Telescope image taken in ultraviolet light. Right: Optical image from the VLT/MUSE instrument. The three black holes, nuclei A, B, and C, are marked with black crosses. The white contours are from Hubble, like on the left, and the yellow contours are of the MUSE instrument. We can observe the complex and disturbed morphology resulting from the ongoing merger. [Adapted from Xu et al. 2025]
Peering into the Triple Core with VLT/MUSE
To understand the gas dynamics in J0849+1114, the authors used the Very Large Telescope (VLT) and its Multi-Unit Spectroscopic Explorer (MUSE) instrument. MUSE is an integral-field spectrograph, meaning it provides spectra for every single spatial pixel (or “spaxel”) across the field of view. This allows astronomers to map not just where the light is coming from, but how the gas is moving and what is causing it to glow, all resolved spatially across the galaxy.
The main technique employed was two-component Gaussian fitting of key emission lines like hydrogen alpha (Hα) and ionized oxygen ([O III]λλ4959,5007), which can be seen in Figure 2. The width of a Gaussian line (or its velocity dispersion) in a spectrum tells us how fast the gas is moving. A narrow line means the gas is relatively calm, with most of it moving at similar speeds. A broader line, on the other hand, means the gas velocities are more spread out — some parts are racing toward us, others away — indicating turbulence or outflows. By comparing the widths of different components, astronomers can separate quiet, rotating gas from the high-speed winds launched by the active black holes.

Figure 2: Zoomed-in spectra showing the Hβ and [O III] (left) and Hα, [N II], and [S II] (right) emission lines from the spot marked with an “X” in the MUSE image in Figure 1. The blue line shows the observed data, the orange line shows the best-fit model, and the two colored curves (light blue and red) represent the two components of the gas. The pink line shows the leftover differences between the data and the model. The First Component is narrow, representing gas that is relatively settled, often showing signs of rotation or slow movements associated with gravitational disturbances, like tidal tails (low velocity dispersion, σ1 ≤ 50 km/s). The Second Component is broad, representing highly turbulent or fast-moving gas, characteristic of powerful outflows or winds driven by the central AGNs (high velocity dispersion, σ2 > σ1). [Adapted from Xu et al. 2025]
What They Found: Gas Tails and Outflows
The VLT/MUSE observations successfully characterized both the undisturbed (First Component) and turbulent (Second Component) gas across the system.
1. Galactic-Scale Tidal Tails
The slow-moving gas (First Component) revealed extended structures of ionized gas stretching over 10 kpc (33,000 light-years), and in some directions, even more than 15 kpc (49,000 light-years) away from nucleus A. These large, low-velocity gas clouds align well with features known as tidal tails: the stretched-out arms of gas and stars pulled away by the violent gravitational forces of the merger.
2. Two Distinct Outflows Driven by Radio Jets
The fast-moving gas (Second Component) clearly showed two distinct sites: outflows originating from nucleus A and nucleus C.
- Outflow A: This outflow extends over 5 kpc (16,000 light-years) around nucleus A. The gas kinematics and geometry strongly suggest that this outflow is being driven by nucleus A’s radio jet. This finding is key, as the measured kinetic power of the outflow is about 10 times stronger than what star formation alone could supply, and the current luminosity of the AGN is also insufficient to power it.
- Outflow C: A smaller but detectable outflow extends about 5.9 kpc (19,000 light-years) around nucleus C, with a lower kinetic power compared to Outflow A. But, like Outflow A, the energetics and velocity gradients suggest this outflow is also linked to nucleus C’s radio jet.
A Black Hole That’s Recently Gone Quiet
The most striking implication of this study relates to the timing of nucleus A’s activity. The presence of extended ionized gas far from the nucleus (in the tidal tails, >10 kpc or 33,000 light-years away) provides a fascinating glimpse into the AGN’s recent past.
The physical conditions of this distant gas were determined using emission line ratios ([O III]/Hα and [N II]/Hα) on the Baldwin, Phillips, and Terlevich (BPT) diagram. A BPT diagram uses emission line ratios to diagnose the energy source that ionizes the gas: star formation, AGN, or shocks. The BPT diagram of J0849+1114 indicates that an AGN currently photoionizes the gas.
By running sophisticated photoionization models, the scientists calculated how luminous nucleus A must have been to ionize the gas currently found 10–15 kpc (33,000–49,000 light-years) away. They discovered that this required nucleus A to be 20–100 times more luminous than it currently is! Since light takes time to travel, and the ionized gas quickly recombines (on timescales of less than 100 years for this gas), this luminous phase must have ended very recently, approximately 30,000–50,000 years ago. This is a long time for us, but just a blink of an eye on cosmic timescales.
The Episode of Self-Regulation
By integrating the findings across different wavelengths and timescales, the current faint luminosity state, the past luminous state inferred from the distant gas, and the presence of radio jets of different ages, the authors propose a model of episodic AGN feedback in nucleus A:
- Past Activity (150,000 years ago): An active phase likely launched an outer radio jet, which subsequently drove the large-scale ionized gas outflow observed today.
- Peak Ionization (30,000–50,000 years ago): A subsequent burst of high accretion reached its peak, ionizing the distant tidal tails.
- Fading and Quenching (Today): The energy released by the jet and/or outflow during the active phase likely expelled or heated the surrounding gas (negative feedback), causing the central accretion disk to run out of fuel. The AGN has since faded rapidly to its current low-accretion state, marked by the appearance of a young inner radio jet.
A Quiet Ending After a Loud Beginning
J0849+1114 is not just a statistical anomaly as a triple AGN candidate; it serves as a crucial case study demonstrating the powerful and rapid effects of AGN feedback. High-resolution observations confirm that violent galaxy mergers trigger both powerful outflows and episodic bursts of extreme luminosity. Crucially, these outflows clear the gas and cause the central supermassive black hole to quickly fade from a luminous quasar phase to a quiet, low-accretion state within tens of thousands of years. This system provides strong, spatially resolved evidence that AGN feedback rapidly suppresses accretion onto the supermassive black hole and shapes the host galaxy on kiloparsec scales during the chaotic drama of galactic mergers.
Original astrobite edited by Lindsey Gordon.
About the author, Sowkhya Shanbhog:
I am currently a first-year PhD student at Scuola Normale Superiore in Pisa, Italy, where I am focusing on studying high-redshift quasars. Prior to this, I completed a dual BS-MS degree at the Indian Institute of Science Education and Research in Pune, India. Now, I am eager to expand my involvement in science communication and outreach initiatives. I have recently developed an interest in cooking, particularly since moving to a new city. I find solace in listening to music during my leisure time.
The post A Triple Black Hole System Caught in the Act of Self-Quenching appeared first on AAS Nova.
]]>
Astronomers search for a simple organic molecule in Lynds 1544, a cold, dense clump of gas that will one day become a star.
The post Mapping a Molecular Building Block in a Pre-Stellar Core appeared first on AAS Nova.
]]>To probe the chemistry of cold pre-stellar cores, researchers investigated Lynds 1544 and made the first-ever spatially resolved map of methanimine — a simple molecule that may be involved in the formation of amino acids in space — in this environment.
Astrochemistry at Work

The chemical structure of methanimine, CH2NH. [Ben Mills]
Today’s research article, led by Yuxin Lin (Max Planck Institute for Extraterrestrial Physics), focuses on a molecule called methanimine (CH2NH). CH2NH is the simplest molecule in a class of nitrogen-containing compounds called imines, and it’s thought to be an important stepping-stone in the creation of amino acids.
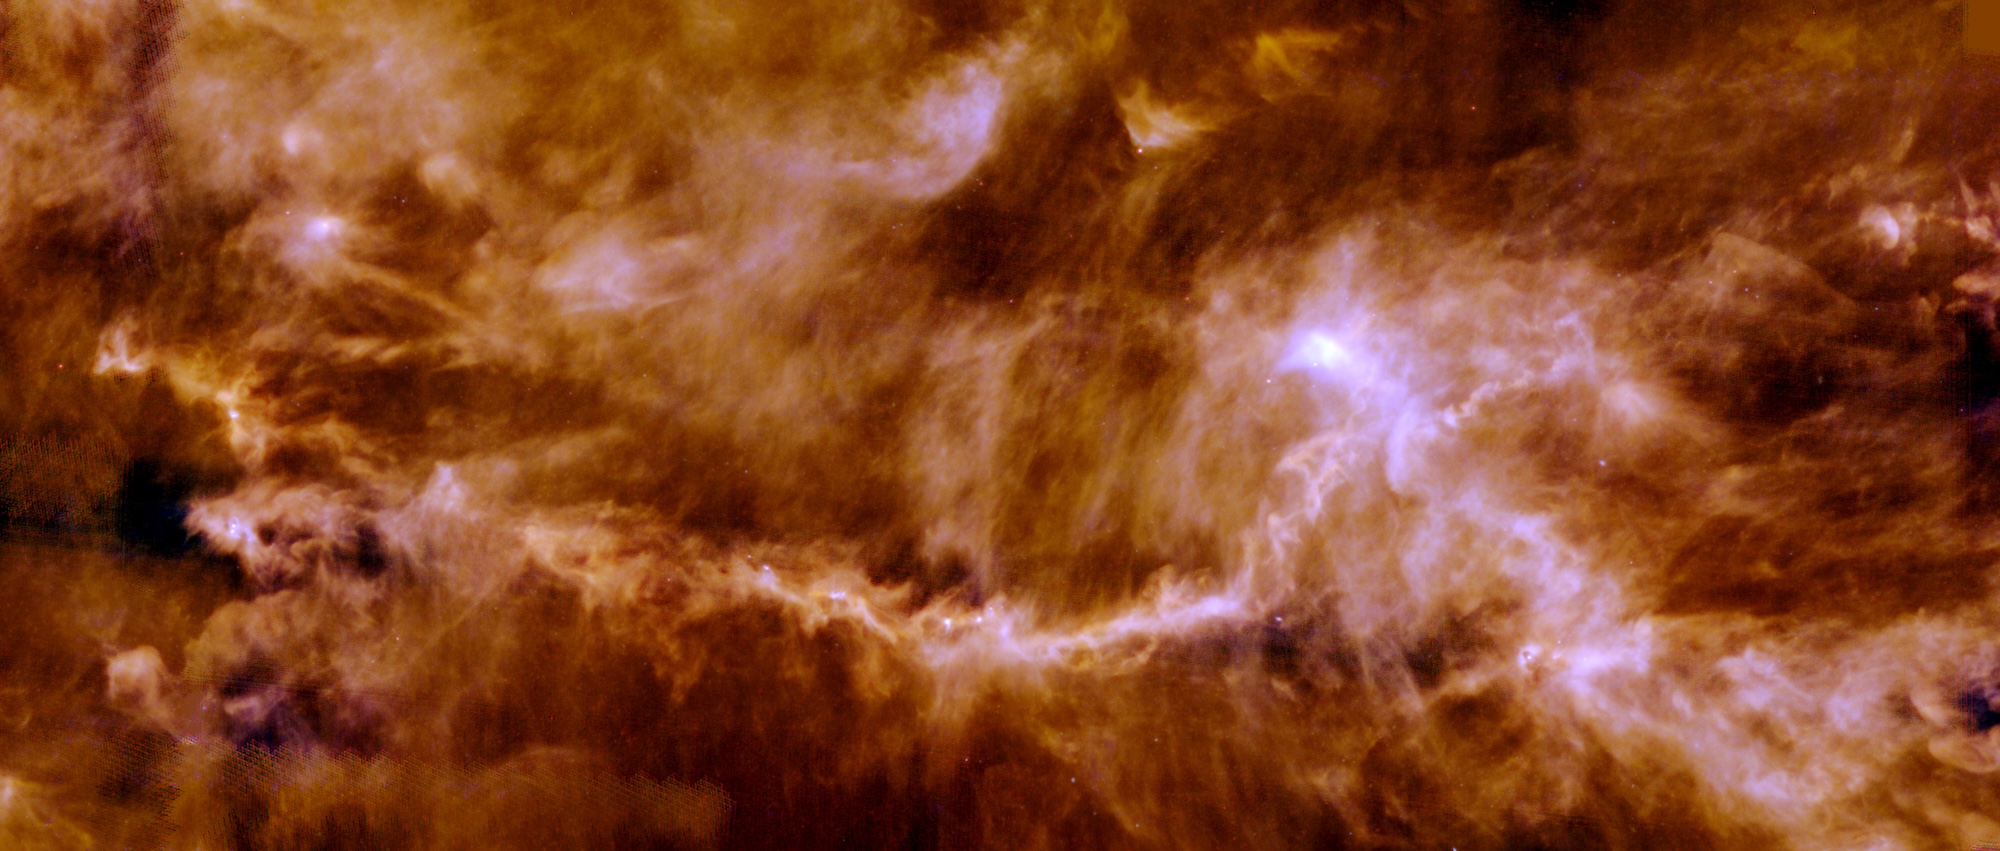
A Herschel Space Observatory view of the Taurus Molecular Cloud, where L1544 resides. This star-forming region is about 450 light-years away. [ESA/Herschel/PACS, SPIRE/Gould Belt survey Key Programme/Palmeirim et al. 2013]
First Spatially Resolved Map
Lin and collaborators searched for CH2NH within Lynds 1544 (L1544), a pre-stellar core in the nearby Taurus Molecular Cloud. Pre-stellar cores — condensed, gravitationally bound clumps of cold gas within a molecular cloud — represent an early stage in the process of star formation, just before the gas collapses to form a protostar.
L1544 has been the subject of many astrochemical investigations, and previous studies have revealed that it contains a complex, chemically differentiated envelope surrounding a dense core in which many chemical species have frozen out onto dust grains, leaving the gas depleted of these species.
Using the Institute for Radio Astronomy in the Millimetre Range 30-meter radio telescope, Lin’s team mapped the distribution of CH2NH across L1544. This isn’t the first time that CH2NH has been detected in a cold pre-stellar core, but it’s the first time that the molecule has been mapped in a spatially resolved way in such an environment. This allows researchers to compare the distribution of CH2NH to other molecules in the core and build an understanding of the chemistry behind its formation.
The Chemistry of CH2NH
Abundance of CH2NH in L1544. The contours indicate the column density of molecular hydrogen. The crosses show where the emission from other chemical species is at its peak. Click to enlarge. [Adapted from Lin et al. 2026]
In the outer layers of the core, where the gas is less dense, ultraviolet light creates reactive chemical species called radicals that can spur the formation of CH2NH. In the interior of the core, dense gas prevents the incursion of ultraviolet light. This means that few radicals are created that can help form CH2NH molecules, and the molecules that do form tend to freeze out onto dust grains, disappearing from the gas.
The discovery of CH2NH throughout L1544 suggests that the precursors to complex organic molecules can form during the cold, calm pre-stellar core phase of star formation, allowing these molecules to be inherited by nascent planetary systems.
Citation
“First Mapping of Prebiotic Molecule CH2NH in a Prestellar Core,” Yuxin Lin et al 2026 ApJL 996 L32. doi:10.3847/2041-8213/ae2c76
The post Mapping a Molecular Building Block in a Pre-Stellar Core appeared first on AAS Nova.
]]>
A chance alignment between galaxies allows astronomers to study a single star system as it was when the universe was just 6 billion years old.
The post JWST Spies a Potential Microlensed Massive Binary Star System appeared first on AAS Nova.
]]>JWST images of galaxy clusters are rich with gravitationally lensed galaxies. Recent work examines a source in a lensed galaxy that may offer a glimpse into the lives of massive stars billions of years ago.
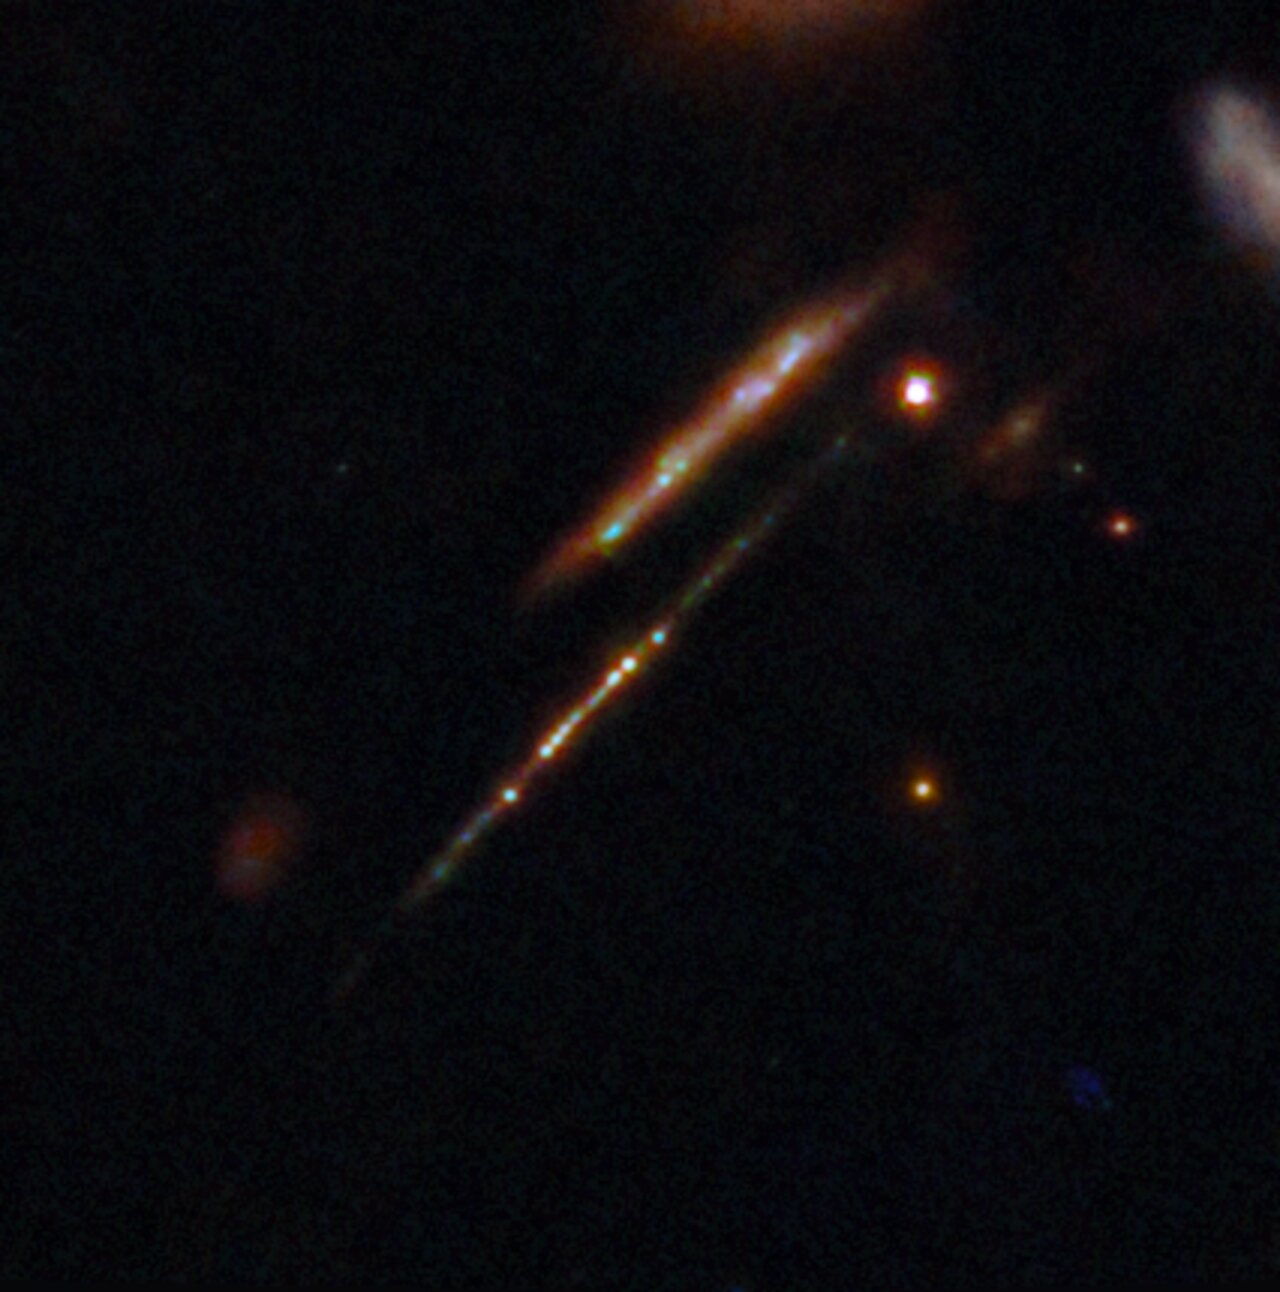
JWST image of the gravitationally lensed Cosmic Gems arc, in which multiple individual star clusters are visible. [ESA/Webb, NASA & CSA, L. Bradley (STScI), A. Adamo (Stockholm University) and the Cosmic Spring collaboration; CC BY 4.0]
Glimpses of Single Stars
Galaxy clusters, the largest gravitationally bound structures in the universe, create the conditions necessary for astronomers to perform an extraordinary feat: examine individual massive stars and star clusters at far greater distances than our telescopes can typically achieve. This is possible thanks to gravitational lensing, the bending of spacetime by an immense mass, which warps and magnifies the light from more distant objects.
These glimpses of single stars and star clusters offer a rare chance to study massive stars in our universe’s distant past directly. In particular, these observations allow us to probe whether factors like the multiplicity fraction — how many massive stars are in binary or multiple systems — have changed over cosmic time.
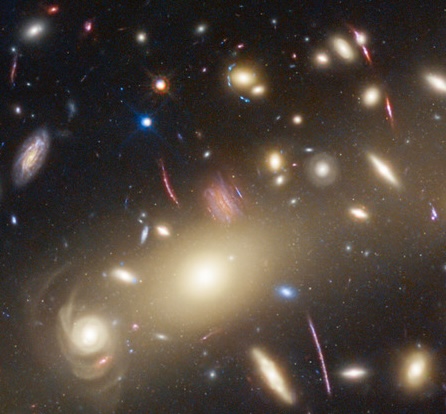
The Warhol arc is the pinkish galaxy at the center of this image. [Adapted from NASA, ESA, CSA, STScI, Jose Diego (IFCA), Jordan D’Silva (UWA), Anton Koekemoer (STScI), Jake Summers (ASU), Rogier Windhorst (ASU), Haojing Yan (University of Missouri); Image Processing: Joseph DePasquale (STScI)]
Peering Through a Gravitational Lens
In a recent research article, a team led by Hayley Williams (University of Minnesota) reported on their examination of an intriguing source in a gravitationally lensed galaxy called the “Warhol arc.” This galaxy, located at a redshift of z = 0.94 (when the universe was roughly 6 billion years old), is gravitationally lensed by the massive galaxy cluster MACS J0416.1−2403. The cluster is located at a redshift of z = 0.396, corresponding to when the universe was about 9.4 billion years old.
Using data from the JWST Prime Extragalactic Areas for Reionization and Lensing Science (PEARLS) program and the Canadian NIRISS Unbiased Cluster Survey (CANUCS), Williams’s team analyzed a source in the Warhol arc called W2, which previous work suggests is either a binary star system or a small star cluster.
Multiplicity and Microlensing
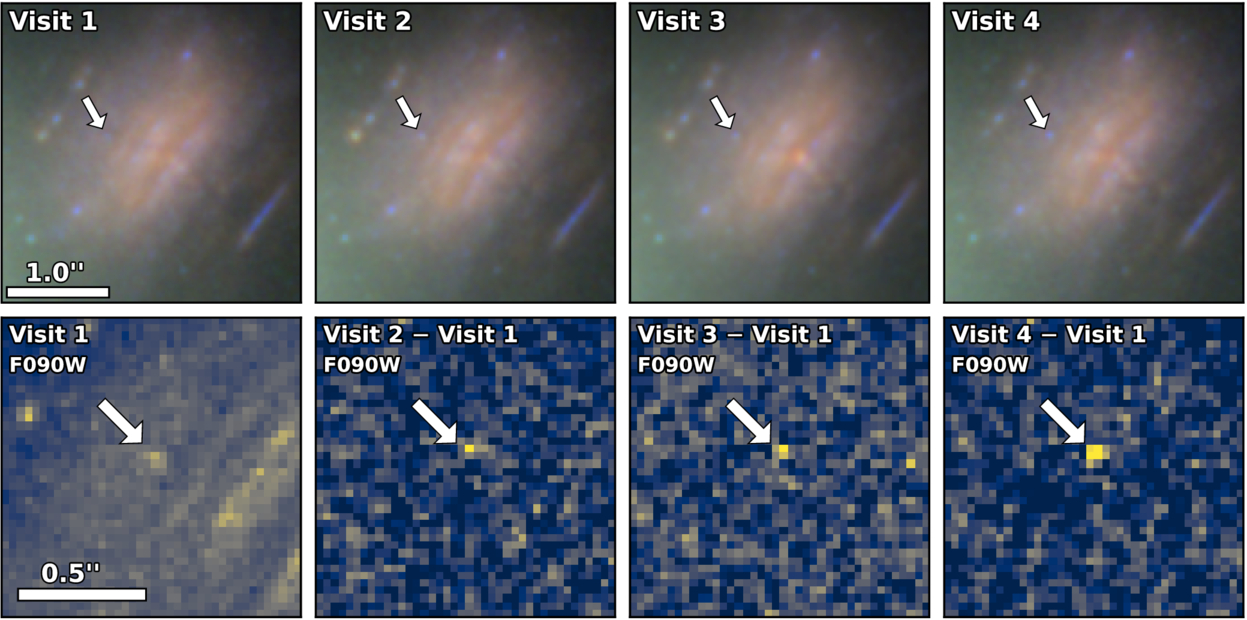
Top row: The Warhol arc during four epochs of JWST observations. Bottom row: On the left, a magnified image of W2 during the first epoch. The remaining images show the difference in brightness between subsequent epochs and the first epoch. Click to enlarge. [Williams et al. 2026]
W2 varies between observations in both brightness and color, a fact that the authors suggested is due to microlensing by a star within the lensing galaxy cluster, rather than variability within the binary system itself. Under this hypothesis, the orbital motions of the binary bring the stars across the microlensing caustic — a region in which the magnification is exceptionally high — and the brightness and color of W2 vary as the components of the binary approach and recede from the caustic.
Williams and collaborators also performed stellar population modeling to explore the binary configurations that could match the observations. They found that the stars likely have masses of 21–24 solar masses, with one being a cool red supergiant and the other a hot, main-sequence companion. Depending on the precise evolutionary stage of the binary, it’s possible that one of the stars is nearing a supernova explosion. Lending more support to the binary system hypothesis, the microlensing measurements constrain W2 to be no larger than 90 au — too small for even a compact star cluster.
The team closed by proposing further observations of W2’s position to rule out the possibility that the microlensing rate there is unusually high, an outcome that may suggest that microlensing of two unrelated stars, rather than a binary system, is responsible for these observations.
Citation
“JWST’s PEARLS: A Candidate Massive Binary Star System in a Lensed Galaxy at Redshift 0.94,” Hayley Williams et al 2026 ApJ 997 292. doi:10.3847/1538-4357/ae2003
The post JWST Spies a Potential Microlensed Massive Binary Star System appeared first on AAS Nova.
]]>
Astrobites reports on the potential habitability of Teegarden’s Star b, a promising Earth-like planet.
The post Teegarden’s Star b: (Almost) Too Hot to Handle? appeared first on AAS Nova.
]]>Editor’s Note: Astrobites is a graduate-student-run organization that digests astrophysical literature for undergraduate students. As part of the partnership between the AAS and astrobites, we occasionally repost astrobites content here at AAS Nova. We hope you enjoy this post from astrobites; the original can be viewed at astrobites.org.
Title: Near the Runaway: The Climate and Habitability of Teegarden’s Star b
Authors: Ryan Boukrouche, Rodrigo Caballero, and Neil T. Lewis
First Author’s Institution: Stockholm University
Status: Published in ApJL
To find life on other planets, we start our search for planets like Earth. (It’s the best example of a habitable planet that we know of!) Earth’s distance from the Sun allows for liquid water to exist on the surface, which is vital for life as we know it. This region, called the “habitable zone,” describes the right atmospheric conditions and proximity to its host star that a planet can have to support liquid water. Earth is also special because of its atmosphere, which contains greenhouse gases such as water vapor and carbon dioxide (CO2); these help keep the average global temperature moderate enough for life to exist.
A few factors govern the habitable zone for a given planetary system: for example, the strength of a star’s radiation, the composition of the planet’s atmosphere, and a planet’s orbital period around its star. This is because a planet’s “energy budget” is dictated by these factors. For a planet to have a “stable” climate, the energy it receives from its star must balance the energy it re-emits. For instance, in a given planetary system, the closer a planet’s orbit is to its host star, the more sunlight it receives and therefore the more energy it must radiate away. This balance is between outgoing longwave radiation, which is heat emitted by the planet, and absorbed/incoming shortwave radiation, which is the sunlight the planet receives from its host star.
Some Earth-like analog planets have piqued the interest of astronomers because observations suggest that they lie within the habitable zones of their respective stars. One system, named after its discoverer, Bonnard Teegarden, features an M-dwarf star with three orbiting Earth-mass planets. It exists about 12.5 light-years away, making it one of the closest planetary systems to us. One of the planets, Teegarden’s Star b, is believed to have very similar characteristics to Earth: a radius of 1.02 REarth and a mass of 1.16 MEarth. Because the planet orbits an M-dwarf star, which is much cooler (temperature-wise) and less massive than our Sun, the planet’s orbit is much, much smaller than Earth’s, with a semimajor axis of 0.0259 au (compared to 1 au for Earth) and an orbital period of 4.9 days (compared to 365 days for Earth).
The authors of today’s article explore how close Teegarden’s Star b is to its habitable zone based on current observations, and how future observations could lead to vastly different interpretations of its habitability.
Exoplanets are small and faint, making it difficult for current technology to study their atmospheres accurately. Modern simulations, known as general circulation models, can model how a planet’s atmosphere might behave under various assumptions. Isca, the climate and atmospheric dynamics model used in this article, has been used to model exoplanetary atmospheres in previous studies. Modeling a planet around an M-dwarf, the authors tried matching the planet’s properties as closely as possible to Earth, using a simple cloud model (which is challenging to model), moist physics (since our atmosphere contains water vapor), and a radiative transfer scheme. In their simulation, the authors also assumed that Teegarden’s Star b is tidally locked, meaning its dayside always faces its sun. For example, our Moon always shows the same side to us on Earth and is considered tidally locked.
They also assigned Teegarden’s Star b a similar atmospheric composition to Earth: 78% nitrogen (N2), 28% oxygen (O2), and a CO2 concentration of 400 parts per million by volume (ppmv). Unlike Earth, they did not include an ozone layer; however, they state that including one did not significantly change the results. Combinations of these different factors were run for 8–41 Earth years, until the Teegarden’s Star b model either reached a stable state (where the energy balance equals 0 W/m²), or it exceeded the runaway greenhouse gas threshold — the point at which the energy balance exceeds zero, and the planet’s surface temperature increases uncontrollably.
The average amount of radiation that a planet receives is called its instellation, or sometimes “insolation” when talking about our Sun. For reference, Earth has an insolation value of around 1365 W/m². Different studies of Teegarden’s Star b suggest an instellation of 1481 W/m² or 1565 W/m², so the authors multiple values in that range (see Fig. 1).
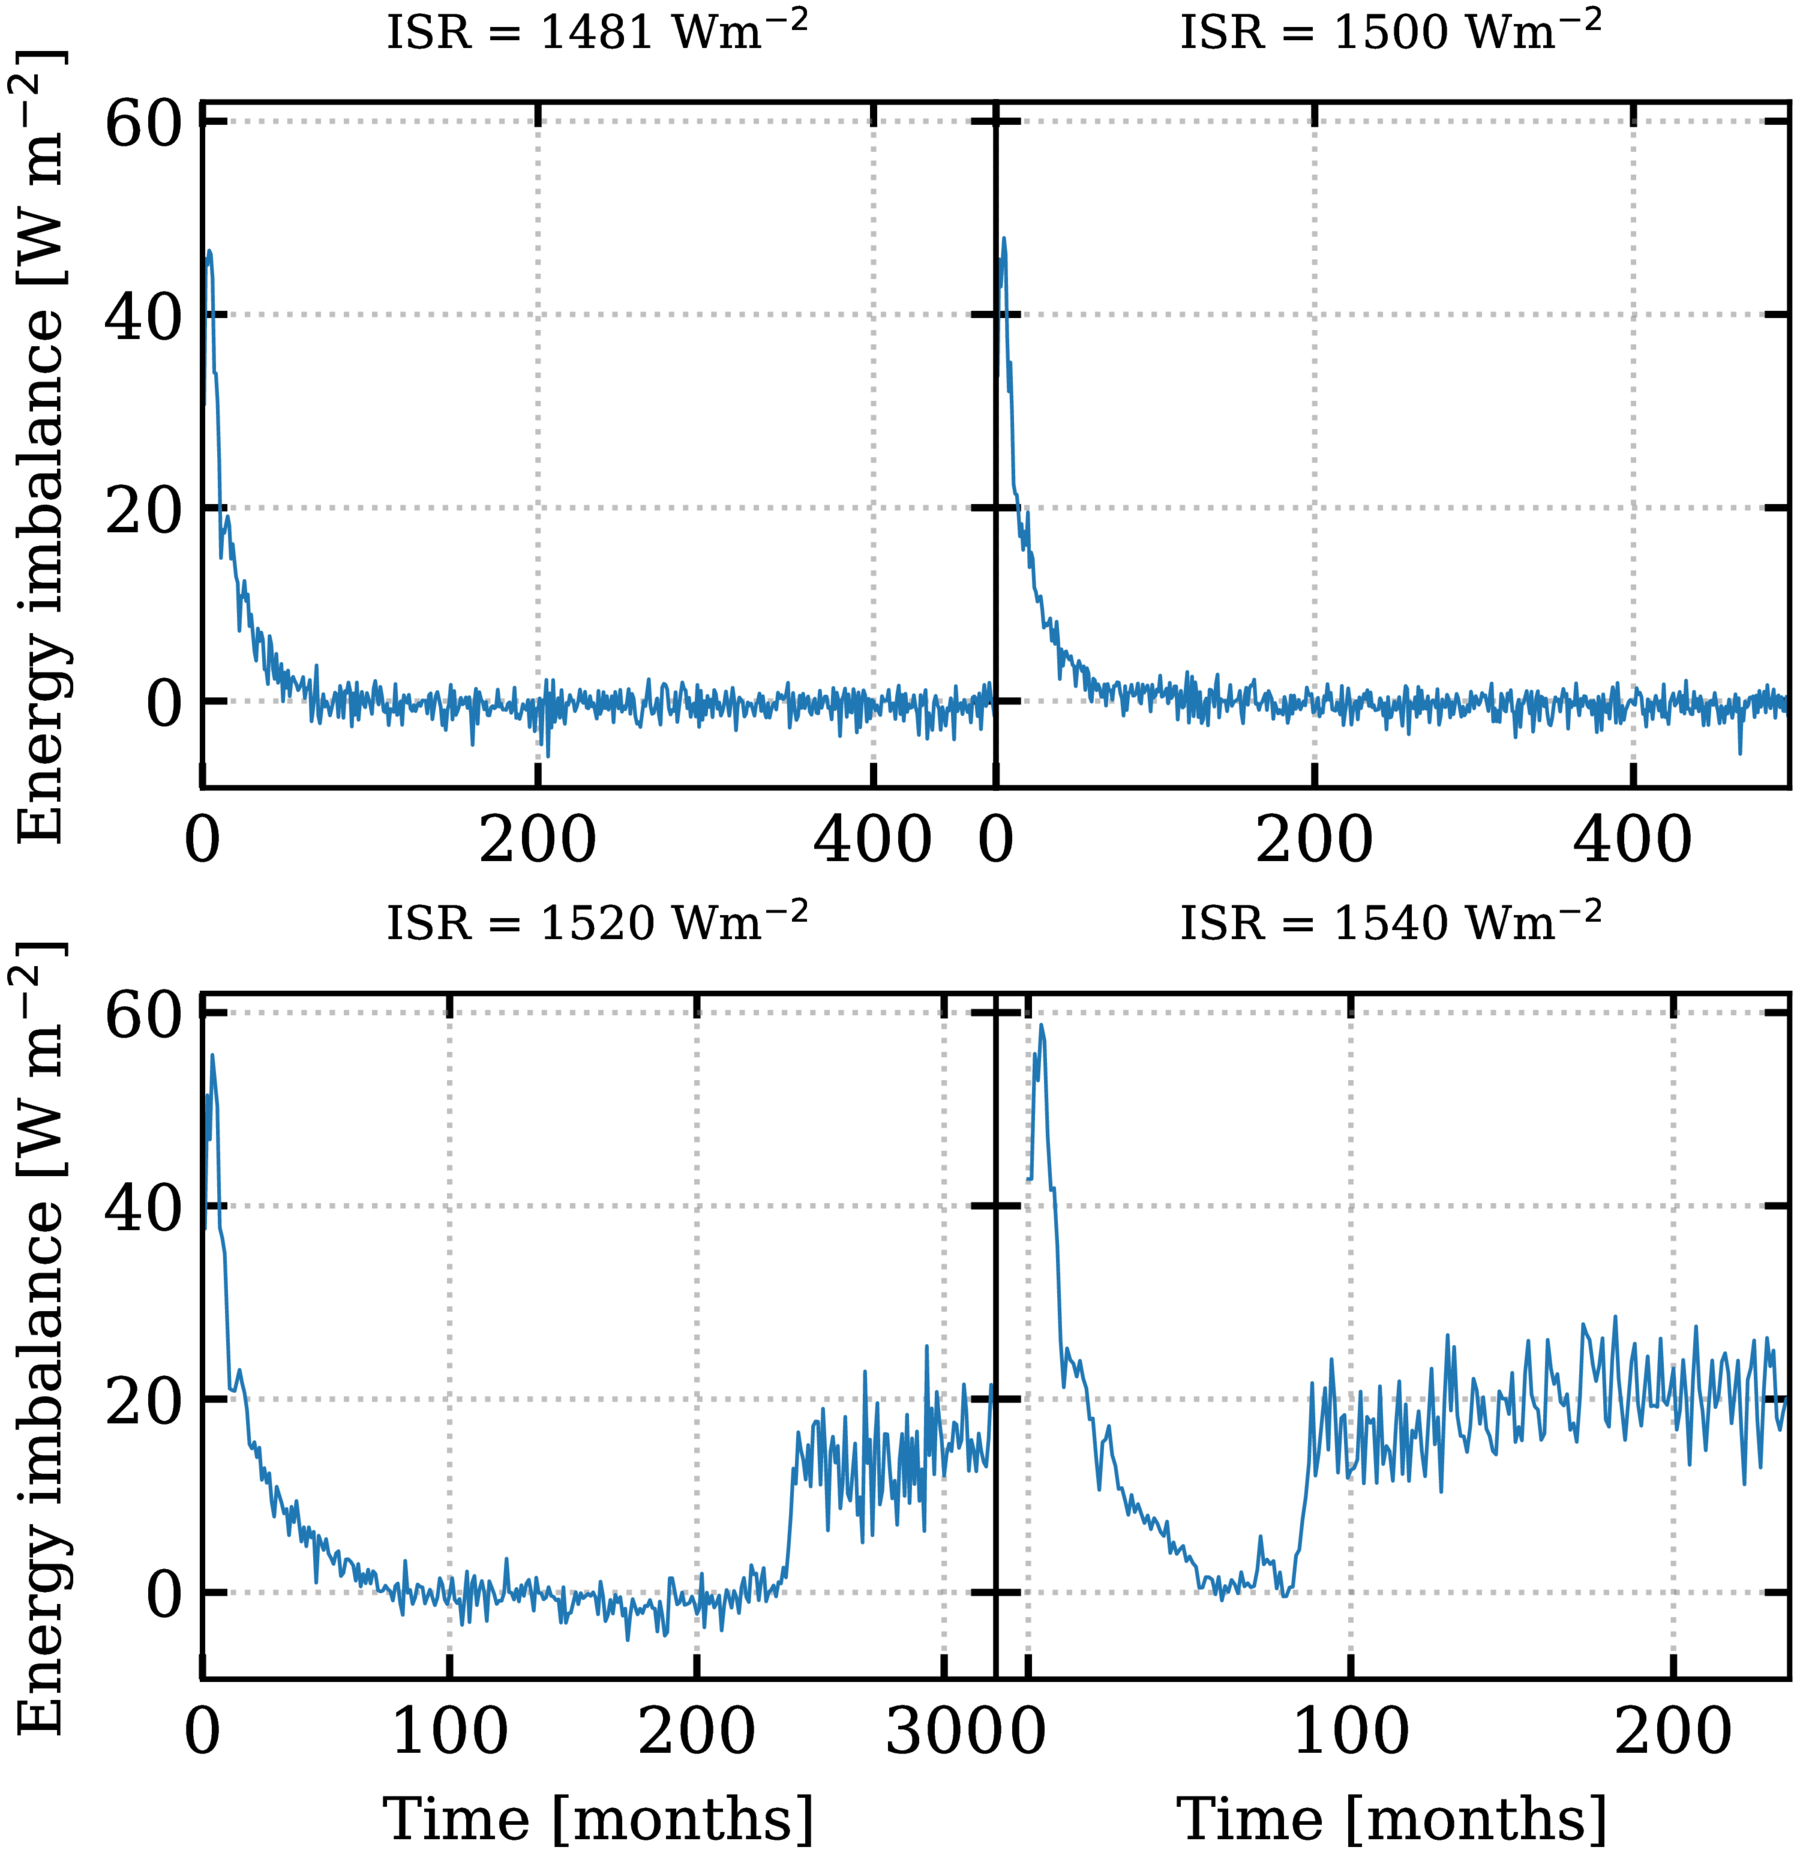
Figure 1: For a surface albedo of 0.07 (ocean-dominated), the energy balance for each tested instellation (ISR; 1481–1540 W/m²) is shown. As time increases, a stable atmosphere would consistently reach an energy imbalance value of 0 W/m². In contrast, an unstable (runaway greenhouse) atmosphere would have a value greater than 0 W/m², indicating that it is receiving more energy than emitting. [Boukrouche et al. 2025]

Figure 2: The global mean surface temperature (top) and planetary albedo (bottom) of Teegarden’s Star b are shown with various instellation values. The filled markers represent models that reached an equilibrium, or stable, state, whereas the empty markers are models that reached a runaway, uninhabitable state. The two vertical black lines represent the two main instellation estimates of 1481 and 1565 W/m². Once the models exceed the ~1520 W/m² instellation value, they start to fail and reach a runaway greenhouse effect. [Boukrouche et al. 2025]
Original astrobite edited by Joe Williams.
About the author, Mckenzie Ferrari:
I’m currently a PhD student in the geophysical sciences program at the University of Chicago. While I now study the atmosphere and oceans of Earth, most of my previous research focused on simulations of Type Ia supernovae and galaxy formation and evolution. In my free time, I foster cats for a local organization, enjoy cooking, and can often be found running along Lake Michigan.
The post Teegarden’s Star b: (Almost) Too Hot to Handle? appeared first on AAS Nova.
]]>
How has the Crab Nebula supernova remnant changed since the Hubble Space Telescope observed it in 1999–2000?
The post Featured Image: Hubble Revisits the Crab Nebula appeared first on AAS Nova.
]]>In 1999–2000, the Hubble Space Telescope captured what was then the most detailed image ever taken of the Crab Nebula. In the quarter-century since the release of that image, the nebula — the remnant of a star observed to explode as a supernova in July 1054 — has been slowly unfurling and changing as the ejected stellar material expands into space. Now, as reported in a research article by William Blair (Johns Hopkins University) and collaborators, astronomers have turned Hubble’s inquisitive eye toward the Crab Nebula once again. One of the new images is shown above (click for the full view!). By comparing the new and old Hubble images, Blair’s team uncovered dramatic changes in the nebula’s intricate filamentary structure. These changes are due to the nebula’s three-dimensional expansion as well as evolution in the density of its knots and filaments. To learn more about the new Hubble portrait of the Crab Nebula, be sure to check out the full article linked below.
Citation
“The Crab Nebula Revisited Using HST/WFC3,” William P. Blair et al 2026 ApJ 997 81. doi:10.3847/1538-4357/ae2adc
The post Featured Image: Hubble Revisits the Crab Nebula appeared first on AAS Nova.
]]>
A recent study looks to the nearest rubble-ridden systems for the potential origins of interstellar objects that have visited our solar system.
The post We Have Visitors: Interstellar Material from Nearby Debris Disks appeared first on AAS Nova.
]]>Traversing the galaxy from places yet known, a few interstellar objects have taken a quick dip into our solar system. These objects have inspired a frenzy of questions regarding their origins and paths that led them here. A recent study took to nearby planet-forming stellar systems as possible launching posts.
Interstellar Object Origins
As 3I/ATLAS was first spotted entering the solar system in July 2025, all eyes turned to the curious interstellar visitor. Just the third interstellar object astronomers have observed, 3I/ATLAS joins 1I/ʻOumuamua (2017) and 2I/Borisov (2019) in capturing our attention and igniting many questions regarding their origins and journeys to our corner of the Milky Way. While astronomers have characterized these objects’ compositions, sizes, and paths through the solar system, the mechanisms by which these objects leave their origin systems and travel the galaxy before arriving here are not well constrained.
These three large bodies are just part of the interstellar material visiting the solar system — spacecraft have detected an influx of small interstellar dust particles, and while not yet directly confirmed, interstellar meteoroids burning up in Earth’s atmosphere are possible. This loose material likely originates in dusty, planet-forming disks (debris disks) around stars — rubble kicked out into interstellar space, sending chemicals, organic compounds, and perhaps even the precursors of life to other nearby systems. Understanding the origins and trajectories of such material will allow us to investigate planet formation and how developing systems may impact their environments.
Deliveries from Debris Disks
Debris disks offer ideal testbeds for tracing small bodies and dusty material through the galaxy. Interactions with large planets in debris disks can launch loose material like planetesimals and dust into interstellar space. To explore how debris disks may drive interstellar visitors to our solar system, Cole R. Gregg and Paul A. Wiegert (The University of Western Ontario) simulated how much material the 20 nearest debris disks would contribute to the interstellar object population of our solar system.

Arrival direction on the sky for particles that reach the solar system from the 20 debris disks studied here. The arrival locations for 1I/ʻOumuamua, 2I/Borisov, and 3I/ATLAS are shown for comparison. Click to enlarge. [Gregg and Wiegert 2025]
Trickier to spot, smaller meteoroids (≥200 microns) that would appear as meteors in Earth’s atmosphere are also expected. The only way to observationally confirm interstellar origins for meteors is based on how fast they are moving relative to the material in our solar system, or their excess velocities. Based on the simulations, many of these smaller particles have low excess velocities, making them observationally difficult to distinguish from bound solar system objects.
Observational Connections and Expectations

Zoomed-in view focusing on the direction where 1I/ʻOumuamua entered the solar system. The interstellar object falls near the arrival directions of particles from HD 38858 and HD 166. Click to enlarge. [Gregg and Wiegert 2025]
Where are the expected interstellar meteoroids? Current meteor detectors including the Canadian Meteor Orbit Radar (CMOR) and the Global Meteor Network (GMN) search the sky for incoming material. While the simulations predict hundreds of meteoroid-sized particles from each debris disk currently in the inner solar system, the small collecting area of CMOR and the limiting size of grains detectable by GMN statistically require decades of observations to detect even a single interstellar meteoroid. Thus, the lack of detections thus far is not surprising, but with advanced instrumentation, discoveries of more interstellar particles and objects are imminent.
Citation
“A Catalogue of Interstellar Material Delivery from Nearby Debris Disks,” Cole R. Gregg and Paul A. Wiegert 2025 PSJ 6 309. doi:10.3847/PSJ/ae284f
The post We Have Visitors: Interstellar Material from Nearby Debris Disks appeared first on AAS Nova.
]]>
The upcoming Vera C. Rubin Observatory Legacy Survey of Space and Time will detect an astonishing number of transients — including kilonovae from colliding neutron stars.
The post How Many Kilonovae Will Rubin Observatory Help Us Spot? appeared first on AAS Nova.
]]>The detection of gravitational waves and light from a single source was one of the most important discoveries of the gravitational wave era. Can upcoming data from Vera C. Rubin Observatory help astronomers repeat that feat?
These images from the Hubble Space Telescope show the fading light of the kilonova associated with the gravitational wave event GW170817. [NASA and ESA Acknowledgment: A. Levan (U. Warwick), N. Tanvir (U. Leicester), and A. Fruchter and O. Fox (STScI)]
Not Yet Repeated
When two neutron stars merge, the collision sends ripples through spacetime and generates an electromagnetic signal called a kilonova. In 2017, researchers detected gravitational waves and kilonova emission from colliding neutron stars — the first and, to date, only electromagnetic signal definitively associated with a gravitational wave event.
In a research article published this week, a team led by Simon Stevenson (Swinburne University of Technology; OzGrav) considered how the much-anticipated Legacy Survey of Space and Time (LSST), carried out by Rubin Observatory, can enhance our ability to detect kilonovae and pair them with their gravitational wave counterparts.
Survey Simulations
When a new gravitational wave signal is detected, researchers rush to search for an electromagnetic counterpart to the signal. While Rubin Observatory can aid this type of reactive search, Stevenson’s team focused on a different strategy: spotting kilonovae during routine survey operations and using these detections to trigger a targeted hunt through gravitational wave data, searching for signals missed by automated detection algorithms.
Over the 10-year course of LSST, Rubin will scan the visible southern sky every few days, uncovering a wide variety of transient sources such as supernovae, novae, and tidal disruption events. Because Rubin will amass a huge amount of data each night, astronomers worldwide will use data brokers to pass along the most promising signals. Stevenson’s team used for their analysis a bespoke and modular data broker called Fink. Fink currently handles 200,000 alerts per night from the Zwicky Transient Facility and will be scaled up to handle 10 million alerts per night as Rubin requires.
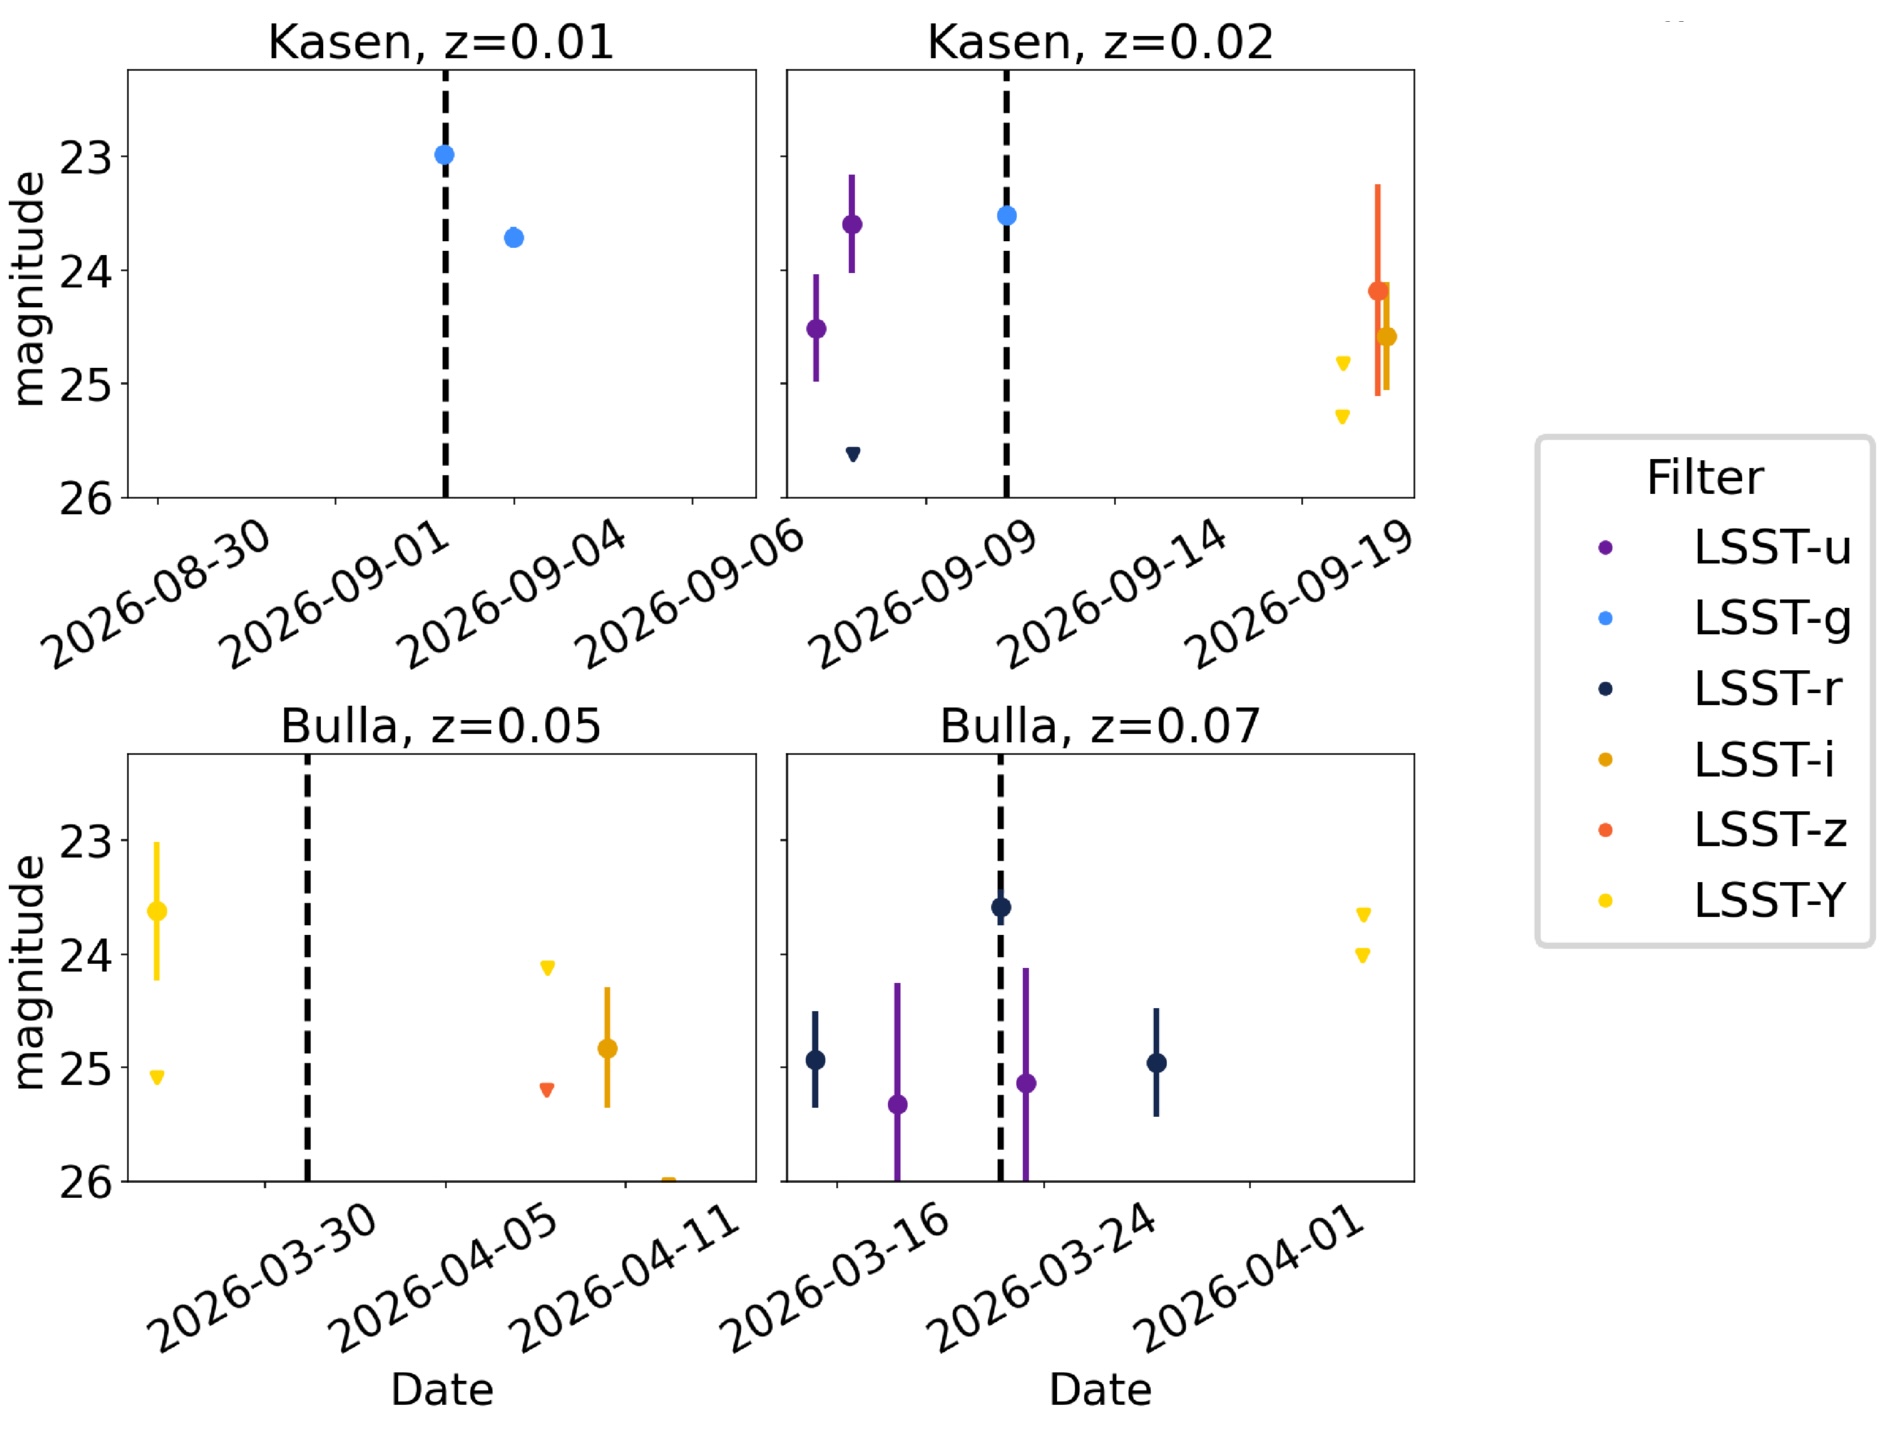
Examples of simulated kilonova light curves for different redshifts and models (Kasen and Bulla). Click to enlarge. [Adapted from Stevenson et al. 2026]
Searching for Signals
Though Rubin is a transient-tracking powerhouse, it’s not ideally suited to discovering kilonovae specifically; these events evolve so rapidly that Rubin may only be able to collect a few data points before the event fades from its view. To gauge Rubin’s efficacy as a kilonova detector, Stevenson and collaborators simulated kilonova light curves and identified detections with a signal-to-noise ratio greater than 5; these detections will be passed to the data broker. They found that Rubin will detect about 42 kilonovae per year, but only a few will have a strong enough signal to be passed to the broker.
For the handful of detections that are passed to the broker, what are the prospects for tracking down the associated gravitational wave signals? Due to the survey cadence, most kilonova detections occurred 1–2 days after the gravitational waves from the neutron star collision would have reached Earth, but delays of up to 5 days were possible. This means that searches for gravitational wave signals must sift through multiple days of data — a computationally intensive prospect that might require the development of new search techniques. The computational requirements of this search are increased by the possibility of contaminants (signals misclassified as kilonovae and passed on by the data broker), which will require additional followup.
Despite these challenges, it’s clear that Rubin’s upcoming detections of kilonovae will advance our study of these rare events. With LSST expected to get underway early this year, the next multi-messenger signal may be just around the corner.
Citation
“Strategy for Identifying Vera C. Rubin Observatory Kilonova Candidates for Targeted Gravitational-Wave Searches,” Simon Stevenson et al 2026 ApJ 998 8. doi:10.3847/1538-4357/ae244e
The post How Many Kilonovae Will Rubin Observatory Help Us Spot? appeared first on AAS Nova.
]]>
Astrobites reports on RACS J0320−35, a quasar that appears to be breaking a cosmic limit by consuming matter faster than theory should allow.
The post The Winner of the Cosmic Speed-Eating Contest appeared first on AAS Nova.
]]>Editor’s Note: Astrobites is a graduate-student-run organization that digests astrophysical literature for undergraduate students. As part of the partnership between the AAS and astrobites, we occasionally repost astrobites content here at AAS Nova. We hope you enjoy this post from astrobites; the original can be viewed at astrobites.org.
Title: X-Ray Investigation of Possible Super-Eddington Accretion in a Radio-Loud Quasar at z = 6.13
Authors: Luca Ighina et al.
First Author’s Institution: Harvard–Smithsonian Center for Astrophysics and Italian National Institute for Astrophysics
Status: Published in ApJL
Quasars are some of the most extreme objects in the entire universe. Despite being as far as tens of billions of light-years away, they nonetheless can appear as bright as some stars in our own Milky Way. To put their brightness in perspective, one just has to consider the Sun. Compared to puny human scales, our star is a truly gargantuan object. It’s a fully functional fusion reactor, churning hydrogen into helium in its core and outputting an unfathomable amount of energy in the process. This glowing furnace is so bright that it can cook us with the heat of an oven during the day, even at a distance of more than 90 million miles (about 8 light-minutes). That distance dramatically dilutes the radiation of the Sun by the time it reaches us, as we only receive a small sliver of its total output, and yet we can still feel its heat pounding down on us when we stand beneath a clear summer sky.
However, if one were to move the Sun about 30 light-years away, it would appear completely unremarkable. You’d need to be under relatively dark skies to even spot it! The vastness of space would simply crush the output of our solar engine; however, if you place a luminous quasar at that same 30 light-year distance, its searing radiation would seem to effortlessly cross the cosmic gulf looming between the stars, scorching us relentlessly with the same heat as the Sun does today. The power of a quasar simply puts our star to shame.
Still, even quasars have limits. The source of power for these objects is a supermassive black hole. The supermassive black hole that lives at the center of our Milky Way is currently dormant. However, many supermassive black holes (especially in the early universe) actively gulp down matter, releasing tremendous energy that escapes in the form of radiation across the electromagnetic spectrum. The escaping photons bump into particles on their way out, exerting an outward pressure. If enough light is unleashed by the quasar, this pressure will actually balance against the pull of gravity, cutting off the food supply for the black hole. This negative feedback loop means that a given quasar has an upper limit to its brightness, called the Eddington luminosity, and to the speed at which it accretes matter, called the Eddington rate. The authors of today’s bite examine a particularly misbehaved quasar that seems to violate even these extreme limits.
It’s a Bird! It’s a Plane! It’s a Jet?
The authors observed the quasar RACS J032021.44−352104.1 (RACS J0320−35 for short) with several radio observatories, including the Giant Metrewave Radio Telescope, the Australia Telescope Compact Array, and the Australian Large Baseline Array. Combining this data with publicly available observations, they find that the source is “radio-loud,” or bright at very long wavelengths. Typically, this kind of emission is expected to be generated by powerful jets that are ejected from the poles of a quasar. For example, the authors compare this radio-loud quasar to similar sources, which show significant variability in the X-ray part of the spectrum. This is a tell-tale sign that the X-ray emission is also generated by these jets (which might come out in fits and spurts and thus cause fluctuations in brightness over time).
However, when the authors examine X-ray data of RACS J0320−35 taken by the Chandra X-ray Observatory, they find surprising results. The quasar is extremely luminous in X-rays, making it one of the brightest in the early universe. But despite the fact that it pumps out a huge number of these energetic photons, it seems to preferentially emit only the lower-energy band of X-rays and completely lacks the highest-energy emission that characterizes similar sources. In technical terms, the X-ray spectrum of RACS J0320−35 is incredibly “soft.” Moreover, this X-ray emission seems to be constant on the timescale of months, though further observations will be required to test if it varies on longer timescales. Still, the softness of the spectrum and weak variability of this system mean that its X-ray emission is unlikely to be produced by a jet.
The authors carefully consider a particular variety of jet — one that is sharply angled towards us. Since quasar jets often travel at incredible speeds, the special theory of relativity kicks in and causes strange behaviors. In particular, an effect called relativistic beaming can cause a source to appear much brighter if traveling towards the observer at extremely high speeds. However, they find that although relativistic beaming can explain the mysterious X-ray properties of RACS J0320−35, such a scenario is incompatible with its observed radio emission. Moreover, a lack of gamma-ray emission and weak variability are further pieces of evidence against the jet origin of the X-ray emission.
Limits Are Meant to Be Broken
The article presents one more fascinating possibility for the origin of the X-rays in this source. Some theoretical work and simulations show that if a black hole breaks the Eddington limit and starts accreting matter at “super-Eddington rates,” the X-ray spectrum that results can be incredibly soft. The authors find excellent agreement between the observations and the predictions from a particular model that simulates a very slowly spinning black hole (see Figure 1). This scenario seems to be a promising explanation for the X-ray emission in RACS J0320−35, which is extremely exciting for several reasons.
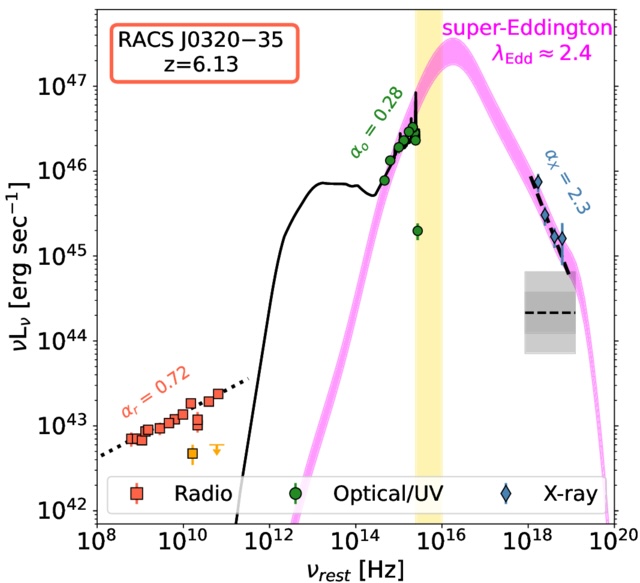
Figure 1: A plot showing the observed energy spectrum of RACS J0320−35 and the theoretical spectra predicted by several models. In particular, the green circles (visible light and ultraviolet (UV) emission), blue diamonds (X-ray emission), and red squares (radio emission) represent the real observations. The shaded pink region represents the predictions of a model that simulates a black hole spinning very slowly and accreting at super-Eddington rates. The model seems to match the observed X-ray and visible/UV emission excellently. However, explaining the observed radio emission might require conditions that violate the assumptions behind this scenario. [Adapted from Ighina et al. 2025]
Despite the promising initial results of this model, there are a few caveats to the results presented in today’s article. For example, the radio jets observed from this source require a rapidly spinning black hole, which conflicts with the model assumptions. The authors note that a radio jet can be very far from a black hole, tracing its past activity. In fact, this jet may have actually spun down the central supermassive black hole by extracting energy from it, a fascinating possibility that will require both further observations and simulations to explore. Today’s bite shines a brilliant light on this possibility by analyzing RACS J0320−35, a fascinating quasar in the early universe and a stunning example that cosmic limits are meant to be broken.
Original astrobite edited by Veronika Dornan.
About the author, Ansh Gupta:
I’m an astronomy graduate student at the University of Texas at Austin working with Steven Finkelstein. I use data from JWST to study the formation and growth of the first galaxies and black holes in the universe. In my spare time, I enjoy playing piano, reading, and making YouTube videos.
The post The Winner of the Cosmic Speed-Eating Contest appeared first on AAS Nova.
]]>
Researchers examine whether the black holes at the centers of little red dots could have been born in the collapse of dark matter halos.
The post A Dark Matter Origin for Little Red Dots appeared first on AAS Nova.
]]>New research suggests that the mysterious “little red dots” spotted in the early universe could be supermassive black holes birthed in the collapse of dark matter halos.
Another Theory for Little Red Dots
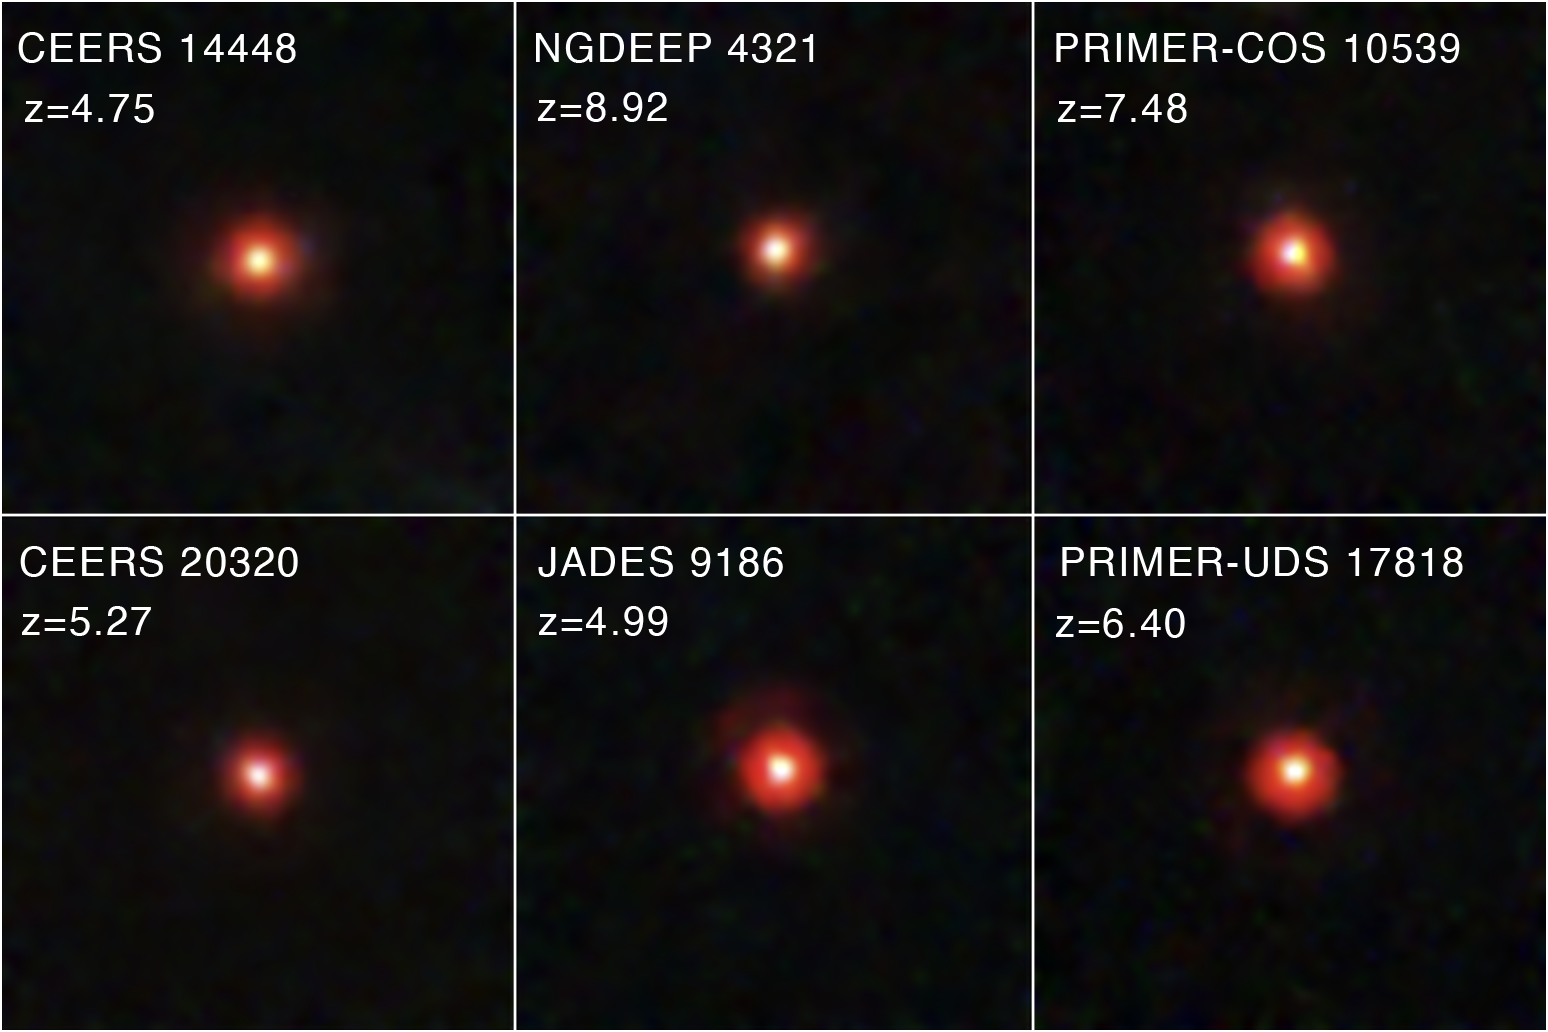
JWST images of six very distant galaxies dubbed “little red dots.” [NASA, ESA, CSA, STScI, Dale Kocevski (Colby College)]
A recent research article explores that theory, with a twist: that the black holes at the heart of little red dots were born not out of regular, baryonic matter, but out of dark matter.
A Dark (Matter) Past
In the early days of the universe, tiny fluctuations in the density of dark matter began to grow, eventually collapsing into vast spheroidal structures called dark matter halos. In the leading theory of cosmology, ΛCDM, dark matter interacts with itself and normal matter only through gravity. This leads to the creation of stable dark matter halos that act as the invisible scaffolding within which the first stars and galaxies grow.
In today’s article, Fangzhou Jiang (Peking University) and collaborators investigated the evolution of halos containing self-interacting dark matter. Particles of self-interacting dark matter, as the name suggests, can interact with one another through collisions and exchange heat. This small adjustment, sometimes invoked in alternatives to ΛCDM to explain the properties of dwarf galaxies, can lead to the collapse of dark matter halos into black holes.
Seeding Black Holes
Jiang and coauthors examined whether this process could explain the observed population of little red dots. First, the team examined whether the timescales are feasible: is it possible for dark matter to assemble itself into massive halos and collapse into black holes, all within the first billion years of the universe?
The answer appears to be yes — in this framework, dark matter halos with masses between 106.5 and 108.5 solar masses were able to form black holes between 104.5 and 106.5 solar masses by a redshift of z = 8.5, when the universe was just 600 million years old.
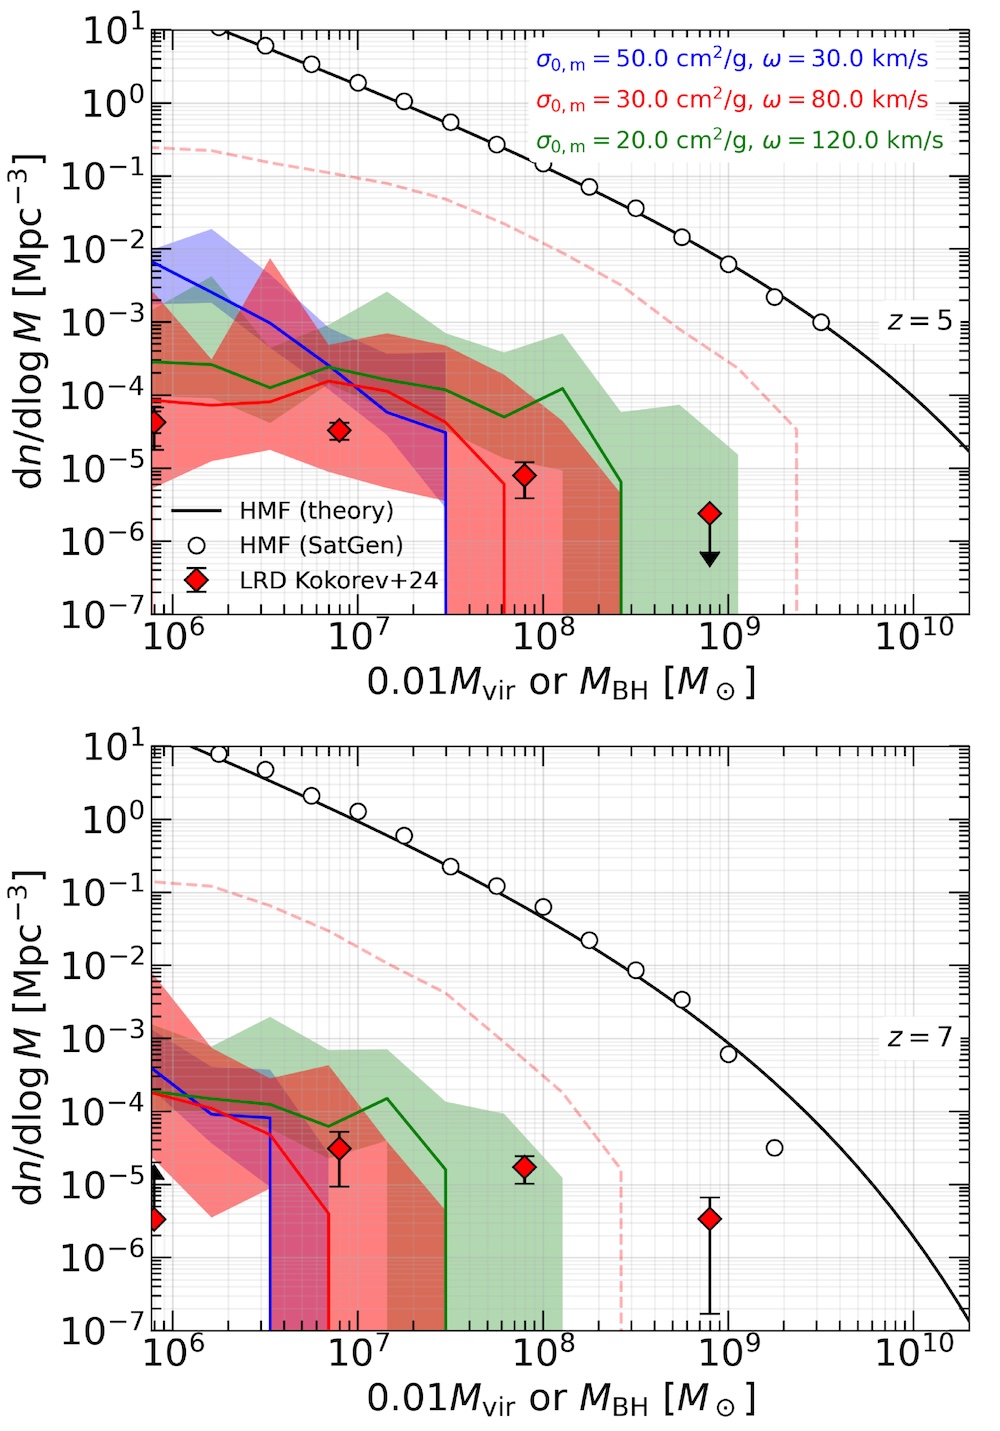
Comparison of the inferred black hole population in little red dots (red diamonds) to models of black holes formed in dark matter halo collapse (shaded areas) at two redshifts. The red area shows the fiducial model, while the blue and green areas show the effects of changing the dark matter self-interaction cross-section. The dashed red lines show an extreme case in which the presence of baryons accelerates halo collapse. Click to enlarge. [Jiang et al. 2026]
To close, Jiang and collaborators noted that this process is not mutually exclusive with other black hole seeding mechanisms, and as studies of self-interacting dark matter continue, its ability to create black holes in the early universe should be examined further.
Citation
“Formation of the Little Red Dots from the Core Collapse of Self-Interacting Dark Matter Halos,” Fangzhou Jiang et al 2026 ApJL 996 L19. doi:10.3847/2041-8213/ae247a
The post A Dark Matter Origin for Little Red Dots appeared first on AAS Nova.
]]>
Researchers use an unlikely tool — distant beacons called quasars — to study the constant inflow and outflow of gas to and from our galaxy.
The post Fueling Up: How Does the Milky Way Get Its Star-Forming Gas? appeared first on AAS Nova.
]]>New research uses distant sources to investigate a question close to home: how the Milky Way replenishes its supply of star-forming gas.
Dynamic Galaxies

This Hubble Space Telescope image shows UGC 12158, a barred spiral galaxy that is likely very similar to the Milky Way. This image also features an asteroid streaking across the top of the galaxy. [NASA, ESA, Pablo García Martín (UAM)]
This interplay of inflowing and outflowing gas has important implications for a galaxy’s ability to form stars; without a way to resupply, galaxies would soon run out of star-forming gas. In a research article published this week, astronomers investigate one channel through which our own galaxy maintains its supply of star-formation fuel.
Quasars Lend a Hand
To learn more about how the Milky Way collects and incorporates new star-forming material, a team led by Hannah Bish (Space Telescope Science Institute; University of Washington) studied the low-velocity gas flowing into and out of our galaxy at the disk–halo interface. This interface is a transitional region in which gas from the Milky Way’s expansive, diffuse halo is incorporated into the disk, where it can condense into stars.
This Hubble image shows the quasar 3C 273. [ESA/Hubble & NASA; CC BY 4.0]
Complex Inflows and Outflows
The team used spectra of 132 quasars and ground-based measurements of neutral hydrogen to identify and disentangle the motions of gases with different temperatures and compositions. Along 67% of the lines of sight, Bish and collaborators found evidence for both inflowing and outflowing gas, suggesting that these processes occur simultaneously.

Infall velocities for the northern (top) and southern (bottom) hemispheres of the Milky Way. The infall velocities in the southern hemisphere are roughly equal regardless of direction, denoted by color, or the ionization energy of the ion being studied. By contrast, the northern hemisphere shows dramatically different behavior with direction and ionization energy. Click to enlarge. [Bish et al. 2026]
Bish’s team explored these results using a simple model of the Milky Way, which they found could largely reproduce the behavior in the southern hemisphere, but not the more complicated findings from the northern hemisphere. They suggested that the difference in behavior between the cooler and warmer gas could be evidence that accretion in the northern hemisphere occurs in patches, and that warm inflowing gas is piling up and cooling where it collides with denser gas at the disk–halo interface.
Looking forward, Bish’s team anticipates that high-resolution models — and more quasar observations to constrain those models — will be key to uncovering the causes of this curious behavior.
Citation
“Differential Accretion of Ionized Low-Velocity Gas at the Milky Way’s Disk–Halo Interface,” Hannah V. Bish et al 2026 ApJ 997 230. doi:10.3847/1538-4357/ae2741
The post Fueling Up: How Does the Milky Way Get Its Star-Forming Gas? appeared first on AAS Nova.
]]>
The discovery of interstellar comet 3I/ATLAS was one of the top astronomy stories of 2025. Though the comet is now heading back to interstellar space, research into its properties and origins continues.
The post Monthly Roundup: Interstellar Visitor 3I/ATLAS appeared first on AAS Nova.
]]>Editor’s Note: After a short hiatus, the Monthly Roundup is back! This series of articles, which began in 2023, examines multiple perspectives or findings on a single topic.
Interstellar object 3I/ATLAS’s trajectory through the solar system. Click to enlarge. [NASA/JPL-Caltech]
Last summer, professional and amateur astronomers worldwide rolled out the red carpet in 3I/ATLAS’s honor, enlisting a pack of ground-based and spacefaring paparazzi to capture its every move. Observations in the first few months after 3I/ATLAS’s discovery revealed cometary features, including a fuzzy coma of gas and dust, a tail that trailed behind the object, and a plume of dust on the side facing the Sun.
With 3I/ATLAS having now made its closest approach to the Sun, venturing within 1.36 au of our star on 29 October 2025, the comet is wrapping up its tour of the solar system and heading back out to interstellar space — but the research continues. Today, we’re taking a look at five of the more than three dozen research articles published in the AAS journals that have examined 3I/ATLAS and its journey through our solar system. As always, this Monthly Roundup contains only a short summary of each article, so be sure to check out the full research articles linked at the bottom of this post!
Early Spectra of 3I/ATLAS
Bin Yang (Diego Portales University and the Planetary Science Institute) and collaborators obtained spectra of 3I/ATLAS less than two weeks after it was discovered, when it was 4.0–4.4 au from the Sun. Using the Gemini South telescope and the Infrared Telescope Facility (IRTF), Yang’s team sought to characterize its coma, the dusty envelope of gas that puffs out from the icy nucleus as the comet warms up.
IRTF spectrum of 3I/ATLAS (black line) with the best-fitting model (red line). Click to enlarge. [Yang et al. 2025]
Yang and coauthors found that the near-infrared spectrum was well fit by a model including a blend of amorphous carbon and water ice (63% carbon and 37% water ice by volume) at a temperature of 120K. 3I/ATLAS’s spectrum bears certain similarities to well-studied solar system comets like C/2006 W3 and 6P/d’Arrest, which suggests that the particles in these objects’ comae are similar in size or composition. Ultimately, the discovery of abundant water ice in 3I/ATLAS’s coma, along with the carbon dioxide spotted in other studies, suggests that the comet formed in the cold, volatile-rich outer regions of its home system.
Unique Polarization Properties
3I/ATLAS is the second interstellar object for which astronomers have obtained polarization information. The first, 2I/Borisov, showed a high degree of positive polarization, comparable to the exceptional solar system comet Hale–Bopp.
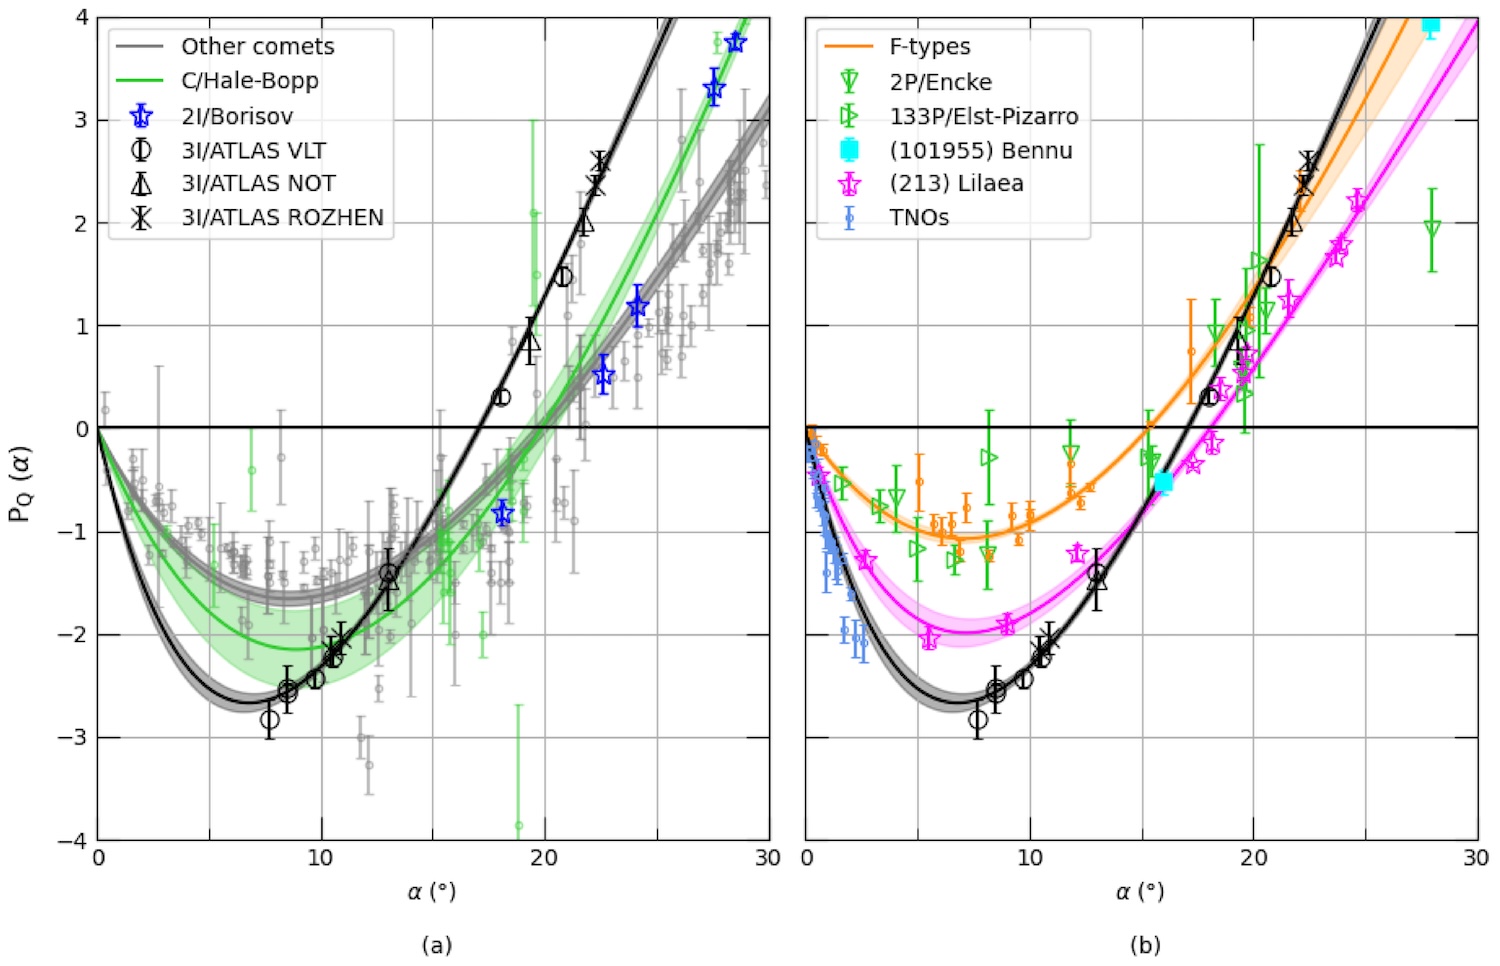
Comparison of 3I/ATLAS’s polarization (black) to measurements of 2I/Borisov (blue) as well as solar system comets and asteroids. Click to enlarge. [Gray et al. 2025]
Gray’s team suggested that 3I/ATLAS’s extreme polarization behavior could be evidence for a mixture of large icy and dark particles in its coma. It’s also possible that it’s the first identified member of a new class of comets, distinct from both solar system comets and interstellar comet 2I/Borisov.
Is 3I/ATLAS Truly a Pristine Relic of the Star System It Came From?
Interstellar objects like 3I/ATLAS have been hailed as pristine beacons that grant us a rare glimpse into the conditions of other star systems. But as new work by Romain Maggiolo (Royal Belgian Institute for Space Aeronomy) and collaborators shows, 3I/ATLAS was likely greatly altered by its journey through interstellar space.
Spectroscopic measurements from JWST suggest that 3I/ATLAS has extremely high abundance of carbon dioxide and carbon monoxide compared to water. A comet’s chemical abundance ratios can be either inherited from the material from which the comet formed, or they can be due to processing after its formation. The team finds that comet 3I/ATLAS’s extreme abundance ratios can be attributed to the comet being pummeled by galactic cosmic rays — high-energy charged particles — as it cruised through interstellar space.
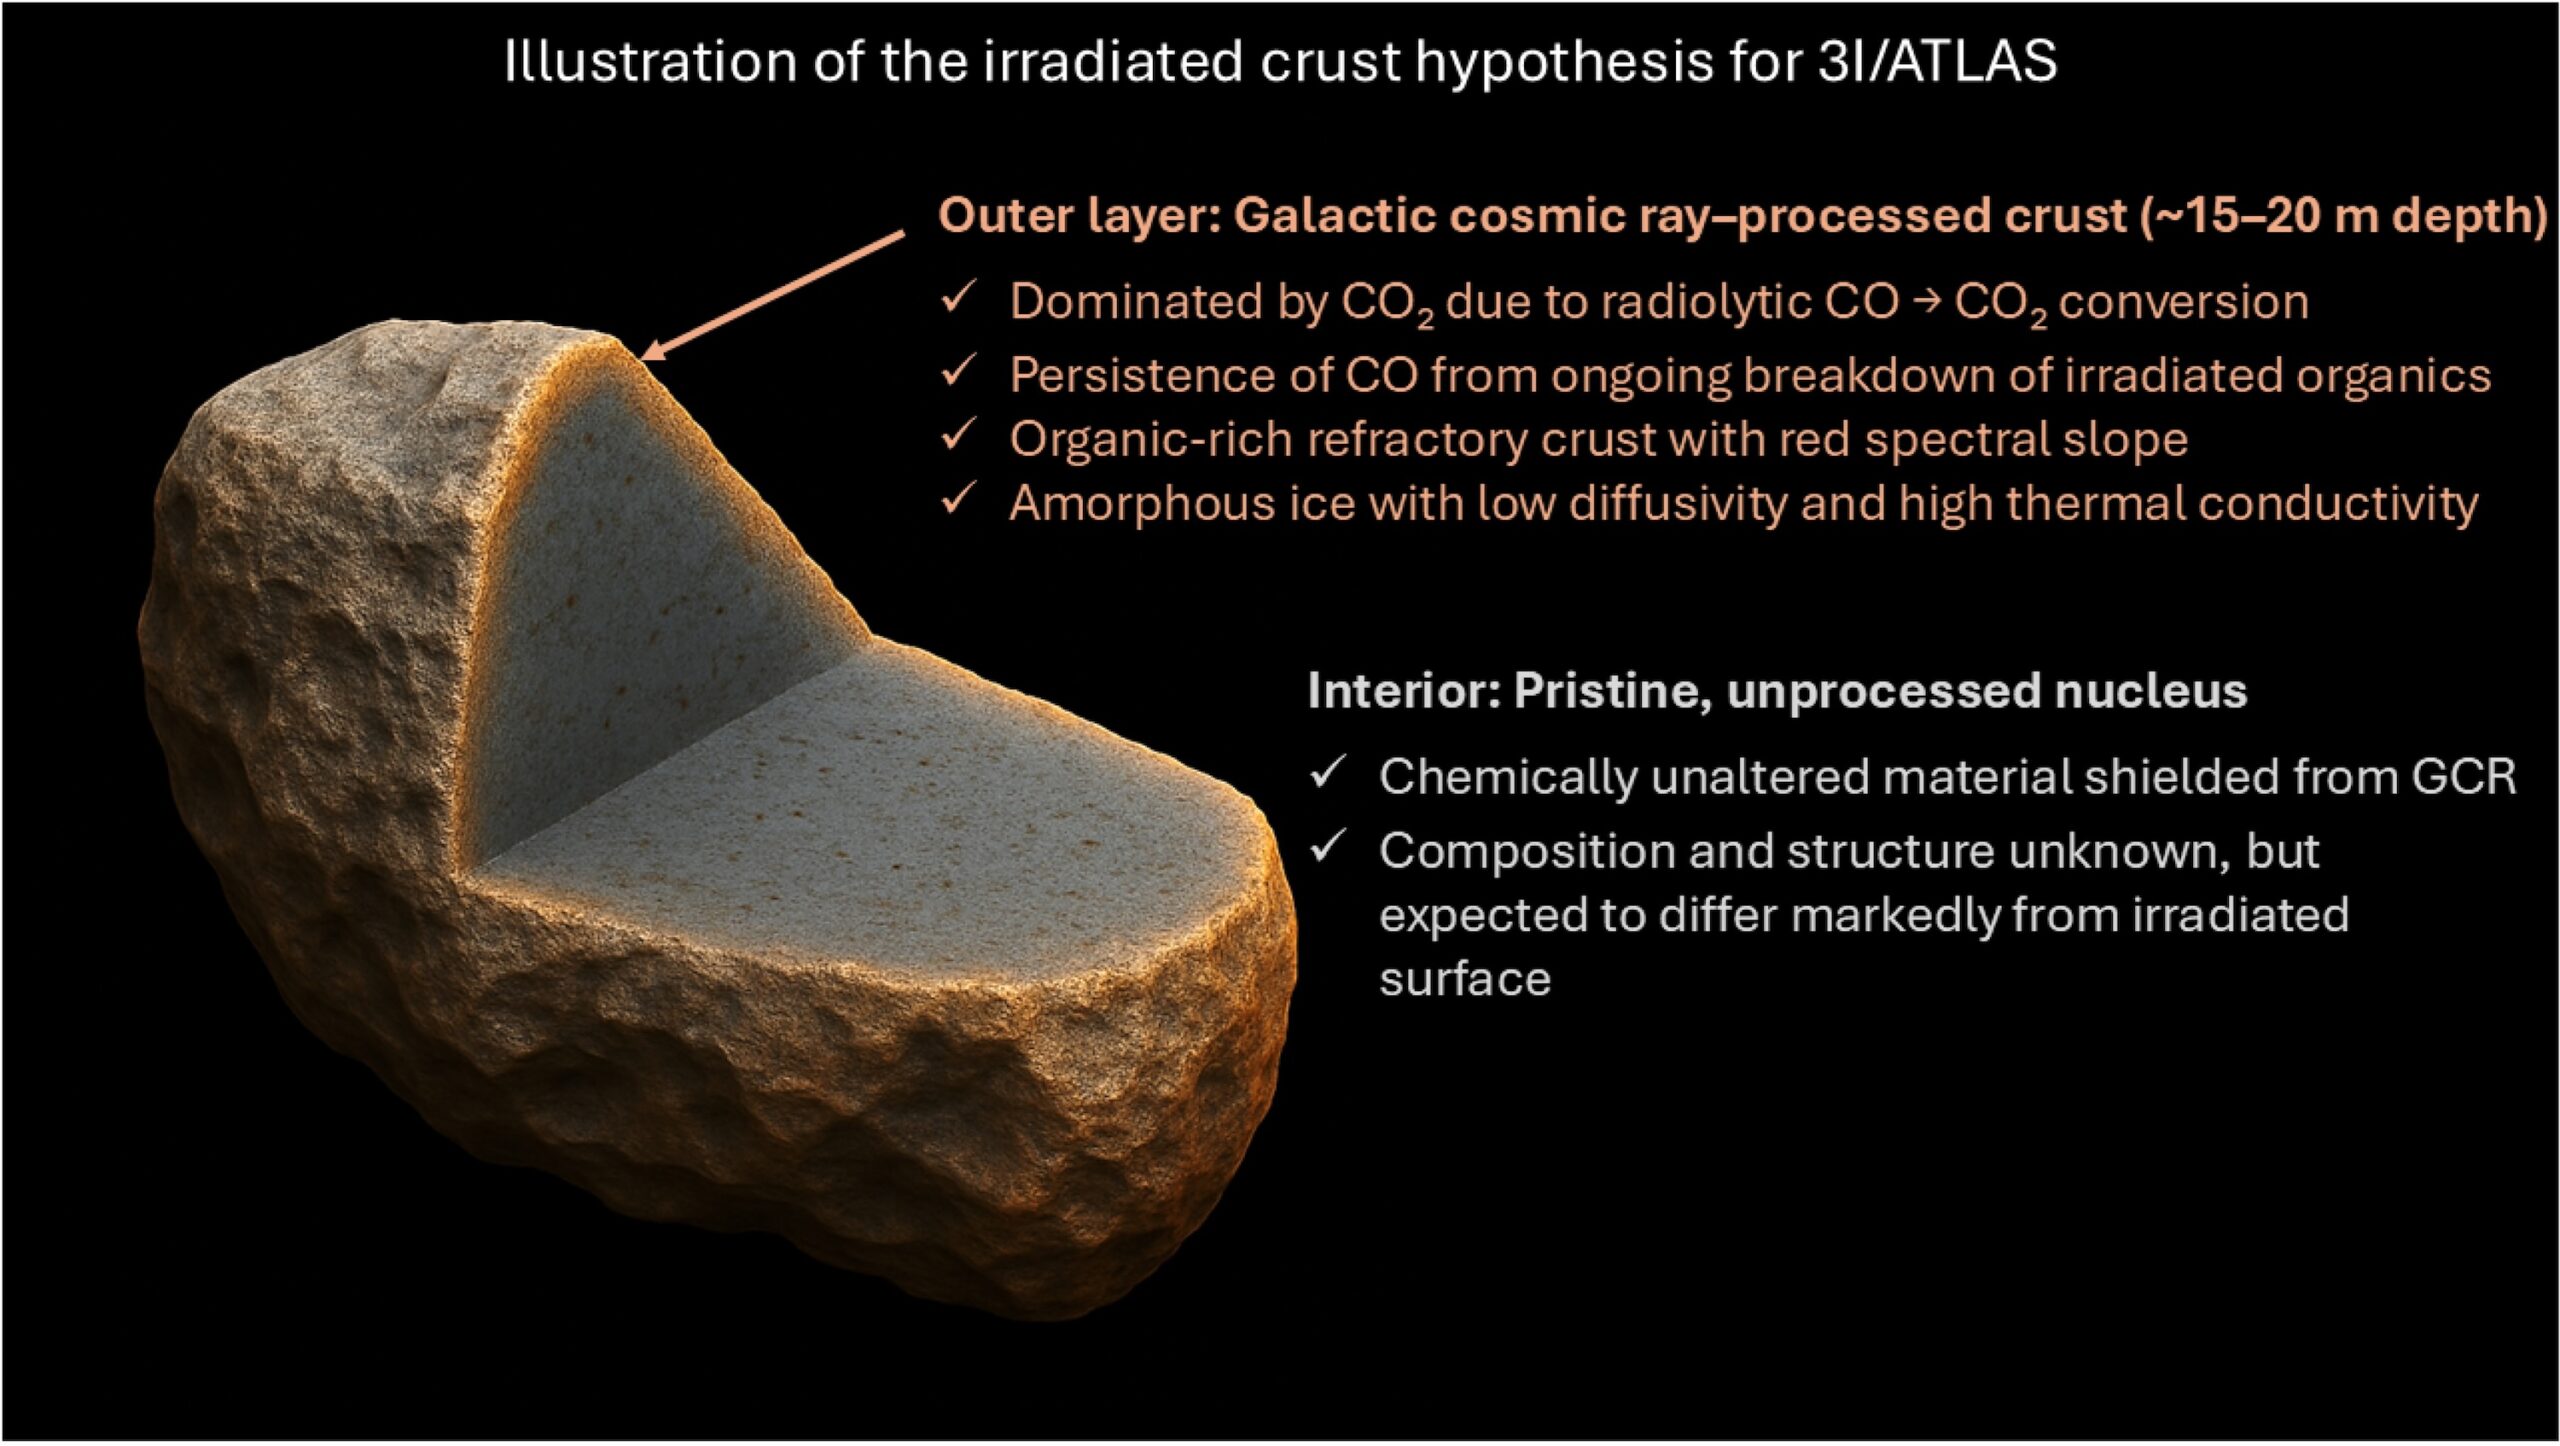
Illustration of the nucleus of 3I/ATLAS, featuring a pristine core encased in a crust that has been irradiated by cosmic rays. Click to enlarge. [Maggiolo et al. 2026]
3I/ATLAS as a Template for Future Encounters: Planning a Potential Rendezvous
It’s only a matter of time before the next interstellar object pays our solar system a visit, and researchers are already thinking about how they’ll study the next visitor. One of the best ways to learn about an interstellar interloper would be to send a spacecraft to rendezvous with it and collect data from up close.
To plan for possible future rendezvous, Atsuhiro Yaginuma (Michigan State University) and collaborators considered what it would have taken for an existing spacecraft to meet up with 3I/ATLAS shortly after it was discovered. The team considered ready-to-launch spacecraft on Earth as well as operational spacecraft currently orbiting Mars.
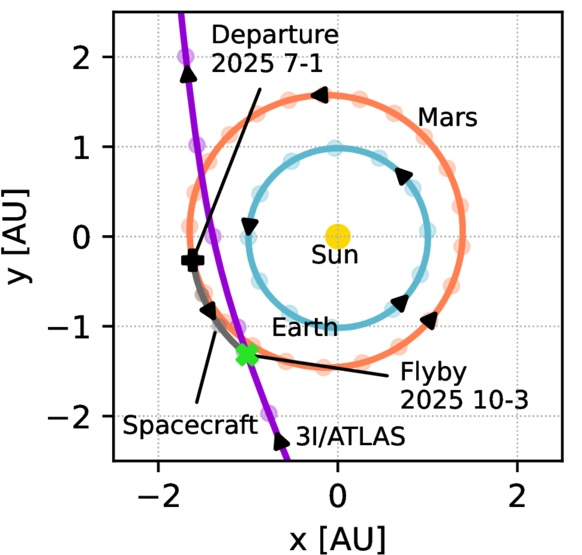
Illustration of the trajectory for the minimum-energy rendezvous with 3I/ATLAS launched from Mars on the day the comet was discovered. [Adapted from Yaginuma et al. 2025]
This highlights the importance of detecting interstellar objects as early as possible, as well as the advantage of stationing well-fueled spacecraft at key locations around the solar system; these spacecraft could be deployed rapidly after an interstellar object is discovered, enabling the collection of valuable data. (This is similar to the premise of the European Space Agency’s Comet Interceptor mission, which will wait at one of the Sun–Earth Lagrange points for the arrival of a long-period comet; such a mission could be repurposed to track down an interstellar comet.)
So, About Those Aliens…
Like its predecessor 1I/ʻOumuamua, 3I/ATLAS prompted speculation that it’s not a natural object, though there’s no compelling evidence that it’s anything but a comet. If 3I/ATLAS were an interstellar probe, we might be able to unmask it as such by intercepting its radio communications. In a recent Research Note, Ben Jacobson-Bell (University of California, Berkeley) and coauthors described their search for narrow-band radio signals — the communication medium for all spacecraft in our solar system — from 3I/ATLAS.
The Breakthrough Listen project pointed the 100-meter Green Bank Telescope in 3I/ATLAS’s direction, just one day before the object made its closest approach to Earth at a distance of 1.8 au. The team identified nine possible “events” in their data, all of which were ruled to be radio-frequency interference. Based on this non-detection, Jacobson-Bell and collaborators ruled out the presence of isotropic, continuously outputting radio transmitters with power greater than 0.1 watt. (For comparison, a cellphone puts out approximately 1 watt, and spacecraft radios tend to put out a few dozen watts.) Other searches for radio transmissions from 3I/ATLAS have similarly detected no signals.
Citation
“Spectroscopic Characterization of Interstellar Object 3I/ATLAS: Water Ice in the Coma,” Bin Yang et al 2025 ApJL 992 L9. doi:10.3847/2041-8213/ae08a7
“Extreme Negative Polarization of New Interstellar Comet 3I/ATLAS,” Zuri Gray et al 2025 ApJL 992 L29. doi:10.3847/2041-8213/ae0c08
“Interstellar Comet 3I/ATLAS: Evidence for Galactic Cosmic-Ray Processing,” Romain Maggiolo et al 2026 ApJL 996 L34. doi:10.3847/2041-8213/ae2fff
“The Feasibility of a Spacecraft Flyby with the Third Interstellar Object 3I/ATLAS from Earth or Mars,” Atsuhiro Yaginuma et al 2025 ApJ 995 64. doi:10.3847/1538-4357/ae11b2
“Breakthrough Listen Observations of 3I/ATLAS with the Green Bank Telescope at 1–12 GHz,” Ben Jacobson-Bell et al 2025 Res. Notes AAS 9 351. doi:10.3847/2515-5172/ae3083
The post Monthly Roundup: Interstellar Visitor 3I/ATLAS appeared first on AAS Nova.
]]>
Astrobites reports on how active galactic nucleus disks might connect black holes across the mass spectrum, setting the stage for extreme-mass-ratio and intermediate-mass-ratio inspirals in the same system.
The post The Black Hole Meetup: EMRIs and IMRIs in the Same Active Galactic Nucleus Disk appeared first on AAS Nova.
]]>Editor’s Note: Astrobites is a graduate-student-run organization that digests astrophysical literature for undergraduate students. As part of the partnership between the AAS and astrobites, we occasionally repost astrobites content here at AAS Nova. We hope you enjoy this post from astrobites; the original can be viewed at astrobites.org.
Title: The Fate of EMRI-IMRI Pairs in Active Galactic Nucleus Accretion Disks: Hydrodynamical and Three-body Simulations
Authors: Peng Peng et al.
First Author’s Institution: Peking University
Status: Published in ApJ
Active galactic nuclei (AGNs) are the extremely luminous central regions of some galaxies, powered by gas accreting onto their supermassive black holes and often outshining the entire galaxy in which they reside. One reason they are so studied in astronomy is that they connect many pieces of physics and astronomy in one cosmic place. This is especially true for AGNs as potential gravitational wave sources. Gravitational waves are observed when two compact objects, usually black holes, orbit each other. Black holes span a massive range of masses, but they are typically categorized into one of three categories: stellar-mass black holes, or sBHs (tens to hundreds of times the mass of the Sun), intermediate-mass black holes or IMBHs (hundreds to thousands of times the mass of the Sun), and supermassive black holes or SMBHs (millions to billions of times the mass of the Sun). AGNs are special because they are among the very few places where black holes across this entire mass spectrum might be found in the same place at the same time. Not only do they host SMBHs at their centers, but their gas disks are ideal nurseries for capturing and growing sBHs and IMBHs.
Current-generation gravitational wave detectors like the LIGO–Virgo–KAGRA (LVK) network can observe stellar-mass to lite-IMBH black hole mergers. Future detectors like the Laser Interferometer Space Antenna (LISA) will be able to observe black holes in the intermediate-mass to supermassive mass range. In addition to the mass range a detector can detect, it is also valuable to know the mass ratio (usually denoted by q) that a detector might detect. Unequal-mass-ratio mergers can tell us a lot about general relativity that more equal-mass mergers cannot because the smaller object orbits the more massive one many times right before the merger, essentially providing a gravitational wave measurement of spacetime around the larger black hole. (See this video for an example of black hole orbits with a large mass ratio, and imagine the spacetime observations around the larger black hole that could be possible with orbits like that.)
One of the most promising advances in gravitational wave detection with LISA will come with the observation of extreme-mass-ratio inspirals (EMRIs), usually defined as involving a smaller black hole that is at least 10,000 times less massive than the massive black hole it orbits (though the exact mass ratio defining an EMRI is a matter of convention and may vary somewhat). In addition, LISA will be able to observe intermediate-mass-ratio inspirals (IMRIs), usually defined as when the smaller black hole is 100–10,000 times less massive than the larger one.
This article uses multiple techniques to address the question of what happens when an AGN disk hosts both an IMBH and an sBH at the same time. The authors began with a hydrodynamic simulation of an AGN gas disk around a 106-solar-mass SMBH. They add a 103-solar-mass IMBH into the gas disk. Because the IMBH orbits within a gas disk, the gas exerts a force on it, causing its orbit to shrink toward the SMBH (a process called migration). Additionally, the IMBH carves out a path through the gas. Once the IMBH carves out enough of a path in the gas, the authors add an sBH of 20 solar masses into the simulation near the IMBH.
The authors test the sBH outcome for two initial conditions of the gas disk. The first, which I will refer to as “InnerDisk,” is when gas already exists inside the IMBH’s orbit (see Figure 1). The other, which I will refer to as “NoInnerDisk,” is when the simulation begins with gas only outside the IMBHs orbit, with no gas initially between the IMBH and SMBH. In this case, gas crosses the IMBH’s gap after the simulation starts. In the InnerDisk case, the sBH initially gets pushed inward from the presence of the inner gas, but that gas steadily drains into the SMBH and is only partly refilled, so the gas’s push on the sBH weakens over time. In the NoInnerDisk case, the IMBH’s direct pull on the sBH becomes more important. The amount of gas that leaks across the IMBH orbit into the inner disk gradually settles into a steady state that is less dense than the InnerDisk case. With a weaker gas push, the sBH stays closely tied to the IMBH and migrates inward at nearly the same rate. In both setups, the IMBH carves a gap in the gas and keeps moving inward, but the presence and evolution of inner gas chiefly determine how closely the sBH can keep up.
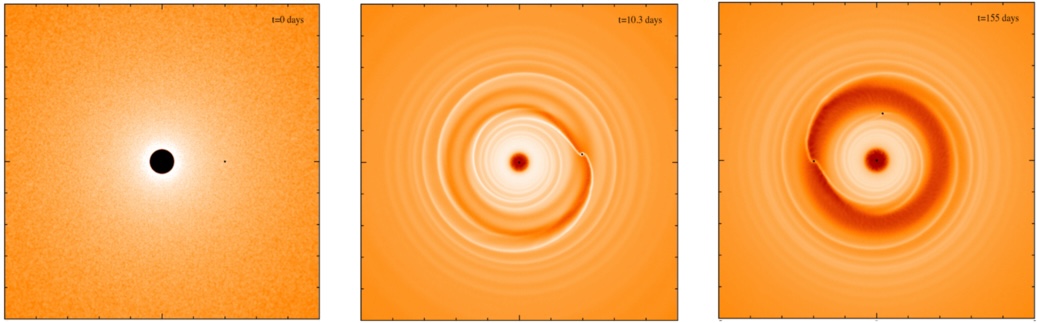
Figure 1: Simulated gas disk around an SMBH with an implanted IMBH at 0 days (left), 10.3 days (middle), and 155 days (right). Brighter orange indicates higher gas density, and darker orange/red indicates lower gas density. An sBH was added at 100 days and is seen in the right panel. These three panels represent the “InnerDisk” scenario. [Adapted from Peng et al. 2025]
Once the IMBH and sBH were in the gravitational regime, their outcomes became much more chaotic. As seen in Figure 2, a slight change in the initial phase angle of the sBH can lead to drastically different consequences for the system. In some cases, the sBH is ejected entirely. In other instances, it merges with the IMBH soon after the simulation begins. Yet in others, it first merges with the SMBH. This leads to one overall message of this article: the orbits of the IMBH and sBH tend to be regular with some gentle variation when they are farther out in the gas disk, but they become highly chaotic once they shrink into the gravitational wave regime closer to the central SMBH.

Figure 2: Post-Newtonian simulation outcomes for different values of sBH initial phase angle from 0 to 2π in increments of 0.02π, while all other initial conditions were kept fixed. Green (binary formation) represents a merger of the IMBH and sBH before reaching the SMBH; red (EMRI after ejection) represents the sBH being ejected from the system, but not before some of its orbits can be observed as an EMRI event; EMRI-IMRI (orange) represents the sBH merging with the SMBH, followed by the merger of the IMBH with the SMBH; and blue (ejection) represents the sBH being ejected from the system entirely before entering a gravitational wave EMRI regime. [Peng et al. 2025]
Original astrobite edited by Maggie Verrico.
About the author, William Smith:
Bill is a graduate student in the astrophysics program at Vanderbilt University. He studies gravitational wave populations with a focus on how these populations can help inform cosmology as part of the LIGO Scientific Collaboration. Outside of astrophysics, he also enjoys swimming semi-competitively, music and dancing, cooking, and making the academy a better place for people to live and work.
The post The Black Hole Meetup: EMRIs and IMRIs in the Same Active Galactic Nucleus Disk appeared first on AAS Nova.
]]>
Hubble has revealed new features in Dracula's Chivito, the largest known protoplanetary disk.
The post Featured Image: Hubble Samples a Dusty Cosmic Sandwich appeared first on AAS Nova.
]]>
Hubble Space Telescope image of Dracula’s Chivito. [Monsch et al 2026]
Citation
“Hubble Reveals Complex Multiscale Structure in the Edge-On Protoplanetary Disk IRAS23077+6707,” Kristina Monsch et al 2026 ApJ 996 45. doi:10.3847/1538-4357/ae247f
The post Featured Image: Hubble Samples a Dusty Cosmic Sandwich appeared first on AAS Nova.
]]>
A mountain top in the Arizona desert scattered with telescopes, the Kitt Peak National Observatory is home to cutting-edge research and cultural connections.
The post Getting a Peek of Kitt Peak National Observatory appeared first on AAS Nova.
]]>After AAS 247 in Phoenix, Arizona, AAS Nova Editor Kerry Hensley and I had the chance to travel about 150 miles south for a tour of Kitt Peak National Observatory.
A Window into Kitt Peak
Located 60 miles southwest of Tucson, Kitt Peak National Observatory (KPNO) resides on a mountain top within the Tohono O’odham Nation reservation. Founded in 1958, Kitt Peak is home to nearly two dozen active telescopes ranging in wavelength coverage and scientific objectives. Ronald Proctor, Lori Allen, and Jacelle Ramon-Sauberan, all serving in crucial roles for the observatory, led our tour around the mountain.

The Windows On the Universe Center’s lobby exhibit displaying the Tohono O’odham language with words describing the land and astronomy. Jacelle Ramon-Sauberan, the Tohono O’odham Nation Education Liaison, is seen to the left. [KPNO/NOIRLab/NSF/AURA/R. Proctor; CC BY 4.0]
The center’s lobby introduced visitors to the beautiful land KPNO calls home. Working with Tohono O’odham linguists, Jacelle, the observatory’s Tohono O’odham Nation Education Liaison, curated the lobby exhibit that features the native language and the Nation’s connection to astronomy and the observatory. The science center serves as an educational resource and place of cultural exchange, expanding the relationship between the observatory and the Tohono O’odham Nation.

Apollo astronauts in the control room of the McMath-Pierce Solar Telescope in 1964. [United States Geological Survey; CC BY 4.0]
At the end of the Windows Center is a Science On a Sphere Theater — a spherical display system that allows visitors to see planets, stars, moons, and even large-scale structures of the universe in 3D. Featuring multiple programs, the theater takes visitors through the universe and displays data collected right there on the mountain!
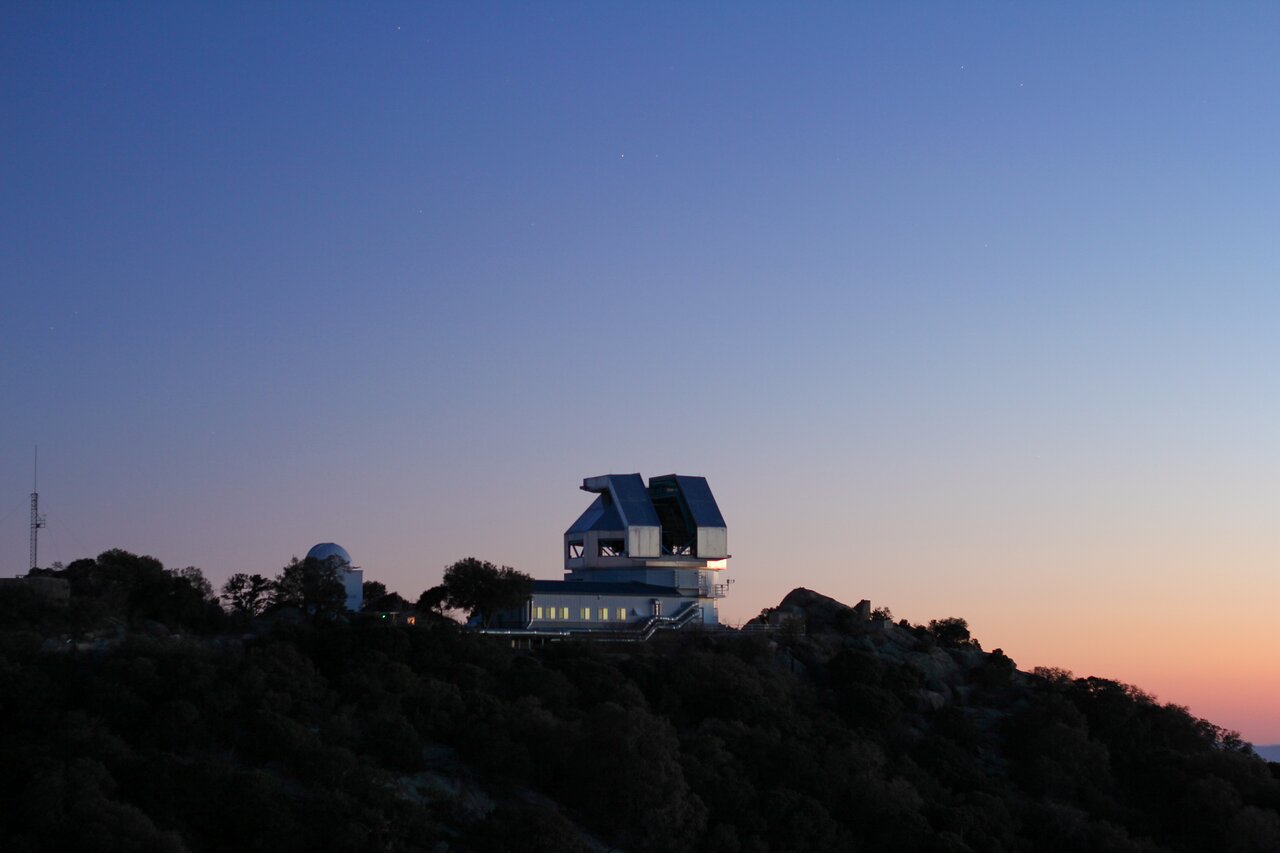
The WIYN 3.5-meter telescope at sunset. [KPNO/NOIRLab/NSF/AURA/P. Marenfeld; CC BY 4.0]
A WIYN for Exoplanetary Science
Though not typically open to the public for tours, our next stop took us to the WIYN 3.5-meter telescope. This telescope is operated and owned by the WIYN Consortium, a partnership between the University of Wisconsin, Indiana University, NSF’s NOIRLab (National Optical-Infrared Astronomy Research Laboratory; formerly NOAO), Pennsylvania State University, and Princeton University. Operating since 1994 with a strong collection of instruments, WIYN has observed galaxies near and far, stars across their lifetimes, and exoplanets tugging on their host stars.

Me, Lexi Gault (AAS Media Fellow), in front of the WIYN 3.5-meter telescope. I have used WIYN’s SparsePak spectrograph to collect data for my dissertation research! [AAS Nova/Kerry Hensley]
The partnership between public and private universities and a government institution was the first of its kind. Through this consortium, hundreds of undergraduate and graduate students have conducted research with WIYN, and the telescope’s suite of instruments have enabled early career astronomers to explore the universe both near and far.
Mysteries of Dark Energy at Mayall
We concluded our tour at the Mayall 4-meter Telescope, the tallest telescope dome on the mountain at a staggering 18 stories high. This iconic telescope saw first light in 1973, and at the time, was the second-largest (in diameter) telescope in the world. Originally built for wide-field optical and infrared studies of the universe, the Mayall has enabled decades of critical scientific research.
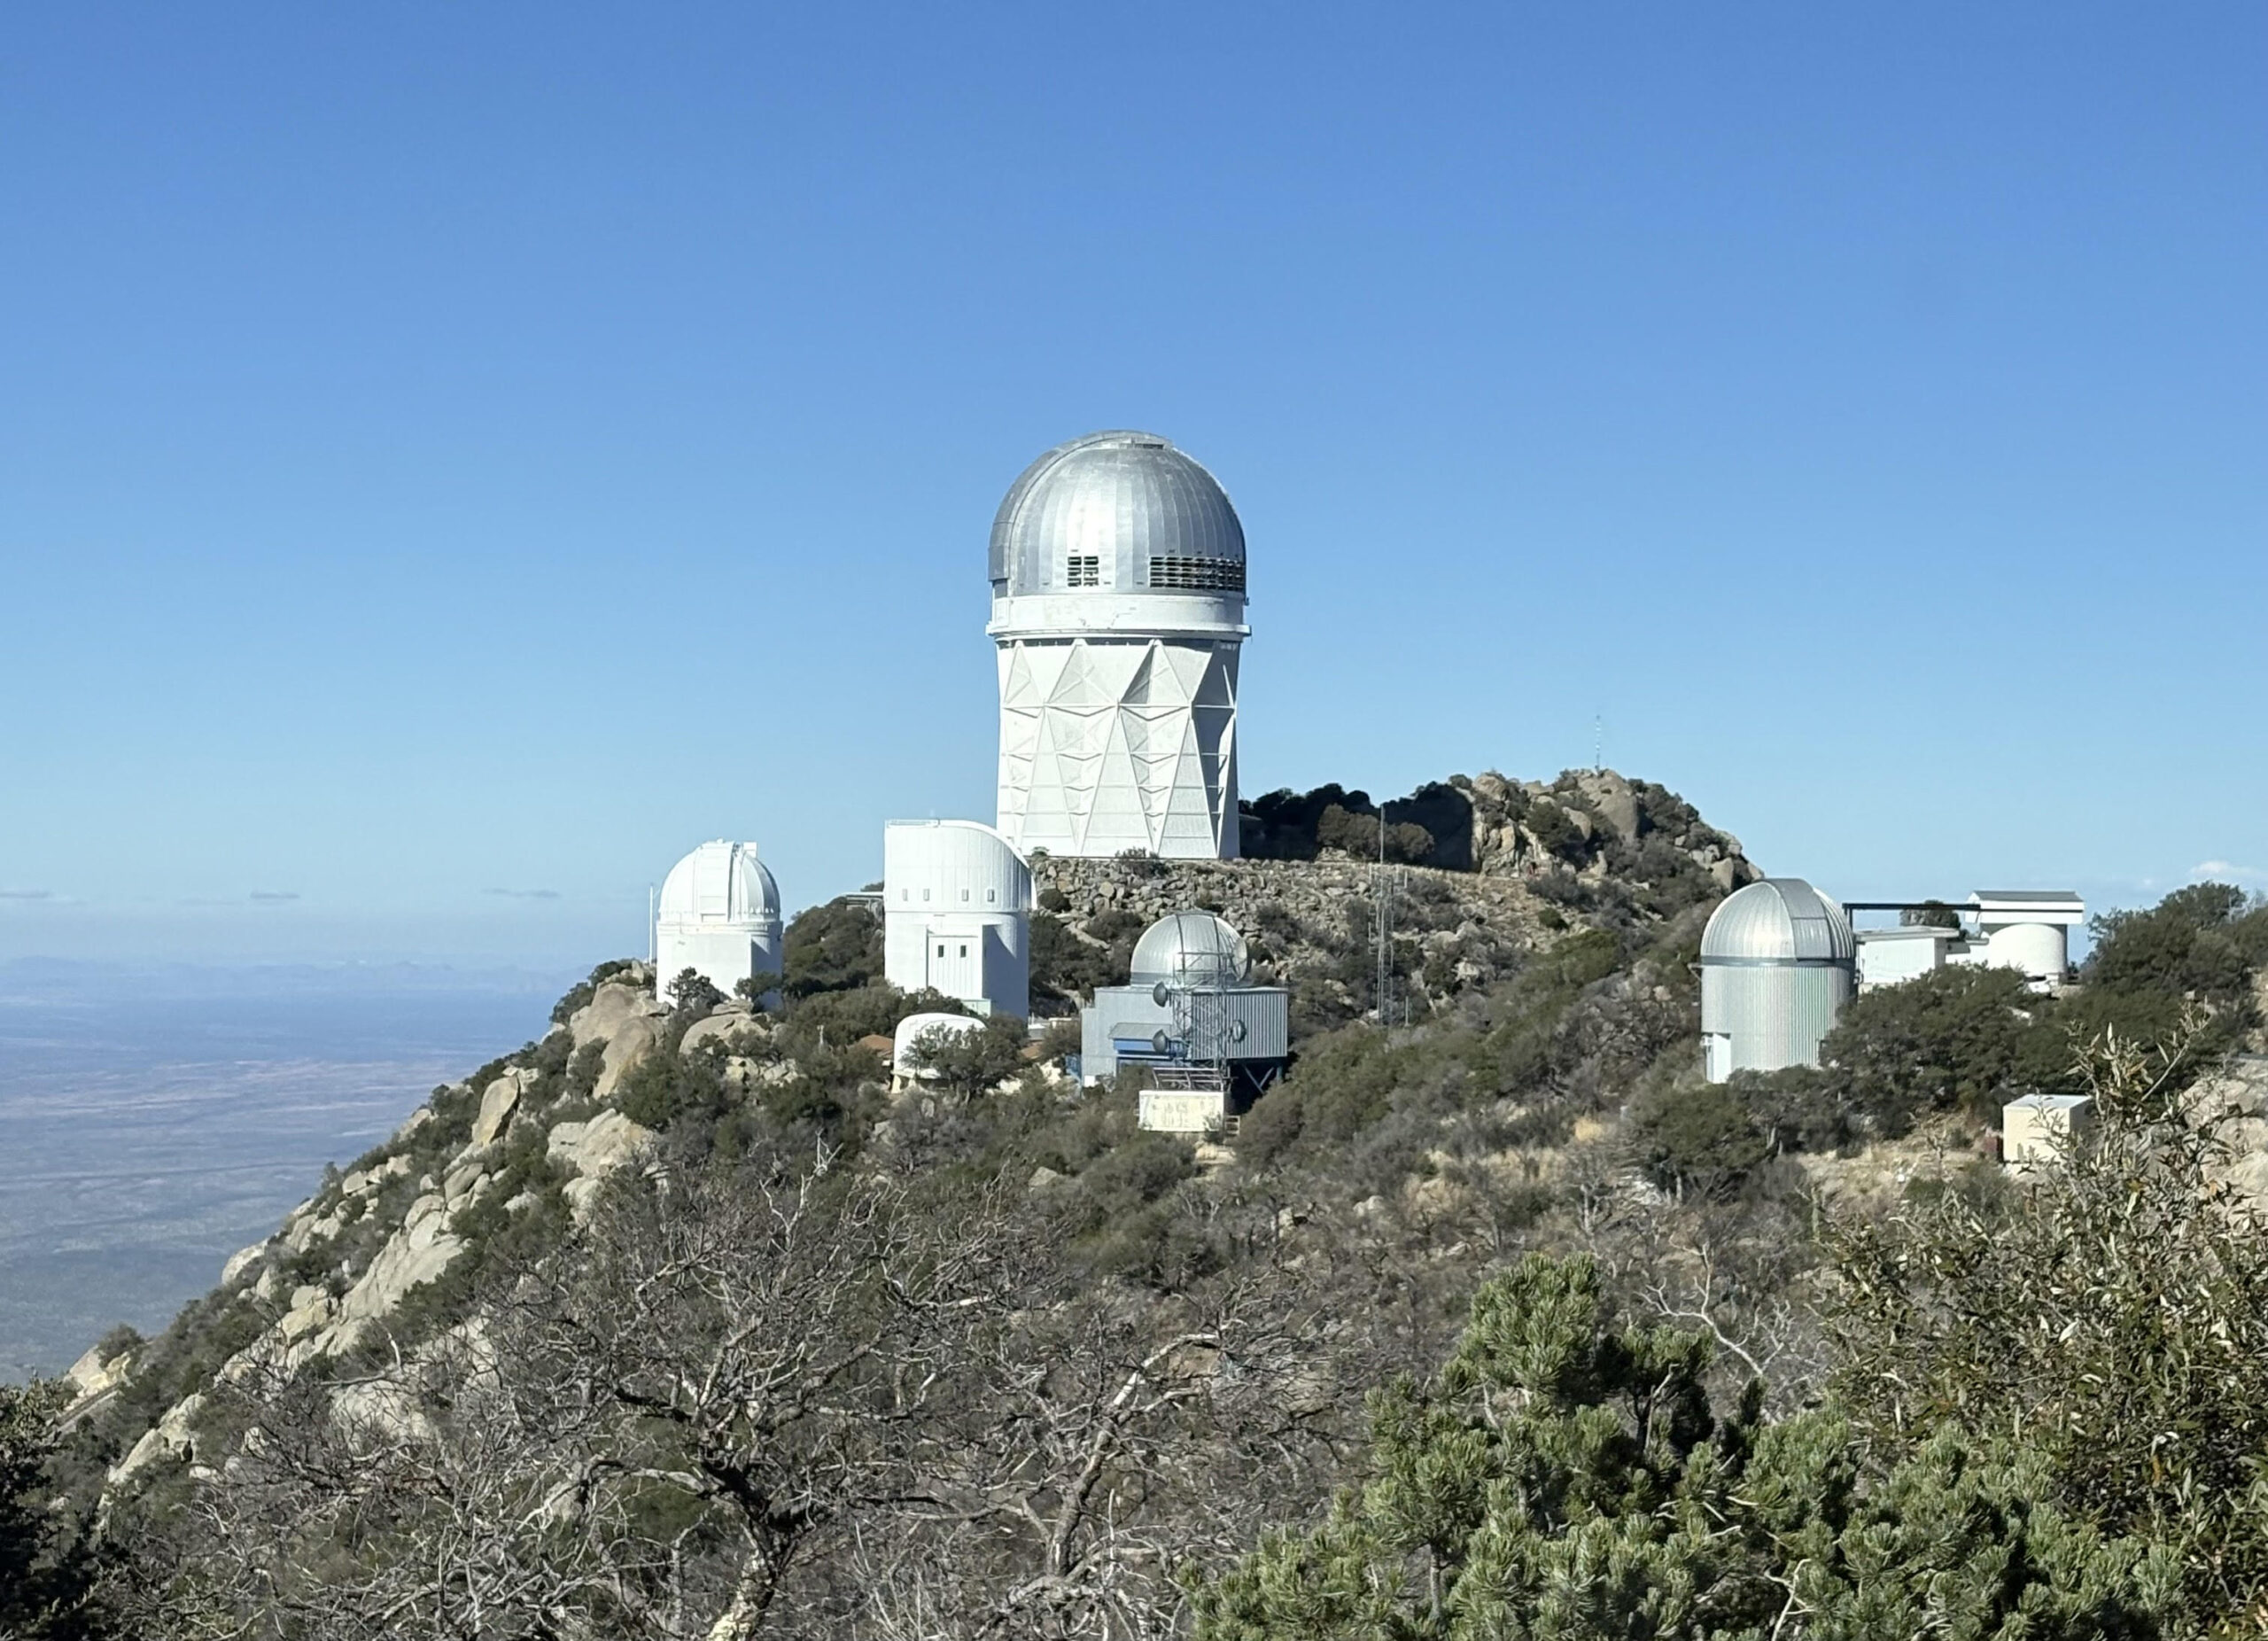
The Mayall dome across the mountain as seen from inside the WIYN dome. [AAS Nova/Lexi Gault]
From the telescope’s massive dome, to the busy DESI control room, to the gallery floor with a nearly 360 degree view of the surrounding desert, the Mayall offers visitors a unique glimpse into Kitt Peak’s history and its future. While WIYN is a hidden gem, the Mayall 4-meter Telescope is open to the public for tours daily, so you can experience the exciting era of research and discovery at KPNO.
Visit Kitt Peak
Interested in getting a peek yourself? KPNO is open to the public daily with multiple tour types to choose from, including both daytime and nighttime visits! Plan your visit to Kitt Peak here.
The post Getting a Peek of Kitt Peak National Observatory appeared first on AAS Nova.
]]>
Lasting multiple hours and featuring several bursts, GRB 250702B is a rare, powerful, and unusual gamma-ray burst. What do JWST observations tell us about the host galaxy and origins of this event?
The post JWST Follows Up on a Rare Gamma-Ray Burst appeared first on AAS Nova.
]]>Discovered in July 2025, GRB 250702B is unlike any other gamma-ray burst astronomers have seen. New follow-up observations of the burst’s location have underscored the strangeness of this event.
Not Like Other GRBs
Gamma-ray bursts (GRBs) are intense flashes of gamma rays lasting anywhere from milliseconds to hours. The shortest of these bursts are thought to come from colliding neutron stars, while bursts lasting longer than a few seconds tend to come from collapsing massive stars, though notable exceptions have been discovered.
Even with known GRBs spanning such a broad range of timescales and arising from different sources, some bursts are truly exceptional. Such is the case for GRB 250702B, which was discovered on 2 July 2025 by the Fermi Gamma-Ray Burst Monitor. This event featured three separate bursts spread across several hours, as well as never-before-seen X-ray emission in the day leading up to the gamma-ray emission.
JWST on the Case
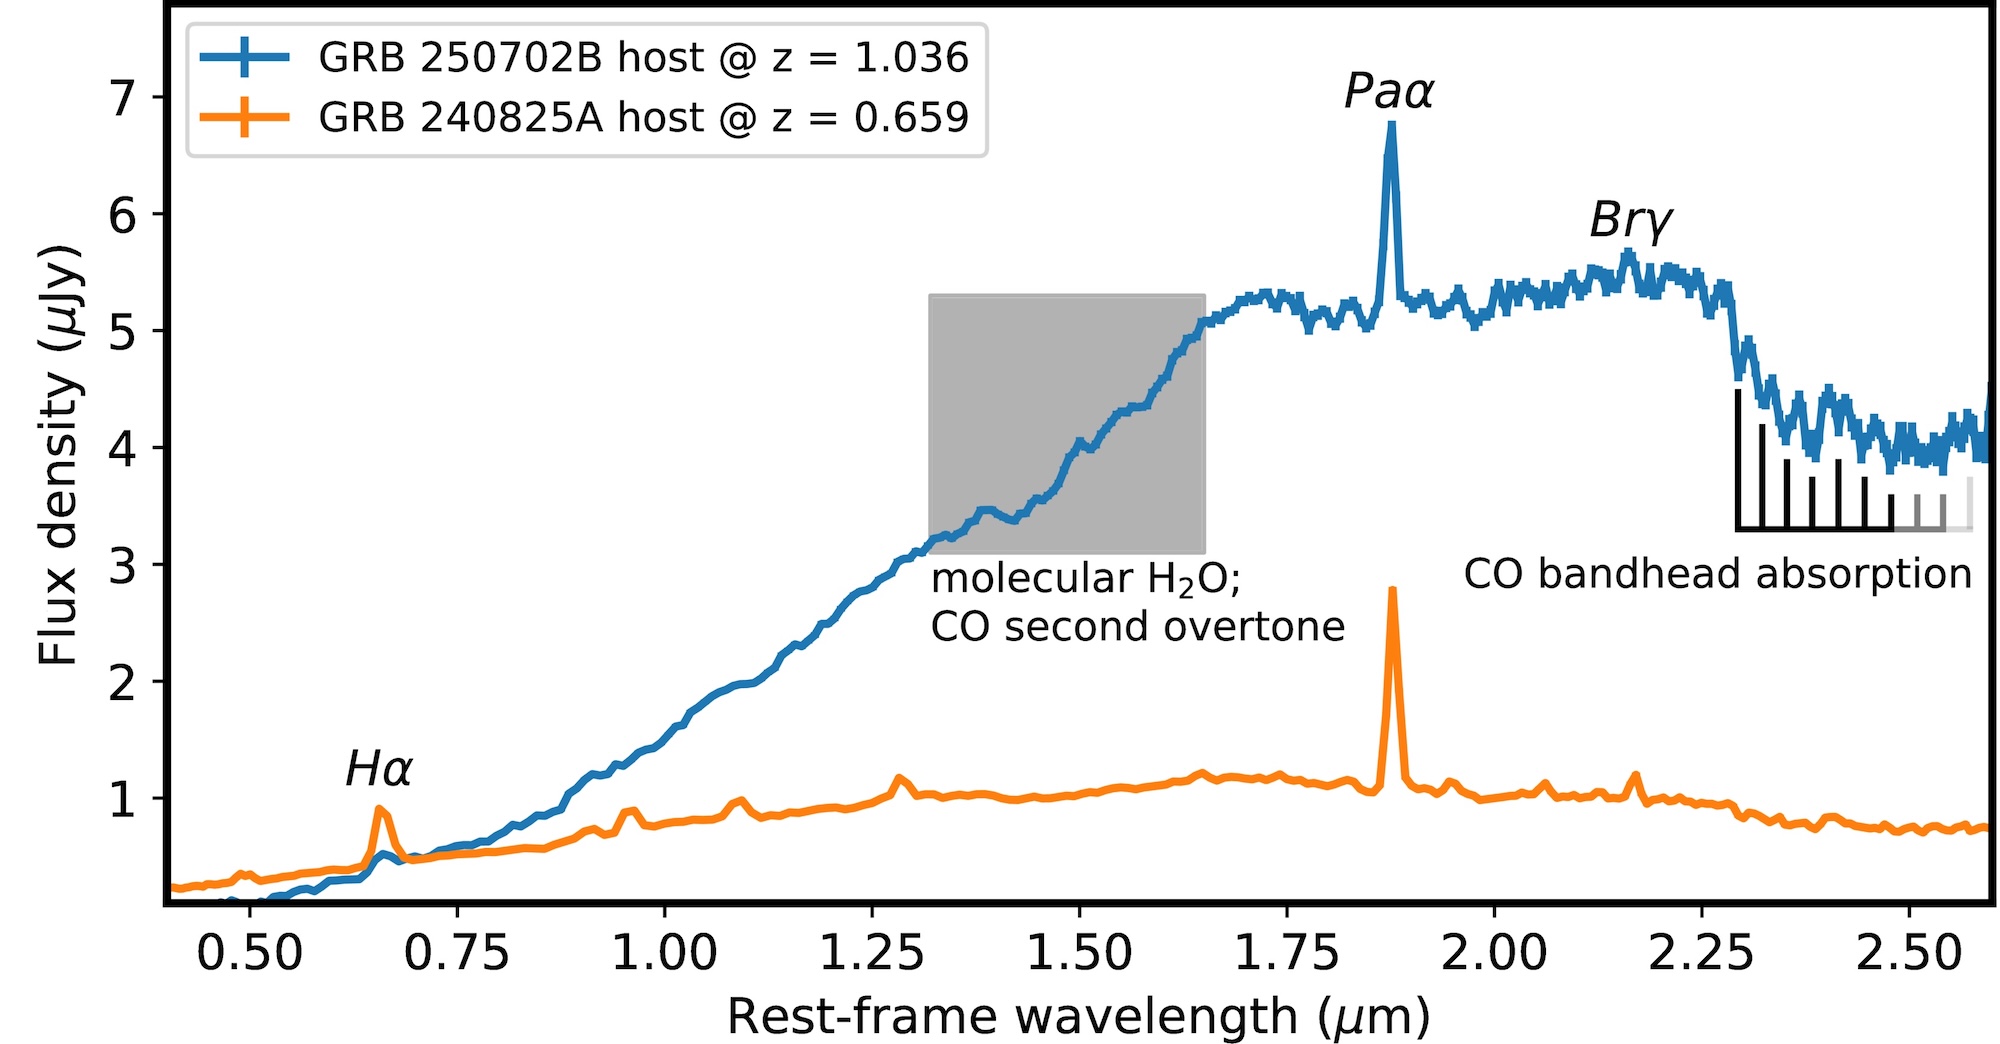
Rest-frame spectrum of GRB 250702B (blue) with the host galaxy spectrum of another burst, GRB 240825A, for comparison (orange). Click to enlarge. [Adapted from Gompertz et al. 2026]
This precisely measured redshift allowed the team to estimate the burst’s energy; in gamma rays alone, the event released at least 2.2 × 1054 ergs. This places GRB 250702B in the top 20 most energetic GRBs known, and the team estimates that events of this kind are 1,000 times less common than other long-duration GRBs and more than 100,000 times less common than typical core-collapse supernovae.
The burst’s host galaxy is also unusual. It’s larger, brighter, and dustier than other galaxies of similar redshift, and it’s unusually massive among GRB host galaxies. In the wavelength range studied here, it also appears to be the most luminous galaxy known to host a GRB.
What Caused GRB 250702B?
Now, to the cause of this unusual burst: is GRB 250702B just a very strange example of a long-duration burst arising from the collapse of a massive star into a black hole, or could it have an entirely different cause, like a star being ripped apart by a black hole?
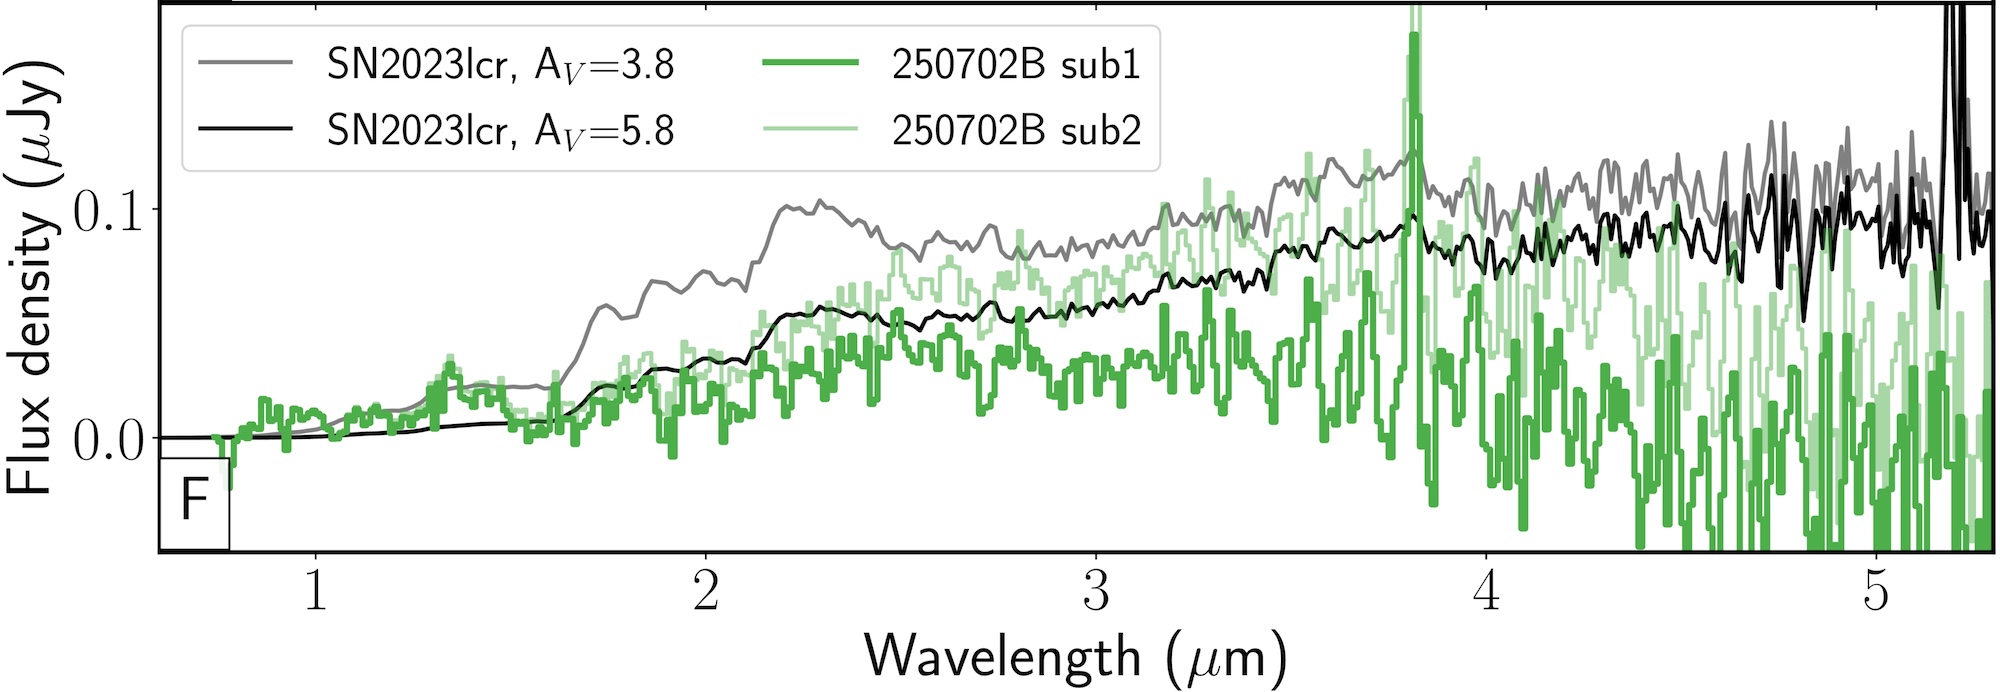
The team placed limits on the supernova emission by subtracting a spectrum of the host galaxy from the event. The green lines show this subtracted spectrum under two different normalization conditions. The black lines show for comparison the emission from the bright supernova SN 2023lcr using two possible extinction values. Click to enlarge. [Adapted from Gompertz et al. 2026]
The observations also place constraints on a tidal disruption event scenario, in which a star is ripped apart by a black hole. The data strongly favor a jetted, relativistic tidal disruption event, which makes it difficult to pin down the mass of the black hole involved. The timescales are consistent with a white dwarf spiraling around an intermediate-mass black hole, and other factors suggest that the black hole could be no more than a million solar masses, placing it firmly in the intermediate-mass regime, should this explanation prevail.
With GRB 250702B’s source still unsettled, astronomers will continue to study the burst and its unusual host galaxy. Gompertz and collaborators anticipate that follow-up spectroscopy will provide more clues in this case.
Citation
“JWST Spectroscopy of GRB 250702B: An Extremely Rare and Exceptionally Energetic Burst in a Dusty, Massive Galaxy at z = 1.036,” Benjamin P. Gompertz et al 2026 ApJL 997 L4. doi:10.3847/2041-8213/ae2ed9
The post JWST Follows Up on a Rare Gamma-Ray Burst appeared first on AAS Nova.
]]>
Astrobites reports on whether the low-density planets that keep popping up in our growing collection of exoplanets are really the water worlds that we imagine them to be.
The post Are Water Worlds Just Made of Soot? appeared first on AAS Nova.
]]>Editor’s Note: Astrobites is a graduate-student-run organization that digests astrophysical literature for undergraduate students. As part of the partnership between the AAS and astrobites, we occasionally repost astrobites content here at AAS Nova. We hope you enjoy this post from astrobites; the original can be viewed at astrobites.org.
Title: Soot Planets Instead of Water Worlds
Authors: Jie Li et al.
First Author’s Institution: University of Michigan
Status: Published in ApJL
They Might Be Planets with a Lot of Water…
Since the discovery of PSR B1257+12 c and d in 1992 and 51 Pegasi b in 1995, we have found evidence for thousands of planets in other star systems. One of the most striking things (aside from how common planets seem to be) is how many of them are so unlike anything we had imagined we would find. Our growing list of exoplanets includes a truly remarkable variety of types, from cold rocky planets smaller than Earth to scorching hot giants bigger than Jupiter.
However, one category of planets is particularly interesting: the sub-Neptunes. These planets, smaller than Neptune but larger than Earth, are characterized by their low densities, which suggests they could be dominated by water or volatile-rich atmospheres. What makes sub-Neptunes so intriguing is that we don’t have a clear counterpart for them in our own solar system. As such, we don’t really know a lot about them other than there seem to be a lot of them out there.
Although these planets are sometimes theorised to be rocky worlds with large hydrogen–helium envelopes, they have alternatively been considered as water worlds, i.e., worlds with giant planet-wide oceans thousands of kilometres deep. The thinking goes that since water ice appears to be abundant beyond the snow line, water worlds would be a natural consequence of planet formation. And if these planets exist, some might host a temperate liquid ocean with the conditions for life.
…or They May Just Be CHON(ky)
However, today’s article suggests that these supposed water worlds may not be as wet as we think they are. They may instead be rich in what are called refractory carbonaceous materials. This term describes solids rich in carbon, hydrogen, oxygen, and nitrogen, or CHON. It is a bit of a mouthful and is often just referred to as “soot,” but it is important to remember that it is different from the black stuff you would find in ye old chimney. Soot, in this case, is a major component of comets. We know that this type of material is present around planet formation, as protoplanetary dust contains not just silicates (rock) and water ice but also a significant amount of CHON, and comets are leftovers from this dust.
Soot is stable and remains in the solid state to much greater temperatures (∼500K) than water ice (∼160K), so the authors argue that there should be regions in the protoplanetary disk where planets accrete both rock and soot but little water. They define a “soot line” akin to the snow line and look at three archetypical planets that may form, shown in Figure 1.
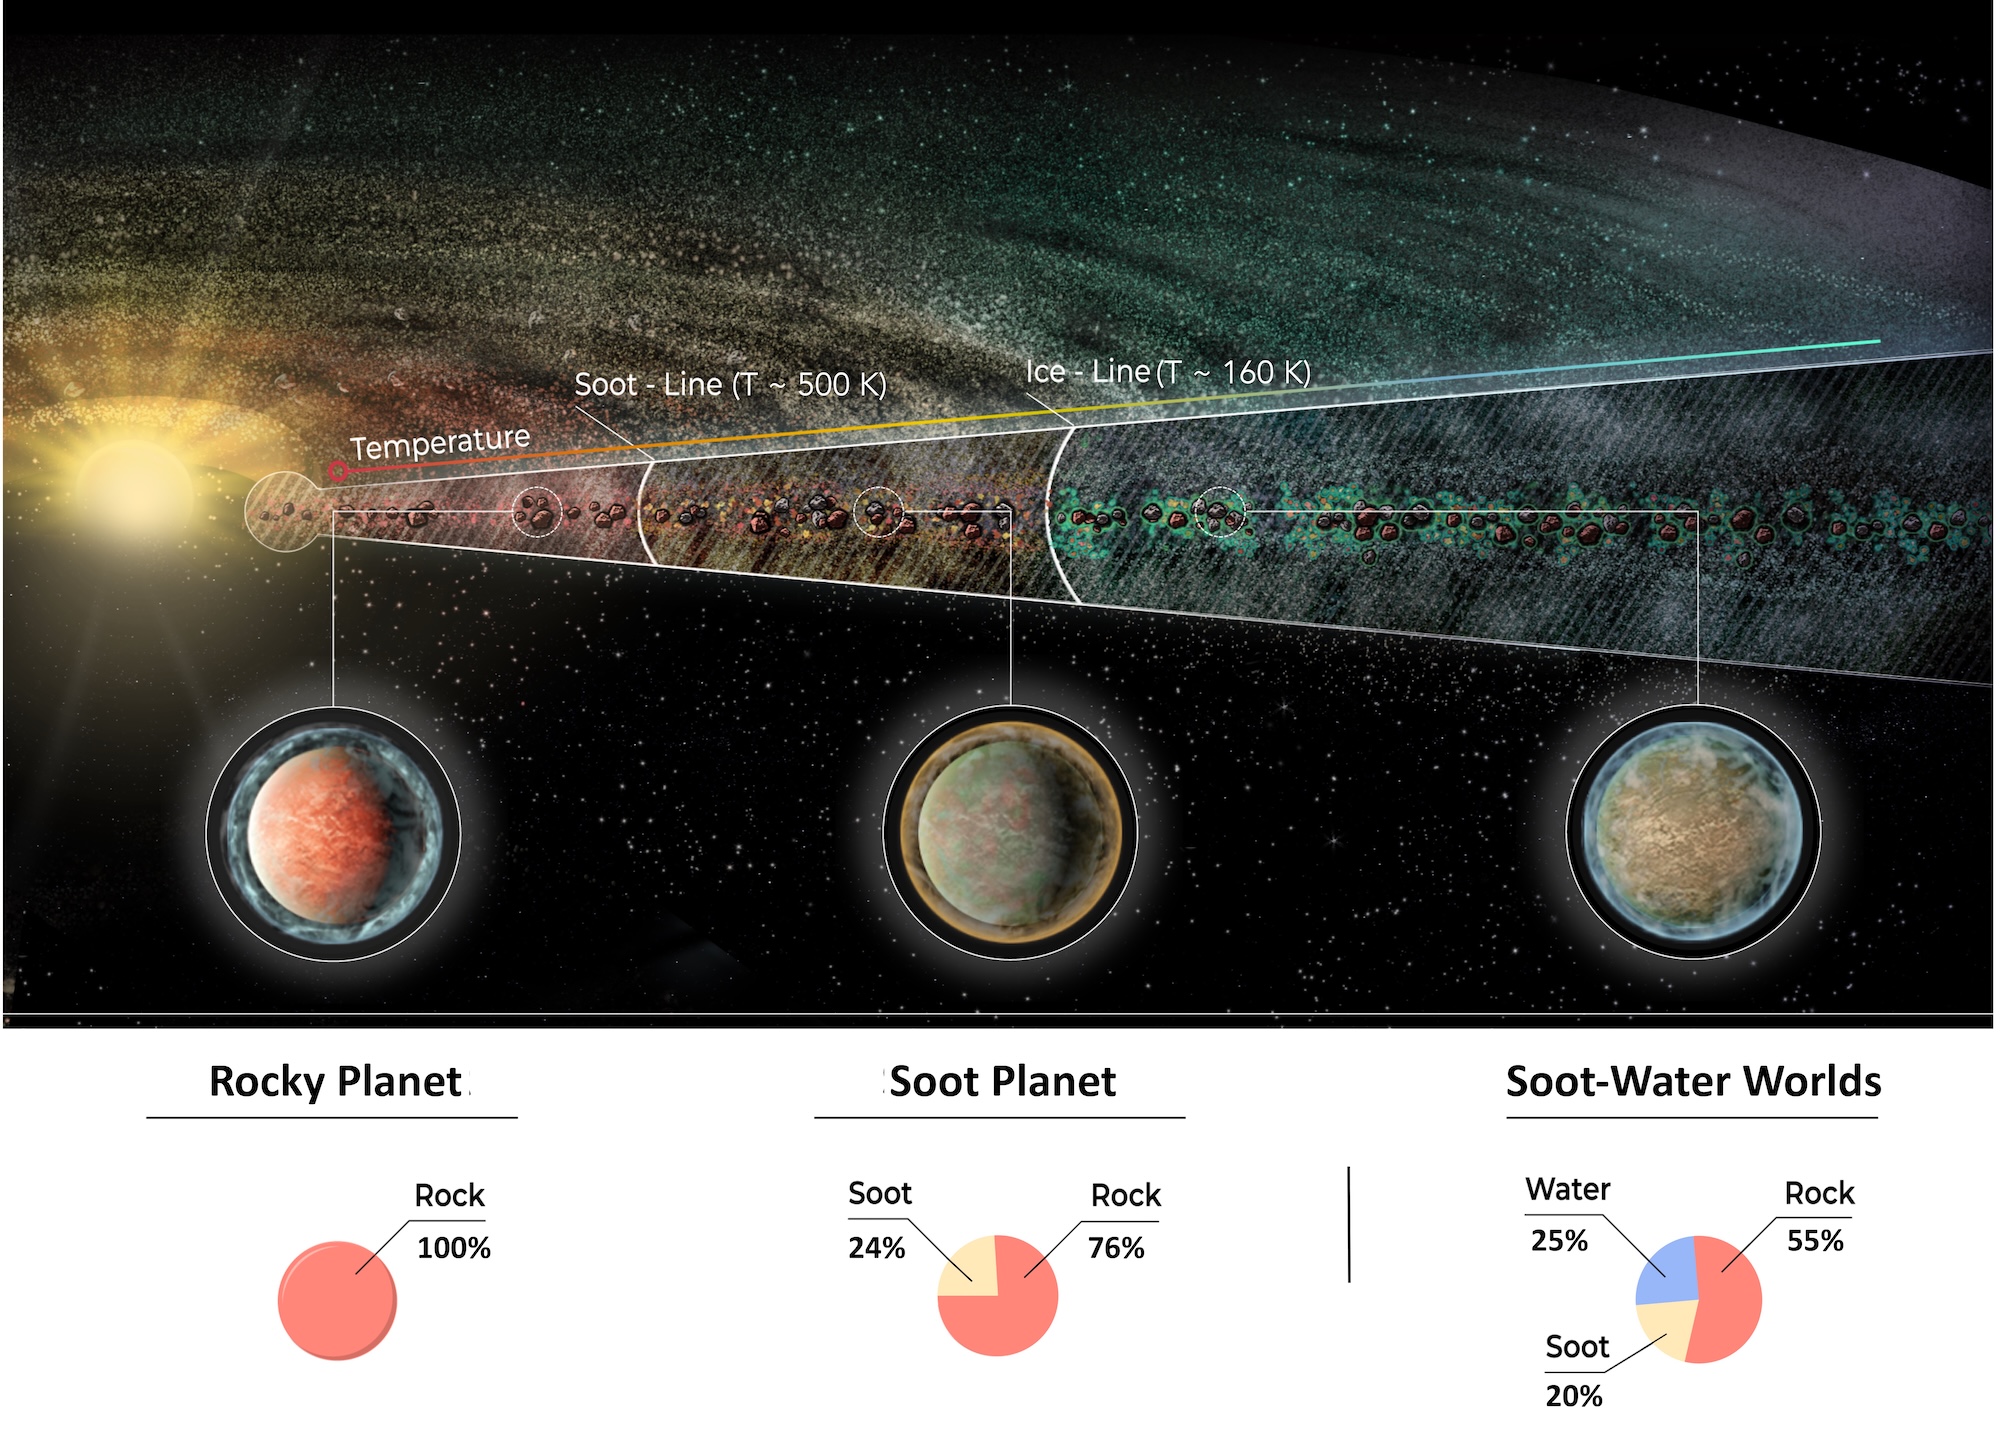
Figure 1: Illustration of a protoplanetary disk and three chemically distinct planet types that may form as the distance from the host star increases. Close in, the temperature in the disk is too high for volatiles to exist in the solid state, but farther out, the temperature drops to allow for water to freeze into ice beyond the water ice line, also known as the snow line. Between the two regions lies another where it’s cool enough for carbonaceous materials or “soot” to avoid destruction via thermally driven reactions. Depending on where planets form, they may contain a varying amount of astrophysical soot. [Li et al. 2026]
What Do the Models Say?
The authors got down to modelling planet compositions based on both observations of protoplanetary disks and the distribution of solid materials found in comets.
They considered two model planets. One is fully stratified, i.e., with a metallic core enclosed in a silicate mantle overlain by a hydrocarbon-rich layer and then a water-ice surface layer. The other, a single-layer mixed planet, is a hypothesised scenario where iron, silicate, soot, and water are fully mixed throughout the planet as a result of exotic chemistry from the high temperature inside the sub-Neptune planet. They expect any potential real planets to lie somewhere between the two extremes. The mass–radius relations for these models can be seen in Figure 2, where they are also compared to a number of known exoplanets, of which several fall within the models’ parameter spaces.
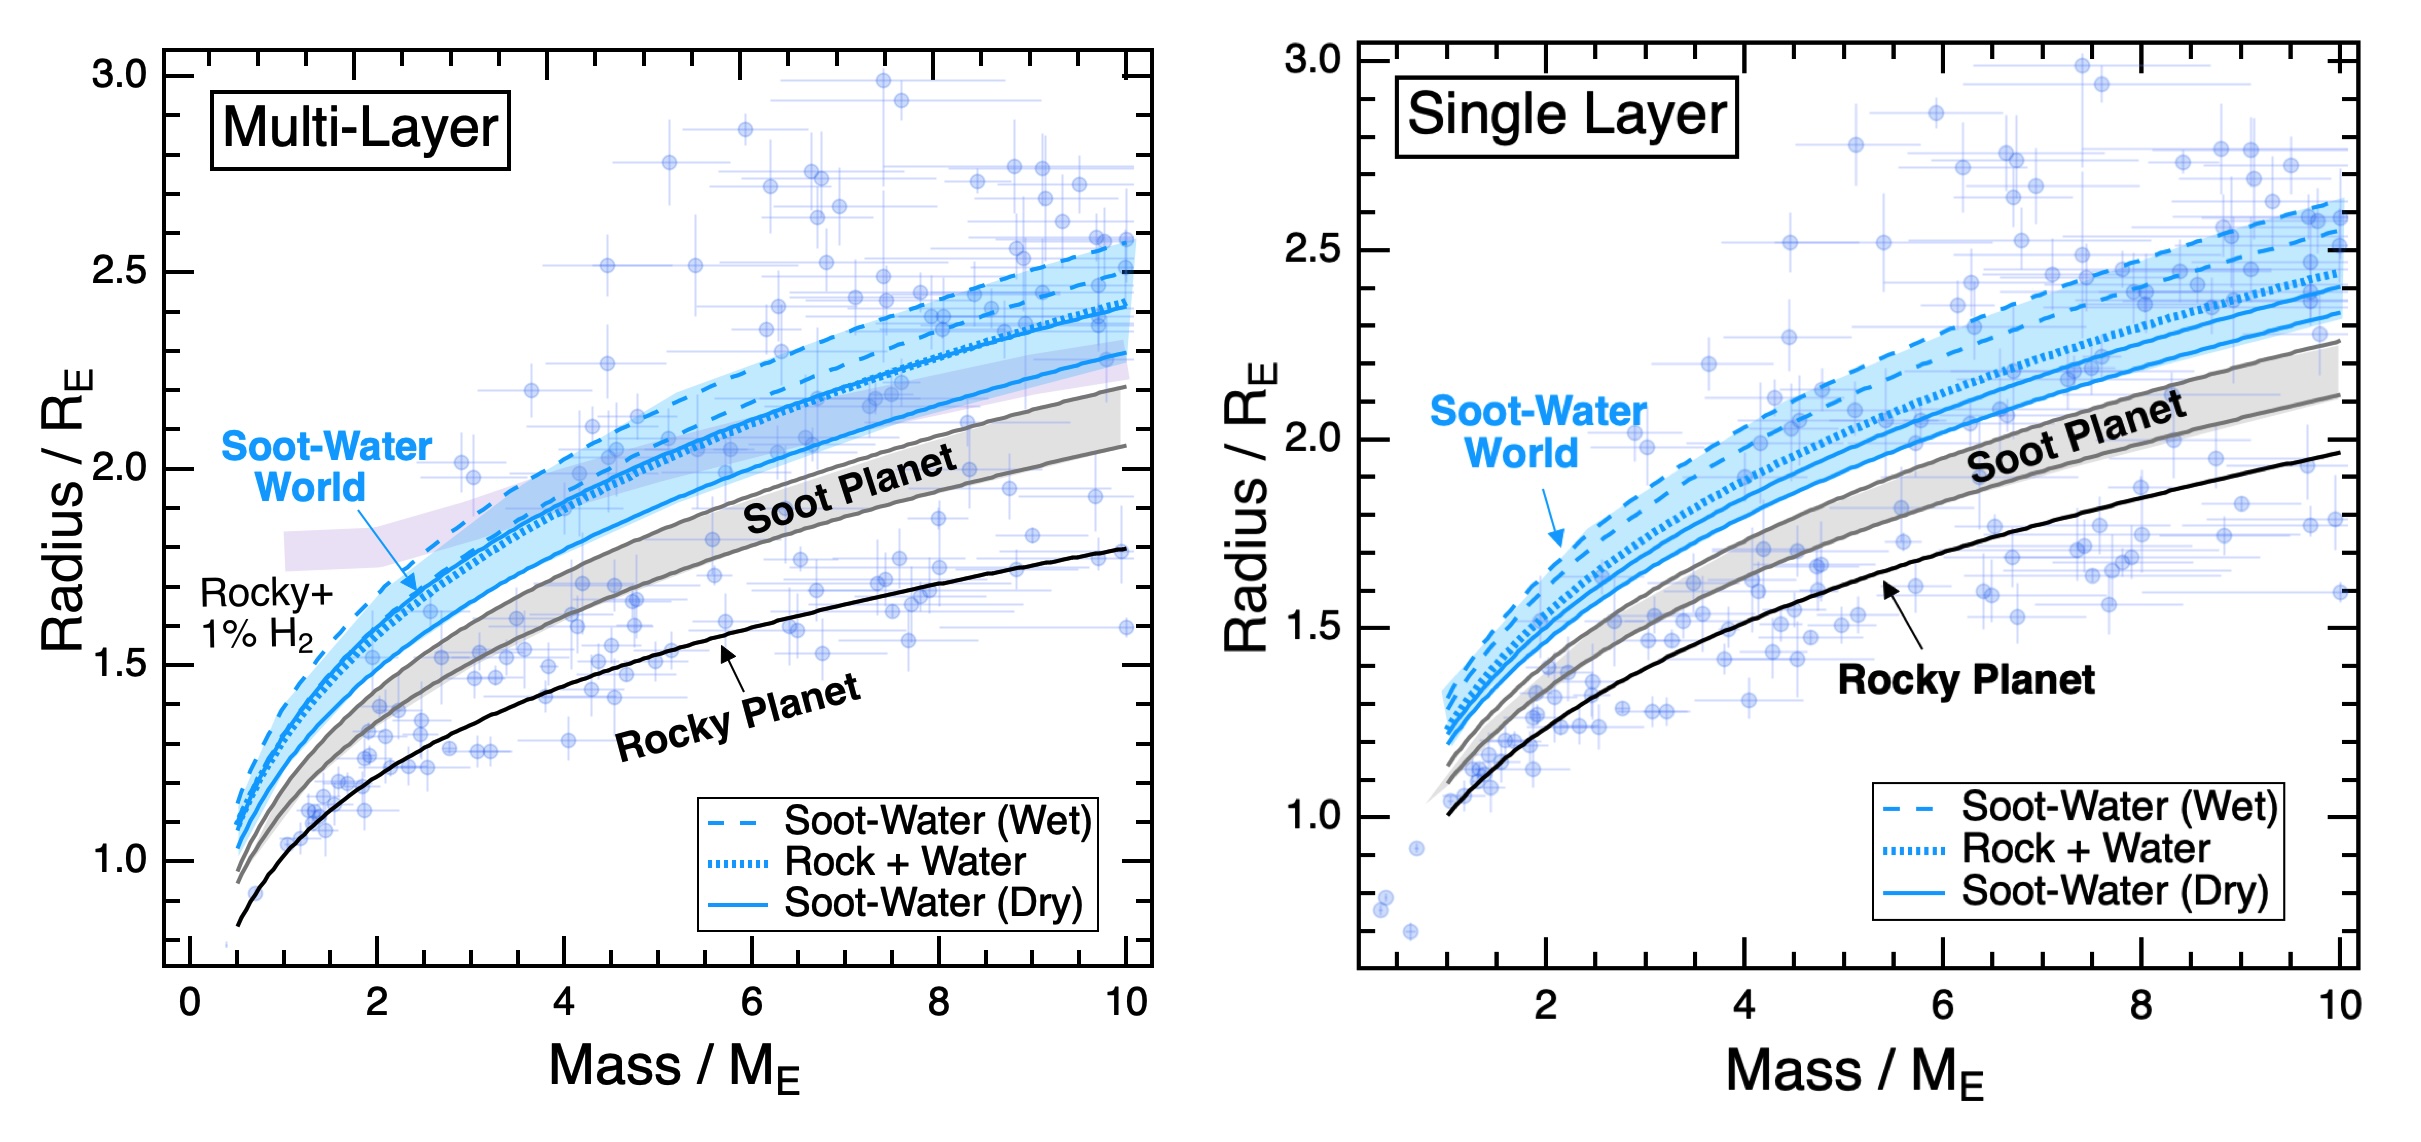
Figure 2: Mass–radius relations for model Earth-like rocky planets (black curves), soot planets (gray bands), and soot-water worlds (blue bands). On the left are multi-layer planets, while on the right are single-layer planets. Overlaid are a number of exoplanets along with their respective uncertainties. Also shown as dashed lines are models for Earth-like planets with 50% rock and 50% water. These fall squarely within the same region as soot-water worlds, making the two indistinguishable from each other. [Li et al. 2026
We Might Have a Telescope That Can Help
How might we break through this impasse? Well, because significant fractions of methane and other simple hydrocarbons are expected to be released from the interior, the soot-rich planets may feature methane-rich atmospheres. These may naturally lead to the formation of hydrocarbon hazes, akin to the tholins in Titan’s atmosphere.
Looking at the atmospheres of exoplanets is one of the main mission goals of JWST. Many of the spectra from sub-Neptunes have so far been featureless, which may indicate the presence of clouds or photochemical haze. The telescope also has the ability to detect carbon-bearing species in the atmospheres of other sub-Neptunes, like with the discovery of CO2 and CH4 in the atmospheres of K2-18b and TOI-270d. Although these planets currently orbit interior to the soot lines of their respective stars, they may have originally formed farther out and later migrated inward during their evolution. Of particular interest is TOI-270d. Aside from also showing signs of water, it has a carbon-to-oxygen ratio that is moderately high for the planet, hinting that it could be a world with a considerable amount of soot.
The presence of soot may have significant implications when it comes to habitability. The planet’s core may be rich in diamond, which would impede the movement of volatiles in the mantle. This would make it challenging for the planet to generate a magnetic field and thus leaving any potential life vulnerable to cosmic radiation. However, they could also be abundant in methane and other volatile organic compounds, substances thought to be crucial for the development of prebiotic chemistry. Regardless, it is interesting that there might be something out there that is not so unlike something we know from our own solar system, a hazy supersized Titan. While the frigid moon is unlikely to show signs of life, a temperate soot-water world might be one place to look in the future.
Original astrobite edited by Sowkhya Shanbhog.
About the author, Kasper Zoellner:
I have a Master of Science in astronomy and I am currently working towards a PhD in physics and educational science. My greatest passion is the search for exoplanets and how stellar variability may influence the possibility of life. I am also interested in science outreach, education and discussing what sci-fi novel to read next!
The post Are Water Worlds Just Made of Soot? appeared first on AAS Nova.
]]>
New research suggests that ultra-long-period pulsars might begin their lives as massive stars in close binary systems.
The post Supernovae, Shocks, and Spindown: A Possible Origin Story for Ultra-Long-Period Pulsars appeared first on AAS Nova.
]]>Researchers have recently discovered a number of ultra-long-period pulsars that are difficult to explain with typical pulsar models. A new article explains how these pulsars might arise from massive stars in close binary systems.
Strangely Slow Sources
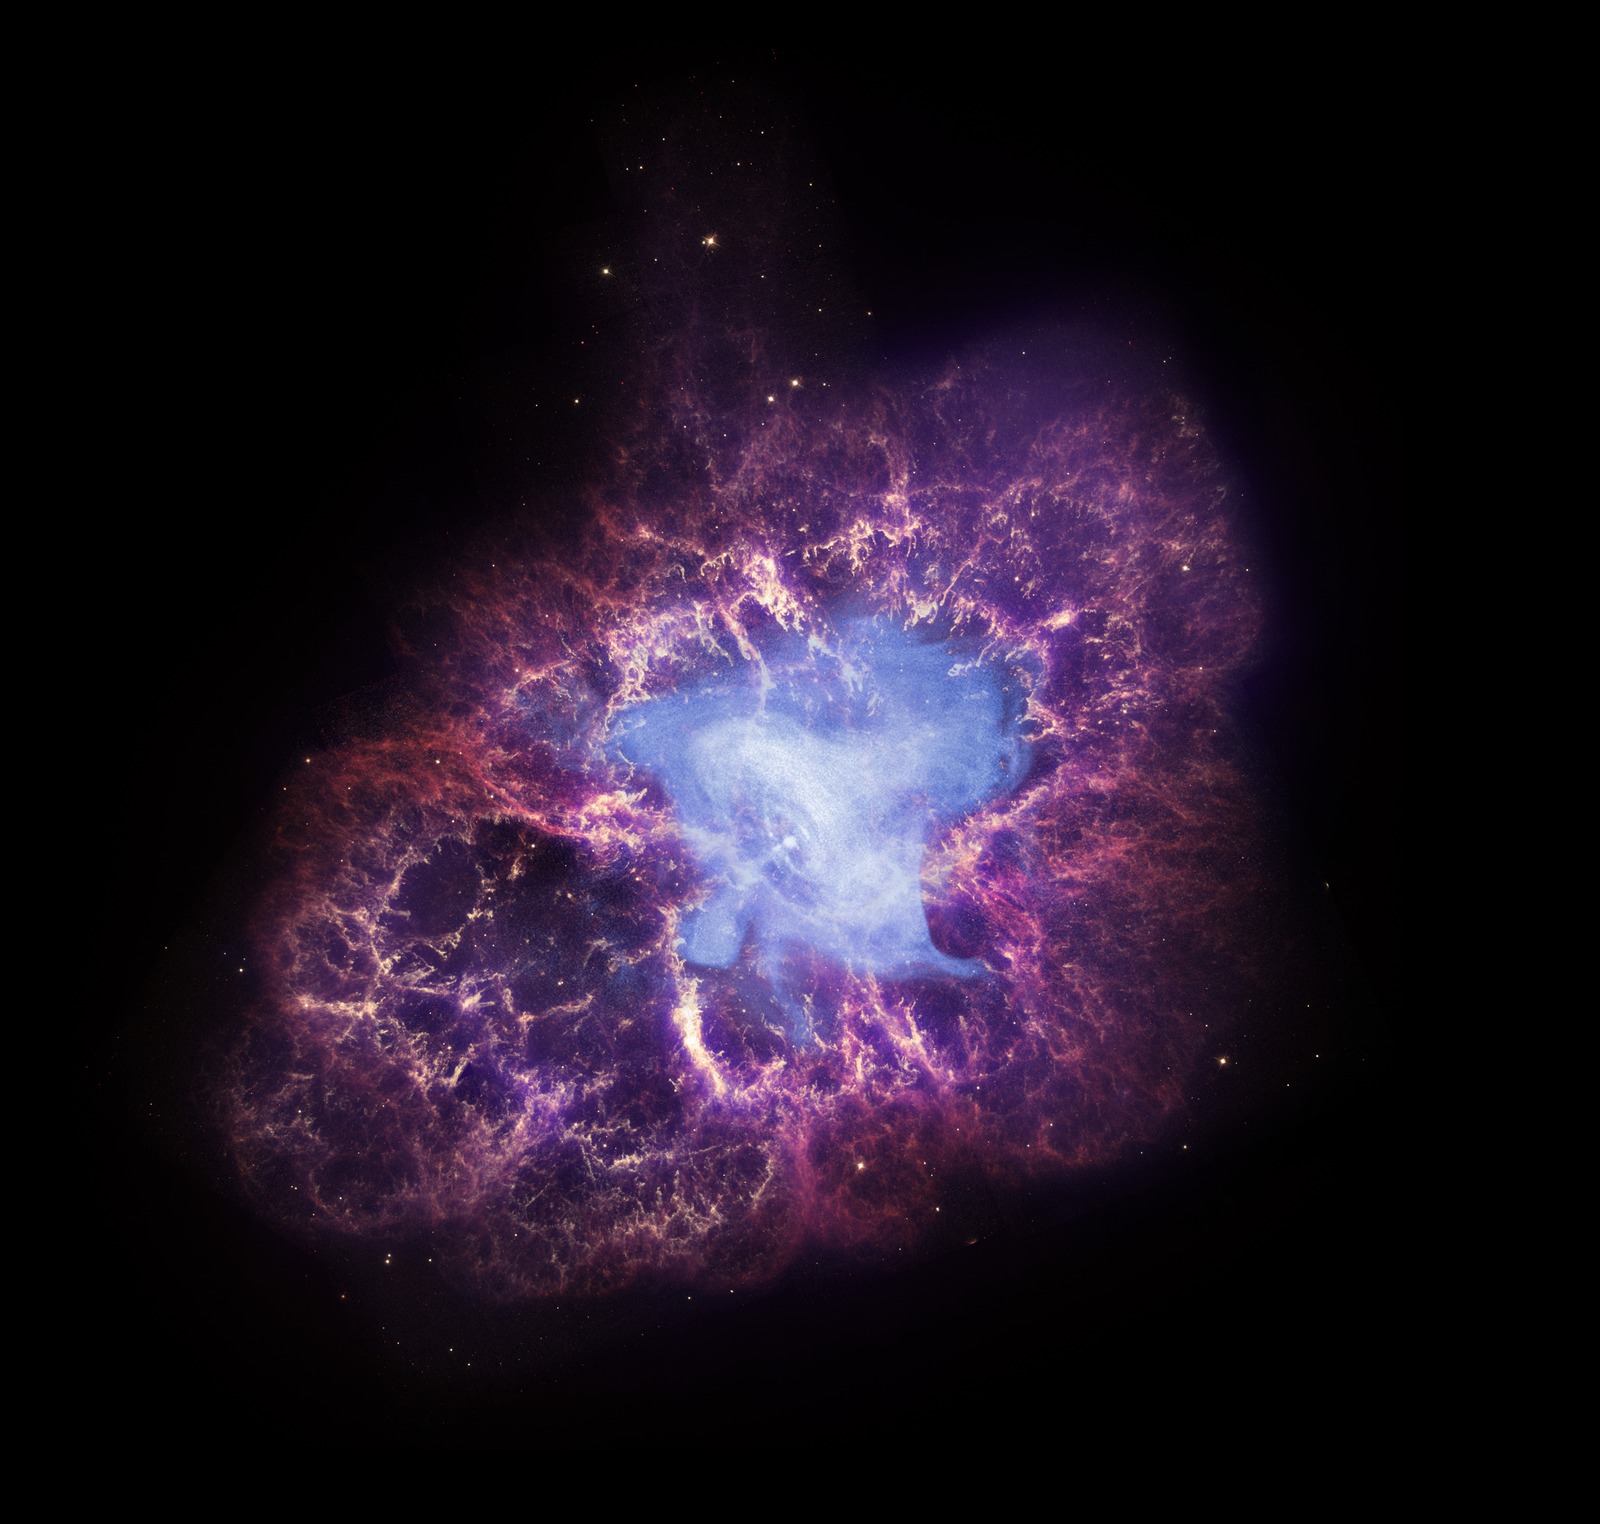
A multi-wavelength view of the Crab Nebula, the remnant of a supernova that birthed a neutron star. The neutron star powers a pulsar wind nebula, shown in blue. [X-Ray: NASA/CXC/J.Hester (ASU); Optical: NASA/ESA/J.Hester & A.Loll (ASU); Infrared: NASA/JPL-Caltech/R.Gehrz (Univ. Minn.)]
Until not too long ago, pulsars appeared to have periods no longer than 12 seconds. Above that “sluggish” rotation rate, researchers suggested, pulsars could no longer produce electron–positron pairs and channel them along polar magnetic field lines to generate their characteristic radio signals.
So it seemed, until unexpectedly slow pulsars began to crop up. The first trend-breaking pulsars had periods of a few dozen seconds, and objects with pulse periods of minutes or hours have now been found. What could these strange objects be?
Neutron Star Origin Story
In a recent article led by Savannah Cary (University of California, Berkeley), researchers proposed that these strange radio sources are pulsars, but pulsars that rotate slowly and have magnetically powered (rather than rotationally powered) radio emission.
The proposed origin story for these ultra-long-period pulsars begins with a binary system containing a massive star and a close stellar companion. As the massive star evolves, it transfers its outer layers to the companion and expires as a stripped-envelope supernova that births a rapidly spinning neutron star. As the supernova ejecta crashes into the companion star, the star heats up and expands to 5–100 times its original radius.
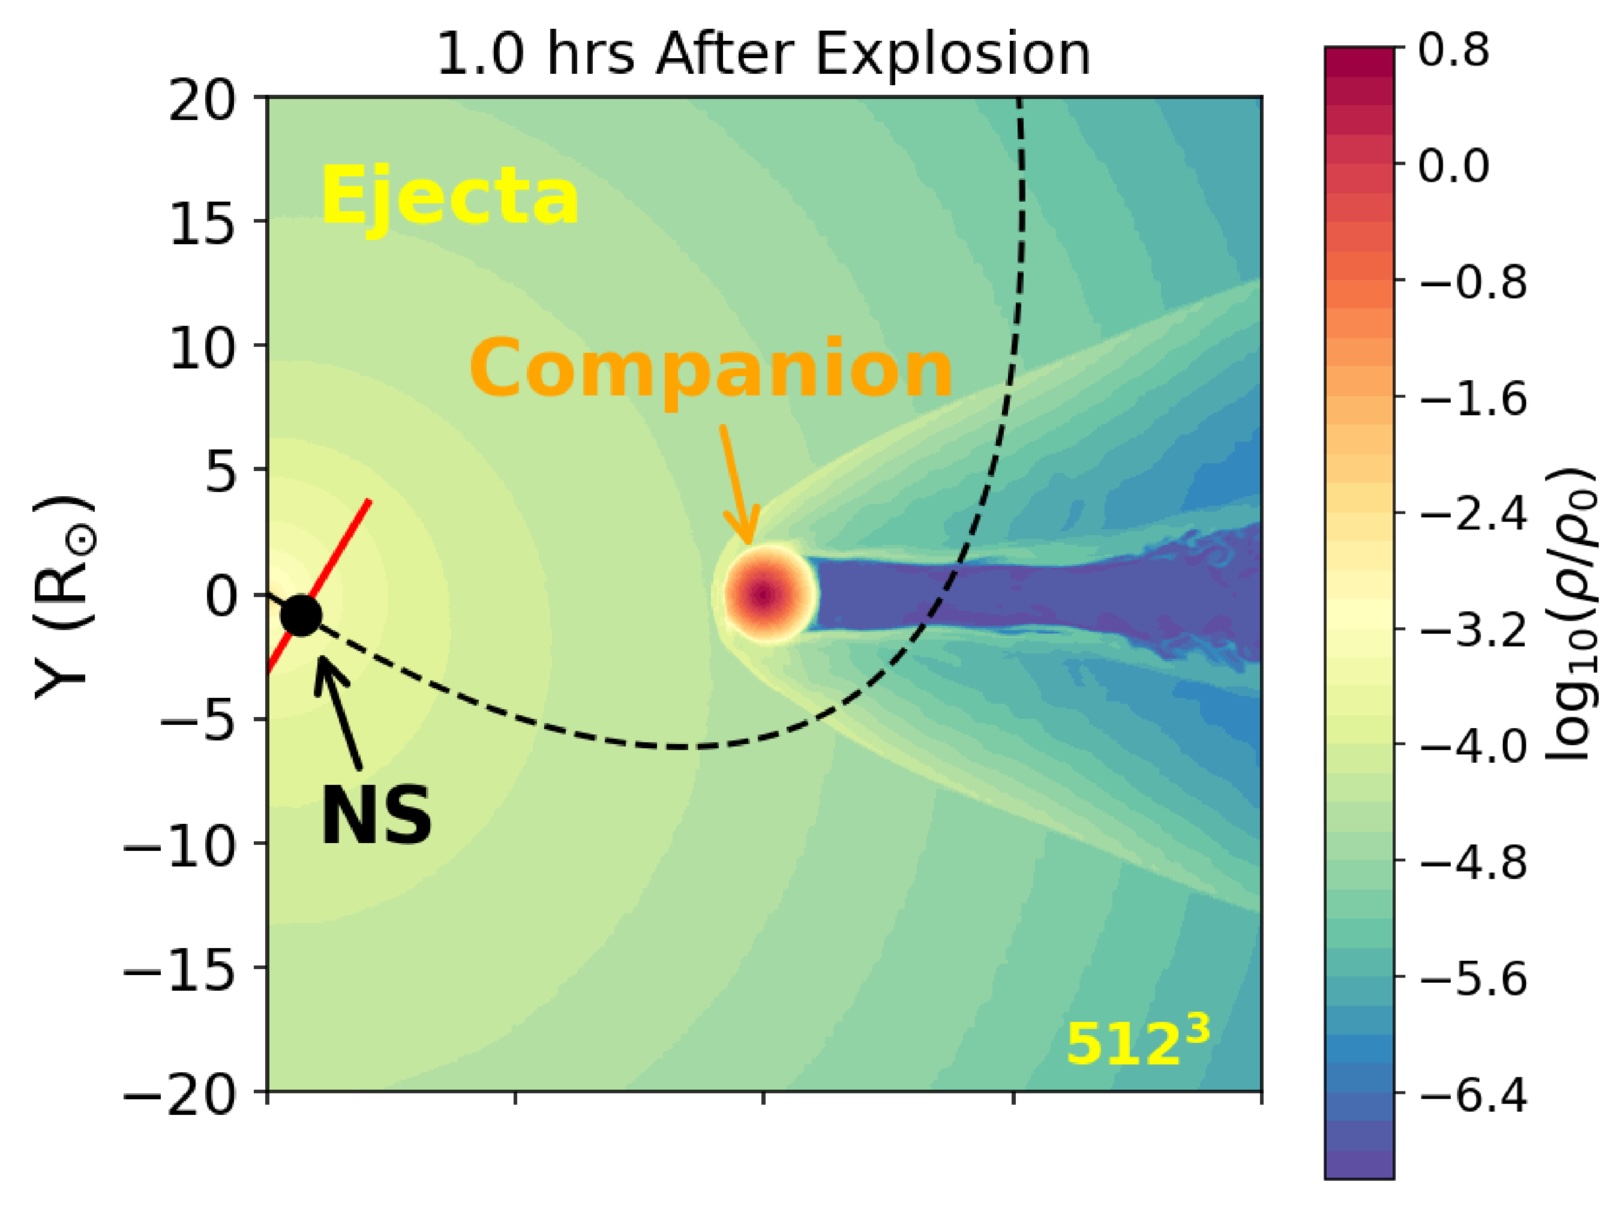
Simulation snapshot taken one hour after the supernova explosion. The black dashed line shows the path the neutron star (NS) will take through the companion star’s outer layers. Click to enlarge. [Adapted from Cary et al. 2026]
Slowing Down
Cary’s team explored the outcomes of this scenario with a trio of simulations: hydrodynamical models for the shock heating of the companion star, numerical models for the formation of the disk around the neutron star, and analytical models for the interaction between the disk and the neutron star.
For a binary system containing stars of 6.4 and 4.0 solar masses and a separation of 20 solar radii — values drawn from observations and simulations — the resulting unbound neutron star collects a disk in 8–10% of cases. The neutron star’s mass, radius, rotation rate, and magnetic field strength determine whether the neutron star and the disk will interact. If they don’t, the neutron star remains rotating rapidly like a typical pulsar. If they do, the neutron star’s rotation will slow to a relative crawl over about a million years. For modest magnetic fields between 1013 and 1014 Gauss, this means rotation periods in the realm of 102 seconds, whereas stronger magnetic fields, above 1015 Gauss, yield periods of roughly a day.
This work suggests that close binary systems could be the source of ultra-long-period pulsars, of which Cary’s team estimates there may be 10–1,000 in the Milky Way. Future work will explore this possibility further, examining broader swaths of parameter space to learn more about how this scenario could contribute to the population of ultra-long-period pulsars in our galaxy.
Citation
“Accretion from a Shock-Inflated Companion: Spinning Down Neutron Stars to Hour-Long Periods,” Savannah Cary et al 2026 ApJ 996 141. doi:10.3847/1538-4357/ae1d43
The post Supernovae, Shocks, and Spindown: A Possible Origin Story for Ultra-Long-Period Pulsars appeared first on AAS Nova.
]]>
Though less destructive than coronal mass ejections, moderate space weather events like stream interaction regions can still cause geomagnetic storms. Researchers have used machine learning to investigate the drivers behind these events.
The post When Winds Collide: Predicting the Effects of Stream Interaction Regions appeared first on AAS Nova.
]]>What happens when pileups of solar wind plasma collide with Earth’s protective magnetosphere? New work uses machine learning to examine how strongly these events affect our planet’s magnetic field.
Plasma Pileups
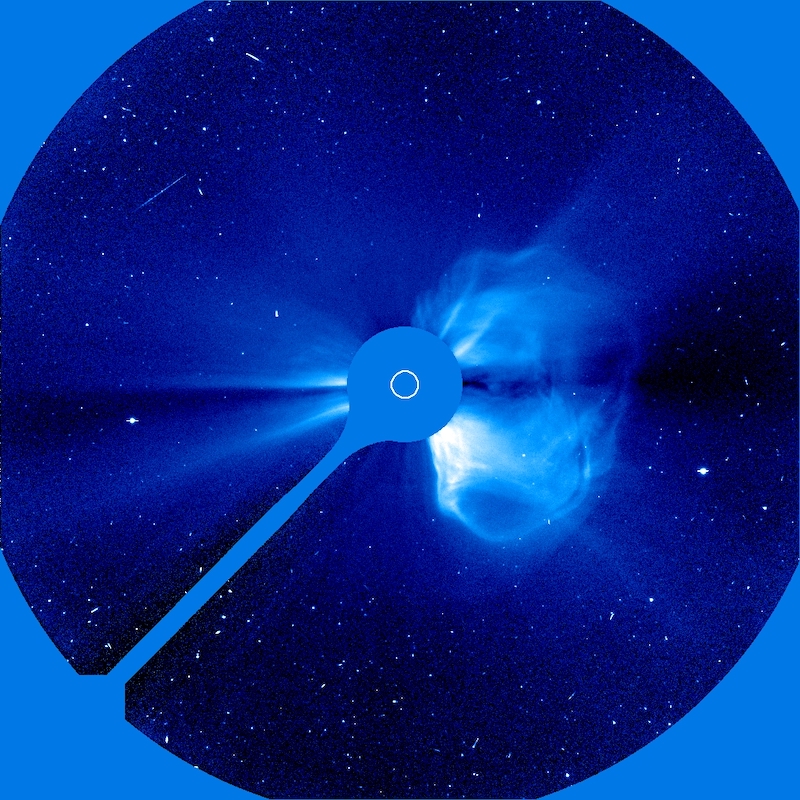
The Solar & Heliospheric Observatory (SOHO) took this coronagraphic image of a coronal mass ejection on 20 April 1998. [SOHO (ESA & NASA)]
Stream interaction regions arise when slow-moving solar wind is struck from behind by faster-moving solar wind emitted later. The collision of the two solar wind streams creates a tangle of compressed plasma and strong magnetic fields capable of peeling back Earth’s protective magnetosphere and dumping in high-energy charged particles, with beautiful yet harmful results.
Machine Learning Method
Though stream interaction regions are less disruptive than coronal mass ejections, they’re far more common; they frequently needle Earth’s magnetosphere, especially during the calmer years of the Sun’s activity cycle. Predicting how strongly a stream interaction region will influence Earth’s magnetosphere — in other words, how geoeffective it is — is challenging, however. When two streams of solar wind collide, their properties combine in complex and nonlinear ways that traditional statistical investigations have struggled to pin down.
Now, Ye and collaborators have used machine learning to study the properties and impact of stream interaction regions in a physically meaningful way. They performed their study on a sample of 879 stream interaction events for which there is abundant information, such as temperature, magnetic field strength and direction, and solar wind conditions before and after the event.
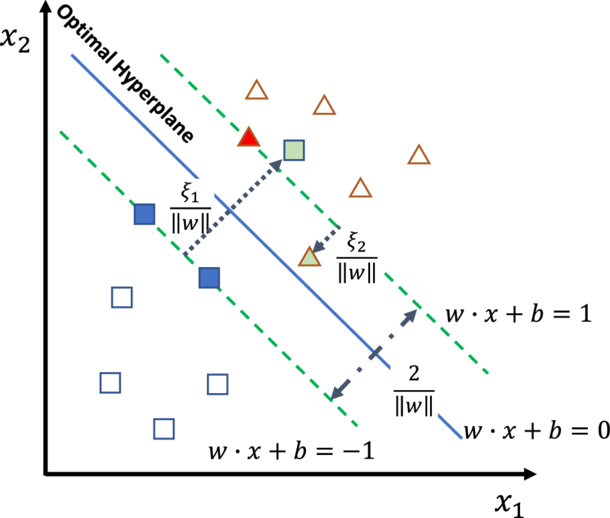
Illustration of the authors’ support vector machine framework. The optimal hyperplane is the boundary that best divides the data by maximizing the distance between the boundary and the data points nearest to it; these points are called support vectors. Square and triangle symbols represent two classes of data. Click to enlarge. [Ye et al. 2025]
A Physical Interpretation
The team first reined in the model’s complexity by identifying the most important features in the dataset. They then determined which features or combination of features had the largest contribution to the output — in other words, which physical parameters most strongly determined the geoeffectiveness of the event.
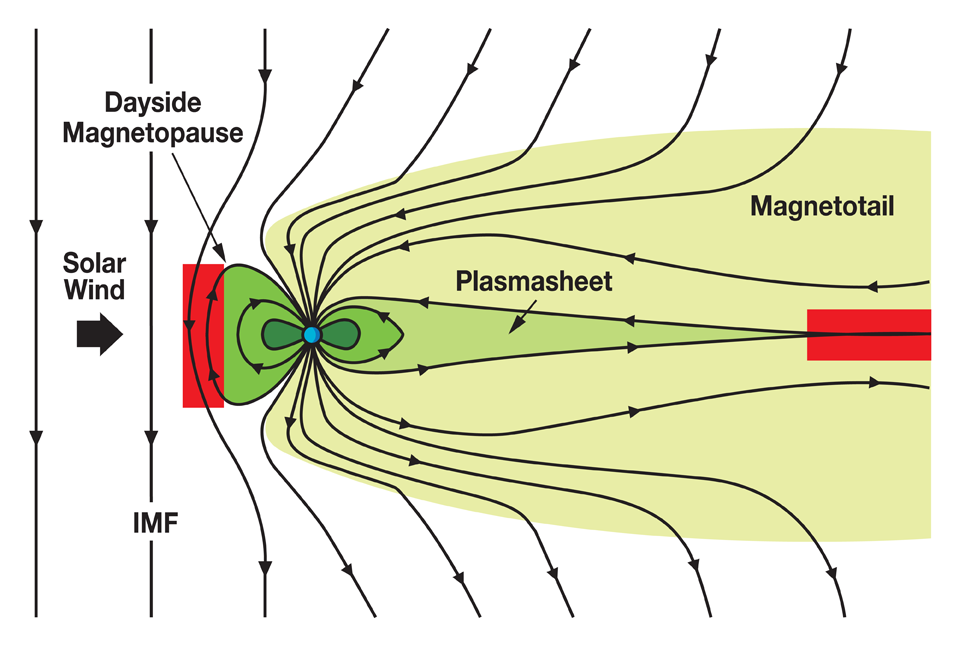
Illustration of how the interplanetary magnetic field (IMF) interacts with Earth’s magnetosphere. When the IMF points southward, as it does in this diagram, the impact on Earth’s magnetosphere is increased, with magnetic reconnection occurring in the red areas. Click to enlarge. [NASA]
Citation
“Assessing the Geoeffectiveness of Stream Interaction Regions Through Physically Interpretable Machine Learning,” Yudong Ye et al 2025 ApJ 993 10. doi:10.3847/1538-4357/ae0454
The post When Winds Collide: Predicting the Effects of Stream Interaction Regions appeared first on AAS Nova.
]]>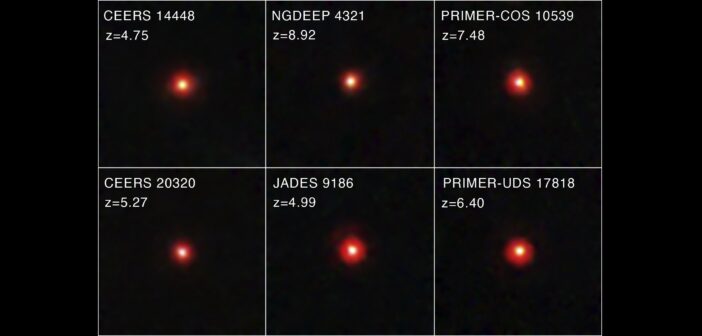
Astrobites reports on how astronomers got a closer view of the distant and mysterious little red dots.
The post A Black Hole Egg That Forgot to Hatch appeared first on AAS Nova.
]]>Editor’s Note: Astrobites is a graduate-student-run organization that digests astrophysical literature for undergraduate students. As part of the partnership between the AAS and astrobites, we occasionally repost astrobites content here at AAS Nova. We hope you enjoy this post from astrobites; the original can be viewed at astrobites.org.
Title: The Discovery of Little Red Dots in the Local Universe: Signatures of Cool Gas Envelopes
Authors: Xiaojing Lin et al.
First Author’s Institution: Tsinghua University and University of Arizona
Status: Published in ApJ
Astronomers are using JWST to search the early universe for strange and captivating objects, and the results so far have exceeded all expectations. For every question we definitively answer, several deeper ones seem to emerge. The study of active galactic nuclei (AGNs), black holes that are actively consuming matter at the centers of galaxies across the universe, is no exception. Our pre-JWST understanding of AGNs has been completely shattered by the discovery of an astounding population of objects called little red dots (LRDs).
We know these objects host active black holes for several reasons. For one, they’re incredibly small despite being extremely energetic (that’s the “little” in their name). The smallest LRD we’ve seen appears to be less than 100 light-years across — for reference, the nearest star to the Sun is 4 light-years away — and yet is still as bright as a galaxy. The most plausible explanation for such brightness and compactness is a supermassive black hole that’s actively consuming matter. As further evidence for this hypothesis, we observe broad Balmer emission lines, spectral features that serve as a clear signature of AGN activity, in the vast majority of LRDs.
However, that’s where the similarities between LRDs and more typical AGNs seem to end. First off, astronomers have been unable to detect any significant X-ray emission from LRDs. This is shocking, since X-rays are a telltale signature of previously known AGNs. Another classic way to identify AGNs is by looking for changes in their brightness over time, since they can show drastic variability in their emission on the scale of years or even days. LRDs buck the trend by showing little to no fluctuation. Other classic AGN signatures that LRDs lack include radio emission and an abundance of hot dust. Explaining all of these unusual features has been incredibly challenging; nevertheless, coming up with a solution is crucial because there appear to be orders of magnitude more LRDs than any other kind of AGN in the early universe!
Wishing on a Star
One leading explanation for LRDs has recently gained significant traction. The hypothesis suggests that early black holes may have been cocooned in shrouds of extremely dense gas. This scenario helps explain the absence of many typical AGN signatures in LRDs. For example, this dense gas could absorb the X-rays generated by the central black hole. The gas-enshrouded model also explains a particular feature in the spectra of many LRDs known as a Balmer break. This feature is usually interpreted as coming from old stars with relatively cool atmospheres. The cocooned AGN hypothesis implies that Balmer breaks could actually be made by a black hole embedded in a cloud of gas, which somewhat resembles an enormous star!
This model helps explain the properties of some puzzling LRDs, including the most distant one we currently know of. However, their enormous distance makes them difficult to study in detail. It would be much easier to examine LRDs if they existed in the nearby universe, since they would appear much brighter and we could probe them on small spatial scales. Unfortunately, previous studies with JWST suggest that LRDs started becoming a lot less common around 12 billion years ago (corresponding to a redshift of about z = 4).
Luckily, less common doesn’t mean extinct! The authors of today’s article leverage data from the Sloan Digital Sky Survey (SDSS), which has taken millions of spectra of objects across the night sky over the past few decades. By mining this rich and diverse dataset, they identify a handful of LRDs in the nearby universe. Although they’re still far beyond our own Local Group, they’re practically in our backyard compared to the distant LRDs we’ve seen before. The authors followed up the new sources with some of the most powerful ground-based telescopes, enabling a detailed study of their properties.
A Chick That Forgot to Hatch
The first major result is that these local LRDs really do resemble many of the distant ones identified by JWST. They show a characteristic “V”-shaped spectrum in the ultraviolet and visible, a key feature in the definition of LRDs. They’re also quite compact. Using existing data from the Hubble Space Telescope, the authors measured the size of one source and found a tiny core embedded within a galaxy only a few thousand light-years across. For comparison, the Milky Way spans about 100,000 light-years.
Using spectroscopy from the Large Binocular Telescope, one of the Magellan Telescopes, and the MMT (formerly Multiple Mirror Telescope), the authors of this article find a rich variety of spectral features. This is where the proximity of these objects is extremely important. Taking spectra of the distant LRDs in this astounding level of detail would be at best prohibitively expensive (multiple full days of JWST observations) and at worst be completely impossible. In contrast, the nearby LRDs appear much brighter than their distant cousins. Their spectra are like intricate tapestries, with each thread revealing new details about their properties.
The authors find numerous broadened emission lines, signaling the presence of an active black hole. They also detect several intriguing absorption lines. These are most striking in one source, J1025+1402, nicknamed “The Egg.” In this object, there are clear absorption features from sodium, potassium, iron, and calcium. These elements appear in the observed states only under specific physical conditions. The authors interpret these findings as implying the presence of an envelope of cool gas surrounding the central black hole (see Figure 1). Such a scenario closely resembles the gas-cocooned AGN model proposed to explain distant LRDs!
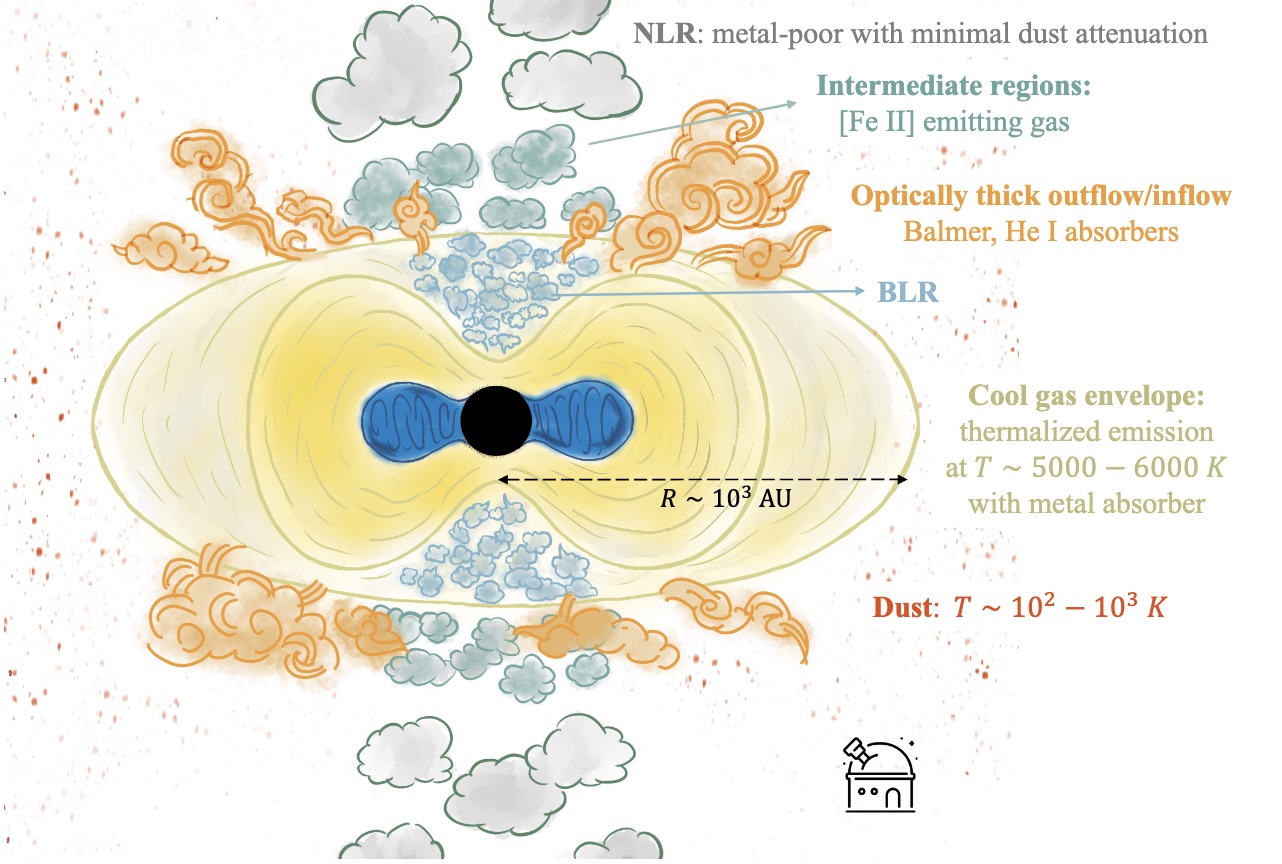
Figure 1: A schematic showing the authors’ interpretation of the nature of LRDs. This scenario is built up based on spectroscopic observations from several ground-based telescopes. Although the local sources differ slightly from the ones in the early universe, this model is strikingly similar to the ones invoked to explain some of the most extreme LRDs. The fact that such objects exist in the nearby universe is intriguing and raises further questions as to how black holes enter such a phase. [Lin et al. 2026]
Original astrobite edited by Niloofar Sharei.
About the author, Ansh Gupta:
I’m an astronomy graduate student at the University of Texas at Austin working with Steven Finkelstein. I use data from JWST to study the formation and growth of the first galaxies and black holes in the universe. In my spare time, I enjoy playing piano, reading, and making YouTube videos.
The post A Black Hole Egg That Forgot to Hatch appeared first on AAS Nova.
]]>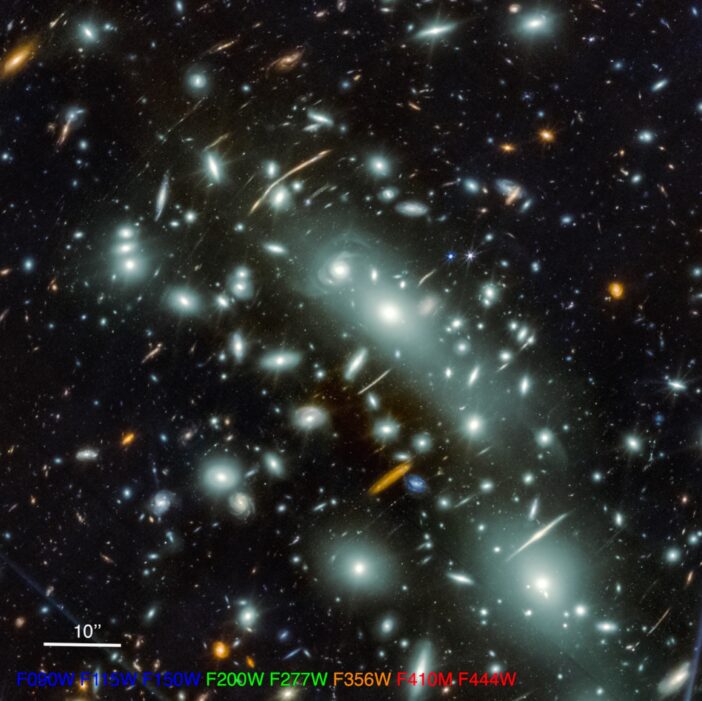
The CANUCS survey brought five galaxy clusters into focus, painting a portrait of galactic life in the early universe.
The post Featured Image: Galaxy Cluster in Technicolor appeared first on AAS Nova.
]]>The expansive collection of galaxies pictured here is MACS J0416, a galaxy cluster located about 4.3 billion light-years away. (Click the image for the full view!) MACS J0416 is one of five clusters targeted by the Canadian NIRISS Unbiased Cluster Survey (CANUCS). This survey takes advantage of the spacetime-bending abilities of massive galaxy clusters and uses JWST’s Near-Infrared Imager and Slitless Spectrograph (NIRISS) and Near-Infrared Camera (NIRCam) to paint a detailed multi-wavelength portrait of galaxies in the early universe. Three of the CANUCS galaxy clusters, including MACS J0416, were investigated even more closely in the follow-up JWST in Technicolor program, which added precise spectroscopic redshifts and broadened the wavelength coverage of parallel fields of view. In a recent publication led by Ghassan Sarrouh (York University), the CANUCS team outlined the design of these programs and their data products, which enabled the study of roughly 53,000 galaxies within the galaxy cluster fields and an additional 44,000 galaxies in adjacent fields. To learn more about the CANUCS and JWST in Technicolor programs, be sure to check out the full research article linked below.
Citation
“CANUCS/Technicolor Data Release 1: Imaging, Photometry, Slit Spectroscopy, and Stellar Population Parameters,” Ghassan T. E. Sarrouh et al 2026 ApJS 282 3. doi:10.3847/1538-4365/ae1611
The post Featured Image: Galaxy Cluster in Technicolor appeared first on AAS Nova.
]]>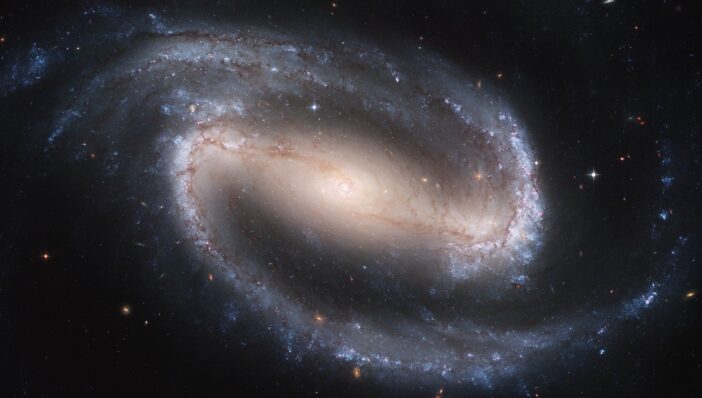
On the final day of AAS 247, researchers described early signs of spiral galaxy structures, gravitational wave astronomy performed with pulsars, and measurements of baryon acoustic oscillations.
The post AAS 247: Day 4 appeared first on AAS Nova.
]]>Editor’s Note: This week we’re at the 247th AAS meeting in Phoenix, AZ. Along with a team of authors from Astrobites, we will be writing updates on selected events at the meeting and posting each day. Follow along here or at astrobites.com for daily summaries, or follow @astrobites.bsky.social on Bluesky for more coverage. The usual posting schedule for AAS Nova will resume on 12 January.
Table of Contents:
- 2025 Annie Jump Cannon Award Lecture: Gravitational Waves from the Stellar Graveyard, Maya Fishbach (University of Toronto)
- Press Conference: High Redshifts and High Energies
- Bruno Rossi Prize Plenary: The Dawn of Low-Frequency Gravitational Wave Astronomy, Maura McLaughlin (West Virginia University) & Xavier Siemens (University of Wisconsin, Milwaukee), on behalf of the NANOGrav Collaboration
- Press Conference: Active Galactic Nuclei Across the Universe
- From CubeSats to Flagships: Innovation Through Exoplanet Exploration, Evgenya Shkolnik (Arizona State University)
- Lancelot M. Berkeley – New York Community Trust Prize Lecture: Measuring Cosmic Sound with DESI, Daniel Eisenstein (Harvard University), on behalf of the DESI collaboration
2025 Annie Jump Cannon Award Lecture: Gravitational Waves from the Stellar Graveyard, Maya Fishbach (University of Toronto) (by Bill Smith)
Maya Fishbach delivered her Annie Jump Cannon Award plenary on what we have learned about binary black holes from the LIGO, Virgo, and KAGRA (LVK) detectors. She began by explaining that gravitational waves are tiny ripples in spacetime created when massive, compact objects orbit and merge. LVK detects these ripples with laser interferometers that measure minute changes in the length of kilometer-scale arms. After several observing runs and hundreds of detections, the field has evolved from studying just individual events to analyzing the full population of binary black hole mergers.
To understand this population, we first ask how these black holes form astrophysically. Fishbach outlined multiple formation channels. The most well known channel is stellar binary evolution: two massive stars in a binary orbit live and die together, eventually becoming binary black holes that later merge. Another channel is dynamical formation in dense star clusters, where black holes can pair up and merge simply because the environment is crowded. Crucially, key properties of a merger are encoded in the gravitational waveform, especially the masses and spins of the black holes, and these can offer clues about which channel produced a given event.
Fishbach then described how population models fit these properties across many events. For example, the mass distribution, as a first-order approximation, can be approximated by a power law. LVK models incorporate measurement uncertainties and selection effects, recognizing that the detectors are more sensitive to some signals than others. They also include more complex models than simple power laws. A central component of this story is the pair-instability mass gap, a theoretically predicted mass range in which normal stellar evolution should not produce black holes. Early LVK population studies found black holes in this gap, prompting new ideas about how black holes could exist there. The leading explanation is hierarchical mergers: two black holes merge to form a heavier remnant, which later merges with a third black hole. LVK researchers refer to first-generation black holes as 1g, second-generation as 2g, and label events accordingly, for example a “1g+1g merger” or “1g+2g merger.”
She highlighted several recent results from population studies. Work by Claire Shi Ye shows a small subpopulation where both merging black holes lie in the mass gap. Hui Tong’s analysis focuses on the distribution of the lighter mass (also called the secondary mass) in the pair. Events with primary masses in the gap tend to have higher spins, a pattern consistent with hierarchical formation scenarios.
She concluded with additional evidence of generational mixing in the population, including work suggesting a population of 2g+1g mergers at lower masses, and newer analyses that are increasingly confident in separating the mass distributions of first- and second-generation black holes. Research by Amanda Farah and Aditya Vijaykumar indicates that 2g+1g mergers are more common at higher redshifts.
Fishbach concluded by thanking her LVK collaborators, the University of Toronto/CITA, and the Compact Objects and Other Loosely Related Stuff (COOLS) group.
You can read Astrobites’s interview with Maya Fishbach here.
Press Conference: High Redshifts and High Energies (Briefing video) (by Drew Lapeer)
An Unlensed Barred Spiral Before Cosmic Noon
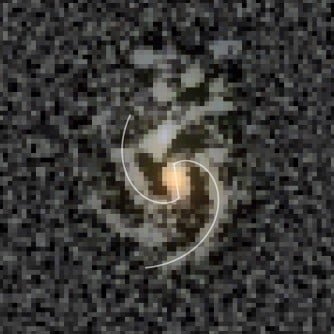
The barred spiral galaxy COSMOS-74706, seen as it was just 2 billion years after the Big Bang. [Daniel Ivanov]
At this morning’s press conference, Daniel Ivanov (University of Pittsburgh) presented results on a barred spiral galaxy in the early universe. At a redshift of z = 3.1591, or just 2 billion years after the Big Bang, this is the most distant barred spiral galaxy ever detected without gravitational lensing. Ivanov and collaborators confirmed the presence of the bar feature using three independent analysis methods. They hope to get further observation time with JWST to further understand the distant galaxy, placing it in a cosmological context to better understand galaxy evolution. | Pitt Press Release | UMass Press Release
A Precessing Radio Jet Drives Super-Heated Gas Outflows from a Disk Galaxy
Thursday morning, Vivian U (Caltech/IPAC) presented new multi-wavelength results studying the active supermassive black hole (SMBH) in nearby galaxy VV340a. Active SMBHs rapidly accrete gas from their surroundings, and they can drastically influence their host galaxy by injecting some of that gas into the surrounding environment.
JWST observations revealed an extended jet of heated gas emerging from the galaxy’s central region. While such features are common in galaxies with active SMBHs, VV340a’s jet is unique due to its size and orientation. The jet is significantly longer than other examples, stretching at least 20 light-years outward from the galaxy’s center (typically, jets are ~10x smaller). In addition, the jet isn’t perpendicular to the galaxy disk, suggesting that the jet is shifting its orientation over time.
Archival data from the Very Large Array (VLA) radio telescope revealed a colder, older, more extended component of the jet, providing a “fossil record” to study the system. From the data, Vivian U and collaborators estimated the speed at which the jet is moving, finding a precession period of ~820,000 years. Using data from Keck, they also estimated the rate at which the jet is depleting the galaxy’s gas reservoir. The deduced mass outflow rate of 19 solar masses per year suggests that the galaxy is using up its reservoir quickly, unless an additional inflow of gas is present to sustain the loss. Several scenarios could produce this wobbly jet — such as two SMBHs in the center of VV340a or an instability in the disk of material surrounding the SMBH. More data is needed to fully confirm the nature of the system. While this is a benchmark case for synergetic observations of active SMBHs, more data is needed to fully understand the system. | Keck Press Release | NRAO Press Release
A Close Quasar Pair in a Massive Galaxy Merger at z = 5.7
Quasars, some of the most luminous objects in the universe, are powered by rapidly accreting supermassive black holes (SMBHs). When two galaxies merge, dormant SMBHs in one, or both, of the galaxies can be triggered, with the latter being exceptionally rare. Such systems are called “quasar pairs.” In Thursday’s press conference, Minghao Yue (University of Arizona) presented new results showcasing a new close quasar pair in two merging galaxies at a redshift of z = 5.7.
The two sources, named J2037-4537, were initially found in 2021 and marked as the first double quasar candidate at z > 5. Dedicated follow up observations from the ALMA radio telescope confirmed that the pair were indeed two individual, physically close galaxies with quasars in their center. Such a system at z > 5 places important constraints on galaxy evolution models, with the search for similar systems still ongoing. Yue and collaborators are hoping to obtain follow up observations with JWST to further understand the groundbreaking system.
An Ultra-Luminous Fast Transient Powered by Rapid Accretion of a Star onto a Black Hole
In 2018, a new enigmatic transient event was detected. These so-called Luminous Fast Blue Optical Transient events are as bright as, or brighter than, supernova explosions, but they disappear much faster. Initial work proposed many models to explain observations of these events, such as stars being destroyed by massive black holes. Since 2018, several other events have been detected, but follow-up observations always occurred too late to constrain the physical origin of the emission.
Daniel Perley (Liverpool John Moores University) announced Thursday that a new event had been detected, named AT2024wpp. The event was originally detected in data from the Zwicky Transient Facility, with follow up observations from Keck. AT2024wpp is one of the most luminous cosmic explosions ever detected, with a peak brightness of 100 billion times that of our Sun. Follow-up observations failed to reveal an expected abundance of spectral lines, challenging theories on the origin of these events. Follow up data from the VLA and ALMA revealed an extremely powerful shock wave passing through a zone of dense gas, moving ~20% the speed of light. To explain this event, Perley and collaborators posited that it was produced by a massive star being eaten by a black hole companion. Future observations obtaining spectra of similar events before they dim can further constrain the nature of these mysterious events. | Summary | LJMU Press Release | NRAO Press Release
Bruno Rossi Prize Plenary: The Dawn of Low-Frequency Gravitational Wave Astronomy, Maura McLaughlin (West Virginia University) & Xavier Siemens (University of Wisconsin, Milwaukee), on behalf of the NANOGrav Collaboration (by Neev Shah)
Maura McLaughlin delivered the Bruno Rossi Prize Plenary Lecture on behalf of the NANOGrav Collaboration. She mentions that Xavier Siemens, who was also going to be there to deliver the plenary, but could not make it due to travel difficulties. Her lecture is on how we use giant radio telescopes across the world to look at extremely precise pulsar clocks to search for gravitational waves. NANOGrav was started in 2007 and is now a NSF Physics Frontier Center with more than 200 members. It is also part of the International Pulsar Timing Array, which consists of a worldwide collaboration of different teams with a common goal, searching for nanohertz gravitational waves.
She starts by talking about how electromagnetic observations over decades have shown us that galaxies grow and evolve through mergers. Most galaxies contain a central supermassive black hole (SMBH). When two galaxies merge, their respective central SMBHs can come close to each other and form a SMBH binary (SMBHB). However, she mentions that we don’t understand the behaviour of SMBHB at close separations very well, commonly referred to as the “final parsec problem.” We also cannot easily study SMBHB through electromagnetic observations, which is where gravitational waves enter the picture.
Locations of pulsars (blue stars) in the NANOGrav pulsar timing array relative to the location of the Sun (yellow star). Some pulsar locations are approximate. Click to enlarge. [Ross Jennings / NANOGrav; CC BY 4.0]
Speaking about the dataset, she highlights that NANOGrav observed 68 millisecond pulsars with various radio telescopes such as GBT, Arecibo (rip!), VLA and CHIME. She mentions that a key step in studying pulsars is fitting the arrival times of their pulses with a timing model, which takes into account all the effects that can cause changes in their arrival times. The next step is to search for gravitational waves by cross-correlating the residuals in the timing data of all the pulsars, where the residuals are what is left in the data after subtracting out the timing model. As the stochastic background has a red noise, they search for such a spectrum in their timing residuals as well.
However, she cautions that there could be many other sources of noise, as pulsars are not perfect rotators; there are pulse jitters and various other effects that need to be carefully accounted for. However, all these noise sources have different signatures, and the gravitational wave background has a unique noise signature that can be teased out in the data.
After decades of accumulating data, in June 2023, NANOGrav, along with various other pulsar timing array collaborations across the world announced the discovery of the stochastic gravitational wave background. She emphasizes that finding the background is just the initial step. But more importantly, what do we learn from it? They find that the slope of the spectrum is consistent with what is expected of SMBHBs, but the signal is also in agreement with many other exotic scenarios. They also perform searches for gravitational waves from individual SMBHBs, and although they do not find any evidence for a signal, they are able to place constraints that will significantly improve in the future.
Speaking about the future, she highlights that NANOGrav is currently working on their 20-year-long dataset. She also shows a preliminary Hellings–Downs curve, which is now much more tightly constrained than in the original discovery paper. The worldwide collaboration of various pulsar timing arrays, called the IPTA, is working on their third data release, which will be the most sensitive dataset in the world for searchers for nanohertz gravitational waves. She also mentions that with improved radio instrumentation and new telescopes such as the Deep Synoptic Array, they will be able to detect and study many more pulsars. With an amazing sensitivity, they expect that many tens of SMBHBs could be detected, and there could also be synergy with electromagnetically identified sources for targeted searches, embarking on a new era in multimessenger astronomy.
You can also read Astrobites’s interviews with Maura McLaughlin and Xavier Siemens.
Press Conference: Active Galactic Nuclei Across the Universe (Briefing video) (by Lexi Gault)
Hidden Hearts: The Central Galactic Structures That Grow Black Holes
Sky surveys have revolutionized our understanding of galaxy-wide morphologies — observations of galaxies across the sky reveal various structures and shapes that can clue us in to what may be happening inside these galaxies. Michael Koss (Eureka Scientific, Inc.) presented the importance of high-resolution imaging of nearby galaxies. Sometimes missed in shallower surveys, higher resolution observations from the Hubble Space Telescope and Keck often reveal detailed internal structures like nuclear dust lanes, spiral arms, and clumpy structures. These features, Koss pointed out, could provide fuel for active supermassive black holes within these galaxies. With planned missions like Euclid and Roman, these telescopes will be able to see through obscured galaxy light and reveal things like mergers and detailed structures that provide better insights into the internal structures and mechanisms of galaxies. Given the volumes of these surveys, citizen scientists can help through Galaxy Zoo to classify galaxies with these types of structures, supporting community engagement while pushing a science goal forward.
From Dwarfs to Giants: A Complete Census of Active Galactic Nuclei
How common are active supermassive black holes? Mugdha Polimera (Center for Astrophysics | Harvard & Smithsonian) presented a census of active galactic nuclei in galaxies across a range of masses. Using different search methods for different galaxy types, the team was able to decipher active black hole light from the glare of star formation. This study included 8,000 galaxies and found that only 2–5% of dwarf galaxies house an active black hole. While this value is up from previous studies estimating only about 1% for dwarfs, this fraction is still far below what Polimera’s team measured for medium and large galaxies, 16–27% and 20–48%, respectively. Looking further into galaxy properties, the dwarf population tends to have little dust, high star formation activity, and high gas content. Despite having ample fuel for hungry black holes, dwarf galaxies rarely house an accreting central black hole. Further investigation is necessary to determine if this is driven by detection limitations or physical properties in dwarf galaxies suppressing supermassive black hole accretion. | Press release
Monsters and Misalignment: Do Active Galactic Nuclei Influence Counter-Rotation in Low-Mass Galaxies?
Within galaxies, we anticipate the gas and stars to generally orbit the galactic center together, but this is not always the case. Low-mass galaxies, which are more susceptible to mass loss from multiple avenues, are sometimes observed to have misaligned gas and stellar rotation. Dominic Schwein (Colorado College) and team were curious if active galactic nuclei could be the culprit of this phenomenon. Using Sloan Digital Sky Survey MaNGA spectroscopy, they were able to map the velocities of the stars and gas in detail for 94 small galaxies with active galactic nuclei (AGN). Through their analysis, they found that counter rotation — when the stars and gas rotate in opposite directions — is much more common in galaxies with AGN, with 52% counter rotating. This analysis provides clues to how AGN can impact their host galaxies, with AGN feedback likely redistributing the gas content leading to counter rotation. Comparing the 94 galaxies to a broader sample of 3,000 galaxies, they find that galaxies with misaligned stars and gas are more likely to host AGN. This study is helping to improve the understanding of AGN and their influence on their host galaxies. | Press release
Galactic Rain: Cool Gas Inflows in Red Geyser Galaxies
One of the important questions in galaxy evolution is how galaxies stop forming stars. Theory predicts that supermassive black holes can suppress star formation in their hosts by heating up the gas, preventing it from collapsing into new stars. However, observations have revealed that some AGN inhabit star-forming galaxies, meaning their impacts on star formation may be a bit more complicated. Looking at a rare galaxy class, red geysers, Arian Moghni (University of California, Santa Cruz) and collaborators sought to understand how some AGN still appear star-forming. The ionized gas in red geysers appears to be outflowing and does not indicate star formation, which is assumed to be the impact of the AGN. However, if gas is being pumped out, what is keeping the AGN active? Moghni looked into the cold gas using specific chemical tracers that can reveal the location and motions of the cool gas in the galaxy. Through this analysis, they found that the cool gas seems to be inflowing into the red geysers, keeping their supermassive black holes active. The exact origins of this cool inflowing gas are not yet fully understood, but it could be accreted from the local environment or from interactions with nearby galaxies. From their analysis, the team found that interactions are the likely culprit, maintaining the AGN activity and keeping star formation in red geysers suppressed. | Press release
From CubeSats to Flagships: Innovation Through Exoplanet Exploration, Evgenya Shkolnik (Arizona State University) (by Lexi Gault)
A professor at Arizona State University, Evgenya Shkolnik presented this afternoon’s plenary on the interconnection between the smallest satellites and the largest flagship missions in the context of exoplanetary science. In order to understand the missions we need, she took us back to the basics, starting with a big science question. For Dr. Shkolnik, a big science question is one that takes many people and often multiple generations to get to the answer. This requires us to break these large-scale questions into more manageable objectives and needed measurements in order to reach the broader science goals.
In exoplanetary science, one of the big driving questions is, “are we alone?” This question, though only three words, is massive in scope scientifically. To search for life, we need to understand exoplanet populations, atmospheric biosignatures, and how a planet’s host star shapes its atmosphere and environment. No single instrument or mission can target every science objective at once; thus, we need an ecosystem of tools to solve big science questions. For example, the first exoplanet discoveries required a variety of telescopes and teams of people to achieve these breakthroughs.
To date, there have been more than 6,000 exoplanets discovered through a variety of methods, with a combination of on-ground and in-space telescopes. From these discoveries, we have learned that exoplanets are everywhere, and they are extremely diverse. Excitingly, it has been estimated that about 25% of all stars have rocky planets in the habitable zone — the atmospheres of these planets are the keys to keep them habitable. However, as we experience solar flares and weather from the Sun here on Earth, the stellar environment a planet is exposed to regulates its atmosphere and subsequent habitability. Therefore, understanding stellar activity and the high energy photon emission at an exoplanet’s orbit is critical in the search for life.
Launching in the early hours on Sunday, 11 January, SPARCS, the Star–Planet Activity Research CubeSat, is a small telescope that will stare at 20 stars for a month each in order to catch ultraviolet flares. This little but significant telescope will collect a wealth of stellar activity data, providing insights into the environments in which potentially habitable planets reside. Not only does SPARCS enable important observations, but it will also test technology that may be employed on future flagships like the Habitable Worlds Observatory.
SPARCS is an example of a small instrument that is part of a larger ecosystem of astronomical tools to explore the universe. Dr. Shkolnik provides a framework for us to consider when thinking about building our science: scaling up, laddering up, and pairing up. Scaling up allows us to build better instruments that provide better measurements. Laddering up connects smaller projects that contribute science results and instrument testing to multiple larger missions that come after them. Pairing up allows us to pull together multiple missions that work simultaneously to address the same big science questions. As we move forward, thinking about these aspects will improve both small- and large-scale missions, making science goals ambitious and achievable.
Lancelot M. Berkeley – New York Community Trust Prize Lecture: Measuring Cosmic Sound with DESI, Daniel Eisenstein (Harvard University), on behalf of the DESI collaboration (by Bill Smith)
Daniel Eisenstein accepted the Lancelot M. Berkeley – New York Community Trust Prize for Meritorious Work in Astronomy on behalf of the DESI collaboration. His plenary talk, Measuring Cosmic Sound with the Dark Energy Spectroscopic Instrument DESI, focused on the physics of baryon acoustic oscillations, the DESI instrument, the latest cosmological results, and what those results mean for the future of cosmology.
He began with the hot Big Bang model, which posits that the very early universe was hot, dense, and nearly smooth, and that it cooled and developed structure over time. This framework has been remarkably successful, explaining much of cosmology with a small set of parameters and well-understood physics. In this model, small inhomogeneities in the early universe grew through gravity into the web of galaxy clusters we see today, and measuring this large scale structure has been one of the most powerful tests of the Big Bang model. A key component of this picture is dark energy, the somewhat recently discovered phenomenon driving the accelerated expansion of the universe.
This is where baryon acoustic oscillations, or BAO, come in. BAO are sound waves from the very early universe, roughly 400,000 years after the Big Bang. Before that time, the universe was hotter and ionized, and photons exerted large pressure and restoring forces on baryons. Overdensities in this matter distribution generated spherical sound waves that propagated at approximately 57% of the speed of light. At the epoch of recombination, the baryons cooled, became neutral, and photons began to travel freely. The sound speed then dropped rapidly, freezing in the pattern of those waves. The result is a faint but measurable statistical imprint in the clustering of matter that persists through cosmic time. Because the expected separation scale of this imprint depends only on the sound speed and the propagation time, it can be used as a standard ruler for measuring distances across the universe.
After outlining the BAO theory, Eisenstein turned to DESI, which was designed to map cosmic expansion and the growth of structure through BAO. Building on the legacy of the Sloan Digital Sky Survey, DESI has mapped about 40% of the sky from redshift z = 0 to z = 3.5. Over four and a half years, through spectra, DESI has measured 45 million extragalactic redshifts and observed 18 million stars.
He then presented the BAO constraints from DESI Data Release 2, which are the tightest to date. He presented correlation functions for several galaxy samples, each revealing a clear BAO signal at the expected separation distance, and he added independent BAO evidence from the Lyman-alpha forest. In the final part of the talk, Eisenstein discussed the implications of these and other DESI results for LambdaCDM cosmology. He emphasized the strong synergy between BAO and Type Ia supernovae as complementary distance probes. When used independently, the BAO-based estimate of the Hubble constant differs from the value inferred from supernovae, further reinforcing the growing issues of the “Hubble tension.” He also presented analyses showing that DESI’s results favor models with evolving dark energy over a simple constant dark energy, and that this preference strengthens when cosmic microwave background and supernova data are included.
He closed by touching on other DESI measurements, including the Alcock Paczynski effect and measurements of gravitational lensing of the cosmic microwave background. Together, these results point to a rapidly improving picture of cosmic history and highlight how DESI’s precise mapping of structure can sharpen our understanding of the universe’s contents and evolution.
The post AAS 247: Day 4 appeared first on AAS Nova.
]]>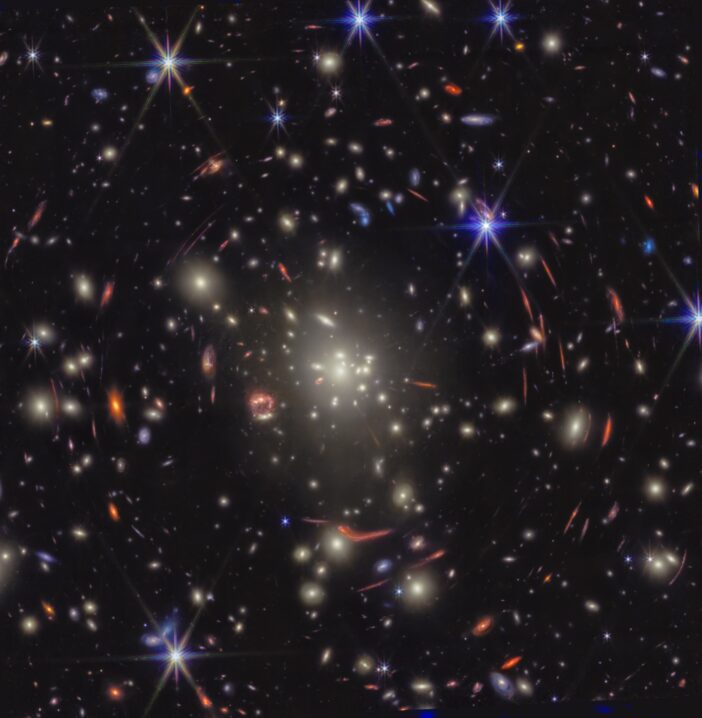
On Day 3 of AAS 247: a record-breaking asteroid, a discussion of science policy, and a supernova that we might hear about again at AAS 367!
The post AAS 247: Day 3 appeared first on AAS Nova.
]]>Editor’s Note: This week we’re at the 247th AAS meeting in Phoenix, AZ. Along with a team of authors from Astrobites, we will be writing updates on selected events at the meeting and posting each day. Follow along here or at astrobites.com for daily summaries, or follow @astrobites.bsky.social on Bluesky for more coverage. The usual posting schedule for AAS Nova will resume on 12 January.
Table of Contents:
- Plenary Lecture: Sharp New Views of the Interstellar Medium of Nearby Galaxies, Adam Leroy (Ohio State University)
- Press Conference: Asteroids, Low-Mass Stars, and a Mystery from History
- Plenary Lecture: Partisan Disparities in the Use, Funding, and Production of Science, Alexander Furnas (Northwestern University)
- Press Conference: Cosmology and Galaxy Clusters
- 2025 Dannie Heineman Prize Lecture: Unveiling the First Black Holes in the Universe, Priyamvada Natarajan (Yale University)
- Plenary Lecture: Probing the Accretion History of AGN using X-Ray and Multi-Wavelength Surveys, Tonima Tasnim Ananna (Wayne State University)
Plenary Lecture: Sharp New Views of the Interstellar Medium of Nearby Galaxies, Adam Leroy (Ohio State University) (by Niloofar Sharei)
Adam Leroy’s plenary talk showed how new high-resolution surveys are transforming our view of the interstellar medium (ISM) in nearby galaxies. He framed the ISM as the gas and dust between stars, the raw material for star formation and a key link between small-scale physics and galaxy-wide evolution.
He began by showing how different wavelengths trace different phases of the ISM. Optical and ultraviolet light reveal stars, optical emission lines trace ionized gas around young stars, ALMA observations of CO trace cold molecular gas where stars form, and JWST infrared images reveal dust, polycyclic aromatic hydrocarbons, and deeply embedded young regions. Taken together, these views place star-forming regions along an evolutionary sequence from molecular clouds to exposed star clusters. He explained about PHANGS surveys, which combine ALMA, JWST, Hubble Space Telescope, Very Large Telescope, and other facilities to study the nearest star-forming galaxies at cloud-scale resolution. Using these data, Leroy showed that molecular gas properties vary across galaxies. Lower-mass galaxies and outer disks have lower gas surface densities and narrower line widths, while massive galaxies and galaxy centers show denser gas and more energetic motions. By averaging cloud-scale measurements within regions, their team found strong correlations between molecular cloud properties and large-scale disk structure, such as stellar surface densities. This may suggest that molecular clouds are shaped by their galactic environment rather than being universal objects. He argued that these trends are consistent with molecular clouds being moderately over-pressurized relative to their surroundings.
Finally, he turned to the origin of molecular clouds from atomic gas. New Very Large Array surveys of the closest galaxies now resolve atomic hydrogen into filaments and clouds at scales comparable to molecular data. He concluded that resolved, multi-wavelength observations now allow galaxies to be dissected into individual star-forming regions which shows how gas, stars, and feedback interact across environments, with ALMA and JWST leading the way and future facilities promising even deeper insights soon.
You can read Astrobites’s interview with Adam Leroy here.
Press Conference: Asteroids, Low-Mass Stars, and a Mystery from History (Briefing video) (by Amaya Sinha)
NSF–DOE Vera C. Rubin Observatory Spots Record-Breaking Asteroid in Pre-Survey Observations
A one-of-a-kind observatory in terms of size, speed, and resolving power, the Vera C. Rubin Observatory will construct an astronomical movie of the night sky like never before over the next few decades. One of the key advances it will bring is a better understanding of the objects in our own solar system, particularly of small asteroids. And yet, it has already been blowing our minds with the first photons it received in 2025 during commission. Sarah Greenstreet (NOIRLab) presented asteroid findings from the telescope’s commissioning data, which involved taking more than 1,000 pictures of the Virgo cluster, located near the ecliptic plane. In these commissioning pictures, it identified more than 2,000 solar system objects, approximately 1,900 of which had never been observed before. Furthermore, due to the large number of images, Rubin scientists were able to create light curves for each object to determine what they were, what they were composed of, and even whether they were rotating or not. One of the most exciting discoveries from this analysis was the discovery of MN45 — an asteroid more than 500 meters across — which shattered all previous asteroid records for rotation for an asteroid of its size, with a rotation period of 1.88 minutes. In summary, we’ve not even begun to show science data from the Rubin Observatory, and it is already changing our understanding of the universe. You can read a press release about this research here.
It’s Not Complicated: Life Is Simple on Cool-Star Planets
Does life exist elsewhere in the universe? If so, where is it? And what does it look like? These are all questions that are at the heart of modern astronomy. Fortunately for us, William Welch of San Diego State University has answers for us! He took a novel approach to answering this question by looking at how life on Earth would have evolved around late-type M dwarfs. These stars comprise over 75% of all stars in the galaxy, and due to their extremely low masses, we can reliably detect exoplanets around them, such as in the TRAPPIST-1 system. So what are the chances of life on these worlds? Unfortunately, not great. See, life (as it exists on Earth) thrives on visible light between 400 and 900 nanometers, as that’s the region most useful for oxygenic photosynthesis. However, TRAPPIST-1 emits relatively little light in that wavelength range, having a much larger contribution from the infrared sections of its spectral energy distribution. This means that — in an Earth-analog scenario — oxygen-breathing life that forms the basis for our life wouldn’t exist, it would have been outcompeted by bacteria that can perform anaerobic photosynthesis. The results of this would drastically change the course of evolution. They likely wouldn’t result in the Cambrian evolution that brought so much of life into existence. You can read a press release about this research here.
Naturally Occurring “Space Weather Station” Elucidates New Way to Study Habitability of Planets Orbiting M-Dwarf Stars
One of the great joys of the modern world is our ability to predict the weather. While this is typically limited to knowing if it’ll rain tomorrow, it’s also essential to understand space weather, or how the Sun’s activity affects our delicate little planet. This is not limited to Earth, though; understanding the interactions between stars and planets is crucial to determining whether life exists there. While astronomers are familiar with studying light from stars and planets, it is generally more challenging to study particle interactions between them; however, these are the interactions that can strip planets of their atmospheres. To overcome this issue, Luke Bouma at Carnegie Science conceived the idea of using a special class of M dwarfs: complex periodic variables. These stars have complexly varying lightcurves that reflect the structure and interactions between the star and its circumstellar hydrogen. From this, Bouma was able to study not just light from the star, but the actual localized space weather around it. Therefore, it would be possible to use objects like these complex variables in the future to identify which kinds of worlds could be potentially habitable and which have been stripped barren by stellar winds. You can read a press release about this work here.
E. E. Barnard’s Star Near Venus — A 130-Year-Old Mystery Solved?
If you’ve been in astronomy, you’ve likely heard of Barnard’s Star, one of the closest stars to the solar system. However, that is not the only notable star associated with the famous E. E. Barnard. In 1892, when he was first starting out at the Mount Lick Observatory, he observed a 7th-magnitude star near Venus that didn’t appear on any existing almanacs or star charts. Certainly, no one could have misplaced a star that bright, right? Well, yes, and yet no matter what he did, he couldn’t figure out what the object in question was! This question remained unanswered for decades and was still unsolved when Barnard passed away in 1923. However, in 2025, over a century later, it appears we have an answer. William Sheehan, a preeminent historian and author of Barnard’s biography, led a team in an attempt to identify the mystery star in question. After trying every classification under the Sun — from nebulae to RR Lyrae stars — they found an answer so simple and yet so hidden: Barnard had likely just misclassified the star’s brightness. See, at the time he observed it, he was still new to using the 36-inch refractor and significantly overestimated the star’s actual brightness, because the human eye is notoriously poor at judging absolute scales. But when the team took a measurement in 2025 to confirm this, the star was right where it should be, right at the magnitude it should have been.
Plenary Lecture: Partisan Disparities in the Use, Funding, and Production of Science, Alexander Furnas (Northwestern University) (by Bill Smith)
The relationship between science and politics has been on the minds of many astronomers this past year, so it was not surprising that Dr. Alexander Furnas, a political scientist who studies science policymaking, drew a dense crowd of astronomers for his plenary talk. He began by unequivocally rebuking the myth that science is apolitical, with astronomy being no exception. Given the long time horizons required to answer fundamental scientific questions, the substantial public investments that support both research missions and researchers’ salaries, and national security concerns, he argued that scientists must now, more than ever, understand the science policy process as part of their professional development and for career success. He then challenged the way that most scientists think about how science policy is crafted — in which scientists make discoveries, gain recognition for their work, policy is created around their new knowledge, and then scientists go back to work creating new knowledge. Instead, he proposed a model in which science policy is a political system, and one in which intermediary organizations, such as think tanks, professional societies, and others, mediate the process between knowledge creation and policy creation, often with incentives beyond supporting science for science’s sake at play.
One of his main points was that there are four main areas in which politics always enters science: funding, evaluation, translation, and uptake. For each of these areas, he showed evidence from his research. Regarding science funding, he presented evidence suggesting that, at least until 2020, both Democratic and Republican lawmakers tended to fund science at the same level, counter to the intuitions of many in the science community, and that the current administration represents a stark departure from even historical Republican administrations.
For translation, his main point to the scientific community is that “intermediaries matter.” Congressional staffers are not trained to read journal articles or to understand how rigorous methodologies are applied across fields, so they rely on intermediary organizations, most notably think tanks, to translate basic science into policy recommendations. These think tanks, Furnas explained, are highly polarized, and this polarization has been increasing over time. He went on to explain that, in this context, polarization has multiple meanings. First, very few scientific and policy studies are cited by both parties. Second, the two parties draw from different “clusters” of research at different rates and for different purposes. Democrats, on average, cite scientific research about 1.8 times more than Republicans across topics, and left-of-center think tanks cite scientific papers roughly five times more than right-leaning institutions. Third, there are systematic differences in how research is framed and used, in that citations are often selective to pre-existing agendas. Furnas also noted that political elites and decision-makers tend to have higher trust in science than the general voting public, which shapes both evaluation and uptake even when the broader public is skeptical.
He emphasized that how scientific work “travels,” who translates it, how it’s framed, and which networks pick it up, can matter as much as the findings themselves. He showed data from an experiment in which congressional staffers were given information from a hypothetical petitioner in their district, and showed that staffers were more likely to act on a recommendation when it came from an ideologically aligned intermediary, a pattern that held for both parties.
Turning to geopolitics, Furnas argued that international collaboration is now heavily politicized, with security concerns often dominating decisions. He described evidence from an NSF evaluation experiment that the political context around countries of those on a proposal (e.g., China versus Germany) influences how proposals are judged. Expecting scientific excellence alone to overcome these pressures, he warned, asks too much of scientists working within the realities of the system.
Furnas closed by underscoring that institutions matter more than individuals. Professional societies, advisory bodies, and other collective organizations play a crucial role in building credibility and continuity in science policy. His caution to the scientific community, including astronomers, was clear: while science remains vital, it is not neutral, but overt partisanship can make institutions less trustworthy. Astronomers will strengthen their impact by becoming policy literate, engaging thoughtfully with credible intermediaries, and framing their work for translation and uptake across polarized institutions. Understanding the politics of science, he argued, isn’t a distraction from doing science, it is increasingly part of doing science well.
You can read Astrobites’s interview with Dr. Furnas here.
Press Conference: Cosmology and Galaxy Clusters (Briefing video) (by Skylar Grayson)
The Strongly Lensed Supernova Pantheon as Revealed by JWST
Massive galaxy clusters warp spacetime, creating a lens that can impact our view of background galaxies. Lensed galaxies appear warped, magnified, or can even show up multiple times. When one of these multiply-imaged galaxies has a supernova go off in it, it provides a great opportunity to measure the expansion of the universe. Conor Larison from the Space Telescope Science Institute presented the discovery of two supernovae in lensed galaxies, one that happened when the universe was half its current age, and one at an even greater distance, when the universe was only as third as old as it is now. Each of these supernovae happened in galaxies that appear multiple times due to lensing, but the supernova itself only shows up in one image. That’s because of an effect called time delay, where because the light from the galaxy is taking a different path, with a different length, to make each image, we’re actually seeing it at different times. Which means that while only one image shows the supernova right now, we will see them again! One will reappear in 1–2 years, while the other won’t be seen for over 60 years. But once we have those observations, we can use them to measure how fast the universe is expanding, quantified by the Hubble constant, H0. This technique gives us a new way to measure H0 and could help shed some light on the current tension in its value that arises from different ways of measuring it. (For more on this idea check out this Astrobite.) You can find the full press release for these results here.
The Discovery of a Strongly Lensed Protocluster Core Candidate at Cosmic Noon
Galaxy clusters are some of the most massive structures in the universe, but currently most galaxies in clusters are not actively forming new stars. Understanding how they built up their mass requires peering back in time, looking for the “protoclusters” that are the early stages of clusters as we see them in today’s universe. Nicholas Foo, a graduate student at Arizona State University, presented observations of one such protocluster, seen when the universe was only a few billion years old. This protocluster is being gravitationally lensed, giving us a magnified glimpse of 11 dusty star-forming galaxies in its core. These galaxies showcase some of the most extreme star-forming environments in the universe, producing new stars at a rate 5,000 times higher than what we see in the Milky Way. Thanks to the strong lensing caused by a fully formed cluster closer to us, we are able to get a glimpse of this early moment of stellar build up, helping uncover how galaxy clusters came to grow so large and what early stages of their lives could have looked like. You can find the full press release here.
ODIN: Mapping the High-Redshift Cosmic Web via Protoclusters and Filaments at Cosmic Noon
Protoclusters, the infant stages of the massive galaxy clusters we see in today’s universe, provide crucial information about structure formation and galaxy evolution. Vandana Ramakrishnan from Purdue University presented results from a survey called ODIN, which hunted for these protoclusters in the early universe. She shared two unique objects they discovered, both of which were extremely massive. One of them is actually a proto-supercluster containing the mass of 5,000 Milky Ways and located at the highest redshift of any proto-supercluster found to date. Using spectroscopic follow-up of these baby clusters, they were able to generate 3D maps of their structure. These maps revealed clumpy and irregular shapes, subgroups, and filamentary structures that feed material into cluster cores. These structures are well aligned with what’s predicted from our models of cluster evolution, and showcase many of the features seen in cosmological simulations.
Scorching Hot Intracluster Gas in a Baby Galaxy Cluster 12 Billion Years Ago
Galaxy clusters are the most massive structures in the universe, but most of their baryonic mass is not actually in the galaxies themselves. Instead, it’s found in the diffuse gas between galaxies known as the intracluster medium, which plays a big role in shaping galaxy evolution and can provide key information about the mass of dark matter halos. But observing this gas, especially at large distances, is quite difficult. Dazhi Zhou from the University of British Columbia presented results from an attempt to observe this gas in a protocluster seen when the universe was only 1.4 billion years old. He utilized the thermal Sunyaev–Zeldovich (SZ) effect, which happens when hot gas scatters with light from the cosmic microwave background. Using the ALMA telescope, he detected a hot intracluster medium using the SZ effect at high significance, the earliest detection of this gas to date. And the detection showed something weird; the gas is hot. Over five times hotter than what we would expect based on observations of nearby clusters and some of our cosmological simulations. Most likely, the extra heating is coming from active galactic nuclei in the protocluster, which drive jets that can deposit energy in the intracluster medium. This is the first such observation of the hot intracluster medium in the early universe, and opens up some exciting questions about the accuracy of our models when it comes to capturing the early stages of cluster growth. You can read the full press release here.
2025 Dannie Heineman Prize Lecture: Unveiling the First Black Holes in the Universe, Priyamvada Natarajan (Yale University) (by Drew Lapeer)
This year’s Dannie Heineman Prize Lecture was given by Dr. Priyamvada Natarajan, professor of astronomy and physics at Yale University. Her talk focused on some of the earliest drivers of galaxy formation and evolution — supermassive black holes (SMBHs) in the early universe. Professor Natarajan’s work in this field has been revolutionary, with much of her theoretical work laying the groundwork for interpreting cutting-edge JWST observations.
She began by giving an overview of two recent leaps in our understanding of SMBHs in the early universe. First is JWST, opening up the door to high-redshift (z > 10) studies of individual SMBHs, just a few hundred million years after the Big Bang. Many of the individual SMBH candidate sources detected with JWST — such as UHZ1 — challenge our understanding of SMBH formation and evolution due to their large masses. More recently, the detection of the gravitational wave background has shed light on the broader population of SMBHs across cosmic time.
Natarajan went on to outline the theoretical models which can produce the population of SMBHs detected by JWST and provided an overview of how we can test these models. Various sources can produce SMBHs as we see them in the local universe. Such models include the direct collapse of massive gas clouds in the early universe, rapid growth of less massive black holes in dense star clusters, and primordial black holes formed very shortly after the Big Bang. Growing evidence points towards the possibility of multiple seeding channels, says Natarajan, but formation of SMBHs via “heavy seeds,” through processes like the direct collapse of gas clouds, is likely a key driver. Moving forward, Natarjan discusses how important it is to understand which of these channels is the most efficient, thus being most likely to produce the current-day SMBH population.

A slide from Priyamvada Natarajan’s plenary talk at AAS. [Priyamvada Natarajan]
The plenary closed with an overview of the future prospects of the field. The Laser Interferometer Space Antenna (LISA) is a next-generation gravitational wave director that’s set to start operations in the 2030s. With LISA, astronomers can pinpoint merging massive black holes. The frequency of these mergers, and follow up with other observatories, will open a new door into SMBH evolution science.
You can find our interview with Professor Natarajan here.
Plenary Lecture: Probing the Accretion History of AGN using X-Ray and Multi-Wavelength Surveys, Tonima Tasnim Ananna (Wayne State University) (by Neev Shah)

Dr. Tonima Tasnim Ananna delivering her plenary lecture at AAS 247.
Dr. Tonima Tasnim Ananna, a faculty member at Wayne State University delivered her plenary lecture on the multiwavelength view of accretion history in active galactic nuclei (AGN). She emphasizes that understanding the behaviour of supermassive black holes (SMBHs) is extremely vital as they are located at the centers of most galaxies. As matter falls into them, it can form an accretion disk around the SMBH, which emits radiation in the ultraviolet and optical. They also have an X-ray corona around them, as well as a torus that absorbs the ultraviolet and optical radiation, re-radiating it in the infrared. She describes the unified model of AGN, which explains their different properties with the help of a simple geometric viewing-angle effect. She highlights that observing them in different wavelengths is crucial as they all provide complementary information. Dr. Ananna describes the key questions in the field, which are:
- How are the first black holes (BHs) seeded?
- How and when do these black holes grow?
- Are AGN driven mostly through mergers or secular evolution?
- How is matter regulated around an AGN?
She mentions that the two ways to answer these questions are through either studying individual objects, or using large datasets to produce statistical functions. Although she primarily focuses on the latter, she emphasizes the importance of the former as well, with the example of how UHZ1 demonstrated the heavy seed scenario for forming the first black holes. Next, she discusses the curious case of the little red dots (LRDs) and mentions that although JWST has found numerous LRDs, they are surprisingly not seen in X-rays or are poor X-ray emitters. She finds that LRDs also contain overmassive BHs. A possible explanation for the lack of X-rays in LRDs could be that we see the SMBHs through lots of obscuration. Another possibility is that the SMBHs are accreting matter at a super-Eddington rate, as that can trap photons and stop the production of X-rays. She describes the receding torus model, which occurs as the AGN has a high luminosity, which makes the torus smaller, and increases the viewing probability. In such a scenario, the obscured fraction should drop with luminosity. She mentions that this can be tested with the help of Swift data, as it provides an unbiased sample of obscured and unobscured sources.
However, Dr. Ananna suggests that perhaps it is not the luminosity that controls the matter around an AGN, but the Eddington ratio, which accounts for the counteracting forces of gravity and radiation pressure. She finds that this model, called the “radiation regulation unification model,” is more accurate than the receding torus model. To summarise, she highlights that at low Eddington ratios, a geometric unification provides a good solution, but at high Eddington ratios, the sources can start to get obscured and show temporal evolution. With that, Dr. Ananna has answered the questions 1) and 4), and concludes with her thoughts on how to tackle questions 2) and 3).
You can find our interview with Dr. Tonima Tasnim Ananna here.
The post AAS 247: Day 3 appeared first on AAS Nova.
]]>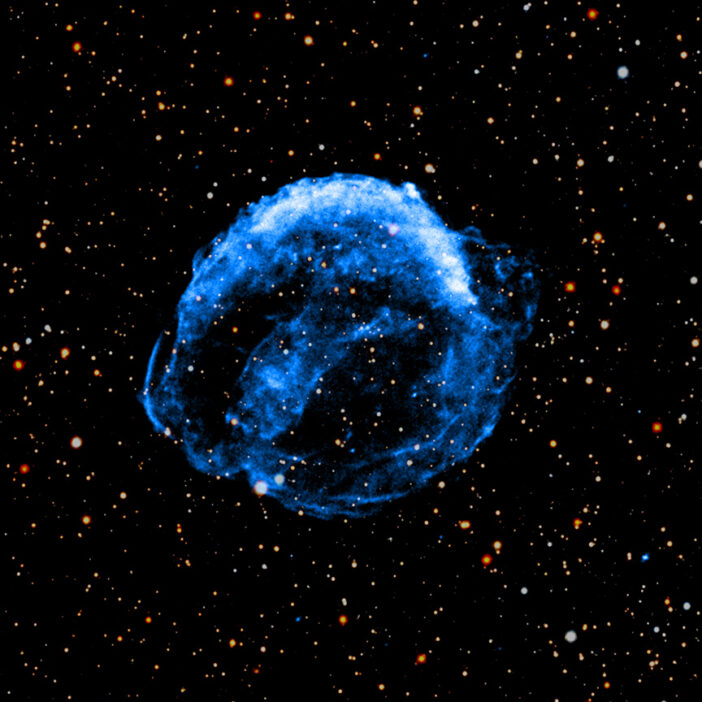
A supernova movie 25 years in the making, a discussion of little red dots, the joy of an unplanned career, and more — all on Day 2 of AAS 247.
The post AAS 247: Day 2 appeared first on AAS Nova.
]]>Editor’s Note: This week we’re at the 247th AAS meeting in Phoenix, AZ. Along with a team of authors from Astrobites, we will be writing updates on selected events at the meeting and posting each day. Follow along here or at astrobites.com for daily summaries, or follow @astrobites.bsky.social on Bluesky for more coverage. The usual posting schedule for AAS Nova will resume on 12 January.
Table of Contents:
- Historical Astronomy Division LeRoy E. Doggett Prize Plenary: Don’t Let Anybody Tell You to Plan Your Career, Thomas Hockey (University of Northern Iowa)
- Press Conference: News from the High-Redshift Universe
- 2025 Newton Lacy Pierce Prize Plenary: What Happens to Planets After Their Stars Die?, Andrew Vanderburg (Harvard University)
- Press Conference: The Milky Way and Stellar Explosions
- Plenary Lecture: The Creating Equity in STEAM (CrEST) Experiential Learning Programs, Raja GuhaThakurta (University of California, Santa Cruz)
- Henry Norris Russell Lecture: Finding the Most Distant Galaxies Using the James Webb Space Telescope, Marcia Rieke (University of Arizona)
Historical Astronomy Division LeRoy E. Doggett Prize Plenary: Don’t Let Anybody Tell You to Plan Your Career, Thomas Hockey (University of Northern Iowa) (by Niloofar Sharei)
Thomas A. Hockey receives the AAS Historical Astronomy Division’s Doggett Prize at AAS 247 in Phoenix.
Today’s awards session for the Historical Astronomy Division’s Doggett Prize featured a lecture by prizewinner Thomas A. Hockey, who used his own winding career path to argue for staying open to unexpected opportunities. He described how early interests in planetary observing gradually led him toward the history of astronomy, with side projects that became central, from untangling long-standing myths about Jupiter’s Great Red Spot to preserving oral histories from figures such as Clyde Tombaugh. A recurring theme he went back to was that historical observations can meaningfully inform modern astrophysics, but only when their limitations are carefully respected. He closed by returning to eclipse-chasing and long-baseline sky watching, emphasizing how real celestial events, rather than rigid plans, ultimately shaped his career, encouraging all young astronomers to be open to opportunities that come along.
You can read Astrobites’s interview with Thomas Hockey here.
Press Conference: News from the High-Redshift Universe (Briefing video) (by Niloofar Sharei)
Today’s press conference highlighted how JWST, together with ALMA and Hubble, is sharpening our view of galaxy growth in the universe’s first billion years, while nearby low-metallicity “analogs” help us test the physics we cannot resolve at high redshift.
The ALPINE-CRISTAL-JWST Survey: A New Multi-Wavelegth Survey Reveals Early Galaxies Grow Up Fast
Schematic overview of early chemical enrichment in galaxies. Supernova explosions rapidly enrich the interstellar medium within the first 100 million years, metals are mixed and then driven into surrounding gas, and later generations of stars continue metal production over billions of years. Click to enlarge. [Andreas Faisst, Caltech]
A New Population of Point-Like Narrow-Line Objects Revealed by the James Webb Space Telescope
Haojing Yan and Bangzheng Sun (University of Missouri – Columbia) introduced a small but fascinating set of JWST sources that look almost like point sources in images but show narrow emission lines when you look at their spectra. Yan described them as the “platypuses of the universe.” On their own, none of their properties are especially strange, but when you put everything together, they do not fit neatly into any familiar category. Normally, unresolved sources turn out to be either stars or quasars. Yan showed that these objects are not stars based on their colors and spectra. They also do not behave like typical quasars: although they are compact, they are less luminous and lack the broad emission lines that come from fast-moving gas around a supermassive black hole.
Because of this, the team argued that these sources are not standard quasars. Two possibilities remain. They could be a previously unknown type of narrow-line active galactic nucleus, where a compact central engine dominates over an extremely faint host galaxy, or they could be very young, compact star-forming galaxies, probably younger than about 200 million years, whose early growth kept them unusually small and smooth. Either way, the speakers emphasized that this appears to be a new population, and that deeper and more detailed JWST spectroscopy will be needed to figure out what these objects really are. | University of Missouri press release; STScI press release
Supermassive Stars as the Engines Behind Little Red Dots
Devesh Nandal (Center for Astrophysics | Harvard & Smithsonian) proposed an alternative explanation for at least some little red dots: instead of being compact galaxies powered by active black holes, their light might come mainly from a single, extremely massive star growing through rapid accretion. A key motivation for this idea is what these objects don’t show: they lack detectable X-ray emission, which would normally be expected if an actively accreting black hole were present. At the same time, their very compact unresolved appearance makes them hard to explain as normal galaxies, and their spectra do not look like those of typical stellar populations either. In this picture, a supermassive star forms out of nearly pristine gas and accretes fast to push past the limits of classical stellar evolution. As long as the accretion rate stays above a critical threshold, the star remains bloated and relatively cool, giving it a red appearance even as it continues to gain mass. In theory, such a star could grow to around a million times the mass of the Sun before becoming unstable and collapsing directly into a black hole, offering a natural route to forming massive black hole seeds.
Schematic showing where JWST’s little red dots fall in a mass–accretion framework, illustrating how rapidly accreting supermassive stars could grow to extreme masses and collapse directly into massive black holes. Click to enlarge. [Devesh Nandal]
Webb Reveals Early-Universe Analog’s Unexpected Talent for Making Dust
Elizabeth Tarantino (Space Telescope Science Institute) focused on Sextans A, a nearby metal-poor dwarf galaxy used as a local analog of early galaxies, which are otherwise too distant to study in detail. Using JWST spectroscopy of a massive asymptotic giant branch star, the team found clear evidence for dust production, but not in the usual Milky Way form. The spectrum lacked the classic 10 μm silicate feature and instead pointed to iron-rich dust, showing that asymptotic giant branch stars at low metallicity can still be efficient dust producers, just with different chemistry. JWST imaging also revealed weak, clumpy polycyclic aromatic hydrocarbon emission, suggesting small dust grains survive only in protected pockets. The results show that even metal-poor galaxies can host substantial stellar and interstellar dust, reshaping how we interpret dust in the early universe. | Press release
2025 Newton Lacy Pierce Prize Plenary: What Happens to Planets After Their Stars Die?, Andrew Vanderburg (Harvard University) (by Skylar Grayson)
Andrew Vanderburg delivered a plenary centered on using white dwarfs, the leftover cores of dead stars (and a glimpse into the future of our own sun) to study exoplanets. We’re currently entering a crucial time for exoplanet astronomy, with the number of known exoplanets rapidly increasing and sophisticated techniques and instrumentation allowing us to push to more extreme and smaller systems, including those that could host life. However, there are still many open questions around habitability, what is and is not a biosignature, and our understanding of the systems life could exist in.
His talk was focused on two core questions in exoplanet research that white dwarfs can help us answer. First up: what elements are rocky exoplanets made of? This is relevant for considerations of magnetic fields and plate tectonics, the elements available for chemical processes, and (crucially) identifying geology that could produce false positives for biosignatures. Determining the composition of rocky planets with our current tools is extremely difficult, but his group has explored using the spectra of white dwarfs to uncover planetary composition. The extreme gravity of white dwarfs makes them chemically stratified, meaning the surface is almost entirely hydrogen and a little bit of helium, offering a blank slate for spectroscopic study. Planets around a white dwarf can be tidally disrupted and torn apart, and that debris can then fall onto the surface of the white dwarf, adding interesting fingerprints to the stellar remnant’s spectrum. Vanderburg’s team has been developing new methods of generating mock spectra to compare to white dwarf observations, and they are laying the groundwork for quick analysis of upcoming spectral surveys in order to efficiently hunt for chemical signatures that could be traced back to exoplanets.
The second half of Vanderburg’s talk was focused on using dead stars to understand life. When the Sun becomes a red giant, then eventually loses its outer atmosphere and becomes a white dwarf, the solar system will completely change. The inner planets will likely be swallowed up, and planets will move around in their orbits, adjusting to the changed gravity of the much smaller white dwarf remnant. But, as he explained, just because planets are orbiting a dead star doesn’t mean they themselves are dead. White dwarfs still have a habitable zone (where liquid water could exist on a planet’s surface), but it’s very, very near to the stellar remnant, in a region where any planets would have been destroyed in the death of the progenitor star.
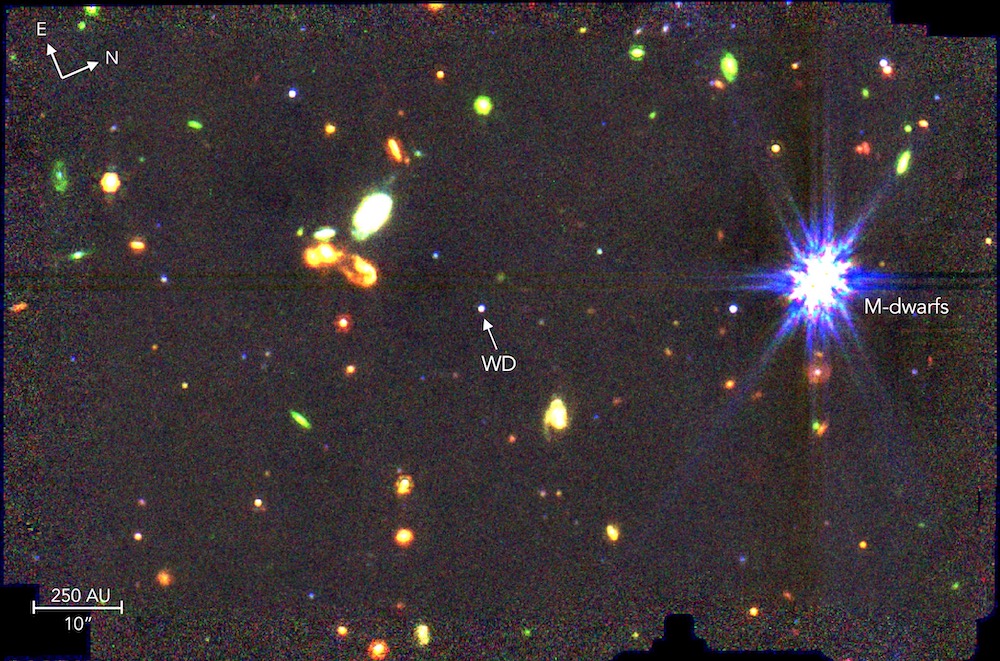
The white dwarf WD 1856+534, shown at the center of this image, hosts an exoplanet at an orbital distance of just 0.02 au. [Limbach et al. 2025]
Overall, the work presented in this plenary sets the stage for the next generation of exoplanet research. Finding planets in unique environments such as near white dwarfs, understanding the conditions under which life could be sustained, and exploring new ways to determine the composition of exoplanets will help prepare for upcoming missions like the Habitable Worlds Observatory and play a big part in the hunt for life beyond Earth.
You can also read our interview with Dr. Vanderburg here.
Press Conference: The Milky Way and Stellar Explosions (Briefing video) (by Skylar Grayson)
Resolving Iron Doublets for Galactic Center Molecular Clouds with XRISM
XRISM (the X-ray Imaging and Spectroscopy Mission) is providing higher resolution X-ray spectroscopy than anything we’ve seen before, and it’s allowing us to study components of the universe in a whole new way. Stephen DiKerby, a researcher at Michigan State University, has been using XRISM to look at molecular clouds in the center of the Milky Way. Iron in these clouds emits X-rays, and the high spectral resolution of XRISM has allowed us to study that emission in detail. One particular line, called Fe Kɑ, was revealed with XRISM to actually be a doublet, and the redshift of the iron-emitting gas could be constrained to within 10 km/s, an unparalleled precision in X-ray spectroscopy. The XRISM results have also shed some light on where the iron emission is coming from, as the lack of certain spectral features can rule out certain emission pathways. The XRISM data prefer a process called X-ray reflection, wherein material around the supermassive black hole in the center of the Milky Way produced a lot of X-ray emission that travelled to the molecular cloud over the course of 100 years, eventually exciting the gas and generating the observed Fe Kɑ. In order to produce the emission observed in the molecular cloud, the supermassive black hole would have needed to be thousands of times brighter than it is today! This work highlights how novel observations, such as high-resolution spectroscopy, can be used to constrain the underlying physics of the interstellar medium. | Press release
Continued Monitoring with Chandra of Kepler’s Supernova Remnant over 25 Years
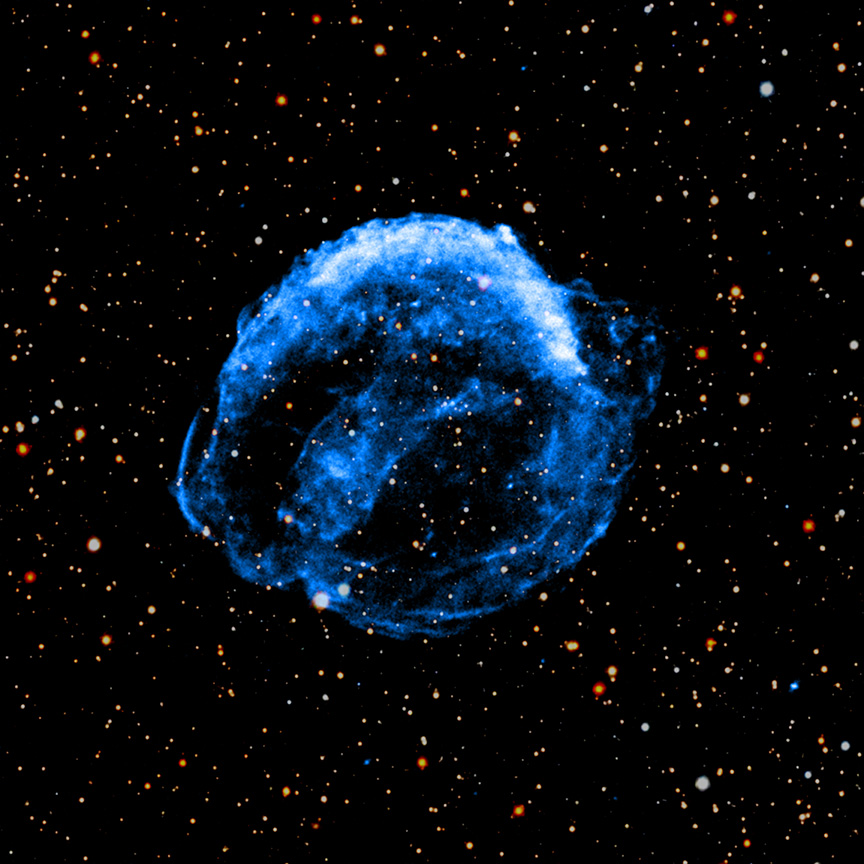
X-ray and optical image of Kepler’s supernova remnant. [X-ray: NASA/CXC/SAO; Optical: Pan-STARRS]
Where Do Stars Explode in the Interstellar Medium?
Supernovae play a major role in galaxy evolution, shaping the interstellar medium, regulating future star formation, impacting baryon cycles, and more. Understanding where supernovae happen is a key part of understanding their impacts, whether they’re embedded in dense clouds of gas and dust that they blow apart, or are located outside of dense regions and can drive winds that compress material and trigger more star formation. In order to unpack this, Sumit Sarbadhicary, a research scientist at Johns Hopkins University, has generated the first detailed census of stellar explosions in the nearby galaxy Messier 33. He looked at massive stars that are near the end of their lives (i.e., future supernovae) and compared their locations to that of atomic and molecular gas clouds as observed by the Atacama Large Millimeter/submillimeter Array and the Very Large Array. This has provided the first measurement of the correlation between massive stars and dense gas clouds. Overall, a majority of the stars won’t explode in dense gas regions, but the results did depend on the mass of the star. More massive stars were more likely to be in dense gas, which could have interesting implications for what types of stars shape cavities in the interstellar medium or trigger future star formation. Overall, these results will be important in the development of simulations moving forward, in order to ensure that we are accurately capturing the physics of stellar evolution and supernovae. | Press release
Plenary Lecture: The Creating Equity in STEAM (CrEST) Experiential Learning Programs, Raja GuhaThakurta (University of California, Santa Cruz) (by Neev Shah)
Prof. Raja GuhaThakurta delivering his 2025 AAS Education Prize Plenary Lecture at AAS 247. [Neev Shah]
Shadow the Scientists (Dipping your toes in the water): GuhaThakurta mentions that StS started in November 2020, in the middle of the pandemic when many telescopes were shut down and were being operated remotely. It started at the Keck and Lick observatories, where school students participated in remote observing sessions with the help of live translations into many languages. He also recalled a particular instance where a school consisting of Israeli and Palestinian students shadowed scientists for a project, with simultaneous live translations from English to Hebrew and Arabic. Now supported by a grant from the Heising-Simons foundation, StS has expanded to include students from Africa, Asia, Latin America, and the Middle East. He mentioned numerous examples of projects where students could shadow scientists in their work, with one of them being exploring the famous comet 3I/ATLAS. He also highlighted that StS has now expanded to several other telescopes such as Subaru, Gemini, Las Cumbres Observatory, CHARA, and CFHT, and is also in conversations with DESI at the Mayall Telescope and LIGO Hanford. To highlight the large impact of this program, he also mentioned that StS has also gone beyond astronomy to include many other projects in stem cell biology, ecology, and even volcanology
Python and Research (Learning swim strokes): GuhaThakurta next spoke about the PyaR, started in November 2018. This program, which runs every few months, develops free online tutorials for students to learn about research through coding and data analysis. He credited his former graduate students Claire Dorman, Emily Cunningham, and Amanda Quirk, who have contributed significantly to the development of these tutorials. It was initially started in an all girls high school in the Bay Area, but it has since expanded and has served a few thousand students since its beginning. He also highlighted that it has been adapted to create tutorials in computational biology, and will soon also have a new module to explore particle physics with the help of data collected at the Large Hadron Collider in CERN.
Science Internship Program (Taking a deep dive): Next, GuhaThakurta spoke about the first program that he started in 2009, SIP, which is a research internship for high school students. It is divided into a week-long online component, followed by 7 weeks in person, where they are mentored by UCSC researchers, which include graduate students, postdocs, research staff, and faculty members. Although originally started in astronomy, SIP has now expanded to all the academic divisions in UCSC. He mentions that high school students get the opportunity to be closely mentored on open-ended real research projects, which generally includes a carved-out piece of research being done by the mentors, and has a shallow learning curve through which mentors can also teach the students about the broader context of the work that they are doing. Although SIP originally started with just three students from one school, it has grown significantly and had 300 students last summer from across the world. Since 2009, SIP has also had students from 750 high schools. In fact, he highlighted that many students return to do SIP multiple times, and the program has had about 2,500 unique students. He also mentions that about a third of SIP students have had to overcome serious obstacles in their life, and the program strongly focuses on BIPOC, low-income, and first-generation students. He highlighted a study done by psychology researchers on the impact of SIP. They found a strong increase in students’ interest and confidence in STEM. He also mentioned that SIP is beneficial not just for the students, but also for the mentors as they gain leadership, project management, pedagogical experience and are also paid a stipend. Mentors are also able to advance their own research with the help of the students, and broaden the impact and awareness of their work to other communities
GuhaThakurta mentions that the CrEST programs have now reached many communities in the US, and also various countries in Africa, South America, Europe, and Asia. CrEST has an annual budget of three million dollars, with 72% of it coming from the fees paid by the students participating in the SIP program, 20% via philanthropic contributions from individuals, families and even corporate gifts. The remaining 8% comes from the StS grant funded by the Heising-Simons Foundation. He emphasizes that a third of SIP students are provided need-based scholarships as well.
GuhaThakurta recalls several other outreach initiatives that he is involved with, such as teaching courses to prison inmates at the SC county jail. He is also involved with a UC-wide program called COSMOS, which is a four-week research camp for high school students.
He emphasizes the need for more mentors and appeals to the AAS community to contact people involved with CrEST to learn more about the programs, as well as to host StS sessions. He also appeals to the audience to spread the word about CrEST programs to their network of researchers, and also to potential participants who may benefit from them. To increase impact, he also recommends others to start new programs, or even modifying the existing experiential learning programs at our own home institutions.
He ended his plenary lecture by sharing a link to a document that includes his slides and many other related resources to learn more about him as well as the programs that he spoke about.
You can also read our interview with Prof. GuhaThakurta here.
Henry Norris Russell Lecture: Finding the Most Distant Galaxies Using the James Webb Space Telescope, Marcia Rieke (University of Arizona) (by Niloofar Sharei)
This Henry Norris Russell Lecture was a mix of personal history, instrument-building, and science results. Marcia Rieke used her own career story, from early hands-on observing to leading roles on major infrared missions, to show how decades of technical progress steadily removed the practical barriers to finding the first galaxies.
She began by describing what high-redshift galaxy work looked like when she started, when infrared observations were done from the ground using single-aperture photometers. Galaxies were often not directly visible, and positions were measured by offsetting from nearby guide stars. At that time, the main motivation was cosmology rather than galaxy evolution, with the hope that distant galaxies, especially ellipticals, could act as standard candles to constrain the geometry of the universe.
She then walked us through the missions that built up the way to JWST. NICMOS marked the transition from single-pixel measurements to infrared imaging from space and revealed how powerful arrays could be. Spitzer pushed sensitivity much further, but its small mirror led to confusion-limited images. Combining Hubble and Spitzer data showed how features like the Balmer break could be identified at high redshift and revealed that extreme emission lines can strongly bias broadband colors. Another limitation was that hydrogen absorption wipes out light shortward of the Lyman break, meaning Hubble can only reach to about z ~ 10 before redshift estimates rely on a single filter.
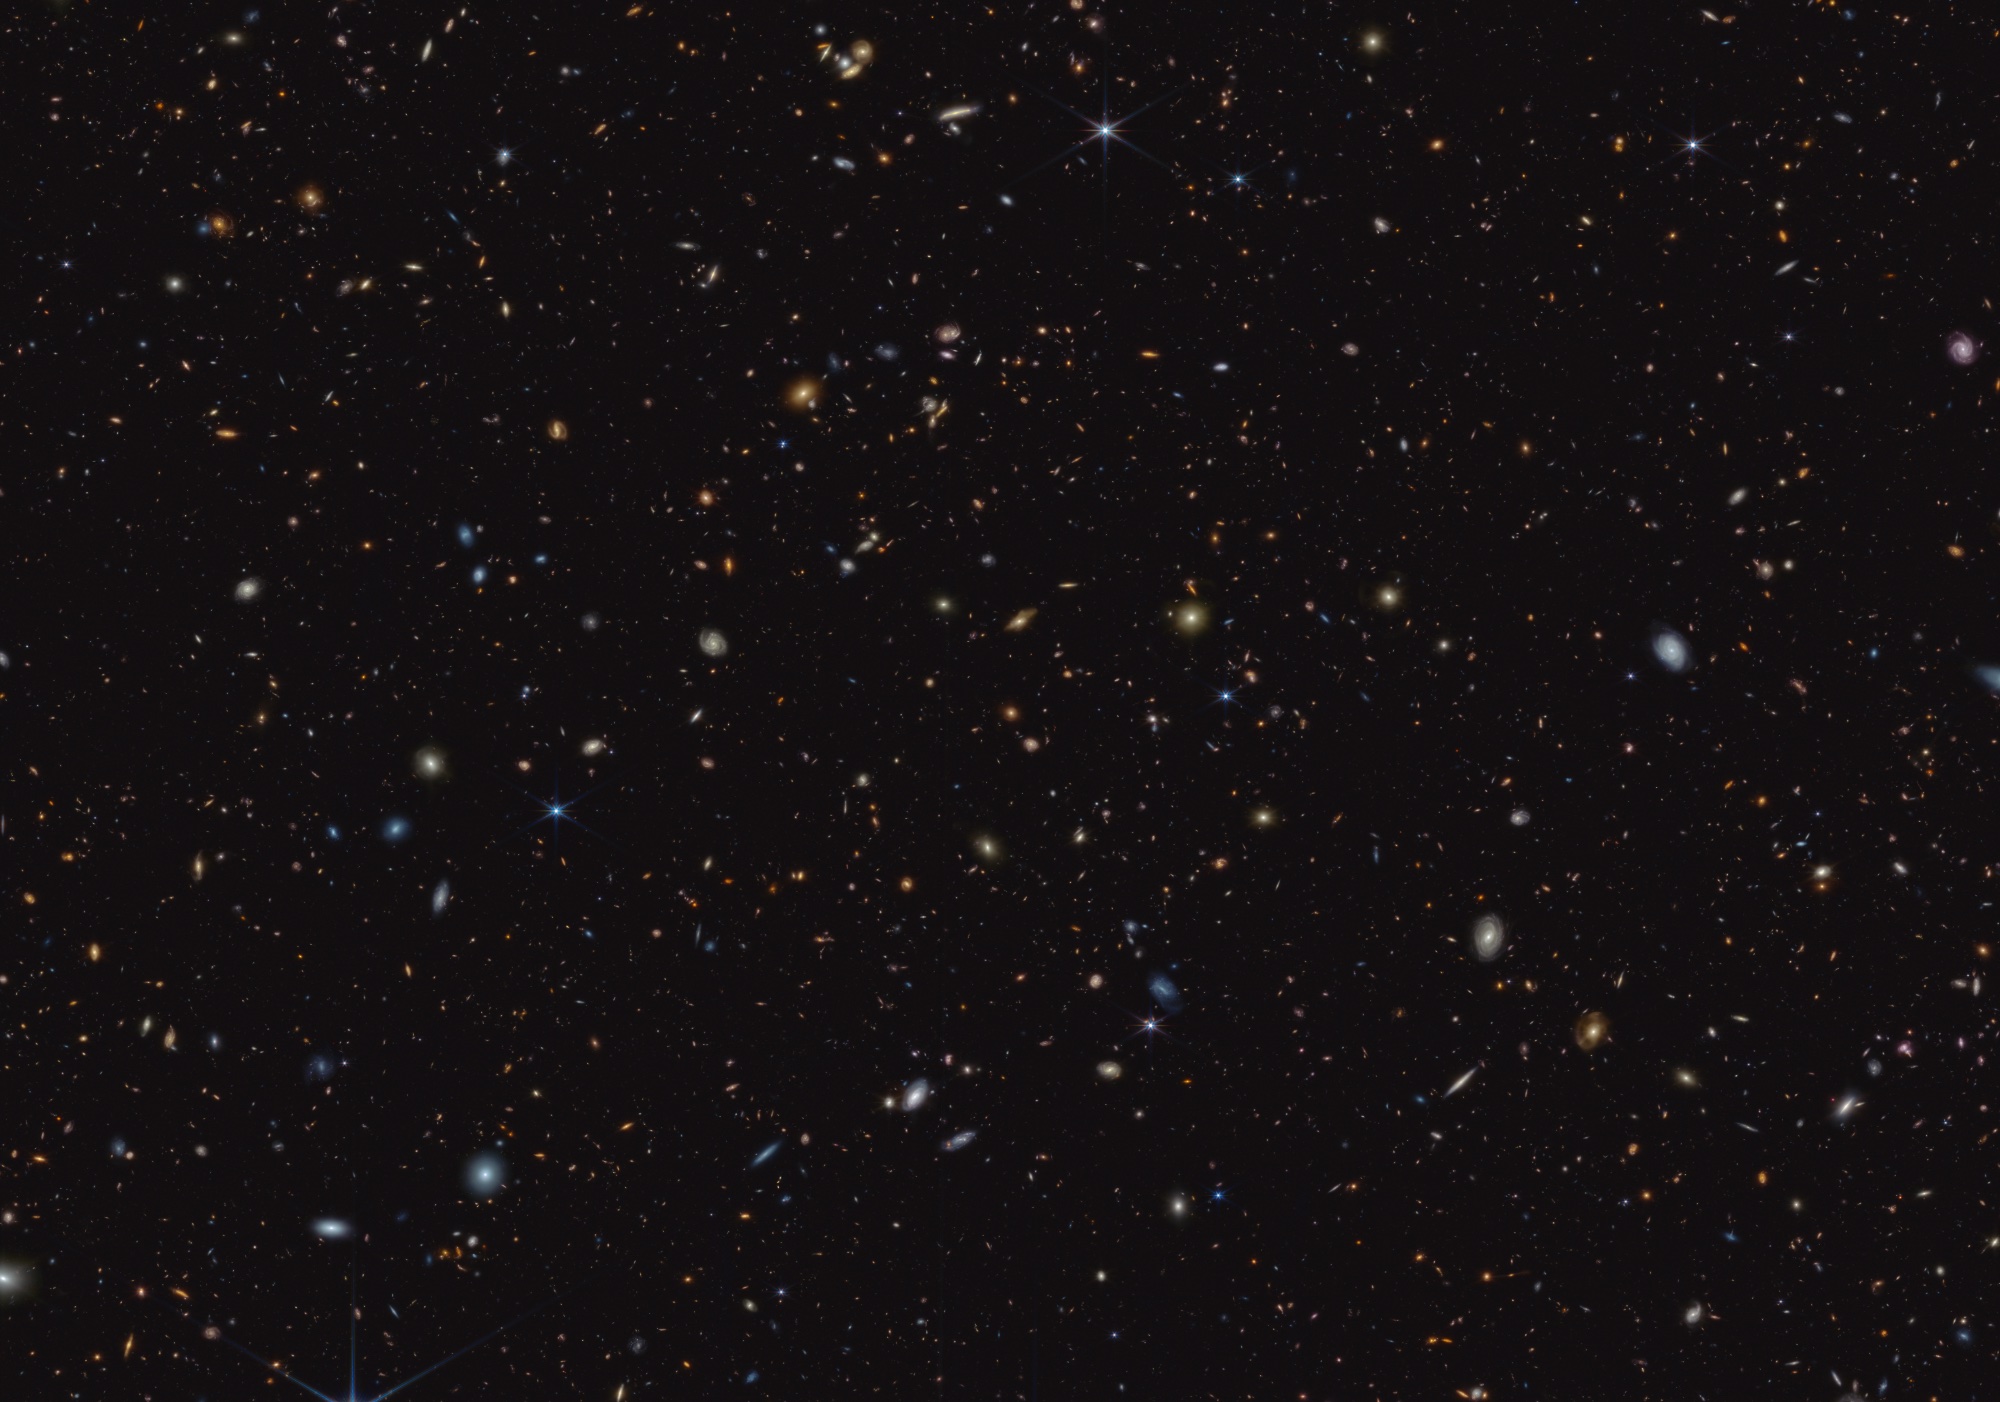
More than 45,000 galaxies appear in this image from the JWST Advanced Deep Extragalactic Survey, or JADES, program. [Image: NASA, ESA, CSA, Brant Robertson (UC Santa Cruz), Ben Johnson (CfA), Sandro Tacchella (Cambridge), Marcia Rieke (University of Arizona), Daniel Eisenstein (CfA) ; Image processing: Alyssa Pagan (STScI)]
You can read our interview with Dr. Rieke here.
The post AAS 247: Day 2 appeared first on AAS Nova.
]]>
Day 1 of AAS 247: brown dwarfs, starburst galaxies, missions to asteroids, and more!
The post AAS 247: Day 1 appeared first on AAS Nova.
]]>Editor’s Note: This week we’re at the 247th AAS meeting in Phoenix, AZ. Along with a team of authors from Astrobites, we will be writing updates on selected events at the meeting and posting each day. Follow along here or at astrobites.com for daily summaries, or follow @astrobites.bsky.social on Bluesky for more coverage. The usual posting schedule for AAS Nova will resume on 12 January.
Table of Contents:
- Welcome Address, Dara Norman
- Fred Kavli Plenary Lecture: From Launch to Legacy: How OSIRIS-REx Changed Our Understanding of Asteroids, Daniella DellaGiustina (University of Arizona)
- Press Conference: Galaxies Big and Small
- 2025 Royal Astronomical Society Gold Medal in Astronomy Lecture: Understanding Galaxies, James Binney
- Press Conference: Stars and Their Behavior
- Plenary Lecture: The Brown Dwarf-Milky Way Connection: How Failed Stars Play a Unique Role in Galactic Archaeology, Adam Burgasser (University of California, San Diego)
- Plenary Lecture: A New Era of Planetary Astrophysics with JWST and High-Resolution Spectrographs, Björn Benneke (University of Montreal)
Welcome Address, Dara Norman (by Lindsey Gordon)
AAS President Dara Norman opened up this year’s winter AAS meeting in Phoenix, AZ, by acknowledging what a weird year it’s been in scientific funding and politics. She thanked the community for their work with the AAS policy office in pushing for action in Congress and with their representatives to advocate for science funding. President Norman led a land acknowledgement to the Akimel O’odham and the 22 Tribal Nations in Arizona. She then ceded the stage to John Davis for a performance of two songs from local Indigenous cultures, followed by a video message from US senator and former astronaut Mark Kelly.
Fred Kavli Plenary Lecture: From Launch to Legacy: How OSIRIS-REx Changed Our Understanding of Asteroids, Daniella DellaGiustina (University of Arizona) (by Lindsey Gordon)
Dr. DellaGiustina gave the Fred Kavli Plenary Lecture for her work on groundbreaking insights into the origins of Earth and other bodies as part of the OSIRIS-REx team. OSIRIS-REx was the first US mission to collect and return a sample from an asteroid — Bennu — and has become the OSIRIS-APEX mission, traveling to the asteroid Apophis.
This sample mission was incredibly significant because of the gap in our understanding of asteroids between telescope observations, like those from the Hubble Space Telescope, and meteorites that have gone through Earth’s atmosphere. Understanding the nature of asteroids in space is essential for understanding their formation, the early solar system, and the formation of planets including Earth. The OSIRIS-REx mission went to observe Bennu, a nearby carbon-rich asteroid, taking observations of it up close and then retrieving a sample that could be returned to Earth without contamination by that pesky Earth atmosphere.
The team was in for a surprise when the mission arrived at Bennu, which did not look like what they had expected based on their existing data. They had designed the sample retrieval expecting centimeter-scale dust grains, and instead found a much larger, rugged rocky object. In 2019, Bennu also began ejecting material from its surface, a kind of active geology no one had expected or seen on such a small asteroid before. In 2020, they found a spot in this “rubble pile” of an asteroid that they could take a sample from, and in 2023 the mission returned with 121.6 grams of material, more than twice the amount the mission had defined as a successful retrieval.
After a very careful contamination control protocol to make sure the sample stayed clean, they began analysis and the results are still forthcoming today. They found indications of rock–water interactions and an origin beyond the major snow lines of the disk. The material contains lots of pre-solar dust, with a factor of six enrichment of carbon not seen in meteorites. They found that the presence of melting ice can enable abiotic organic molecule synthesis, and a bias of left-handed chirality that suggests it might be a general property of molecules and not just a unique feature of Earth. Just this year they published their findings of ribose, a molecule used in RNA, and the first-ever discovery of glucose. They know their sample control was strong, and that these molecules aren’t just contaminants from being on Earth. This suggests that complex chemistry doesn’t require full planets or massive oceans, and molecules could have started forming in the very early solar system.
Up next: Apophis, an asteroid infamous for previously having been predicted to have an Earth-impact trajectory. We know now it’s not going to hit us in the next 100 years at least, but it is going to get super close to us (10 times closer than the Moon!), and it’s not clear what that interaction will cause for the asteroid. OSIRIS-APEX will study the asteroid after its close approach and then use its thrusters to stir up the asteroid’s surface, allowing the team to study the sub-layers of the asteroid.
You can also check out our interview with Dr. DellaGiustina here.
Press Conference: Galaxies Big and Small (Briefing video) (by Niloofar Sharei)
This press conference highlighted how galaxies evolve across a large range of scales, from the resolved stellar populations of a nearby starburst, to rare galaxy morphologies mapped in huge surveys, to galaxies that shut down star formation early, and even a “failed galaxy” that never managed to form stars.
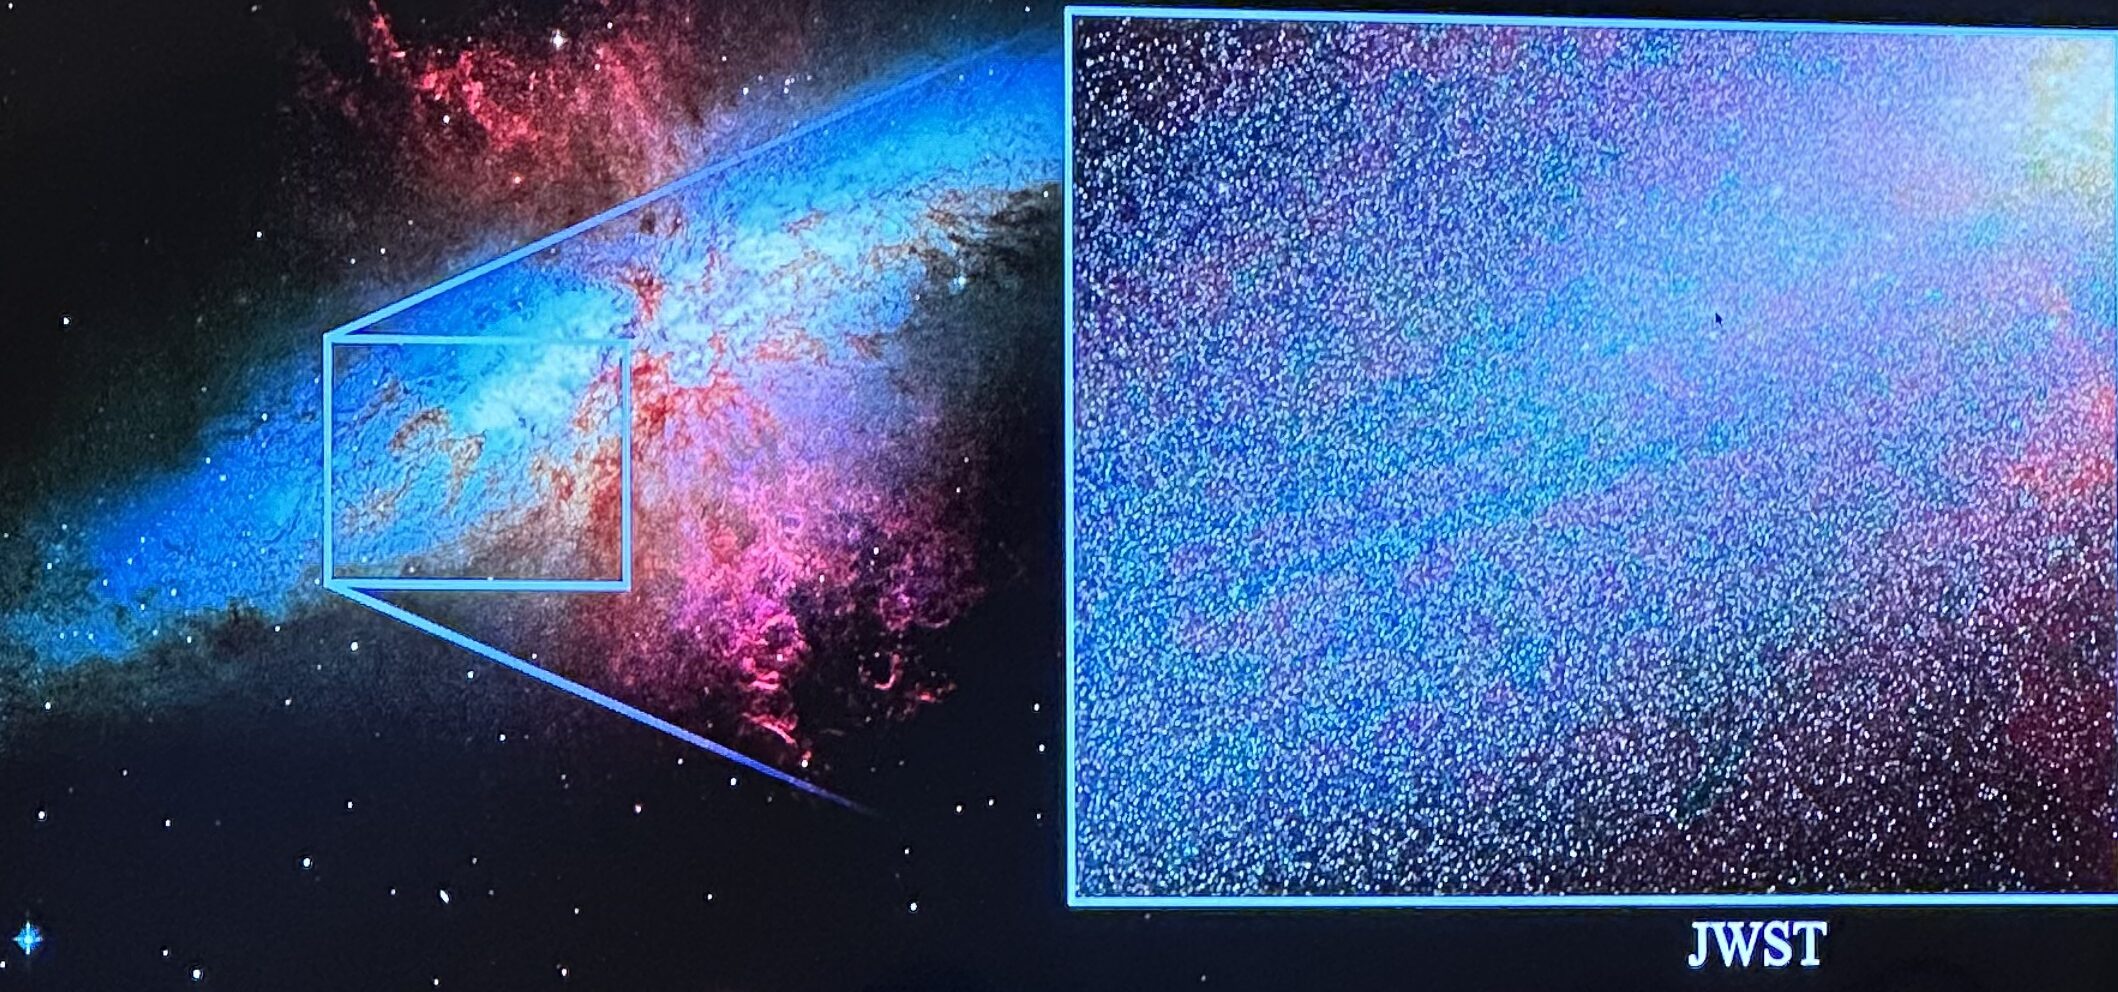
JWST image of the starburst galaxy M82 demonstrating how infrared observations pierce the dusty, crowded disk and resolve individual stars across the galaxy. [Adam Smercina / JWST]
Adam Smercina (STScI) presented a new JWST imaging survey of the nearby starburst galaxy Messier 82 (M82). M82 is forming stars at roughly 10 times the Milky Way’s total rate, but heavy dust has long made it difficult to reconstruct its detailed star formation history. With JWST’s sensitivity and resolution, the team can now resolve individual stars across the system, including about 16.5 million stars across the face of M82, enabling a much more direct, population-by-population view of when and where stars formed during the starburst.
Revealing Polar-Structure Galaxies Across Cosmic Time with DESI and Euclid
Jacob Guerrette (Brigham Young University) described “polar structure galaxies,” systems with rings, disks, or other stellar and gaseous structures oriented roughly perpendicular to the main galaxy body. Because these orthogonal structures likely arise from environmental events like mergers or accretion, building large samples is key to learning how often these interactions happen and what they do to galaxies. Earlier catalogs contained only a few hundred objects (about 150 identified in 1990, then a few hundred more in later Sloan-based work), but combining modern wide surveys produces an order-of-magnitude jump. The new DESI-based catalog and early Euclid imaging suggest that the full Euclid survey could yield thousands of strong candidates, including rarer subtypes that were previously underrepresented.
Slide illustrating ultra-massive (“monster”) galaxies in the early universe, with stellar masses exceeding 1011solar masses and rapid formation and quenching within the first 2 billion years of cosmic time. Click to enlarge. [Wenjun Chang]
Wenjun Chang (UC Riverside) presented results from the MAGAZ3NE survey, which uses more than 30 nights of Keck/MOSFIRE spectroscopy, plus far-infrared and radio data from ALMA and the Very Large Array to study the most massive galaxies at redshifts around z ≈ 3 to 4. A central goal is to clarify whether these systems are genuinely “dead” or simply dusty and star-forming. The multi-wavelength view shows a diverse set of evolutionary states at a fixed epoch: while many ultramassive galaxies are truly quiescent, others show residual dust emission or signs of obscured star formation, and some are in intermediate phases of shutting down. You can find the related press releases here and here.
The First RELHIC? Cloud-9 Is a Starless Gas Cloud
Rachael Beaton (STScI) discussed “Cloud-9,” a compact neutral hydrogen cloud that appears to be a convincing example of a galaxy that never formed a normal stellar population. Cloud-9 was first identified in a FAST radio telescope survey as a reionization-limited H I cloud, and follow-up searches in the DESI imaging survey found no associated stellar system. Subsequent observations with the Green Bank Telescope confirmed the H I detection. Radio observations reveal roughly a million solar masses of hydrogen, consistent with a dark matter halo of order 100 million solar masses, but deep follow-up with the Hubble Space Telescope (8 orbits) reveals at most a single candidate star, allowing the team to rule out any stellar population more massive than about 103.5 solar masses. Despite being near thermal equilibrium with the universe and massive enough that it should have formed stars, Cloud-9 appears to have remained starless. This makes it the most convincing observational example to date of a “failed galaxy” predicted by ΛCDM, a halo that acquired gas but never converted it into stars. You can find the press release here.
2025 Royal Astronomical Society Gold Medal in Astronomy Lecture: Understanding Galaxies, James Binney (by Bill Smith)
James Binney’s lecture focused on methods for turning the flood of stellar measurements into a physical understanding of how galaxies work. “We are drowning in amazing data,” Binney opened. With Gaia delivering astrometry for more than a billion stars (and radial velocities for a substantial fraction), complemented by MUSE integral-field spectroscopy, ground-based surveys like RAVE and APOGEE, and missions like Kepler, Binney argues the question is no longer how to get data, it’s how to synthesize that data into models that reveal how galaxies are structured and how they came to be that way. A central point of his plenary address was the relationship between galaxy structures and galactic history, about which he said that “discussion of history is pointless until structure has been established.”
One of his core methodological messages was that modern dynamical modeling must live in phase space (x, v), not just real space. While galaxies are not strictly in equilibrium, Binney emphasized that they are near equilibrium, a crucial simplification that lets us use equilibrium models as scaffolding and then study departures by perturbing them. The goal for understanding galaxies, he said, is to synthesize the data into a self-consistent “chemo-dynamical” model in which orbits (dynamics) are labeled and weighted in concert with stellar ages and abundances (chemistry), and then gently perturbed to interpret disequilibria from bars, spirals, accretion, and galactic mergers. Binney reviewed why some familiar tools struggle in the data-rich era. N-body simulations, though powerful, he argued, are specified by uncertain initial conditions, are difficult to steer toward specific observational constraints, can be expensive to run, and often hide the “why” behind emergent structure.
Binney then advocated a methodology based on actions and angles using torus machinery, in which one computes orbital actions, which can be thought of as embeddable constants of motion, and uses them to label orbits in a way that’s physically meaningful and robust to slow evolution. To do this, however, requires using the Hamilton–Jacobi equation, which is solvable only for a few potentials. Binney advocated using torus generators, fast “plug-in replacements” that return positions and velocities for a given set of inputs, and argued that they should largely replace brute-force integration. One sticking point, however, is the inverse map (finding the action given x and v). For that, practitioners still rely on the “Stackel fudge,” a fast, approximate method Binney dubbed “cheap and cheerful.”
He then turned to what the Milky Way’s actions reveal about its formation. The local stellar sample shows that essentially all stars co-rotate with the disk. Binney stressed that more than 99% of the stars we see were born in the rotating disk from gas already moving in the same direction, consistent with a formation scenario dominated by quiescent gas accretion rather than mergers. This is a cautionary note for merger-driven narratives: in the Milky Way, at least, the bulk stellar population does not look like a debris field.
Binney’s prescription for the next decade is to build chemo-dynamical models that synthesize data into a coherent distribution function for stars and dark matter, include quiescent gas accretion and mergers as perturbations rather than starting points, and use torus-based perturbation theory to interpret disequilibria. Do this, and we will not only map structure, we will have a firm foundation for credible histories of how galaxies, including our own, were made.
You can read Astrobites’s interview with James Binney here.
Press Conference: Stars and Their Behavior (Briefing video) (by Neev Shah)
Discovery of the Wake Caused by Siwarha — the Betelgeuse Companion
Betelguese, a red supergiant seen on the shoulder of the constellation Orion, is one of the brightest stars in the night sky. It also shows a variability in brightness over a timescale of about 6 years, called its long secondary period. Recently, a couple of papers proposed that the best explanation for its long secondary period is that Betelguese has a buddy, a faint companion orbiting it. Andrea Dupree (Center for Astrophysics | Harvard & Smithsonian) and collaborators presented one of the first observations that suggest that they have found evidence for a companion, Siwarha. They utilized optical and chromospheric spectra from ground based telescopes as well as the Hubble Space Telescope. They observed changes in the spectra that are characteristic of a ”wake” left by a companion within the atmosphere of Betelguese, similar to how a boat moving through water leaves a wake behind it. These observations suggest that Betelguese indeed might have a companion around it, and future observations will be crucial to confirm this discovery. Press releases: NASA; Center for Astrophysics | Harvard & Smithsonian
A Volume-Complete All-Sky Spectroscopic Census of More Than 2,100 Nearby K Dwarfs: Insights from the RKSTAR Project
K dwarfs are some of the most common stars in the Milky Way, comprising approximately 11% of all stars in the solar neighborhood. They also have long life times, which makes them an excellent tracer of abundances and star formation history in a stellar population. However, they are often neglected in exoplanet studies, and we do not know much about their intrinsic population. To mitigate this, Sebastian Carrazco-Gaxiola, a graduate student at Georgia State University, and collaborators started the RKSTAR project. They created a volume-complete sample of over 2,100 K dwarfs within 40 parsecs of the Sun. They also used several spectrographs to obtain high resolution spectra for these stars, which can be used to estimate their ages. Combining this information with Gaia astrometry, they have found that many K dwarfs are young, active and some of them are also part of young moving associations. This provides the first such complete catalog of nearby K dwarfs that will be extremely useful to study their properties and will aid in future studies exploring the habitability of exoplanets around these stars.
A Previously Unknown Binary Star System in the Eagle Nebula
Steven Cromwell and Tyler Peters, undergraduate students at San Diego State University, had just started working on a research project through the STARTastro program. Their aim was to try finding exoplanets around eclipsing binary systems. As part of this program, they were learning how to code and access public astronomical data for the first time. They started with analyzing some test data in the Eagle Nebula, home to the famous Pillars of Creation. During this, they found that one of the stars had a TESS light curve that showed periodic brightness variations, a key indicator for the system being an eclipsing binary in a ~3.5-day orbit. Interestingly, as they searched through public catalogs, they found that this star had never been categorized as a binary — they had discovered a new eclipsing binary system! Such systems are extremely useful as they provide direct measurements of the masses and radii of the stars, which can be used to calibrate stellar evolution models and to help estimate the age of the Eagle Nebula. They also highlighted that their serendipitous discovery was done using data and tools that are openly accessible to everyone, demonstrating the benefit of having such resources available to the community.
Compact Objects and the Physics of Accretion Survey (COPAS)
White dwarfs are often found to be accreting matter from companions in binary systems. The accretion processes can lead to outbursts as matter builds up in a disk around them. Such systems are called cataclysmic variables (CV) if the donor star is on the main sequence, and are called AM CVn if the donor star is also a white dwarf or a helium star. TESS, a satellite built to search for exoplanets, has a cadence of just 2 minutes, which is extremely useful in identifying systems that show outbursts. Wendy Mendoza, a graduate student at the University of Texas Rio Grande Valley, and collaborators utilized transient alerts from the Zwicky Transient Facility, Gaia, and data from thousands of TESS light curves to identify CV and AM CVn systems. They found several new systems and obtained a better characterization for the known ones. In the future, they plan to expand their analysis to the rest of the vast TESS data set and conduct follow up observations of their candidates to better characterize them. They also highlight the benefit of TESS in overcoming gaps in data, which prevents misclassification and provides a unique opportunity to study outbursts in accreting white dwarfs.
Witnessing Giant Planet Formation in the Act
Disks are a natural product of the process of star formation, and are also the sites where planets form. Such disks, when viewed edge on, provide a direct view of the radial and vertical distribution of gas and dust within it. Charles Law, a NASA Sagan Fellow at the University of Virginia used ALMA to study such an edge-on system, called Gomez’s Hamburger (GoHam), due to its hamburger-like shape. GoHam is also one of the most massive disks that we know of, and has enough material to form a multi-planetary system in the future. With the help of ALMA’s extremely high resolution, they were able to set unique constraints on the size of the dust grains, and also measure the distribution of various molecules such as CO and CS. Interestingly, they also detected emission from the molecule SO on just one side of the disk. When matter in a disk collapses, it increases in temperature and density, which can change the disk chemistry, and also increase the abundance of SO, which is exactly what they find. This hints that they have found evidence for a fragment in the disk, called GoHam b. This discovery provides the first evidence for one of the earliest stages of giant planet formation. The full press release can be found here.
Plenary Lecture: The Brown Dwarf–Milky Way Connection: How Failed Stars Play a Unique Role in Galactic Archaeology, Adam Burgasser (University of California, San Diego) (by Niloofar Sharei)
Adam Burgasser’s plenary talk focused on how brown dwarfs, objects too low in mass to sustain hydrogen fusion, can be used as powerful tracers of the Milky Way’s formation history. The big idea is that, while many classic stellar tracers tangle age and metallicity in ways that are hard to disentangle, brown dwarfs give a cleaner “evolutionary clock.”
Brown dwarfs are born hot and then cool continuously over time. Their luminosities, temperatures, and spectra change in predictable ways, so their observed properties carry direct information about age. Because they are fully convective and never undergo sustained fusion, their atmospheres retain the chemical composition of the gas from which they formed, making them valuable “chemical clocks” as well as age tracers.
Burgasser also emphasized that brown dwarfs are extremely common. Roughly one in every five objects in the Milky Way is a brown dwarf. Their wide mass range also makes them sensitive probes of dynamical processes that depend on mass, making them have a different perspective on galactic evolution than higher mass stars alone.
The main challenge, historically, has been that brown dwarfs are faint, especially for “ancient” populations far from the Galactic disk. Burgasser showed how this is now being overcome by three approaches. First, local populations can be isolated using kinematics, like proper motion cuts, with major contributions from citizen science projects such as Backyard Worlds. Second, deep surveys with JWST are pushing brown dwarf detections out to kiloparsec scales, sometimes revealing brown dwarfs misidentified at first as high-redshift galaxies. Third, globular clusters provide clean, single-age environments where the cooling of brown dwarfs can be used to constrain cluster ages and test evolutionary models.
Three complementary approaches to identifying ancient brown dwarfs in the Milky Way: nearby local samples selected by kinematics, deep-field observations that probe distant populations, and brown dwarfs in old globular clusters. [Adam Burgasser, Cool Star Lab]
You can also check out our interview with Dr. Burgasser here.
Plenary Lecture: A New Era of Planetary Astrophysics with JWST and High-Resolution Spectrographs, Björn Benneke (University of Montreal) (by Lindsey Gordon)
Dr. Benneke’s plenary covered his work on big questions in the field of exoplanet physics and chemistry. He focused on three major questions in the field.
The first is the elemental abundances in giant planets and how they may differ from system to system. There are three big building blocks of element types: gases (H, He), refractories (Fe, Mg, Si, Ni), and ice forming / volatiles (C, O, N). Understanding the ratios of these different groups is essential for understanding the formation and evolution of the planet.
For giant planets in our own solar system, these measurements are quite hard to do. Jupiter only has 8–9 elements measured, and Uranus and Neptune are even worse because they’re colder. But with exoplanets, we have a much larger population to pick from and the ability to observe from a distance. It’s actually easier to study elemental composition when you can see the planet in the context of the light of its star through spectroscopy. His team works with JWST spectra of hot gas giants to estimate the chemical abundances in the planets, allowing them to begin to sequence and classify the planets by their abundances.
The second is understanding sub-Neptune worlds, and the ratio of the three building blocks of element types within them. We can measure the mass and the radius, but there’s a lot of degeneracy as to how that mass is split up. By using JWST to measure the atmospheres of these planets, you can get an estimate of the metallicity of the atmosphere. They found that the atmospheres were mixed gas envelopes, not stratified or layered models as many people predicted. A paper in 2015 (Soubiran & Militzer) actually predicted this, but the result went largely unnoticed until these measurements. The team also found that there’s not a clear temperature dependence for the presence of clouds in the atmospheres. Seemingly similar planets in terms of mass and radius, but with different temperatures, don’t have a clear scaling law as to how cloudy they are. This could be due to the different chemical compositions or their formation locations in their systems, and this result needs more follow-up observations and theoretical models.
Finally, he discussed the atmospheres of rocky planets. More specifically: whether or not they have them. You need a really big ratio of star to planet size to be able to see a very compact, CO2-based atmosphere, which means we need planets around very tiny stars. The TRAPPIST-1 system is a great example of this, and JWST has studied many of the planets in this system in detail. A study of TRAPPIST-1d — likely in the habitable zone — found no evidence for a compact CO2-based atmosphere or larger hydrogen-based atmosphere, but if there had been one they would have found it. This rules out an atmosphere similar to that of Venus, Mars, or Earth for this planet. More studies of similar targets are underway in the JWST Rocky Worlds program to get data on eclipses of favorable targets to study their atmospheres.
The post AAS 247: Day 1 appeared first on AAS Nova.
]]>
Welcome to the 247th AAS meeting in Phoenix, AZ! Here's an overview of some of the education and outreach sessions you might want to check out at the meeting.
The post AAS 247: Welcome! appeared first on AAS Nova.
]]>This week, AAS Nova and Astrobites are attending the American Astronomical Society (AAS) winter meeting in Phoenix, AZ.
AAS Nova Editors Kerry Hensley and Susanna Kohler and AAS Media Fellow Lexi Gault will join Astrobites Media Intern Amaya Sinha along with Astrobiters Neev Shah, Drew Lapeer, Skylar Grayson, Lindsey Gordon, Bill Smith, and Niloofar Sharei to live-blog the meeting for all those who aren’t attending or can’t make it to all the sessions they’d like. We plan to cover all of the plenaries and press conferences, so follow along here on aasnova.org or on astrobites.org! You can also follow Astrobites on Bluesky at astrobites.bsky.social for more meeting content.
Where can you find us during the meeting? We’ll be at the Astrobites booth in the Exhibit Hall all week — stop by and say hello! You can also find Susanna, Kerry, and Lexi at the press conferences Monday through Thursday at 10:15 am and 2:15 pm MST. AAS press conferences are open to all attendees, and they can also be viewed on the AAS Press Office YouTube channel for anyone not attending the meeting.
Finally, you can read the currently published AAS 247 keynote speaker interviews, which were conducted by Astrobiters Neev Shah, Sowkhya Shanbhog, Sarah Stevenson, Skylar Grayson, Nathalie Korhonen Cuestas, Lindsey Gordon, Katherine Lee, and Bill Smith. Be sure to check back all week as the remainder are released!
Education, Outreach, and More at AAS 247
AAS 247 features a broad range of sessions related to education and outreach. For a comprehensive and curated list of sessions, check out this post from AAS Education Program Manager Tom Rice. Here are a few highlights (all times MST; must be logged in to aas.org for links to work correctly):
Start things off on Monday with education-related poster sessions at 9:00–10:00 am in the Exhibit Hall, then check out The National Landscape of Undergraduate Astronomy Majors session from 2:00 to 3:30 pm (organized by the AAS Education Committee). Wrap up the day with a Reception for Astronomy Educators from 7:30 to 9:00 pm.
On Tuesday, check out a panel and discussion from the AAS Working Group on Graduate Admissions, happening from 10:00 to 11:30 am. After lunch, join the special session on Disability and Accessibility in Education/Outreach from 2:00 to 3:30 pm, or hear from notable amateur astronomers in the 2:00–3:30 Promoting Professional–Amateur Collaboration in Astronomy splinter session. Be sure not to miss the 2025 AAS Education Prize Winner’s talk, “The Creating Equity in STEAM (CrEST) Experiential Learning Programs” from 3:40 to 4:30 pm. Finally, take a break from the convention center to join the public star party that the AAS Education Committee is organizing from 3:00 to 8:00 pm; don’t forget to sign up if you want to attend or help out!
Wednesday kicks off with the Bridging AAS Outreach Efforts into the 2020s and Beyond: Eclipse Efforts, Shapley Lectures, and More splinter session from 10:00 to 11:30 am. In the afternoon, from 2:00 to 3:30 pm, check out a special session on Transforming Astronomy Classrooms: Active Learning in Practice by APS/AAS/AAPT Faculty Teaching Institute Alumni, or hear about astronomy-adjacent careers at the Beyond Academe: Exploring Astronomy-Powered Career Paths splinter session. End your day by learning about how to Get Involved with NASA Citizen Science during an iPoster session from 5:30 to 6:30 pm in the Exhibit Hall.
Finally, on Thursday, the 9:00–10:00 am poster session in the Exhibit Hall will feature a number of education-related sessions. Immediately following the poster session is the Non-Federal Funding Mechanisms for Undergraduate Research Programs special session, organized by the AAS Education Committee.
And remember, you can find a longer curated list of education-related sessions here!
The post AAS 247: Welcome! appeared first on AAS Nova.
]]>
AAS Publishing will be attending the upcoming AAS meeting in Phoenix. Here's where you can find the publishing team during the conference.
The post AAS Publishing at AAS 247 in Phoenix appeared first on AAS Nova.
]]>The 247th meeting of the American Astronomical Society, to be held in Phoenix, AZ, 4–8 January, is nearly here. The AAS Publishing team looks forward to connecting with meeting attendees, and you can find representatives from the publishing and journals’ editorial staff at the AAS booth in the Exhibit Hall in the Phoenix Convention Center. AAS Director of Scholarly Publishing Kerry Kroffe, AAS Editorial Operations Manager Alex Andrews, and AAS Journals Data Editors Greg Schwarz and Gus Muench will all be available at the AAS Publishing booth, so be sure to stop by to say hello, chat about the journals, and pick up some swag!
AAS Nova Editors Kerry Hensley and Susanna Kohler, AAS Media Fellow Lexi Gault, Astrobites Media Intern Amaya Sinha, and the rest of the Astrobites team will also be available periodically at the Astrobites booth in the Exhibit Hall. We look forward to seeing you there!
Open Science, Data, and AI in Astronomy: Sessions to Look for at AAS 247
Note: The links in this section take you to the corresponding entries in the AAS 247 block schedule. You must be logged in for the links to work correctly; otherwise, they will take you to the main block schedule page. Note that times and locations are subject to change.
If you’re interested in open-source software and its uses in astronomy, be sure to check out the “Open-Source Tools for Scalable Astronomical Data Analysis” iPoster session on Monday, 5 January, 9:00–10:00 am in the Exhibit Hall.
Dive into data issues on Tuesday, 6 January, at the “Data Roundtable” splinter session, which will run from 10:30 am to 3:00 pm in Room 121C. This session will be split into a moderated discussion with several short talks and an opportunity for attendees to engage with specific problems that they’re interested in.
Ever wondered why the AAS journals ask you to select five keywords to accompany your research article, or how to pick the best keywords? Join the “5 Keywords and Me” splinter session on Wednesday, 7 January, from 9:00 am to 12:00 pm in Room 121C to learn about the Unified Astronomy Thesaurus and how it makes your work more discoverable.
AAS 247 will include several sessions relating to the use of AI in astronomy. Of note: join the “Advancing AI Infrastructure for Large Astronomy Datasets” special session on Tuesday, 6 January, 2:00–3:30 pm in Room 232A to learn how AI tools can benefit upcoming large astronomical surveys. Wednesday, 7 January, will feature two sessions related to AI: a splinter session from the NASA Artificial Intelligence Science and Technology Interest Group from 10:00 am to 11:30 am in Room 231ABC, and the “AI and Foundation Models for Astronomical Inference” oral session from 2:00 to 3:30 pm in Room 228B. Finally, on Thursday, 8 January, the special session “AI Meets Stars: Advancing Our Understanding of Stellar Lives and Fates with Machine Learning” will take place 10:00–11:30 am in Room 226A.
The post AAS Publishing at AAS 247 in Phoenix appeared first on AAS Nova.
]]>
Explore the most popular topics on AAS Nova in 2025 — from nearby rocky planets to distant little red dots.
The post Looking Back on Astronomy in 2025 with AAS Nova appeared first on AAS Nova.
]]>2025 has been a year of discovery and challenge for astronomers worldwide. In the US, even as researchers celebrated big scientific and operational wins — reveling in long-awaited first-light images from Vera C. Rubin Observatory, examining the third interstellar object to enter our solar system, and diving into a treasure trove of new gravitational wave detections, to name just a few — scientists faced existential threats to funding, and our community mobilized to advocate for our field. Here at AAS Nova, this was a big year for us, as we celebrated our 10th anniversary. Now, we’ll bring the year to a close by taking a look back at the top posts of 2025:
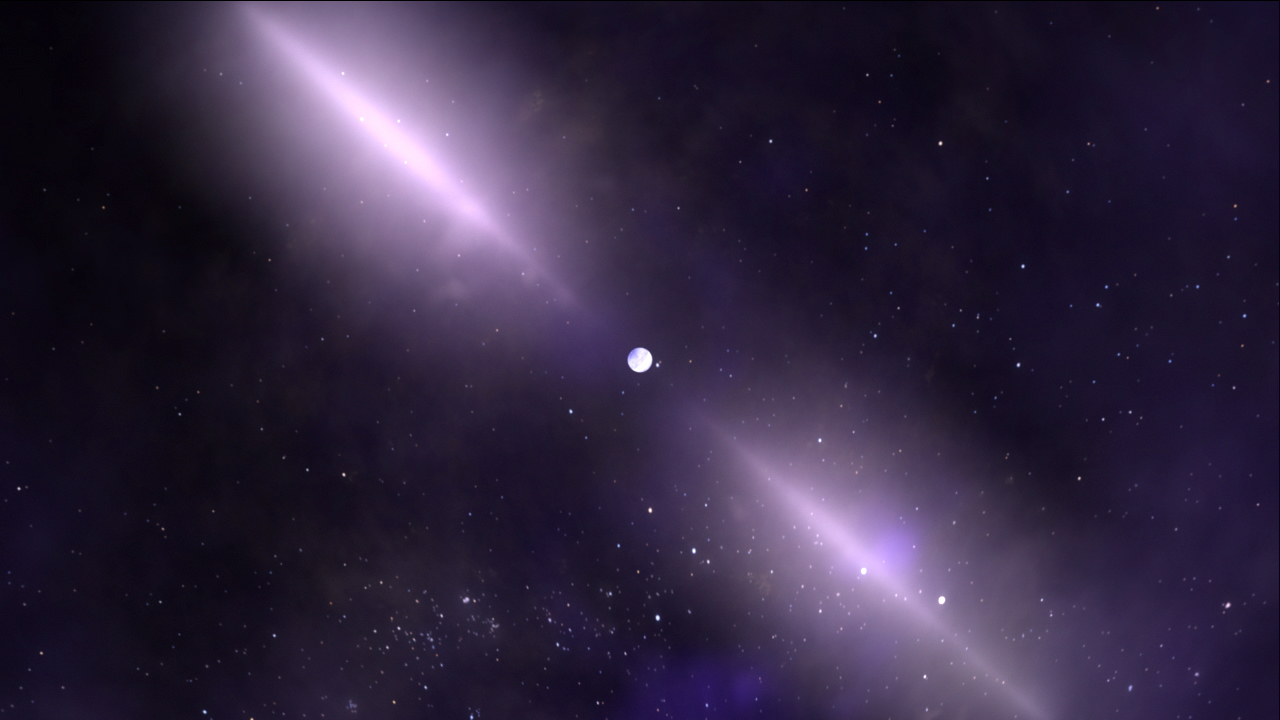
An artist’s impression of a pulsar — a rapidly spinning neutron star. [NASA’s Goddard Space Flight Center]
10. A Slowly Spinning Pulsar Below the Death Line
When Yuanming Wang and collaborators serendipitously discovered radio pulses from PSR J0311+1402, the object’s identity was a mystery. Its pulses were too widely spaced to come from a pulsar — an extremely dense remnant of a dead massive star — but they were also too frequent to come from a long-period radio transient. Though the object remains somewhat mysterious, several of its properties indicate that it’s an unusually sluggish pulsar.
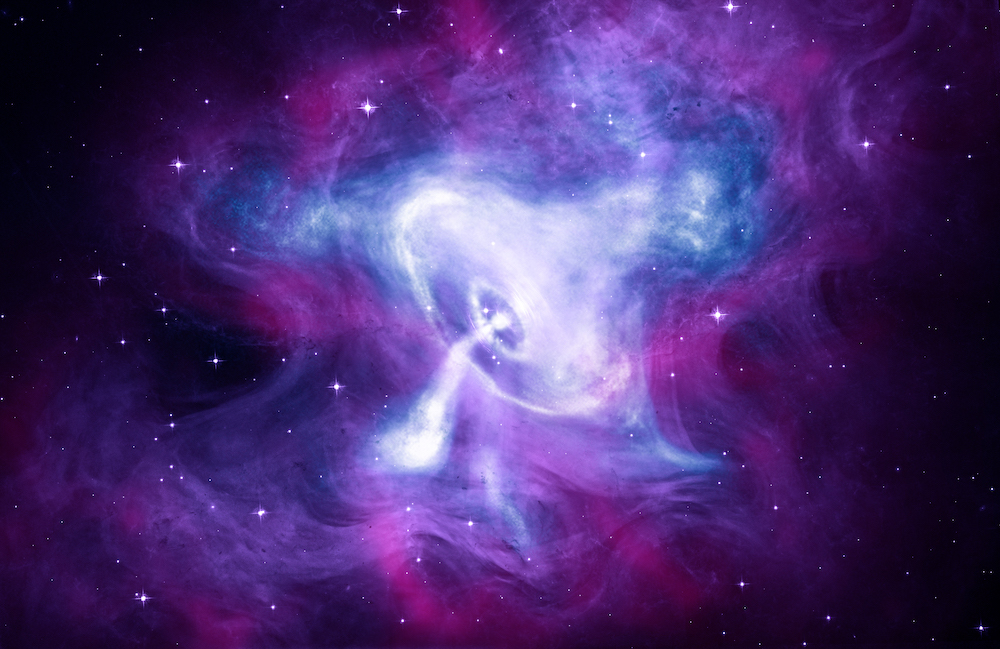
Composite X-ray, optical, and infrared image of the Crab Nebula, which houses a pulsar at its center. [X-ray: NASA/CXC/SAO; Optical: NASA/STScI; Infrared: NASA-JPL-Caltech]
9. Cracking Crusts Might Set a Neutron Star Speed Limit
Neutron stars spin incredibly fast, often hundreds of times per second — but they only spin about half as fast as they could before being ripped apart by their rotation. Why don’t they spin faster? That’s the question investigated by Jorge Morales and Charles Horowitz. Morales and Horowitz hypothesized that neutron star crust (the strongest material in the universe) cracks when these stars spin at about half of their breakup rate, and once the crust splits, the star begins to emit gravitational waves and can spin no faster.
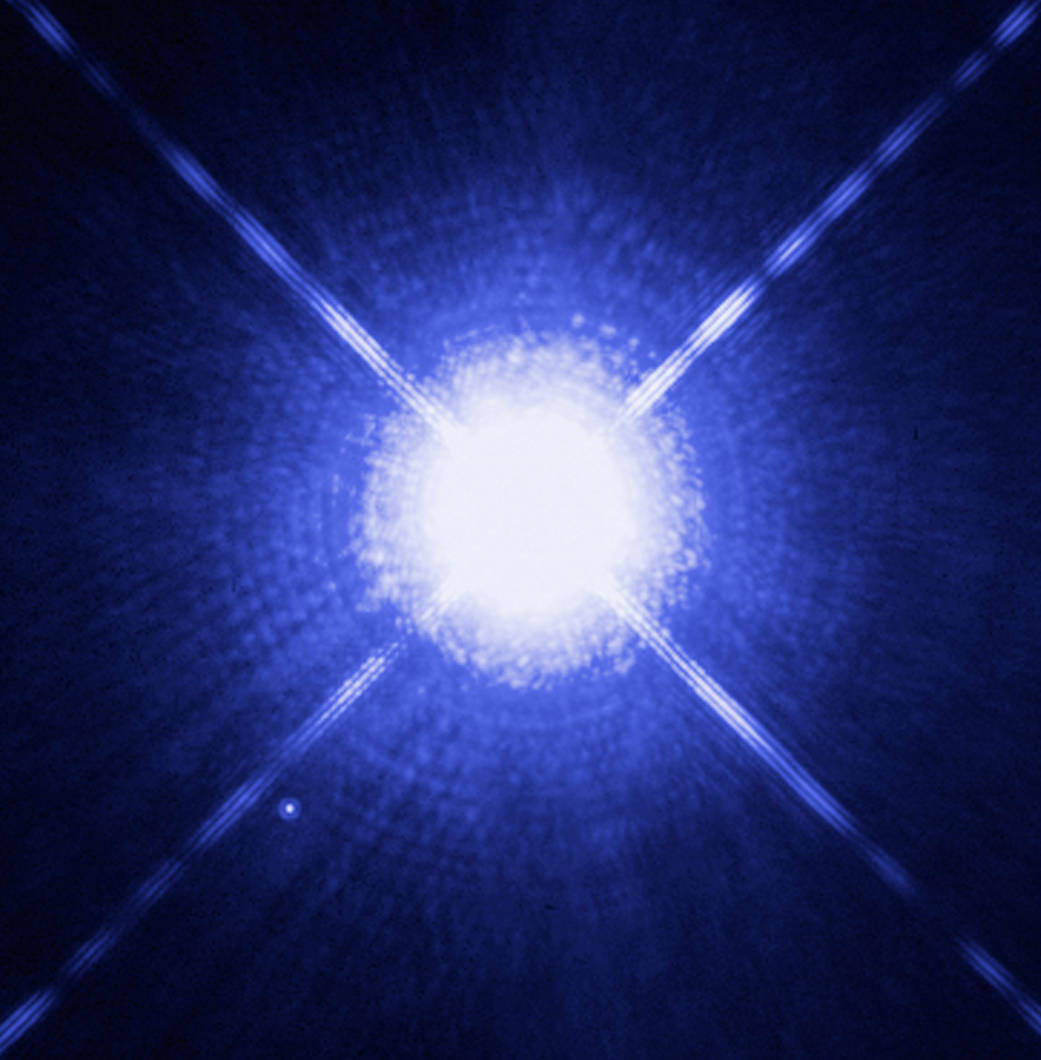
The tiny white dwarf Sirius B hides in the glare of its larger and brighter companion, Sirius A. [NASA, ESA, H. Bond (STScI) and M. Barstow (University of Leicester)]
8. Record-Breaking Pulsating White Dwarf Discovered
The evolution of a low- or intermediate-mass star eventually leaves behind a crystallized, compressed stellar core called a white dwarf. As white dwarfs slowly cool from initial temperatures of more than a million degrees, they pass through the instability strip and begin to pulsate. These pulsations allow astronomers to peer into white dwarfs’ crystalline interiors, potentially illuminating the origins of ultra-massive white dwarfs. A team led by Francisco De Gerónimo searched for pulsating white dwarfs and discovered a record-breaking 19 pulsation modes in one ultra-massive specimen called WD J0135+5722.
JWST images of six very distant galaxies dubbed “little red dots.” [NASA, ESA, CSA, STScI, Dale Kocevski (Colby College)]
7. Distant Little Red Dot Hosts a Huge (and Growing) Black Hole
Anthony Taylor and collaborators reported their findings on CAPERS-LRD-z9, a little red dot seen by JWST as it was when the universe was just a billion years old. Using JWST, the team spotted a broad emission line characteristic of hydrogen gas moving at thousands of kilometers per second. This is a tell-tale sign of an accreting supermassive black hole, making CAPERS-LRD-z9 the earliest galaxy to show this signature.
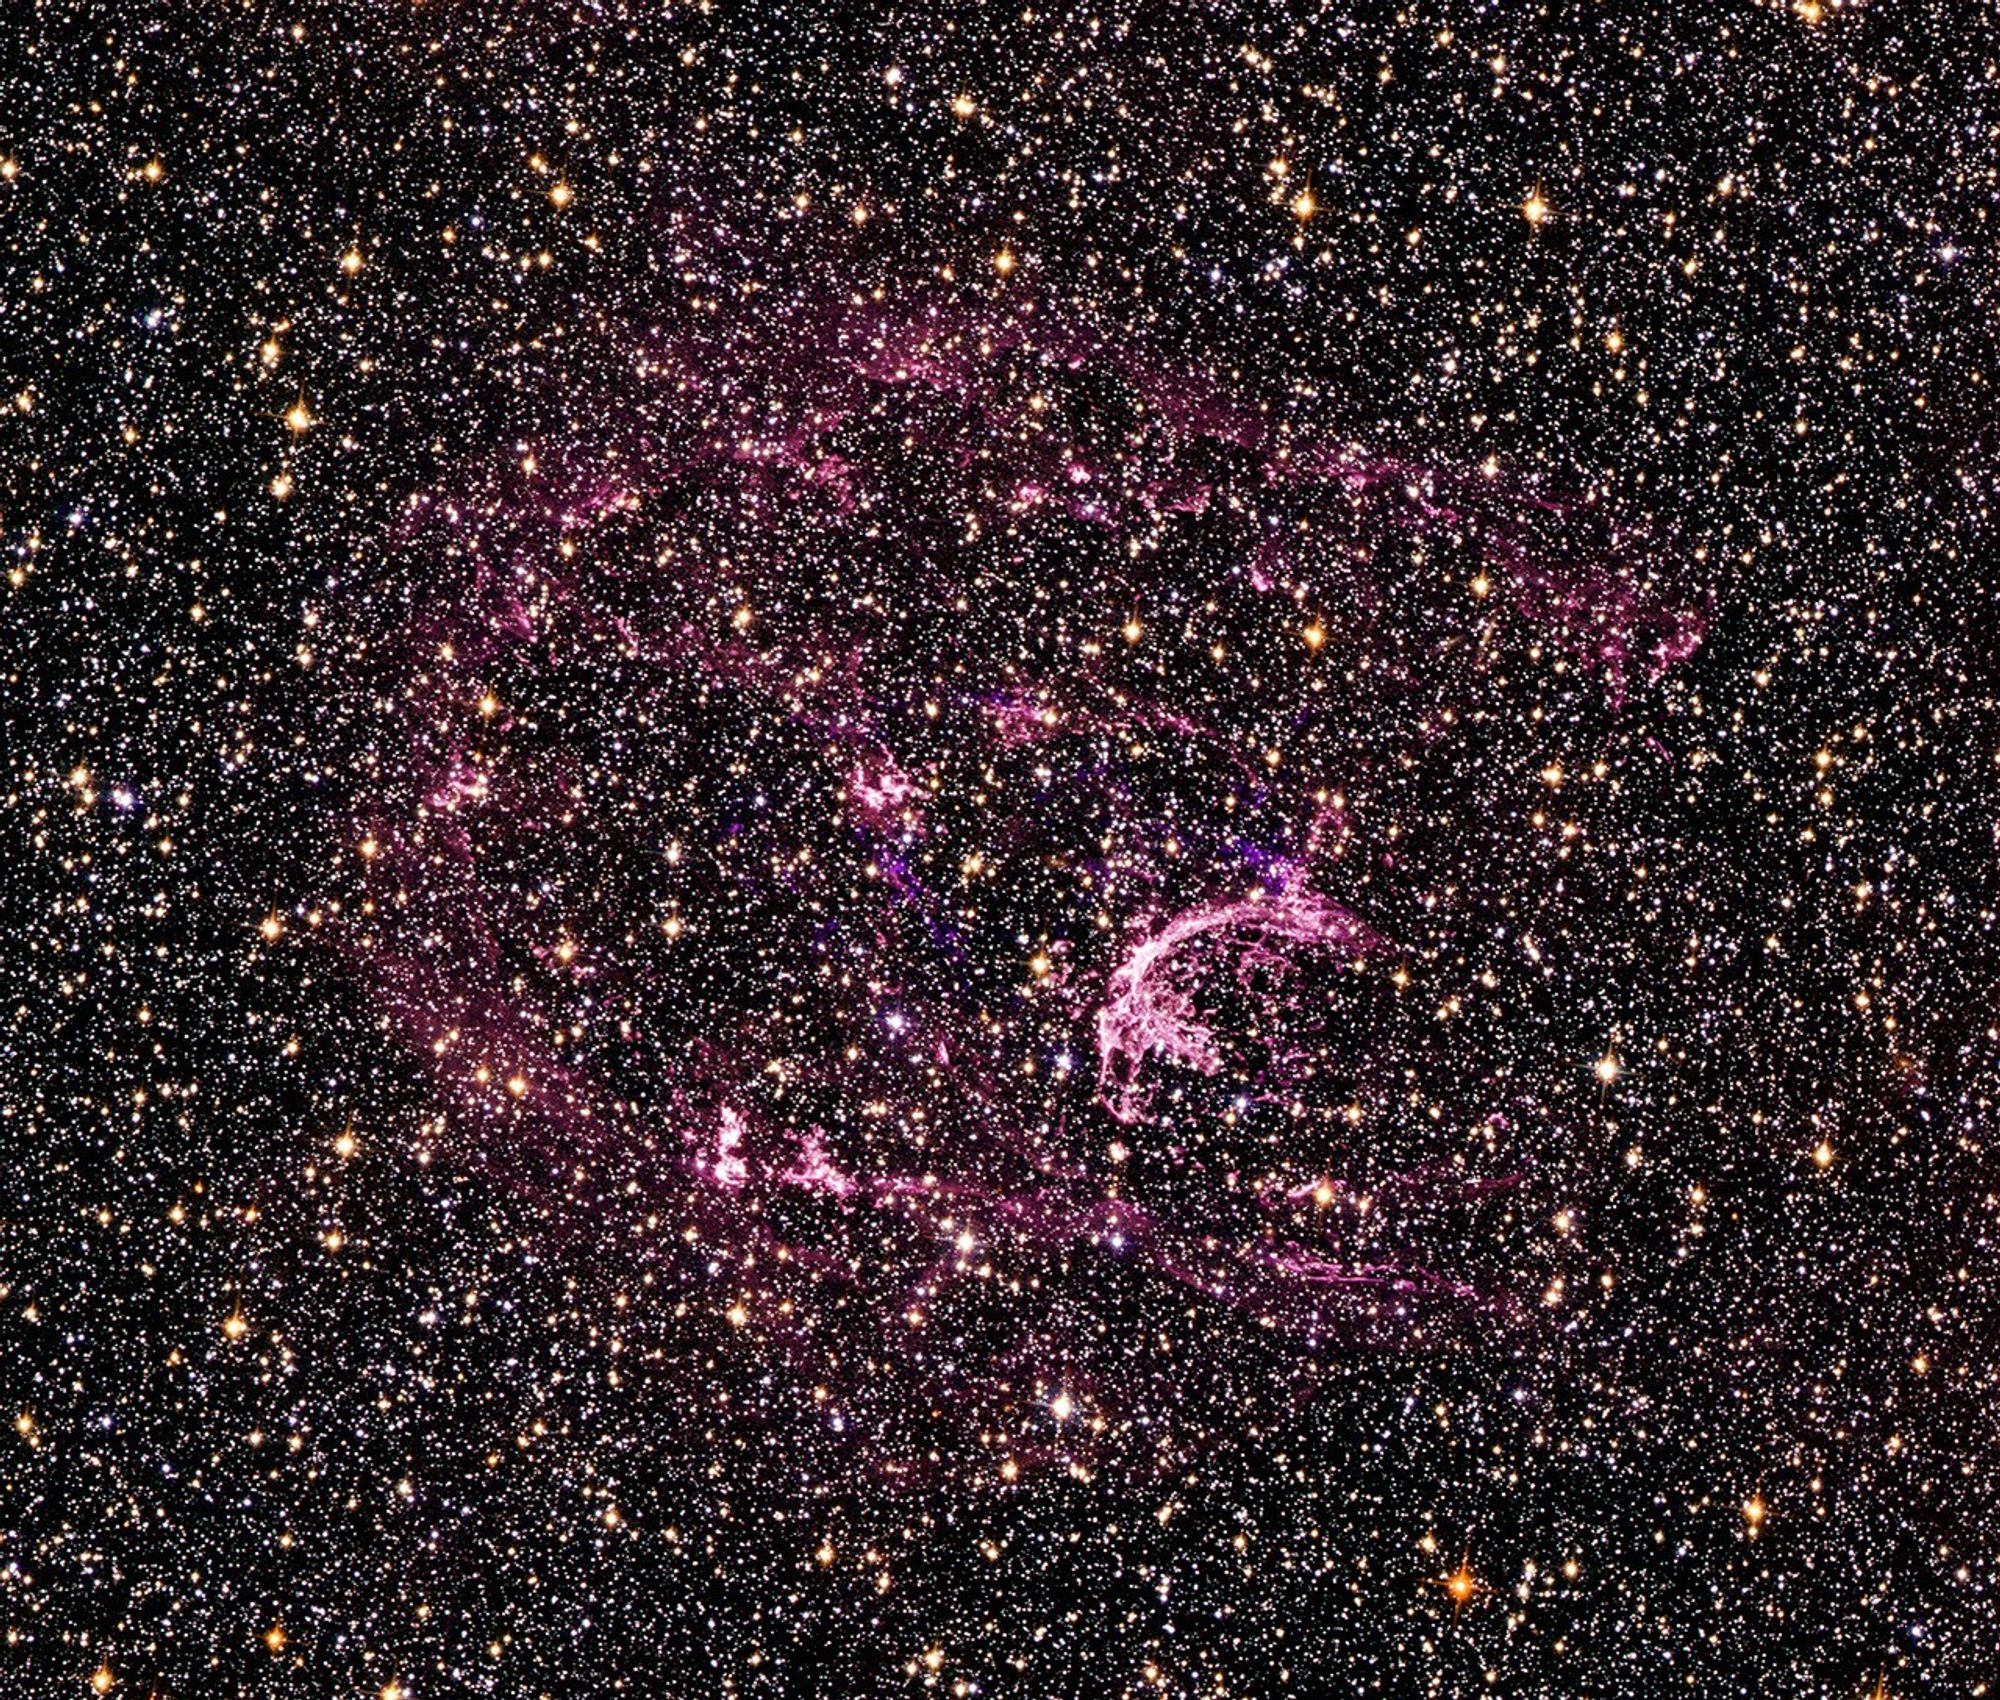
Optical image of supernova remnant N132D in the nearby Large Magellanic Cloud. [NASA, ESA, and the Hubble SM4 ERO Team]
6. Chandra Spies a Supernova Shock Front Speeding Along
N132D is a 2,500-year-old supernova remnant that holds the distinction of being the most X-ray luminous supernova remnant in the Local Group. Xi Long and collaborators turned the sensitive instruments of the Chandra X-ray Observatory toward N132D to measure the velocity of its expanding shock. Using two sets of measurements separated by 14.5 years, the team directly measured the remnant’s expansion, obtaining a much more precise measurement than previous efforts have achieved with other methods like X-ray spectroscopy and revealing differences in the expansion velocity around the remnant.
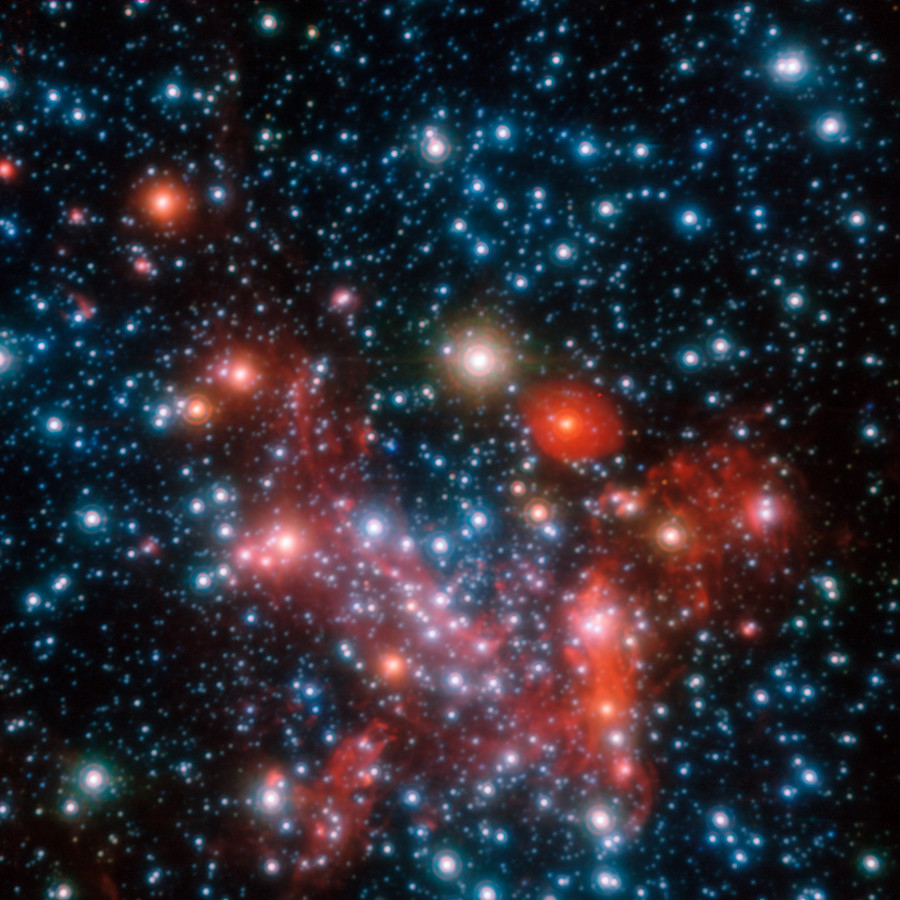
Stars at the center of the Milky Way, as seen by the Very Large Telescope. [ESO/S. Gillessen et al.; CC BY 4.0]
5. Our Galaxy’s Supermassive Black Hole May Have Had a Companion in the Past
At the center of our galaxy, a supermassive black hole 4 million times the mass of the Sun holds court. Though today Sagittarius A* is a solo act, Chunyang Cao and collaborators explored the possibility that our galaxy’s supermassive black hole had a companion millions to billions of years ago. If an intermediate-black hole entered our galaxy when the Milky Way absorbed a neighboring dwarf galaxy, the presence of the smaller black hole could explain the present-day properties of the hypervelocity stars that inhabit the center of our galaxy. The two black holes likely merged 10 million years ago.
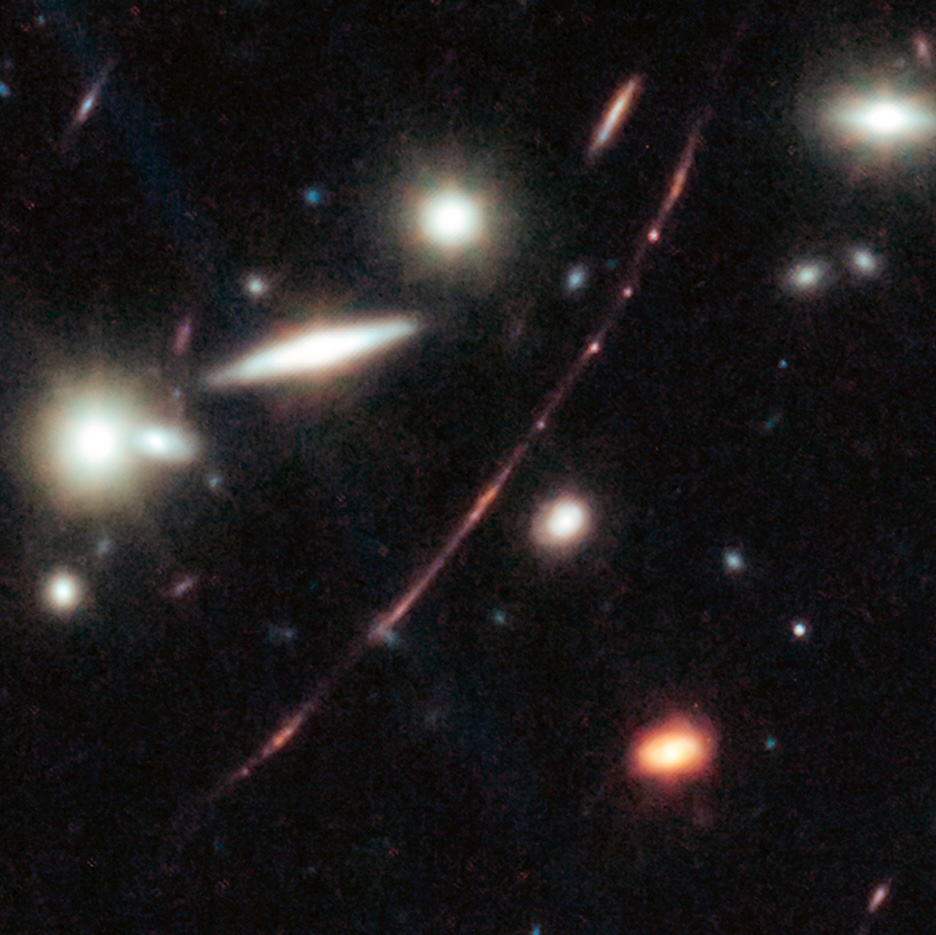
JWST image of the Sunrise Arc containing Earendel. [NASA, ESA, CSA; Science: Dan Coe (STScI/AURA for ESA, JHU), Brian Welch (NASA-GSFC, UMD); Image Processing: Zoltan Levay]
4. Examining Earendel: Is the Most Distant Lensed Star Actually a Cluster?
In 2022, researchers using the Hubble Space Telescope discovered a gravitationally lensed single-star candidate at a redshift of z = 5.926, corresponding to less than a billion years after the Big Bang. However, distinguishing between one gravitationally lensed star and many is challenging. A team led by Massimo Pascale used simple stellar population models to investigate Earendel’s identity, finding that the object’s spectrum is fit well by a variety of star cluster models. Based on this analysis, Earendel certainly could be many stars rather than one, but a single star cannot be ruled out. Variability due to stellar winds would be a smoking gun for the single-star hypothesis, but no such variability has been discovered to date.
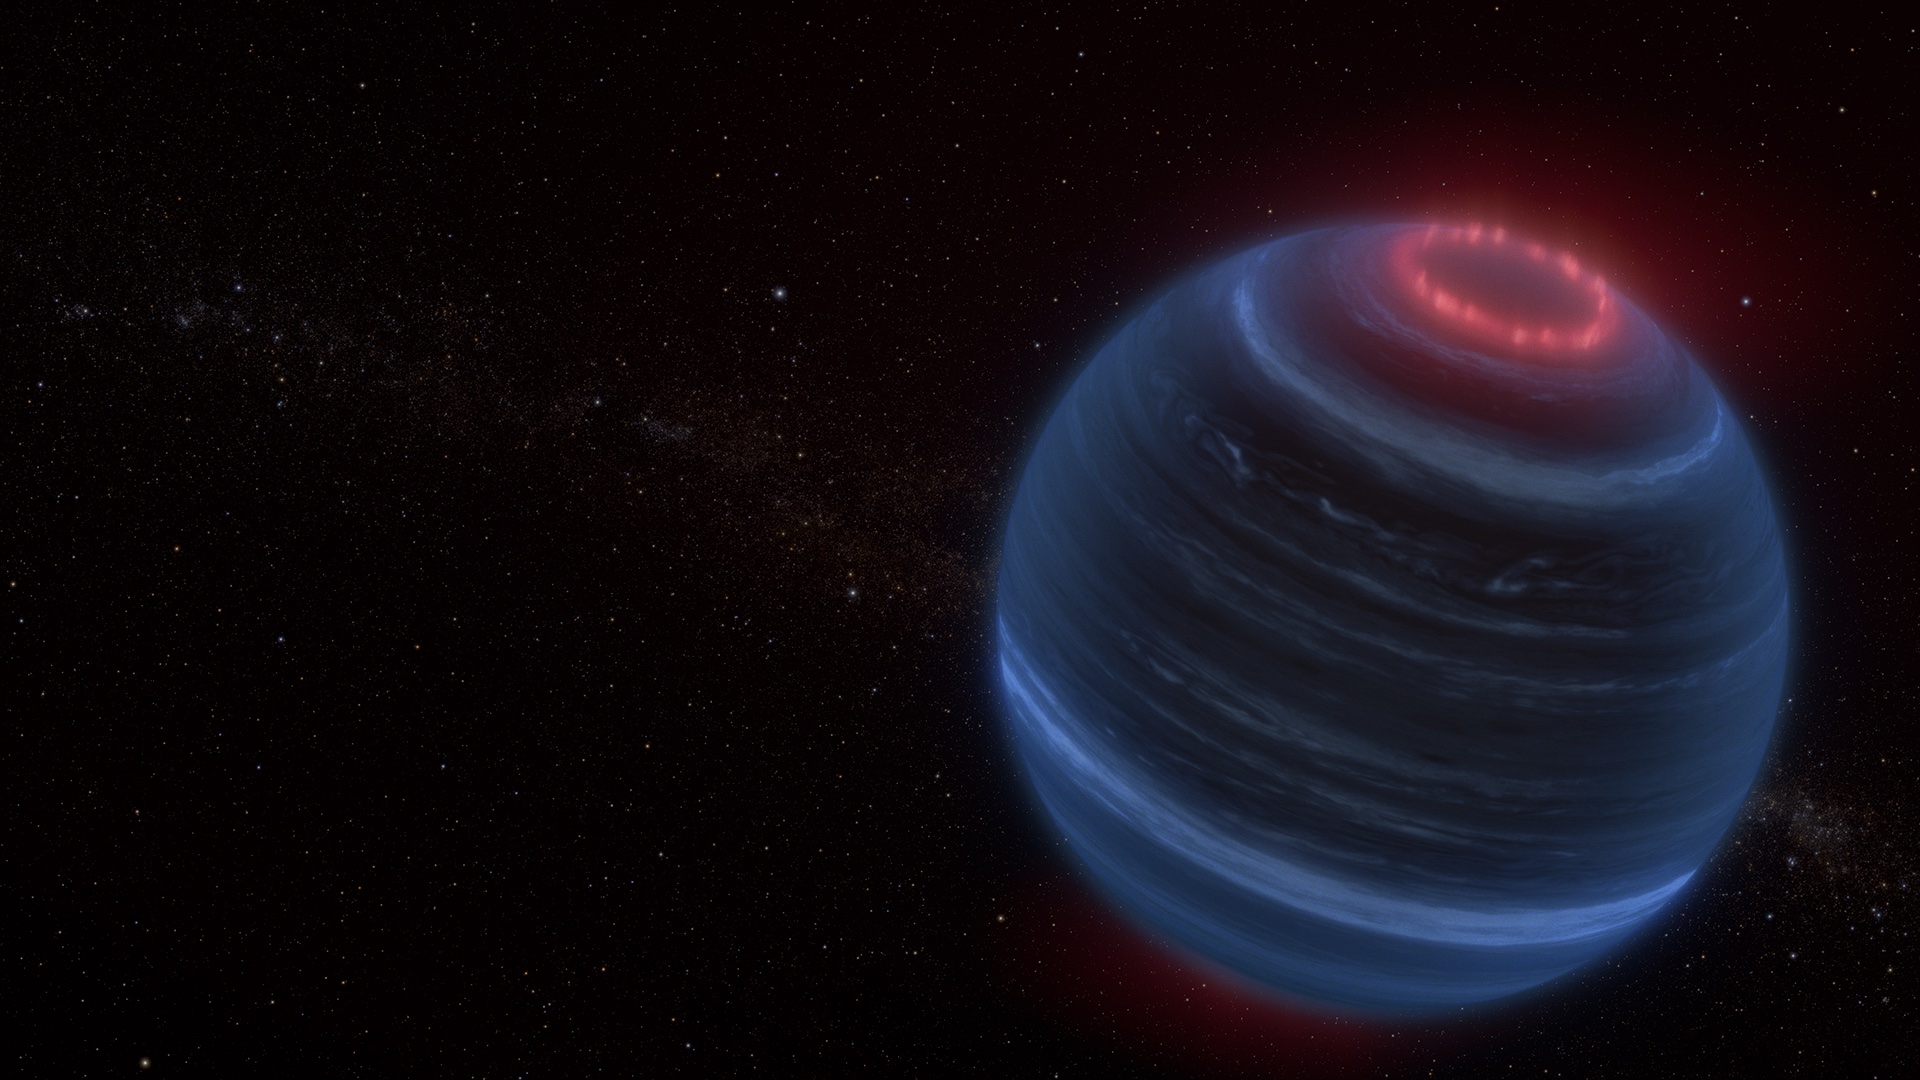
Artist’s impression of auroral emission on the brown dwarf W1935. [NASA, ESA, CSA, Leah Hustak (STScI)]
3. A Strange Brown Dwarf Gets Stranger
The brown dwarf W1935 made headlines in 2024 when researchers discovered methane emission from its atmosphere, a potential sign of auroral emission. In 2025, W1935 was back in the news after Matthew de Furio and collaborators reported that the brown dwarf was actually two brown dwarfs that were closely locked into 16–28 year orbits. What delightful weirdness will we discover about W1935 next?
Artist’s impression of the view from one of the planets orbiting Barnard’s Star. [International Gemini Observatory/NOIRLab/NSF/AURA/R. Proctor/J. Pollard; CC BY 4.0]
2. Confirmed at Last: Barnard’s Star Hosts Four Tiny Planets
Claims of planets orbiting Barnard’s Star have been made and disproven since the 1960s — but now, the claim has finally stuck. In 2024, researchers reported the discovery of one planet and three planet candidates around Barnard’s Star. In 2025, Ritvik Basant and collaborators confirmed the presence of all four of these planets, which appear to have minimum masses between 19% and 34% of Earth’s mass.

Illustration of stellar-mass black holes embedded within the accretion disk of a supermassive black hole. [Caltech/R. Hurt (IPAC)]
1. Gravitationally Lensed Gravitational Waves from Black Holes Around Black Holes
Discoveries featuring black holes and gravitational waves often occupy the top spots on AAS Nova’s year-end list. This year, the most-read article features both of those topics! Samson Leong’s team explored the gravitational waves that would be produced by merging stellar-mass black holes orbiting within the disk surrounding supermassive black holes.
We wish you a safe, warm, and happy New Year, and we hope to see you in 2026 for more news from our universe!
The post Looking Back on Astronomy in 2025 with AAS Nova appeared first on AAS Nova.
]]>
Researchers explored the reaches of humanity's technological signatures to determine if intelligent life like that on Earth could detect Earth.
The post Selections from 2025: Could Earth Detect Earth? appeared first on AAS Nova.
]]>Editor’s Note: For the remainder of 2025, we’ll be looking at a few selections that we haven’t yet discussed on AAS Nova from among the most-downloaded articles published in AAS journals this year. The usual posting schedule will resume January 2nd.
Earth Detecting Earth: At What Distance Could Earth’s Constellation of Technosignatures Be Detected with Present-day Technology?
Published February 2025
Main takeaway:
In a collaborative effort between the Search for Extraterrestrial Intelligence (SETI) Institute and the Penn State Extraterrestrial Intelligence Center, Sofia Sheikh (SETI Institute) and team turned inward to expand the search for intelligent life in the universe. Right here on Earth, humans have created a laboratory of technological signatures that can be detected from space — if another Earth-like civilization is out there, could they detect us? Using theoretical modeling, the authors determined the reaches of various human technosignatures such as radio transmissions, optical and infrared emission, satellites, and other probes sent into space. They found humanity’s strongest signals, radio transmissions, could be detected as far as 12,000 light-years away.
Why it’s interesting:
Scientists search for intelligent civilizations by hunting for signs of technology — signals or patterns that natural phenomena cannot explain. While we cannot expect other intelligent life to look exactly like Earth’s, many SETI projects have surveyed the skies for hypothetical signals far exceeding humanity’s own technological advancements. Taking a step back, Sheikh and collaborators considered where human technology is currently and what present-day instrumentation could pick up on if we were to search for ourselves. This “Earth detecting Earth” paradigm recenters the search for intelligent life and provides a multiwavelength framework for understanding the detectability of technology on far-away worlds.

Maximum distances that Earth’s technosignatures could be detected by current technology. Click to enlarge. [Sheikh et al 2025]
Earth’s constellation of technosignatures:
What exactly are Earth’s many technosignatures, and how far could our current technology detect them? The most prominent and farthest detectable signal comes from radio transmissions. As the authors noted, these signals come from multiple sources: targeted radar transmissions used to characterize planets and asteroids, radio transmissions used to communicate between space probes and ground stations (e.g., space telescopes, Mars rovers, etc.), and radio leakage from Earth’s communication systems like cell towers and broadcasting stations. Additionally, there are atmospheric technosignatures from air-polluting compounds, optical and infrared emission from cities, targeted lasers from telescopes, and interplanetary and interstellar probes sent into space. All of these combined create a constellation of technosignatures detectable across a range of distances from Earth. This study underscores the importance of assessing Earth’s technology and detection capabilities, and repeating this type of study as technological advancements continue will enhance the search for intelligent life.
Citation
Sofia Z. Sheikh et al 2025 AJ 169 118. doi:10.3847/1538-3881/ada3c7
The post Selections from 2025: Could Earth Detect Earth? appeared first on AAS Nova.
]]>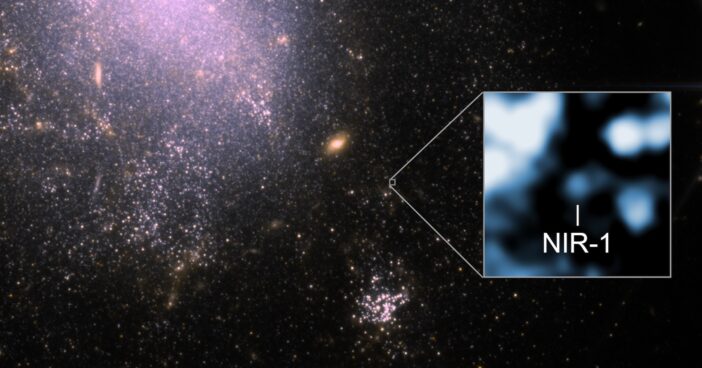
Astronomers have traced a bright, seemingly one-off fast radio burst to a galaxy 130 million light-years away.
The post Selections from 2025: Pinpointing a Bright Fast Radio Burst with CHIME appeared first on AAS Nova.
]]>Editor’s Note: For the remainder of 2025, we’ll be looking at a few selections that we haven’t yet discussed on AAS Nova from among the most-downloaded articles published in AAS journals this year. The usual posting schedule will resume January 2nd.
FRB 20250316A: A Brilliant and Nearby One-Off Fast Radio Burst Localized to 13 pc Precision
Published August 2025
Main takeaway:
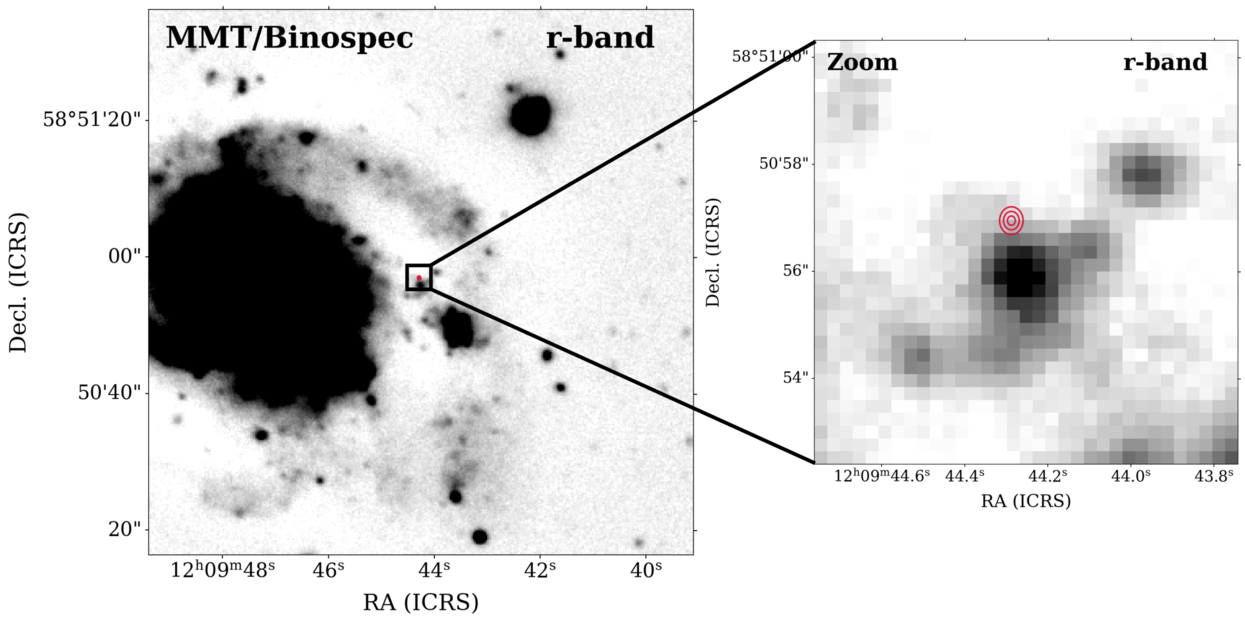
MMT observation of NGC 4141 (left) and zoomed-in on FRB 20250316A’s location. The red lines show the 1-, 2-, and 3-sigma localization ellipses of the burst. Click to enlarge. [CHIME Collaboration 2025]
Why it’s interesting:
The origins of fast radio bursts — bright flashes of radio waves lasting on the order of milliseconds — are mysterious, despite several thousand bursts having been cataloged. Among the many questions that remain is whether one-off bursts and repeating bursts arise from the same population of objects, or if they have entirely different origins. So far, FRB 20250316A appears to be a one-off burst; while it’s still possible that the source could emit another burst, the team noted that the burst’s properties don’t mesh with those of known repeating bursts. This makes the discovery and localization of FRB 20250316A an excellent opportunity to investigate the sources of one-off fast radio bursts.
More about the potential source of this burst, and prospects for pinpointing future sources:
After homing in on FRB 20250316A’s location, the CHIME collaboration embarked on a multi-wavelength follow-up campaign to learn more about where the burst came from. This campaign placed constraints on the metallicity and gas density near the source, which lies about 600 light-years from the center of the nearest star-forming region. A separate research article, published the same day as this work from the CHIME collaboration, described the discovery of a red giant star in the FRB 20250316A source region. This star may be located near FRB 20250316A’s source by chance, or it could be in a binary system with the source. With the main CHIME array in British Columbia continuing to scan for new bursts and three newly built outrigger telescopes in British Columbia, West Virginia, and California now online, we can expect many more precise localizations in the future!
Citation
The CHIME/FRB Collaboration: et al 2025 ApJL 989 L48. doi:10.3847/2041-8213/adf62f
The post Selections from 2025: Pinpointing a Bright Fast Radio Burst with CHIME appeared first on AAS Nova.
]]>
What did JWST see when it examined TRAPPIST-1e, a nearby habitable-zone exoplanet orbiting a cool red star?
The post Selections from 2025: JWST Searches for an Atmosphere on TRAPPIST-1e appeared first on AAS Nova.
]]>Editor’s Note: For the remainder of 2025, we’ll be looking at a few selections that we haven’t yet discussed on AAS Nova from among the most-downloaded articles published in AAS journals this year. The usual posting schedule will resume January 2nd.
JWST-TST DREAMS: Secondary Atmosphere Constraints for the Habitable Zone Planet TRAPPIST-1 e
Published September 2025
Main takeaway:
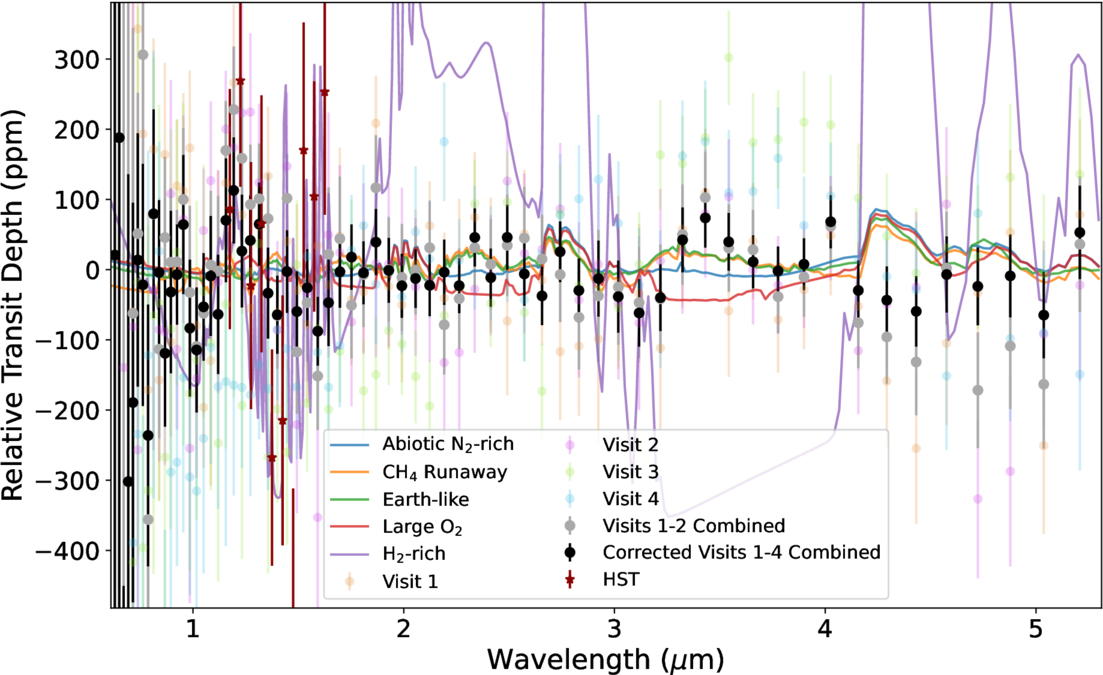
JWST spectra of TRAPPIST-1e (circles) and model outputs for several different atmospheric compositions and pressures (lines). Click to enlarge. [Glidden et al. 2025]
Why it’s interesting:
TRAPPIST-1e is one of seven confirmed planets orbiting TRAPPIST-1, a cool M-dwarf star that is just larger than Jupiter and only 41 light-years away. All of these planets are roughly the size and mass of Earth, and as many as four of them — planets d through h — are thought to lie within the tiny star’s habitable zone. Thus, this system offers an excellent opportunity for powerful observatories like JWST to characterize the atmospheres of several potentially habitable planets. This study by Glidden’s team presents JWST’s first look at TRAPPIST-1e’s atmosphere through transmission spectroscopy.
How TRAPPIST-1 complicated the observations:
When examining an exoplanet that closely orbits its host star, special care must be taken to separate the signals from the planet and the star. This is especially tricky for active stars like TRAPPIST-1, whose surfaces are peppered with dark starspots and bright faculae. TRAPPIST-1’s surface features have contaminated observations of other planets in the system, as described in previous research, and these observations of TRAPPIST-1e were not exempt from the star’s meddling. Luckily, researchers are conducting further JWST observations that should help disentangle the star’s impact; an ongoing program will capture closely spaced transits of TRAPPIST-1e and TRAPPIST-1b, which trace nearly the same track across the star’s disk. Since TRAPPIST-1b appears to be a bare rock, any features that are shared between its spectrum and TRAPPIST-1e’s are likely to come from the star. Identifying these features will allow for better characterization of TRAPPIST-1e’s spectrum and atmosphere.
Citation
Ana Glidden et al 2025 ApJL 990 L53. doi:10.3847/2041-8213/adf62e
The post Selections from 2025: JWST Searches for an Atmosphere on TRAPPIST-1e appeared first on AAS Nova.
]]>
Researchers discovered a record-breaking giant nine-ringed galaxy that provides critical insight into galaxy formation and evolution.
The post Selections from 2025: The Nine-Ringed Bullseye Galaxy appeared first on AAS Nova.
]]>Editor’s Note: For the remainder of 2025, we’ll be looking at a few selections that we haven’t yet discussed on AAS Nova from among the most-downloaded articles published in AAS journals this year. The usual posting schedule will resume January 2nd.
The Bullseye: HST, Keck/KCWI, and Dragonfly Characterization of a Giant Nine-ringed Galaxy
Published February 2025
Main takeaway:

Red ellipses overplotted on the first eight rings identified with Hubble in the Bullseye galaxy. Click to enlarge. [Pasha et al 2025]
Why it’s interesting:
Galaxy mergers and interactions are commonplace in the universe, but it is very rare for a dwarf galaxy to strike right through a large galaxy’s core. When this does happen, the collision sends shock waves through the impaled galaxy, sweeping gas and dust outward and forming rings where star formation can occur (hence the name, collisional ring galaxy). These galaxies are valuable sites to explore galactic structure and evolution as well as provide a unique case to study galaxy mergers and interactions. Previously discovered collisional ring galaxies have at most two or three rings, so when Pasha and collaborators found the stunning nine in the Bullseye, it was clear they caught something significant.
Catching the Bullseye at a lucky time in its evolution:
Why does the Bullseye have so many rings? Theoretical studies of these head-on collisions predict that many rings will form and travel outward after the initial crash; however, the rings tend to dissolve after only a few hundred million years. Catching this collision only 50 million years after it happened means we are witnessing the earlier stages of the Bullseye’s evolution. This lucky discovery not only confirms theoretical predictions for collisional ring galaxies, it also may be a clue to how another unique galaxy type, giant low-surface brightness galaxies, originate. Given the wispy ring material found at very large radii from the Bullseye, the authors suggested that collisional ring galaxies may evolve into giant low-surface brightness galaxies as they expand outward and fade. Further investigation and a larger sample of collisional ring galaxies are necessary to confirm this hypothesis, but the Bullseye provides interesting and critical observational evidence of these predictions for the first time.
Citation
Imad Pasha et al 2025 ApJL 980 L3. doi:10.3847/2041-8213/ad9f5c
The post Selections from 2025: The Nine-Ringed Bullseye Galaxy appeared first on AAS Nova.
]]>
Researchers used an airborne telescope to find out more about the origins of massive stars in our galaxy.
The post Selections from 2025: The Formation of Massive Stars appeared first on AAS Nova.
]]>Editor’s Note: For the remainder of 2025, we’ll be looking at a few selections that we haven’t yet discussed on AAS Nova from among the most-downloaded articles published in AAS journals this year. The usual posting schedule will resume January 2nd.
The SOFIA Massive (SOMA) Star Formation Survey. V. Clustered Protostars
Published June 2025
Main takeaway:
A team led by Zoie Telkamp (University of Virginia) used the Stratospheric Observatory for Infrared Astronomy, SOFIA, to study massive protostars and test theories of high-mass star formation. Contrary to the predictions of some star-formation models, the team found no evidence that massive protostars require a certain surface mass density to form. Formation in a cluster environment, however, may limit the formation of the most massive protostars.
Why it’s interesting:
Massive stars are rare, short-lived, and luminous. They influence their environments across a vast range of spatial and temporal scales, from advancing the epoch of reionization in the early universe to impacting the formation of individual planetary systems in the present-day universe. The fundamental question of how high-mass stars form is still unsettled. Theories of high-mass star formation range from scaled-up versions of low-mass star formation to scenarios involving collisions between protostars.
More about this massive-star study and the potential impact of a cluster environment:
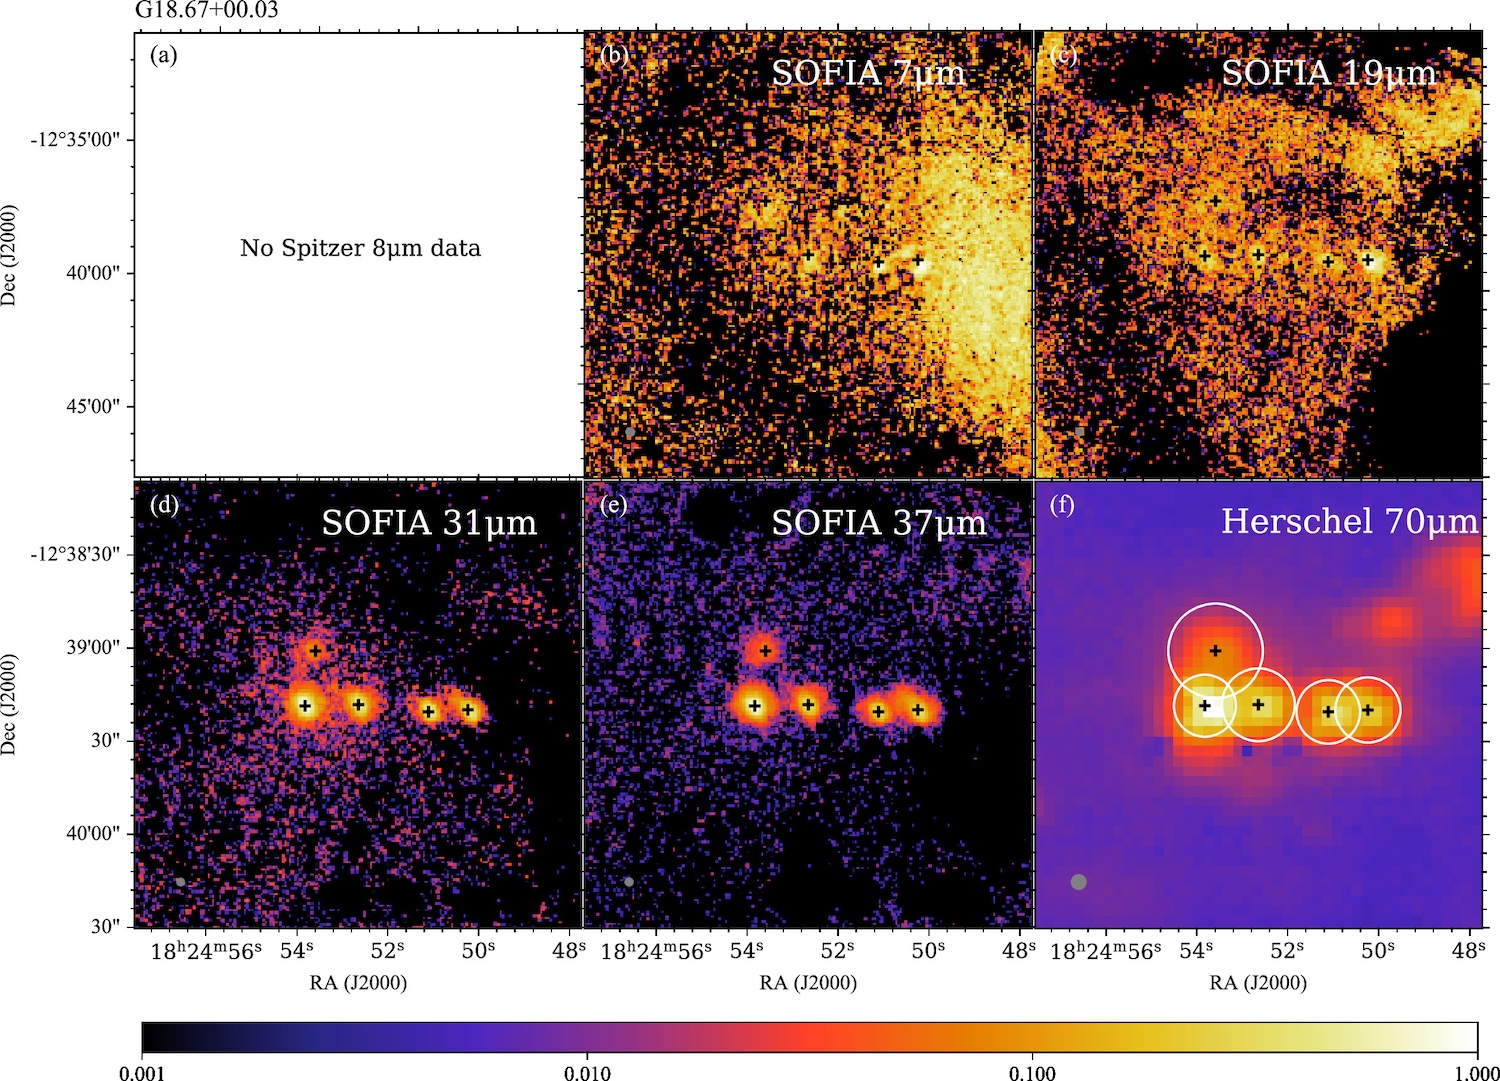
SOFIA FORCAST and Herschel Space Observatory images of protostars in the G18.67+0.03 star-forming region. Click to enlarge. [Telkamp et al. 2025]
Citation
Zoie Telkamp et al 2025 ApJ 986 15. doi:10.3847/1538-4357/adcd79
The post Selections from 2025: The Formation of Massive Stars appeared first on AAS Nova.
]]>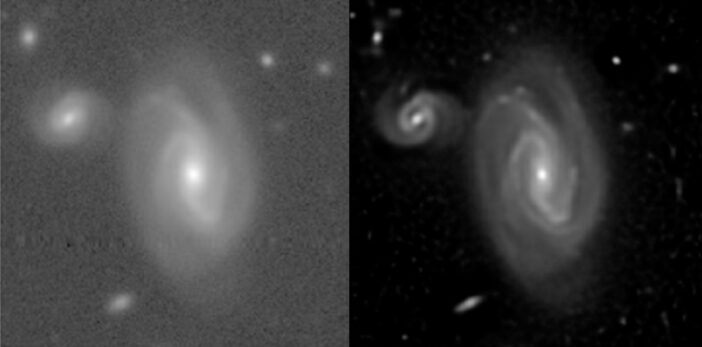
With immense amounts of data headed our way from ground-based facilities like the Vera C. Rubin Observatory, new methods are needed to rapidly and effectively process high-resolution images.
The post Selections from 2025: A New Way to Combine Ground-Based Images appeared first on AAS Nova.
]]>Editor’s Note: For the remainder of 2025, we’ll be looking at a few selections that we haven’t yet discussed on AAS Nova from among the most-downloaded articles published in AAS journals this year. The usual posting schedule will resume January 2nd.
ImageMM: Joint Multi-Frame Image Restoration and Super-Resolution
Published September 2025
Main takeaway:
A team led by Yashil Sukurdeep (Johns Hopkins University) developed a new method for processing and combining ground-based astronomical images. The authors’ algorithm, called ImageMM because it leverages a method called majorization–minimization, yielded greater detail in bright sources and distinguished more faint sources from the background than existing methods.
Why it’s interesting:
As ground-based telescopes grow larger and their cameras grow more sensitive, they must still contend with one unfortunate fact: they are trapped beneath Earth’s atmosphere, which blurs fine details in astronomical images. To extract as much information as possible from beneath Earth’s blurry, ever-shifting atmosphere, researchers have developed numerous strategies for cleaning, combining, and sharpening astronomical images. From simple averaging of multiple exposures to complex statistical techniques, each of these methods has unique strengths and weaknesses. ImageMM succeeds in quieting background noise and sharpening images of both extended and point-like sources while avoiding many of the pitfalls of statistical methods.
How they tested the new method:
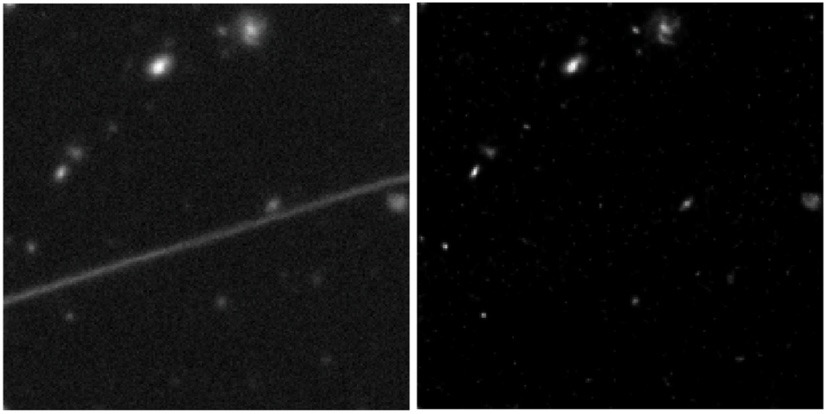
An example of satellite-trail removal by ImageMM. Click to enlarge. [Adapted from Sukurdeep et al. 2025]
Citation
Yashil Sukurdeep et al 2025 AJ 170 233. doi:10.3847/1538-3881/adfb72
The post Selections from 2025: A New Way to Combine Ground-Based Images appeared first on AAS Nova.
]]>
During the exceptionally deep solar minimum of 2008, researchers thought the Sun might be entering a prolonged period of low solar activity — but the Sun had other plans.
The post Selections from 2025: The Sun Changed Course in 2008 appeared first on AAS Nova.
]]>Editor’s Note: For the remainder of 2025, we’ll be looking at a few selections that we haven’t yet discussed on AAS Nova from among the most-downloaded articles published in AAS journals this year. The usual posting schedule will resume January 2nd.
The Sun Reversed Its Decades-Long Weakening Trend in 2008
Published September 2025
Main takeaway:
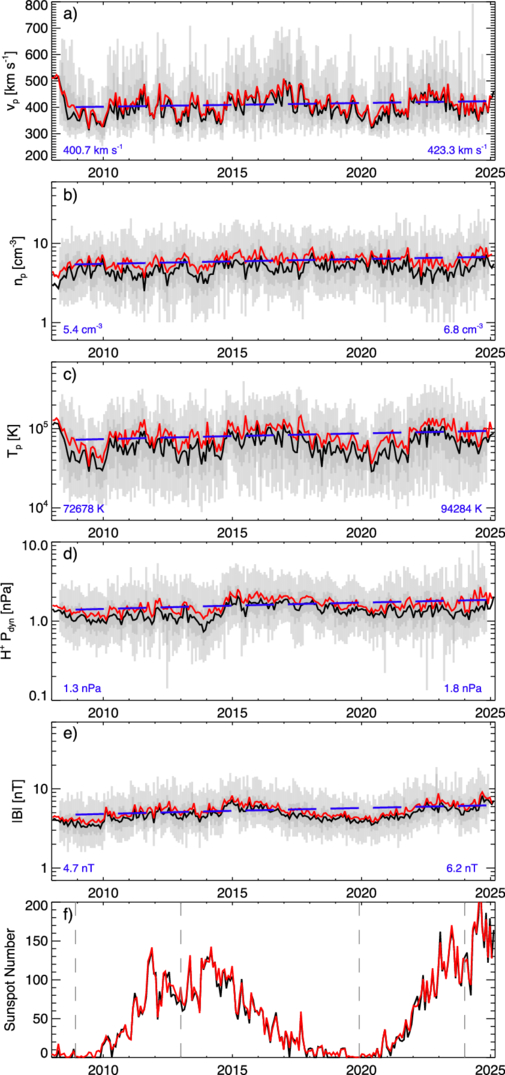
Various solar wind parameters measured at Earth’s orbital distance from 2008 to 2025. [Jasinski and Velli 2025]
Why it’s interesting:
The Sun undergoes an 11-year activity cycle that is driven by a change in its internal magnetic field structure. As the Sun’s magnetic activity changes, the number of sunspots, the frequency of solar flares and coronal mass ejections, and the intensity of the solar wind vary as well. Atop these mostly regular 11-year changes are longer-term variations. A recent example of this longer-term behavior began in the 1980s, when an overall weakening trend was stamped upon the usual 11-year cycle. This decline led to an exceptionally deep solar minimum in 2008, leading researchers to suspect that the Sun’s activity level might remain low for decades.
The historical context for a prolonged weak period:
Though the Sun reversed its weakening activity trend in 2008, a prolonged period with little solar activity wouldn’t have been unprecedented. Astronomers have monitored and counted sunspots for centuries, allowing modern-day researchers to investigate the Sun’s behavior long before spacecraft began to study our home star. In the historical record, there are two instances of weak solar activity spanning multiple decades: the Maunder minimum in 1645–1715 and the Dalton minimum in 1790–1830. Compared to the 11-year solar cycle, these longer-term behaviors are more difficult to predict, and their causes are uncertain.
Citation
Jamie M. Jasinski and Marco Velli 2025 ApJL 990 L55. doi:10.3847/2041-8213/adf3a6
The post Selections from 2025: The Sun Changed Course in 2008 appeared first on AAS Nova.
]]>
The repeating fast radio burst source FRB 20240209A is the only known repeating burst to come from a quiescent galaxy.
The post Selections from 2025: A Repeating Fast Radio Burst in a Quiescent Galaxy appeared first on AAS Nova.
]]>Editor’s Note: For the remainder of 2025, we’ll be looking at a few selections that we haven’t yet discussed on AAS Nova from among the most-downloaded articles published in AAS journals this year. The usual posting schedule will resume January 2nd.
A Repeating Fast Radio Burst Source in the Outskirts of a Quiescent Galaxy
Published January 2025
Main takeaway:
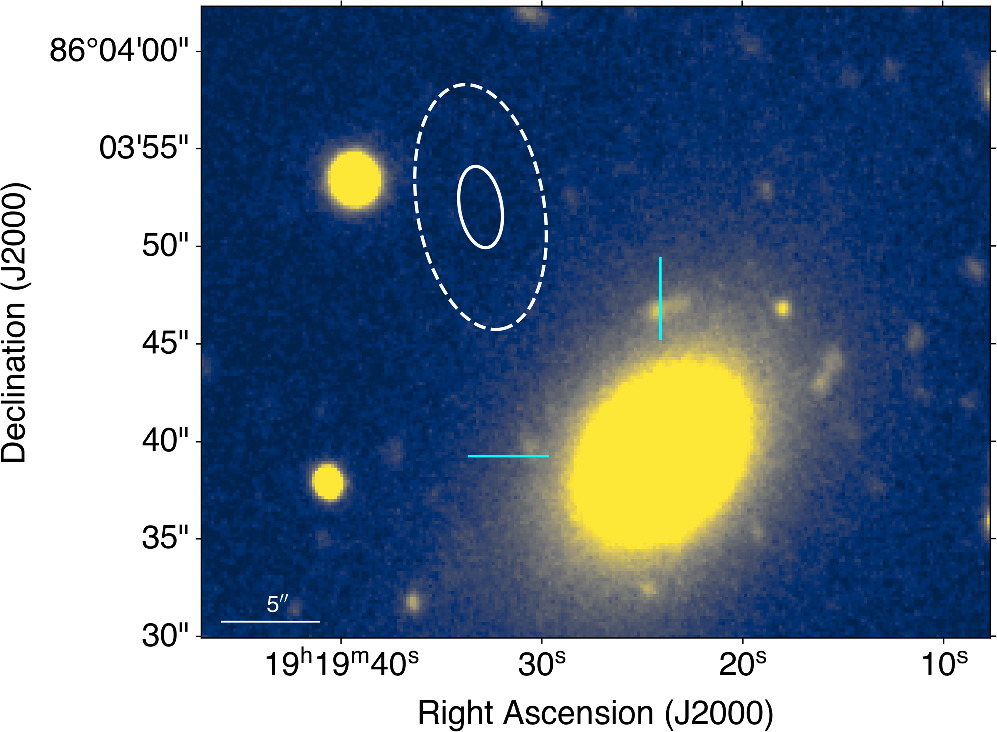
Gemini-North image of the FRB 20240209A localization region (white lines) and the source’s likely host galaxy (cyan crosshairs). [Shah et al. 2025]
Why it’s interesting:
Fast radio bursts are brief, intense flashes of radio waves from sources across the universe. Aside from one fast radio burst that has been associated with a magnetar within our own Milky Way, the source of these outbursts remains mysterious, and precise localization of these bursts is key to pinning down their origins; fast radio bursts that come from galaxies with active star formation may be linked to “prompt” formation channels like core-collapse supernovae or young magnetars, while bursts that arise in quiescent galaxies might be due to “delayed” formation pathways such as neutron stars that are born from merging white dwarfs.
How FRB 20240209A compares to other fast radio bursts, and what may have caused it:
FRB 20240209A is similar to other repeating fast radio bursts in terms of the shape of its individual bursts as well as its tendency to undergo periods of high and low bursting activity. Its location makes it quite unusual, though: it’s the only repeating fast radio burst known to come from a quiescent galaxy, and it’s the only burst — repeating or not — that has been found in an elliptical galaxy. If confirmed to originate from a globular cluster, FRB 20240209A would also be only the second known fast radio burst source to come from this type of environment. Shah’s team explored multiple possible origin stories for FRB 20240209A, including the possibility that the source was ejected from its host galaxy. The team favors an origin involving a magnetar formed through the collapse or merger of a compact object.
Citation
Vishwangi Shah et al 2025 ApJL 979 L21. doi:10.3847/2041-8213/ad9ddc
The post Selections from 2025: A Repeating Fast Radio Burst in a Quiescent Galaxy appeared first on AAS Nova.
]]>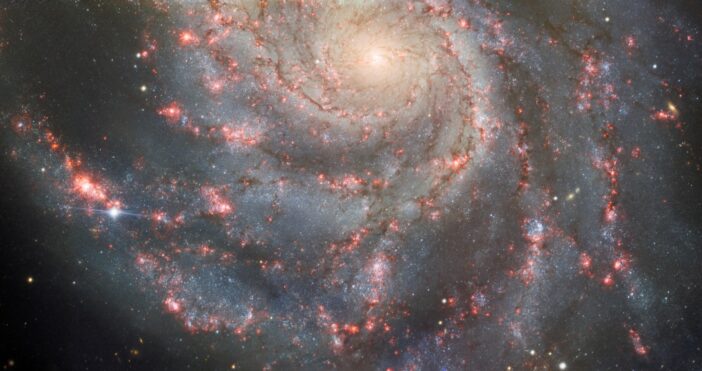
SN 2023ixf is the closest supernova in a decade. Did researchers detect gravitational waves from the explosion?
The post Selections from 2025: A Search for Gravitational Waves from SN 2023ixf appeared first on AAS Nova.
]]>Editor’s Note: For the remainder of 2025, we’ll be looking at a few selections that we haven’t yet discussed on AAS Nova from among the most-downloaded articles published in AAS journals this year. The usual posting schedule will resume January 2nd.
Search for Gravitational Waves Emitted from SN 2023ixf
Published May 2025
Main takeaway:
The LIGO, Virgo, and KAGRA collaborations searched for gravitational waves from the core-collapse supernova SN 2023ixf. Though no significant gravitational wave events were detected during times when two or more gravitational wave detectors were online, the non-detection of gravitational waves from this nearby supernova places constraints on the amount of energy emitted by the explosion in the form of gravitational waves, the shape of the proto-neutron star produced in the collapse, and more.
Why it’s interesting:
When a massive star expires in a core-collapse supernova, the collapse of the stellar core into a neutron star or black hole produces gravitational waves. These gravitational waves, along with a stream of neutrinos, should arrive at Earth before the light from the explosion does; gravitational waves and neutrinos can easily escape the dense, roiling ejecta from the explosion, but photons take some time to claw their way through the debris. Gravitational waves from a supernova have never been detected, but the nearby supernova SN 2023ixf, which occurred in a galaxy about 20 million light-years away, offered the best recent opportunity to detect these waves.
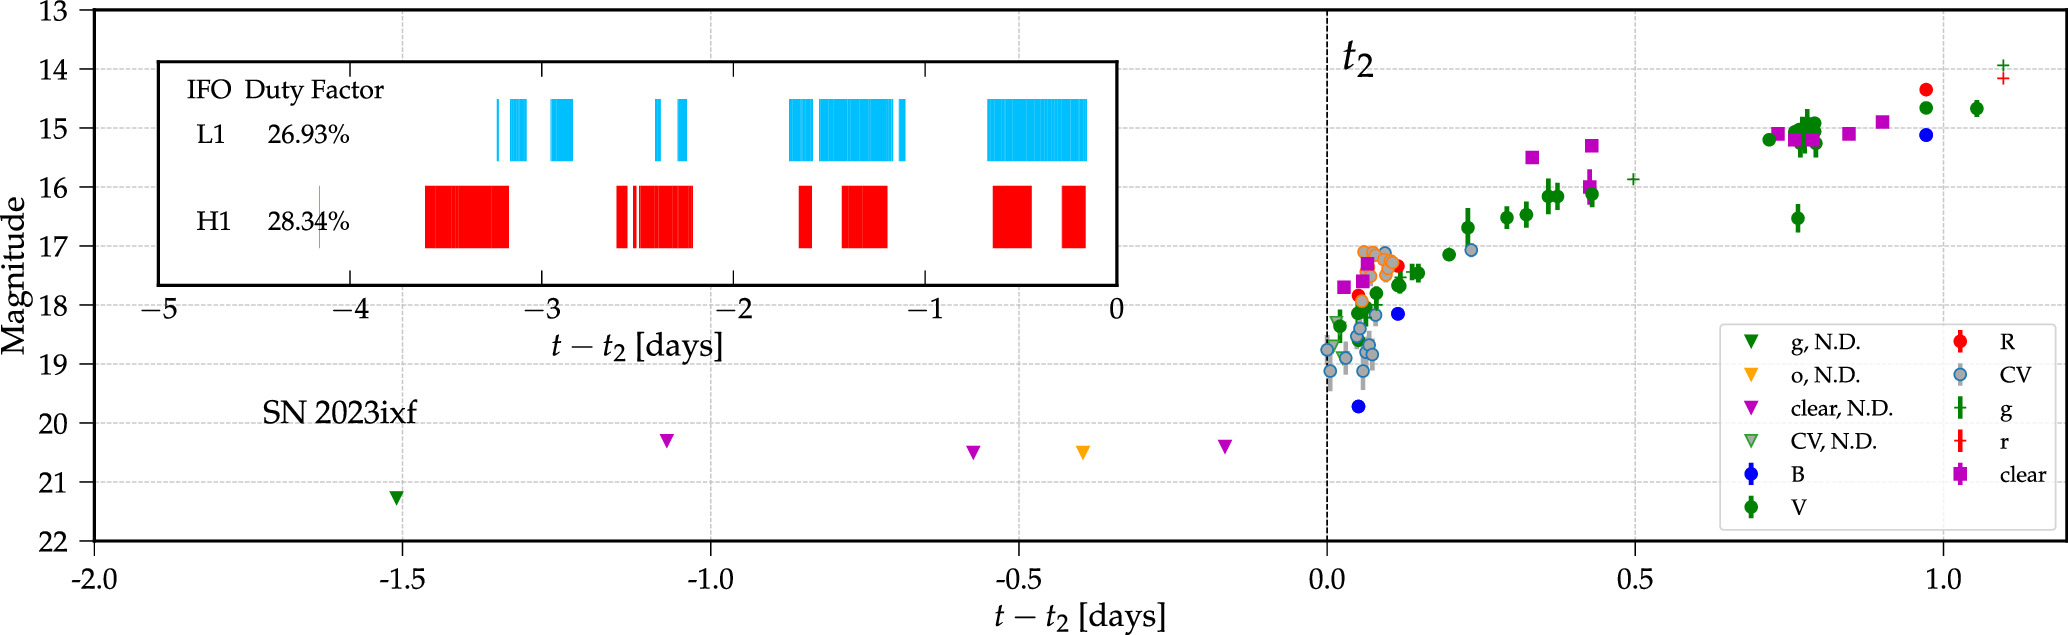
Photometric evolution of SN 2023ixf in its early days and gravitational wave coverage leading up to the supernova’s discovery (inset image). [LIGO-Virgo-KAGRA Collaborations 2025]
What we learned from this non-detection:
Using the non-detection of SN 2023ixf, researchers placed stringent constraints on the gravitational wave energy and luminosity of a supernova explosion, but an even closer supernova is still needed to begin to rule out model predictions for these quantities. To estimate the distance out to which we can expect to detect gravitational waves from collapsing stars, the collaboration members injected synthetic supernova signals into their data. The majority of non-rotating explosions can be detected out to about 22,000 light-years — meaning events on the far side of our galaxy remain inaccessible to current detectors — while rapidly rotating explosions should be detectable out to nearly 100,000 light-years, pushing the detection horizon beyond the borders of the Milky Way.
Citation
A. G. Abac et al 2025 ApJ 985 183. doi:10.3847/1538-4357/adc681
The post Selections from 2025: A Search for Gravitational Waves from SN 2023ixf appeared first on AAS Nova.
]]>
The third interstellar object to enter our solar system, 3I/ATLAS, is without a doubt one of the most fascinating astronomical discoveries of this year.
The post Selections from 2025: Hubble Observes 3I/ATLAS appeared first on AAS Nova.
]]>Editor’s Note: For the remainder of 2025, we’ll be looking at a few selections that we haven’t yet discussed on AAS Nova from among the most-downloaded articles published in AAS journals this year. The usual posting schedule will resume January 2nd.
Hubble Space Telescope Observations of the Interstellar Interloper 3I/ATLAS
Published August 2025
Main takeaway:
3I/ATLAS as seen by Hubble on 21 July 2025, when the comet was 3.83 au from the Sun. [Adapted from Jewitt et al. 2025]
Why it’s interesting:
3I/ATLAS is just the third known object to visit our solar system from another planetary system. With such a small sample size, every interstellar object discovered is a source of fascination. Are these objects more like comets or asteroids? How many of them roam the space between the stars? What, exactly, launches them into interstellar space? Using all available tools, including powerful observatories like Hubble, researchers can extract as much information as possible when interstellar objects make their brief journeys through our solar system, and get us closer to answering these key questions.
How these observations were planned, and what happened afterward:
After interstellar objects 1I/ʻOumuamua and 2I/Borisov zipped through the solar system in 2017 and 2019, respectively, researchers knew it was only a matter of time before the next interstellar interloper paid a visit. In preparation for the next arrival, Jewitt’s team proposed a target-of-opportunity observation with Hubble. This allowed them to disrupt the telescope’s planned observing schedule once 3I/ATLAS was discovered, getting an early high-resolution look that could guide further observations. Since then, researchers have published more than 30 articles in the AAS journals alone about 3I/ATLAS. In these articles, researchers have sought to understand where 3I/ATLAS came from, investigated its polarization properties, collected JWST data of the object, found it in pre-discovery data, and much more, crafting a comprehensive view of a rare visitor to our neighborhood.
Citation
David Jewitt et al 2025 ApJL 990 L2. doi:10.3847/2041-8213/adf8d8
The post Selections from 2025: Hubble Observes 3I/ATLAS appeared first on AAS Nova.
]]>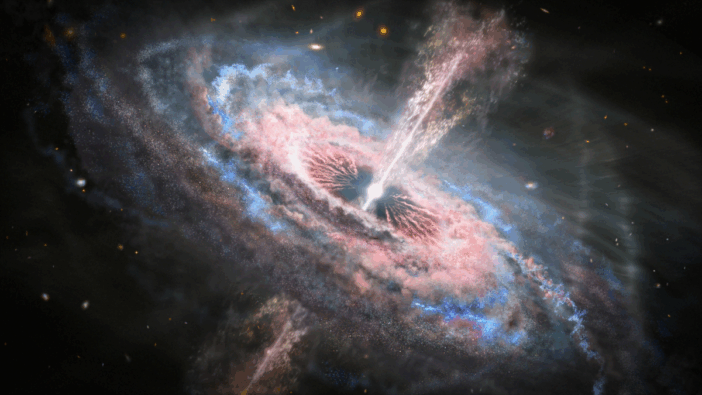
A recent study with JWST has unveiled how a reionization-era quasar has suppressed star formation in its galactic neighbors.
The post Intergalactic Impacts of Quasars During the Epoch of Reionization appeared first on AAS Nova.
]]>Emitting powerful radiation into their surroundings, quasars had the ability to significantly influence their local environments. A recent study using JWST observations focuses in on one of the most powerful known quasars to determine its intergalactic impact.
Quasar Questions
Beacons of light from the very distant universe, quasars are incredibly luminous galactic cores powered by active supermassive black holes. During the first few billion years after the Big Bang, quasars pumped radiation not only into their host galaxies but also out into intergalactic space and subsequently into nearby galaxies. This radiation was strong enough to ionize any intervening material and even break up (or photodissociate) molecular hydrogen gas. With their star formation fuel evaporated, a quasar’s unsuspecting galactic neighbors were stymied from growth.
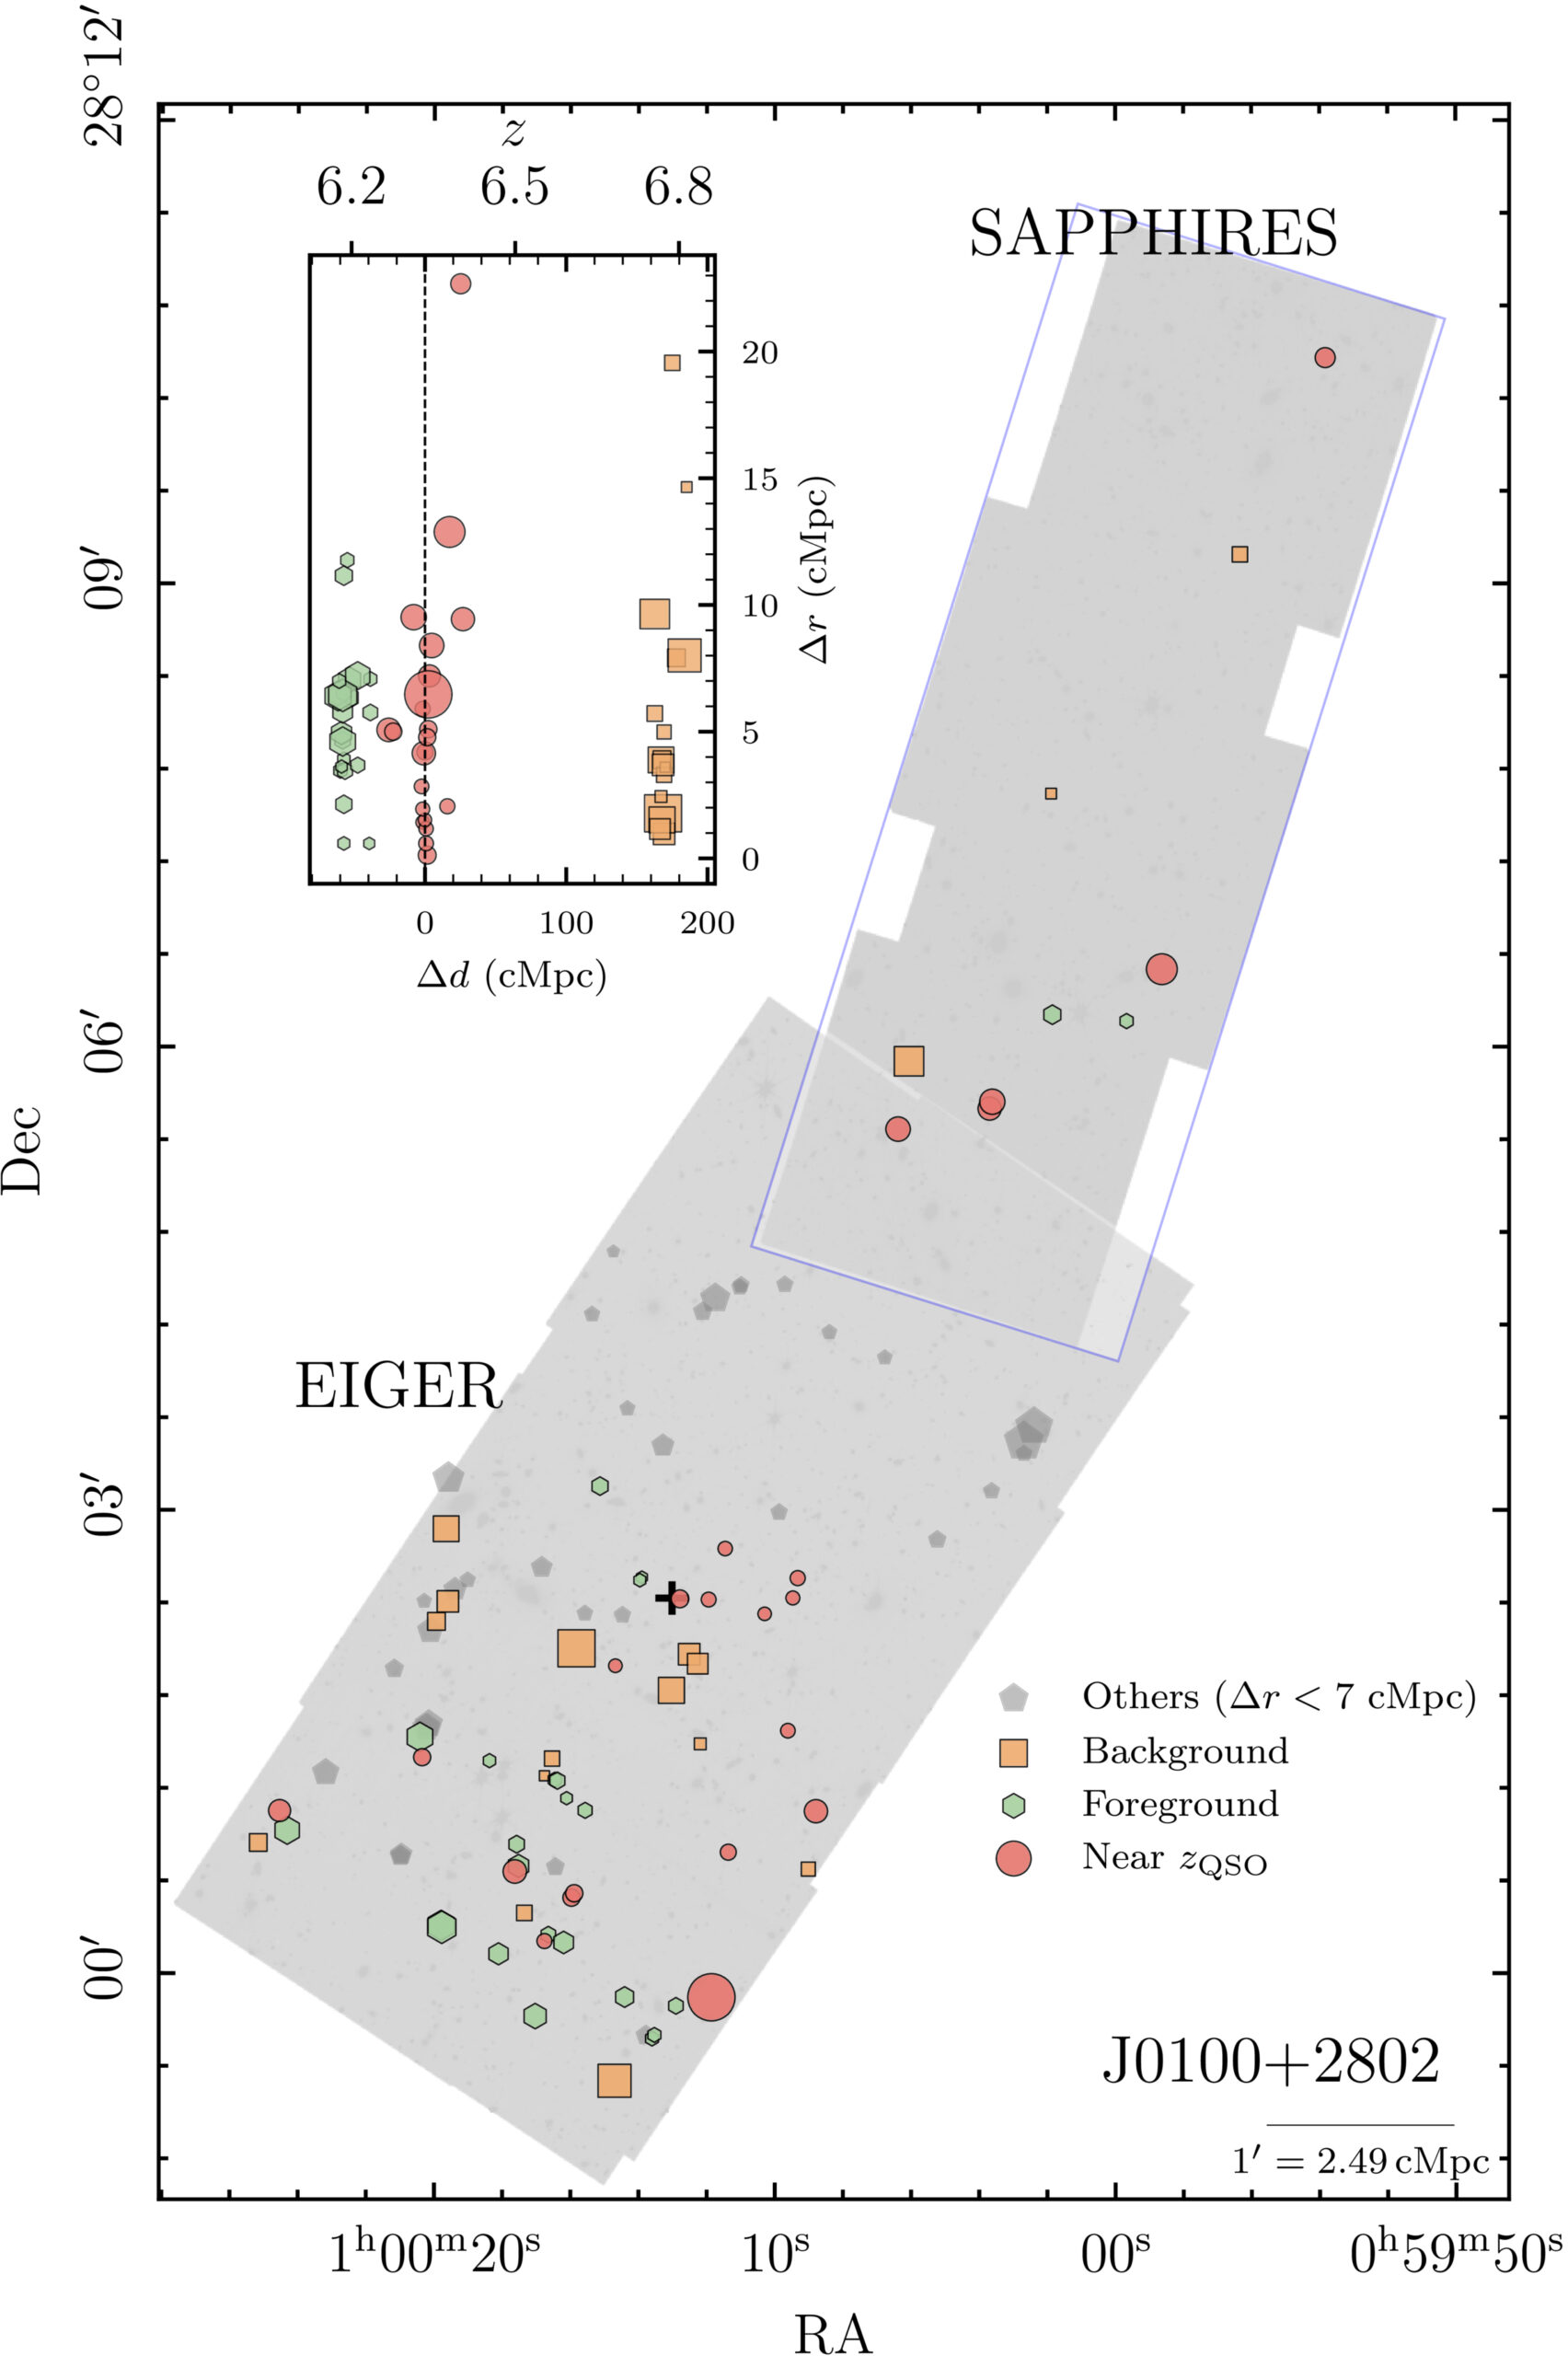
Sky map showing the location of quasar J0100+2802 (marked with black cross) and the [OIII]-emitting galaxies detected in the field. The red points are within the same redshift window as J0100+2802, and the green and orange points show foreground and background galaxies respectively. Click to enlarge. [Zhu et al 2025]
Searching for Suppressed Star Formation
To investigate how quasars may impact their environments, Yongda Zhu (University of Arizona) and collaborators set their gazes on J0100+2802 — the most ultraviolet-luminous quasar known at redshift z > 6. This powerful quasar lies in an overdensity, surrounded by galaxies filled with hot, young stars, making it an ideal candidate to test the impacts of luminous quasars on their neighbors. The authors used spectroscopy and photometry obtained from JWST to explore the space around J0100+2802.
Searching within the expected reach of the quasar’s radiation field, the authors identified galaxies with doubly ionized oxygen emission ([OIII] λ5008), which traces a galaxy’s recent star formation activity. After carefully separating background and foreground galaxies from galaxies at the same redshift as J0100+2802, the authors measured the total [OIII] emission and compared it to the overall ultraviolet stellar emission. From their sample, galaxies closer to J0100+2802 tend to exhibit lower [OIII]/UV ratios than those farther away, indicating that the powerful quasar may be suppressing star formation activity in nearby galaxies.

[OIII]/UV ratio versus distance from quasar J0100+2802. There is a clear positive correlation indicating that closer to the powerful quasar, [OIII] emission declines. The dashed line shows the expected radiation field of J0100+2802. Click to enlarge. [Modified from Zhu et al 2025]
Confirming the Culprit
To verify that the quasar is truly responsible for this declining trend, other environmental factors and intrinsic galaxy properties must be ruled out. Could the galaxies nearby J0100+2802 just happen to have elevated ultraviolet stellar continuum? Or could the overdense environment itself drive this trend? The authors performed additional analysis to control for these variables and found no strong global factors that could explain the decline in [OIII] emission — radiation from the quasar is likely the driver.
To further bolster their results and determine whether this behavior is more widespread, the authors investigated the environments around three other quasars at the same redshift as J0100+2802. Though these quasars are not as powerful as J0100+2802, a similar trend is uncovered for galaxies within the radiation field of these quasars. From this study, radiative feedback from quasars appears to disrupt the star formation activity in nearby galaxies, suppressing their growth and changing the way early galaxy formation progresses.
Further wide-field studies are necessary to understand the full extent to which reionization-era quasars can impact their environments, but this study provides a clear path forward with JWST.
Citation
“Quasar Radiative Feedback May Suppress Growth on Intergalactic Scales at z = 6.3,” Yongda Zhu et al 2025 ApJL 995 L5. doi:10.3847/2041-8213/ae1f8e
The post Intergalactic Impacts of Quasars During the Epoch of Reionization appeared first on AAS Nova.
]]>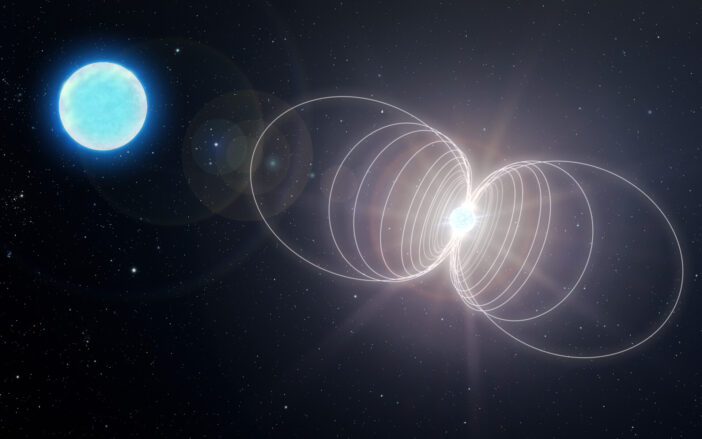
Researchers examine the possibility that one-off and repeating fast radio bursts could both arise from magnetars.
The post A Unified Explanation for Fast Radio Bursts appeared first on AAS Nova.
]]>A discovery that linked a fast radio burst to a magnetar in the Milky Way showed that certain fast radio bursts come from magnetars. A new study explores whether all fast radio bursts could have magnetar origins.
Varied Bursts
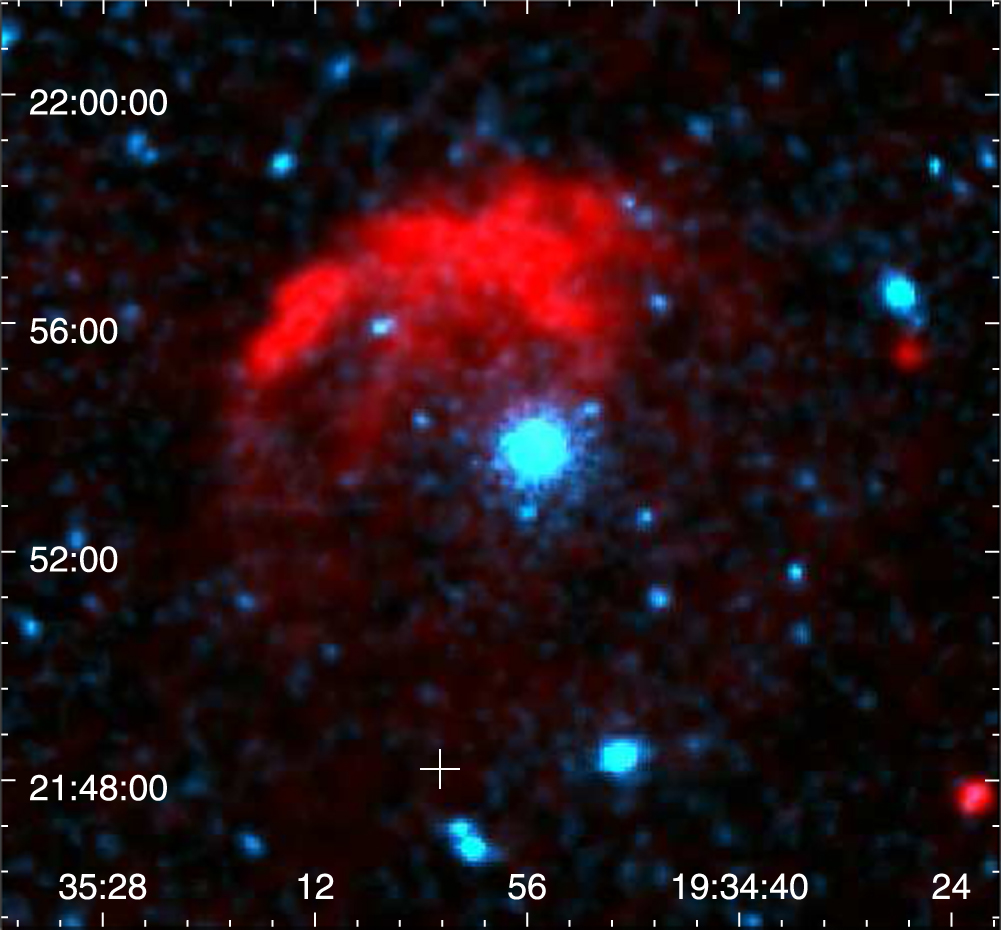
The bright blue source at the center of this X-ray image is SGR 1935+2154, the first magnetar to be associated with a fast radio burst. [Zhou et al. 2020]
In July 2020, astronomers reported the discovery of a fast radio burst likely associated with a magnetar in the Milky Way. This discovery suggested that at least some fast radio bursts come from magnetars, the rapidly spinning, intensely magnetized remnants of certain massive stars. However, it’s still not known whether all fast radio bursts share this origin, or if their varied behaviors can be traced to equally varied origins.
Mystery Solved by Magnetars?
In a recent research article, Bing Zhang (University of Hong Kong; University of Nevada) and Rui-Chong Hu (University of Nevada) set out to explore the possibility that all fast radio bursts have magnetar origins.
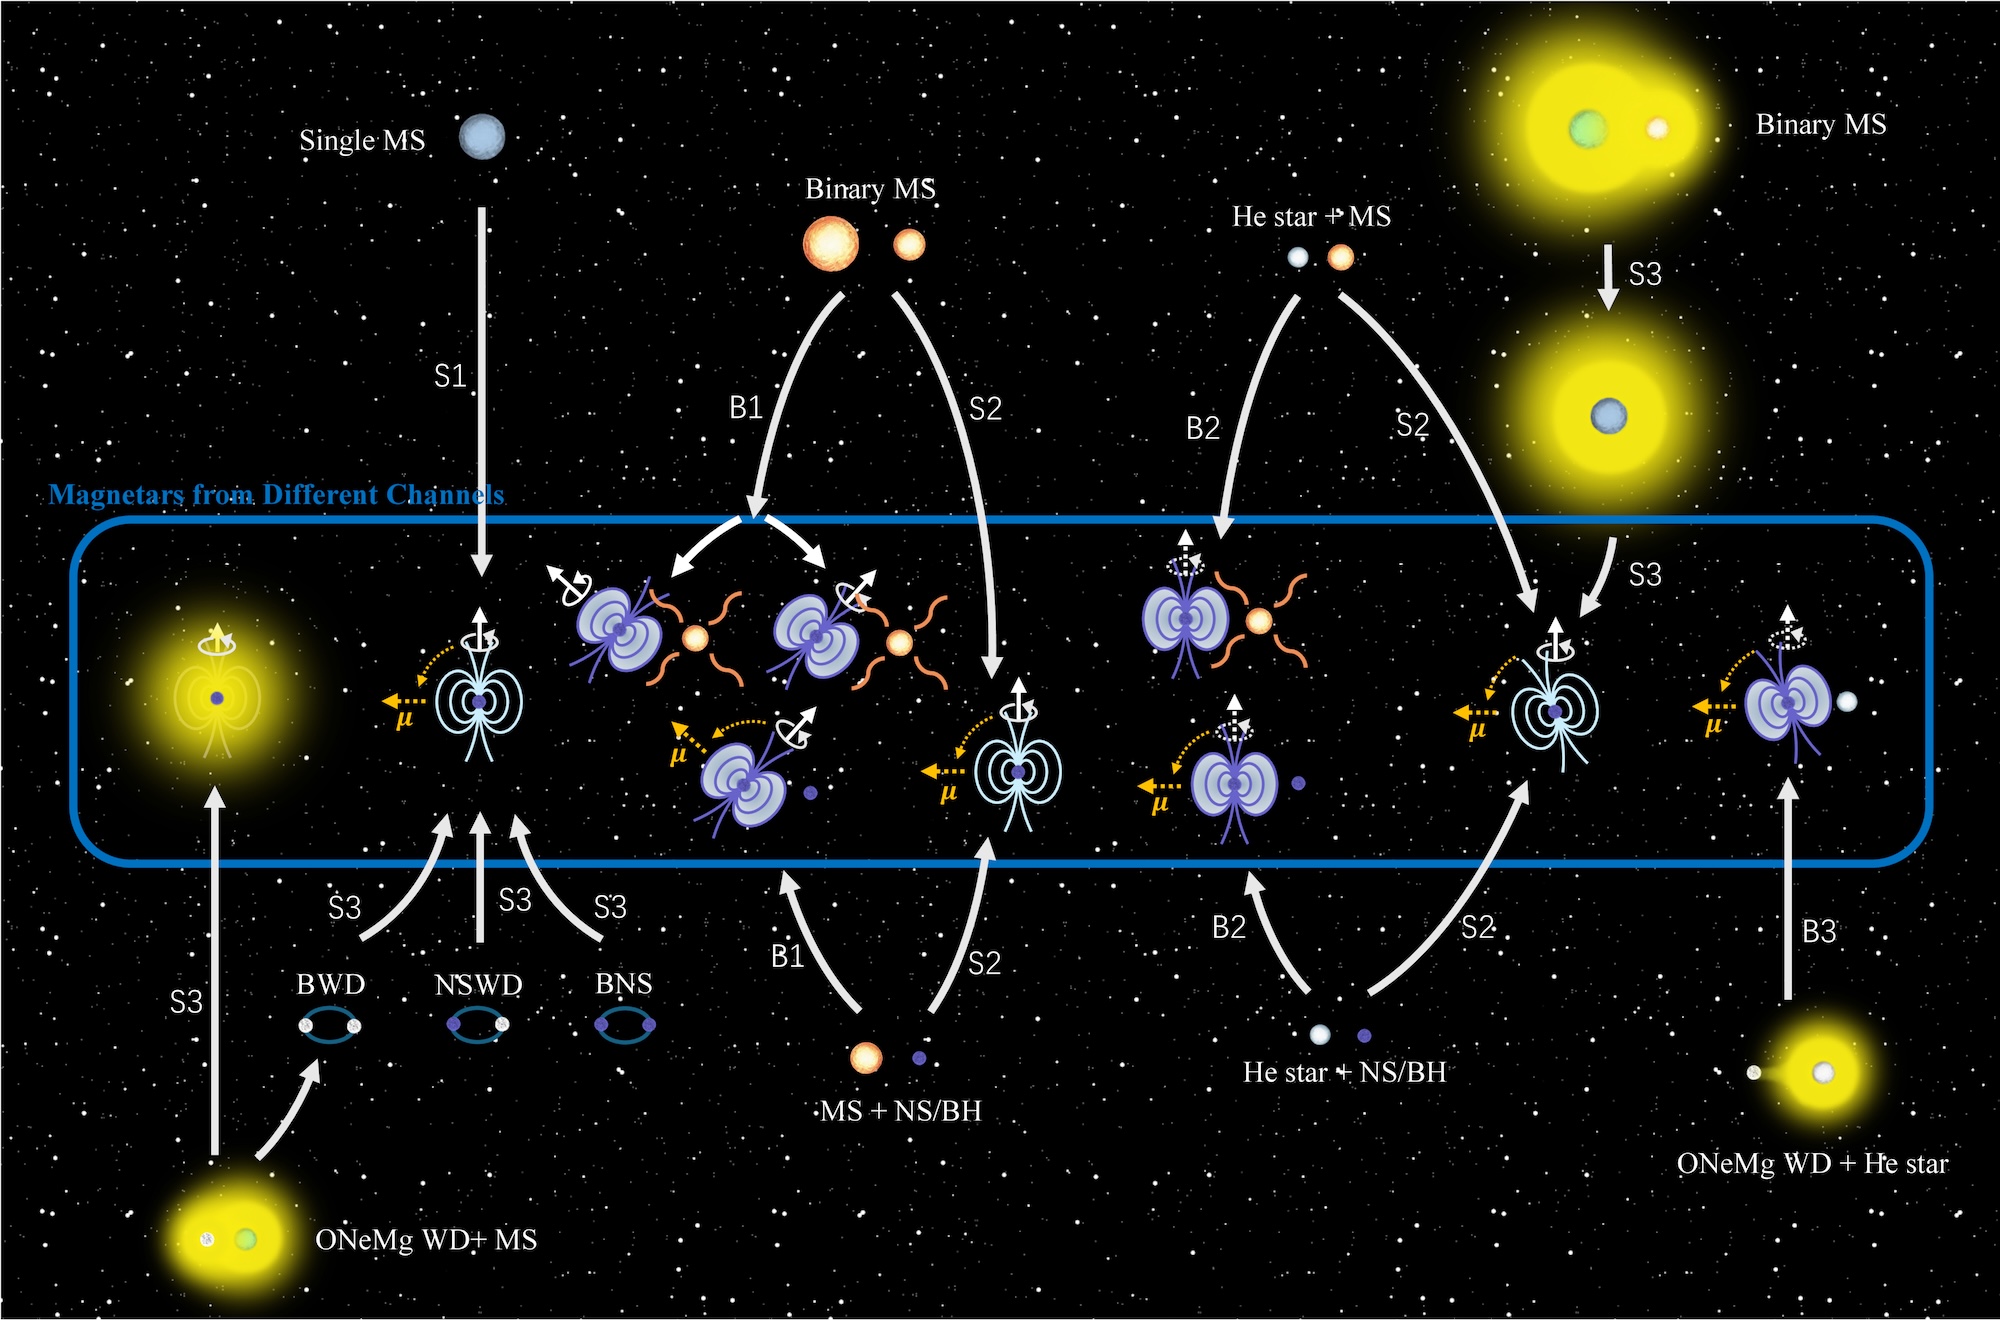
Magnetar formation pathways. The magnetic field lines of isolated magnetars have a black background, while the field lines of magnetars in binary systems have a white background. Click to enlarge. [Zhang & Hu 2025]
The remaining few percent of magnetars reside in binary systems. These coupled-up magnetars largely have companions more than twice as massive as the Sun, though some are paired with helium stars or compact objects.
Multiple Possible Arrangements
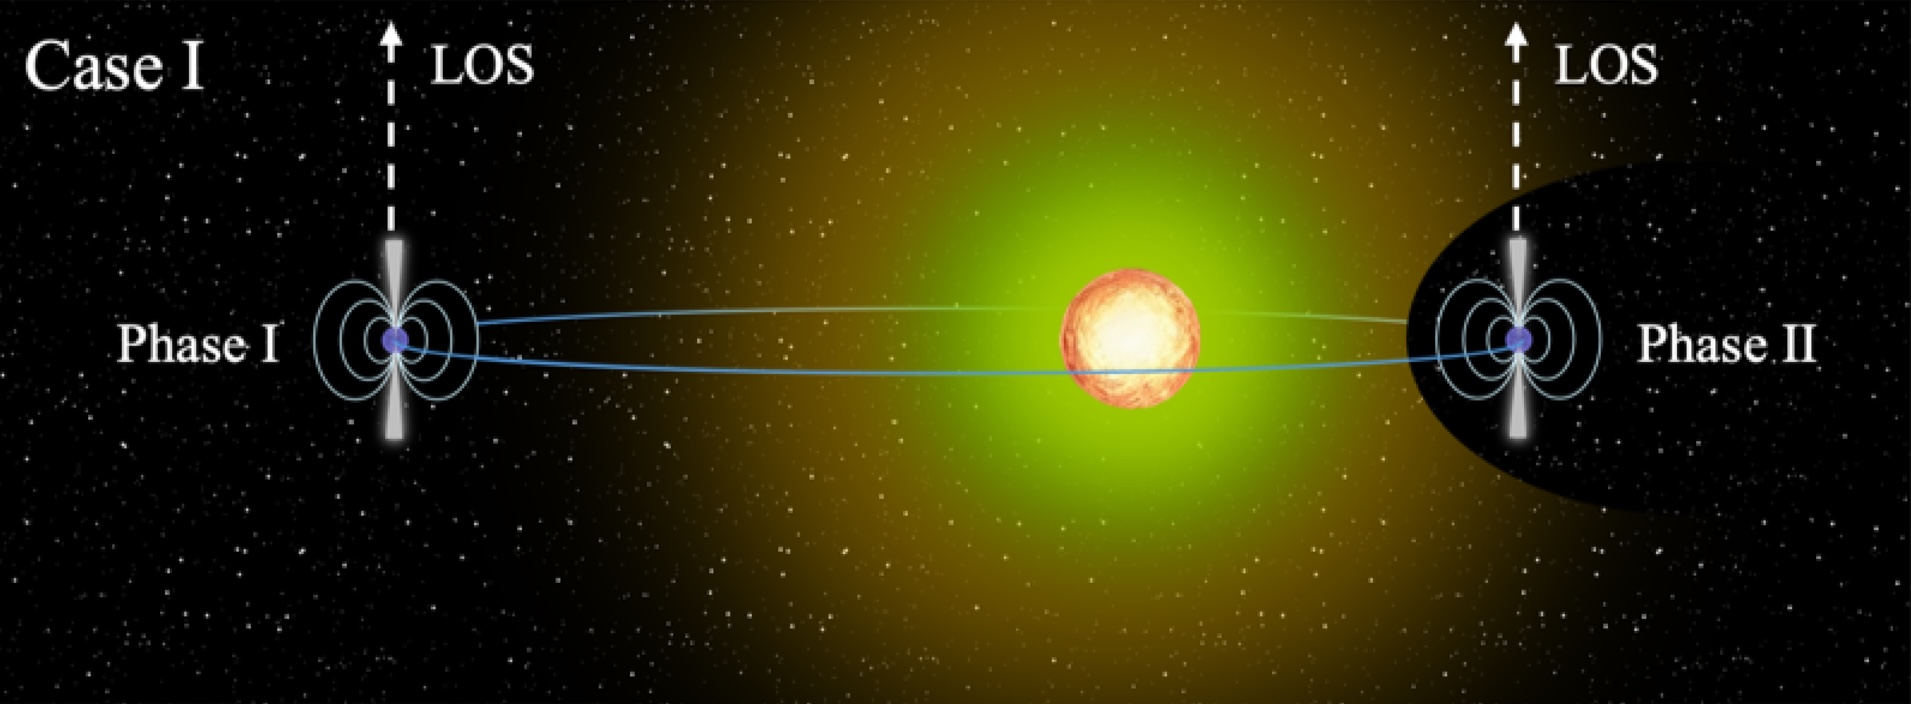
Illustration of a magnetar in a binary system with a star with a stellar wind. As the magnetar moves along its orbit, it encounters differing amounts of stellar wind. This affects the polarization angle of the bursts. Click to enlarge. [Adapted from Zhang & Hu 2025]
In this framework, actively repeating fast radio bursts arise from aligned magnetars in binary systems, while one-off or infrequently repeating bursts come from isolated magnetars or misaligned magnetars in binary systems. Isolated magnetars could also be responsible for some actively repeating bursts, though this ability is likely short lived.
Though this work demonstrates that magnetars could be the source of all fast radio bursts, it doesn’t rule out the possibility that fast radio bursts have diverse origins instead. Further work is needed to explore other pathways and make even more headway on the mystery of fast radio bursts.
Citation
“Magnetars in Binaries as the Engine of Actively Repeating Fast Radio Bursts,” Bing Zhang and Rui-Chong Hu 2025 ApJL 994 L20. doi:10.3847/2041-8213/ae1023
The post A Unified Explanation for Fast Radio Bursts appeared first on AAS Nova.
]]>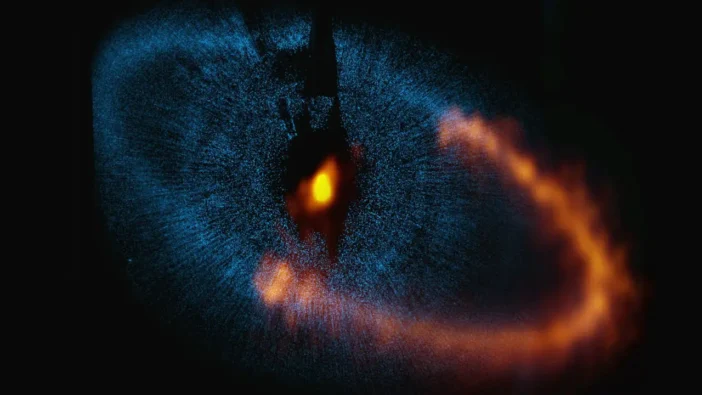
Astrobites reports on the Fomalhaut debris disk, which is well studied but may contain a hidden planet we haven’t seen yet.
The post Michelangelo in Space: A Planet Carving the Fomalhaut Debris Disk? appeared first on AAS Nova.
]]>Editor’s Note: Astrobites is a graduate-student-run organization that digests astrophysical literature for undergraduate students. As part of the partnership between the AAS and astrobites, we occasionally repost astrobites content here at AAS Nova. We hope you enjoy this post from astrobites; the original can be viewed at astrobites.org.
Title: ALMA Reveals an Eccentricity Gradient in the Fomalhaut Debris Disk
Authors: Joshua B. Lovell et al.
First Author’s Institution: Center for Astrophysics | Harvard & Smithsonian
Status: Published in ApJ
Step 1: Understanding How to Carve Your Debris Disk
Let’s start with our solar system: the Kuiper belt, a large ring of icy asteroids, is believed to have been sculpted into its current shape by Neptune. Neptune may have previously scattered objects in the Kuiper Belt through gravitational interactions, but some of them (like Pluto) remain in an orbital resonance with Neptune. In the same way that Neptune shapes the Kuiper Belt, today’s authors believe a planet could be shaping an exo-Kuiper Belt around the star Fomalhaut.
What on Neptune is an orbital resonance, though? A planet orbiting a star has an orbital period, and the gravitational forces between nearby (astronomically speaking) objects can push these objects into a state where their orbital periods are multiples of each other. For example, Pluto and Neptune have a 2:3 orbital resonance, meaning Pluto completes two orbits for every three that Neptune does. The same can happen for the asteroids and planetesimals in the Kuiper Belt, so the same should happen in other star systems!
Step 2: Make Your Observations
If we understand how debris disks carved by exoplanets look — and we think we do — then we should be able to infer the existence of exoplanets! Today’s authors have used observations from the Atacama Large Millimeter/submillimeter Array (ALMA) of the debris disk around Fomalhaut and made some very clever calculations. We’ve known about this disk for a while, which is why today’s authors have studied it with a new analysis technique they developed.
Planeteismals — basically big rocks from a few to hundreds of kilometers across — that orbit in this disk do so with a certain eccentricity, and typically things in the same orbit would have the same eccentricity. But today’s authors were clever — they checked if there was an eccentricity gradient, meaning the planetesimals’ eccentricities depend on their semi-major axis (i.e., the mean orbit radius); we would typically not expect any eccentricity gradient for bodies orbiting a star unperturbed. The authors discovered that the gradient for planetesimals around Fomalhaut is negative, which implies the presence of a planet when you look at the maths behind gravitational interactions between planets and planetesimals.
A negative eccentricity gradient means the planetesimals gather up at the point on the orbit farthest from the star (the apocenter), and since there are more planetesimals in that region, they appear brighter in the ALMA data (see Fig. 1 left); the ring also appears slightly wider. If the eccentricity gradient were positive, the same thing would happen at the point on the orbit closest to the star (the pericenter). The authors term this phenomenon the “eccentric velocity divergence.”
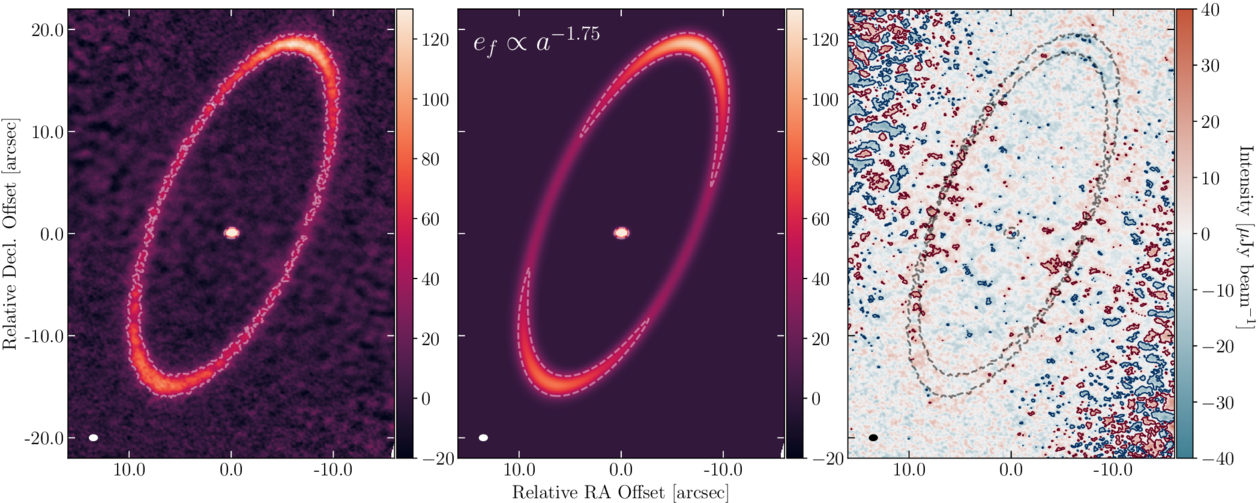
Figure 1: Left: The observed intensity of the Fomalhaut debris disk with ALMA. Middle: the authors’ model that fits the ALMA data the best. Right: The residual (data – model) between model and data. White means there is a close match to the data (which is better). [Lovell et al. 2025]
The authors tested other scenarios with different gradients and allowed for the planetesimals to oscillate their eccentricity around their orbit, but they didn’t find a better-fitting scenario.
Step 3: Find a Carving Planet
Okay, so those were the details. The authors investigated a few scenarios to see what could be causing the observed debris disk and its negative eccentricity gradient, as well as an intermediate ring sitting between the main disk and the star that recently was seen with JWST. The authors tested two scenarios: one where a planet sits between the rings and evacuates the nearby region, and another where a planet is interior to the inner ring and clears the gap through orbital resonances (kind of like Neptune!). An illustration can be seen in Figure 2.
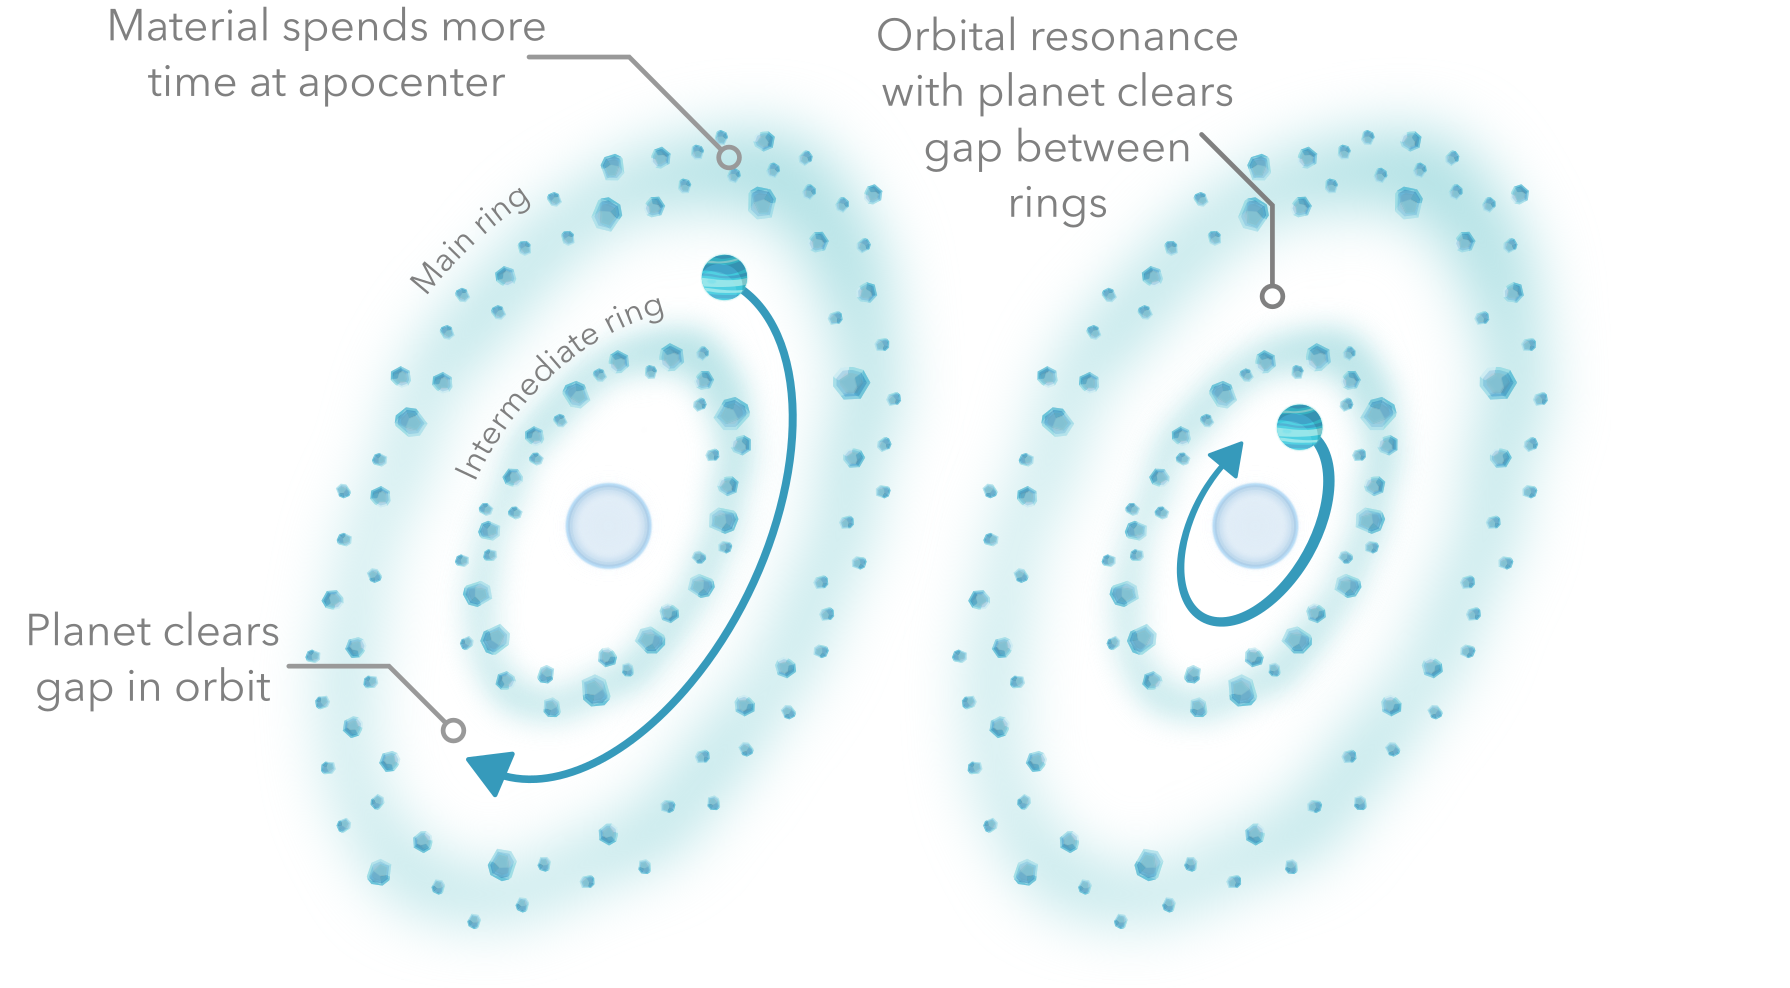
Figure 2: Illustration of possible planet-based scenarios that could create the observed debris disk around Fomalhaut. One features a planet between the observed debris disk rings, and another is where the planet is interior to both and carves the gap with orbital resonances. [J. Williams]
Finally, the authors stress, however, that it might not be a planet causing the observed structure — it could instead be the gravity of the planetesimals in the disk. Unfortunately, existing models are not equipped to explore this scenario, which is why the authors are planning to develop tools to investigate this next.
Original astrobite edited by Sandy Chiu.
About the author, Joe Williams:
I’m a third-year PhD student at the University of Exeter in the UK, and I study protoplanetary discs — mainly the tiny dust grains and their ices! In my spare time, I’m a climber, crocheter, and reader of sci-fi and fantasy books. My favourite sci-fi series is The Expanse!
The post Michelangelo in Space: A Planet Carving the Fomalhaut Debris Disk? appeared first on AAS Nova.
]]>
An ongoing survey aims to detect bursts of radio emission associated with flares and coronal mass ejections from young Sun-like stars.
The post Featured Image: Studying the Space Weather of Young Suns appeared first on AAS Nova.
]]>This image shows the Owens Valley Radio Observatory Long Wavelength Array (OVRO-LWA), a recently upgraded collection of 352 antennas spanning 2.4 kilometers east of the Sierra Nevada mountain range in California. A research team led by Ivey Davis (California Institute of Technology) recently outlined their survey that uses OVRO-LWA to study space weather on young Sun-like stars. The Study of Space Weather Around Young Suns (SWAYS) uses both OVRO-LWA and a 0.5-meter optical telescope to observe white-light stellar flares and any accompanying low-frequency radio emission from five stars with temperatures of 5000–6000K and ages of 100–800 million years. Though detections of stellar flares are common, the bursts of radio emission associated with flares and coronal mass ejections have yet to be identified conclusively on other stars. Previous studies have focused on M-dwarf stars, whose strong magnetic fields and plasma environments might limit the production of radio bursts, and have lacked the dedicated monitoring needed to detect transient bursts — problems that SWAYS has solved. To learn more about the instrumentation and design behind SWAYS, be sure to check out the research article linked below.
Citation
“A Dedicated System for Coordinated Radio and Optical Monitoring of the Space Weather of Young, Solar-Type Stars,” Ivey Davis et al 2025 ApJ 993 82. doi:10.3847/1538-4357/adfbe9
The post Featured Image: Studying the Space Weather of Young Suns appeared first on AAS Nova.
]]>
AT2024wpp is the most powerful fast blue optical transient spotted so far. What do extensive X-ray and radio observations tell us about this event?
The post Investigating the Most Luminous Known Fast Blue Optical Transient appeared first on AAS Nova.
]]>Fast blue optical transients are a rare class of emerging transients, the source of which is not yet known. A recent study of the most luminous known object in this class, AT2024wpp, reveals clues about their identity.
A New Class of Transients
In 2018, a network of robotic survey telescopes spotted a new transient source toward a galaxy 200 million light-years away. It was bright and getting brighter rapidly, rising in just a few days to become 10–100 times brighter than the brightest supernovae.
That transient, AT2018cow, was the first of now tens of known sources like it that are too blue, too rapidly evolving, and too luminous to be ordinary supernovae. Despite the growing number of luminous fast blue optical transients (FBOTs) discovered, exactly what causes them is still up for debate.
Brightest of the Bright
Enter AT2024wpp: the most luminous known fast blue optical transient to date. In about a month and a half, this record-breaking event radiated away more than 1044 Joules — which is roughly equivalent to the Sun’s radiative output over 8 billion years. Nayana A. J. (University of California, Berkeley) and collaborators carried out an extensive multi-wavelength observing campaign to track the behavior of AT2024wpp from 2 to 280 days after it was first discovered, making it only the second FBOT to undergo such detailed study. This research article describes the team’s findings at radio and X-ray wavelengths.
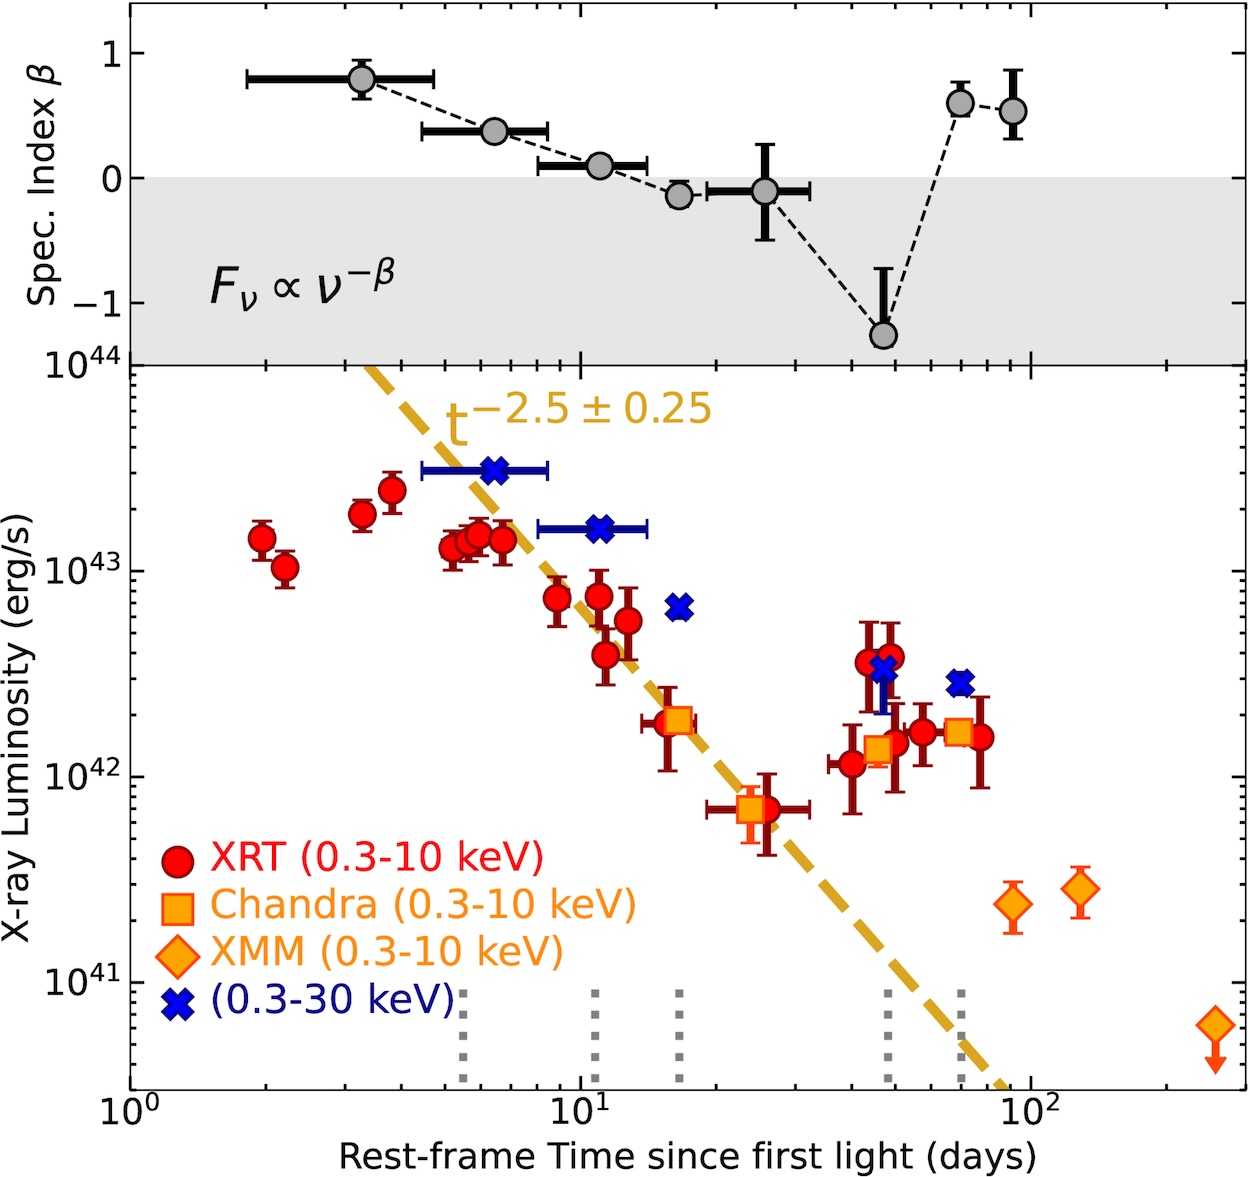
X-ray behavior of AT2024wpp. The top plot demonstrates the hardening of the spectral index (i.e., shifting toward higher energies) around the peak at 50 days. Click to enlarge. [Nayana A. J. et al. 2025]
These observations revealed that AT2024wpp’s X-ray emission remained bright and constant for 7 days before plummeting until day 30. The emission then rocketed up again, peaking at day 50, and shifted toward higher energies. Finally, things settled down to a lower brightness around day 75. In the radio, AT2024wpp’s behavior was complex, showing a never-before-seen meteoric rise at millimeter wavelengths around 17–32 days.
Comparison of the density of the material surrounding AT2024wpp (red stars) and other FBOTs. Click to enlarge. [Nayana A. J. et al. 2025]
Possible Scenarios
Based on these observations, the team favors a scenario involving a central compact object — a black hole or a neutron star — that is rapidly accreting matter from its surroundings. This accretion powers outflows that accelerate to more than 40% the speed of light and send a shock through dense material around the system. Notably, the team found that the density of the surrounding material is similar among FBOTs that have bright radio emission, including AT2024wpp. This suggests that similar processes are responsible for setting up these events.
The team pointed to two scenarios from the literature that are compatible with their data. In the first, a newborn neutron star or black hole collides with a stellar companion, ripping the star apart and accreting its remains. In the second, a Wolf–Rayet star (a massive star that has shed much of its atmosphere and is nearing its eventual end as a supernova) is tidally disrupted by a neutron star or a black hole. Though it’s not possible to narrow the possibilities further, the immense energies involved tilt things in favor of a black hole rather than a neutron star.
Though FBOTs remain mysterious, additional multi-wavelength studies like this one can help to illuminate their origins. And with the Ultraviolet Transient Astronomy Satellite (ULTRASAT) and UltraViolet EXplorer (UVEX) missions slated to launch within the next five years, we can expect many more FBOT discoveries in the near future.
Citation
“The Most Luminous Known Fast Blue Optical Transient AT 2024wpp: Unprecedented Evolution and Properties in the X-Rays and Radio,” Nayana A. J. et al 2025 ApJL 993 L6. doi:10.3847/2041-8213/ae0b4d
The post Investigating the Most Luminous Known Fast Blue Optical Transient appeared first on AAS Nova.
]]>
Researchers show how preferential accretion in a merging pair of supermassive black holes can explain the unexpectedly large amplitude of the gravitational wave background.
The post Boosting the Gravitational Wave Background appeared first on AAS Nova.
]]>The gravitational wave background — the constant, low-frequency hum of colliding supermassive black holes across the universe — seems to have a larger amplitude than expected. Can preferential accretion explain why?
Larger than Expected
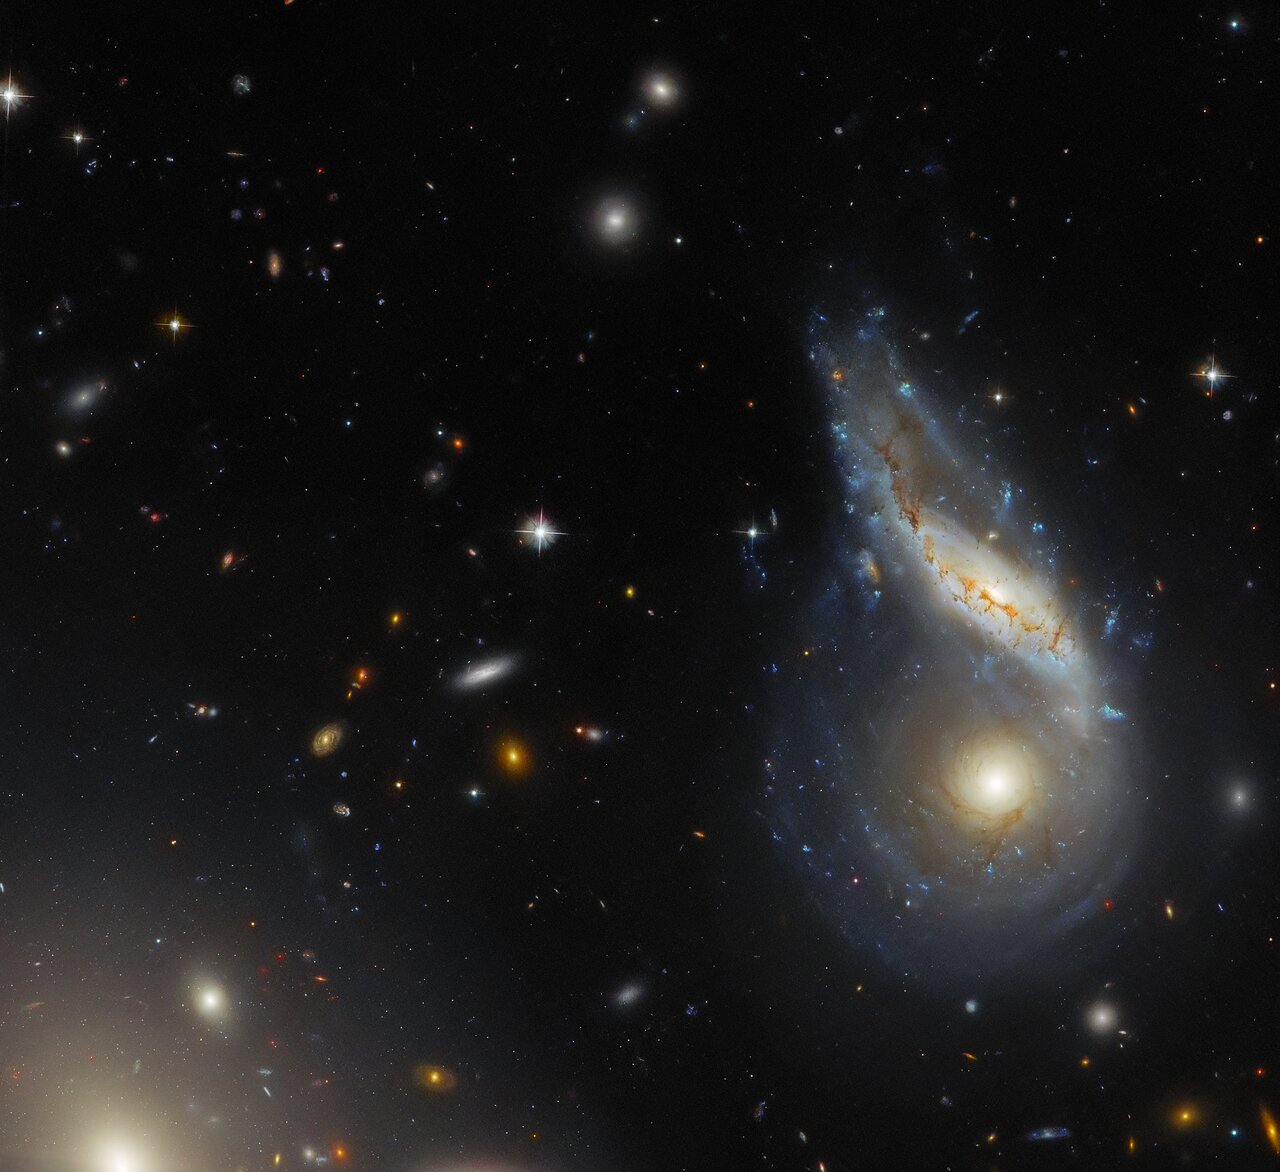
The peculiar galaxy Arp 122, shown here in a Hubble Space Telescope image, is in the process of merging. When two galaxies merge, the supermassive black holes at their centers eventually merge as well. [ESA/Hubble & NASA, J. Dalcanton, Dark Energy Survey/DOE/FNAL/DECam/CTIO/NOIRLab/NSF/AURA; Acknowledgement: L. Shatz; CC BY 4.0]
Though some researchers have invoked new physics to explain this discrepancy, all that may be required is an adjustment to our understanding of the supermassive black hole binary population in our universe. In a recent research article, Julia Comerford (University of Colorado Boulder) and Joseph Simon (University of Colorado Boulder; Oregon State University) tackled one of the underlying assumptions about the masses of merging supermassive black holes.
Preferential Accretion Pathway
When supermassive black holes merge, the strength of the gravitational wave signal depends on how similar the black holes were in mass; merging equal-mass black holes produce stronger signals than mismatched black holes do. What if, Comerford and Simon proposed, the masses of merging supermassive black holes scattered across the universe are more similar than previously thought?
The initial and final black hole mass ratio, q. The blue and orange lines show a 10% and 20% increase in the total mass of the binary, respectively. The dotted line divides major mergers (q ≥ 0.25) and minor mergers. [Comerford & Simon 2025]
What’s more, it appears that the smaller of the two black holes tends to pack on more mass, meaning that the masses of the black holes grow more similar as they wind toward a merger. (This somewhat counterintuitive result arises because the smaller of the two black holes encounters more gas as it spirals inward.)
Boosting the Signal
If accretion tends to even out the masses of the binary members, is the resulting increase in signal strength large enough to explain the observed amplitude of the gravitational wave background?
Probability distribution functions for the calculated gravitational wave background amplitude for different accretion conditions. The brown diamond shows the median amplitude from the NANOGrav data set. [Adapted from Comerford & Simon 2025]
The signal-boosting effect from preferential accretion may be especially important if the binary evolution timescale — the time it takes for black holes approaching a merger to reach a separation at which their gravitational waves become accessible to pulsar timing arrays — is longer than the estimated 1.8 billion years. At longer timescales, models without this accretion become entirely inconsistent with observations. Future research that examines the masses and accretion rates of supermassive black holes as they approach make their way toward a merger can provide further clues to the role of preferential accretion.
Citation
“Preferential Accretion onto the Secondary Black Hole Strengthens Gravitational-Wave Signals,” Julia M. Comerford and Joseph Simon 2025 ApJ 994 168. doi:10.3847/1538-4357/ae1133
The post Boosting the Gravitational Wave Background appeared first on AAS Nova.
]]>
Astrobites reports on simulations that explore whether a baby neutron star repeatedly diving into the envelope of its inflated companion star could be the cause of bumpy supernova light curves.
The post Bumpy Road Ahead: Can Binary Interactions Make Supernovae Periodically Brighter? appeared first on AAS Nova.
]]>Editor’s Note: Astrobites is a graduate-student-run organization that digests astrophysical literature for undergraduate students. As part of the partnership between the AAS and astrobites, we occasionally repost astrobites content here at AAS Nova. We hope you enjoy this post from astrobites; the original can be viewed at astrobites.org.
Title: Supernova-Induced Binary-Interaction-Powered Supernovae: A Model for SN2022jli
Authors: Ryosuke Hirai (平井遼介) et al.
First Author’s Institution: RIKEN Pioneering Research Institute, Monash University, OzGrav: The ARC Centre of Excellence for Gravitational Wave Discovery
Status: Published in ApJ
There are thousands of dying stars that go bang in the night. These explosions are known as supernovae, and they are classified primarily on what spectral lines they show in the days and weeks following their initial explosion. Most broadly, they are separated into Type I (spectra that show little or no evidence of hydrogen) and Type II (spectra that show hydrogen). The physics leading to each type of supernova is different, and astronomers use all of the information at their disposal to learn about these cosmic fireworks.
One of the most useful tools for monitoring and learning about a supernovae is its light curve — the plot of the explosion’s brightness over time. This light curve usually appears as a steep incline up to a peak in brightness several days after the initial detonation, and then a shallow decline in brightness over the following weeks. There are, however, a few examples of supernovae that break this mould.
Today’s article seeks to understand the curious case of supernova SN2022jli. Unlike the typical gradual fade in brightness, the light curve of this supernova shows a periodic bump of brightness every 12.5 days (see Figure 1). The proposed mechanisms to explain this include the blown-apart supernova material interacting with concentric and regularly spaced shells of circumstellar matter, or a binary companion that interacts with the supernova remnant each orbital period. The authors of today’s article investigate the latter scenario by running 3D hydrodynamical simulations of an interacting, post-supernova binary to try to recover SN2022jli’s periodic light curve and constrain the orbital characteristics of the system.
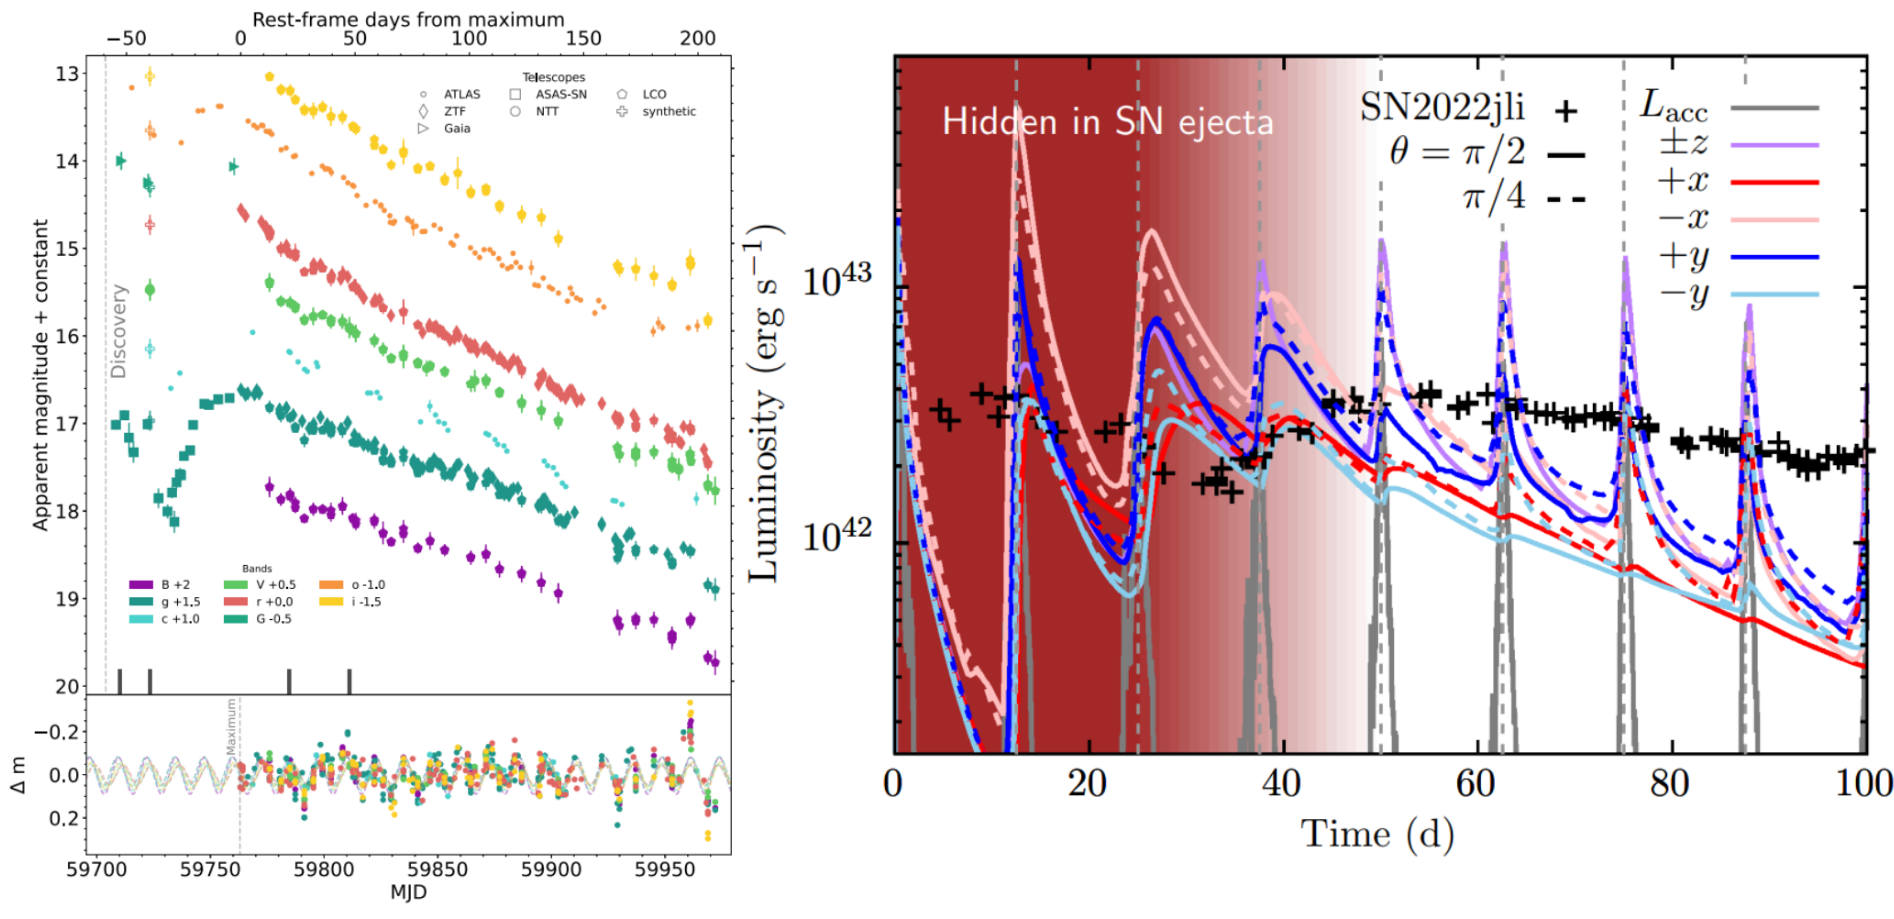
Figure 1: The light curve of SN2022jli shows periodic oscillations in the brightness, superimposed on top of the typical fading luminosity of a supernova. The left plot shows the light curve across various colours, and the associated bottom panel shows the oscillations with the typical fading supernova signal subtracted. The right plot shows the light curve of the authors’ proposed mechanism, where the different coloured lines are for different viewing angles on the system at the heart of the supernova. [Moore et al 2023 (left) and Hirai et al. 2025 (right)]
Why a neutron star? SN2022jli is a sub-class of Type I supernovae involving a “stripped” massive star which has lost its hydrogen — most likely through interactions with a close companion. These interactions typically circularise the pre-supernova orbit, and the subsequent explosion most commonly yields neutron stars. To explain the necessarily highly eccentric post-supernova orbit that may cause the periodic oscillation in SN2022jli, there was most likely a “natal kick” — a sudden and asymmetric burst during the supernova that rockets the neutron star in a random direction — which widened the orbit and de-circularised it, giving further evidence for a neutron star remnant.
Immediately following the supernova explosion, ejecta interacting with the main-sequence companion star would heat the star and cause it to swell up. This inflated companion then feeds matter to the orbiting dense neutron star, and the accretion is most intense when the stars are closest in their orbit (called the periastron). During accretion, however, mass is not perfectly absorbed onto the neutron star, and there is some feedback onto the surrounding gas due to the complex thermal and magnetic physics around the neutron star. In this study, the authors model cases where there is no feedback, feedback from thermal radiation due to accretion, or feedback from bipolar outflows via jets or disk winds. Snapshots from the simulation involving a 5-solar-mass companion on an orbit with eccentricity of 0.5 and bipolar feedback is shown in Figure 2.
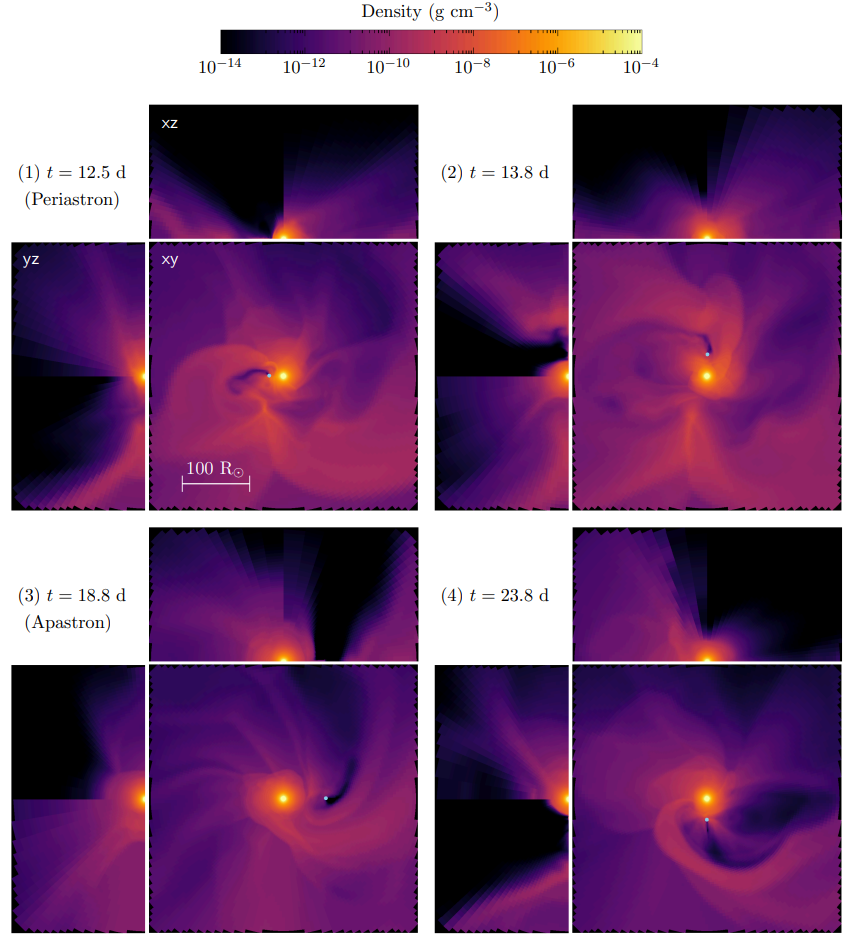
Figure 2: Several density snapshots of the 3D hydrodynamic simulations show how the neutron star (blue point) in the binary accretes and sculpts matter from the inflated main-sequence companion star (bright diffuse blob in the centre of each panel). The xy panels are a top-down look onto the orbital plane, while the xz and yz panels show a cross section through the plane. [Hirai et al. 2025]
SN2022jli is just one of an emerging class of oscillatory supernovae, with more and more being discovered with highly sensitive modern all-sky surveys. Today’s authors rigorously modelled one proposed scenario to explain this periodic oscillation in brightness and showed that it is viable. More modelling using this interacting-binary mechanism on other oscillating supernova light curves — those with longer periods and different supernova classifications — will show whether this explanation is ubiquitous, or if the population of dancing supernova light curves is due to some other process!
Original astrobite edited by Anavi Uppal.
About the author, Ryan White:
I am a masters student at Macquarie University in Australia, working mainly on binary/multiple systems with massive stars (Wolf–Rayets in particular!). Outside of study, I’m a novice film buff, baking sourdough all the time, probably drinking coffee, and trying to get more into reading and frisbee/squash. You can also find me procrastinating on Bluesky @astroryan.bsky.social.
The post Bumpy Road Ahead: Can Binary Interactions Make Supernovae Periodically Brighter? appeared first on AAS Nova.
]]>
Researchers have investigated how solar flares might signal that they're about to occur and whether they'll be accompanied by an explosion of plasma.
The post How Solar Flares Hint That They’re About to Happen appeared first on AAS Nova.
]]>Forecasting solar flares is one of the major challenges facing solar physicists today. New research finds that non-thermal emission can precede a solar flare by more than an hour, and this early emission may signal whether the flare will be accompanied by an explosion of plasma.
Flare Flavors
The Solar & Heliospheric Observatory (SOHO) took this coronagraphic image of a coronal mass ejection on 20 April 1998. [SOHO (ESA & NASA)]
Both solar flares and coronal mass ejections can disrupt everyday life on Earth, with flares knocking out radio communications and coronal mass ejections threatening spacecraft electronics and power grids. Given these real-life risks, as well as the potential for probing the physics behind the activity on the Sun and other stars, it’s critical to be able to identify signs of upcoming flares.
Looking at the Lead-Up
Luckily, there’s growing evidence that the Sun sends out subtle signals that a flare is soon to happen. One early sign of an impending flare is an increase in the non-thermal velocity of the plasma at the flare’s location. This phenomenon has been spotted in individual flares, but it hasn’t been studied and characterized for a large sample of flares — until now.
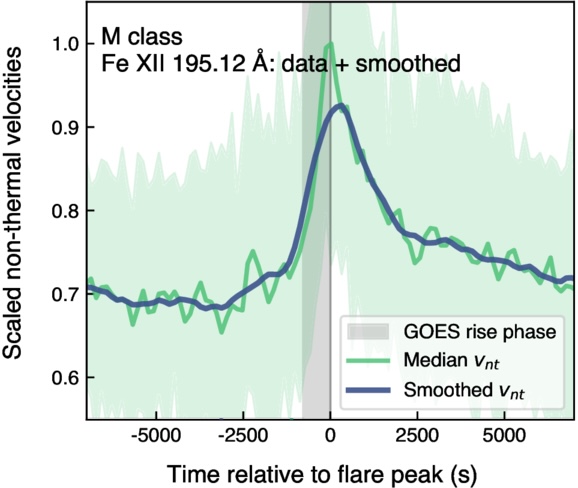
Demonstration of the increase in non-thermal velocity seen in an M-class flare compared to the onset and rise time of the soft X-ray flux (gray shaded area). [Adapted from To et al. 2025]
Of the flares in the sample, 83% were moderately powerful C-class flares, 18% were stronger M-class flares, and 1% were the most powerful X-class flares. To’s team identified a clear trend across all types of flares: the non-thermal velocity increases 4–25 minutes before the flare’s X-ray emission begins to rise, peaks when the X-ray emission peaks, and decays as the flare decays. The team found some evidence that for smaller flares, the velocity increase begins in spectral lines that trace cooler plasma before spreading to lines probing hotter plasma, but more work is needed to confirm this trend.
More Details
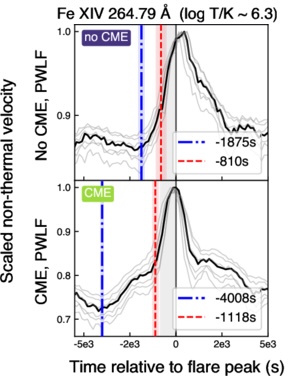
Examples of flares with and without coronal mass ejections. [Adapted from To et al. 2025]
These results suggest that changes in the non-thermal velocity of solar plasma can not only signal when and where a flare is likely to arise, but also whether the flare will be accompanied by a potentially destructive coronal mass ejection. Upcoming missions like the Multi-slit Solar Explorer and SOLAR-C will give an even better view of the early stages of solar flares, helping to illuminate the physics behind them and enhancing our ability to forecast them.
Citation
“Systematic Nonthermal Velocity Increase Preceding Soft X-Ray Flare Onset: A Large-Scale Hinode/EIS Study,” Andy S. H. To et al 2025 ApJ 993 102. doi:10.3847/1538-4357/ae07de
The post How Solar Flares Hint That They’re About to Happen appeared first on AAS Nova.
]]>
Astrobites reports on efforts to understand how the variability of certain variable stars changes over time.
The post The Times They Are A-Changin’: Searching for Shifts in Variable Star Light Curves appeared first on AAS Nova.
]]>Editor’s Note: Astrobites is a graduate-student-run organization that digests astrophysical literature for undergraduate students. As part of the partnership between the AAS and astrobites, we occasionally repost astrobites content here at AAS Nova. We hope you enjoy this post from astrobites; the original can be viewed at astrobites.org.
Title: Search for the Blazhko Effect in Field RR Lyrae Stars Using LINEAR and ZTF Light Curves
Authors: Ema Donev and Željko Ivezić
First Author’s Institution: XV. Gymnasium (MIOC)
Status: Published in AJ
RR Lyrae stars are a class of pulsating variable stars — similar to better-known Cepheid variables — that sit on the horizontal branch of the Hertzsprung–Russell diagram. Because of the regularity with which they pulsate, these stars are useful for a number of scientific applications, including standard-candle distancing (helping astronomers set the scale of distances in the universe) and as probes of very old star formation in nearby populations (because most RR Lyrae stars are at least 10 billion years old).
Today’s article studies the Blazhko effect in RR Lyrae stars. Simply put, the Blazhko effect is a long-term change of the duration (period) or strength (amplitude) of pulsation in some RR Lyrae variables. Fig. 1 shows an example from today’s article. While this effect was first observed as early as 1907, the physical mechanism for Blazhko modulation is still formally unknown, as is the percentage of RR Lyrae stars that exhibit it. Broadly speaking, there are three explanations for this effect: 1) nonlinear resonance between a star’s primary pulsation mode and some higher-level pulsation, 2) magnetic influence, or 3) cycles in the convection activity.
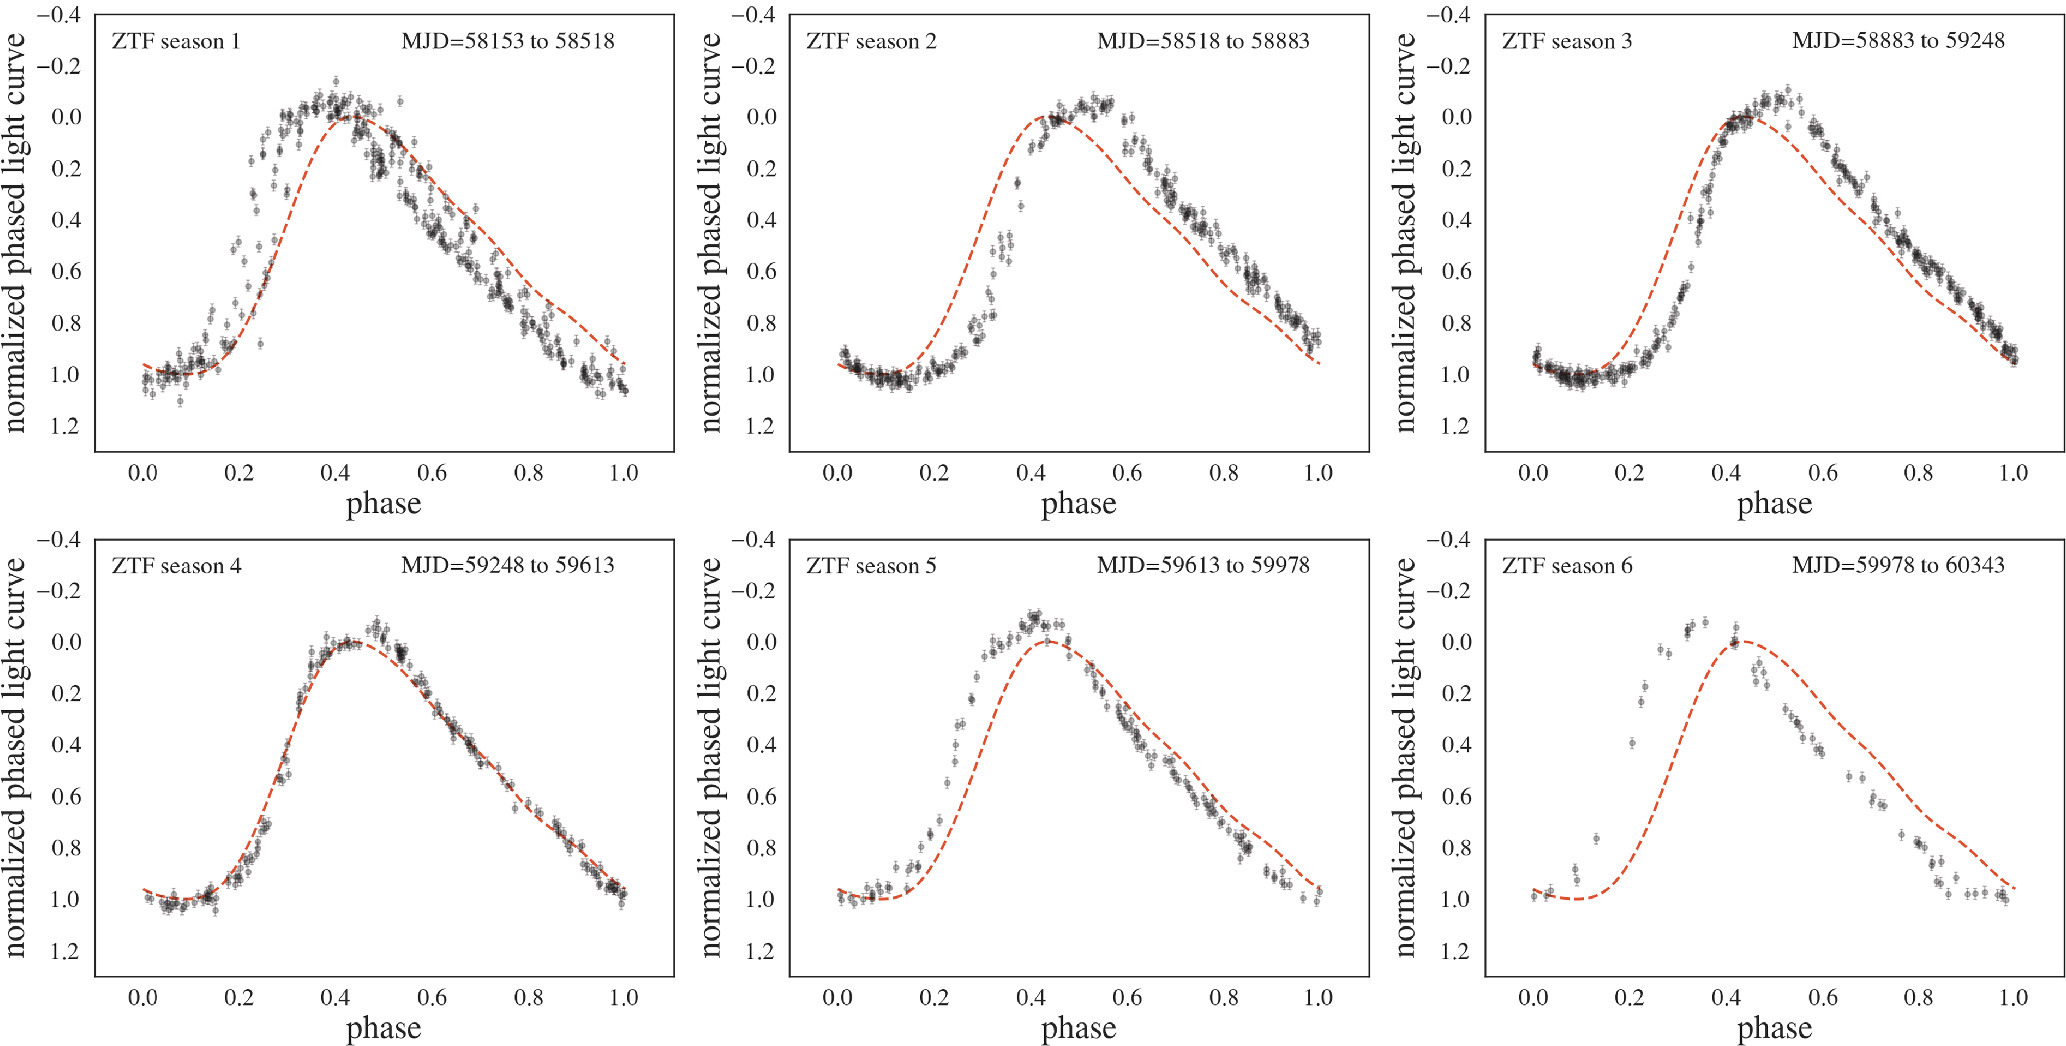
Figure 1: An example of the Blazhko effect. Each panel shows data from ZTF for the same source for different seasons (at different times). The best-fit pulsation model for the total data set is shown in red. Over time, the actual pulsation of the source (black data) varies significantly from the average best fit due to Blazhko modulation. [Adapted from Donev and Ivezić 2025]
From this initial set of RR Lyrae stars, today’s article identifies 531 potential Blazhko star candidates that are moved on to a visual inspection step. In order to identify the candidates for visual inspection, the authors establish two pre-selection methods based on the direct light curve and periodogram for each source:
- Light curve selection works by algorithmically assigning a score to each source, with higher scores indicating a greater expectation that the source is a Blazhko RR Lyrae star. The scores are associated with best-fit pulsation models. One way a given source could earn points was by having a very high reduced χ2 statistic in one or both data sets. Blazhko modulation changes the characteristics of the pulsations over time, meaning the best-fit model will be a poor fit to many of the pulsations within one or both data sets. Generally, poorer fits mean higher reduced χ2 values. In addition, candidates could earn points by having a moderately high reduced χ2 statistic in one or both data sets, as well as a significant change in pulsation characteristics of the best fit model from one data set to the next. Such a change between data sets is an indication of long-term Blazhko modulation. From this 479 of the 531 candidates are identified.
- Periodogram selection works by looking for interactions between the primary pulsation and Blazhko frequencies. First, the authors create a periodogram for the time-series data. In short, a periodogram plots a number of possible frequencies (or periods) of variability in the data versus the “power” associated with that frequency (or period), where higher power means the data vary more strongly at that frequency. When periodic data have only one associated frequency, the periodogram will show a single peak with high power. In the case where there are two effects of variation (in this case, the pulsation of the star and the Blazhko modulation) with disparate frequencies, a single, large peak will occur at the average frequency, with a smaller peak appearing to either side. Fig. 2 shows an example using simulated data. By identifying the location and strength of these side peaks, the authors are able to identify a handful of additional Blazhko sources (29), as well as estimate the frequencies of Blazhko modulation.
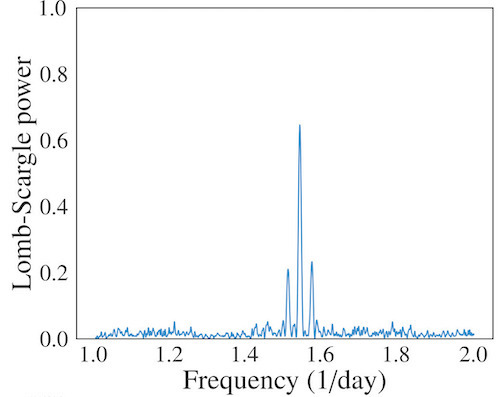
Figure 2: A simulated Lomb–Scargle periodogram made using the sum of two sine functions with similar, but different, frequencies. Note the primary peak at the frequencies’ mean, and the smaller side peaks indicating the difference. [Adapted from Donev and Ivezić 2025]
Original astrobite edited by Kylee Carden.
About the author, Catherine Slaughter:
Catherine is a PhD candidate in astrophysics at the University of Minnesota. Her research primarily deals with stellar population astrophysics in local dwarf galaxies, with particular focus on the intersection between computational and observational research methods. Prior to moving to Minnesota, she completed her BA in Physics and Astronomy, and MSc in Astronomy Research at Leiden University.
The post The Times They Are A-Changin’: Searching for Shifts in Variable Star Light Curves appeared first on AAS Nova.
]]>
What can ultraviolet observations from Hubble tell us about the identity of Betelgeuse's likely companion star?
The post Hubble on the Hunt: A Spectroscopic Search for Betelbuddy appeared first on AAS Nova.
]]>Multiple research teams have turned to the famous red supergiant Betelgeuse in search of a possible companion star hiding in its glare. A carefully designed spectroscopic search has placed new constraints on the identity of Betelgeuse’s stellar buddy.
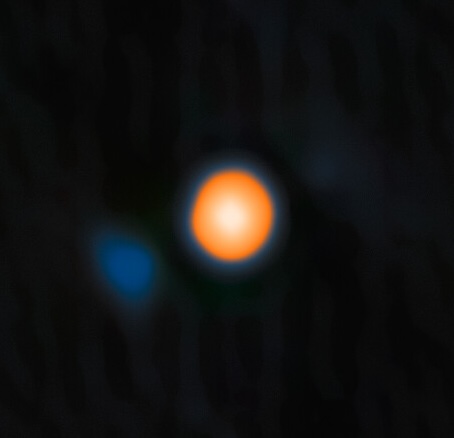
An image of Betelgeuse and its probable companion star from the ‘Alopeke instrument on the Gemini North telescope. [International Gemini Observatory/NOIRLab/NSF/AURA; Image Processing: M. Zamani (NSF NOIRLab); CC BY 4.0]
Betelgeuse and Its Buddy
Betelgeuse, a nearby red supergiant, is a variable star with a 400-day primary pulsation period and a 2,100-day secondary variation period. Recent studies have speculated that this secondary period is due to the presence of an 0.5–2.0-solar-mass companion star (often nicknamed “Betelbuddy”), and researchers using a speckle imaging technique likely spotted this companion earlier this year.
As is often the case when there’s an intriguing astronomical possibility, multiple research teams have sought out Betelgeuse’s purported stellar companion in different ways. One avenue recently described in a published paper was spectroscopic, searching for signs of ultraviolet emission lines from a growing young star.
Spectroscopic Search
In just 10 million years, Betelgeuse has sped through its main-sequence lifetime and taken on a new starring role as a red supergiant. In contrast, a 0.5–2.0-solar-mass companion star would not have even reached the main sequence in the same span of time. How is it possible to spot a tiny young stellar object next to a much brighter supergiant?
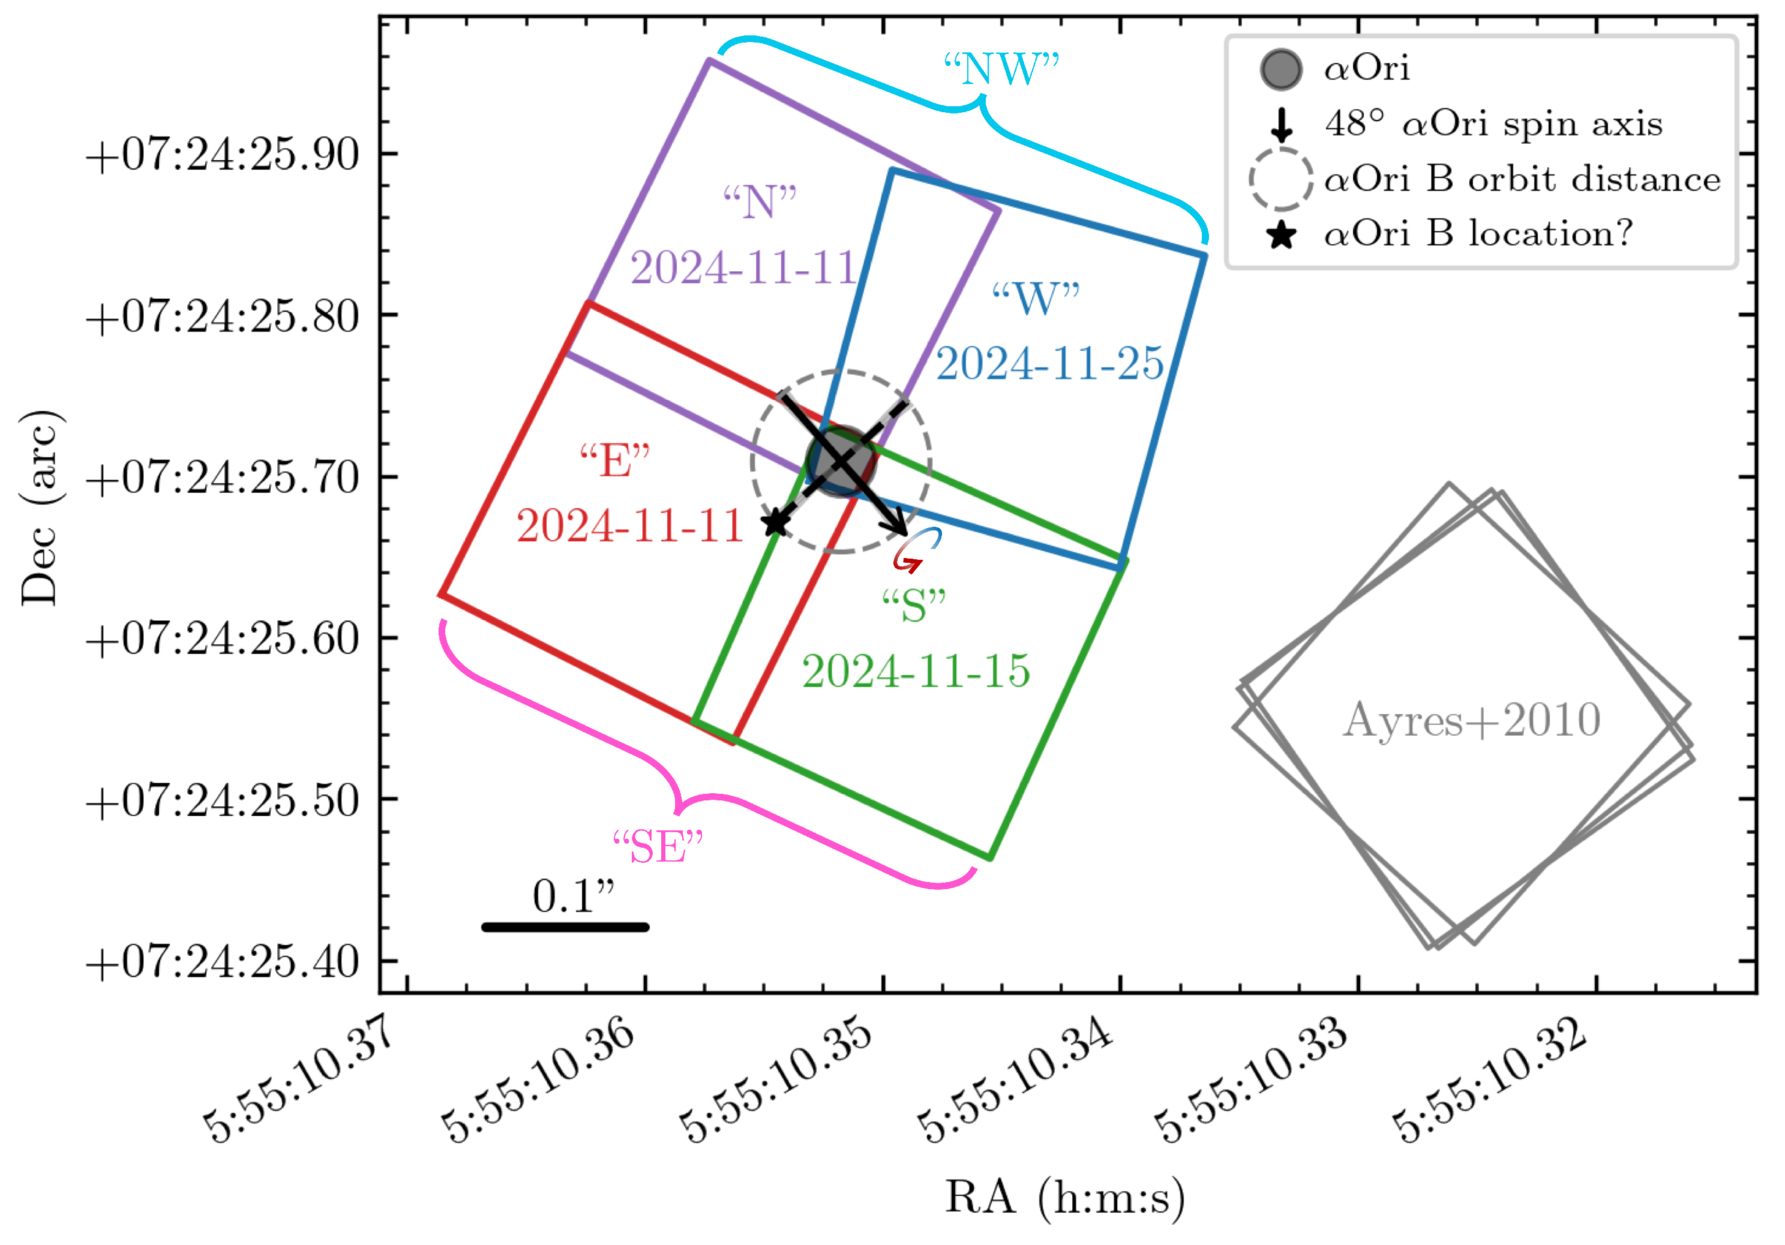
Hubble observing pattern, showing how the quadrants are arrayed around Betelgeuse. Click to enlarge. [Goldberg et al. 2025]
The search is on: Goldberg and collaborators observed Betelgeuse with the Hubble Space Telescope in November 2024, timed to when the companion star’s emission lines would be shifted relative to Betelgeuse. The observations split Betelgeuse’s disk into quadrants, only one or two of which should contain the companion, helping the team tease out the signal from the smaller star, if present. Ultimately, though, no statistically significant signals were found.
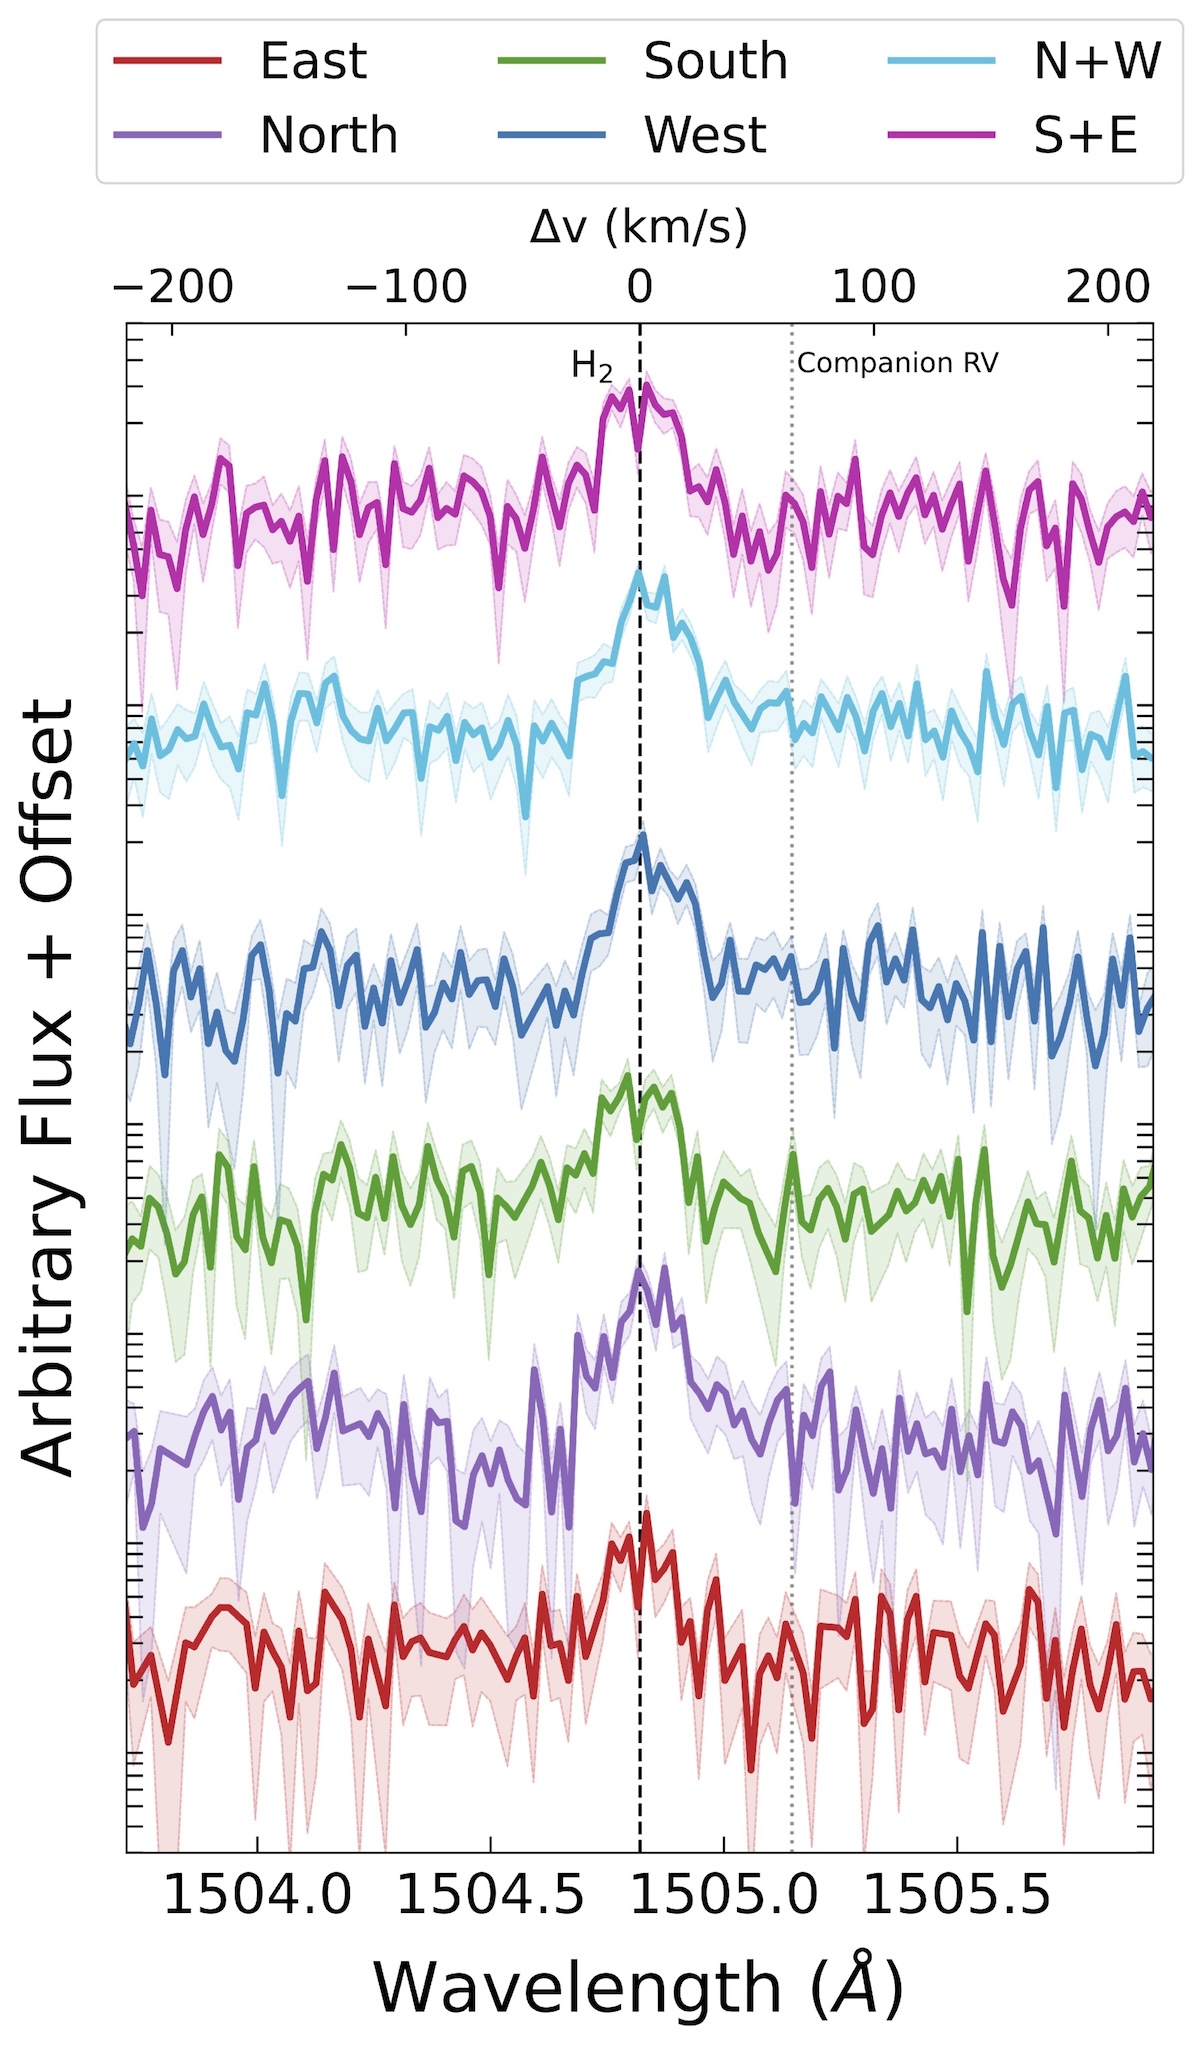
Emission around Betelgeuse’s 1504.82 Angstrom H2 line from each of the four observed quadrants as well as combinations of two quadrants. No significant signals were detected at the expected radial velocity of the companion star. [Goldberg et al. 2025]
When Finding Nothing Tells You Something
A lack of a significant detection doesn’t mean that the companion isn’t there, but it does place constraints on its identity. The data confidently rule out a companion star twice as massive as the Sun, marginally permit a star in the 1.1–1.5-solar-mass range, and favor a star lower than 1.1 solar masses.
Researchers assigned a likely mass of about 1.5 solar masses to the probable companion star imaged earlier this year. Though this is at the limit of what’s permitted by the ultraviolet observations, Goldberg and coauthors note that the companion star’s ultraviolet output could be suppressed due to tidal coupling with Betelgeuse or other processes. If the star’s ultraviolet emission is lower than expected, a 1.5-solar-mass companion remains consistent with Hubble’s non-detection of the star.
This is a fantastic example of how multiple lines of inquiry can converge on similar solutions. With the companion star expected to swing around to a favorable observing position again in 2027, this is certainly not the last chapter in the tale of Betelgeuse and Betelbuddy.
Citation
“Betelgeuse, Betelgeuse, Betelgeuse, Betel-buddy? Constraints on the Dynamical Companion to α Orionis from HST,” Jared A. Goldberg et al 2025 ApJ 994 101. doi:10.3847/1538-4357/ae0c0c
The post Hubble on the Hunt: A Spectroscopic Search for Betelbuddy appeared first on AAS Nova.
]]>
JWST discovered a distant galaxy with too much nitrogen, which has led to evidence of the universe's first stars.
The post Too Much Nitrogen Pops Open the Search for the Universe’s First Stars appeared first on AAS Nova.
]]>Astronomers have long sought evidence of the universe’s first generation of stars, and as more distant galaxies come into view, it seems these stars may finally be within reach.
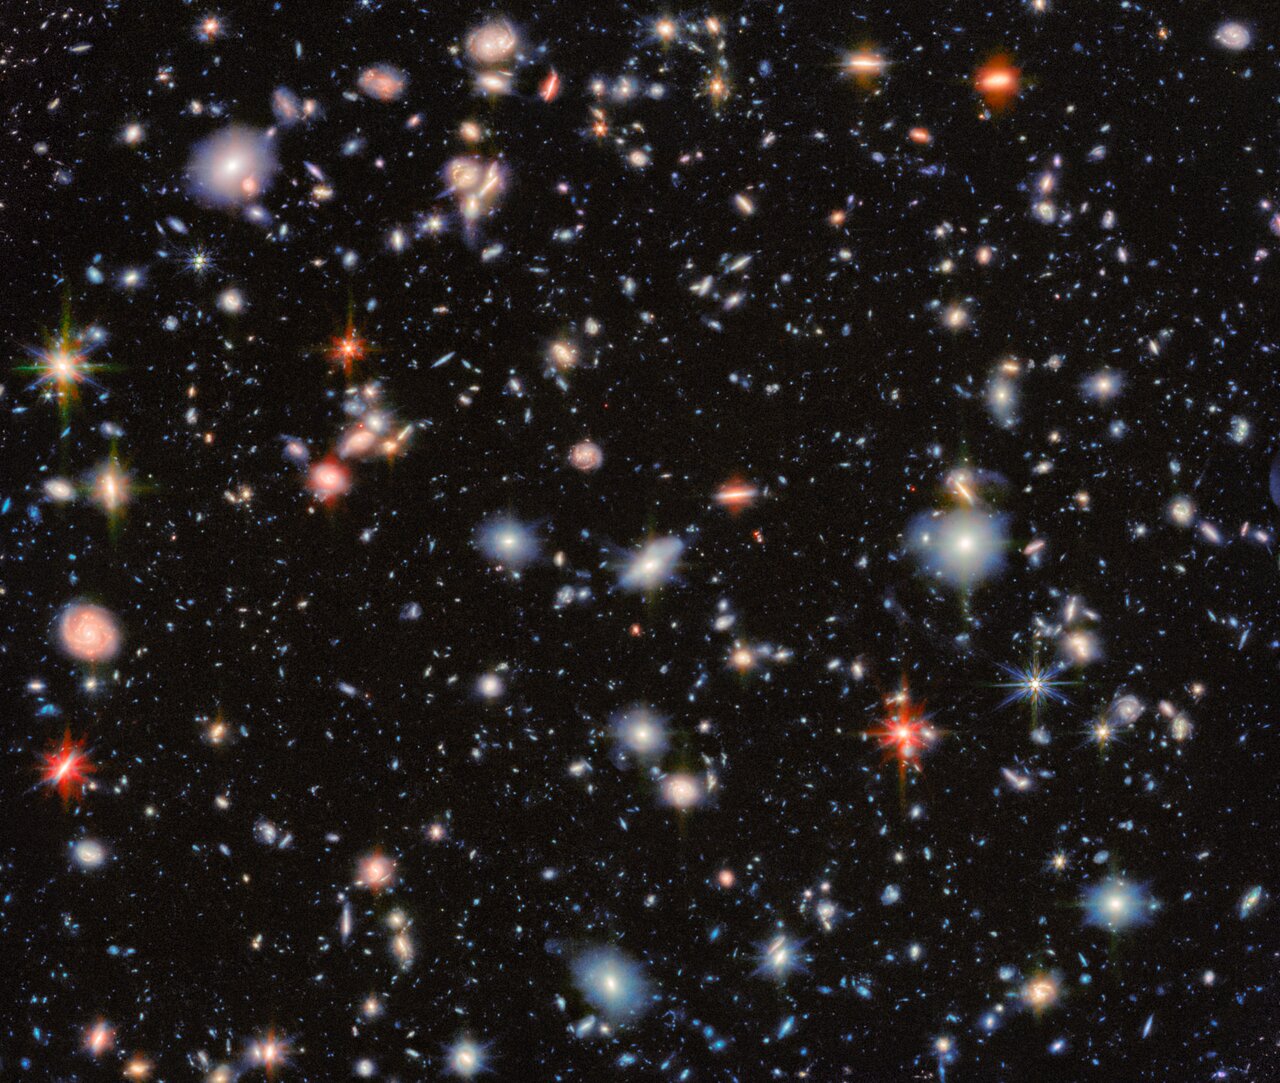
JWST spies thousands of distant galaxies in the classic Hubble Deep Field — many galaxies being uncovered for the first time with the space telescope’s powerful instruments. [ESA/Webb, NASA & CSA, G. Östlin, P. G. Perez-Gonzalez, J. Melinder, the JADES Collaboration, the MIDIS collaboration, M. Zamani (ESA/Webb); CC BY 4.0]
Excess Metals Popping Up
Since its 2021 launch, JWST has given astronomers eyes to peer into the distant past, discovering many galaxies whose light reveals the universe’s early stages of star and galaxy formation. Within the population of newly discovered galaxies are a few with bizarre chemical properties that, upon first pass, seem to be too enriched to exist so early in the universe. These hard-to-reconcile abundances may be a sign of the universe’s first stars.
Known as Population III (Pop III) stars, the first stars in the universe were born out of giant clouds of pristine gas (hydrogen, helium, and a little lithium) and were able to form at masses hundreds to thousands of times the mass of our Sun. Though they burned bright, they did not burn for very long, ending their lives in violent supernovae and chucking their newly enriched guts back into their surroundings. While these stars are long dead, the chemical imprints they left on their host galaxies can persist — and understanding how Pop III stars create and distribute metals could clue us in to the odd chemical signatures recently found with JWST.
Too Much Nitrogen in GS 3073
Researchers have identified a few galaxies exhibiting high nitrogen-to-oxygen (N/O) ratios that cannot be explained by stars similar to those in the universe today. A couple of these galaxies could be explained through multiple stellar populations, rapidly rotating stars, massive explosions, or the early stages of globular cluster formation. However, GS 3073, a galaxy with a redshift of z = 5.55 (about one billion years after the Big Bang), has an N/O excess so high that is has, so far, defied explanation.
Aiming to make sense of this bizarre phenomenon, Devesh Nandal (University of Virginia; Center for Astrophysics | Harvard & Smithsonian) and collaborators used stellar evolution models to see if Pop III stars could be the culprit. Modeling stars with masses 1,000–10,000 times the mass of our Sun, the authors traced the elemental yields of these supermassive stars as they go through the various stages of nuclear burning. The analysis takes into account mixing within the stars, mass loss throughout their lifetimes, and how the eventual supernova ejecta mixes within the interstellar medium.
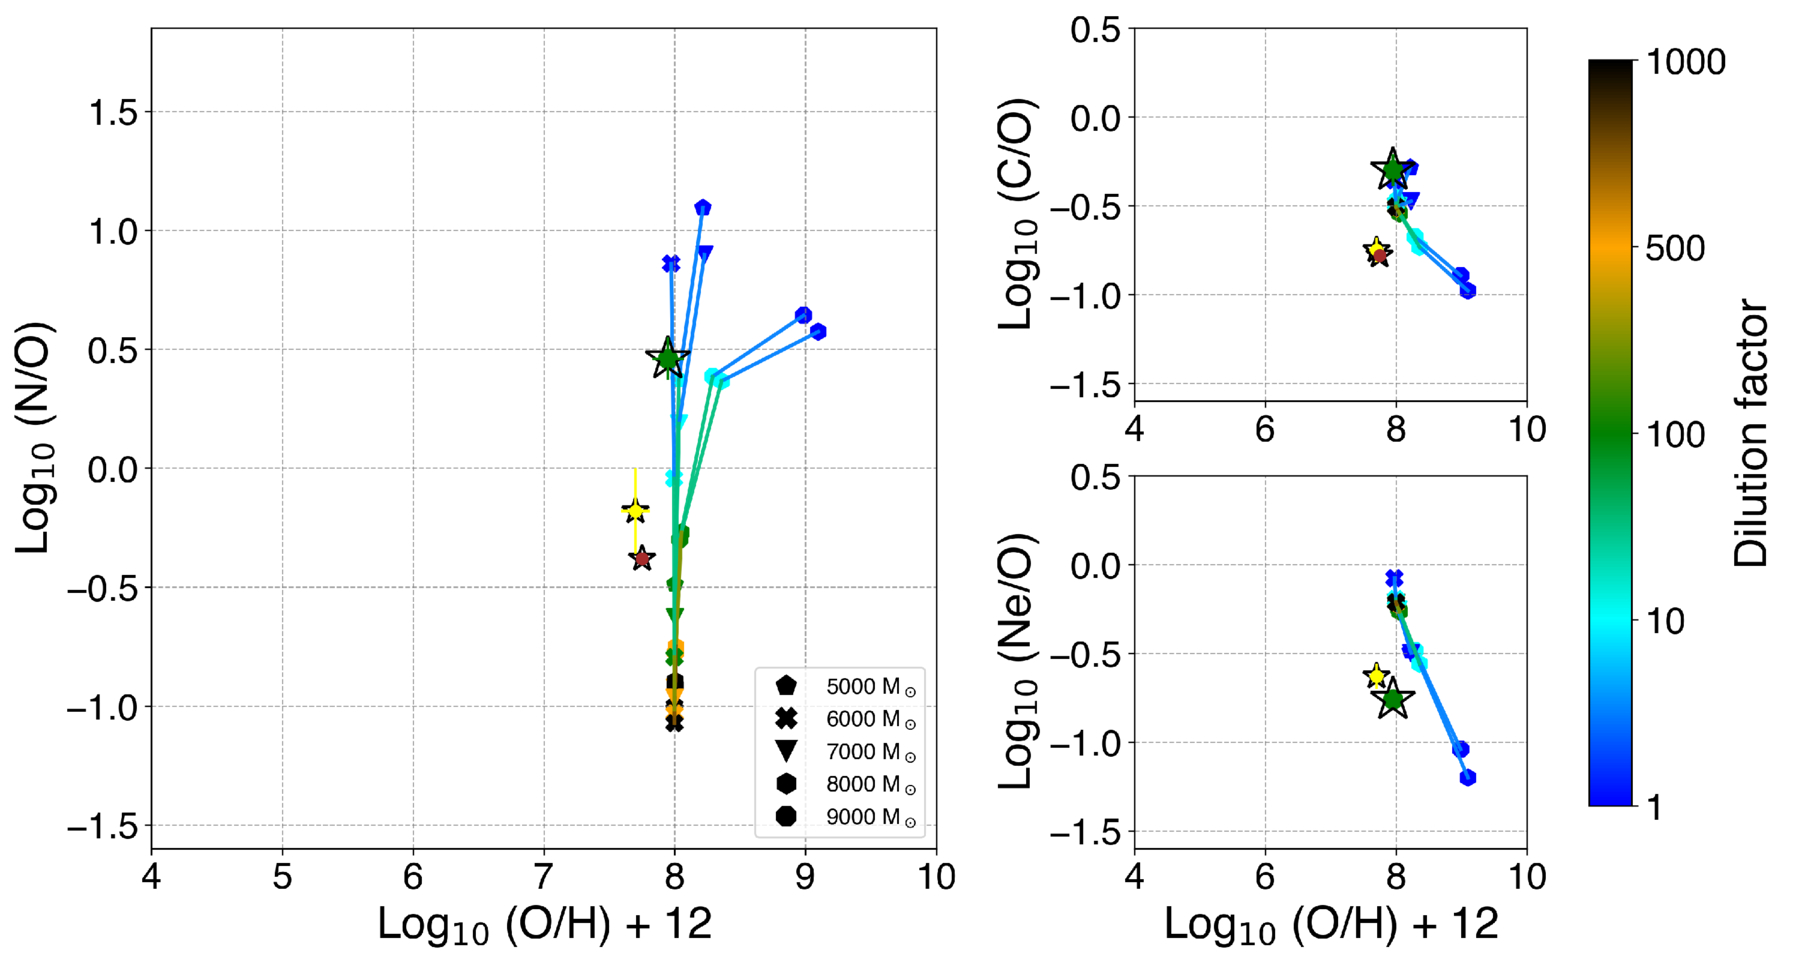
N/O, C/O, and Ne/O abundance ratios of five modeled supermassive Pop III stars taking into account the contribution from other stars in the galaxy and the Pop III star losing 10% of its mass over its lifetime. The green star indicates the observed ratios of GS 3073. Click to enlarge. [Nandal et al 2025]
Finally Evidence of Pop III Stars?
This study of GS 3073 is the first of its kind to confirm the chemical imprints of Pop III stars on their host galaxy at this redshift. The unique nitrogen abundance can only be produced through the evolutionary phases of Pop III stars that burn quickly enough to produce and release an excess amount of nitrogen while other elements stay consistent. From their modeling, the authors suggest that galaxies with even higher nitrogen excess could exist, and further observations with JWST may just find them.
The search for Pop III stars is booming — another recent study (Visbal et al 2025) examines the galaxy LAP1-B. While GS 3073 shows evidence of Pop III stars through chemical abundances, the study of LAP1-B finds that the galaxy matches theoretical predictions for the formation environments and mass distributions of Pop III stars. Both of these recent research works are laying the groundwork for the wealth of discovery possible with JWST, and the universe’s first stars are no longer out of reach.
Citation
“1000–10,000 M⊙ Primordial Stars Created the Nitrogen Excess in GS 3073 at z = 5.55,” Devesh Nandal et al 2025 ApJL 994 L11. doi:10.3847/2041-8213/ae1a63
The post Too Much Nitrogen Pops Open the Search for the Universe’s First Stars appeared first on AAS Nova.
]]>
New research suggests that triplet stars might be able to evolve into every observable type of stellar-mass black hole system.
The post Black Holes with a Shared Background appeared first on AAS Nova.
]]>What if there was one process capable of creating every type of detectable stellar-mass black hole system? Recent research suggests there might be, and that it involves a triple-star system.
Three Separate Contexts
Stellar-mass black holes, or black holes that are at most a few hundred times the mass of the Sun, pop up in a number of different environments in the Milky Way. Astronomers have known since the 1960s that these black holes are the engines behind accreting low-mass X-ray binaries; more recently, researchers at gravitational wave observatories such as LIGO have found pairs of black holes orbiting each other just prior to merging; and, in just the past few years, scientists using the Gaia spacecraft have found black holes on wide, prowling orbits around still-burning stars.
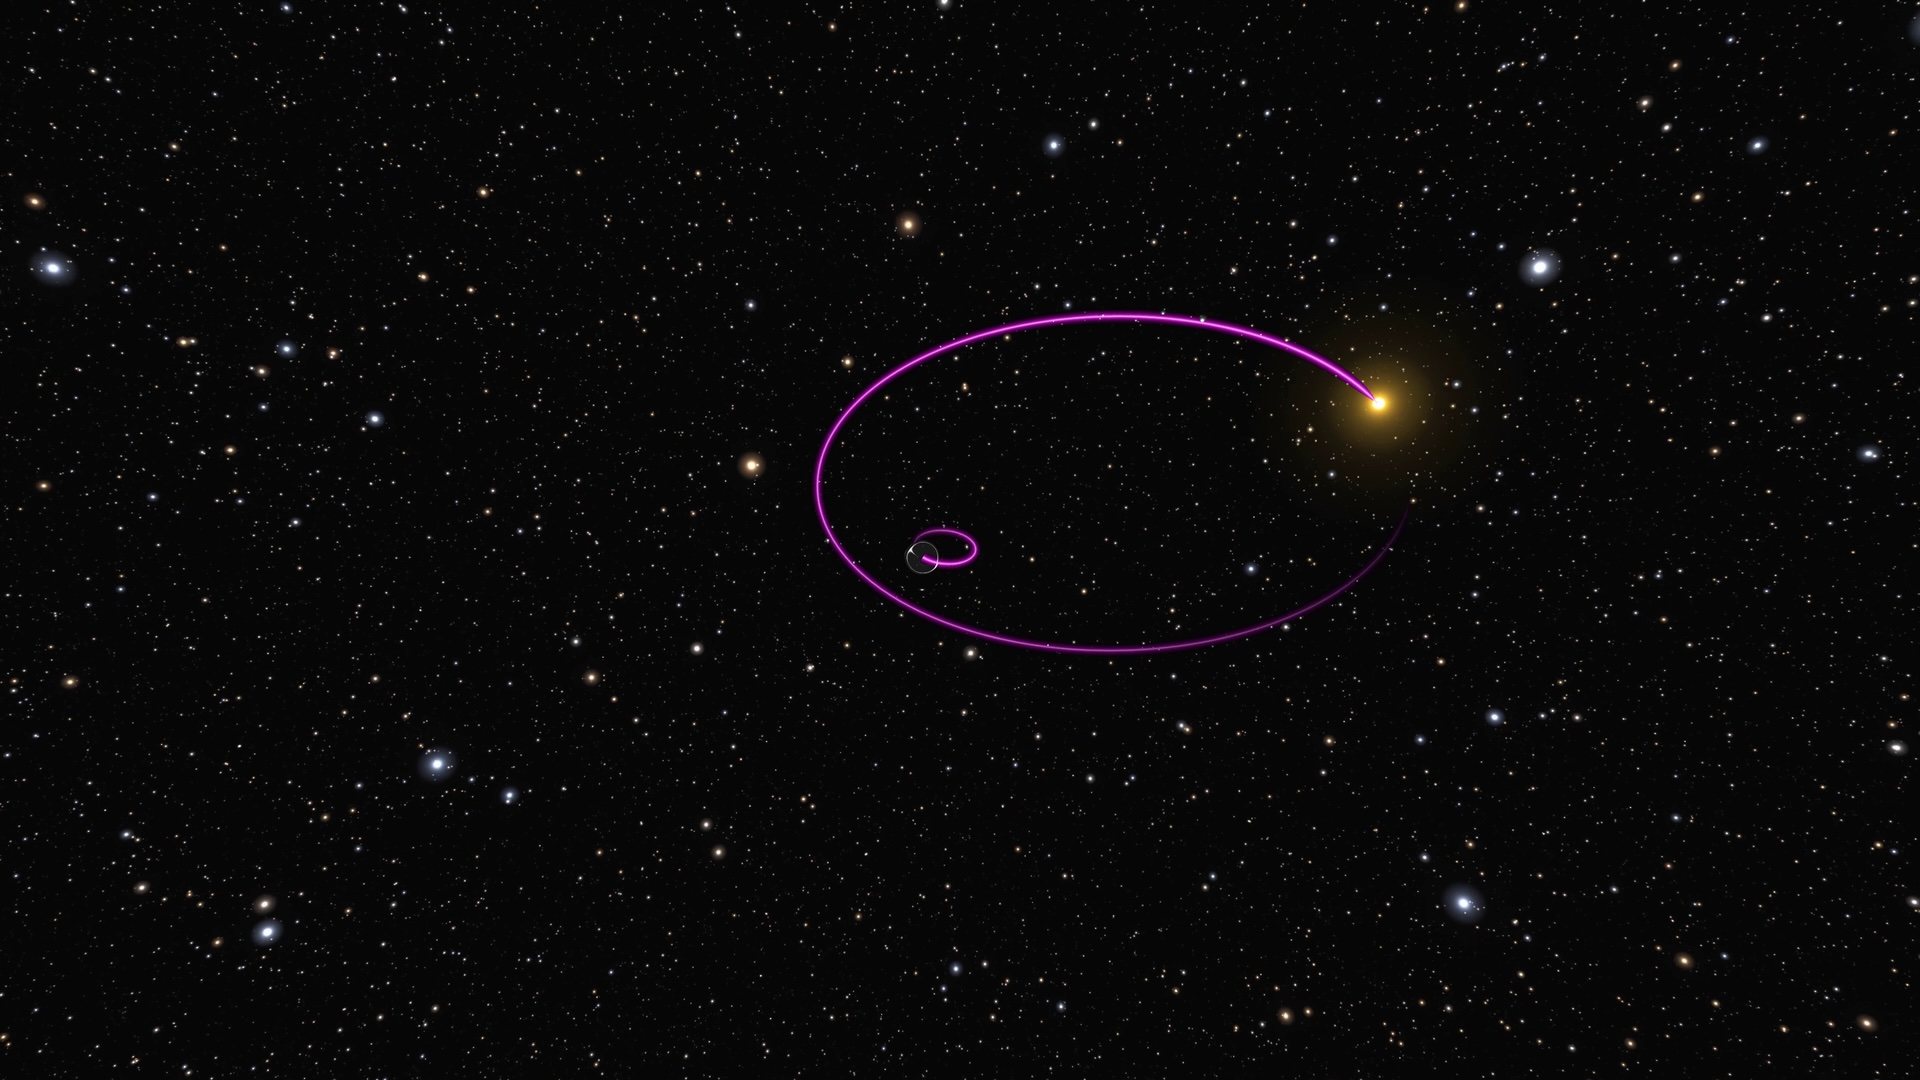
An illustration of the first black hole discovered with a star on a wide orbit. The black hole moves along the smaller inner ellipse, while its companion star orbits along the wider outer one. [ESA/Gaia/DPAC]
Recent research led by Smadar Naoz (University of California, Los Angeles) offers a potential answer to this question of relatedness — that each of these situations forms through the same underlying process.
Triples Systems
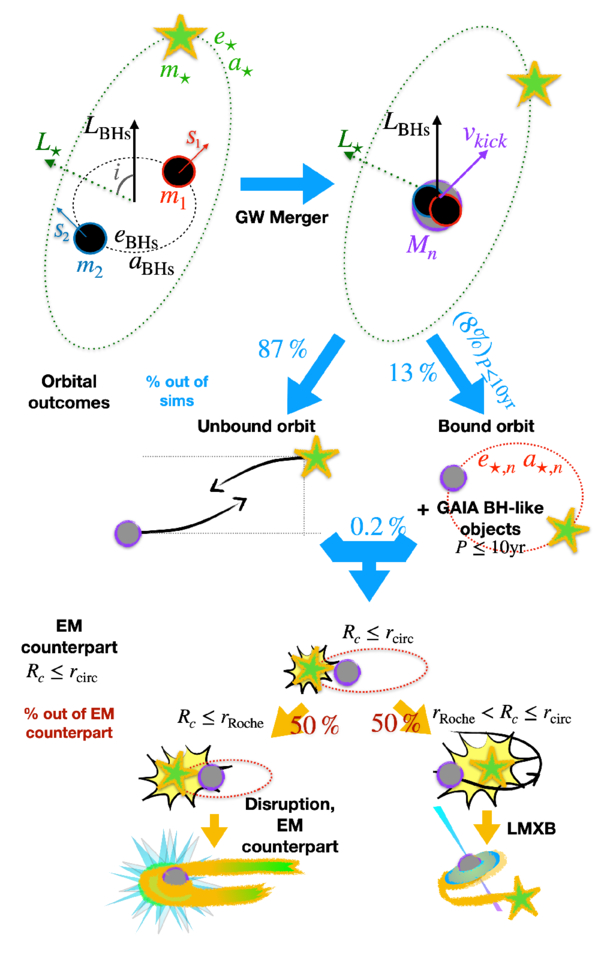
A schematic illustration of how triple-star systems can produce all three types of observable stellar-mass black hole systems. Click to enlarge. [Naoz et al. 2025]
What happens next depends on the geometry of the system and the direction of the kick. If the remnant black hole gets shot away from the third star, it might just drift off on its own and leave the star behind. If the kick isn’t too strong, the remnant will remain gravitationally bound to that third star, and the system will eventually look like the star–black hole pairs observed by Gaia. Finally, if the kick sends the remnant toward the third star, some dramatic outcomes become possible: either the black hole starts nibbling on the star and the system becomes a low-mass X-ray binary, or the black hole simply smashes into the star, destroying it completely in a large, flashy explosion paired with a gravitational wave signal.
The authors stress that this mechanism is almost certainly not the only way that these three stellar-mass black hole systems form. However, it is exciting to consider a common thread underlying such seemingly different scenarios, and with upgrades coming to gravitational wave observatories, we can hope for tests of its feasibility in the near future.
Citation
“Triples as Links Between Binary Black Hole Mergers, Their Electromagnetic Counterparts, and Galactic Black Holes,” Smadar Naoz et al 2025 ApJL 992 L12. doi:10.3847/2041-8213/ae0a20
The post Black Holes with a Shared Background appeared first on AAS Nova.
]]>
Astrobites reports on how X-rays influenced the formation of the first massive black holes in the universe.
The post Do X-Rays Help or Hurt Massive Black Hole Formation? appeared first on AAS Nova.
]]>Editor’s Note: Astrobites is a graduate-student-run organization that digests astrophysical literature for undergraduate students. As part of the partnership between the AAS and astrobites, we occasionally repost astrobites content here at AAS Nova. We hope you enjoy this post from astrobites; the original can be viewed at astrobites.org.
Title: Massive Black Hole Seed Formation in Strong X-Ray Environments at High Redshift
Authors: Kazutaka Kimura, Kohei Inayoshi, and Kazuyuki Omukai
First Author’s Institution: Tohoku University
Status: Published in ApJ
Environments of Massive Black Holes
Astronomers have found that nearly every observable galaxy hosts a central supermassive black hole (SMBH) — a black hole more than a million times more massive than the Sun. Using JWST, they have peered back into the early universe to observe some of the earliest galaxies, and these early galaxies also contain SMBHs. In fact, many of these galaxies seem to contain SMBHs that are more massive than we expected them to be this early in the universe.
We believe that most black holes form at the ends of the lives of massive stars, which collapse under their own gravity when they run out of fuel. We expect that this happened to the first stars too, forming “light” (as in “lightweight”) seeds of SMBHs with masses up to about 100 solar masses. Astronomers also think that the right conditions in the early universe could lead to the formation of a “heavy” seed with a mass on the order of 104 solar masses or more; this kind of black hole is called a direct-collapse black hole (DCBH).
In order to form a DCBH, a gas cloud needs to collapse without fragmenting to form star clusters and stars — if stars form, there won’t be enough mass funneled to the center of the cloud to form the DCBH. One important criterion for this to happen is the absence of coolants, like metals and molecular hydrogen (H2), which cause fragmentation. One way to eliminate H2 is with a particular type of ultraviolet light called Lyman-Werner radiation, which can destroy H2 molecules. However, recent results from the Hydrogen Epoch of Reionization Array (HERA) suggest that early galaxies emitted more X-rays than expected, which would increase the amount of H2 and make it less likely for DCBHs to occur. Today’s authors investigate the feasibility of forming DCBHs in these X-ray-bright environments.
Modeling Black Hole Formation
Today’s authors model the collapse of gas in dark-matter halos that have a nearby neighboring halo. This neighboring halo emits radiation like ultraviolet light and X-rays that impact the formation of molecules like H2, which affects the gas chemistry. This radiation is typically emitted by hot gas in star-forming regions. The authors also track quantities like the gas density and temperature as the gas collapses. Once the gas collapses enough, a star forms at the center and continues to accrete surrounding material. Once this star evolves and reaches the end of its life, it becomes a black hole.
The authors considered different intensities of X-ray radiation relative to a critical value of Lyman-Werner radiation believed to destroy enough H2 to form a DCBH, which is called J21. They explore values of the X-ray intensity Jx relative to J21, considering ratios of 0, 10-6, 10-5, and 10-4.
Another important consideration was the baryonic streaming velocity. This is the relative bulk velocity between baryonic (i.e., “normal”) matter and dark matter in the early universe. Higher streaming velocities can delay the collapse of gas in dark-matter halos, which affect gas properties like density, temperature, and chemistry. The streaming velocity depends on the redshift, z, which is given by σbsm = 30 km/s (1+z)/(1+z0), where z0 = 1,100. This “standard” relationship has been calibrated with measurements from observations. The authors consider two cases for the streaming velocity: vbsm = 0 and vbsm = 1σbsm, which are denoted in the figures below.
X-Rays and Seed Suppression
The first main results are shown in Figure 1. The authors find that a large number of intermediate-mass seeds form from H2 cooling, shown in blue, regardless of the X-ray intensity. A smaller number of higher-mass seeds form from H–H2 and H–H cooling, but these cooling processes become suppressed as the X-ray intensity increases. This is because the increased X-ray intensity converts more H to H2. Interestingly, accounting for the streaming velocity all but wipes out black hole formation via H2 cooling except at very high X-ray intensities.
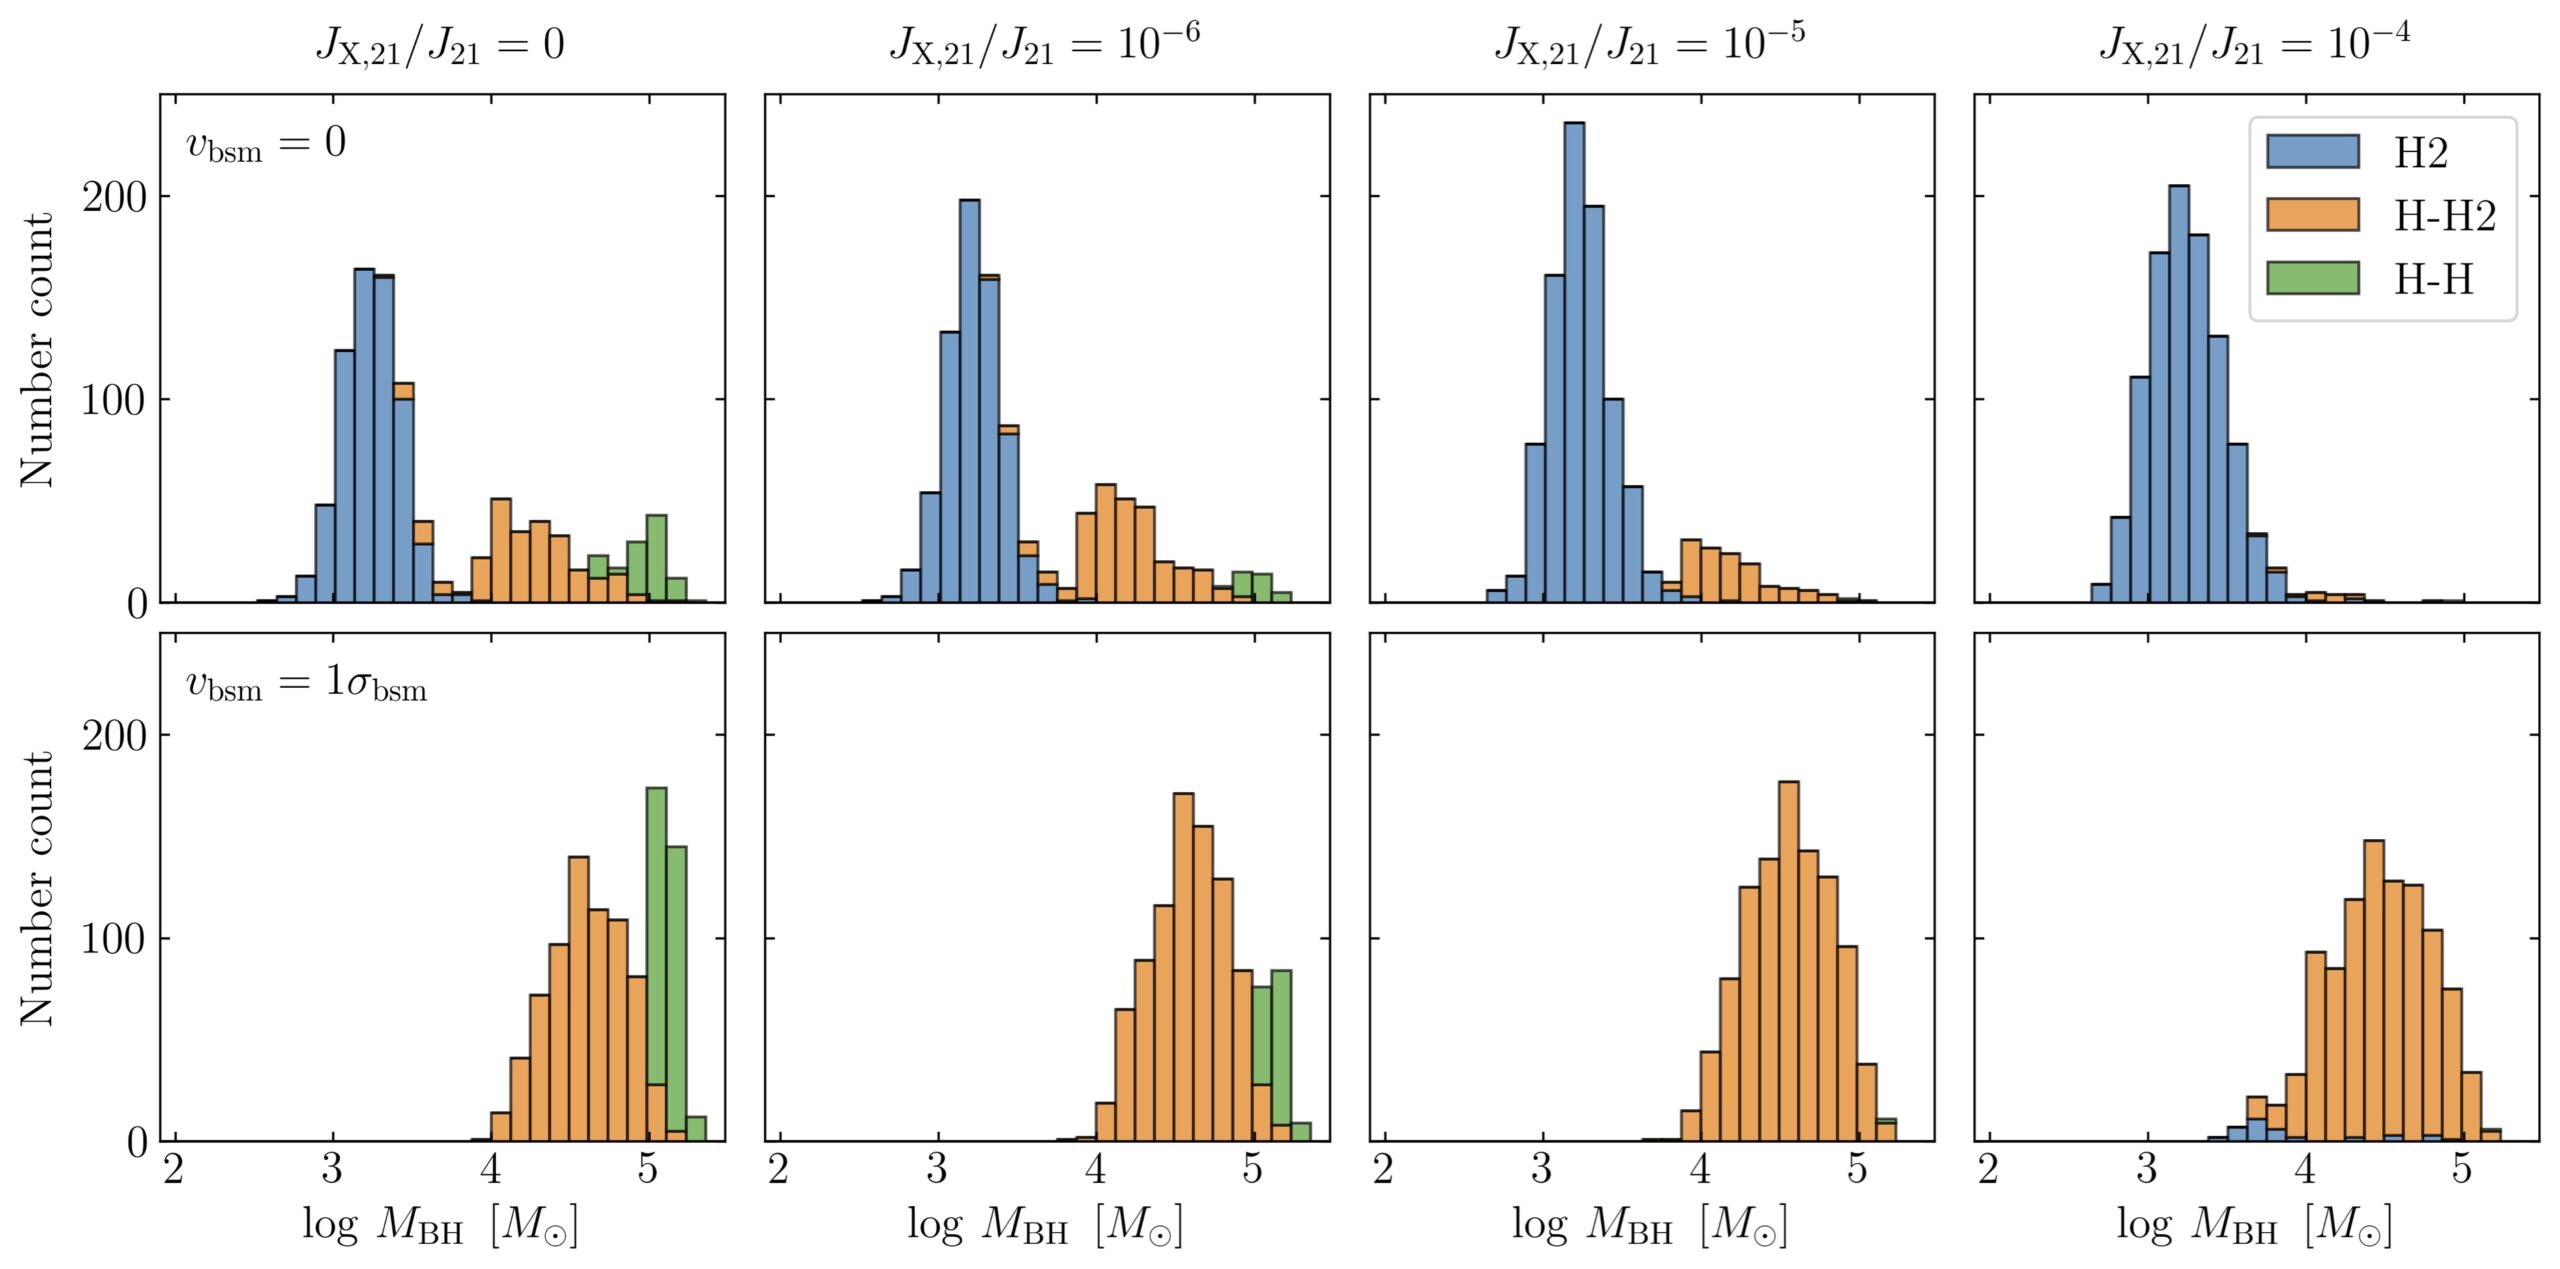
Figure 1: Mass distributions of seed black holes. The top row uses a baryonic streaming velocity of 0 and the bottom row uses the standard streaming velocity. Columns represent increasing X-ray intensities (left to right). Colors represent the dominant cooling mechanisms: H2 (blue), atomic hydrogen H transitioning to H2 (orange), and solely H (green). [Kimura et al. 2025]

Figure 2: Seed black hole mass functions for low and high X-ray intensities (left and right columns, respectively). Rows are the same as in Figure 1. [Kimura et al. 2025]
Original astrobite edited by Sparrow Roch.
About the author, Brandon Pries:
I am a graduate student in physics at Georgia Institute of Technology (Georgia Tech). I do research in computational astrophysics with John Wise, using machine learning to study the formation and evolution of supermassive black holes in the early universe. I’ve also done extensive research with the IceCube Collaboration as an undergraduate at Michigan State University, studying applications of neural networks to event reconstructions and searching for signals of neutrinos from dark matter annihilation.
The post Do X-Rays Help or Hurt Massive Black Hole Formation? appeared first on AAS Nova.
]]>
By studying the orbits of rare outer solar system objects, astronomers have estimated how long it took for the Sun to leave its birth cluster.
The post The Sun Left Home in a Hurry appeared first on AAS Nova.
]]>By simulating how the orbits of distant solar system objects were altered by close encounters with other stars early in the Sun’s life, astronomers have placed tight constraints on how long our home star stuck around its siblings after birth.
Born in Batches
Though our Sun currently travels on a solitary trajectory through the galaxy, its earliest childhood was not spent so lonely. Instead, the Sun was likely born as part of a litter of many other stars all collapsing out of the same cloud of precursor gas and dust. As a consequence, its early adolescence was spent in the company of dozens of other young stars, all zipping along on their own paths, destined to drift apart but initially packed close together.
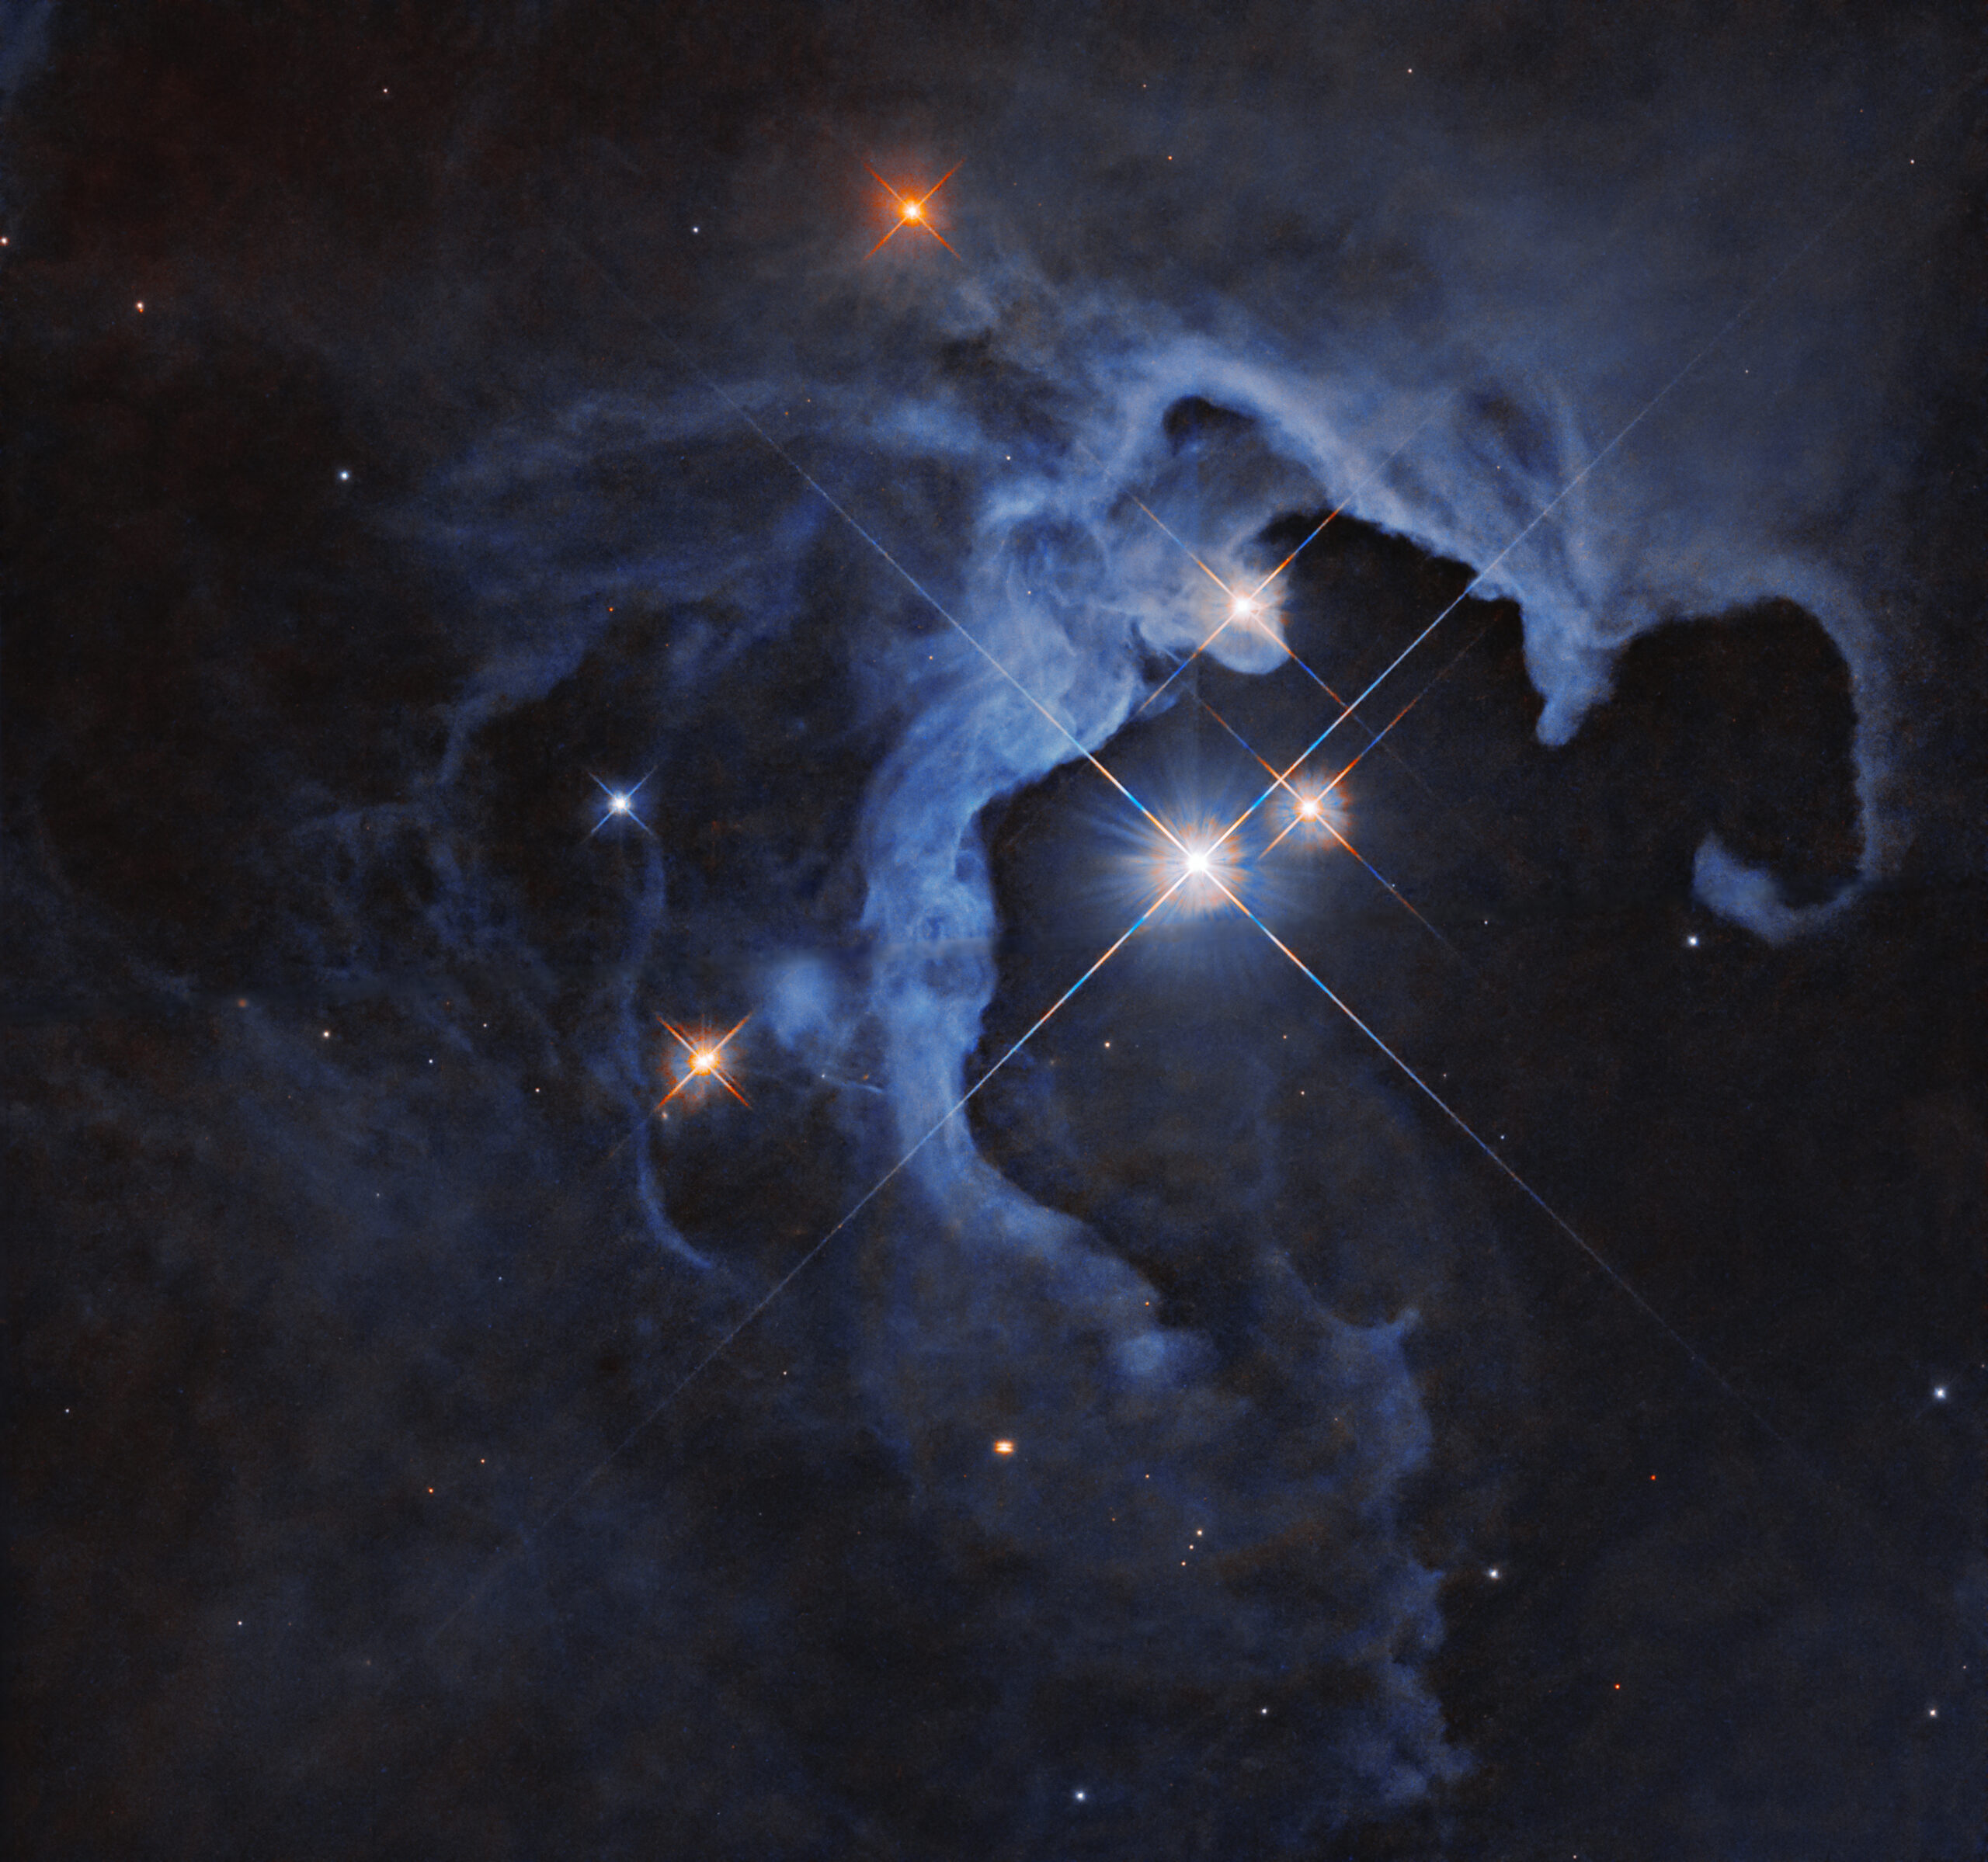
The Hubble Space Telescope’s view of a collection of young stars still embedded within their natal nebula. [NASA, ESA, G. Duchene (Universite de Grenoble I); Image Processing: Gladys Kober (NASA/Catholic University of America)]
Recent research led by Amir Siraj, Princeton University, leverages these scars or their apparent absence to ask the question: given the structure we observe in the outer solar system today, what limits can we place on the number of stars born near the Sun and the amount of time the Sun spent in its birth cluster?
Distance is Power
Several authors have asked this question over the past several decades, but Siraj and collaborators added a new twist: instead of studying either the giant planets or the cold classical Kuiper Belt, they instead focused exclusively on the “distant sednoids.” This rarefied collection of only nine known objects includes only the most distant minor planets in our solar system: the sednoids never come within 40 au of the Sun, and they spend much of their orbits beyond 400 au. Interestingly, however, all of them orbit on planes that are fairly aligned with that of the planets, and none ever strays farther than 20° from the ecliptic.
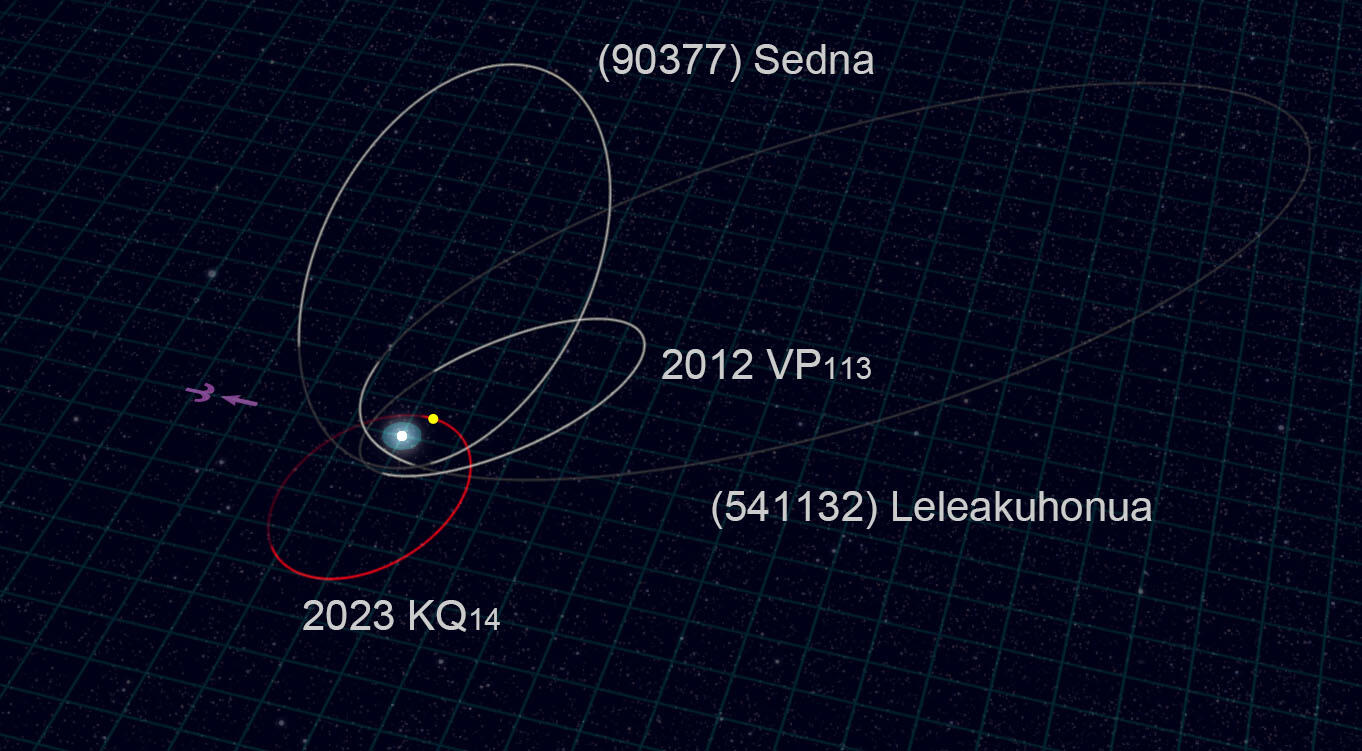
An illustration of the orbits for some of the distant sednoids considered in this study. Click to enlarge. [NAOJ]
The authors stress that this conclusion leans on the assumption that the distant sednoids arrived on their extreme orbits essentially immediately, though in fact astronomers aren’t sure exactly how and when these objects ended up on the outskirts of the solar system. If the sednoids were in fact implanted onto their orbits early on, this limit on how long it took the Sun to leave its siblings is by far the strongest to date. With the Vera C. Rubin Observatory poised to discover thousands of new distant solar system objects, it’s likely that the bound will grow even more stringent in the next few years.
Citation
“Limits on Stellar Flybys in the Solar Birth Cluster,” Amir Siraj et al 2025 ApJL 993 L4. doi:10.3847/2041-8213/ae1025
The post The Sun Left Home in a Hurry appeared first on AAS Nova.
]]>
Astrobites reports on the discovery of the faintest galaxy in the Andromeda system, Pegasus VII.
The post Do You Have This Andromeda Galaxy in Extra-Extra-Extra Small? appeared first on AAS Nova.
]]>Editor’s Note: Astrobites is a graduate-student-run organization that digests astrophysical literature for undergraduate students. As part of the partnership between the AAS and astrobites, we occasionally repost astrobites content here at AAS Nova. We hope you enjoy this post from astrobites; the original can be viewed at astrobites.org.
Title: Deep in the Fields of the Andromeda Halo: Discovery of the Pegasus VII Dwarf Galaxy in UNIONS
Authors: Simon E. T. Smith et al.
First Author’s Institution: University of Victoria
Status: Published in ApJ
Picture a galaxy. It’s big, right? Unfathomably big, huge even! But galaxies aren’t all extremely massive; they come in a variety of sizes and luminosities, and some galaxies are so small and so dim that astronomers may not even know they’re there, even when they’re basically in our backyard. The hunt for the smallest galaxies is an important one, as these systems give us extreme environments where we can test theories of dark matter and galaxy evolution. The authors of this article present a newly discovered ultra-faint dwarf galaxy dubbed Pegasus VII (Peg VII), found next to our nearest major galactic neighbour: Andromeda.
How Do You Find a Dwarf Galaxy?
Finding ultra-faint dwarf galaxies requires deep, long-exposure imaging across wide swaths of the night sky, something that is only possible through observational surveys. Some telescopes, like JWST, require astronomers to submit an application to point the telescope at a specific, known target and, if approved, will have some amount of “telescope time” to do their imaging. Others, like the Euclid space telescope, are part of large surveys in which an area of the sky is selected and systematically imaged over several years, regardless of if there are known objects there or not. Because of this, surveys are our best bet to discover faint systems like ultra-faint dwarf galaxies.
The survey these authors used is UNIONS (Ultraviolet Near Infrared Optical Northern Survey), which covers the same area of the sky as the Euclid space telescope but is done with three ground-based telescopes: the Canada-France-Hawaii Telescope, Pan-STARRS, and Subaru, all located on Maunakea in Hawaiʻi. The authors were originally focused on finding satellite galaxies in the outskirts of Andromeda’s gravitational influence and during their search were able to identify an overdensity of bright stars. They then applied for and were awarded telescope time with both the Canada-France-Hawaii Telescope and the Gemini Observatory to perform deeper follow-up imaging of the system to figure out what exactly it was.
Optical Illusion or Optical Observation?
With this deeper follow-up imaging they could confirm if these stars were really one coherent system or if they just appeared to be clumped together on the sky. When they plotted the stars on a colour–magnitude diagram (Figure 1) they were able to identify a main sequence, horizontal branch, and red giant branch, as would be expected if these stars all formed at roughly the same time and were allowed to evolve over billions of years. Congratulations, it’s a dwarf galaxy!

Figure 1: Left: The colour–magnitude diagram for all stars within 2 half-light radii of Peg VII. Those inside the orange dashed lines are identified members of Peg VII, and the red lines are the best-fit isochrones. The vertical red line is the main sequence, the curve at the top is the red giant branch, and the horizontal line is the horizontal branch. Below the black dashed lines are stars that are too dim to be reliably used in the analysis. Right: The colour–magnitude diagram for stars that appear to be around Peg VII that are not actually members. These stars don’t follow the main sequence at all. [Adapted from Smith et al. 2025]
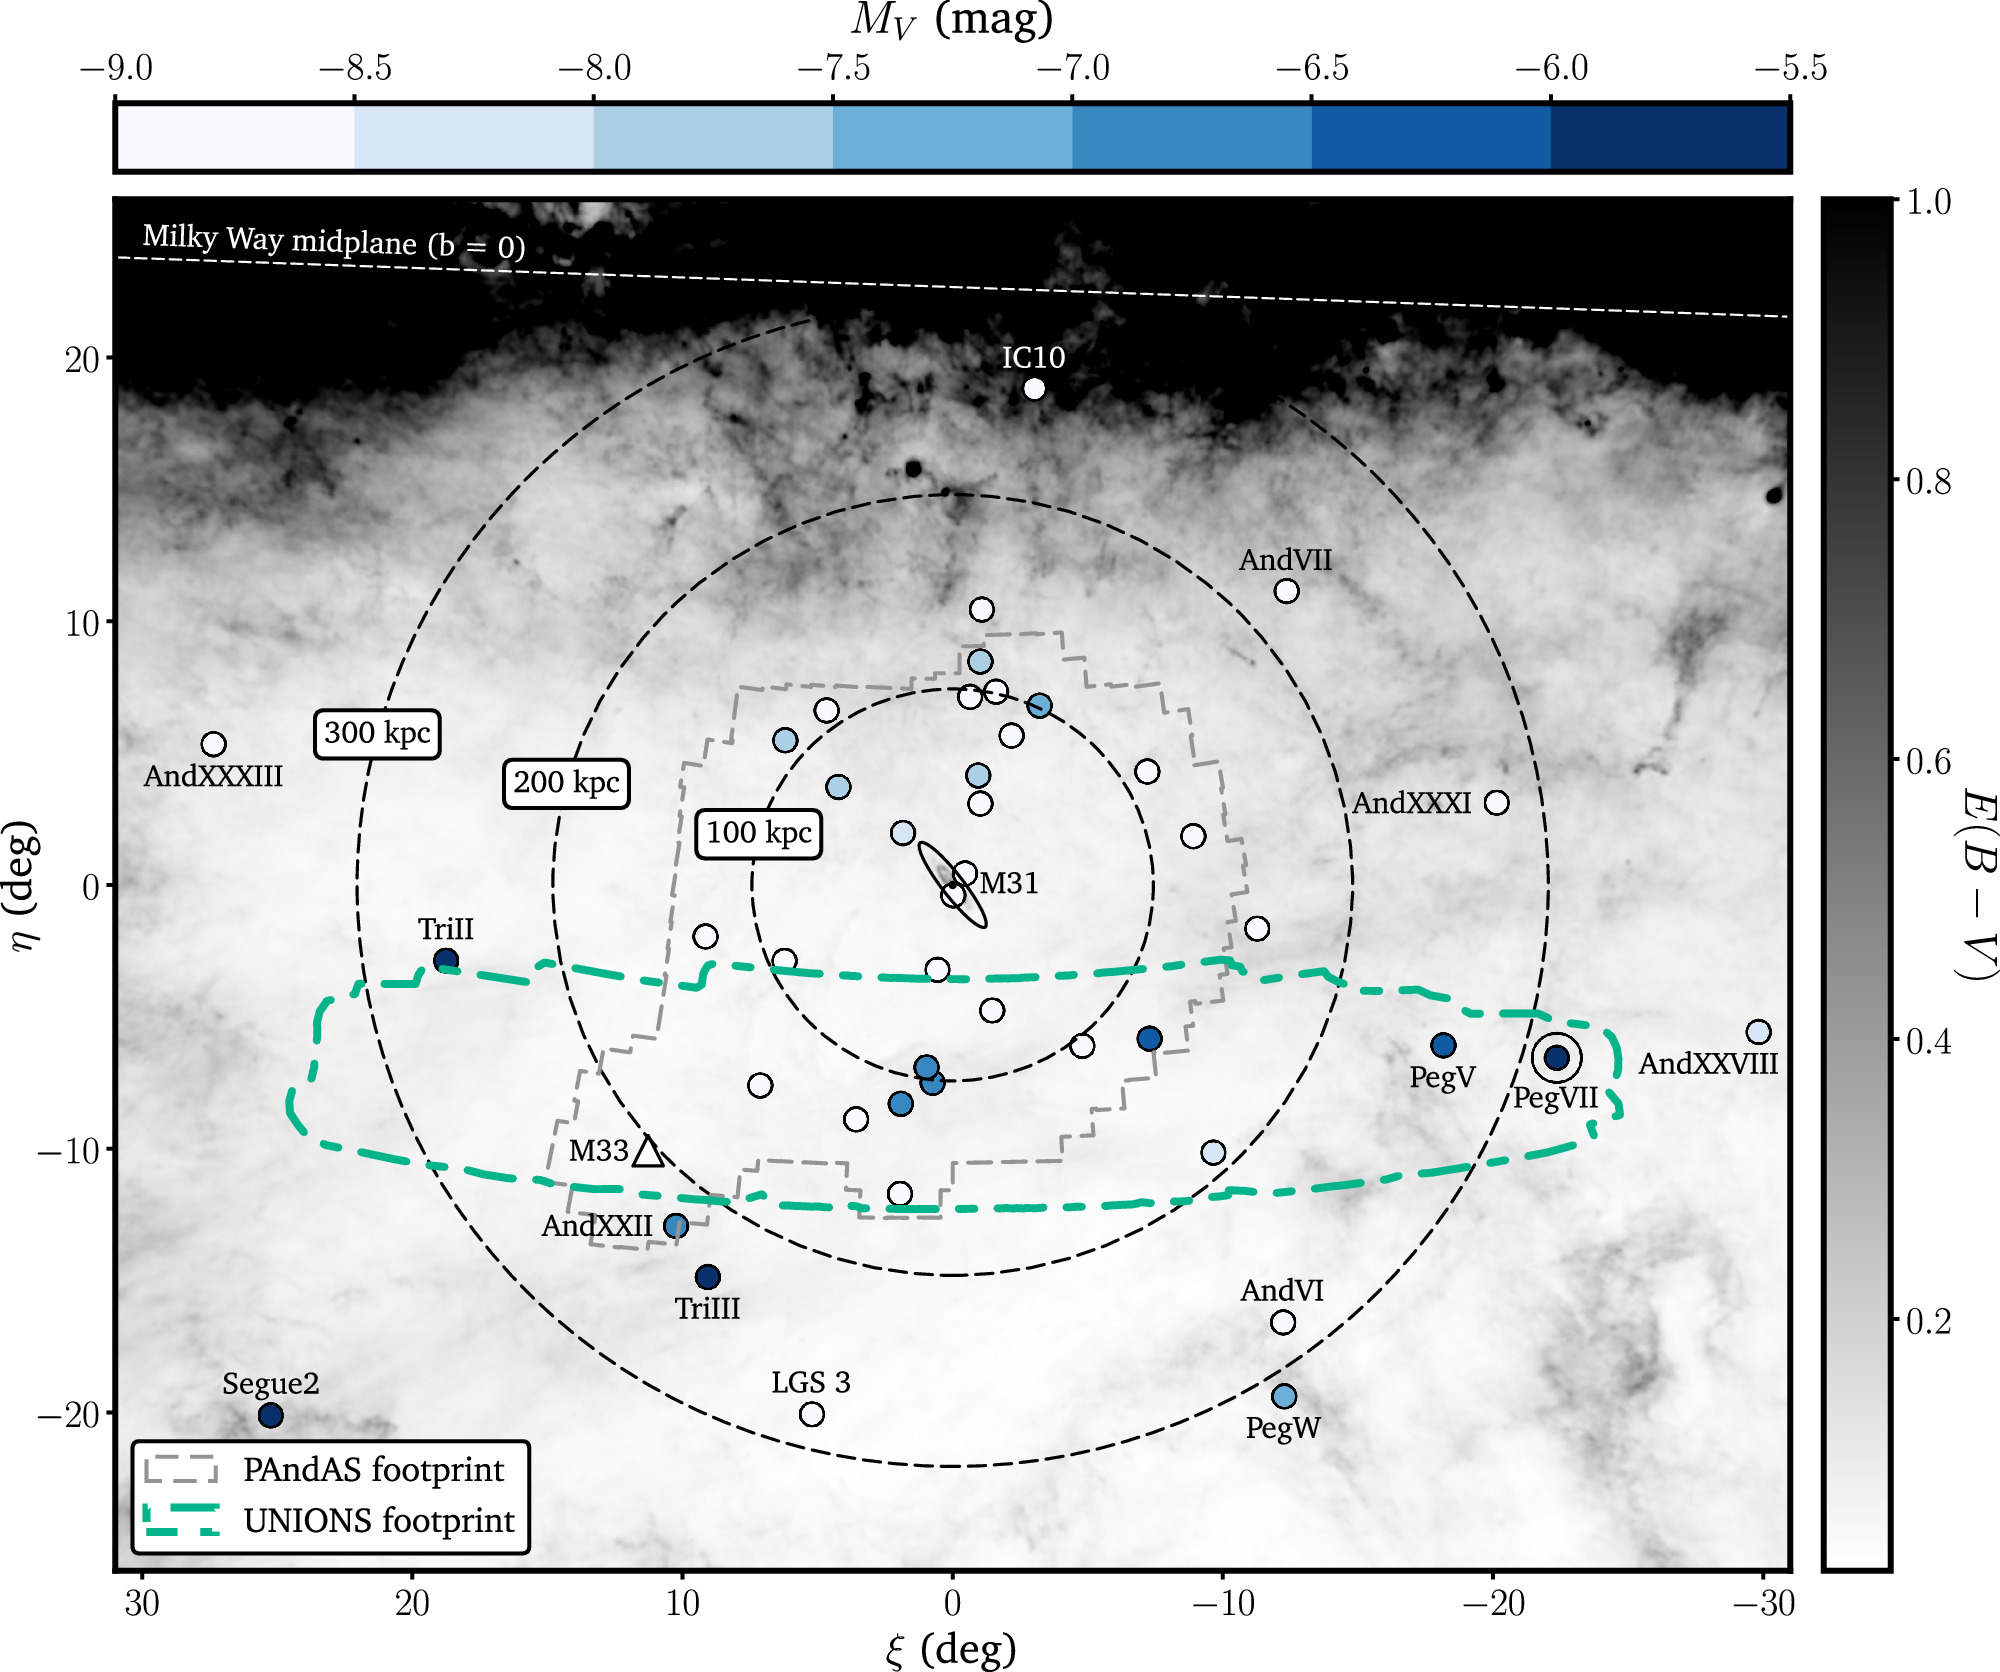
Figure 2: The spatial distribution of the Andromeda (M31) satellite galaxy system. Galaxies are coloured based on how bright they are (darker means dimmer). The dashed grey line denotes the area covered by PAndAS, a survey focused on Andromeda satellites that are more centrally concentrated. The dashed green line denotes the area covered by the UNIONS survey, with Peg VII on the right-hand side, more than 978,000 light-years from Andromeda. [Smith et al. 2025]
How Are Baby Dwarf Galaxies Made?
The big question surrounding Peg VII is how exactly it got like this. Did it originally form with so few stars, or was it originally bigger and has since had stars stripped away due to tidal forces exerted on it by Andromeda? It’s difficult to answer this right now because the imaging the authors obtained doesn’t allow them to determine Peg VII’s orbital path and speed around Andromeda. But, they can look for indicators of tidal disruption, like spatial elongation of the stars’ distribution, or how “stretched out” the galaxy is.
They found that Peg VII is quite elliptical (oval-like) and its major axis is roughly pointed at Andromeda (Figure 3). This could indicate that Peg VII has interacted with Andromeda in the past, and this could have affected its mass and size. However, there are lots of other possibilities for Peg VII’s shape that wouldn’t involve Andromeda at all. Peg VII could have naturally formed like this in isolation and has only just recently been brought into Andromeda’s orbit. It’s also possible Peg VII is the byproduct of a merger between two even smaller dwarf galaxies, which has been shown to result in elliptical distributions.
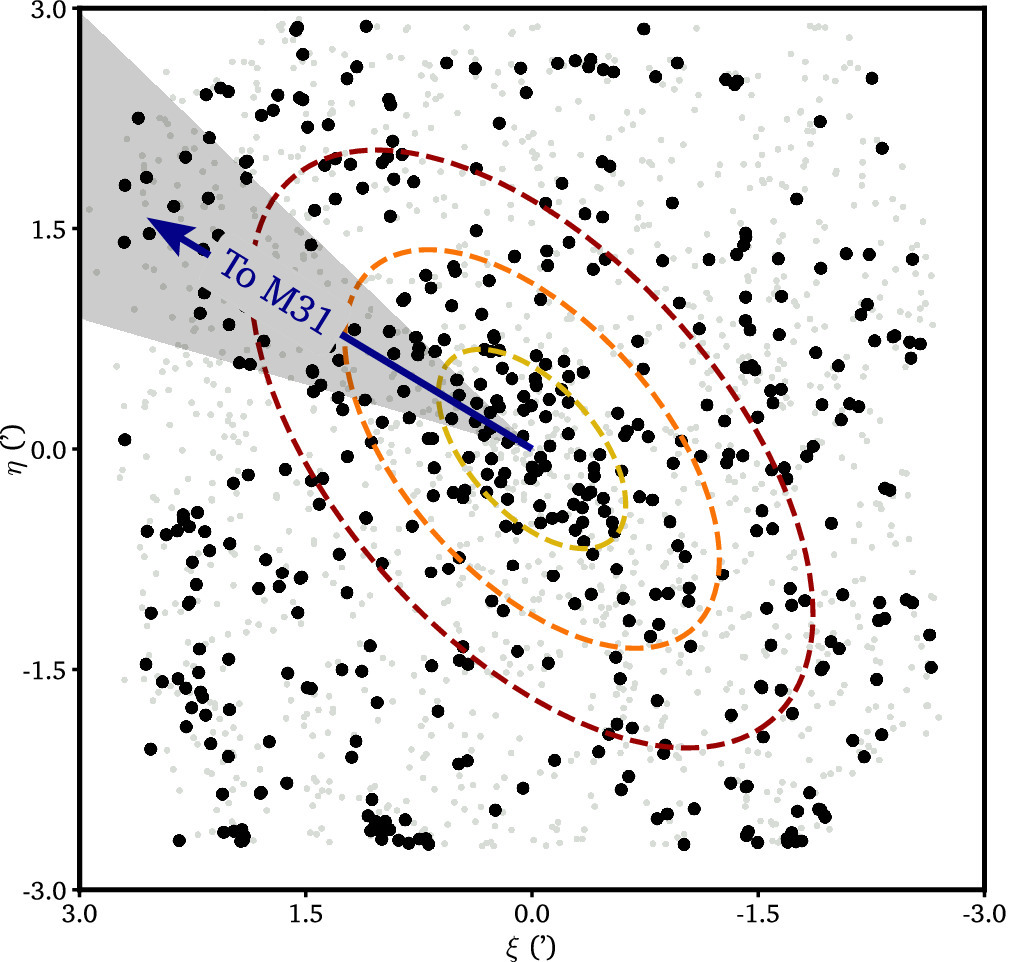
Figure 3: The spatial distribution of Peg VII member stars (dark black dots). The dashed lines show where 1, 2, and 3 half-light radii are, showing how elliptical Peg VII is. The blue arrow shows the direction Andromeda is in, which roughly lines up with Peg VII’s major axis. [Adapted from Smith et al. 2025]
In the meantime, keep your eye on the sky for more news about Peg VII and its other ultra-faint dwarf galaxy buddies. As big surveys designed for finding faint systems like these start to ramp up, like the Euclid space telescope and the Vera C. Rubin Observatory, we may be hearing more big things about these little galaxies.
Original astrobite edited by Caroline Von Raesfeld.
About the author, Veronika Dornan:
Veronika is a postdoctoral research associate at the University of Edinburgh. Her research is in observations of globular star clusters and how they can be used to study the evolution of their host galaxies.
The post Do You Have This Andromeda Galaxy in Extra-Extra-Extra Small? appeared first on AAS Nova.
]]>
Recent research shows how fractal properties can help distinguish between grand-design and flocculent spiral galaxies.
The post Featured Image: Fractals and Flocculence appeared first on AAS Nova.
]]>Displayed above are eight galaxies imaged by the Sloan Digital Sky Survey. Although all of these galaxies are spiral galaxies, there are large differences between them: the top row shows grand-design spirals, which feature well-defined arms, and the bottom row shows flocculent spirals, which have feathery or patchy arms. Recently, a team led by Biju Saha (Indian Institute of Science, Education and Research) explored whether grand-design and flocculent spirals could be classified by their fractal dimension. With intricate structures on scales large and small, spiral galaxies are fractal-like, and fractal dimension is a way of quantifying the complexity of their structure. Saha and collaborators found a statistically significant difference in the median fractal dimension of their samples of grand-design and flocculent spirals, suggesting that this mathematical method can help distinguish between the two types of spirals. To learn more about how fractal dimension is calculated from galaxy images, and what these results might mean for how spiral arms form, be sure to check out the full research article linked below.
Citation
“Can Fractal Dimension Distinguish Between Grand-Design and Flocculent Spiral Arms?” Biju Saha et al 2025 ApJ 991 63. doi:10.3847/1538-4357/adf840
The post Featured Image: Fractals and Flocculence appeared first on AAS Nova.
]]>
When supernovae explode, they send a fast-moving shock wave into the interstellar medium, changing the local landscape significantly. A recent publication hones in on one supernova remnant to determine how fast it's expanding and where it may have come from.
The post Chandra Spies a Supernova Shock Front Speeding Along appeared first on AAS Nova.
]]>Beautiful bubbles of hot ionized gas, supernova remnants trace the dying days of massive stars. A recent study uses the Chandra X-ray Observatory to detail the motion and understand the origins of one supernova remnant.
Retracing Supernova Remnants
Massive stars, about 8 solar masses or larger, will end their short lives in violent core-collapse supernovae. These explosions barrel into any surrounding interstellar medium, carving out low-density cavities and blowing material outward. Appearing as a bubble or shell of hot gas, a supernova remnant carries the signatures of the type of star that produced it and the ways that star shaped its environment throughout its life.
Nearby, in the Large Magellanic Cloud, is the 2,500-year-old supernova remnant N132D — the most X-ray luminous supernova remnant within the Local Group. Though N132D’s size, likely progenitor mass, and chemical composition are well constrained, astronomers have yet to nail down the velocity of the X-ray shock front — the outer edge of the supernova remnant that rams into the interstellar medium. This measurement is critical to understanding the local conditions the supernova first encountered and how its expansion will continue to impact the interstellar medium over time.
Chandra Observations of N132D
Determining the shock front velocity requires astronomers to focus on the thin outer edge of the soaring supernova remnant — how do we measure the motion of such a narrow strip of gas? X-ray spectroscopy of N132D yields a measurement from a single epoch of observations, but it cannot isolate the narrow shock front, making a reliable velocity measurement difficult to attain.
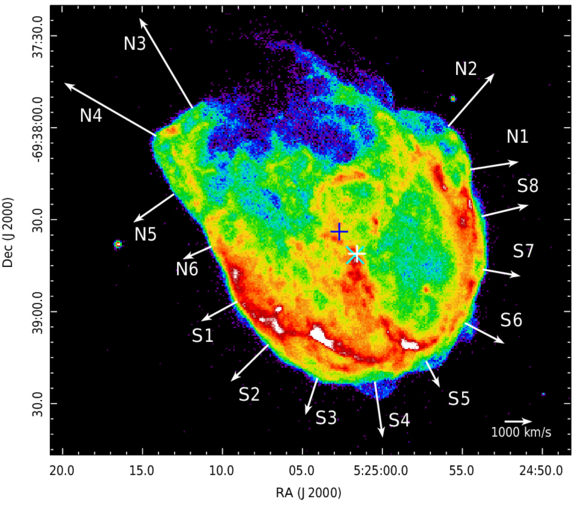
The expansion of supernova remnant N132D around the rim for each of the regions analyzed in this study. The arrow lengths are proportional to their estimated expansion velocities. Click to enlarge. [Long et al 2025]
The authors focus on small regions on the very edge of the supernova shock front, six northern and eight southern, to carefully measure the motion of the shock between the two sets of observations. In separating the shock front into smaller regions, the authors can determine any variations in speed along the shock front. The southern edge of N132D moves with the same expansion rate of 1,620 km/s. The northern edge has an average expansion rate of 3,820 km/s, but its speed is more varied, which isn’t unexpected given its blown-out appearance.
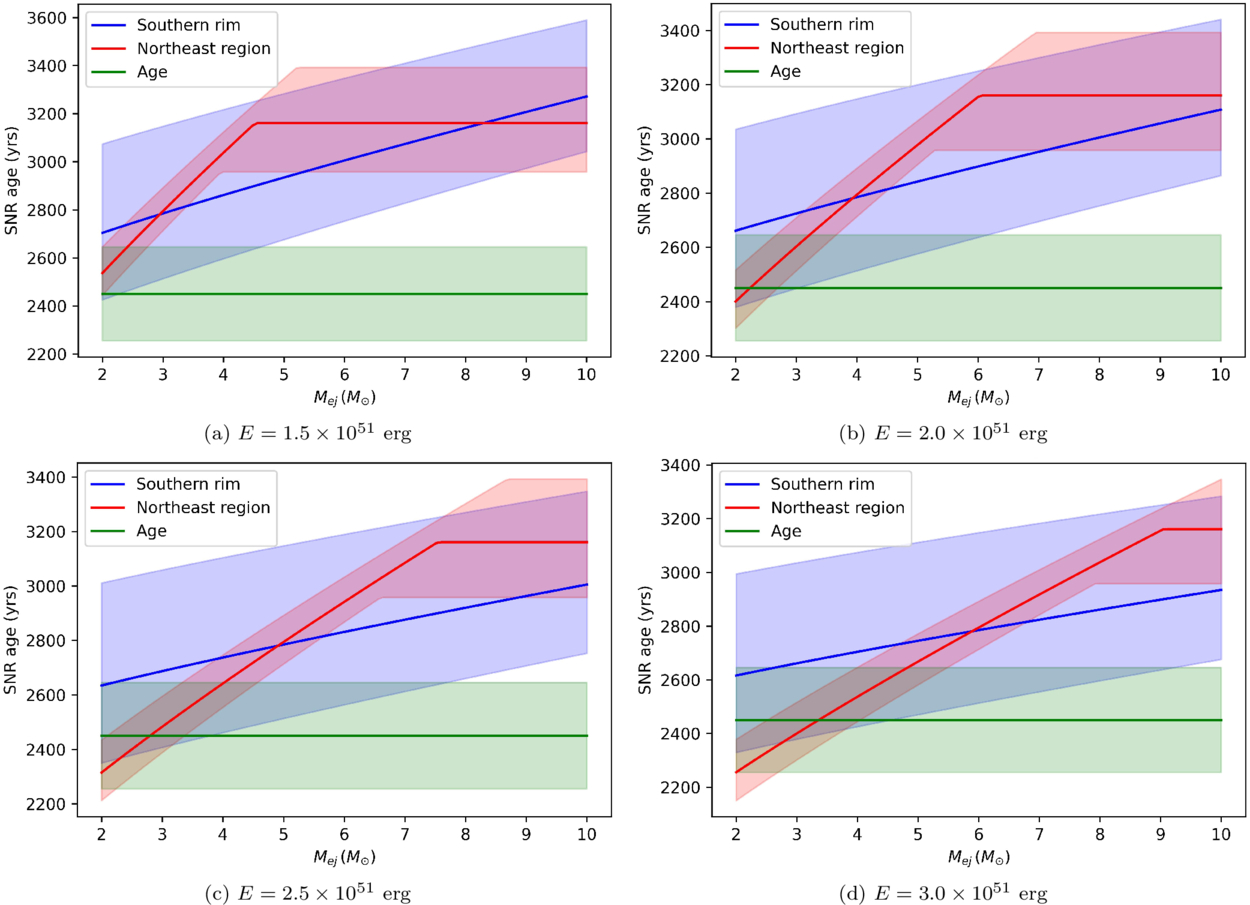
Modeling results showing the supernova age versus ejecta mass for the northern (red) and southern (blue) regions compared to the age estimate from an optical study of N132D. For the explosion energies and estimated ejecta masses between 2 and 6 solar masses, the models are consistent for all three. Click to enlarge. [Long et al 2025]
Comparing to Prior Studies
In addition to determining the velocity of the forward shock, the authors model the evolution of the supernova remnant to estimate the initial conditions of N132D including progenitor star mass, explosion energy, and ejecta mass. Their results agree with other studies that suggested N132D originated from a roughly 15-solar-mass star that exploded 2,500 years ago into a low-density cavity.
This study showcases the unique ability of Chandra’s high-resolution instruments to carefully measure the evolution of supernova remnants, and further studies will continue to determine the detailed characteristics of supernova remnants across the Local Group.
Citation
“Chandra Large Project Observations of the Supernova Remnant N132D: Measuring the Expansion of the Forward Shock,” Xi Long et al 2025 ApJ 993 136. doi:10.3847/1538-4357/ae07c7
The post Chandra Spies a Supernova Shock Front Speeding Along appeared first on AAS Nova.
]]>
If you were standing on a sub-Neptune exoplanet, would you be standing on a rocky surface or in a magma ocean?
The post Standing on a Sub-Neptune appeared first on AAS Nova.
]]>Astronomers often assume that sub-Neptune exoplanets have magma oceans hiding beneath their atmospheres. New research suggests that this might not always be the case.
Puzzling Type of Planet
In the 30 years since the discovery of the first exoplanet, astronomers have come to appreciate that many of the most common planets in our galaxy look nothing like the worlds in our solar system. One type of planet in particular appears to be ubiquitous despite not appearing in our own cosmic neighborhood: sub-Neptunes. As their name suggests these planets are slightly smaller than Neptune, but still much larger than Earth or what we’d expect from a planet composed mostly of rock.
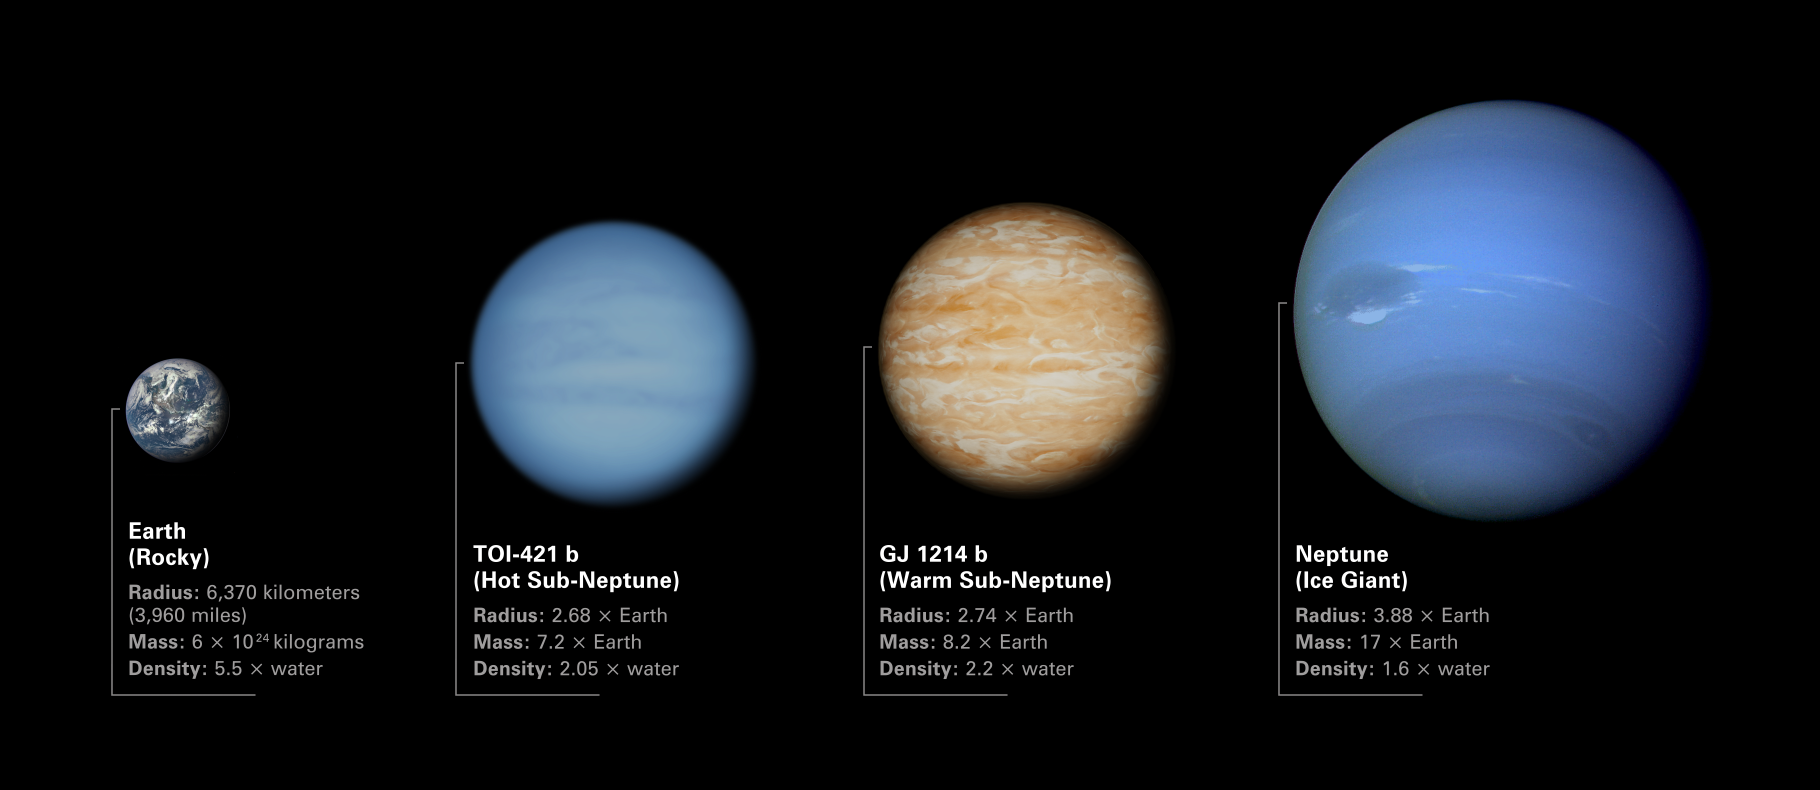
An illustration of how two sub-Neptunes mentioned in this study (TOI-421b and GJ 1214b) compare with planets in our solar system. Click to enlarge. [NASA, ESA, CSA, Dani Player (STScI)]
This key assumption that there’s no solid surface to stand on influences our models about how these planets cool and evolve over time. However, new research led by Bodie Breza (University of Maryland) suggests that this premise might not always be appropriate.
Solid Ground
To test the assumption that every sub-Neptune has a magma ocean, Breza and collaborators simulated hundreds of thousands of feasible exoplanet interiors and atmospheres. Each simulation slightly tweaked various characteristics, like the surface temperature or the planet’s total mass, then checked whether the temperature and pressure conditions at the planet’s surface would leave any rocks in solid or liquid form.
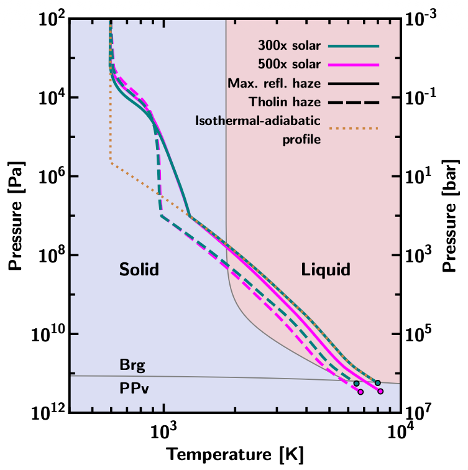
A phase diagram for a common rocky material MgSiO3. The various lines show different model pressure–temperature profiles for the sub-Neptune GJ 1214b, while the circles indicate the location of the atmosphere/surface boundary. All circles fall into the “solid” part of the phase diagram, indicating that GJ 1214b likely has a solid surface. [Breza et al. 2025]
This latter result is particularly insightful in light of recent JWST observations that suggest many sub-Neptunes have heavy atmospheres. These new models suggest that these worlds might have solid surfaces, and that models attempting to explain their compositions should be tweaked to account for this finding. In these early days where astronomers are still puzzling out the most basic properties of these strange worlds, research like this demonstrates the power of using advanced theoretical modeling to help interpret our cutting-edge observations.
Citation
“Not All Sub-Neptune Exoplanets Have Magma Oceans,” Bodie Breza et al 2025 ApJL 993 L46. doi:10.3847/2041-8213/ae0c07
The post Standing on a Sub-Neptune appeared first on AAS Nova.
]]>
Astrobites reports on the consequences of shooting an asteroid with a spacecraft.
The post Shot by the DART and We’re to Blame! Now That Space Rock Won’t Be the Same appeared first on AAS Nova.
]]>Editor’s Note: Astrobites is a graduate-student-run organization that digests astrophysical literature for undergraduate students. As part of the partnership between the AAS and astrobites, we occasionally repost astrobites content here at AAS Nova. We hope you enjoy this post from astrobites; the original can be viewed at astrobites.org.
Title: High-Speed Boulders and the Debris Field in DART Ejecta
Authors: Tony L. Farnham et al.
First Author’s Institution: University of Maryland
Status: Published in PSJ
The DART Mission: A First Step in Planetary Defense
In a groundbreaking experiment, NASA’s Double Asteroid Redirection Test (DART) became the first mission to intentionally crash a spacecraft into an asteroid to test whether such an impact could change the asteroid’s path. The target was Dimorphos, a small companion orbiting a larger asteroid called Didymos, located about 11 million kilometers from Earth.
Luckily, neither Dimorphos nor Didymos was ever on any sort of collision course with anything (and they’re still not). But by impacting an object orbiting another, the effect of the collision could more easily be measured and so Dimorphos was chosen as the target. You see, the goal wasn’t destruction, but deflection. The scientists wanted to see if a spacecraft could alter an asteroid’s orbit by striking it — and if so, by how much. When DART slammed into Dimorphos at over 22,500 kilometers per hour, it successfully shortened the asteroid’s roughly 12-hour orbit by about 33 minutes. This confirmed that hitting an asteroid with a spacecraft — in this case scientifically called a kinetic impactor — could be a viable method to redirect a potentially hazardous object in space.
But the change in momentum didn’t just come from the spacecraft itself. Much of the momentum transfer came from the plume of debris — called ejecta — that blasted out from the impact site. This debris, spreading out in multiple directions, added to the total push on the asteroid. Understanding how this ejecta moved exactly is key to calculating the full effect of the impact and was one of the primary goals for the DART mission.
With this exact purpose in mind, a small companion spacecraft called LICIACube (Light Italian Cubesat for Imaging of Asteroids), released by DART two weeks before the crash, flew past moments after the collision. It snapped several images of the debris cloud, as seen in Figure 1, as it raced past. It is with a reanalysis of these images that today’s authors have managed to track a number of boulders in the ejected material.
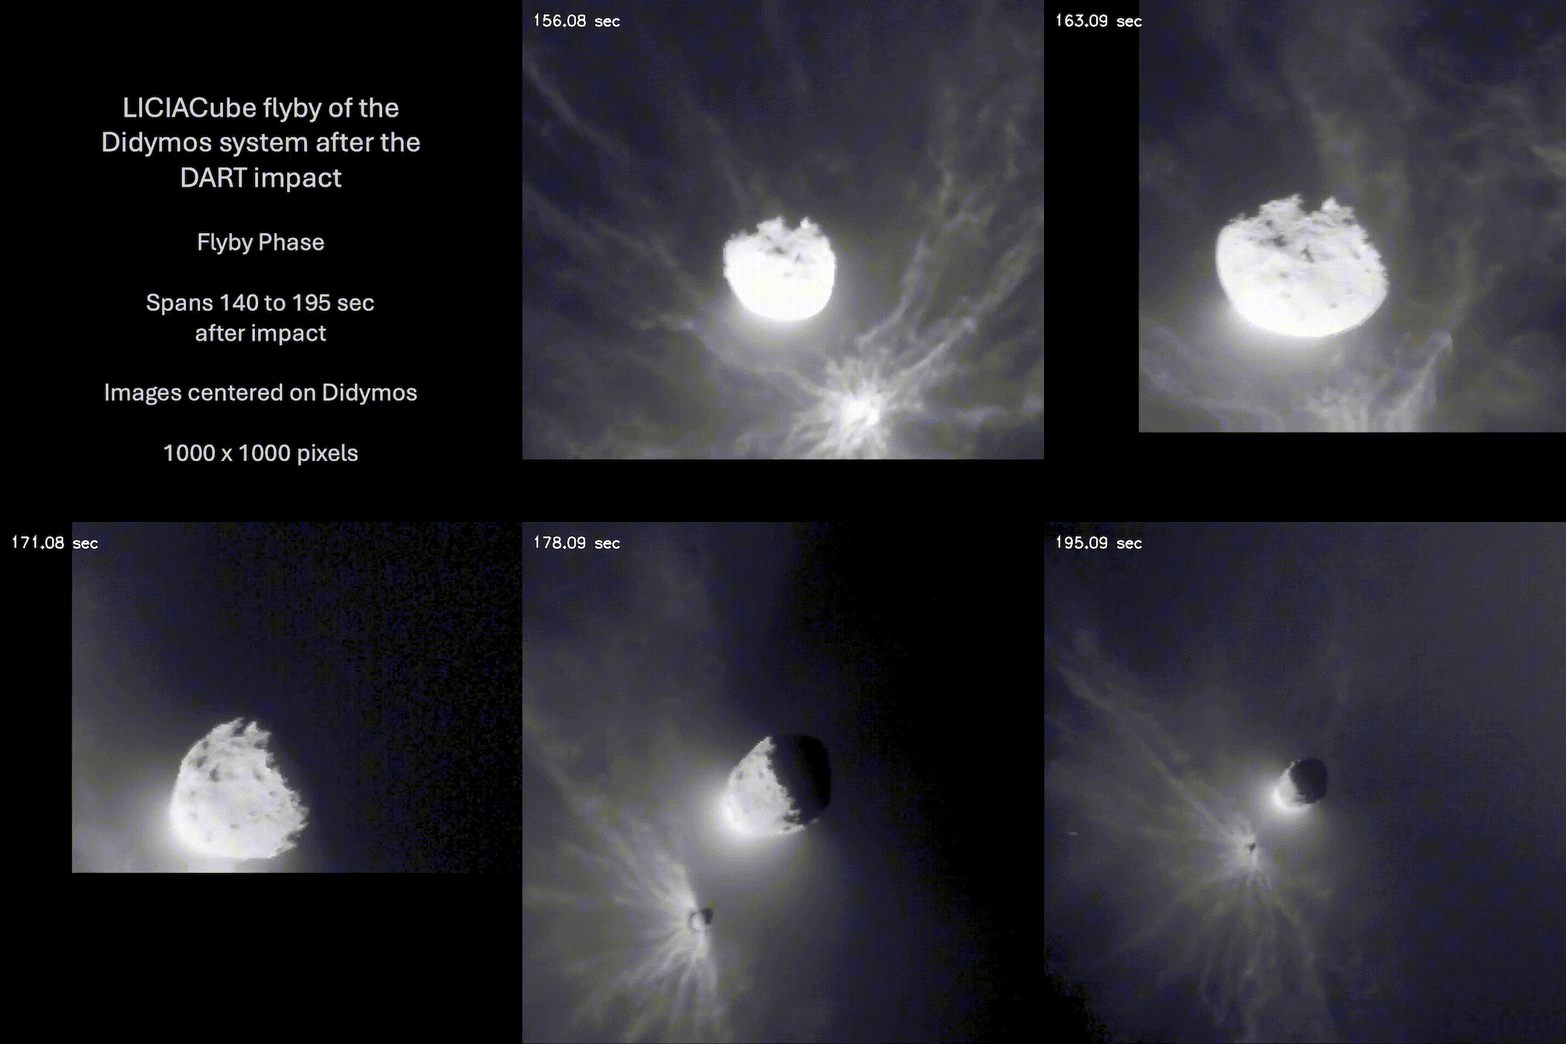
Figure 1: Animated sequence of images taken by LICIACube as it flew past Didymos and Dimorphos a few minutes after impact by the DART spacecraft. The image is centered on Didymos with the smaller Dimorphos visible for most of the flyby. Large plumes of ejected material are visible, radiating out from the impact site where a very deep crater likely formed. Video provided by the author and subsequently converted to GIF and slowed for use in this bite. [Farnham et al. 2025]
Boulders, Boulders Everywhere!
You can say that DART really made an impact — pun intended. It kicked up a lot of material as it struck Dimorphos. In some parts the ejecta plumes are dense enough to block sunlight and even cast shadows on Dimorphos. In the images, like the one seen in Figure 2, the authors were able to make out more than 100 boulders, some as big as 3.6 meters in radius. Tracking the boulders allowed them to calculate velocities and their contribution to the momentum budget. Some of the boulders were ejected at speeds up to nearly 200 kilometers per hour and carried almost as much momentum as the DART craft itself.

Figure 2: The image shows part of the ejected material from the DART impact on Dimorphos at 2 minutes and 40 seconds after impact. A number of boulders are highlighted as they are tracked through the sequence of images from the LICIACube. The boulders are not uniformly distributed but mostly clustered in two distinct populations, with the South Cluster containing around 70% of the measured objects. [Farnham et al. 2025]
The authors also found that the boulders are clustered, suggesting that they were ejected in preferred directions. They conclude that this non-uniform distribution likely changed Dimorphos’s orbital plane. Additionally, the momentum imparted by boulder ejection also likely altered the rotational state of the asteroid, making it tumble around in its orbit.
So what happened? Although there are no constraints on their actual points of origin, the authors suggest that a likely scenario might be that the ejected rocks are the shattered pieces of two large boulders that were seen in some of the last images from the DART spacecraft itself. The two boulders on the surface — named Bodhran and Atabaque after their drum-like shapes — were likely struck by the solar panels as seen in Figure 3.
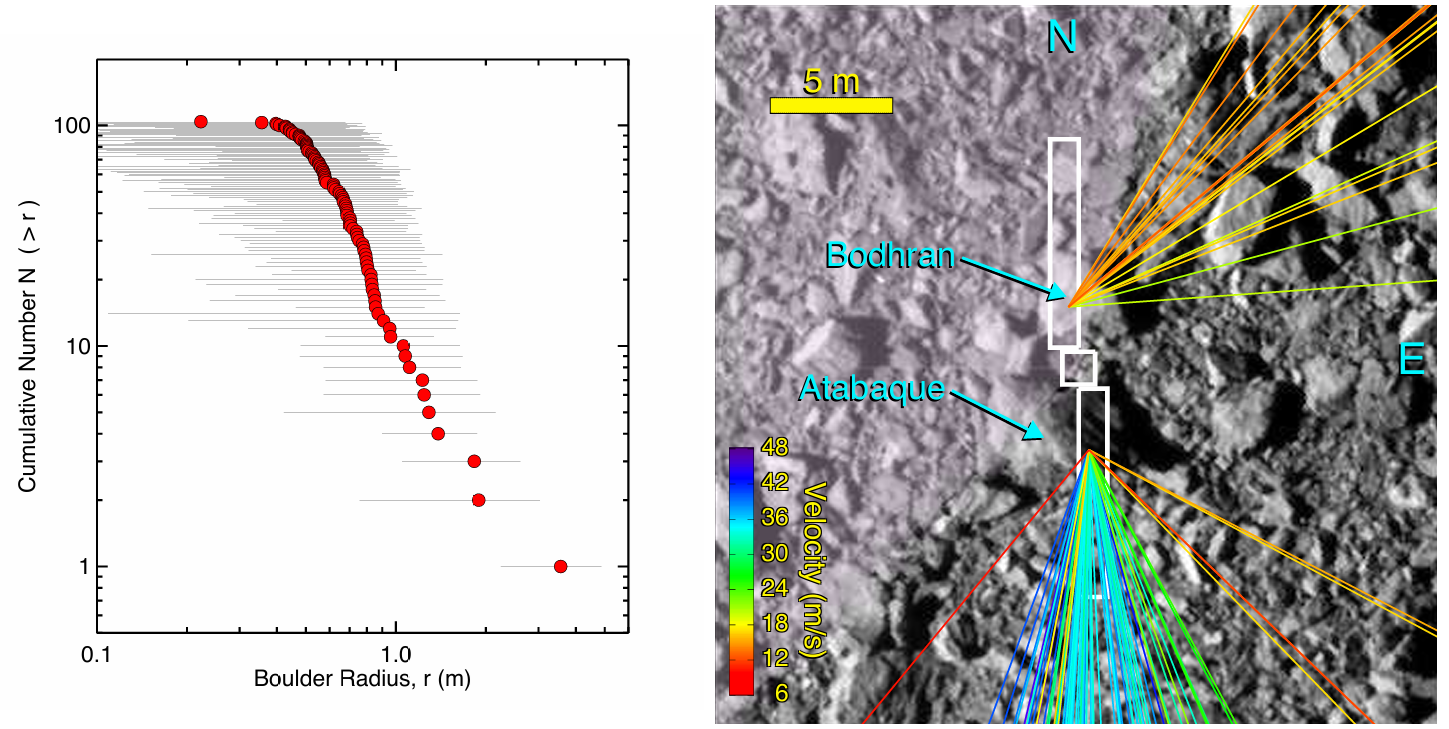
Figure 3: The right side of the figure shows the impact site for the DART spacecraft just before it hit the surface. The outline of the craft is superimposed on top with the main bus of the craft and with two extended solar panels. Also shown are the authors’ estimated paths for the 104 boulders tracked. They may be the remains of two surface rocks that were shattered upon impact. To the left is the radius distribution for the boulders that were tracked in the study. [Farnham et al. 2025]
The European Space Agency’s Hera mission, now en route and arriving in 2026, aims to carry out an in-depth post-impact analysis. It could determine if Dimorphos is tumbling in its slightly modified orbit and help assess the momentum transfer from the impact debris. All this will contribute to a better understanding of just how much the impact changed the asteroid’s orbit and how much more momentum came from the ejected material than was contributed by the DART spacecraft to Dimorphos. These data will be key to refining asteroid deflection strategies in the case that we might need them in the future. After all, the dinosaurs didn’t have any, and look where it got them!
Original astrobite edited by Chloe Klare.
About the author, Kasper Zoellner:
I have a Master of Science in astronomy and I am currently working towards a PhD in physics and educational science. My greatest passion is the search for exoplanets and how stellar variability may influence the possibility of life. I am also interested in science outreach, education and discussing what sci-fi novel to read next!
The post Shot by the DART and We’re to Blame! Now That Space Rock Won’t Be the Same appeared first on AAS Nova.
]]>
Researchers may have untangled the complex origins of the two black holes involved in a recent massive collision.
The post A Black Hole Family Tree appeared first on AAS Nova.
]]>Black holes can have messy family histories, and a recent massive merger challenged astronomers to sort out just how many generations of black holes were involved in the event. Recent research, however, may have untangled the lineages of the two progenitors.
A Massive Collision
Earlier this year, the Laser Interferometer Gravitational-Wave Observatory (LIGO) detected the ripples in spacetime caused by the merger of two black holes somewhere in the distant universe. Though these detections have become increasingly common, this one in particular stood out among the more than 200 reported over the last decade. Named GW231123, this event must have caused more of a splash than a ripple since the two black holes that slammed together were unusually massive; both likely weighed more than 100 times the mass of the Sun. Not only that, each was also spinning unusually rapidly prior to the collision.
LIGO Livingston, one of the two LIGO detectors. [Caltech/MIT/LIGO Lab]
Merger Mystery
This result was celebrated as evidence of so-called “hierarchical formation,” in which black holes formed in dense environments swarm throughout their star clusters, merging with other black holes they encounter and growing ever larger.
However, there were a couple of complications with this picture. For one, theory predicts that it is challenging to form such rapidly spinning black holes from randomly oriented progenitors, since usually the spins wash out and leave the remnant rotating slowly. For another, the merging process tends to give the final black hole a “kick” that sends it flying rapidly away from the site of the impact, occasionally fast enough to leave the star cluster altogether, meaning second-generation black holes might not be able to merge into subsequent generations.
A schematic of various potential black hole family trees. The binary-star origin scenario is shown in the green box. Click to enlarge. [Stegmann et al. 2025]
Born as a Pair
New research led by Jakob Stegmann, Max Planck Institute for Astrophysics, suggests a way around each of these problems. In the team’s model, the two black holes involved in the GW231123 merger didn’t form from isolated black holes in a cluster, but rather from binary stars embedded within that cluster. In this picture, two massive stars were born bound together, orbiting one another within a larger cluster of stars. Crucially for this scenario, the massive primordial stars have aligned spins — an expected outcome of massive binary star evolution.
After both stars in the binary collapsed into black holes, these black holes merged to form a rapidly spinning second-generation black hole. This second-generation black hole eventually encountered another black hole within the cluster and merged to produce the ripples in spacetime we observed as GW231123.
Since black holes born within binary systems are expected to have smaller kicks and faster spins, this scenario neatly explains the properties observed in GW231123. As LIGO keeps listening for more black hole mergers, hopefully similar events will provide more chances to untangle their complex family trees.
Citation
“Resolving Black Hole Family Issues Among the Massive Ancestors of Very High-Spin Gravitational-Wave Events like GW231123,” Jakob Stegmann et al 2025 ApJL 992 L226. doi:10.3847/2041-8213/ae0e5f
The post A Black Hole Family Tree appeared first on AAS Nova.
]]>
The gravitational wave events GW241011 and GW241110 provide strong evidence for the growth of black holes through successive mergers.
The post Not Their First Rodeo: Gravitational Wave Detectors Spot Merging Black Holes That Have Merged Before appeared first on AAS Nova.
]]>Meet GW241011 and GW241101, two events from the fourth observing run of the LIGO, Virgo, and KAGRA (LVK) gravitational wave detectors. With rapid spins and mismatched black hole masses, both events provide strong evidence for black hole growth through hierarchical mergers.
Masses of black holes and neutron stars discovered via gravitational waves (blue and orange circles). The red and yellow circles show the black holes and neutron stars detected through electromagnetic means. Click to enlarge. [LVK/A. Geller/Northwestern]
A Decade of Discovery
Humanity is 10 years into its study of the gravitational wave universe, and detectors across the globe are about to wrap up their fourth observing run. The recently released fourth catalog of gravitational wave transients, GWTC-4.0, more than doubles the number of recorded events.
Today, we’re taking a look at two of the fourth observing run’s gravitational wave events, both of which point to black holes born in dense environments.
Two Detections in the Spotlight
GW241011 and GW241101 are gravitational wave signals that reached Earth in late 2024. Using Bayesian parameter estimation, members of the LVK collaboration determined that each of these two signals arose from the merger of a pair of black holes.
Posterior distributions for the primary black hole’s spin magnitude for GW241011 (left) and GW241101 (right). [LIGO, Virgo, and KAGRA Collaborations 2025]
GW241101 flips the script: its primary black hole also spins rapidly, but it appears to do so in a direction opposite from the direction in which the black holes orbit. Though its spin isn’t measured as precisely as that of the primary black hole in GW241011, this event still provides the best evidence so far that the spins of some merging black holes are misaligned with their orbital motion.
In addition to their standout spin parameters, these events are also remarkable for the masses involved. In both cases, the larger black hole has a mass of 15–20 solar masses, and the smaller black hole is significantly smaller — about 6 solar masses for GW241011 and 8 solar masses for GW241101.
A Black Hole Genealogy Project
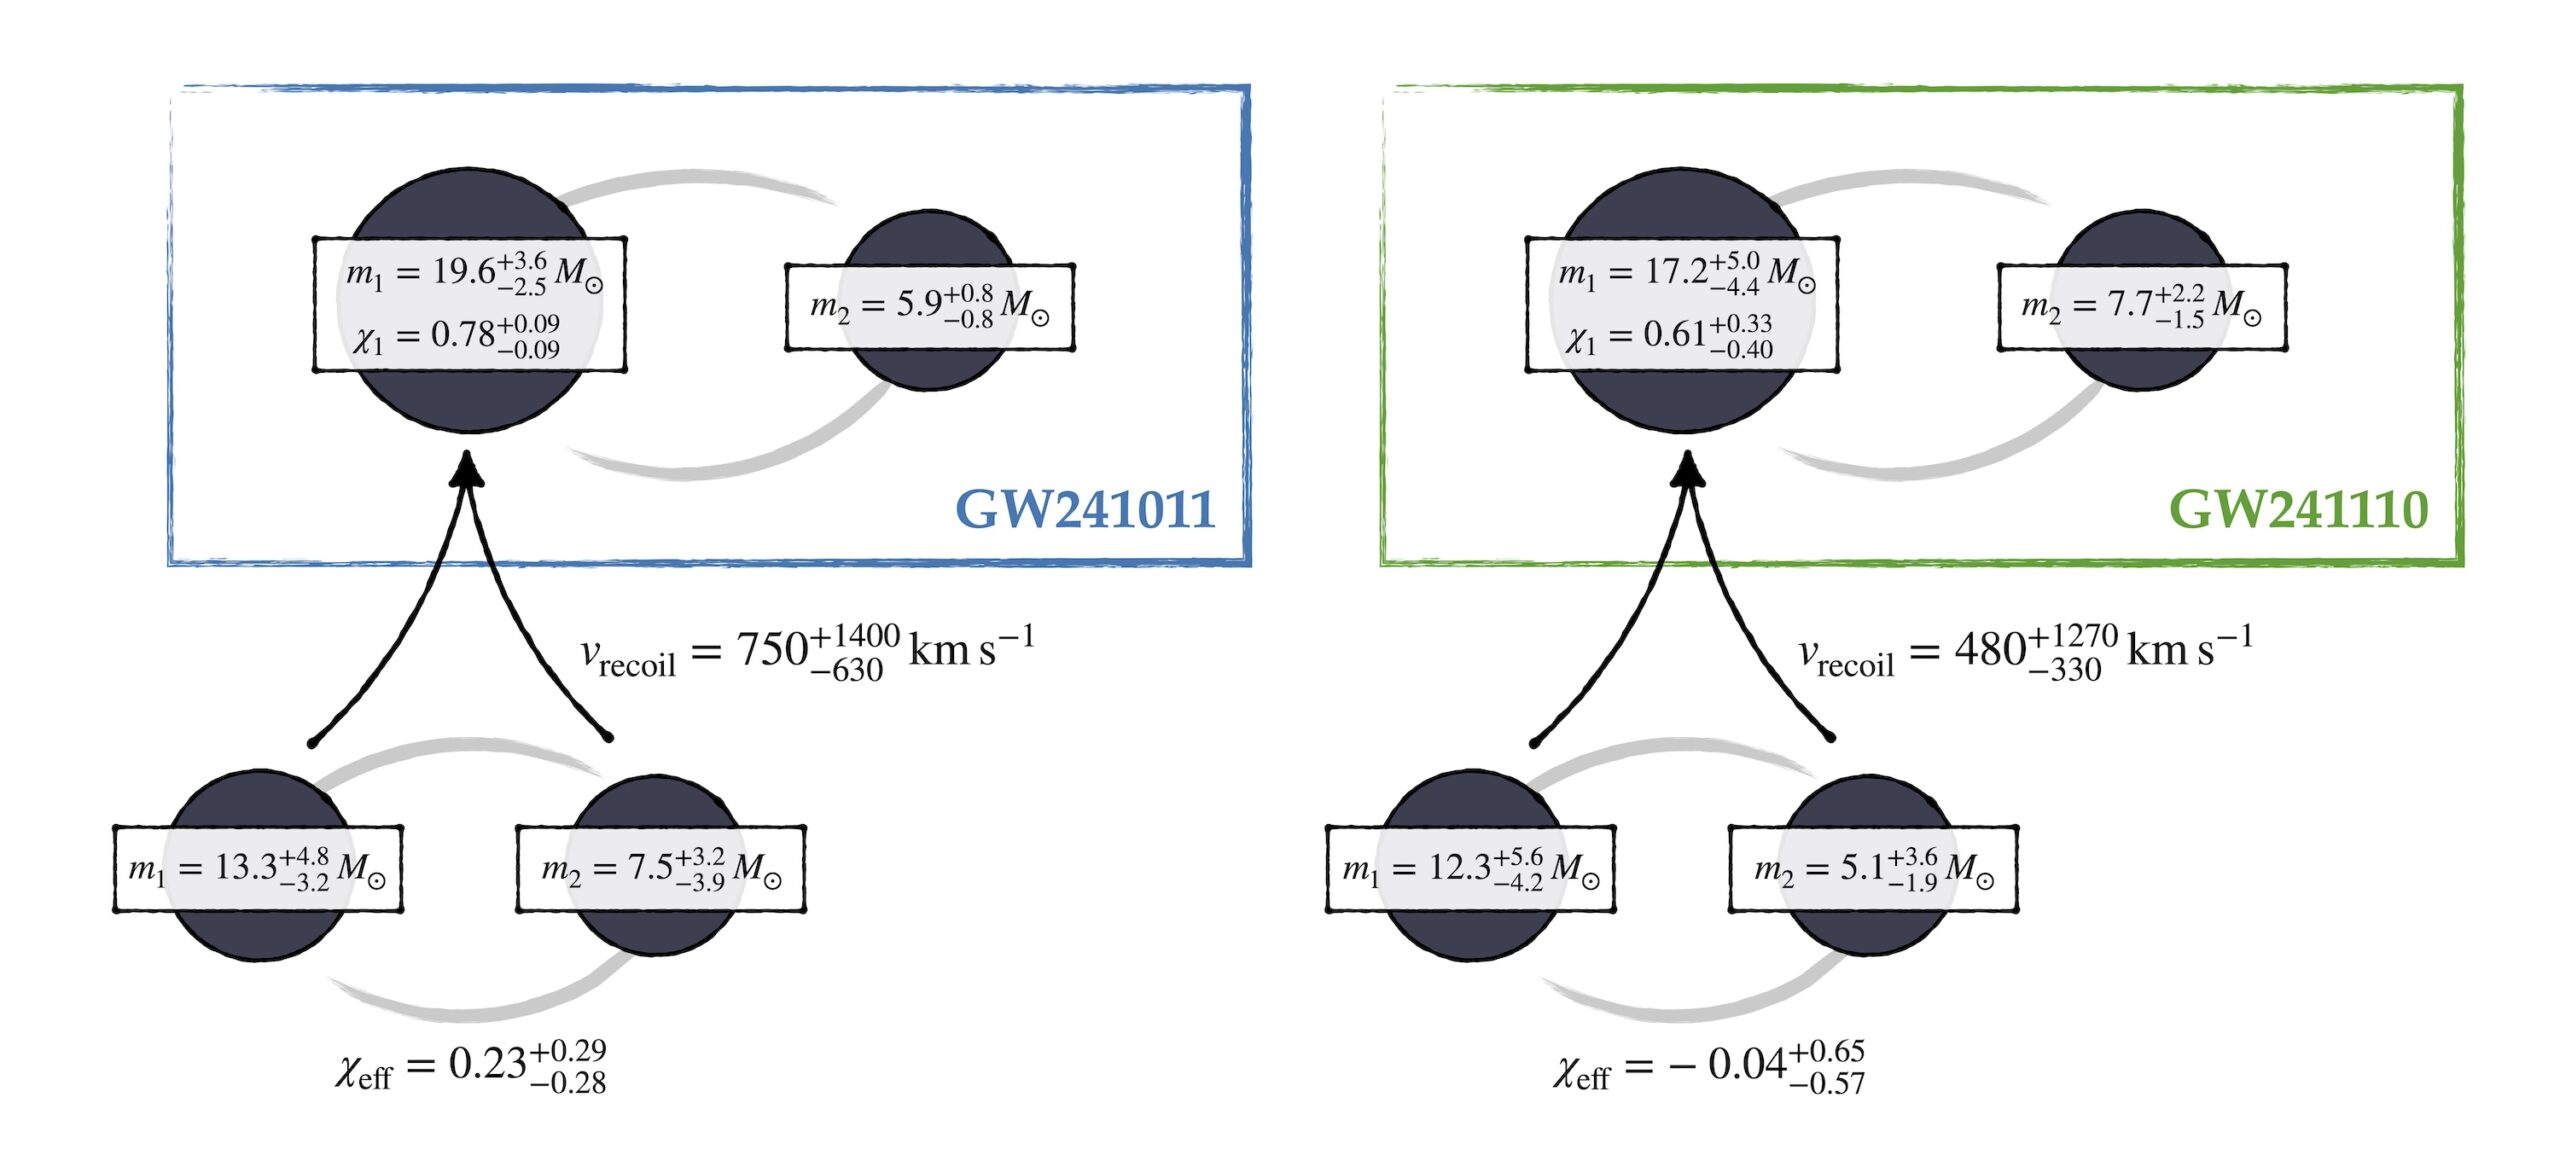
Inferred masses and spins of the ancestors of the primary black holes of GW241011 and GW241101. Click to enlarge. [LIGO, Virgo, and KAGRA Collaborations 2025]
If these signals arose from hierarchical mergers, that tells us something about the environment in which the black holes lived. When two black holes merge, the product is expected to spin rapidly and receive a “kick.” For a black hole pair in a loose grouping of stars, this kick would likely boot the merger product out of the group, preventing it from encountering other black holes and merging again.
But in dense environments like compact star clusters, even a good strong kick isn’t enough to overcome the cluster’s escape velocity and launch the resulting black hole on a lonely journey through space. Instead, these black holes are retained in the dense cluster environments of their birth, where they may dance and merge with another black hole partner. While it’s not possible to entirely rule out other origins, such as an isolated pair of massive binary stars, the data strongly support the hierarchical merger scenario.
This discovery yet again demonstrates the ability of our gravitational wave detectors to reveal the lives and histories of black holes throughout our universe. Stay tuned for even more black hole news from the current observing run!
Citation
GW241011 and GW241110: Exploring Binary Formation and Fundamental Physics with Asymmetric, High-Spin Black Hole Coalescences,” A. G. Abac et al 2025 ApJL 993 L21. doi:10.3847/2041-8213/ae0d54
The post Not Their First Rodeo: Gravitational Wave Detectors Spot Merging Black Holes That Have Merged Before appeared first on AAS Nova.
]]>
Astrobites reports on the impact of galactic outflows on the formation of stars in the local starburst galaxy Messier 82.
The post Outflows, Shocks, and Star Formation in Messier 82 appeared first on AAS Nova.
]]>Editor’s Note: Astrobites is a graduate-student-run organization that digests astrophysical literature for undergraduate students. As part of the partnership between the AAS and astrobites, we occasionally repost astrobites content here at AAS Nova. We hope you enjoy this post from astrobites; the original can be viewed at astrobites.org.
Title: Stars Born in the Wind: M82’s Outflow and Halo Star Formation
Authors: Vaishnav V. Rao et al.
First Author’s Institution: University of Michigan
Status: Published in ApJ
Outflows and Star Formation
Some galaxies, known as starburst galaxies, form stars at exceptionally high rates. High star formation rates mean, you guessed it, lots of new stars! The most massive stars live comparatively short lives and can die in a brilliant cosmic explosion known as a supernova. So, when you have a starburst galaxy, you get lots of young stars, a fraction of which produce supernovae. While these stellar explosions occur on relatively small scales, they can collectively drive galactic-scale expulsions of gas and dust known as outflows.
Outflows expel gas laden with metals out of the galaxy, playing a pivotal role in the evolution of galaxies. They can also drive additional star formation in the areas surrounding the galaxy, which is exactly what today’s authors are interested in. Messier 82 (M82), a quintessential local starburst galaxy, is the focus of today’s article (see Figure 1). M82’s proximity makes its spectacular outflows a prime testing ground for studying the impact of outflows on a galaxy and its surroundings.

Figure 1: An image of the local starburst galaxy M82, taken by the Subaru Telescope. The Hubble Space Telescope field encompassing the Southern Arcs is highlighted as a green box. [Rao et al. 2025]
The Southern Arcs of M82
The main focus of today’s article are arc-like groups of stars called the Southern Arcs that are located near M82’s southern outflow. Using photometry from the Hubble Space Telescope, today’s authors derive star formation histories for the Southern Arcs, with the goal of understanding the impact that M82’s outflows have had on star formation in its halo. Figure 1 shows the Southern Arcs region of M82 highlighted in green alongside an image of M82.
Star Formation Histories
If you’ve ever taken an astronomy class, you’re probably familiar with the Hertzsprung–Russell (HR) diagram. HR diagrams are one of the most powerful tools available to astronomers, as they encode a ton of information regarding populations of stars and their formation. In practice, astronomers can construct HR diagrams using resolved stellar populations. That is, if you can resolve individual stars in a galaxy, you can construct a color–magnitude diagram, which is essentially the HR diagram you may be familiar with, but uses observed properties as a proxy for temperature (color) and luminosity (magnitude).
Today’s authors use the color–magnitude diagrams of the Southern Arc to derive star formation histories for the region. Star formation histories describe the star formation rate as a function of time, providing an insight into when and how stellar populations formed. To derive the Southern Arc star formation histories, the authors use the MATCH color–magnitude diagram fitting code, which determines the combination of stellar populations that reproduce the observed color–magnitude diagram, accounting for observational biases along the way. Figure 2 shows the star formation histories obtained using three different stellar evolution models. The authors find that about 85% of the stellar mass in the Southern Arc field formed sometime between 70 and 150 million years ago before star formation slowed down. About 30 million years ago, star formation picked up again, producing the rest of the stellar mass in the Southern Arc field.

Figure 2: The star formation history (left) and cumulative star formation history (right) of the Southern Arc region. Different stellar evolutionary models are marked in different colors. The star formation history shows the star formation rate as a function of time, while the cumulative star formation history shows the buildup of the stellar mass as a fraction of the total mass observed now. [Rao et al. 2025]
So, What’s the Deal with the Southern Arcs?
The authors explore two mechanisms that could explain the star formation histories. In the first scenario, M82’s outflows trigger star formation when impacting the cooler circumgalactic gas. When the outflow shocks collide with the cooler gas, it causes it to collapse and form stars. In the second scenario, star formation is occurring within the outflows themselves. Figure 3 is a schematic of the two proposed mechanisms.

Figure 3: A schematic outlining the two possible mechanisms for the formation of the Southern Arcs. The left panel shows the scenario in which shocks produced by the outflow collide with gas in the circumgalactic medium, triggering star formation. The right panel shows the scenario in which star formation is triggered within the outflow itself. [Rao et al. 2025]
Original astrobite edited by Jessie Thwaites.
About the author, Drew Lapeer:
Drew is a first-year PhD student at the University of Massachusetts Amherst. They are broadly interested in the evolution of galaxies, with a focus on the impact of cosmic feedback on the galactic ecosystem. In their free time, they enjoy reading, rock climbing, hiking, and baking!
The post Outflows, Shocks, and Star Formation in Messier 82 appeared first on AAS Nova.
]]>
New research suggests that giant planets likely ring like bells after they collide with other worlds.
The post Planets Can Be Bells: The Aftermath of Major Mergers appeared first on AAS Nova.
]]>What would happen to a gaseous exoplanet if it was struck by a protoplanet? Recent research suggests that it would ring like a bell, and that just maybe, we’d be able to observe this ringing back on Earth.
Heavy Metal Mystery
Previous studies have hinted that giant planets have more heavy elements in their cores than we’d expect if they had formed from the exact same stew of gas and dust as their host stars. How exactly they end up with these enriched compositions is something of a mystery, though. Astronomers have proposed two potential theories: one somewhat dull, and one that involves dramatic collisions between the massive protoplanets.
In the first case, perhaps growing giant planets clear out the gas along their orbits, then steadily and quietly accrete the dust that spills over into the gaps. In the latter case, theorists have conjured a model in which growing gas giant planets repeatedly collide and merge with large and somewhat rocky protoplanets. Both of these mechanisms would produce the enhanced heavy element contents observed today, so how can we tell these two paths apart? Recent work by a team led by J.J. Zanazzi (University of California, Berkeley) proposes one such test.
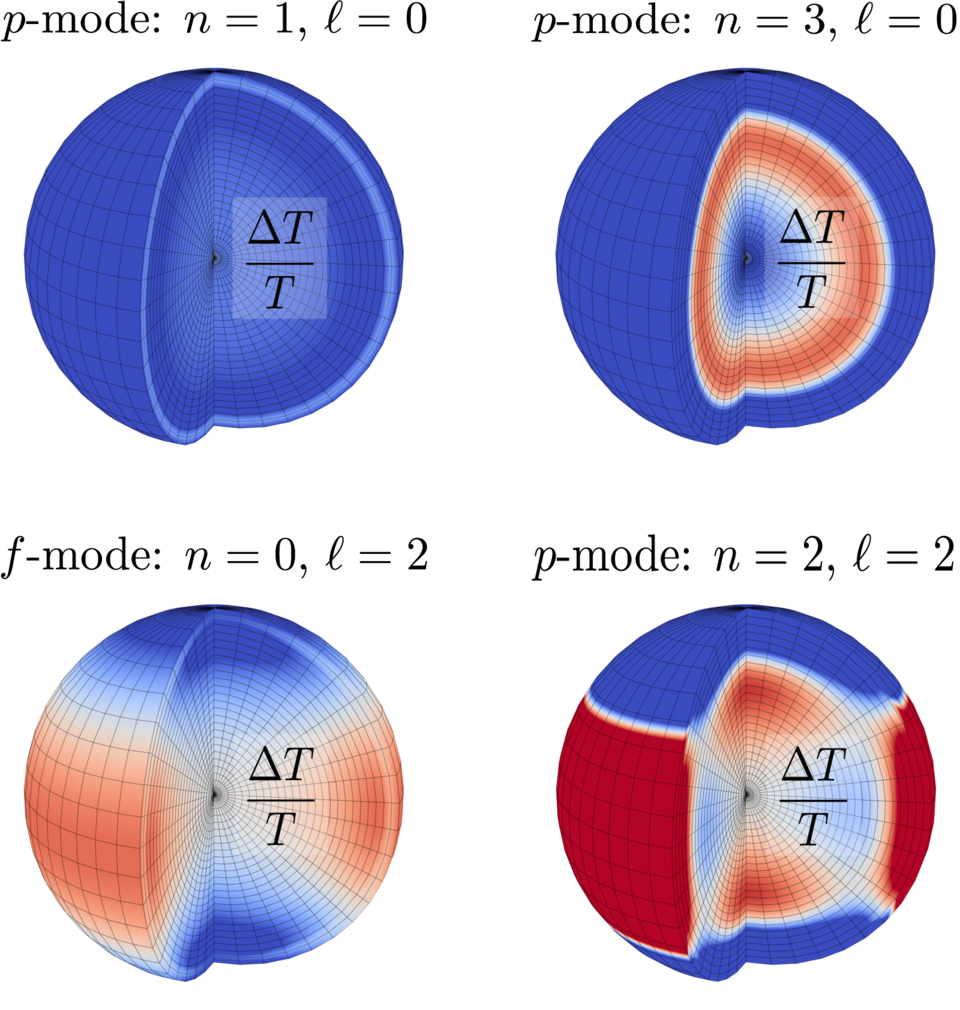
An illustration of the different oscillation modes within a gas giant after it’s struck by a protoplanet. [Zanazzi et al. 2025]
Ringing Planets
Through mathematical derivations, the researchers demonstrate that if a gas giant were to collide with a protoplanet, the impact would cause the planet’s surface to physically oscillate inwards and outwards, and for its surface temperature to vary. In other words, the planet would “ring” like a bell struck with a hammer, and as it physically convulses in the aftermath of the merger it would grow brighter and fainter in a repeating, periodic pattern. In principle, if the ringing lasts for long enough and the oscillations in brightness were large enough, observers back on Earth could record the amplitude and period of the changes and back out some constraints on what had happened and when.
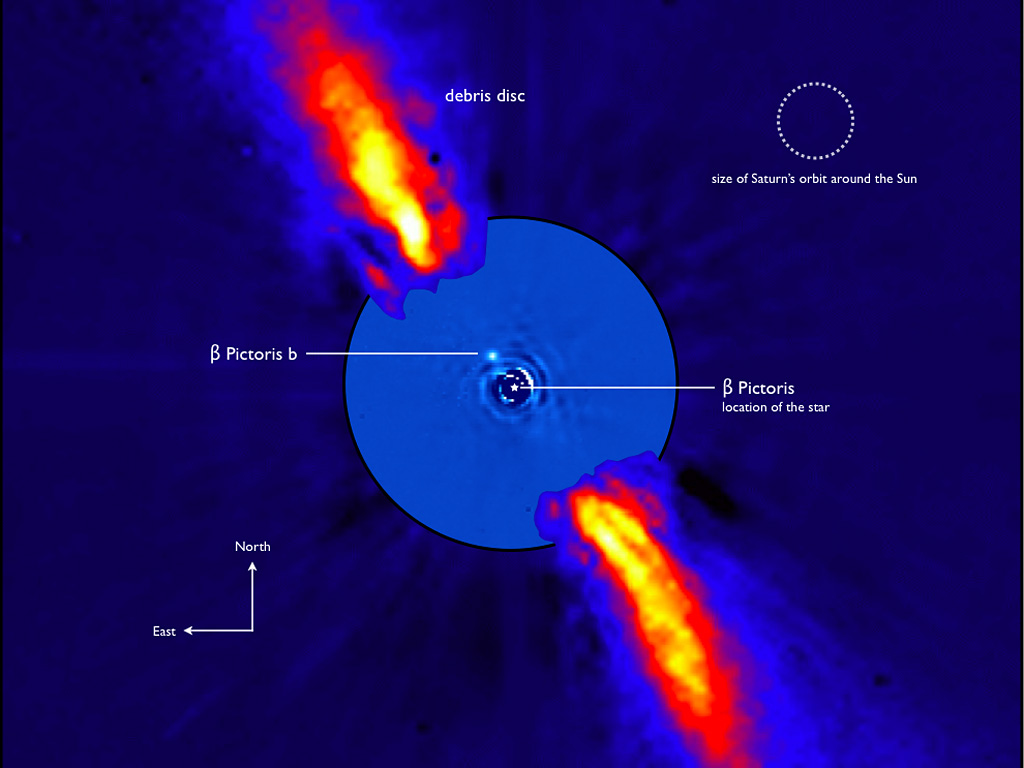
An image of Beta Pictoris, including the young gas giant Beta Pictoris b and the surrounding debris disk. Click to enlarge. [ESO/A.-M. Lagrange et al.; CC BY 4.0]
Beta Pictoris b is a young planet in a system that’s still forming, and it orbits its host star on an eccentric path that takes it through dense regions of the disk. Hopefully, future observations will test whether this treacherous path produced any massive collisions in the relatively recent past. Until then, though, we can all enjoy charming visions of massive planets colliding with one another and ringing through the night.
Citation
“Seismic Oscillations Excited by Giant Impacts in Directly Imaged Giant Planets,” J. J. Zanazzi et al 2025 ApJ 993 3. doi:10.3847/1538-4357/ae04ec
The post Planets Can Be Bells: The Aftermath of Major Mergers appeared first on AAS Nova.
]]>
Gaia19bxc appears to contain a magnetic white dwarf and a metal-poor star in theory-defying close quarters — a configuration seen for the first time in a cataclysmic variable system.
The post Shortest-Period Polar Cataclysmic Variable Discovered appeared first on AAS Nova.
]]>Astronomers have discovered the most compact cataclysmic variable system containing a strongly magnetized white dwarf. The extreme closeness of the system suggests that the companion may be a metal-poor star — the first time such a star has been paired with a strongly magnetized white dwarf.
Meet the Cataclysmic Variable
Cataclysmic variables are binary star systems that contain a white dwarf and a companion star in uncomfortably close quarters. In these systems, the companion star transfers gas to the white dwarf, resulting in sudden, irregular, and often repeated outbursts as the stolen gas ignites on the scorching surface of the white dwarf.
These bound-together stars typically orbit one another on orbits ranging from about 80 minutes to 10 hours. Though theorists place the minimum orbital period around 76 minutes, a handful of cataclysmic variable systems have cropped up with periods below this limit. The systems that have limboed under the limit are thought to have stellar companions that are more compact than typical main-sequence stars, allowing the white dwarf to nestle in closer.
Exploring Below the Limit
Discovered in 2019 by the Gaia spacecraft, Gaia19bxc is a cataclysmic variable that fluctuates with a period of 64.42 minutes. If this variability is linked to the orbital period of the system, that would place it well below the theoretical minimum period. Adding to the intrigue, early observations also hinted that Gaia19bxc’s white dwarf is strongly magnetic, making the system what’s called a polar. In polar systems, the white dwarf’s magnetic field diverts the accreted matter toward the white dwarf’s poles as it is collected, rather than into a disk around the white dwarf’s equator.
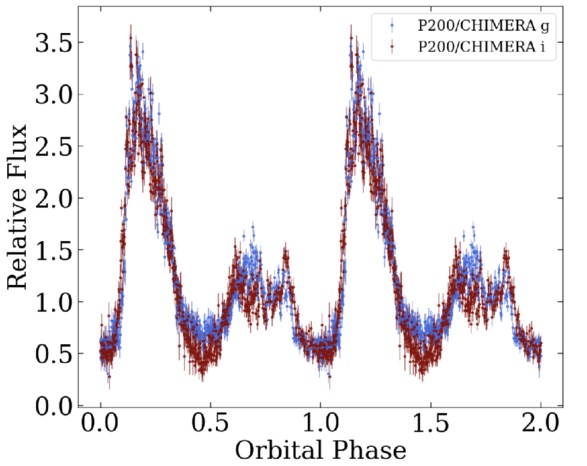
Phase-folded light curves for Gaia19bxc from the Caltech HIgh-speed Multi-colour camERA (CHIMERA) on the Hale Telescope. The double-peaked light curve is evidence for cyclotron beaming, which occurs in strongly magnetized white dwarfs. [Adapted from Galiullin et al. 2025]
The team’s analysis confirmed that the stars of Gaia19bxc orbit one another every 64.42 minutes, cementing the system’s place below the period minimum for typical cataclysmic variables. The system’s double-peaked light curves and evidence for an accretion stream — rather than an accretion disk — confirm the system’s polar nature, implying a magnetic field strength greater than 10 million Gauss. This makes Gaia19bxc the most closely orbiting system to contain a strongly magnetized white dwarf.
A Sign of Discoveries to Come
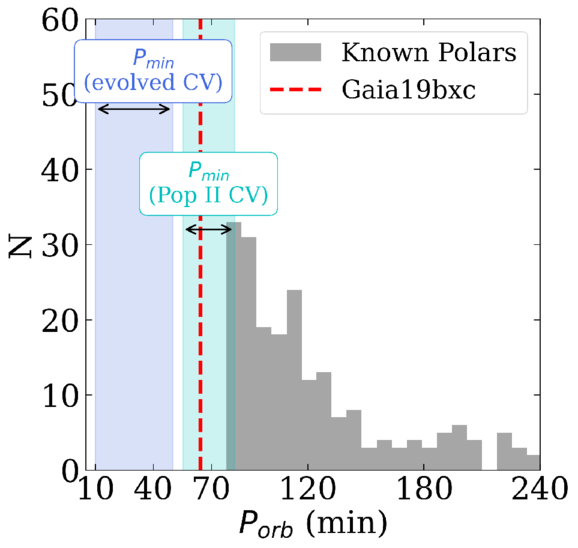
Gaia19bxc’s orbital period compared to known polar cataclysmic variables (gray) as well as the theorized minimum periods for systems containing a metal-poor (Pop II) companion (cyan) and an evolved companion (blue). [Galiullin et al. 2025]
Galiullin and coauthors saw no evidence for metal lines in Gaia19bxc’s spectrum, nor did they see spectral features arising from a hot companion star. These findings suggest that the companion is an old, cool, compact, metal-poor star, which would make Gaia19bxc the first known polar to contain a metal-poor star. It’s also one of only a handful of cataclysmic variables to contain a metal-poor star and be below the theoretical period minimum.
Though Gaia19bxc is currently in a class of its own, it may not be for long; with the start of the Vera C. Rubin Observatory’s Legacy Survey of Space and Time rapidly approaching, many more cataclysmic variable systems as faint as or fainter than Gaia19bxc may soon be discovered.
Citation
“Optical Spectroscopy of the Most Compact Accreting Binary Harboring a Magnetic White Dwarf and a Hydrogen-Rich Donor,” Ilkham Galiullin et al 2025 ApJL 990 L57. doi:10.3847/2041-8213/adff82
The post Shortest-Period Polar Cataclysmic Variable Discovered appeared first on AAS Nova.
]]>
Astrobites reports on the possibility of merging black holes producing flares within the accretion disks surrounding active supermassive black holes.
The post Following Up on Flares: Can We Spot Black Hole Mergers in Active Galactic Nucleus Disks? appeared first on AAS Nova.
]]>Editor’s Note: Astrobites is a graduate-student-run organization that digests astrophysical literature for undergraduate students. As part of the partnership between the AAS and astrobites, we occasionally repost astrobites content here at AAS Nova. We hope you enjoy this post from astrobites; the original can be viewed at astrobites.org.
Title: Tracing the Light: Identification for the Optical Counterpart Candidates of Binary Black Holes During O3
Authors: Lei He et al.
First Author’s Institution: University of Science and Technology of China
Status: Published in ApJ
Since the first detection of gravitational waves about a decade ago, gravitational wave science has been the gift that keeps on giving (for example, check out GW231123, announced earlier this year). It is also a field where more questions with unknown answers just keep coming. A key question at the forefront of gravitational wave science is about formation channels: how does the population of black holes seen through the LIGO–Virgo–KAGRA (LVK) detectors form? The two most popular of these formation channels are the “isolated binary” channel, wherein two stars of a binary stellar system each form black holes that then merge, and the “dynamical” formation channel, wherein two stars in a dense stellar cluster (usually a nuclear star cluster) become black holes and merge just through chance and the denseness of the environment they are in.
More recently, a third channel has been gaining popularity: the active galactic nucleus (AGN) disk channel. An AGN disk is a large disk of hot gas that surrounds a supermassive black hole in the center of a galaxy. The disk helps address two potential issues with stellar-mass binary black hole mergers that could pose a problem for the other two formation channels: delay time and mass. The delay time is the time between when the binary system forms and when the two black holes merge. By putting the system into the denser gaseous environment of an AGN disk, the orbits of the black holes decay faster, allowing the merger to happen on a quicker timescale. Regarding mass, the LVK detectors have detected mergers with masses above what would be expected from stellar-mass black holes alone, the so-called “lite” intermediate-mass black holes. One potential avenue through which these “lite” intermediate-mass black holes may form is in the gaseous disks of AGNs, where they can accrete material and gain mass before merging.
One potential astronomical benefit of a binary black hole merger happening inside the gaseous disk of an AGN is that the merger could disturb this disk and spark a flare of light. If we could spot such a flare and tie it to a gravitational wave event, we would then have both gravitational wave and electromagnetic observations of the same event. Prior research has suggested that some AGN flares detected by the Zwicky Transient Facility (ZTF) might be linked to binary black hole mergers observed during LIGO–Virgo’s third observing run. Today’s authors revisit this possibility by using additional years of data from ZTF combined with the public data through the third observing run.
The authors re-analyzed seven candidate flare–gravitational wave pairs originally flagged during the third observing run (see Figure 1). They examined each AGN’s long-term light curve from data from ZTF, looking for repeated flaring that might indicate a variable AGN rather than a one-time merger-driven flare. Using a Bayesian framework and an approach called Gaussian processes, they calculated the probability that each optical flare was physically connected to a specific gravitational wave event, considering both the spatial and temporal alignment of each of the two signals. Their framework allowed them to calculate a value they dub pflare, which is the probability that a given flare is indeed a genuine flare rather than a characteristic of the variability intrinsic to the AGN itself.
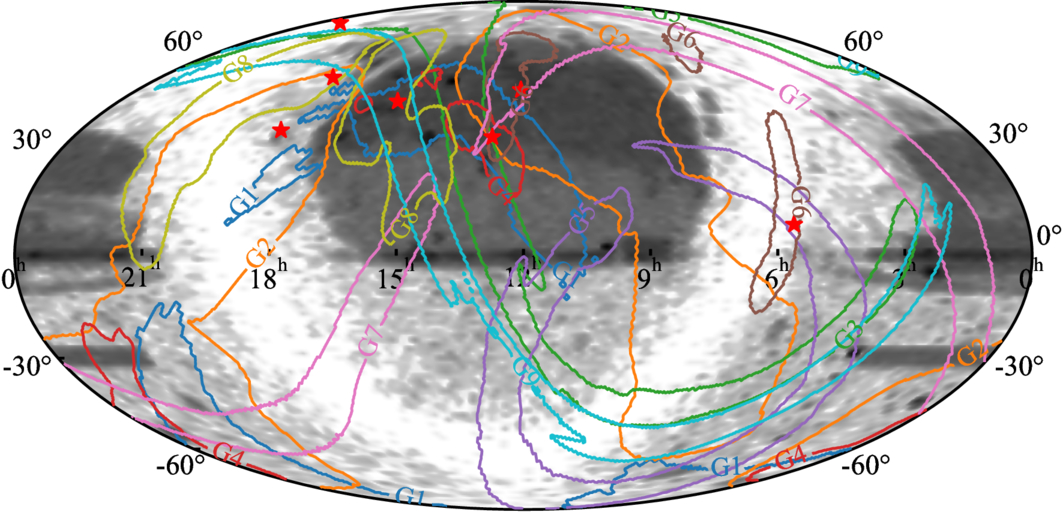
Figure 1: Sky localization of the seven AGN systems analyzed in this work. Red stars represent the locations of the AGNs with suspected flares, and colored lines represent the nine potential gravitational wave events that may be associated with each AGN flare. The white/black background represents the density of the distribution of AGNs in the Million Quasar Catalog. [He et al. 2025]
The authors take this result one step further. One primary application of combining gravitational wave and electromagnetic signals is an independent measurement of the Hubble constant. The most straightforward way to measure the Hubble constant is to measure both the recessional velocity and the distance to a single source. Multi-messenger astronomy provides a straightforward approach to this, as the redshift can be determined from electromagnetic observations and the distance from gravitational wave observations. (GW170817 is a notable example of this.)
The authors show how this could be applied to their data using flares. They use the two most promising flare–gravitational wave associations to derive a new estimate of the Hubble constant. By combining the distance inferred from the gravitational wave signal with the redshift of the AGN host galaxy, they obtained a value of the Hubble constant of about 72 kilometers per second per megaparsec (roughly the peak of the green dotted curve on the bottom of Figure 2). This result is consistent with other measurements of the Hubble constant, which are the local distance-ladder measurements from supernovae and the cosmic microwave background estimates from Planck (the two measurements that are often cited as being in tension). The uncertainty from the author’s analysis is still quite large, but it provides a proof of concept. When they included the well-known GW170817 neutron star merger, they obtained a result that is slightly more informative and slightly greater than the result from GW170817 alone.
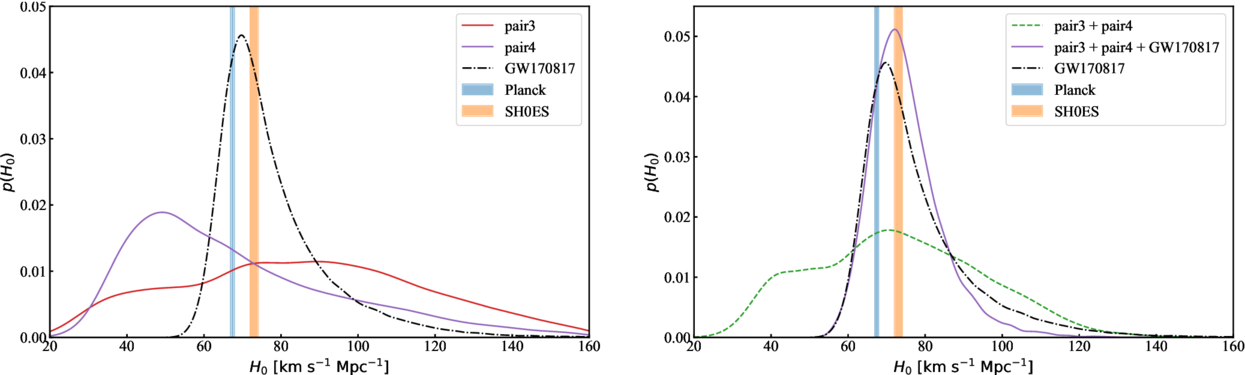
Figure 2: Constraints on the Hubble constant using multiple methods. For both figures, the x-axis represents the inferred value of the Hubble constant, and the y-axis represents the posterior probability of that value using hierarchical Bayesian analyses (for gravitational wave analyses). The vertical orange bands represent the measured value of the Hubble constant with five standard deviations of certainty using the “distance ladder” method as reported by the SH0ES collaboration. The vertical blue bands represent the measured value of the Hubble constant with five standard deviations of certainty by using measurements of the cosmic microwave background with the Planck spacecraft. The dotted black curve (both left and right) represents the posterior distribution of the Hubble constant as measured by the LVK collaboration from the first binary neutron star multi-messenger source, GW170817 (which peaks directly between the other two measurements). The purple and red curves (left) represent the posterior distributions of the two confident AGN/binary black hole pairs in this work, the green curve (right) represents the combined posterior distribution of the two confident AGN/binary black hole pairs in this work, and the solid purple curve (bottom) represents the combined posterior distribution of the two confident AGN/binary black hole pairs with GW170817. [He et al. 2025]
Original astrobite edited by Amaya Sinha.
About the author, William Smith:
Bill is a graduate student in the astrophysics program at Vanderbilt University. He studies gravitational wave populations with a focus on how these populations can help inform cosmology as part of the LIGO Scientific Collaboration. Outside of astrophysics, he also enjoys swimming semi-competitively, music and dancing, cooking, and making the academy a better place for people to live and work.
The post Following Up on Flares: Can We Spot Black Hole Mergers in Active Galactic Nucleus Disks? appeared first on AAS Nova.
]]>
A brown dwarf that made headlines for showing signs of auroral activity is back in JWST's sights — and it's now doubly interesting.
The post A Strange Brown Dwarf Gets Stranger appeared first on AAS Nova.
]]>Isolated brown dwarfs are some of the rarest and hardest to study objects in our stellar neighborhood. Recently, astronomers revealed that one of the most famous isolated brown dwarfs, W1935, is not actually one brown dwarf but two.
Challenging but Fascinating
Astronomers know of only 50 free-floating brown dwarfs within the nearest 200 light-years or so, and even the ones we know about are poorly understood. Since brown dwarfs are frigid compared to their stellar cousins, they consequently shine much less brightly and at longer wavelengths of light. Even taking a picture of these ~500K objects requires long stares with specialized telescopes, and these facilities already have their schedules full supporting a wide range of other areas of research from distant galaxies to exploding supernovae.
An image of Jupiter and its prominent aurora taken with the Hubble Space Telescope. [NASA, ESA, and J. Nichols (University of Leicester); Acknowledgment: A. Simon (NASA/GSFC) and the OPAL team]
Recently, JWST continued its pattern of discovery: the telescope took another look at the brown dwarf W1935, where methane emission was detected for the first time, and again found something surprising.
A New Binary
When JWST first took a look at this brown dwarf, it used its Near Infrared Spectrograph (NIRSpec) to record a spectrum of the object. These data revealed a large spike near 3 microns that perfectly lined up with methane emission from an aurora, similar to what we observe on Jupiter in the solar system. This was a thrilling find, since it hinted at an exciting possibility: Jupiter’s aurora is powered by its nearby moon Io, so the researchers cautiously wondered if W1935’s aurora could be evidence of a companion satellite as well.
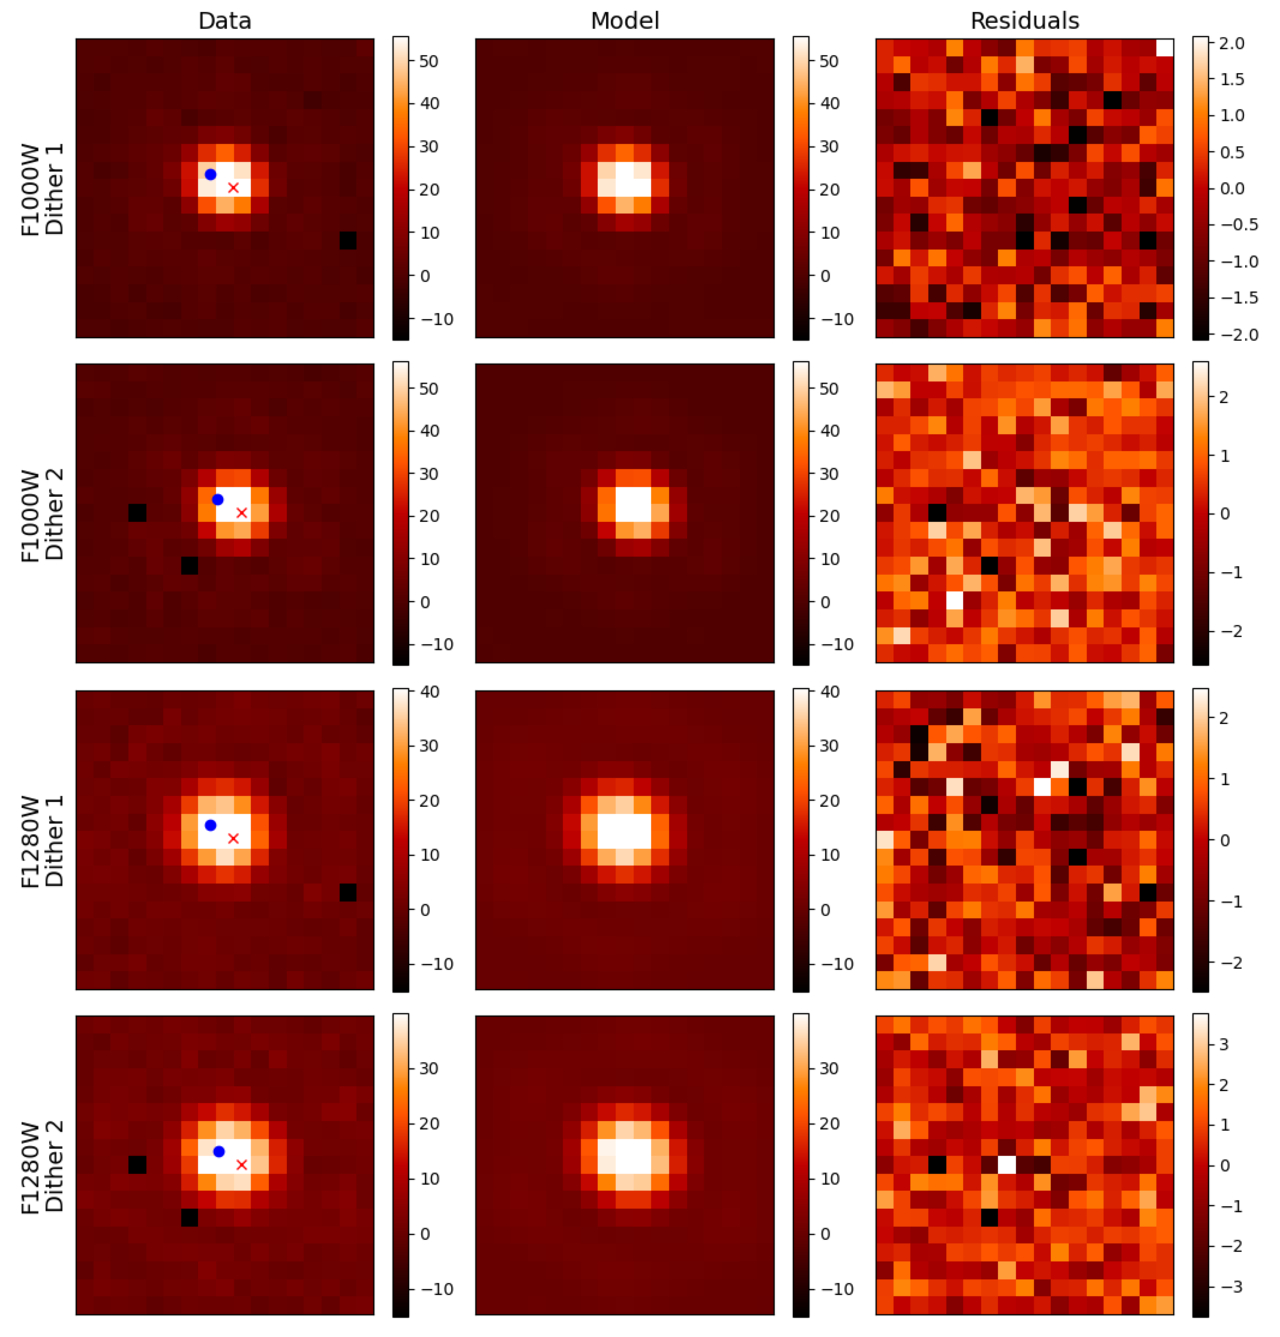
Images of W1935 taken with MIRI (left column), the author’s model for those images (center column), and the residuals (right column). The model includes two nearby point sources that are so close together they appear as one slightly elongated source. Click to enlarge. [De Furio et al. 2025]
Doubly Interesting
This makes W1935 just the second-ever known Y+Y dwarf binary and cements its status as one of the most interesting brown dwarf systems discovered to date. So far, it’s not clear which object is responsible for the auroral signal since the objects are so close together that their images blur together without careful modeling and image processing.
De Furio’s team pointed out that JWST has yet another instrument that could prove useful here: its Integral Field Unit spectrometer within NIRSpec. Should JWST revisit this fascinating system, it could study the aurora’s variability over time, pin it to one specific object within the binary, and hopefully shed some light on whether any moons play a role in the methane emission. Given all we have learned each time JWST has turned to these strange worlds, we can only hope that it will do so again soon.
Citation
“Discovery of the Second Y+Y Dwarf Binary System: CWISEP J193518.59-154620.3,” Matthew De Furio et al 2025 ApJL 990 L63. doi:10.3847/2041-8213/adfee1
The post A Strange Brown Dwarf Gets Stranger appeared first on AAS Nova.
]]>
The tidal disruption event AT 2024tvd happened outside the nucleus of its host galaxy, indicating the presence of a wandering or recoiling massive black hole. What can radio observations tell us about this unusual event?
The post Investigation of the First Radio-Bright Off-Nuclear Tidal Disruption Event appeared first on AAS Nova.
]]>Catastrophic encounters between stars and massive black holes usually take place in the nuclei of galaxies, but not always. Researchers recently reported on the brightest-ever radio emission from an off-nuclear tidal disruption event caused by a wandering or recoiling black hole.
Signature of a Roaming Black Hole
Tidal disruption events occur when a star ventures too close to a massive black hole. The tidal forces of the black hole stretch the star until it’s partially or entirely disrupted, sometimes causing jets or outflows to spray from the shredded star. One thing that often distinguishes a tidal disruption event from the sea of other possible transients is the location, close to the nucleus of a galaxy.
But not all tidal disruption events happen in the center of a galaxy. In rare cases, a massive black hole roaming elsewhere in a galaxy may encounter a star, sending out a tell-tale signal in an unexpected location.
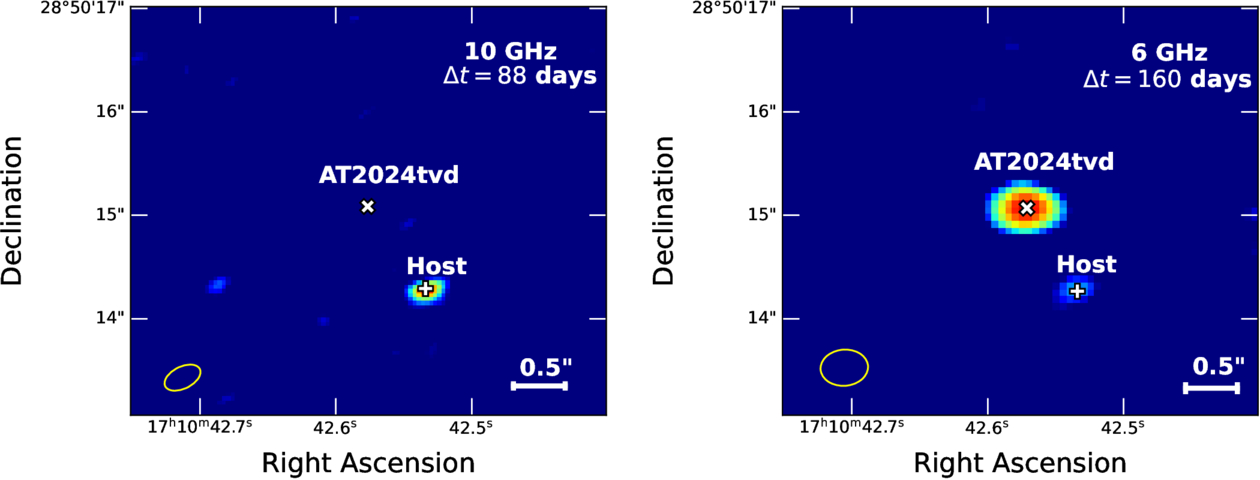
Radio observations of AT 2024tvd on two dates after its optical discovery. The tidal disruption event was not detected at 88 days post-discovery (left) and outshone the center of its host galaxy on 160 days post-discovery (right). Click to enlarge. [Sfaradi et al. 2025]
Radio Reconnaissance
Less than three months after AT 2024tvd was discovered, Itai Sfaradi (University of California, Berkeley) and collaborators launched a months-long radio-wavelength observing campaign using the Very Large Array, the Atacama Large Millimeter/submillimeter Array, the Arcminute Microkelvin Imager Large Array, the Allen Telescope Array, and the Submillimeter Array. Radio observations are critical for investigating jets and outflows from tidal disruption events.
The observations, which spanned centimeter and millimeter wavelengths, revealed two emission peaks from the tidal disruption event. The first peak occurred roughly 131 days after the event was discovered, and the second followed at day 194.
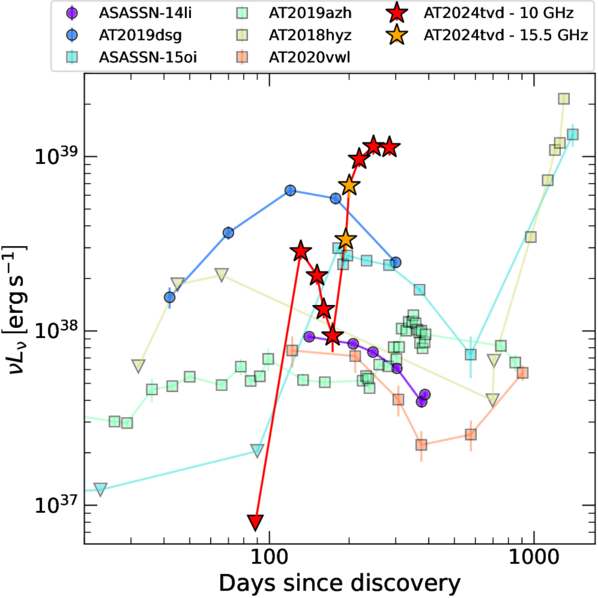
Demonstration of the fast evolution of AT 2024tvd’s radio emission (red and orange stars) compared to other radio-bright tidal disruption events (other symbols). [Sfaradi et al. 2025]
Prompt or Delayed, Outflow or Jet?
To understand the origin of the fast-evolving, extremely bright radio emission from AT 2024tvd, Sfaradi’s team modeled the emission that would arise from outflows and jets. For both wide-angle outflows and narrow jets, the team considered both prompt — arising simultaneously with the event’s optical detection — and delayed sources.
The team’s modeling highlighted several possible scenarios. In the first, both bright radio peaks arose from a single outflow that was launched about 84 days after the star met its doom. The double-peaked behavior is due to the outflow interacting with a complex distribution of material surrounding the black hole. It’s also possible for the two peaks to arise from separate outflows or jets, one launched around 84 days and the other around either 170 or 190 days, depending on whether the second source is a mildly relativistic outflow or a relativistic jet.
Sfaradi and collaborators posited that AT 2024tvd’s unusual radio behavior could be due to its off-nuclear location, but they acknowledged that this event might simply occupy a region of tidal disruption event parameter space that had yet to be explored. Sensitive interferometric or polarimetric observations may reveal more about how AT 2024tvd interacts with its environment, helping to illuminate the nature of this rare event.
Citation
“The First Radio-Bright Off-Nuclear TDE 2024tvd Reveals the Fastest-Evolving Double-Peaked Radio Emission,” Itai Sfaradi et al 2025 ApJL 992 L18. doi:10.3847/2041-8213/ae0a26
The post Investigation of the First Radio-Bright Off-Nuclear Tidal Disruption Event appeared first on AAS Nova.
]]>
Astrobites reports on the explosive origins of hyper-velocity survivor stars.
The post Kickin’ It into Overdrive with Stellar Escapees appeared first on AAS Nova.
]]>Editor’s Note: Astrobites is a graduate-student-run organization that digests astrophysical literature for undergraduate students. As part of the partnership between the AAS and astrobites, we occasionally repost astrobites content here at AAS Nova. We hope you enjoy this post from astrobites; the original can be viewed at astrobites.org.
Title: The Evolution of Hypervelocity Supernova Survivors and the Outcomes of Interacting Double White Dwarf Binaries
Author: Ken J. Shen
Author’s Institution: University of California, Berkeley
Status: Published in ApJ
Even stars get kicked around sometimes. When a white dwarf — a dense stellar corpse that’s run out of its nuclear fuel — gets pushed past its limit, the result is a spectacular thermonuclear explosion called a Type Ia supernova. Two stars are needed to trigger a Type Ia supernova explosion. In a binary system that gives rise to a Type Ia supernova, the more massive star, called the primary, steals mass from the less massive companion star. As the primary gains mass, it undergoes a runaway thermonuclear reaction and explodes. Despite the violent nature of the blast, it doesn’t always destroy everything in sight. While the primary star is obliterated, the companion star might survive the explosion by being launched, or “kicked,” into space at incredibly high speeds.
A few of these hyper-velocity survivors have been detected in surveys, particularly from the Gaia mission. Understanding how these stars survived a supernova provides important clues about how a supernova forms and explodes in the first place.
The D6 Model: (Double the Trouble) + (Double the Double the Trouble)
In today’s post, we explore the “dynamically driven double-degenerate double-detonation” model, fortunately shortened to the D6 model. (Try to say that ten times fast!) The D6 model describes a binary star system of two white dwarfs, each of which is generally composed of an even mix of carbon and oxygen. (Sometimes white dwarfs composed of helium or a mix of oxygen and neon are also possible.) As the white dwarfs spiral toward each other, the more massive primary star steals material, often helium, from the less massive companion star’s outer shell. If this mass transfer is violent enough, it can trigger a detonation within the helium shell of the primary star. This detonation then triggers an explosion deep within the core of the primary star, causing a supernova.
For a Type Ia supernova, it takes two stars to tango. What happens to the secondary (donor) star? One theory suggests that it can be blasted away from the scene of the crime at speeds ranging from approximately 1,000 to 3,000 km/s, becoming a so-called hyper-velocity star. Of these observed “survivors,” the hottest of the bunch have been theorized to be heated by the supernova explosion itself. But some of these survivors have been cooler (in temperature). If these companion stars were in the vicinity of the blast, how could they not be heated by the explosion? What can their temperature tell us about their origin?
Defining the Model
To explore the origins of these cool hyper-velocity stars, today’s author used the stellar evolution code MESA to model the evolution of different types of white dwarf companion stars after (presumably) surviving a Type Ia supernova. A key focus was on the Kelvin–Helmholtz mechanism, which is the process by which a star cools and therefore contracts over long periods as it radiates away its internal heat.
Because white dwarfs come in many flavors, they explored a range of possible elemental compositions for the companion white dwarf: helium-rich (He-rich), carbon/oxygen-rich (C/O-rich), and oxygen/neon-rich (O/Ne-rich).
One important detail of these models is that the stars were assumed to be fully convective, which is a common property of low-mass stars with masses less than around 0.4 M☉. (You can think of a fully convective star almost like a massive lava lamp where the heat source is at the center of the sphere.) Extensive mass loss can cause a more massive non-convective star to become less massive and convective, which in turn makes it susceptible to cooling quickly and avoiding a fiery death as a supernova. (Hotter gas rises to the surface, where the particles lose kinetic energy by doing work, gradually slowing down and cooling off.) This is key if we want to produce cool, fast-moving stars.
Detonate First, Simulate Later
For helium-rich survivors, the simulations suggest that if the companion star loses enough mass either before or during the explosion, the star’s natural Kelvin–Helmholtz evolution can potentially explain why we observe some cool hyper-velocity survivors. In the case of a star called D6-2, the simulations reproduced its low temperature and luminosity, assuming that it began its life as a helium white dwarf that was shredded but not entirely destroyed. This produces a tiny, convective, hyper-velocity supernova survivor.
D6-2 is an interesting object, however, because it has a fairly low velocity for a potential hyper-velocity survivor. Its velocity is estimated to be about 1,050 km/s, which simulations suggest should be higher based on its estimated mass. It’s likely that either the simulations and models need refining or D6-2 had an altogether different origin.
What About the Others?
So far, we’ve mainly talked about He-rich stars, but what about those C/O-rich ones? These stars would likely appear cooler and redder since they evolve at a nearly constant temperature before moving onto the standard white-dwarf cooling track. (This is called the Hayashi track.)
Red objects are harder for telescopes to detect and often get mistaken for other stars or objects, partially due to a pesky phenomenon called dust extinction, or interstellar reddening. To expand the search for these hyper-velocity candidates, surveys like Gaia might benefit by expanding their search limits to include redder stars, although this opens up the possibility of increasing the number of false positives.
A different class of fast-moving, faint stars — like LP 40-365 — could be related to this population. They are theorized to be remnants of white dwarfs around 1.4 M☉ that only partially exploded. Low-mass, O/Ne-rich survivors might match the observed temperatures and luminosities of LP 40-365, but the ages don’t line up as well as one might hope. (More work will be needed to figure out this particular puzzle.)
The Odds of Stellar Survival
Based on these simulations, it’s estimated that about 2% of Type Ia supernovae might leave behind a He-rich hypervelocity star like D6-2 (see Fig. 1). If we consider C/O-rich survivors (like D6-2’s cousins D6-1 and D6-3), the rate drops to about 0.2%, which is intriguingly close to the estimated rate of SN 2003fg-like events: unusually bright, slowly evolving Type Ia supernovae that often display tell-tale signs of unburned carbon and oxygen in their spectra.
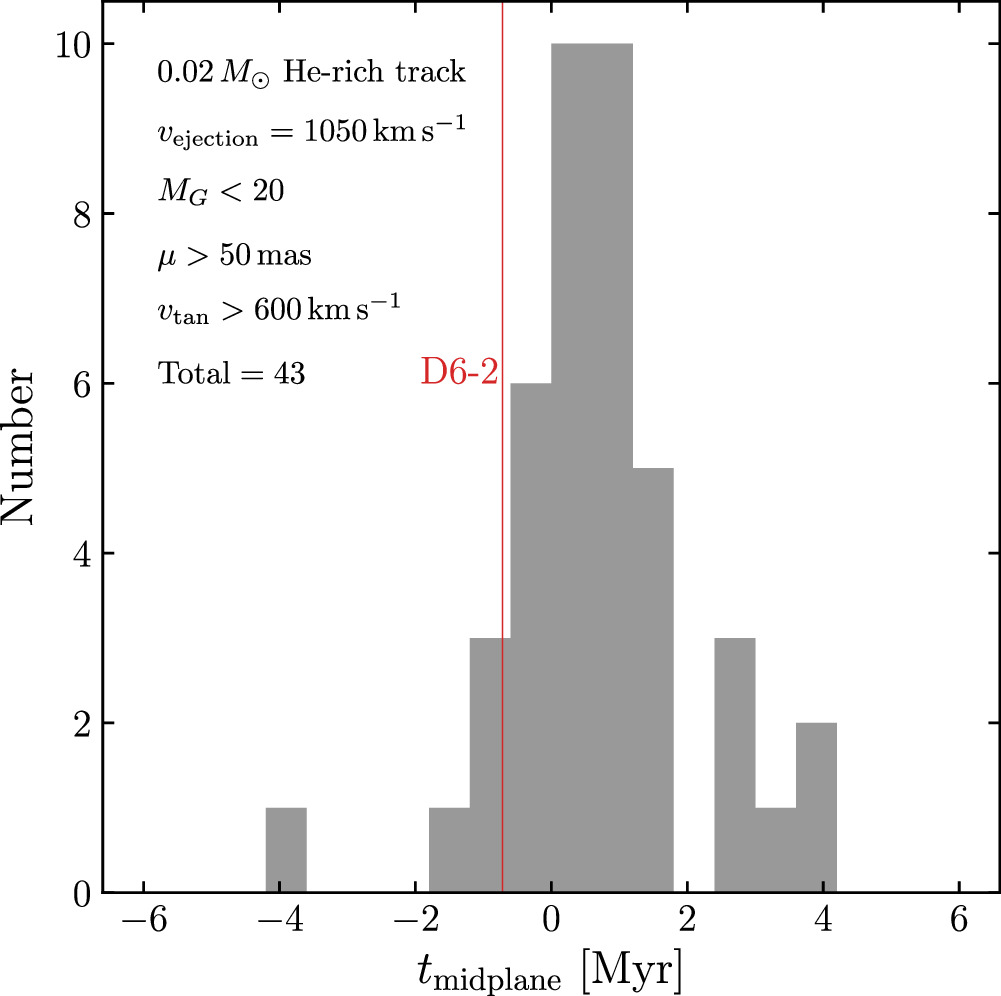
Figure 1: A histogram of detectable hyper-velocity survivors from the He-rich track assuming every Type Ia supernova produces a companion with a mass of 0.02 solar mass. These survivors are assumed to be ejected from their Type Ia supernovae at a velocity of 1,050 km/s, matching D6-2. The x-axis, tmidplane, describes the apparent travel time from the midplane of the simulation’s galaxy. A negative value means the survivor was observed before it passed through the plane. A total count of 43 hyper-velocity survivors from every Type Ia supernova yields an estimated survival rate of about 2%. [Shen 2025]
Choose Your Own (Stellar) Adventure
This article suggests different evolutionary paths for how binary white dwarfs might evolve. Depending on the properties of the merger, the system might do any of the following:
- Trigger nuclear reactions within the outer shell of the primary without detonating the primary’s core
- Become a normal Type Ia supernova
- Leave behind a hyper-velocity remnant
- Become a SN 2002es-like supernova, which is a fainter type of Type Ia supernova
There are lots of potential outcomes for these types of binaries, and hyper-velocity survivors indicate just a tiny fraction of a particular configuration of binary white dwarfs (see Fig. 2).
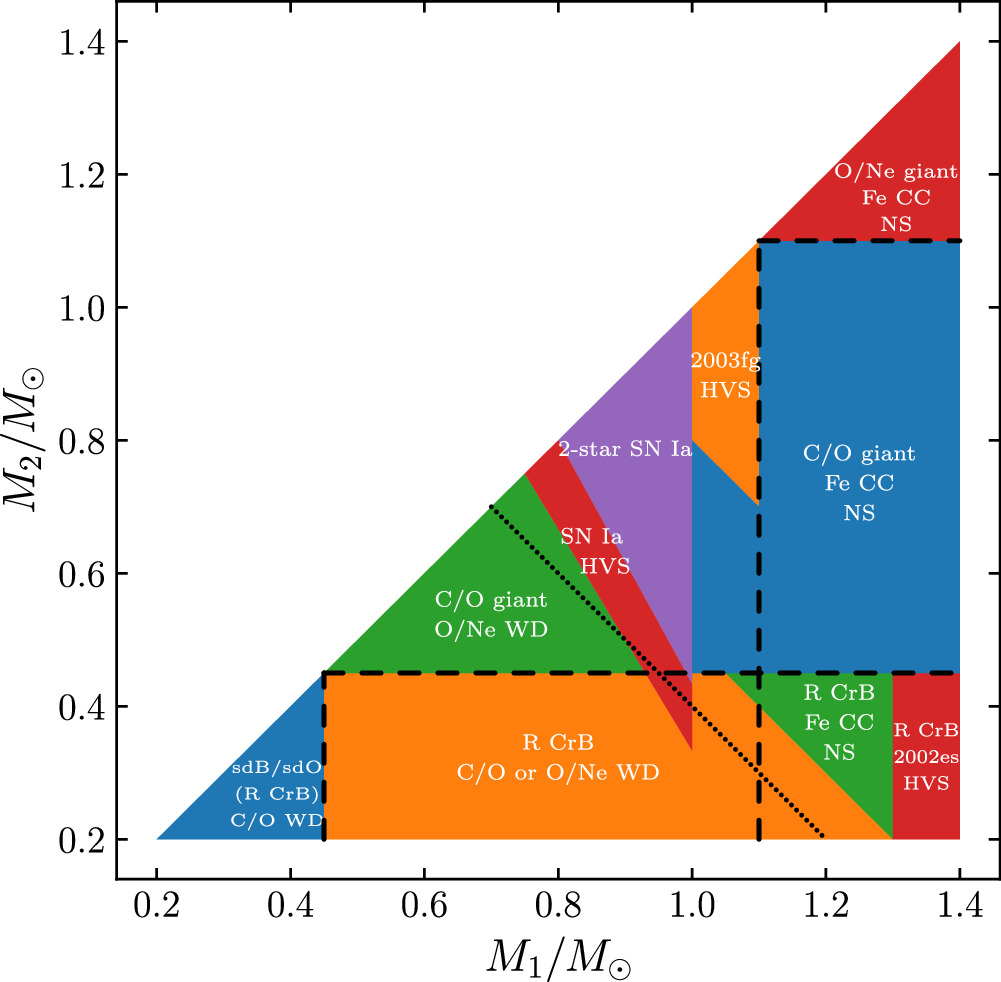
Figure 2: A diagram of the speculative outcomes for a white dwarf–white dwarf binary. The y-axis shows the secondary’s initial mass, whereas the x-axis shows the primary’s initial mass. The dashed lines indicate where the combined white dwarf mass is 1.4 M☉. The plot illustrates the wide variety of outcomes of white dwarf–white dwarf binaries, of which hyper-velocity survivors (HVS) are rare. sdB/sdO = subdwarf B/O stars; R CrB = R Coronae Borealis, variable star; Fe CC = iron core-collapse supernovae; HVS = hyper-velocity survivor; NS = neutron star. [Shen 2025]
Original astrobite edited by Chloe Klare.
About the author, Mckenzie Ferrari:
I’m currently a PhD grad student in the Geophysical Sciences program at the University of Chicago. While I now study the atmosphere and oceans of Earth, most of my previous undergrad and grad research focused on simulations of Type Ia supernovae and galaxy formation and evolution. In my free time, I foster cats for a local organization, enjoy cooking, and can often be found running along Lake Michigan.
The post Kickin’ It into Overdrive with Stellar Escapees appeared first on AAS Nova.
]]>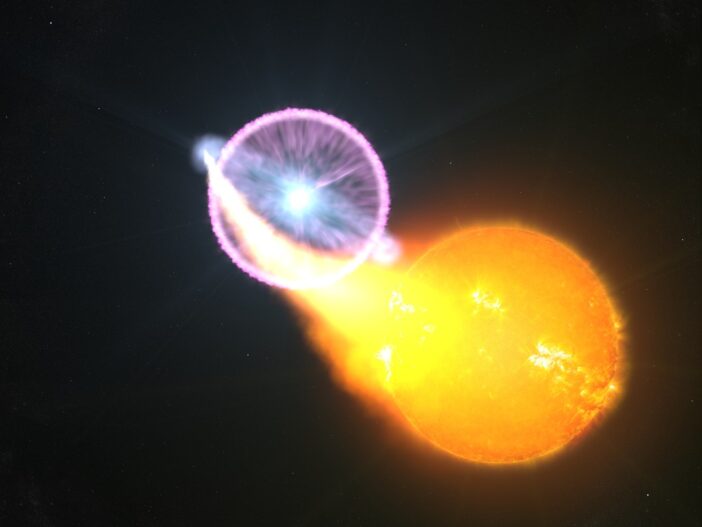
A recent study finds that a recurrent nova may be powered by a rare Be star–white dwarf binary system, broadening the scope of possible novae origins.
The post Rapid Recurrent Nova May Be Challenging Perceptions appeared first on AAS Nova.
]]>Flashing on and fading quickly, recurrent novae are captivating astronomical phenomena. A recent study identifies one system that challenges our current understanding.
Rapid Recurrent Novae
When a white dwarf — the white-hot remnant of a dead star — has a close binary companion, the white dwarf can pull material from the companion star onto its boiling surface. Ignited in a bright flash, the accreted material is blown out from the white dwarf in a nova explosion that gradually expands and fades over time. Some novae, known as recurrent novae, repeat on observable timescales, creating a “new” star in the sky on periods ranging from one to one hundred years.
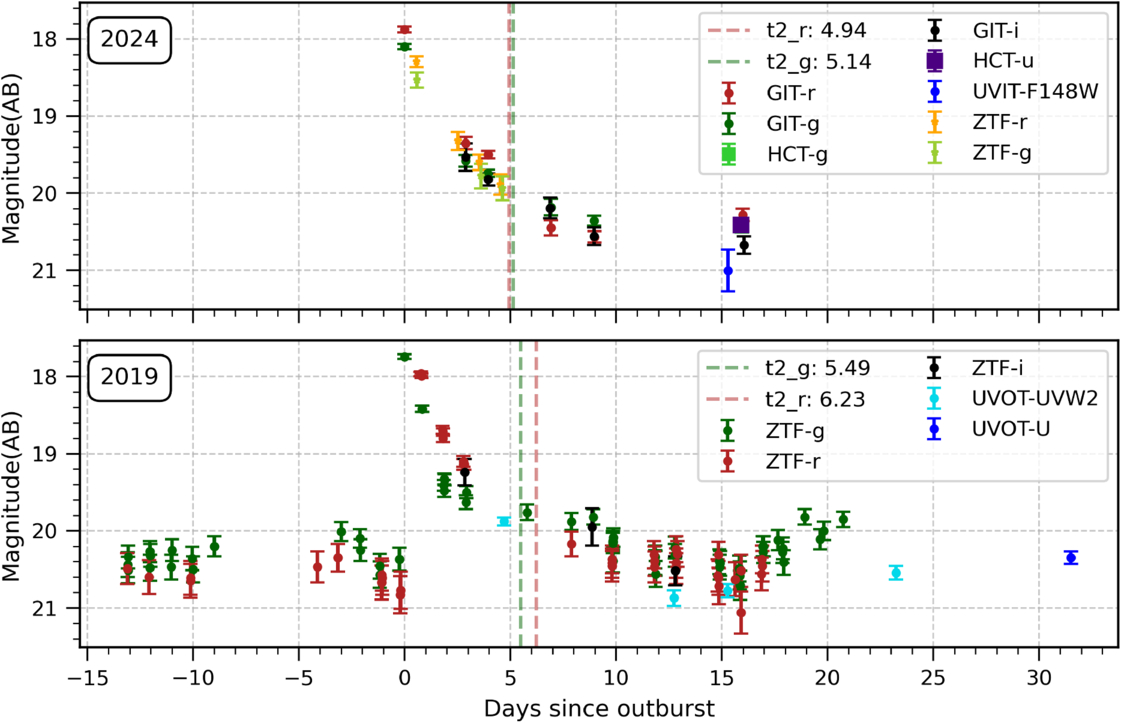
Two light curves of M31N 2017-01e outbursts from 2024 (top) and 2019 (bottom) showing how the light evolves over time. Click to enlarge. [Chamoli et al 2025]
Discovered in 2017, the second-shortest-period nova M31N 2017-01e has an outburst about every 2.5 years. This nova has sparked intrigue among researchers due to its low-amplitude outbursts and rapid evolution compared to other recurrent novae. While M31N 2017-01e exhibits some emission features typical for recurrent novae, recent studies have suggested that the system’s companion star may be a moderately young, blue B-type star. Most novae occur in systems where the white dwarf’s companion is a late-type main-sequence, subgiant, or giant star, making M31N 2017-01e an unusual case requiring further investigation.
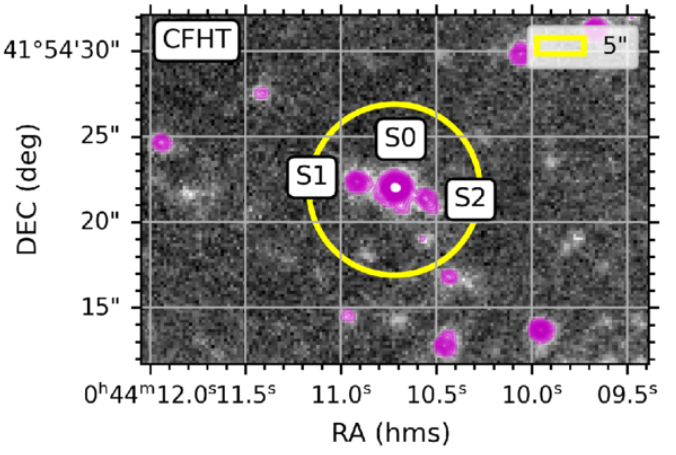
Optical image showing the location of sources near the location of M31N 2017-01e. The yellow circle corresponds to a radius of 5 arcseconds and is centered on the nova. Labeled S0, the source coincides with the location of the nova with sub-arcsecond resolution. Click to enlarge. [Modified from Chamoli et al 2025]
Dialing In on M31N 2017-01e
Aiming to constrain the nature and companion star of the nova, Shatakshi Chamoli (Indian Institute of Astrophysics and Pondicherry University) and collaborators performed a multiwavelength analysis using ultraviolet and optical observations of M31N 2017-01e.
In monitoring the nova during and in between outbursts, the authors identified a source at the reported location of M31N 2017-01e that exhibited variability and color consistent with previous observations of the system. Through a detailed photometric analysis, the authors found that the color and emission properties of the source are consistent with a hot, early-type star as was previously suggested. Though all the observational signs point toward a B-type companion, there’s one glaring obstacle to that scenario: such a massive star would typically be unable to transfer the amount of mass necessary to fuel the nova’s frequent eruptions without the accretion becoming unstable.
Be a Companion
What else, then, could the companion be? The authors considered another stellar companion known as a Be star — a rapidly rotating, early-type star that occasionally hosts a disk of loose stellar material. With a blue color and spectral features similar to B-type stars, a Be star could match the observational properties of the nova’s companion while solving the problem of its accretion. Outbursts of M31N 2017-01e likely arise due to the white dwarf lying very near or within the Be star’s circumstellar disk, siphoning material and adequately fueling the system’s recurring eruptions. To confirm this hypothesis, researchers will need to perform follow-up infrared observations to search for the tell-tale signs of a dusty disk around the companion star.
This system is rare and challenges the assumed properties of recurrent novae. From this study, it is clear that nova progenitors are potentially quite diverse and require further multiwavelength observational programs to identify more systems like M31N 2017-01e.
Citation
“Challenging Classical Paradigms: Recurrent Nova M31N 2017-01e, a BeWD System in M31?” Shatakshi Chamoli et al 2025 ApJ 991 174. doi:10.3847/1538-4357/adf843
The post Rapid Recurrent Nova May Be Challenging Perceptions appeared first on AAS Nova.
]]>
Growing planets need to eat, and astronomers just found one snacking on gas in between the rings of a protoplanetary disk.
The post Researchers Spot a Rare Glowing, Growing Planet appeared first on AAS Nova.
]]>Have you ever eaten a meal so quickly that you started to glow? Although this behavior likely isn’t relatable for most humans, astronomers are beginning to find more and more baby planets doing just that.
Planetary Glow Up
Planets are, famously, quite large. But astronomers know that they don’t start out that way, and that instead, stars and planetary systems start as wispy collections of dust and gas. This raw material eventually compresses itself into stars and planets and life capable of contemplating such things, but how exactly that happens is not perfectly understood.
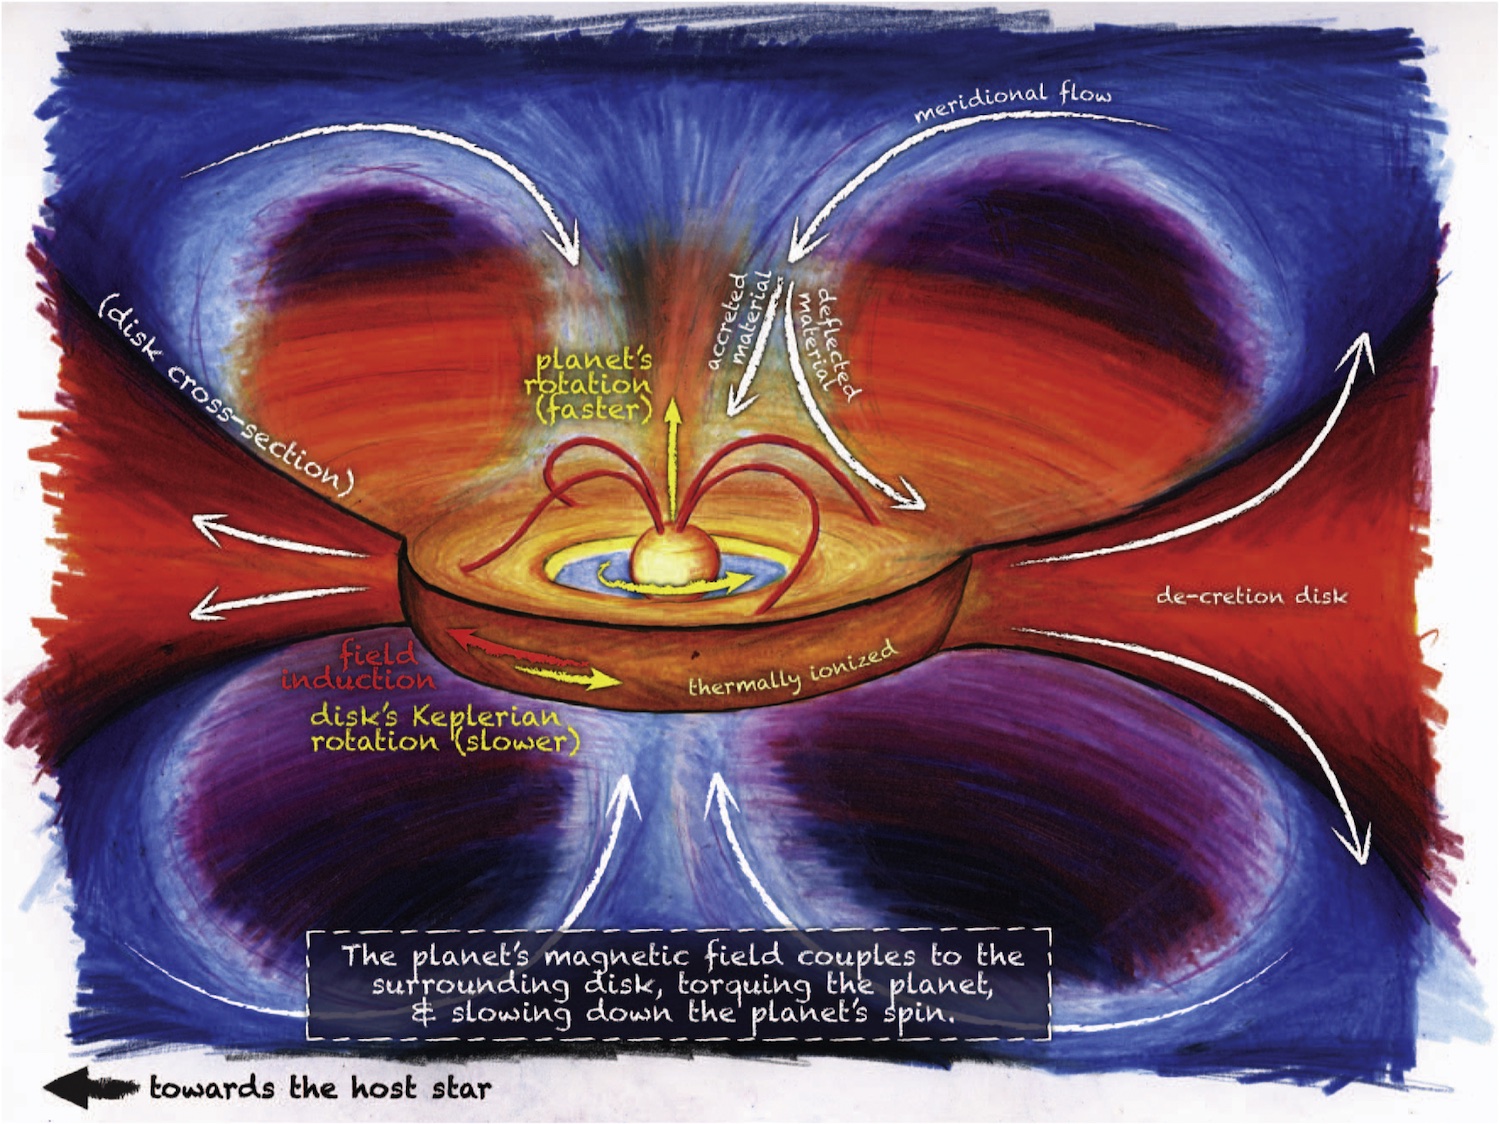
A schematic of some of the processes involved during giant planet formation. Click to enlarge. [Batygin 2018]
A number of different mechanisms predict that during this process, the protoplanet should emit light at a certain frequency associated with electrons jumping between energy levels in hydrogen atoms — what astronomers call Hα emission. In other words, they should glow at that specific wavelength only when they are accreting, though how strongly and consistently will depend on exactly what is happening around the planet.
These ideas existed only on paper until 2019, when a team first observed two glowing, growing planets around the star PDS 70. Recently, however, a powerful new instrument has begun collecting data, and astronomers just announced it has found another similar protoplanet: WISPIT-2b.
A New Discovery
A team of researchers led by Laird Close (University of Arizona) announced the discovery of this new world after analyzing images taken with the powerful new MagAO-X instrument on one of the 6.5-meter Magellan telescopes in Chile. The team outfitted the camera with a narrow filter that only admitted the Hα emission associated with accretion, then collected thousands of images over about two hours in April 2025. After stacking and post-processing their data, a faint dot jumped out beside the central star, right in the gap between two bright rings in the star’s disk.

A follow-up image of WISPIT-2b taken with a broader filter. [Laird et al. 2025]
This remarkable find is only the third protoplanet unambiguously found to be embedded within a disk, and the first to be found in the gap between rings in a disk. With MagAO-X collecting data and the WISPIT survey underway, we’re likely in store for many other discoveries in the coming years. With enough observations and examples of these growing worlds, astronomers will fill in their models of how exactly giant planets as we know them are formed.
Citation
“Wide Separation Planets in Time (WISPIT): Discovery of a Gap Hα Protoplanet WISPIT 2b with MagAO-X,” Laird M. Close et al 2025 ApJL 990 L9. doi:10.3847/2041-8213/adf7a5
The post Researchers Spot a Rare Glowing, Growing Planet appeared first on AAS Nova.
]]>
Astrobites reports on how we might someday detect moons around planets outside our solar system by precisely tracking the positions of a star and a planet.
The post Finding Avatar’s Pandora: Exomoons with Astrometry appeared first on AAS Nova.
]]>Editor’s Note: Astrobites is a graduate-student-run organization that digests astrophysical literature for undergraduate students. As part of the partnership between the AAS and astrobites, we occasionally repost astrobites content here at AAS Nova. We hope you enjoy this post from astrobites; the original can be viewed at astrobites.org.
Title: Astrometric Methods for Detecting Exomoons Orbiting Imaged Exoplanets: Prospects for Detecting Moons Orbiting a Giant Planet in α Centauri A’s Habitable Zone
Authors: Kevin Wagner et al.
First Author’s Institution: University of Arizona
Status: Published in ApJL
Six of the eight planets in our solar system host at least one moon; the innermost planets Mercury and Venus are the exceptions. The origins of these moons are widely studied and hotly debated. Earth’s very own moon seems to have formed in the aftermath of a collision between the young Earth and another protoplanet. Mars seems to have captured two asteroids as its moons, Phobos and Deimos, a process thought to have produced many of the irregular satellites orbiting the gas giants as well. Using our solar system as a model, the presence of moons seems like a natural outcome of planet formation.
Why then don’t we observe exomoons, moons orbiting any of the ~6,000 known exoplanets? Well, the largest moon in our solar system, Ganymede, is 2.5% as massive as Earth and has 40% of the radius, making it marginally larger than Mercury but still less massive. You might have heard how difficult it is to find Earth-like exoplanets, and finding exomoons is even harder. A few exomoon candidates have been announced via microlensing and transits, but the authors of today’s article investigate whether a different technique, astrometry, could help find moons.
Astrometry involves precisely tracking the positions of objects like stars or planets on the sky. In a simple star–planet system, the star and planet trace out ellipses around their shared center of mass. With a moon present, there is an additional deviation, as the planet wobbles to and fro due to the gravitational tug of the moon. The authors of today’s article check whether moons can be detected by tracking such wobbles exhibited by directly imaged planets.
To start, the authors consider whether any known planets are promising targets for astrometric moon searches. There just so happens to be a giant planet candidate in Alpha Centauri, and if there were a massive moon orbiting this large planet around this nearby star, it would be as good as it gets. The authors simulate orbits of this system (a Saturn-like planet in a 1.8 au orbit around a Sun-like star at a distance of 4.2 light-years) with a 30-Earth-mass moon injected. They simulate observing such a system with a space-based 6.5-meter telescope (similar to the planned Habitable Worlds Observatory) with realistic noise over a 3-year observing campaign. The simulated and modeled orbits are shown in Figure 1. After the authors subtract the best-fit planet orbit, they are left with what is shown in Figure 2, where a clear periodic perturbation from the moon as it orbits is visible.
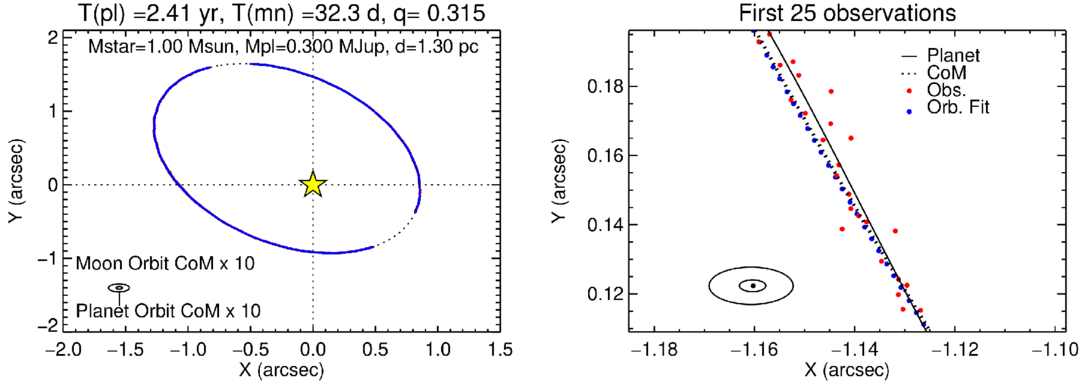
Figure 1: Left: The zoomed-out orbit of the hypothetical Alpha Centauri star–planet–moon system. The blue curve shows the Keplerian orbital fit. Right: The zoomed-in orbit. The red points are the simulated observations, showing deviations caused by the moon. [Wagner et al. 2025]

Figure 2: Left: Deviations in position of the planet’s orbit over time. The red points show the simulated observations, and the black curve shows the data smoothed. Right: Zoom-in showing the moon’s effect on the planet’s motion. [Adapted from Wagner et al. 2025]
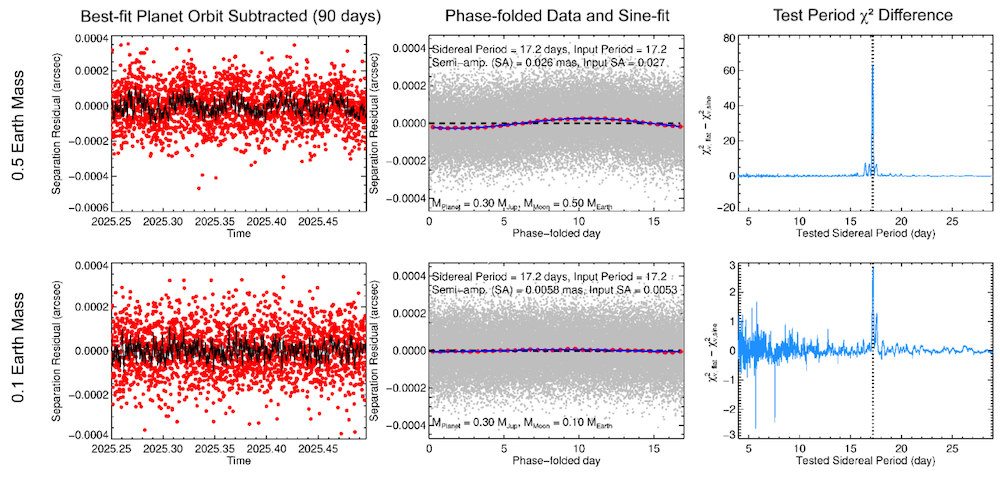
Figure 3: Left: Moon-induced planet position deviations over the first 90 observing days. Middle: Deviations from the entire 5-year observing baseline folded around the best-fit moon orbital period. Right: χ2 difference as a function of period, showing a peak in the signal at the moon’s orbital period. [Adapted from Wagner et al. 2025]
All of this is great news for fans of the hit movie (and still the highest-grossing movie of all time) Avatar, which features a habitable exomoon in the Alpha Centauri system. Searching for moons will help us understand their properties and formation, probe whether our solar system is unique, and even look for life on rocky moons orbiting gas giants in the habitable zones of their stars.
Original astrobite edited by Ryan White.
About the author, Kylee Carden:
I am a PhD student at Johns Hopkins University, where I am an observer of planets outside the solar system. I’m interested in dynamics, disks, demographics, the Roman Space Telescope. I am a huge fan of my cat Piccadilly, cycling, and visiting underappreciated tourist sites.
The post Finding Avatar’s Pandora: Exomoons with Astrometry appeared first on AAS Nova.
]]>
AAS Nova turned 10 this year! For our 2,000th post, we're looking back on the past decade of astronomy research.
The post AAS Nova Celebrates 10 Years of Astronomy Research News appeared first on AAS Nova.
]]>AAS Nova launched in 2015, and what has followed since is a remarkable encapsulation of 10 years of astronomy. Today, for our 2,000th post, we’re looking back on some of the discoveries we shared in the first year of AAS Nova and how far the astronomical community has come since then.
The Solar System, Exoplanets, and Astrobiology

The protoplanetary disk surrounding the young star HL Tauri has numerous visible rings and gaps in this image from the Atacama Large Millimeter/submillimeter Array. [ALMA (ESO/NAOJ/NRAO); C. Brogan, B. Saxton (NRAO/AUI/NSF); CC BY 4.0]
Exoplanets are by far the most frequently featured topic on AAS Nova, with more than 300 posts mentioning these distant worlds. Almost exactly 10 years ago, NASA reported that the number of known exoplanets was over 1,800 — and now that number has surpassed 6,000. Researchers continue to discover planets that are smaller, colder, and found in more extreme locations than ever before (even right next door). On the habitability side of the equation, researchers continue to make headway on critical questions, such as whether the multitude of small, rocky exoplanets around M-dwarf stars are likely to have atmospheres.
Back in our solar system, the past decade has brought a bevy of firsts, such as the first measurement of the wind speed on another planet using an aircraft and the first definitive detection of water on an asteroid. Though controversial, researchers reported the first detection of phosphine in the atmosphere of Venus, a possibility that could have implications for life on our planetary neighbor but is complicated by many factors including the possible existence of active volcanoes on Venus. The search for life beyond Earth goes on, with researchers continuing to devise new ways to detect it, if it exists.
High-Energy Phenomena and Fundamental Physics
Gravitational wave astronomy started with a bang 10 years ago when the Laser Interferometer Gravitational-Wave Observatory (LIGO) first detected colliding black holes (a discovery that we covered in our first year!). Since then, LIGO, the Virgo interferometer, and the Kamioka Gravitational Wave Detector (KAGRA) have detected about 300 black hole mergers, and the explosion of gravitational wave data has enabled population-level studies of compact objects across the universe. This era also brought about the first detection of merging neutron stars, which was also studied across the electromagnetic spectrum; the first detection of a merger between a black hole and a neutron star; and the detection of mysterious objects in the “mass gap” between the lightest black holes and the heaviest neutron stars. New techniques for detecting gravitational waves have been demonstrated since they were first recorded in 2015; in 2023, international pulsar-timing collaborations around the globe announced that they’d found significant evidence for the gravitational wave background.

The first Event Horizon Telescope image of the Milky Way’s supermassive black hole. [EHT Collaboration; CC BY 4.0]
In other high-energy astrophysics news, our ability to detect fleeting astronomical events has never been better, thanks to facilities like the Canadian Hydrogen Intensity Mapping Experiment, the Zwicky Transient Facility, and, most recently, the Vera C. Rubin Observatory. Astronomers have caught flares from stars totally, partially, and repeatedly torn apart by black holes, homed in on the host galaxies of fast radio bursts, explored the sources of gamma-ray bursts, and even discovered entirely new classes of transients. (And as a little preview of what you can expect in the next 10 years, here’s a refresher on just how much Rubin will reveal about the transient sky.)
The Sun and the Heliosphere
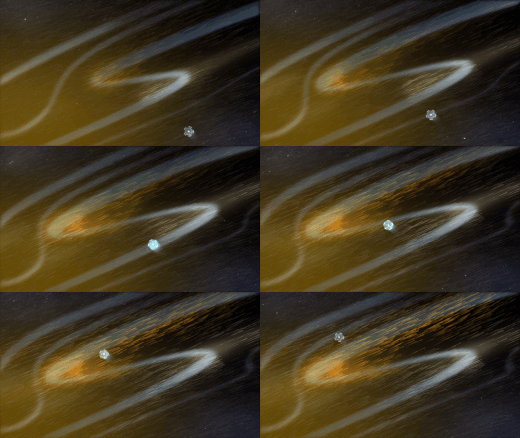
An animation showing the Parker Solar Probe traversing a solar switchback. [NASA’s Goddard Space Flight Center/Conceptual Image Lab/Adriana Manrique Gutierrez]
Ten years ago, solar physicists were tackling the tricky problem of how to forecast damaging space weather events like solar flares and coronal mass ejections. Today, that work continues, increasingly aided by machine-learning techniques that make handling mountains of solar data more tractable. (The growth of machine learning in astronomy isn’t limited to solar physics; there were only 468 peer-reviewed astronomy research articles published in 2015 that mentioned machine learning, and more than 3,400 articles mentioning machine learning were published in 2024 alone.)
Researchers have also made headway on other persistent challenges like the open flux problem, the coronal heating problem, and how to handle sparse solar data sets.
Stars and Stellar Physics
An early AAS Nova post asked if we’ve finally found Population III stars, the first stars to light up the universe. Through observations and simulations, astronomers are still asking that question, probing whether Population III stars with masses lower than 0.8 solar mass could have formed, as these low-mass stars would still be present in the universe today; whether JWST could detect Population III stars during the epoch of reionization; and whether the first stars were solely massive stars that formed alone. While the first stars themselves may still elude detection, astronomers are gaining confidence that they’ve discovered stars born from the gas enriched by just a single member of the first stellar generation, getting us closer to understanding the first stars in the universe.

An image of Betelgeuse and its probable companion star from the ‘Alopeke instrument on the Gemini North telescope. Click to enlarge. [International Gemini Observatory/NOIRLab/NSF/AURA; Image Processing: M. Zamani (NSF NOIRLab); CC BY 4.0]
This decade also brought the discovery of double-faced white dwarfs, a turnover of the initial mass function of a star cluster, and strange brown dwarfs like “The Accident.”

JWST image of the star cluster IC 348. A discovery of the amino acid tryptophan was reported in the gas of this cluster, though further research called that discovery into question. [NASA, ESA, CSA, STScI, Kevin Luhman (PSU), Catarina Alves de Oliveira (ESA)]
Interstellar Matter and the Local Universe
There’s been plenty to learn in our cosmic backyard: researchers have discovered a potential “feather” in the Milky Way, tracked the rapid evolution of a gas cloud in the galactic center, found the faintest known satellite of our galaxy, and found evidence for structures within our galaxy that existed before it gained its disk or spiral arms. They’ve even solved the 50-year mystery of the Milky Way’s unexpectedly slow star formation.
In the space between the stars, we’ve seen many interstellar molecular firsts, like the first detection of an isomer of glycine, the simplest of the amino acids necessary for life on Earth, the first detection of ionized buckyballs, and the detection of complex organic molecules in the Large Magellanic Cloud. At the same time, other molecular breakthroughs were called into question. In addition to interstellar molecules, humanity has now also confirmed the first interstellar objects that have roamed into our solar system: 1I/ʻOumuamua in 2017, 2I/Borisov in 2019, and 3I/ATLAS in 2025.
Laboratory Astrophysics, Instrumentation, Software, and Data
Not all of astronomy happens at a telescope: lab work on Earth has shown how laboratory studies can help identify mystery spectral lines in the interstellar medium, explored how magnetic fields affect the formation of planets, and even examined the possibility of growing crops in asteroid soils.

Stars and satellites as seen by the Dark Energy Camera [CTIO/NOIRLab/NSF/AURA/DECam DELVE Survey, CC BY 4.0]
Astronomers are concerned not just with the outcomes of their research, but also how outside factors affect their ability to do research in the first place. As the number of Earth-orbiting satellites has exploded and the sources of light pollution have continued to grow, researchers have investigated the effects of light pollution on dark-sky sites and sought to understand the impact of satellite trails and space debris on astronomical observations.
Galaxies and Cosmology
In the broader universe, researchers continue to discover galaxies that are fainter and farther away than ever before. Both ultra-diffuse galaxies and ultra-faint dwarf galaxies have been in the spotlight. JWST, which finally began observations in 2022, has provided an incredible amount of data on galaxies both near and far. JWST revealed surprisingly massive galaxies in the first few hundred million years of the universe, creating challenges for models of galaxy formation and evolution. In 2015, the record holder for most distant known object was the galaxy EGSY8p7 at a redshift of z = 8.68. A decade later, that honor goes to the galaxy MoM-z14, at a redshift of z = 14.44 — an enormous leap that demonstrates how our view of the universe has expanded.
JWST images of six very distant galaxies dubbed “little red dots.” [NASA, ESA, CSA, STScI, Dale Kocevski (Colby College)]
On the cosmology side of things, the Hubble tension — the apparent disagreement between the universe’s expansion rate measured in the local universe and the rate extrapolated forward from early universe measurements — continues to grow. Another less-well-known tension, in measurements of the S8 or “clumpiness” parameter, has also inspired scientists to propose tweaks to our leading cosmological model. On top of all this tension, measurements from the Dark Energy Spectroscopic Instrument have provided mounting evidence that dark energy, the largest chunk of the mass–energy budget of the universe, changes over time.
Here’s to 10 More Years
In addition to sharing a curated selection of astronomy news, AAS Nova has also brought you summaries of 30 AAS, Division, and topical meetings over the past decade. When the AAS and the Astrobites collaboration formalized their partnership in 2016, we expanded our coverage of astronomy news by sharing Astrobites articles on AAS Nova. In 2017, we launched the AAS Media Fellowship, a quarter-time position that enables an astronomy graduate student to build a portfolio of writing and gain experience working in the press office. Since then, we’ve featured nearly 180 articles written by our five Media Fellows, several of whom have gone on to careers in science writing and policy. We’ve also shared news and updates from the AAS journals, including the transition to open access, the release of new versions of AASTeX, interviews with publishing staff, and the celebration of the Astronomical Journal‘s 175th anniversary.
We hope you’ll join us as we continue our efforts to bring you short, approachable summaries of recent research in astrophysics and planetary science, amplifying the reach of researchers worldwide who continue to discover what’s new in the universe.
The post AAS Nova Celebrates 10 Years of Astronomy Research News appeared first on AAS Nova.
]]>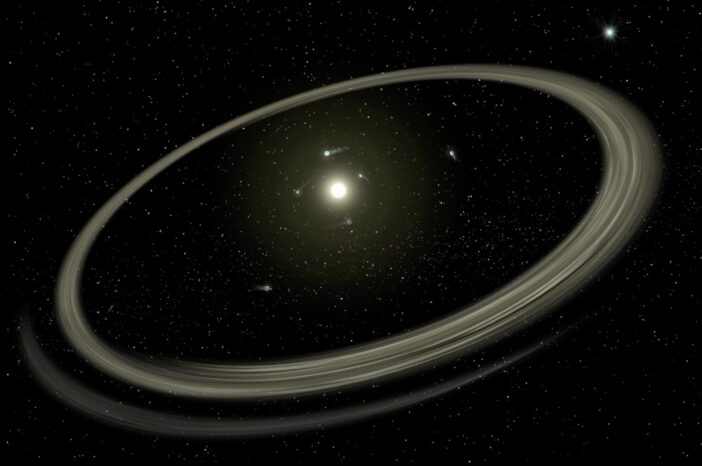
Astrobites reports on a study that explores whether there are planets hiding from us inside the gaps of multi-planet systems.
The post Planetary Hide and Seek appeared first on AAS Nova.
]]>Editor’s Note: Astrobites is a graduate-student-run organization that digests astrophysical literature for undergraduate students. As part of the partnership between the AAS and astrobites, we occasionally repost astrobites content here at AAS Nova. We hope you enjoy this post from astrobites; the original can be viewed at astrobites.org.
Title: The Gap–Giant Association: Are Planets Hiding in the Gaps?
Authors: Caleb Lammers and Joshua Winn
Authors’ Institutions: Princeton University
Status: Published in ApJ
The Kepler space telescope played an almost decade-long game of hide-and-seek. After nine and a half years of operation, Kepler detected more than 2,700 planets outside of our solar system primarily by using the transit method, which is particularly efficient at detecting planets that orbit close to their host stars. Astronomers have also been detecting planets with the radial velocity technique, which is better at finding larger planets at longer orbital periods. By looking for planets with both the transit and radial velocity techniques, astronomers can look for both close-in and far-out planets to paint a more complete picture of other solar systems in our galaxy.
Using the Kepler Giant Planet Survey, the authors of today’s article found that among the 26 systems with three or more transiting planets, four were found to also have an outer giant planet. They quickly noticed that instead of an evenly spaced out inner system of planets, every single one of these four systems with the outer giant planets revealed a notable gap between two of their inner planets. They dubbed this phenomenon the “gap–giant association” — in other words, when an outer giant planet exists in a planetary system, there is evidence of a large gap between two of the inner planets, as shown in Figure 1. This pattern has been observed before, but there has been little theoretical work to explain the effects of outer giants on orbital spacings. In today’s article, the authors ask the question: are there planets inside the gap hiding from us? To address this, they conduct simulations to see if (a) these systems can host a hiding planet in their gaps without becoming dynamically unstable and (b) if such a planet can remain hidden when looked for with the transit method.
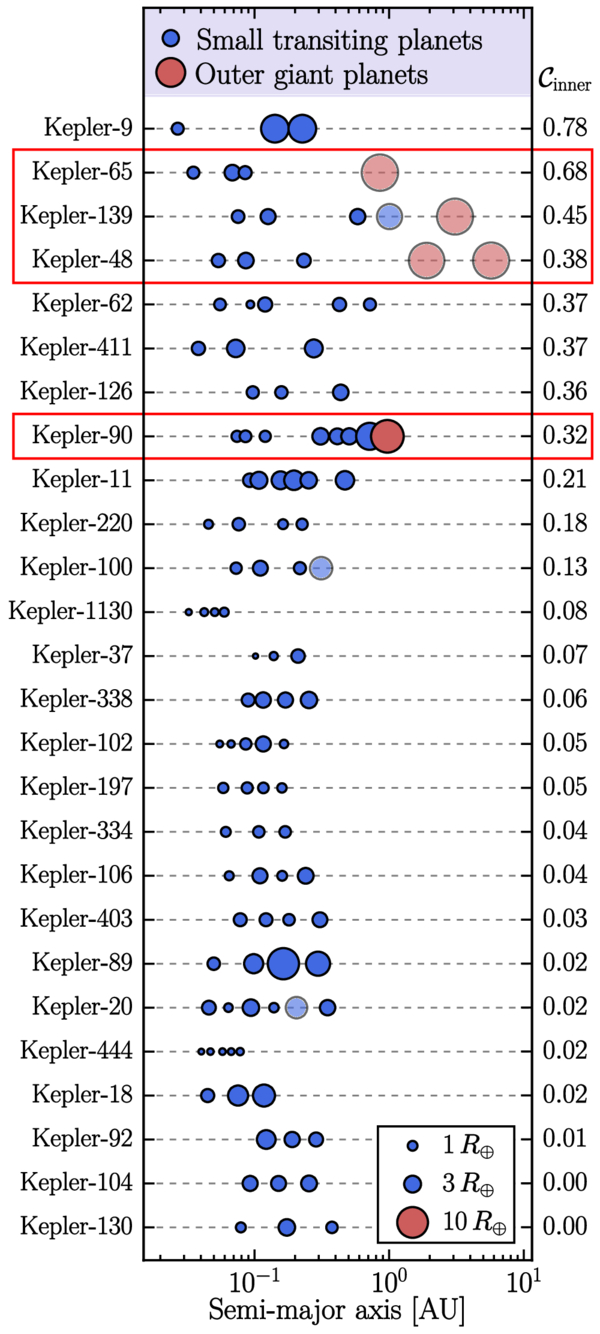
Figure 1: Orbital spacings of systems in the Kepler Giant Planet Survey with three or more transiting planets in the inner planetary system. The parameter C is a metric denoting the regularity of orbital spacings, where a smaller value would indicate a more uniform spacing. The four systems of interest all have large orbital gaps between two adjacent inner planets, and therefore high values of C. [Lammers & Winn 2025]
Close Your Eyes and Count to N
The authors of today’s article model these four systems (Kepler-48, Kepler-65, Kepler-90, and Kepler-139) with a planet added to their gaps and use an N-body simulation (i.e., fancy physics calculations that track how planets gravitationally interact) to evolve the systems over time and evaluate their long-term stability. They find that each of these injected planets has a high survival rate, which means that each of these four systems could stably host an additional ~2–20 Earth-mass planet in its gap for billions of years without falling apart. The authors then calculated whether the outer giants could “hide” these theoretical gap planets by tilting the planets’ orbits enough so that they would not be detectable with the transit method. In order to do this, the outer giant would have to exert a large enough gravitational force on the gap planet to cause it to precess at a rate independent of its neighbors, allowing its orbital inclination to grow. However, they found that the outer giant planets are either too far away or not massive enough to do the job.
Only one system, Kepler-90, has an outer giant that could potentially tilt the gap planet’s orbit enough for it to fly under the radar if the giant were also on a modestly inclined orbit. However, previous detections of Kepler-90’s outer giant suggest that its orbit is well-aligned with those of the inner system, making this hypothesis implausible. They therefore concluded that it is unlikely that planets between ~2 and 20 Earth masses are hiding within these gaps.
Seeking Out Another Option
Before completely abandoning this hypothesis, the authors propose that maybe the gaps do contain planets, but they’re just too small for Kepler to detect. They calculate the detection efficiencies as a function of planet radius and orbital period for each of the four systems and find that planets smaller than about ~0.5–1 Earth radius could have gone unnoticed (as shown in Figure 2). While this would make these systems slightly unusual (most multiplanetary systems have relatively uniform planet sizes), it’s not completely impossible. However, they don’t rule out the possibility that these gaps are truly empty, and that the presence of an outer giant could prevent planets from forming in certain regions or disrupt their orbits after formation. While it is hard to draw any firm conclusions with a sample size of four systems, this study highlights how much we still don’t understand about planetary system architecture, and therefore planetary formation and evolution.
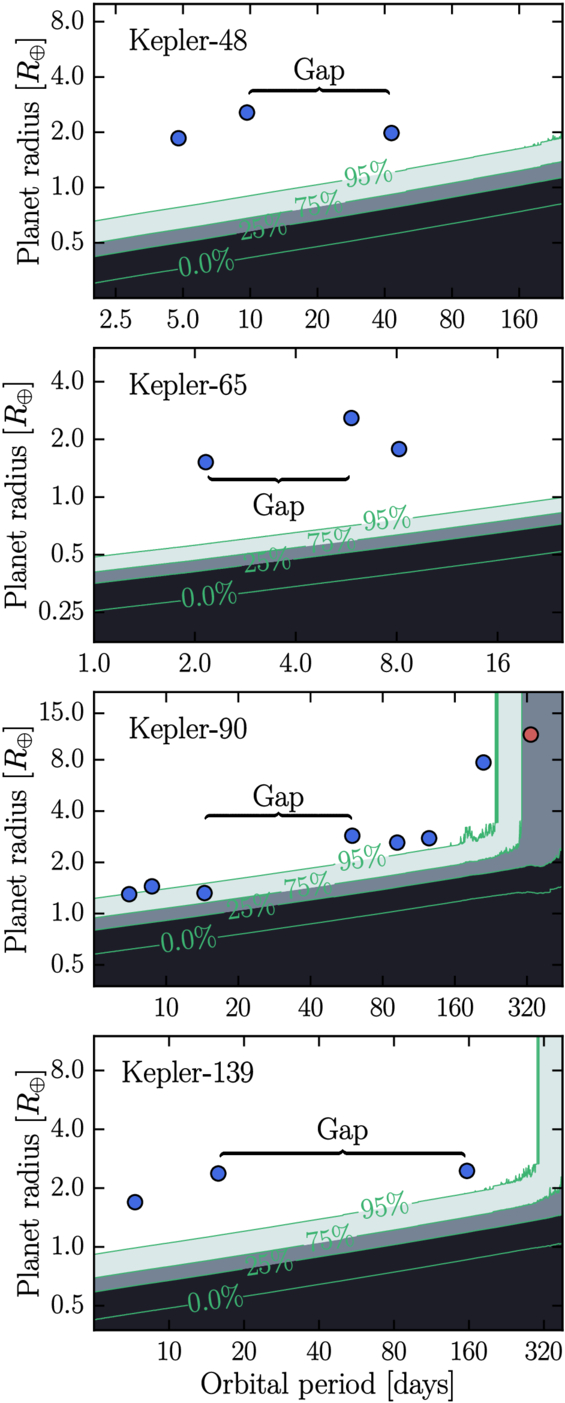
Figure 2: Transit detection efficiency as a function of planetary radius and orbital period for each planetary system. The inner planets and location of the gap are overplotted. The darker contours show regions where Kepler is not sensitive to detecting planets. In order to avoid detection, the planets in each of these systems would have to be much smaller relative to their neighbors, except for the Kepler-90 system, where a hidden planet would only have to be marginally smaller. This suggests that there could exist a demographic of exoplanets that are evading detection within these gaps. [Lammers & Winn 2025]
Original astrobite edited by Annelia Anderson.
About the author, Tori Bonidie:
I am a 5th-year PhD candidate studying exoplanet atmospheres at the University of Pittsburgh. Prior to this, I earned my BA in astrophysics at Franklin and Marshall College where I worked on pulsar detection as a member of NANOGrav. In my free time you can find me cooking, napping with my cat, or reading STEMinist romcoms!
The post Planetary Hide and Seek appeared first on AAS Nova.
]]>
Infrared studies of resolved supernova remnants beyond the Milky Way and the Magellanic Clouds are now within reach.
The post Featured Image: JWST Expands the Search for Extragalactic Supernova Remnants appeared first on AAS Nova.
]]>Out to what distance can we resolve the structure of a supernova remnant in the infrared? Until recently, it was only possible to do so for remnants in the Milky Way and the Magellanic Clouds, but JWST has now extended that capability to other nearby galaxies. In a recent research article, Sumit Sarbadhicary (The Ohio State University) and collaborators used JWST to study supernova remnants in the Triangulum Galaxy (Messier 33), a small spiral galaxy that is 2.7 million light-years away. The study area contained 40 supernova remnants that were previously identified at other wavelengths. The image above shows a portion of the galaxy’s southern spiral arm, where each white circle indicates a known supernova remnant. Infrared observations of supernova remnants are critical for understanding the physics of the interstellar medium and the composition, formation, and destruction of dust. To learn more about how JWST has pushed the limits of our search for extragalactic supernova remnants, and for details on each of the remnants detected by JWST in the Triangulum Galaxy, be sure to check out the full research article linked below.
Citation
“A First Look at Spatially Resolved Infrared Supernova Remnants in M33 with JWST,” Sumit K. Sarbadhicary et al 2025 ApJ 989 138. doi:10.3847/1538-4357/adec7a
The post Featured Image: JWST Expands the Search for Extragalactic Supernova Remnants appeared first on AAS Nova.
]]>
Using high-resolution JWST observations, a recent study has found a supermassive black hole at the center of an ultracompact dwarf galaxy.
The post Supermassive Black Hole in a Super Tiny Galaxy Found with JWST appeared first on AAS Nova.
]]>With very small stellar masses and tiny radii, ultracompact dwarf galaxies raise questions about the dividing line between the highest-mass star clusters and the lowest-mass galaxies. A recently published article leverages JWST’s high resolution to target one tiny galaxy and investigate its origins.
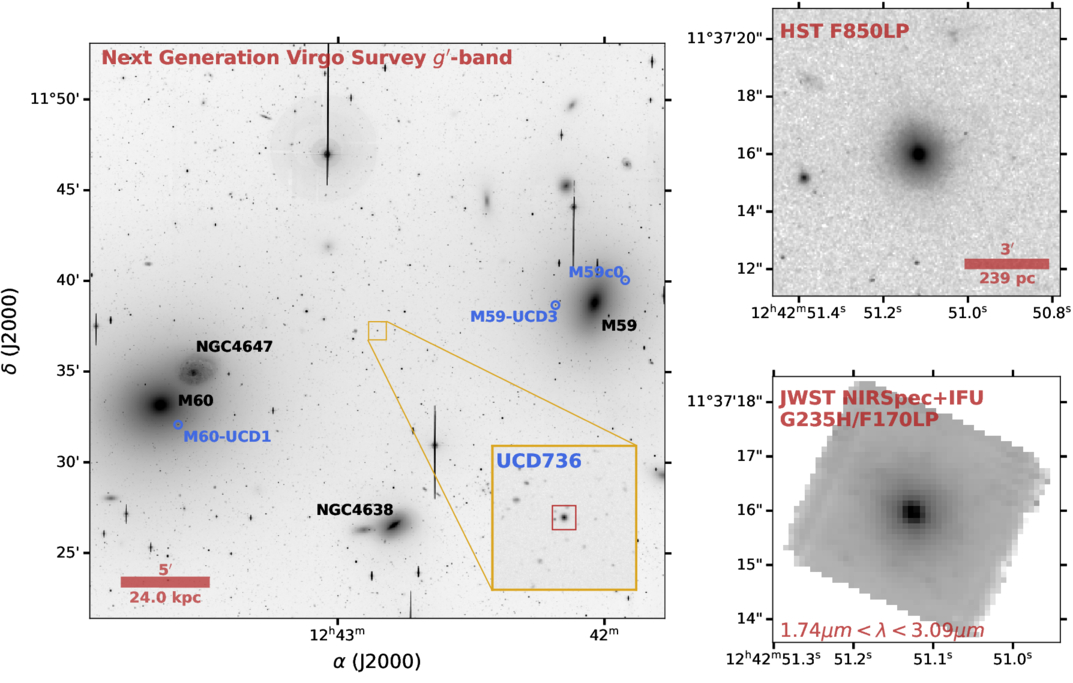
Location of UCD 736 in the Virgo Cluster with the other ultracompact dwarf galaxies with supermassive black hole detections labeled. Click to enlarge. [Taylor et al 2025]
Origins of Ultracompact Dwarf Galaxies
How tiny can a galaxy get? Discovered 20 years ago among the dense environments of the Virgo and Fornax clusters, ultracompact dwarf galaxies walk the line between the largest globular clusters and the smallest galaxies. Determining if these dwarfs are stellar in nature or actually of galactic origin is complex, but one sure way to get at this question is to determine if an ultracompact dwarf galaxy houses a supermassive central black hole.
While astronomers have identified hundreds of these tiny dense galaxies, supermassive black holes have been detected in only five. Hoping to extend this sample, Matthew Taylor (University of Calgary) and collaborators targeted UCD 736, an ultracompact dwarf galaxy located in the Virgo galaxy cluster. If a massive black hole is found in this galaxy, it will be the smallest and least luminous ultracompact dwarf to have such a detection. Exploring galaxies at such small sizes will allow researchers to determine what fraction of ultracompact dwarfs have galactic or star cluster origins, which can provide insights into massive black hole seeding mechanisms in the early universe.
Modeling Black Hole Mass
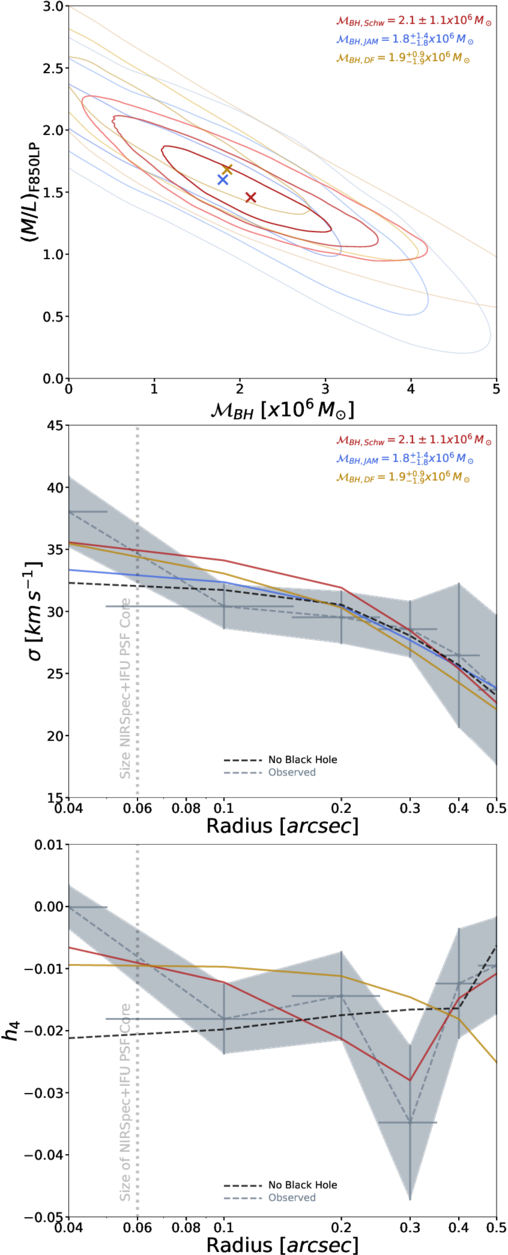
Summary of results for the three black hole modeling methods for UCD 736, indicating the quality of the models and how the observed velocity dispersion and spatial distribution of the galaxy fit with the models. Click to enlarge. [Taylor et al 2025]
However, the authors noted that the three models do not provide equivalent confidence levels in this estimate — while one model confidently rules out the possibility of no central black hole at 3σ significance, the other two models were less constraining, ruling out the possibility of there not being a black hole to only 1σ. Despite these differences, all three models agree on the central black hole mass within the first confidence interval, indicating a positive detection of a black hole in UCD 736.
Progenitor of UCD 736
From their observations and modeling, the authors presented the fifth positive detection of an ultracompact dwarf galaxy with a central supermassive black hole within the Virgo Cluster. Given the presence of this black hole, UCD 736 likely originated as a more massive galaxy that was tidally stripped as it interacted with other nearby cluster galaxies. Interestingly, though, other ultracompact dwarf galaxies with black hole detections in the Virgo Cluster are much closer to the massive galaxy that likely stripped them. UCD 736 sits about 160,000 light-years outside of the nearest giant galaxy Messier 59’s tidal radius, which does not rule out interactions but could indicate that Messier 59 is particularly good at stripping material from smaller galaxies.
Continued searches for black holes in ultracompact dwarfs will further probe the differences between the highest-mass globular clusters and the lowest-mass galaxies. Revealing more within this parameter space will allow astronomers to test black hole seeding and galaxy formation theories.
Citation
“A Supermassive Black Hole in a Diminutive Ultracompact Dwarf Galaxy Discovered with JWST/NIRSpec+IFU,” Matthew A. Taylor et al 2025 ApJ 991 L24. doi:10.3847/2041-8213/ae028e
The post Supermassive Black Hole in a Super Tiny Galaxy Found with JWST appeared first on AAS Nova.
]]>
Neutron stars are born running, and recent research explores just how fast they start off.
The post Kicking Neutron Stars from the Nest appeared first on AAS Nova.
]]>Neutron stars don’t stick around for long after they’re born. Recent research has now uncovered just how fast they flee.
They Grow Up So Fast
Human beings require many years of care and support from their parents before they’re able to venture forth into the world. This is an embarrassingly long process compared to the standard for animals like deer and horses, whose offspring are ready to walk mere minutes after birth. However, baby neutron stars, some of the densest objects in the known universe, put all life on Earth to shame with their immediate self-reliance: after a fiery birth from a supernova explosion, these stars flee the site of their creation at hundreds of kilometers per second.
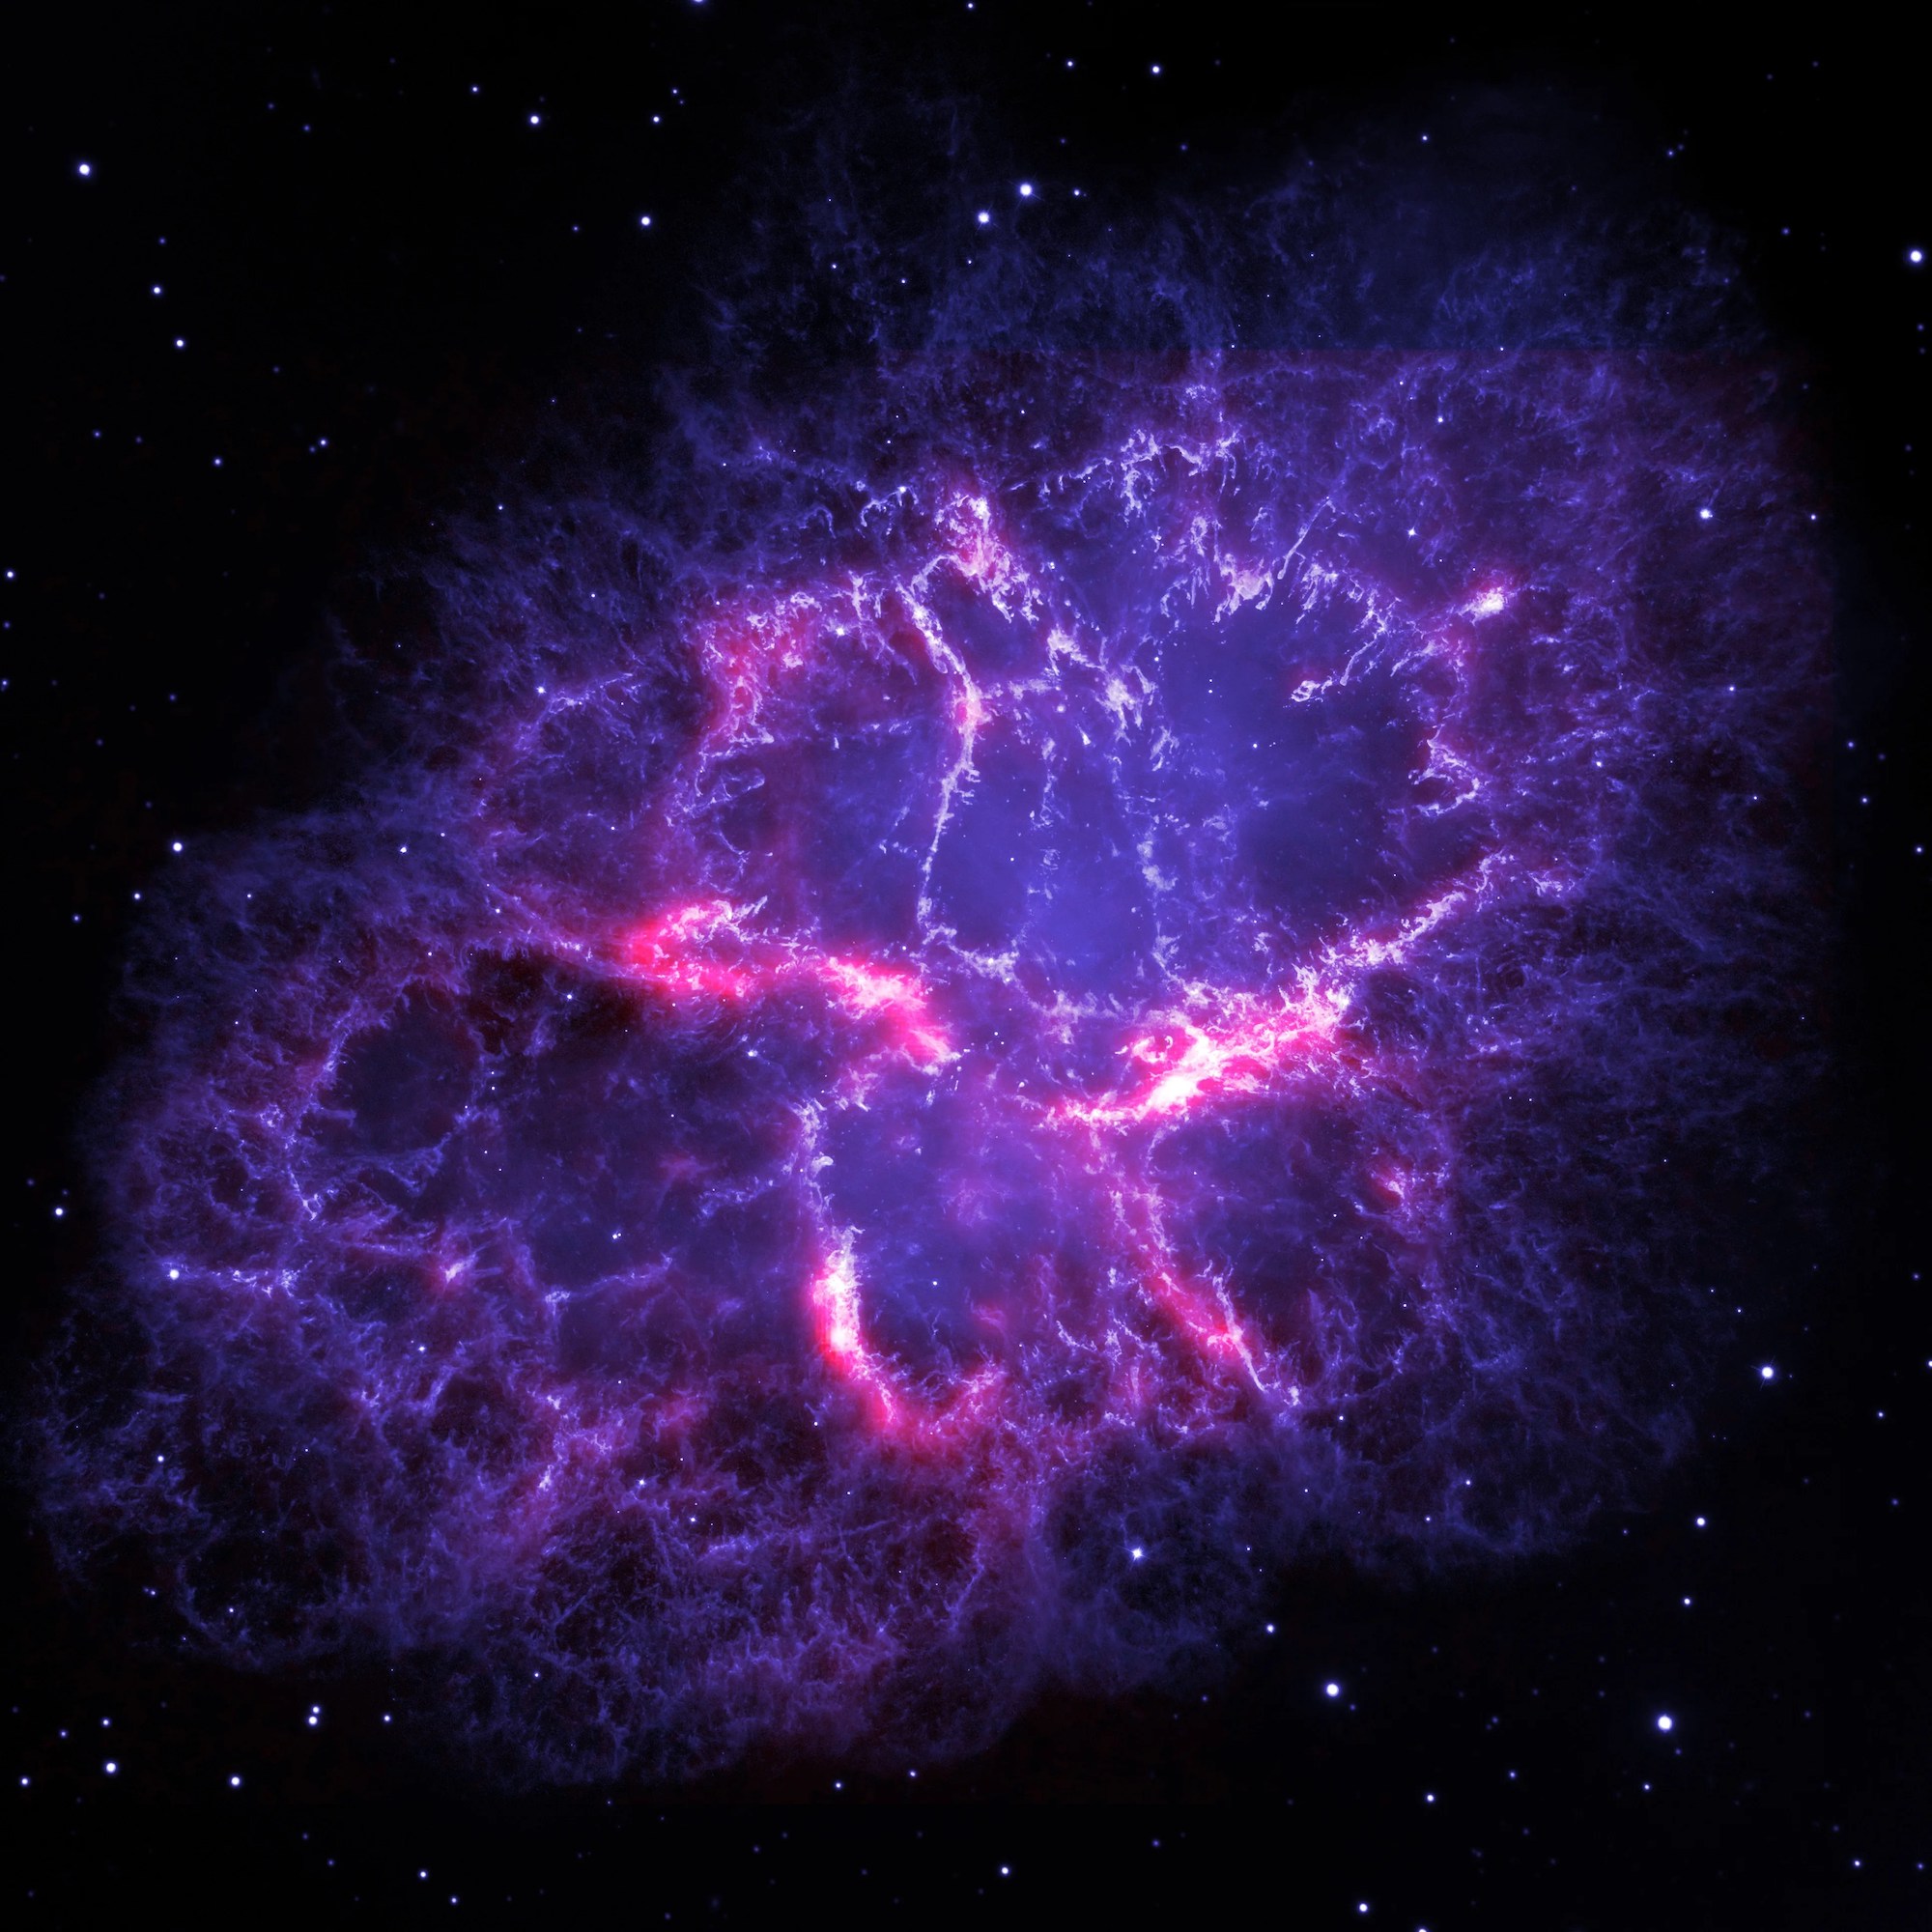
Hubble Space Telescope and Herschel Space Observatory image of the Crab Nebula, which is the remnant of a supernova explosion. [ESA/Herschel/PACS/MESS Key Programme Supernova Remnant Team; NASA, ESA and Allison Loll/Jeff Hester (Arizona State University)]
By measuring the characteristic speeds of these “kicks,” astronomers can deduce how asymmetric the preceding collapse must have been, along with other information about the earliest moments of the supernova. Though measuring the speed of something so small from the other side of the galaxy is no easy task, Disberg and Mandel’s recent publication in The Astrophysical Journal Letters takes on the challenge.
Quantifying the Kicks
The pair first began by examining measurements of neutron stars known to be less than 10 million years old, which is extremely young in an astronomical context. Since these objects haven’t had time to be slowed down or altered from their course by passing stars or the galactic tide, their present-day speeds should be the same as their natal kicks. The researchers found that while every neutron star had its own unique kick velocity, the distribution of all the velocities followed a log-normal pattern with a peak near 150–200 km/s.
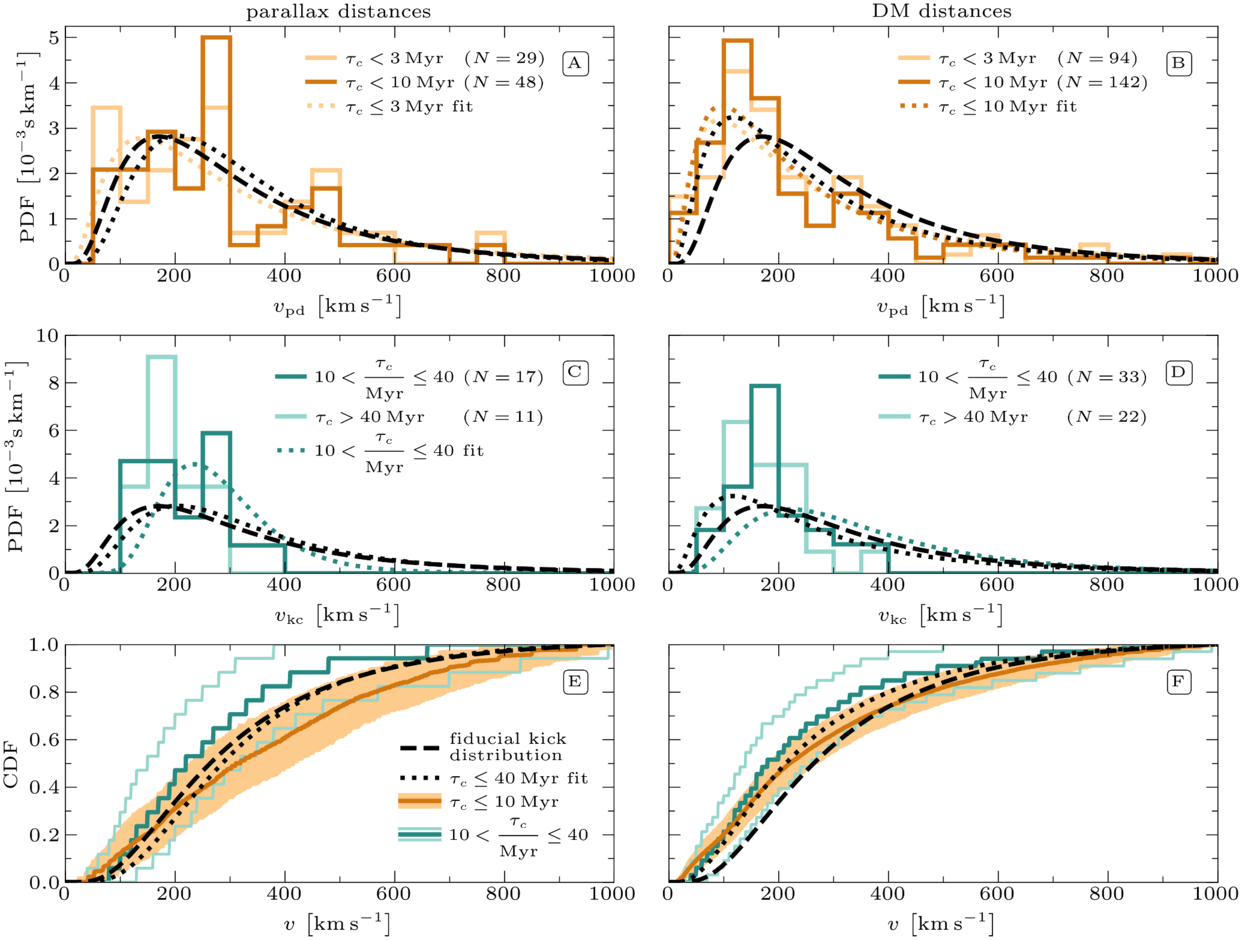
Measured kick velocities (histograms) and fit distributions (curves) for different subsamples. Click to enlarge. [Disberg & Mandel 2025]
Going forward, other astronomers focused on modeling supernovae, orbits within the galaxy, and binary-star evolution can use this distribution either to sanity check their models or as inputs to other simulations. Through slow accumulation of studies like this, each with its own quantified measurement of some property in the galaxy, we come to understand our universe more fully and unlock our ability to make ever more models and predictions.
Citation
“The Kick Velocity Distribution of Isolated Neutron Stars,” Paul Disberg and Ilya Mandel 2025 ApJL 989 L8. doi:10.3847/2041-8213/adf286
The post Kicking Neutron Stars from the Nest appeared first on AAS Nova.
]]>
Astrobites reports on supermassive black holes in the early universe that may have been hiding phases of their growth.
The post Are Quasars Growing in Secret? appeared first on AAS Nova.
]]>Editor’s Note: Astrobites is a graduate-student-run organization that digests astrophysical literature for undergraduate students. As part of the partnership between the AAS and astrobites, we occasionally repost astrobites content here at AAS Nova. We hope you enjoy this post from astrobites; the original can be viewed at astrobites.org.
Title: Quasar Lifetime Measurements from Extended Lyα Nebulae at z∼6
Authors: Dominika Ďurovčíková et al.
First Author’s Institution: MIT Kavli Institute for Astrophysics and Space Research
Status: Published in ApJ
Observations have shown that galaxies, from our own Milky Way to far out into the distant universe, often host supermassive black holes at their centres. While the exact growth history of supermassive black holes is still uncertain, astronomers think that they likely begin as much less massive black holes, which grow primarily by eating up gas in a process known as accretion. As gas falls into the black hole, it releases a huge amount of energy, allowing astronomers to observe accreting black holes even when they’re billions of light-years away from us. The most luminous accreting supermassive black holes are known as quasars.
A supermassive black hole pulls gas in towards itself due to the force of gravity, but light emitted by the gas simultaneously exerts an outward pressure known as radiation pressure. The faster gas is being pulled into the black hole, the more light is emitted by the gas, and the stronger the pressure becomes. Eventually, the pressure will win out over gravity, preventing the black hole from accreting more gas. The theoretical maximum rate at which a black hole could accrete gas, without the gas being blown out by radiation pressure, is known as the Eddington rate.
If you took a black hole that initially weighed about 100 times the mass of our Sun and consistently fed it at the Eddington rate, it would take about 1 billion years to grow to the size of a supermassive black hole. However, measurements of quasar lifetimes suggest that black holes don’t continuously accrete at the Eddington rate, and instead, black holes go through phases of accretion. As a result, we should not expect to find supermassive black holes within the first billion years of the universe’s history.
But the universe loves to throw astronomers curveballs. Indeed, we have observed quasars less than 1 billion years after the Big Bang, suggesting that this simple picture of supermassive black hole growth is not quite right. Many mechanisms have been proposed as ways to speed up black hole growth, including accretion rates higher than the Eddington rate, mergers between two black holes, and phases of obscured growth during which the black hole accretes at the Eddington rate, but most of the light released in this process is hidden from view.
Today’s authors tackle the question of whether black holes have substantial phases of obscured growth by measuring the lifetimes of early universe quasars. Previous measurements have suggested that these quasars have only been active for less than 1 million years. However, the method that was previously used could be underestimating quasar lifetimes if there was a period of obscured growth. To determine whether this is the case, today’s authors use a different, independent method of measuring the quasar’s lifetime; if there’s a significant mismatch between the two age estimates, then it’s likely that the quasar has had significant periods of obscured growth.
The key to the methods used by today’s authors is that they probe different lines of sight to the quasar. Previous methods quantified the effect of a quasar’s light on the intergalactic medium (the diffuse gas in between galaxies) along the line of sight from the quasar to us. The method used in today’s article measures the size of a nebula of ionised gas, in the plane of the sky, at a right angle to the line of sight. While light from the quasar may have been obscured along our line of sight, it’s unlikely to have also been obscured at a different angle at the exact same time.
A quasar emits a lot of photons capable of ionising hydrogen, and as a result, a quasar can carve out bubbles of ionised gas in the otherwise neutral circumgalactic medium. The size of the ionised gas bubble, or nebula, grows at the speed of light, so if you know the size of the nebula, you can estimate the time since quasar activity began. Today’s authors looked for ionised gas in the circumgalactic medium of six early universe quasars, all of which are estimated to have very short lifetimes based on line-of-sight measurements.
To observe ionised nebulae in the circumgalactic medium, today’s authors use observations from the Very Large Telescope’s Multi-Unit Spectroscopic Explorer (MUSE). The first three panels of Figure 1 show you (left to right) the quasar; the point-spread function (PSF), or a model of how the quasar’s light diffracts as it’s observed by MUSE; and the image of the region surrounding the quasar once you subtract the PSF from the image. Each pixel is colour-coded by brightness. The last two panels also show the PSF-subtracted image, but are instead colour-coded by the ratio of signal to noise in each pixel. In the last panel, the signal has been smoothed out, and you can see the structure of a nebula (outlined in red) emerge from the image.
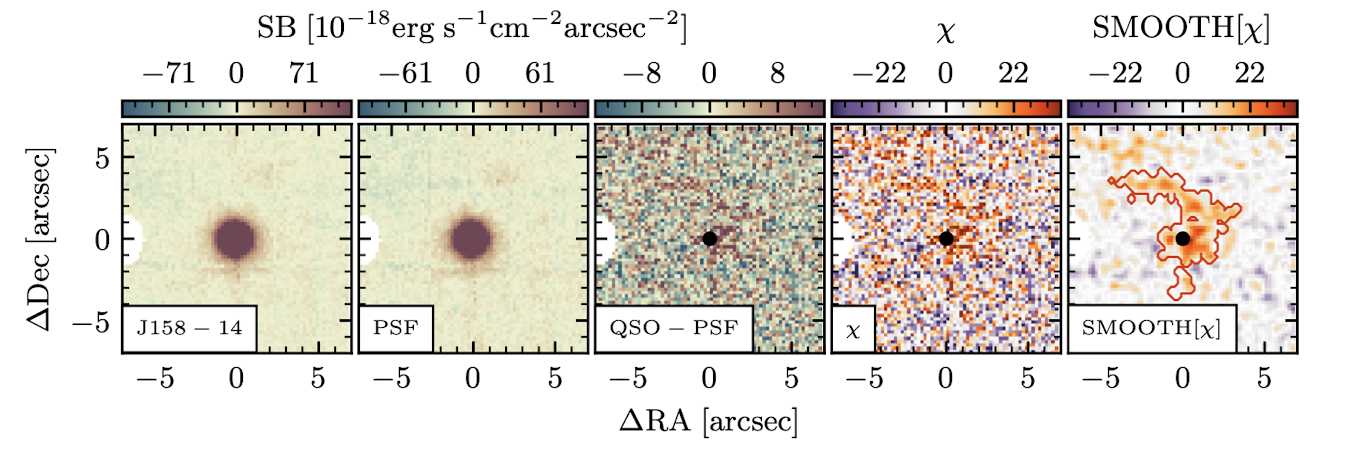
Figure 1: To observe the nebula (red outlined region in the rightmost panel), you have to subtract out the light coming from the quasar (leftmost panel). [Adapted from Ďurovčíková et al. 2025]
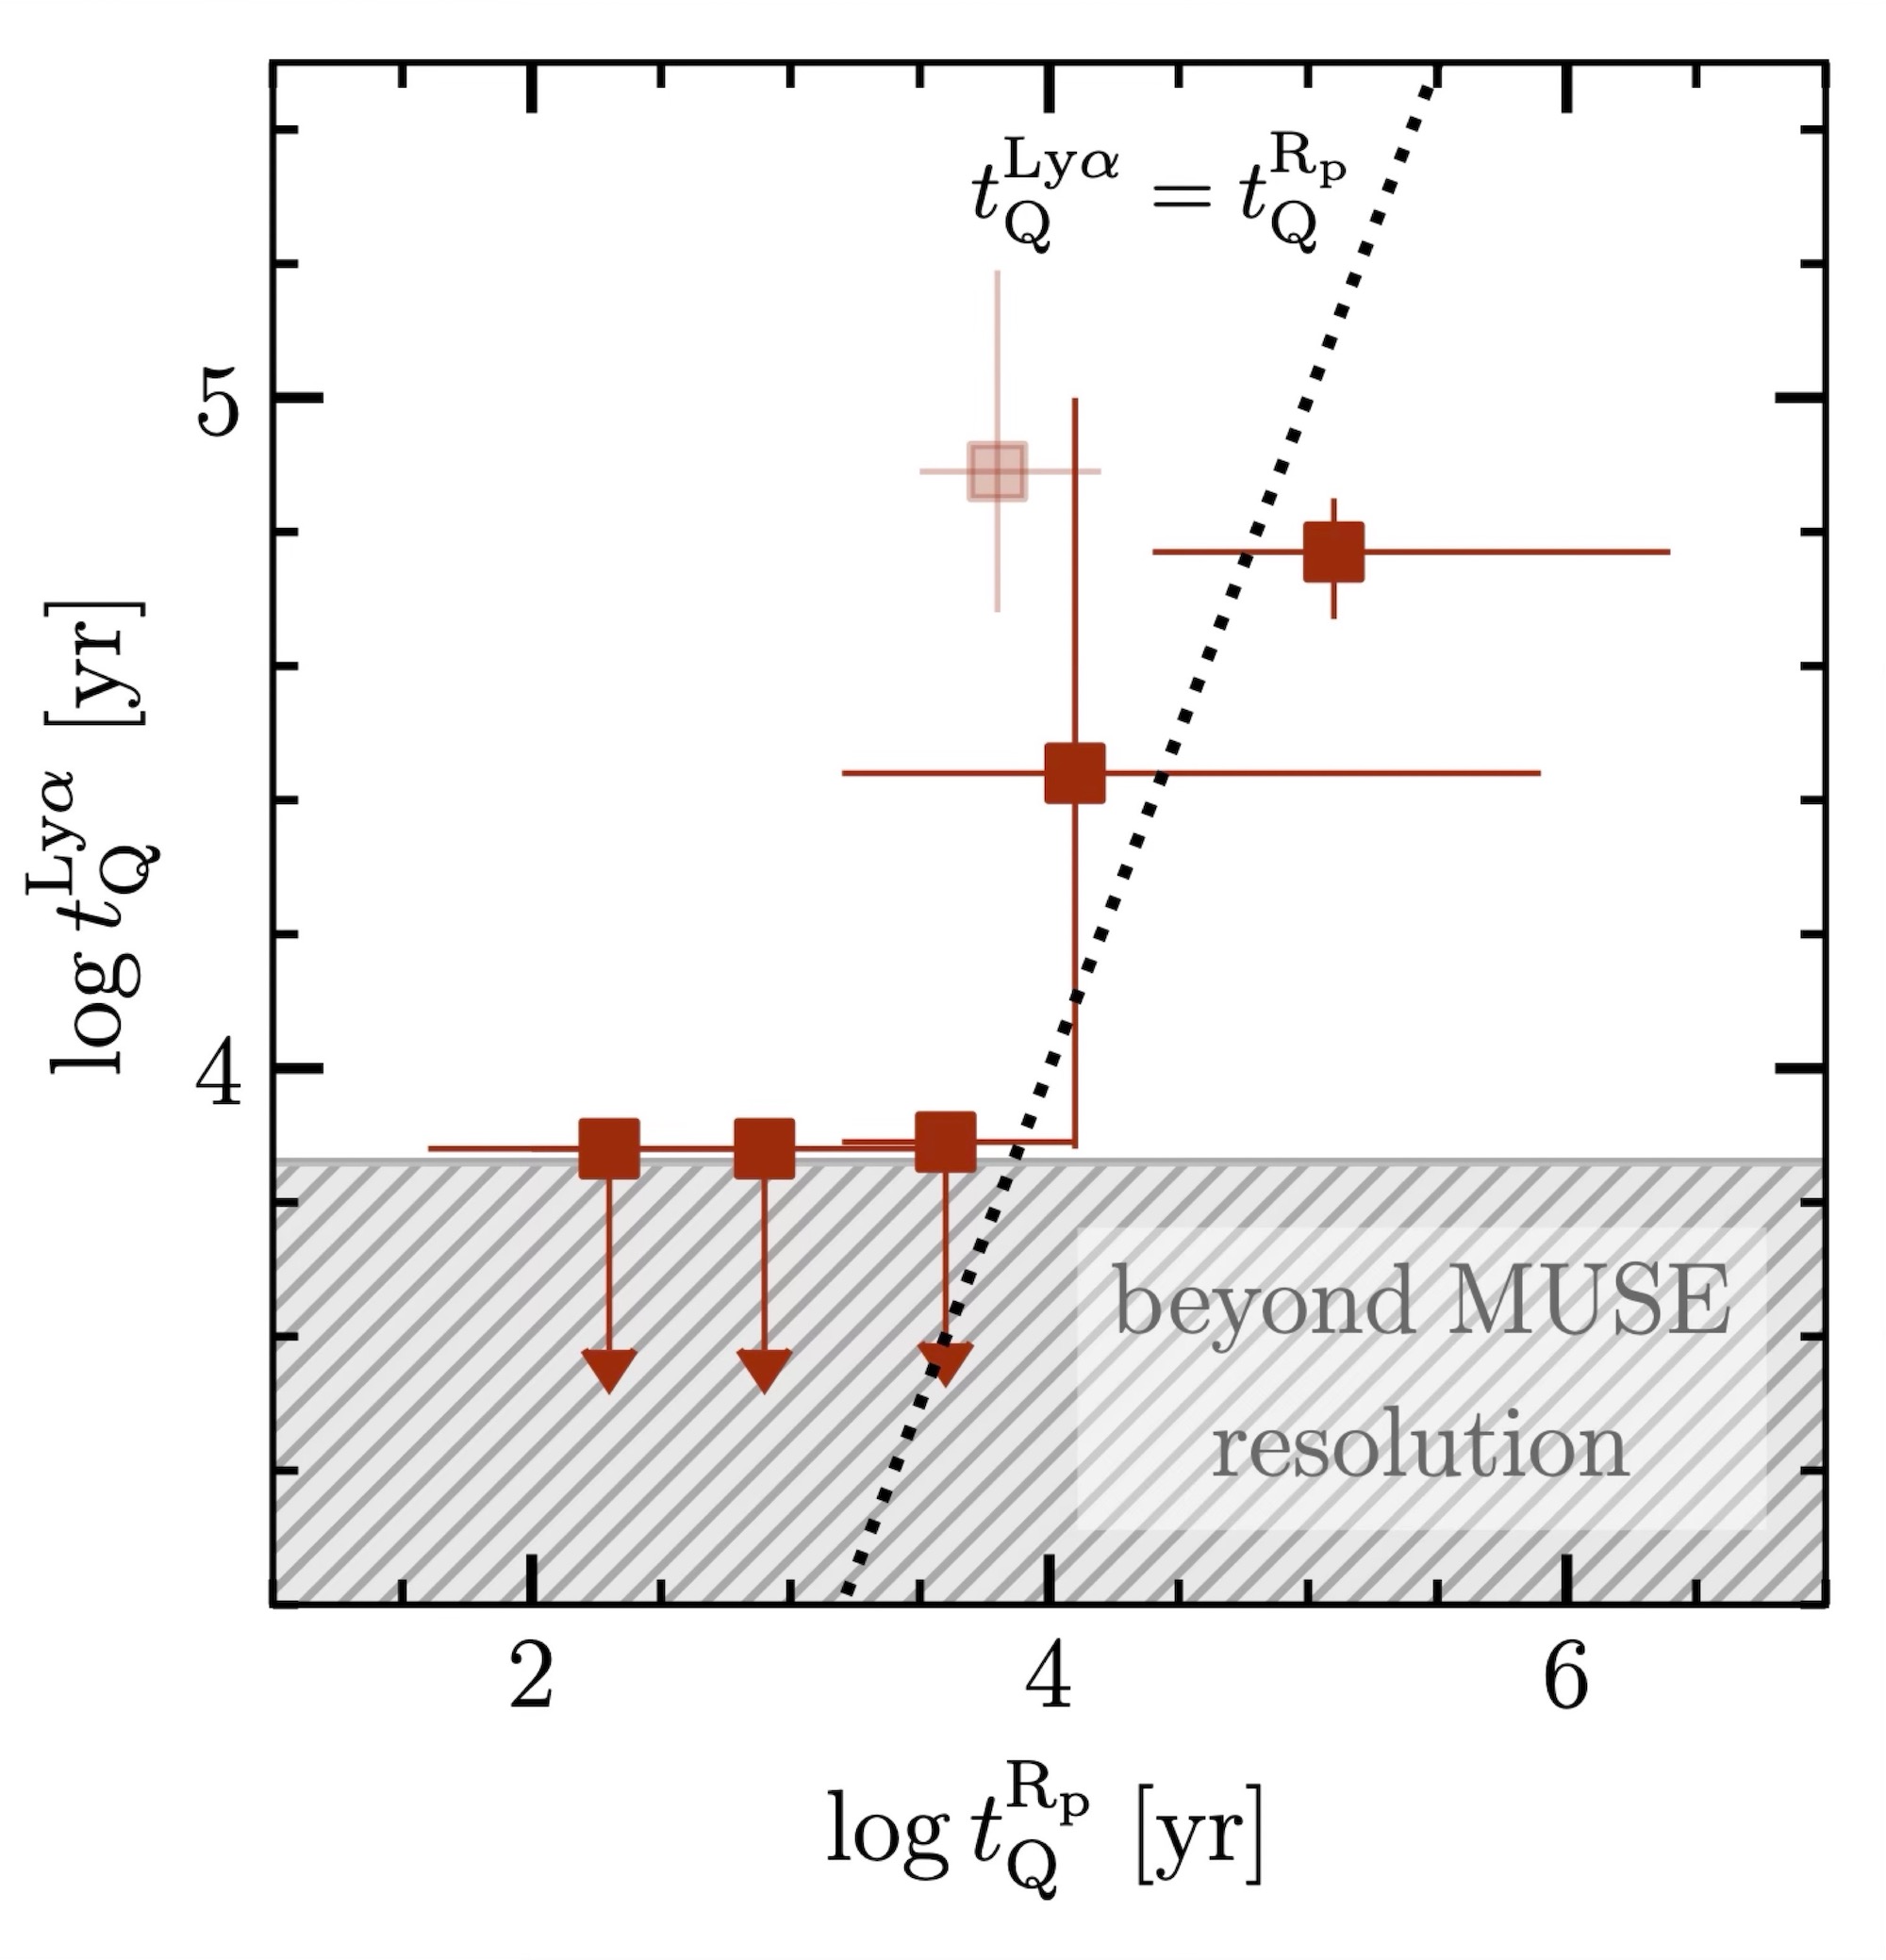
Figure 2: The age estimates derived by today’s authors (y-axis) are similar to the line-of-sight age estimates (x-axis), and generally follow a one-to-one relationship, suggesting that line-of-sight obscuration effects are not leading astronomers to underestimate the age of a quasar. [Adapted from Ďurovčíková et al. 2025]
Age estimates from the two methods are broadly pretty consistent, suggesting that obscuration effects are not causing one method to be severely underestimating the lifetime of a quasar. Therefore, for these six quasars, it seems unlikely that their growth can be primarily explained by phases of obscured growth. Instead, some other mechanism must have allowed these black holes to grow rapidly during the early universe and reach their supermassive sizes.
The mystery of how supermassive black holes can grow so quickly is still to be solved, but today’s article shows us that we haven’t been missing phases of obscured growth. The results of today’s article provide an independent measurement of quasar lifetimes, which models of supermassive black hole growth should be able to explain.
Original astrobite edited by Cesily King.
About the author, Nathalie Korhonen Cuestas:
Nathalie Korhonen Cuestas is a second-year PhD student at Northwestern University, where her research focuses on the chemical evolution of galaxies.
The post Are Quasars Growing in Secret? appeared first on AAS Nova.
]]>
To push the limits of high-precision pulsar measurements, astronomers have reconsidered their approach to data stacking.
The post Cluster Before Stack: A New Algorithm for Pulsar Timing appeared first on AAS Nova.
]]>To measure properties of a pulsar accurately, astronomers have to stack many individual observations together to boost the signal above the noise. But what if there was a more clever, more effective way to add observations than simple stacking?
Weak Cosmic Lighthouses
Pulsars, or rapidly spinning neutron stars that emit narrow cones of radio waves, are often referred to as the galaxy’s lighthouses. Just like a sailor looking to shore might see a periodic flash when a lighthouse’s beacon sweeps over their ship, so too would radio telescopes aimed at a pulsar detect a “pulse” when its beam sweeps across Earth. However, although this comparison to lighthouses is a powerful analogy, it starts to break down when considering the speed and strength of these flashes.
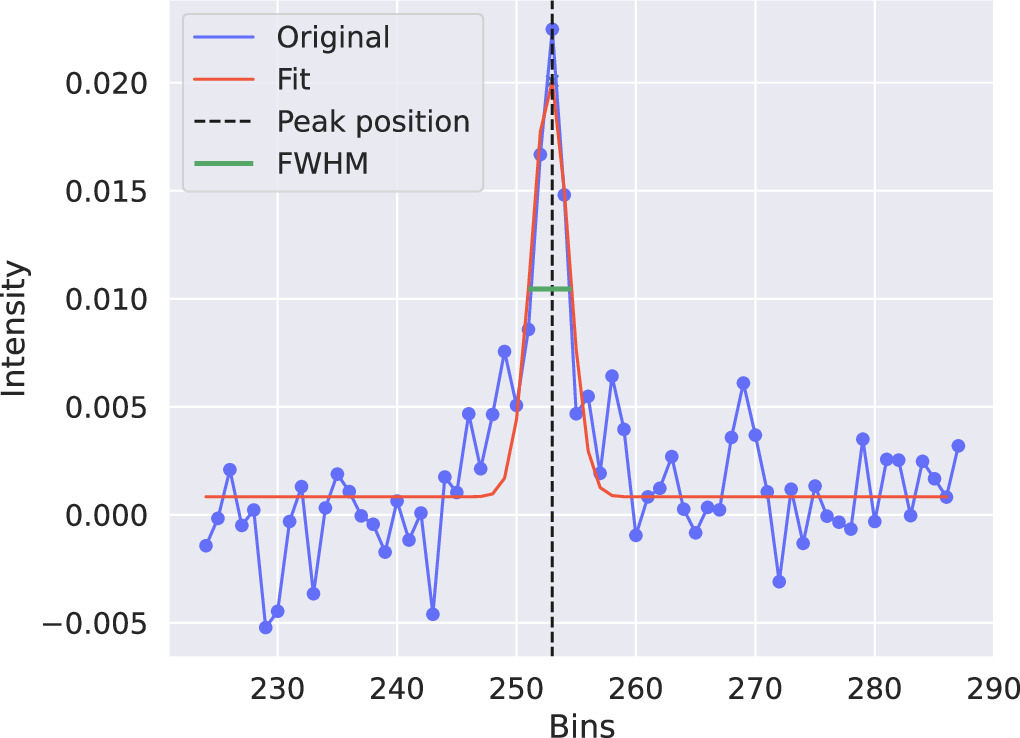
An example of one noisy individual pulse. Click to enlarge. [Sosa Fiscella et al. 2025]
This practice rests of the subtle assertion that every individual pulse is just a noisy variation of the same unchanging pulse profile. But is that safe to assume? And can we improve the precision of our measurements by doing something more complex than simple stacking? These are the questions recently tackled by a team of astronomers led by Sofia V. Sosa Fiscella (Rochester Institute of Technology) in research published in The Astrophysical Journal.
Squeezing the Data
The researchers focused on one particularly bright source named PSR J2145−0750 that was observed by the Green Bank Telescope for two hours in 2017. This pulsar is so bright that it’s possible to measure quantities like the pulse width, height, center, and total energy of individual pulses, not just the final stack. The team did just that for each of the more than 200,000 pulses in their dataset and assigned each one a vector of four numbers. When they next sorted the pulses into distinct groups, they found that there were indeed correlations among these variables: for example, pulses with higher maximum heights tended to arrive earlier and be narrower than the overall average.
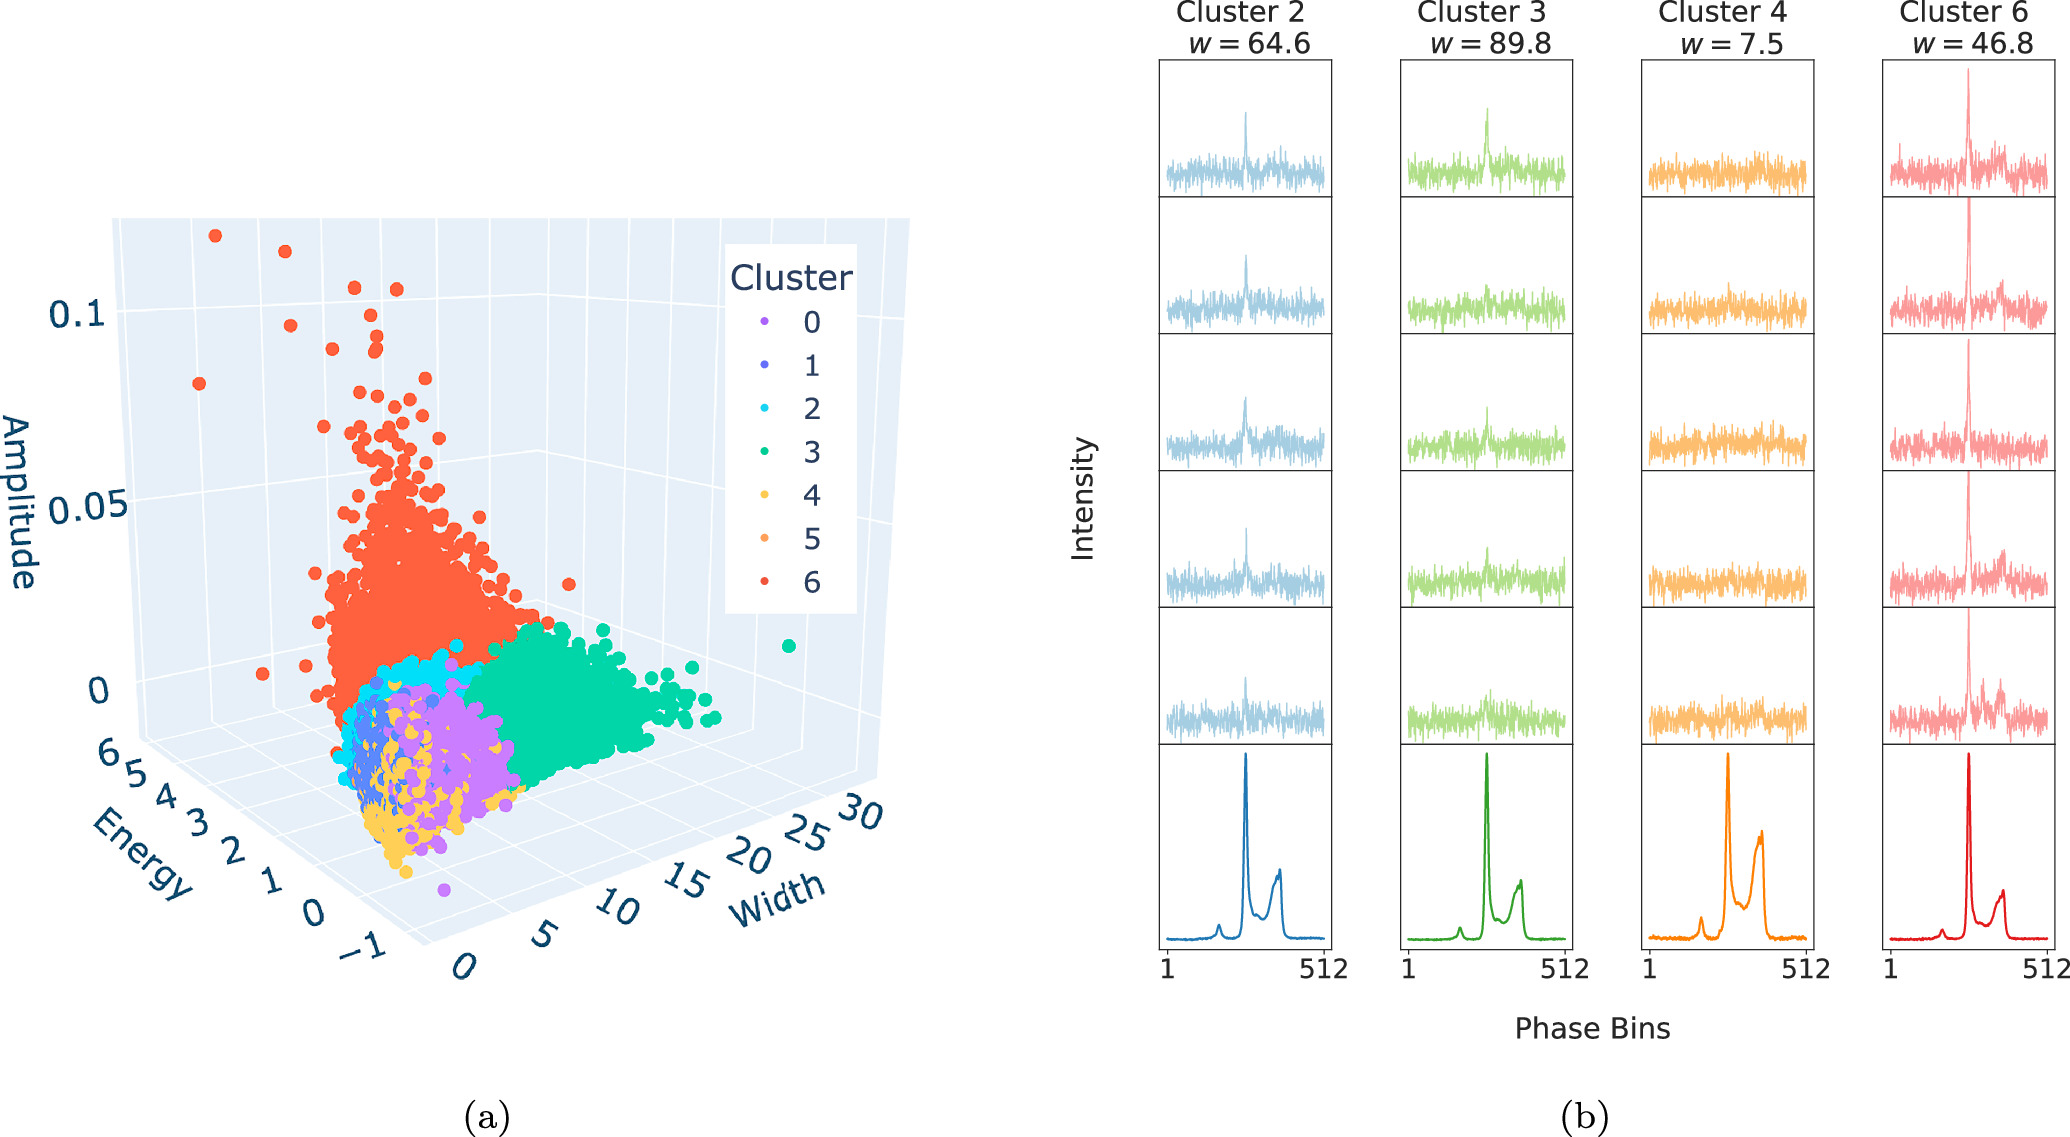
A visual representation of the different pulse clusters. Each point corresponds to one pulse. Click to enlarge. [Sosa Fiscella et al. 2025]
Though the team cautions that this new method will likely only be relevant for the pulsars for which we can measure individual pulses, they also point out that as better telescopes come online, we’ll be able to do that for more pulsars. In the meantime, astronomers can take comfort in the fact that as our technological abilities improve, so do our abilities to squeeze as much from our data as possible.
Citation
“Improving Pulsar Timing Precision with Single Pulse Fluence Clustering,” Sofia V. Sosa Fiscella et al 2025 ApJ 984 111. doi:10.3847/1538-4357/adc1c2
The post Cluster Before Stack: A New Algorithm for Pulsar Timing appeared first on AAS Nova.
]]>
Astrobites reports on research that explores if we’ll be able to find a star that has formed from the gas enriched by only one stellar predecessor.
The post Looking for a Single Stellar Ancestor: Mono-Enriched Stars in Zoom-In Simulations appeared first on AAS Nova.
]]>Editor’s Note: Astrobites is a graduate-student-run organization that digests astrophysical literature for undergraduate students. As part of the partnership between the AAS and astrobites, we occasionally repost astrobites content here at AAS Nova. We hope you enjoy this post from astrobites; the original can be viewed at astrobites.org.
Title: SIRIUS: Identifying Metal-Poor Stars Enriched by a Single Supernova in a Dwarf Galaxy Cosmological Zoom-In Simulation Resolving Individual Massive Stars
Authors: Yutaka Hirai et al.
First Author’s Institution: Tohoku University
Status: Published in ApJL
All of the elements in stars come from, well, other stars. Each star has its own unique makeup of elements, kind of like our own DNA. Just like genes passing down generation after generation, elements in stars can be passed down to newly forming stars after the previous generation has died. So, if you’re looking at the chemical makeup of a particular star, what you’re really seeing is all the elements that were created after another star in the region exploded (went supernova) and enriched the gas (that the new star formed from) around it with elements like oxygen, nitrogen, iron, and more.
Like genealogy for stars, astronomers can use stellar enrichment to work their way back from a star they observe to its potential predecessors. It’s a bit trickier for stars that have a lot of elements, dubbed “metal-rich” stars, because there’s no way to tell which star contributed what mixture of elements at what point in time. However, scientists have recently been observing “extremely metal-poor” stars, which are stars with only small amounts of elements like oxygen, nitrogen, or carbon. Because there are so few of these elements, it’s safe to assume that these stars formed out of gas that didn’t have many predecessor stars enriching it — in fact, astronomers are hoping to find stars that only ever had one ancestor, calling them “mono-enriched” stars. Finding a mono-enriched star would tell us exactly what elements were produced in the supernova — aka in supernova nucleosynthesis.
However, how many of these metal-poor stars are mono-enriched is unknown. Estimating this fraction could help researchers identify more of them. The authors of this study tackle this problem by examining how many might exist in dwarf galaxies and what kind of chemical signatures they could produce.
Simulating Mono-Enriched Stars
To do this, they simulate a dwarf galaxy with the hydrodynamic code ASURA and model the gas physics in the galaxy with CLOUDY. In this method, stars form once the density of hydrogen gas in a region exceeds a certain threshold at a temperature that is cool enough for the gas to clump together. Pockets of this simulated region are then randomly assigned a stellar mass from the initial mass function, and eventually explode, diffusing elements into the gas particles around it.
Finding Mono-Enriched Stars in the Simulated Stellar Haystack
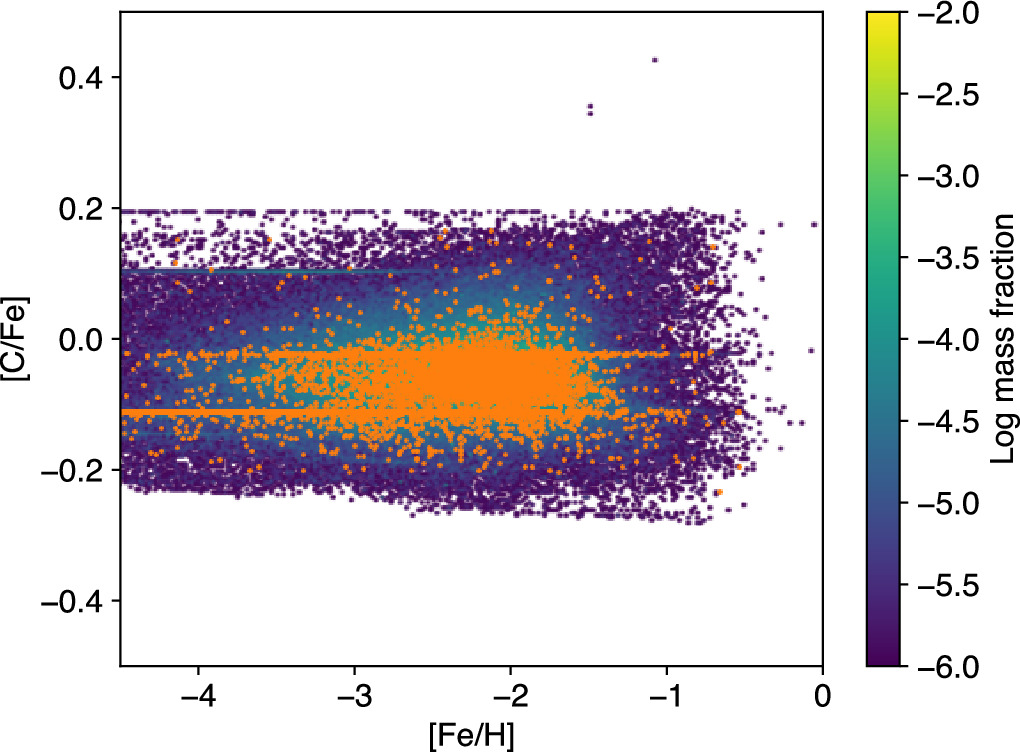
Figure 1: Every simulated star in the dwarf galaxy, shown as a function of their stellar metallicity, [Fe/H], carbon enhancement, [C/Fe], and their mass. Orange points are identified as mono-enriched stars. Click to enlarge. [Hirai et al. 2025]
Once these data points are collected, the authors investigate the fraction of mono-enriched stars at different metallicities. The authors essentially ask, are mono-enriched stars more likely to occur at lower metallicities? They find that, indeed, stars that are lower metallicity (and thus have lower [Fe/H]) are more likely to be mono-enriched (Figure 2). For stars with exceedingly low metallicities, [Fe/H] < −5, about 11% of them in this simulated dwarf galaxy have formed out of gas enriched by only one supernova.

Figure 2: Fraction of mono-enriched stars in the stellar population depending on the stellar metallicity ([Fe/H]) of the population. Stars with much lower metallicities ([Fe/H] < 2.5) are more likely to be mono-enriched. [Hirai et al. 2025]
Finding Mono-Enriched Stars in the Observed Stellar Haystack
These theoretical predictions help observers prepare what to look for when they want to find a mono-enriched star. These predictions seem to suggest that astronomers should keep looking for these extremely metal-poor stars if we want to find these unique stars that tell us about what elements are made in core-collapse supernovae. There is currently a decently large database of extremely metal-poor stars found with photometry, and if observers could follow up with the most ideal candidates spectroscopically we could really test what kind of elements are in these stars. Further, the upcoming Subaru Prime Focus Spectrograph will take many spectroscopic observations of close-by dwarf galaxies, which may contain more extremely metal-poor stars.
The authors note there is more work to be done in simulations, as they are interested in testing how extremely metal-poor stars, specifically ones with enhanced carbon, form. All of this will hopefully lead to a better understanding of how elements are made when stars explode, perhaps leading us to how some of the earliest elements formed in the early universe.
Original astrobite edited by Diana Solano-Oropeza.
About the author, Caroline von Raesfeld:
I’m a third-year PhD student at Northwestern University. My research explores how we can better understand high-redshift galaxy spectra using observations and modeling. In my free time, I love to read, write, and learn about history.
The post Looking for a Single Stellar Ancestor: Mono-Enriched Stars in Zoom-In Simulations appeared first on AAS Nova.
]]>
Our galaxy likely contains far more supernova remnants than we've found so far. What progress have recent radio surveys made in the hunt for supernova remnants?
The post Featured Image: Hunting for Missing Supernova Remnants with EMU and POSSUM appeared first on AAS Nova.
]]>Researchers estimate that there are at least 1,000 supernova remnants in our galaxy that should be visible at radio wavelengths today — but so far, only a few hundred have been confirmed. Embarking on a search for the missing supernova remnants, Brianna Ball (University of Alberta) and collaborators used radio observations from the Evolutionary Map of the Universe (EMU) and Polarization Sky Survey of the Universe’s Magnetism (POSSUM) surveys. The image above presents a portion of that search, overlaying the positions of various objects of interest atop a background of radio continuum emission from EMU. Several types of objects are indicated: previously known supernova remnants (red), previously identified candidate remnants (orange), new candidates (white), known H II regions (cyan), and young pulsars (green stars). So far, the team has newly confirmed 14 supernova remnants, six of which were identified for the first time thanks to EMU and POSSUM, and 37 new candidate remnants. As the EMU and POSSUM surveys continue, the authors expect that as many as 400 candidate supernova remnants may be spotted. If these candidates are confirmed, it would nearly close the gap between expected and observed numbers of supernova remnants in the regions covered by these surveys. To learn more about this search for supernova remnants, be sure to check out the full research article linked below.
Citation
“A Catalog of Galactic Supernova Remnants and Supernova Remnant Candidates from the EMU/POSSUM Radio Sky Surveys. I.,” B. D. Ball et al 2025 ApJ 988 75. doi:10.3847/1538-4357/addc63
The post Featured Image: Hunting for Missing Supernova Remnants with EMU and POSSUM appeared first on AAS Nova.
]]>
Using CHIME, a new collaboration has embarked on a journey to discover pulsars across the northern sky.
The post Chiming In on the Pulsar Search: Searching for Pulsars with CHIME appeared first on AAS Nova.
]]>Pulsars, the best timekeepers in the universe, are key to many fields within astronomy. A new survey searching for pulsars has come online and is already making discoveries.
Searching for Pulsars
Pulsars, the extremely dense cores left over from some massive stars’ deaths, act as astronomical lighthouses — spinning fast and emitting jets of light from their magnetic poles, they send steady pulses of light to observers on Earth. Pulsars are particularly intriguing sources, providing insights into multiple areas of astrophysics like gravitational waves, general relativity, and high-density matter properties. While more than 3,700 pulsars have been discovered to date, increasing this number will enable further exciting science.
Multiple pulsar surveys have utilized single-dish radio telescopes to cover portions of the sky, and to date, these surveys have primarily focused on finding pulsars near the dense stellar population in the Milky Way’s galactic plane. While these surveys have detected many pulsars, they are limited by their small fields of view, taking longer to cover large portions of the sky, and they miss the population of pulsars that must lie within globular clusters orbiting in the galactic halo. Some low-frequency detectors address these limitations but require intense computational resources to sift through the raw data to find pulsars. How can we search for pulsars efficiently across the sky?
Introducing CHAMPSS
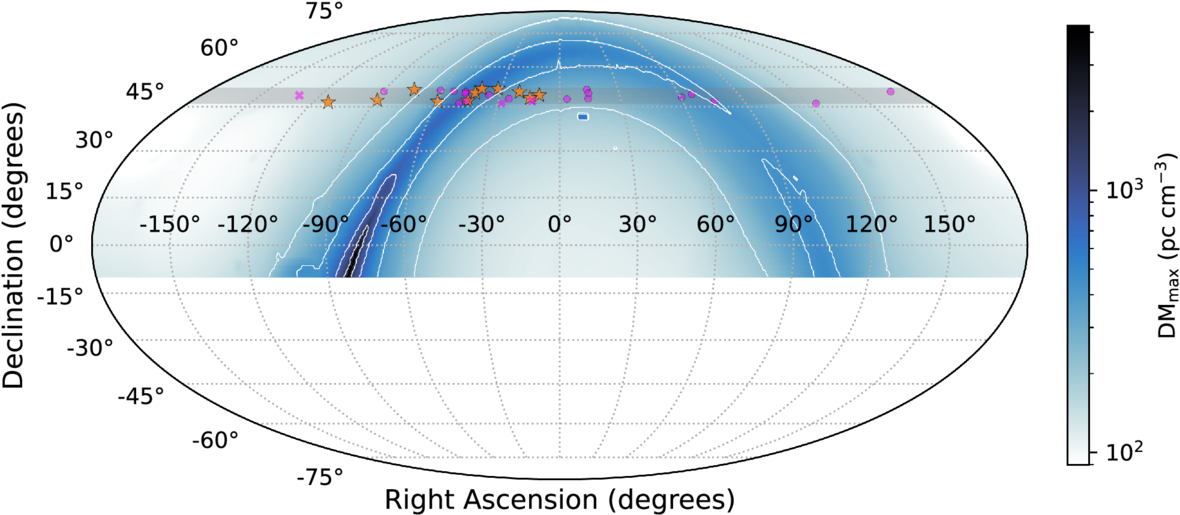
CHAMPSS pointing map showing the survey’s planned sky coverage. The orange stars correspond to the newly discovered pulsar, and the pink points denote known pulsars within the commissioning surveys. Click to enlarge. [Andrade et al 2025]
With a clear opportunity to advance the pulsar search, a group of scientists developed the CHIME All-sky Multiday Pulsar Stacking Search (CHAMPSS) — a radio pulsar survey that covers the full northern sky daily and uses long-term data stacking to detect irregular and faint sources. Through stacking observations across multiple days, CHAMPSS builds up signals to find faint sources that would otherwise go undetected. The data processing pipeline searches in real time for strong peaks that signify a transient radio event, and follow-up analysis determines if the event is a pulsar candidate. A strong candidate then moves through further stages to confirm it as a pulsar and determine its properties.
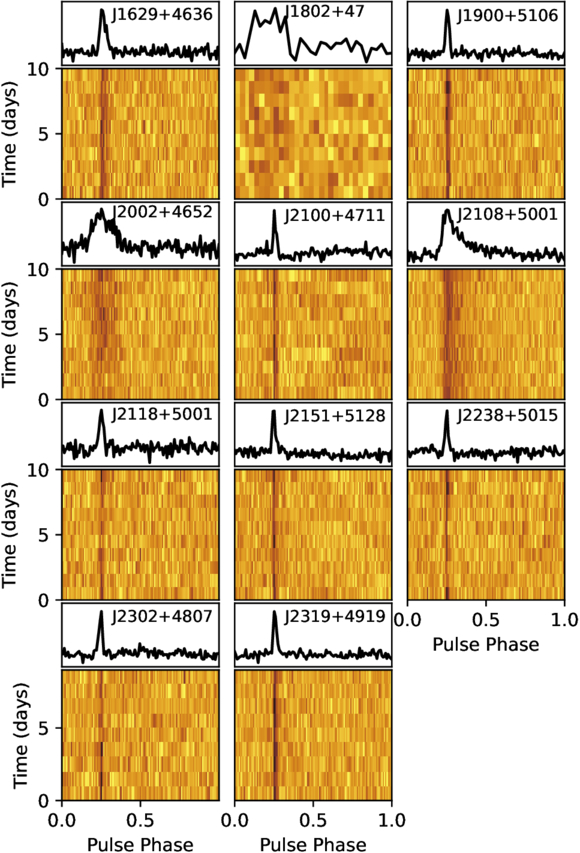
The 11 pulsars discovered with CHAMPSS. Click to enlarge. [Andrade et al 2025]
First Discoveries and Looking Forward
What has CHAMPSS uncovered thus far? In testing the system through multiple commissioning surveys on a small subset of the sky, the CHAMPSS collaboration has discovered 11 new pulsars with periods ranging from 0.2 to 1.5 seconds. Additionally, the collaboration tested the sensitivity of their survey by searching for known pulsars within the observed area, and they found that their predicted and detected signal-to-noise ratios for known pulsars agree well. This confirmation allows the team to advance to the next phase of the survey, and it will soon be in full swing.
CHAMPSS complements and expands upon other radio pulsar searches, discovering faint and irregular sources that are missed without repeated observations. The future of pulsar astronomy is promising, and with the advent of this survey, a new collection of pulsars will be discovered.
Citation
“CHIME All-sky Multiday Pulsar Stacking Search (CHAMPSS): System Overview and First Discoveries,” Christopher Andrade et al 2025 ApJ 990 50. doi:10.3847/1538-4357/adeb51
The post Chiming In on the Pulsar Search: Searching for Pulsars with CHIME appeared first on AAS Nova.
]]>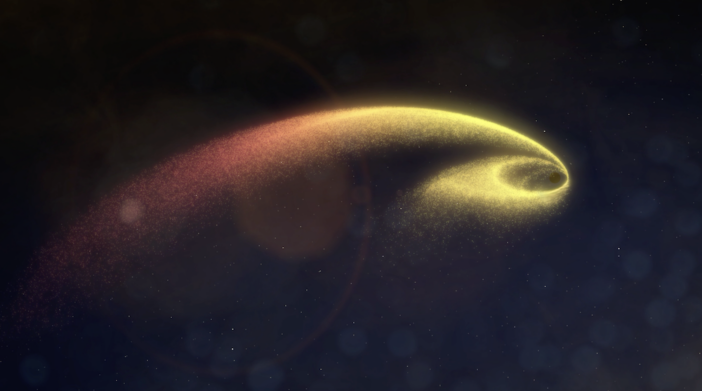
Say a star wandered close enough to a black hole to be partially ripped apart, but lived to tell the tale. What does the rest of its life look like?
The post Scars from a Black Hole appeared first on AAS Nova.
]]>Simulations suggest that there should be a million stars in our galaxy that once wandered so close to a supermassive black hole that they were nearly destroyed. What are the long-term effects of this encounter, and could astronomers observe the scars of these near-death experiences?
Moths to a Flame
This infrared and X-ray image of the Milky Way’s center shows a swirl of hot gas surrounding Sagittarius A*, our galaxy’s central supermassive black hole. [NASA, ESA, SSC, CXC, STScI]
Simulations suggest that most of the time, these hapless stars are not completely destroyed by their close encounters with the black hole. In principle, then, there should be about a million “survivor” stars wandering near the center of our galaxy. But, what would these survivors look like? And with careful measurements, could we tell them apart from their regular, unscathed counterparts?
Simulating a Star’s Worst Day
Recently, a team of astronomers led by Rewa Clark Bush (University of California Santa Cruz, Cabrillo College, Wesleyan University) tackled this question. First, the team needed to simulate a terrible day for a hypothetical star: the day it passes closest to the black hole. To compute what happens to the star in those intense couple of hours, they used an open-source hydrodynamic code called FLASH to track the state of the star in granular detail.
Temperatures (top row) and diffusion timescales (bottom row) of four stars soon after their closest approach to the black hole. Click to enlarge. [Bush et al. 2025]
Back on Track
Comparison of the original undisturbed stars (filled circles), the stars after a black hole encounter (open symbols), and other stars with different initial masses (black points). Click to enlarge. [Bush et al. 2025].
Eventually, though, these stars pretty much return to a new normal. Though these stars would have had slightly different colors and luminosities had they not encountered the black hole, they end up looking similar to undisturbed stars with the same final mass.
Although detailed spectroscopic measurements of these remnants might reveal a strange composition thanks to all the stirring that happened during the flyby, it’d be hard to tell anything happened to these stars otherwise. Ultimately, life goes on, even for stars that were nearly destroyed by the most massive creature in the galaxy.
Citation
“Black Hole Survival Guide: Searching for Stars in the Galactic Center that Endure Partial Tidal Disruption,” Rewa Clark Bush et al 2025 ApJL 990 L7. doi:10.3847/2041-8213/adefde
The post Scars from a Black Hole appeared first on AAS Nova.
]]>
Astobites reports on a surprising dust curve in a distant galaxy that challenges what we know about cosmic dust.
The post A Dust Curve That Breaks the Mold appeared first on AAS Nova.
]]>Editor’s Note: Astrobites is a graduate-student-run organization that digests astrophysical literature for undergraduate students. As part of the partnership between the AAS and astrobites, we occasionally repost astrobites content here at AAS Nova. We hope you enjoy this post from astrobites; the original can be viewed at astrobites.org.
Title: The AURORA Survey: The Nebular Attenuation Curve of a Galaxy at z = 4.41 from Ultraviolet to Near-Infrared Wavelengths
Authors: Ryan L. Sanders et al.
First Author’s Institution: University of Kentucky
Status: Published in ApJ
Imagine a galaxy from 13 billion years ago, long before the Milky Way took its current form. Now picture trying to uncover the secrets of that ancient galaxy. How quickly did it create stars and evolve? Here’s the tricky part: its light has journeyed across an unimaginable distance to get here. On its journey, cosmic dust — tiny grains of carbon and silicates — has scattered and dimmed the light, making the task harder.
Dust doesn’t just block light — it changes it. Ultraviolet (UV) light gets scattered much more than light at longer wavelengths, which is why galaxies seem redder and dimmer than they truly are. This dual nature can be seen in the “Pillars of Creation,” in Figure 1. A new near-infrared image from NASA’s JWST, shown in the right panel below, helps us peer through more of the dust in this star-forming region. The thick, dusty brown pillars are no longer as opaque, and many more red stars that are still forming come into view.
Figure 1: On the left, NASA’s Hubble Space Telescope captures the iconic Pillars of Creation in stunning visible light (2014). On the right, JWST unveils a breathtaking infrared view, revealing even more details hidden within the cosmic dust. [NASA, ESA, CSA, STScI; Joseph DePasquale (STScI), Anton M. Koekemoer (STScI), Alyssa Pagan (STScI)]
But here’s the catch: most of the dust curves we have were designed for galaxies much closer to us, like the Milky Way or the SMC, so they may not apply in the exact same way to distant galaxies. Whether those same curves work for the much younger, chaotic galaxies of the early universe is an open question. The dust in nearby galaxies is well studied and relatively predictable, but does dust behave the same way in galaxies billions of years in the past?
This question drove Ryan Sanders and collaborators to study GOODSN-17940, a starburst galaxy located at a redshift of z = 4.41, when the universe was just 1.36 billion years old. Observed as part of the Assembly of Ultradeep Rest-optical Observations Revealing Astrophysics (AURORA) survey using JWST, this galaxy provided an unprecedented opportunity to investigate how dust behaved in the distant past. Using JWST’s NIRSpec instrument, the team constructed a unique dust curve by studying 11 hydrogen emission lines from Hα to H12 (the twelfth line in the rest-frame optical Balmer series), shown in Figure 2. These lines act like lighthouses, their brightness giving away how much light is being absorbed by dust at each wavelength. By comparing the observed brightnesses of these lines, the researchers created a detailed dust curve tailored to GOODSN-17940.
Figure 2: Spectrum of GOODSN-17940 from the AURORA survey, showing hydrogen Balmer lines. These features help estimate the galaxy’s dust and ionization conditions. The top panel presents the 2D spectrum, showing spatially resolved emission that traces the galaxy’s structure, while the bottom panel shows the corresponding 1D spectrum. [Adapted from Sanders et al. 2025]
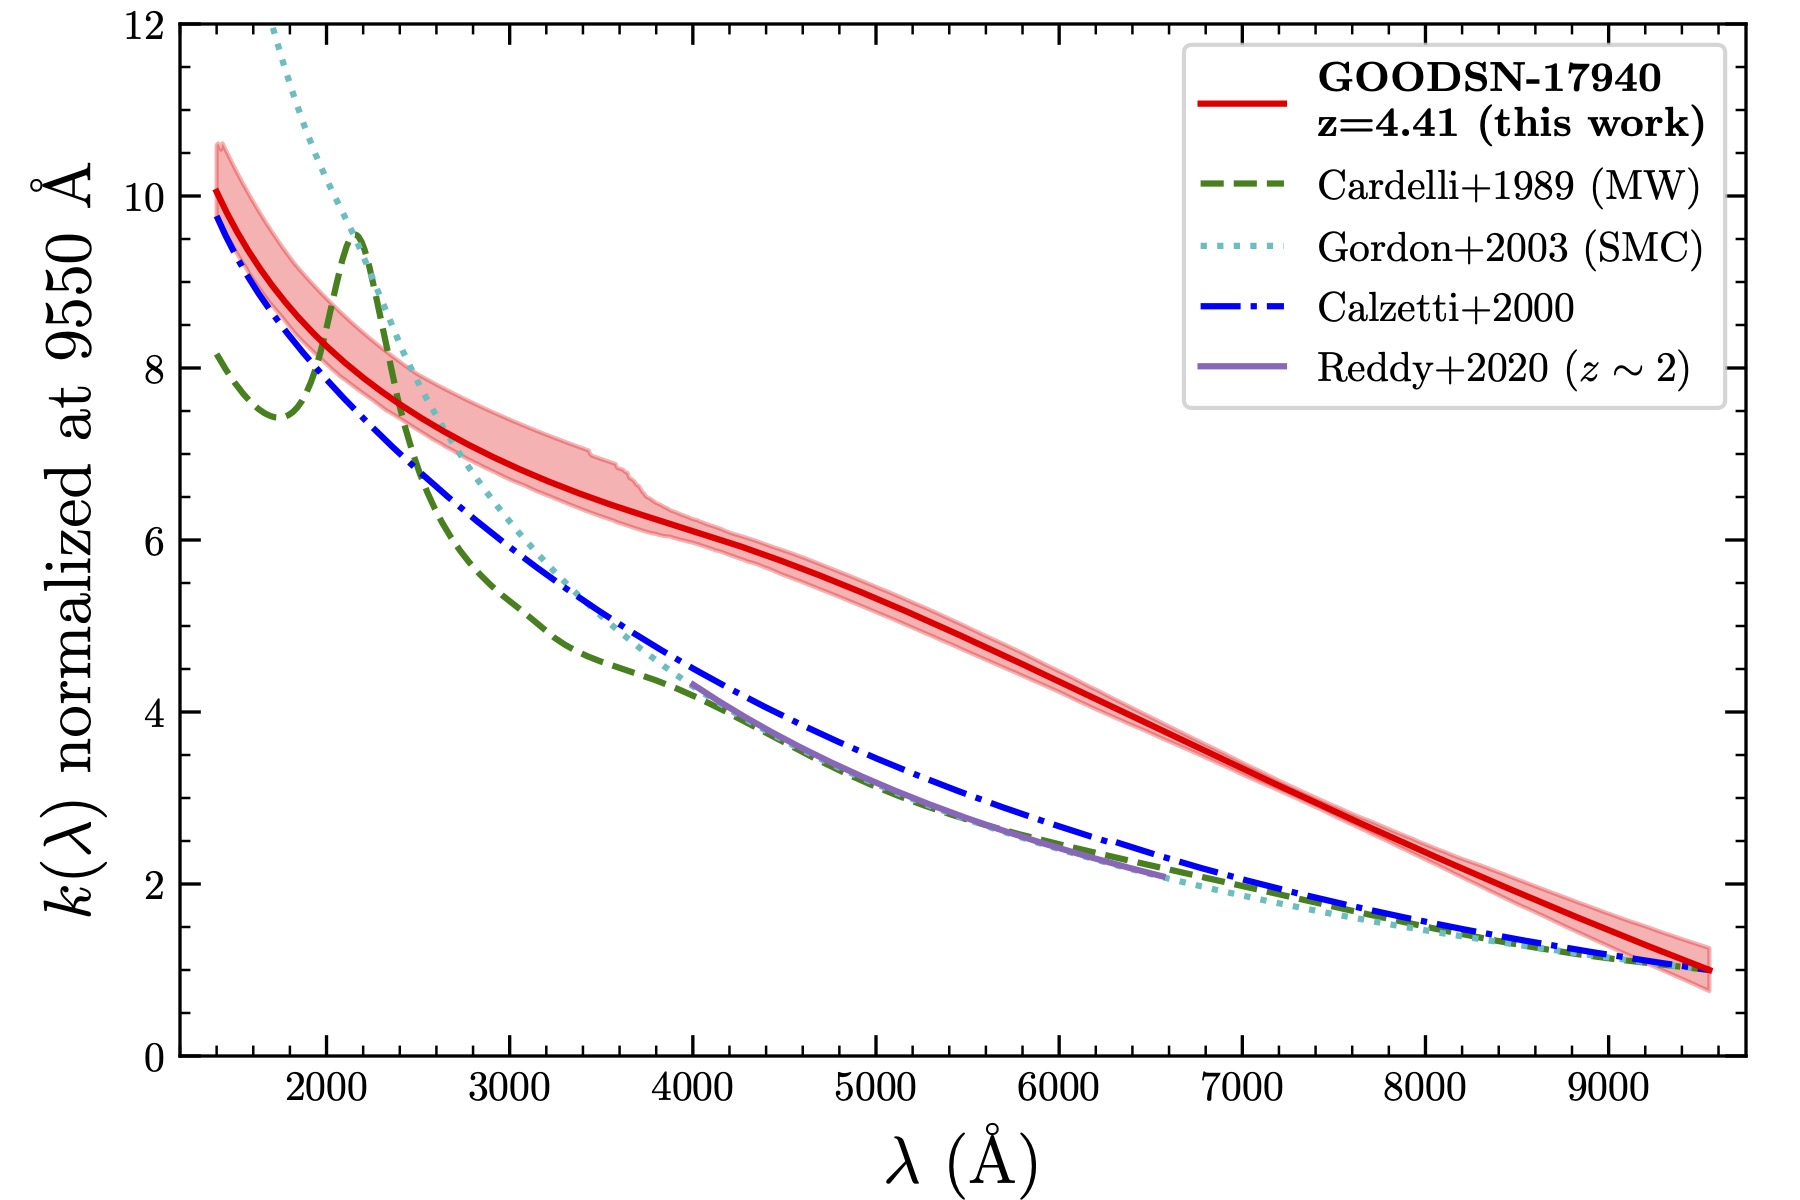
Figure 3: The dust curve of GOODSN-17940 (solid red line) at z = 4.41, derived in this work, compared to established curves for the Milky Way (green dashed), Small Magellanic Cloud (SMC, dotted cyan), Calzetti et al. (blue dot-dashed), and Reddy et al. z ~ 2 galaxies (purple solid). This curve is steeper in the near-infrared and flatter in the UV, highlighting unique dust properties in this galaxy. [Sanders et al. 2025]
So, why does this even matter? If you used the Milky Way’s dust curve to adjust for the dust in a galaxy like GOODSN-17940, you’d be way off. In fact, you’d underestimate its star formation rate by up to 50%! This isn’t just a minor detail — it could explain why star formation rates derived from Hα don’t always match those derived from UV luminosity. Such details can completely change how we interpret a galaxy. It’s the difference between a galaxy steadily forming stars and one caught in a dramatic starburst phase. That’s why astronomers focus on creating dust curves tailored to individual galaxies. This study isn’t just about one galaxy — it’s about rethinking how we interpret dust, star formation, and galaxy evolution in the early universe. Before JWST, isolating individual emission lines from distant galaxies was challenging, but it has become much more efficient now. As more galaxies like GOODSN-17940 are studied, we might find that many early galaxies had dust curves breaking the mold, forcing us to refine how we measure star formation and understand cosmic history.
Original astrobite edited by Hilary Diane Andales and Delaney Dunne.
About the author, Niloofar Sharei:
I’m a third-year Astronomy PhD student at University of California, Riverside, where I study bursty star formation histories and how galaxies take shape. When I’m not busy exploring the universe, you can usually find me curled up with a good book, hiking somewhere peaceful, trying astrophotography, or getting lost in Bach’s music and art.
The post A Dust Curve That Breaks the Mold appeared first on AAS Nova.
]]>
Researchers present the first-ever millimeter-wavelength map of Callisto, the coldest and most weather-worn of Jupiter's major moons.
The post A Close Look at an Ancient Moon appeared first on AAS Nova.
]]>By piecing together observations from dozens of radio telescopes in Chile, planetary scientists recently completed the first-ever map of Callisto’s emission at millimeter wavelengths.
Old and Cold
In striking contrast to Io’s frenzied volcanism and Europa’s cracking ice shell, Jupiter’s moon Callisto is much quieter and colder than its Galilean siblings. Though a liquid water ocean hypothetically sloshes beneath its frigid surface, it’d be hard to infer that just by looking at the moon. Callisto’s terrain is ancient, static, and bears the scars of the millennia of exposure to space. There are no volcanoes, plate tectonics, or any other features to disturb what researchers call “evolved ruins” of the numerous craters. These have names like Valhalla, Asgard, and Lofn, since Callisto’s geologic features are named after settings and characters in Norse mythology to further reinforce their freezing existence.
This never-reset canvas makes Callisto an ideal laboratory for studying the long-term effects of asteroid impacts, dust accumulation from nearby natural satellites, and other processes that modify a planetary surface over time. One way to infer the composition and structure of the first few meters of material is to observe the way the temperature changes over the course of a day. For example, ice and rock respond differently to temperature changes; similarly, small-grains of either material warm up and cool down at different speeds than their larger-grain counterparts.
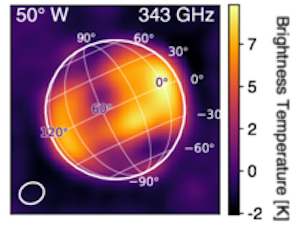
The residuals from one of ALMA’s observations of Callisto. [Adapted from Camarca et al. 2025]
Mapping from Afar
A team led by Maria Camarca, California Institute of Technology, just finished churning through all of the data and assembling their map of Callisto’s temperature residuals. Though the final spatial resolution was at best a few hundred kilometers, meaning a comparable map of Earth would blur all of New England together, this represents the most detailed thermal map of Callisto yet. The map was detailed enough to easily spot the largest craters, and several impact craters including Valhalla stood out as being 3–5K colder than all of the surrounding terrain. The team spotted another anomalously cold region that coincides with the location of maximum carbon dioxide gas density recently seen with JWST.
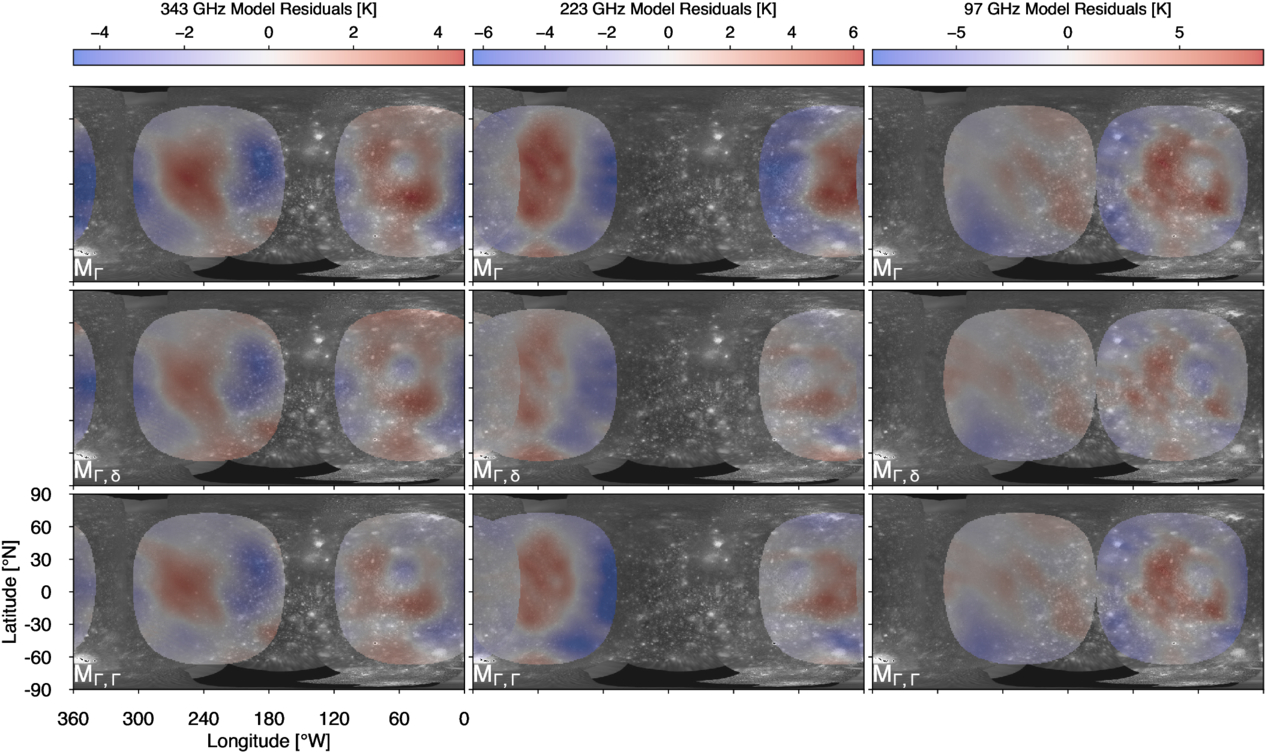
A map of Callisto’s thermal emission (red/blue) overlaid atop visible images of the surface collected by spacecraft. Click to enlarge. [Camarca et al. 2025]
Citation
“A Multifrequency Global View of Callisto’s Thermal Properties from ALMA,” Maria Camarca et al 2025 Planet. Sci. J. 6 183. doi:10.3847/PSJ/ade7ee
The post A Close Look at an Ancient Moon appeared first on AAS Nova.
]]>
Astrobites reports on how clouds might actually be a good thing when it comes to detecting biosignatures with NASA's proposed next-generation space telescope, the Habitable Worlds Observatory.
The post Weather Forecast for the Habitable Worlds Observatory: Cloudy with a Chance of Biosignatures appeared first on AAS Nova.
]]>Editor’s Note: Astrobites is a graduate-student-run organization that digests astrophysical literature for undergraduate students. As part of the partnership between the AAS and astrobites, we occasionally repost astrobites content here at AAS Nova. We hope you enjoy this post from astrobites; the original can be viewed at astrobites.org.
Title: Clouds Can Enhance Direct-Imaging Detection of O2 and O3 on Terrestrial Exoplanets
Authors: Huanzhou Yang, Michelle Hu, and Dorian S. Abbot
First Author’s Institution: University of Chicago
Status: Published in ApJ
In the hunt for life beyond Earth, studying exoplanet atmospheres is one of our most powerful tools. The atmosphere of an exoplanet acts as a window into its environment and allows astronomers to take a guess at what processes are shaping the planet’s climate, chemistry, and thus, its potential for habitability. The gases present in the planet’s atmosphere impart a unique spectral fingerprint on the light that passes through the atmosphere and allows us to identify what gases might be present and look for possible signs of life.
JWST is already hard at work looking at distant worlds and gathering spectroscopic data for us to analyse. It has already observed several exoplanets and recorded the light that passed through their atmospheres. This has not only sparked a debate over what could be interpreted as the first possible signs of biological activity, but has also given us a glimpse of worlds that are remarkably different from our own.
However, JWST is mostly limited to observing the atmospheres of transiting exoplanets. That means planets that orbit close to their host star and are more or less directly edge-on, as viewed from us, so that they transit across the face of the star. The only planets that the telescope is able to observe directly are big, young, and hot planets farther from their host star, at distances more resembling those of the outer planets in our solar system, like Saturn or Uranus. If only we had a telescope powerful enough to image a potentially habitable planet directly and analyse the light reflected from it.
The Habitable Worlds Observatory
This is where the Habitable Worlds Observatory (HWO) will come in. Now, I know what you are thinking. Why must astronomers always look towards greener pastures bigger telescopes when we already have perfectly functional space telescopes in orbit or practically on the launch pad? Well, it is true that the next flagship space telescope from NASA, the Nancy Grace Roman Space Telescope, is designed to directly image exoplanets and analyse their atmospheres. But space telescopes can take decades to plan and are often built on lessons learned from previous missions. Roman, with its 2.4-meter primary mirror and coronagraph, will be able to observe planets similar in size and orbital distance to Jupiter and will get us some of the way, for sure, but not all the way. At three times the mirror size, HWO, NASA’s proposed successor to Roman that is planned for the 2040s, will carry the torch even further and be able to directly image Earth-like planets in the habitable zone, where liquid water can exist on the planet’s surface.
But It Might Be Cloudy Tomorrow
This brings us to today’s article. If the HWO is going to potentially observe Earth analogues, we might expect it to run into the same issue that plagues everyone living in the UK for most of the year — clouds. Clouds in the atmosphere of an exoplanet can sometimes cause trouble when trying to analyse the light. Cloud particles scatter different wavelengths of light differently, and cloud variability creates dynamic changes in the observed brightness that can make it hard to know what exactly you are looking at. Clouds can also mean varying levels of opacity to look through depending on cloud composition, and they can hide underlying atmospheric properties such as water content beneath a thick cloud layer. For transmission spectroscopy, even a thin layer of clouds can disrupt the measurements as the light has to travel a long distance through the atmosphere. However, for direct imaging, the effect of clouds is perhaps more nuanced. While a thick cloud deck will block the signal from whatever gas lies beneath it, it will also increase the overall albedo of the planet and make it easier to detect the gas above. This means that cloud height and type are both critical variables in understanding atmospheric properties of exoplanets, which is what the authors of today’s article set out to investigate.
To understand how clouds affect the ability to detect signs of life on distant Earth-like planets, the authors used computer simulations. They focused on two gases, molecular oxygen (O2) and ozone (O3). Both gases are often regarded as biosignatures, although their astrobiological significance has been debated. The authors first used a tool that simulates how a telescope like the HWO might observe an Earth-like planet around a star 15 parsecs away. This tool predicts how light bounces off a planet’s surface and atmosphere, and whether the two gases would show up clearly in the reflected light. Next, they created realistic cloud conditions using a cloud microphysics model. This model calculates how clouds might form and behave depending on factors like surface pressure or how much sunlight the planet gets. With this they were able to change things like cloud height and particle size. They then combined the two tools by adding the simulated clouds into the observations model and building a mathematical model to help explain what they saw in the simulations. The sketch for their model can be seen in Figure 1.
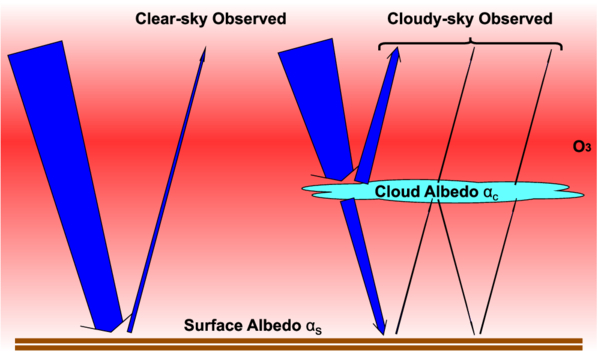
Figure 1: Clouds can affect the amount of reflected light (albedo) from the imaged planet. Depending on the cloud height and particle size, this can have a big impact on the observability of different species of gas in the atmosphere. Here the blue arrows indicate the amount of light entering the atmosphere and being reflected. The arrows get thinner from tail to head, representing absorption in the atmosphere. Depending on the presence of clouds, a varying amount is reflected back. The red colour indicates the assumed distribution of ozone, O3, which is concentrated at a high altitude. [Yang et al. 2025]
A Cloudy Sky Can Actually Be a Good Thing
The researchers discovered that low clouds can actually make gases like oxygen and ozone easier to detect, because these clouds reflect more light without blocking the gases above them. On the other hand, high clouds can make it harder since they can hide the gases from view. They tested different cloud types using real data from Earth as seen in Figure 2. They looked at five common cloud types, like stratus (flat and low), cirrus (high and wispy), and deep convective clouds (tall, thunderstorm-like), and compared them to their model clouds (labelled as CARMA in the figure).
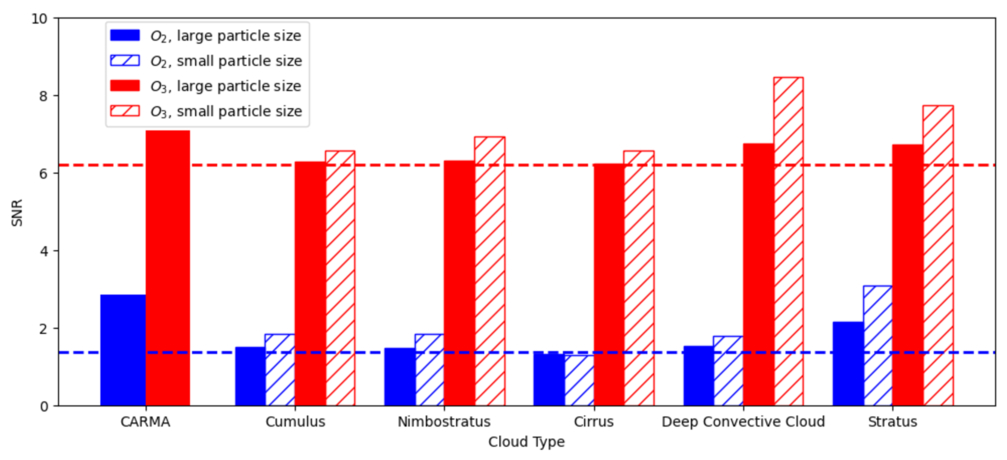
Figure 2: The figure shows how different types of clouds affect our ability to detect oxygen (blue) and ozone (red) on an Earth-like planet. The dashed lines show the results without clouds, while the bars show what happens when clouds are present. Solid bars represent larger cloud droplets, and striped bars represent smaller ones, which reflect more light. The figure shows that most cloud types — especially low clouds like stratus and thick storm clouds — actually make it easier to detect these gases, particularly when droplets are small. Only high, thin clouds (cirrus) slightly reduce oxygen detection, and even then, the effect is small. This is the article’s main finding: while clouds can block light in some observation methods, for direct imaging of reflected light, they often help us see signs of life better. The cloud types are based on real Earth data while the authors’ simulated cloud model is labelled as CARMA. [Yang et al. 2025]
Original astrobite edited by Maria Vincent.
About the author, Kasper Zoellner:
I have a Master of Science in astronomy and I am currently working towards a PhD in physics and educational science. My greatest passion is the search for exoplanets and how stellar variability may influence the possibility of life. I am also interested in science outreach, education, and discussing what sci-fi novel to read next!
The post Weather Forecast for the Habitable Worlds Observatory: Cloudy with a Chance of Biosignatures appeared first on AAS Nova.
]]>
Small in size and glowing red, little red dots have been confusing astronomers since their discovery by JWST. What are the origins of these distant galaxies, and what have researchers learned so far?
The post All Alone With No AGN to Call Home? New Results for Little Red Dots appeared first on AAS Nova.
]]>Among the discoveries JWST has made since its 2021 launch, “little red dots” are one of the most perplexing. Named for their compact size and red color, the origins of these distant galaxies remain unknown. A recent article explores some little red dots’ spectral energy distributions and local environments to better understand what may be lighting up these tiny torches.
Little Red Dot Dilemma
Along with their size and color, little red dots exhibit “V”-shaped spectral energy distributions (how they emit light across wavelengths), broad hydrogen emission lines, and no observed X-ray emission. These properties land them in an untapped parameter space with some similarities to both active galactic nuclei (AGNs) and stellar populations. Some previous investigations have suggested that little red dots contain AGNs, reddened by a dusty accretion disk scattering or blocking AGN light. Other studies have found that models for stellar populations can also fit certain little red dot spectra well.
Adding to the ambiguity, observations and theory predict AGNs to show broad spectral lines, which are present in little red dots — but if little red dots are AGNs, this implies a much higher density of AGNs in the early universe than previously predicted by ground-based surveys. Furthermore, AGNs are expected to emit in the X-ray and show photometric variability, but neither property has been detected definitively thus far for a little red dot. With a clear dilemma arising for the origins of little red dots, astronomers are still prodding at these curious sources.
AGN or Not?
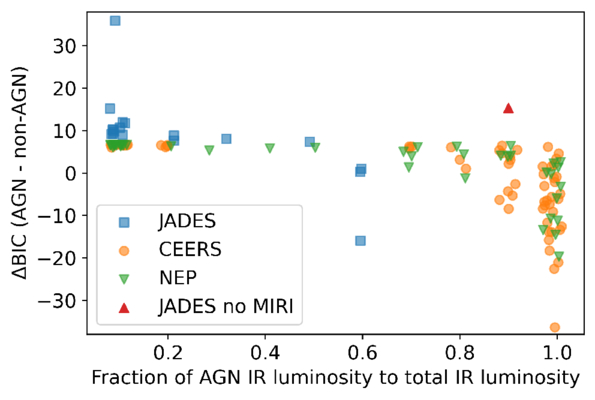
Comparison of AGN versus non-AGN fits using the Bayesian information criterion (BIC). Positive values of ΔBIC favor a non-AGN fit, and ~70% of little red dots have positive ΔBIC. Click to enlarge. [Carranza-Escudero et al 2025]
Using a robust statistical analysis, the authors found that AGN models tend to “overfit” the data — with more free parameters, an AGN model can be tweaked in a way that may not actually be physical (e.g., fitting for extremely high dust extinction that would not be possible). Instead, models without AGN components appear to be more appropriate for about 70% of the little red dots in their sample, suggesting that these peculiar objects may have a significant star-forming component powering their emission.
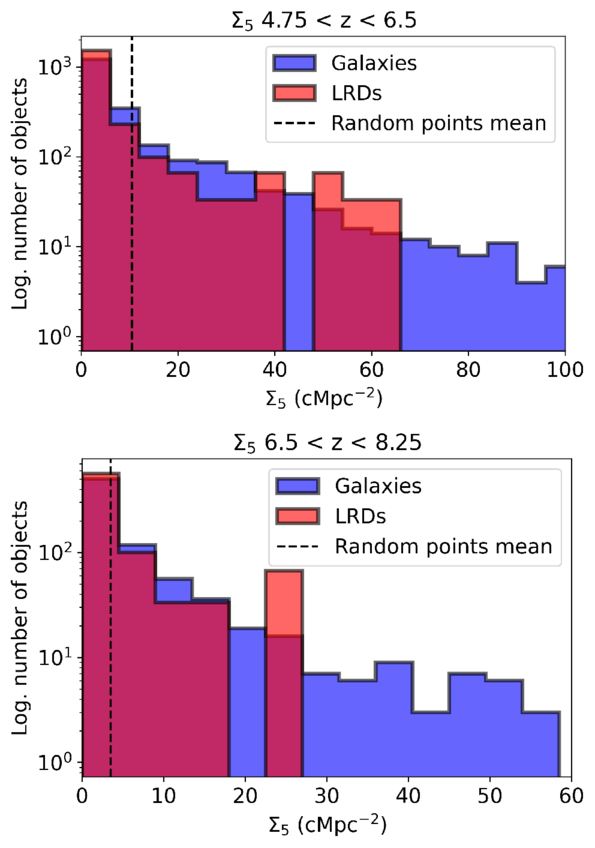
Histograms for two redshift windows showing that little red dots (red) tend to be found in less dense environments than other galaxies (blue) in the same redshift window. Click to enlarge. [Carranza-Escudero et al 2025]
Lonely Neighborhoods
In addition to characterizing little red dots’ emission, the authors analyzed the local environments to compare to other galaxies at similar redshifts. From their analysis, they found that little red dots tend to be found in sparser environments, generally isolated from other galaxies. One explanation for this could be that little red dots in higher-density environments evolve past this peculiar stage faster, which is supported by observations of high-density environments accelerating the evolution of other galaxy types at similar redshifts. However, further investigation is required to better understand the connection between the local environment and little red dot properties.
More little red dots are yet to be discovered, and continued analysis of their emission and environments will uncover more intriguing characteristics. For now, it seems as though little red dots are still a mystery.
Citation
“Lonely Little Red Dots: Challenges to the Active Galactic Nucleus Nature of Little Red Dots through Their Clustering and Spectral Energy Distributions,” María Carranza-Escudero et al 2025 ApJL 989 L50. doi:10.3847/2041-8213/adf73d
The post All Alone With No AGN to Call Home? New Results for Little Red Dots appeared first on AAS Nova.
]]>
Rings and gaps in TWA 7's debris disk suggested a planet might be lurking nearby. JWST observations may have revealed the hidden world.
The post A Dusty Disk Points to a Potential Planet appeared first on AAS Nova.
]]>JWST observations of a nearby star’s debris disk recently revealed what may be one of the lowest-mass planets ever imaged.
How to Find a Small Planet
Though it remains a formidable technical challenge, astronomers have gotten fairly good at taking images of planets around other stars by carefully blocking the light of the host and searching for the small points of light that remain. However, though this technique is well-suited for discovering large, bright, high-mass planets, their lower-mass cousins below the size of Jupiter remain challenging to detect. To get pictures of these smaller worlds, astronomers must resort to detective work and search for signs of their presence through indirect means.
One promising approach is to look not for the planet itself, but rather its effect on the dusty disk of material around the star. These structures, called debris disks, are constantly replenished by planetesimals colliding and grinding one another to dust. If a planet happens to orbit within this disk, it will “stir” the dust into distinctive patterns including rings and spiral arms. If astronomers observe that a star has a debris disk with gaps or spirals, they can analyze those substructures and deduce where a planet might be hiding.
The Star of this Show: TWA 7

A mid-infrared image of TWA 7’s debris disk and candidate planet. [ESA/Webb, NASA, CSA, A.M. Lagrange, M. Zamani (ESA/Webb); CC BY 4.0]
This prediction led to a search with JWST last summer. Initial observations taken at mid-infrared wavelengths revealed a bright dot sitting near the predicted location of the planet. However, with just these observations, it was hard to confidently say that this source wasn’t just a distant background galaxy that happened to appear there by chance. To help settle the matter, JWST took another look in two different near-infrared wavelength bands a few weeks later.
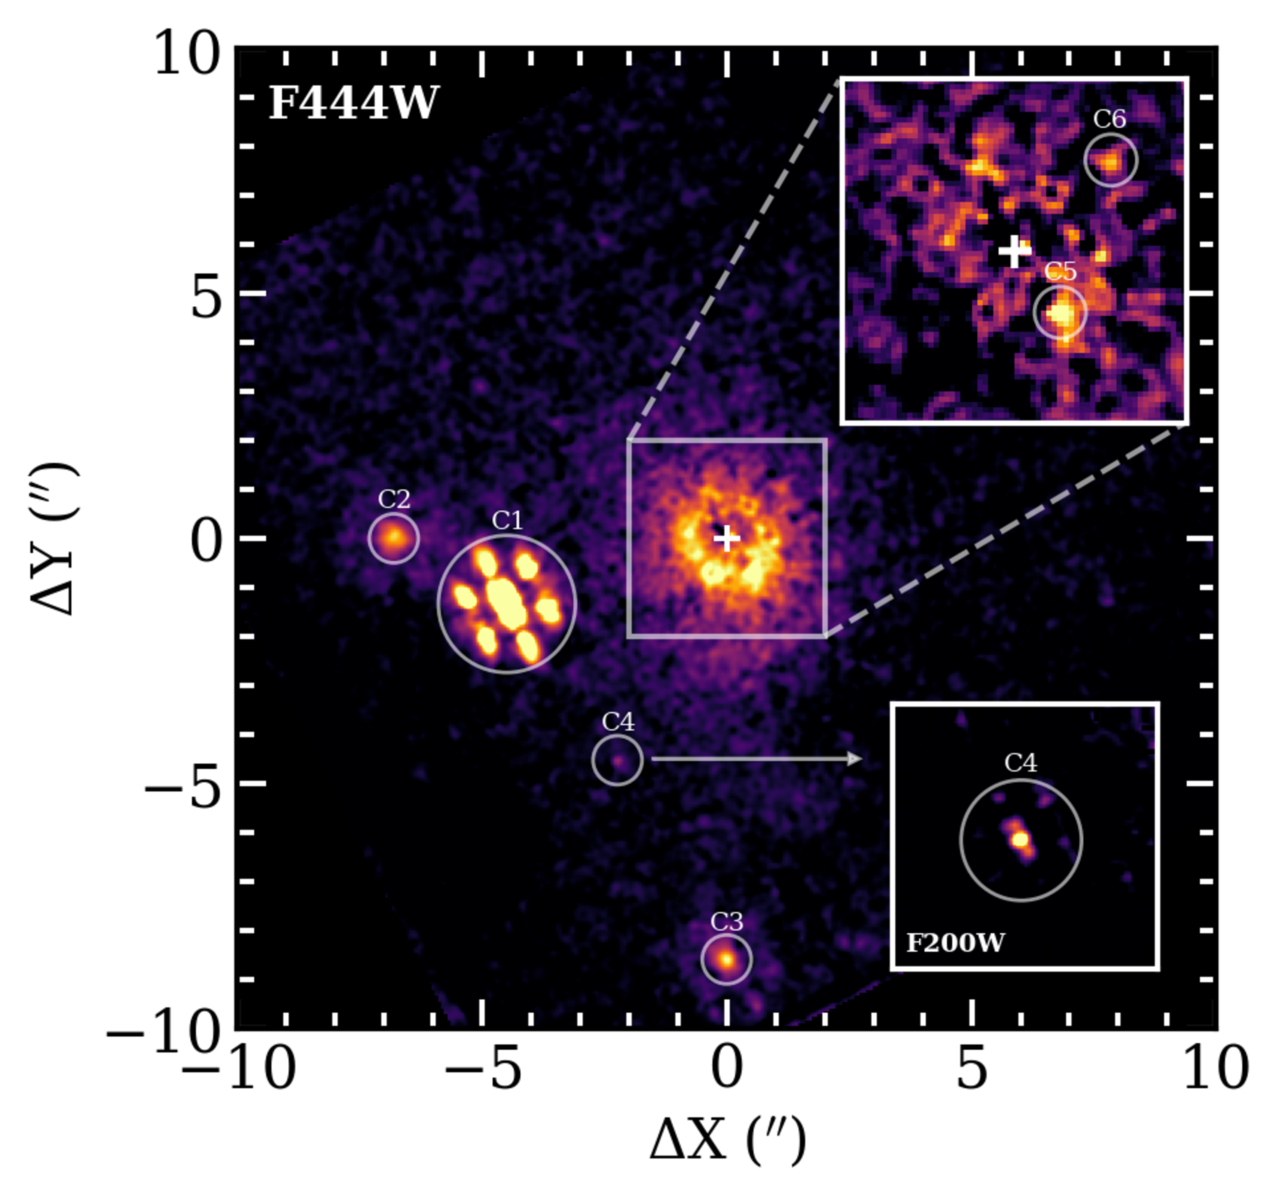
New JWST observations of TWA 7. The sources labeled C5 and C6 are planet candidates. C6 is located at the same place as the planet candidate identified in mid-infrared observations, making it a strong candidate. C5 requires further observations to understand if it is real or an artifact. Click to enlarge. [Crotts et al. 2025]
Revisiting TWA 7
A team led by Katie Crotts (Space Telescope Science Institute) recently published these later observations. These new data show a dot in the exact same place as before, and with a color that’s much more planet-like than galaxy-like.
While this adds plenty of evidence to the planetary interpretation, the team cautions that one more set of follow-up observations is needed to be confident that this is, in fact, a planet. Assuming future observations back up these first hints, however, this would be the lowest-mass planet ever imaged, and a happy conclusion to a detective story that started with dust.
Citation
“Follow-Up Exploration of the TWA 7 Planet–Disk System with JWST NIRCam,” Katie Crotts et al 2025 ApJL 987 L41. doi:10.3847/2041-8213/ade798
The post A Dusty Disk Points to a Potential Planet appeared first on AAS Nova.
]]>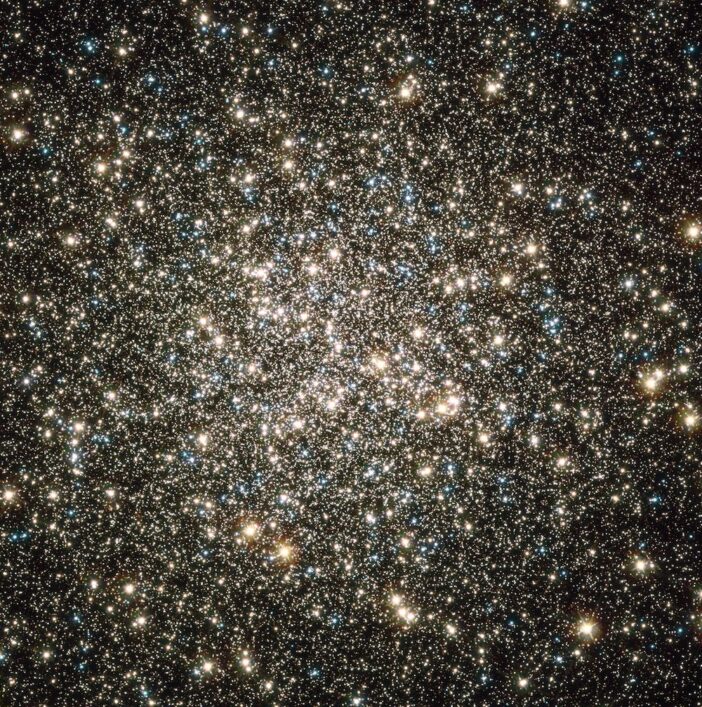
Astrobites reports on how we might be able to observe gravitational wave signals from intermediate-mass black holes in binary systems with stellar-mass black holes.
The post From Globs to Gravitational Waves: A Simulated Cosmic Choreography appeared first on AAS Nova.
]]>Editor’s Note: Astrobites is a graduate-student-run organization that digests astrophysical literature for undergraduate students. As part of the partnership between the AAS and astrobites, we occasionally repost astrobites content here at AAS Nova. We hope you enjoy this post from astrobites; the original can be viewed at astrobites.org.
Title: Formation and Evolution of Compact Binaries Containing Intermediate-Mass Black Holes in Dense Star Clusters
Authors: Seungjae Lee et al.
First Author’s Institution: Seoul National University
Status: Published in ApJ
A delicate dance goes on in astronomy between theory and observation. Most astronomy research, by and large, fits into one of two categories. In one category, you start with a theory, model, or simulation, and attempt to figure out what observations you might expect given those initial assumptions. The other approach begins with raw data and attempts to determine what kinds of theories, models, and fundamental astrophysical assumptions might give rise to it. Accepted knowledge usually happens when these two approaches agree and reinforce each other, but a lot of the actual science occurs when one side dances ahead of the other — either we have theories and models that make predictions that cannot yet be observationally tested, or we have data that defy attempts at fitting underlying models.
Another dynamical dance goes on in globular clusters between binary black holes. Today’s article investigates intermediate-mass black holes, or IMBHs, a pristine example of an astronomical topic in which theory has danced ahead of observations. IMBHs fill the gap between stellar mass and supermassive black holes. We can observe black holes in multiple ways, usually from the electromagnetic radiation of the gas disks surrounding some black holes (either stellar or supermassive), or the gravitational waves of two orbiting or merging black holes. Unfortunately, each method requires some extra component — either gas to accrete or a companion to orbit — and IMBHs are far more challenging to observe through these methods. Hence, we have a lot of ideas about how they might form, and scarce observational evidence for their existence.
That hasn’t stopped many researchers from trying to make better models and predictions. One of the most commonly proposed mechanisms for forming IMBHs is in dense globular or nuclear star clusters (up to a million times denser than our region of the Milky Way). In these dense environments, stars and the black holes they produce might have a chance to find and run into each other often enough to reach the masses of the IMBH regime through mergers. Today’s authors use a series of N-body simulations to study these dense stellar clusters, into which they embed IMBHs. Their study investigates the detectability of gravitational waves from intermediate-mass-ratio inspirals (IMRIs). Because so many mergers occur in dense clusters, it allows for more mergers between objects with greater mass differences. The mass ratio between the two objects (usually denoted as ‘q’) is one of the most important parameters for characterizing a merger, and a high q value creates a gravitational wave signature that is different from a low q, even if the total mass of the system is the same.
To investigate the formation and detectability of IMRIs, the authors conducted a suite of direct N-body simulations of star clusters with total masses between 5×10⁴ and 105 solar masses, containing ~105 particles. They include initial conditions for how densely packed the particles should be, given how far they are from the cluster’s center (called a Plummer profile). They also include a rule for how the initial masses of the stars are distributed (called a Kroupa initial mass function). Then, they use a code called Stellar EVolution for N-body (SEVN) to follow the evolution of the stars in the system for 100 million years.
In that time, massive stars in the simulation can evolve into neutron stars and stellar-mass black holes. In addition to simulating the clusters’ stars, the authors embed an IMBH of 300–5,000 solar masses into the clusters. The key to this article is that some of the stellar-mass binary black holes will interact with the IMBH, creating an IMRI, which gives off gravitational waves. This article’s primary goal is to characterize these IMRIs and to test how well current and future gravitational wave detectors will measure them.
In the simulation, when a stellar-mass binary black hole and an IMBH come close, the authors must create a “merger criterion” — essentially, how it is decided whether the two objects merge, and what the subsequent “gravitational wave” would look like. Once they model the wave itself, they turn to five current or future detectors to see how well they will measure those waves if they were at particular astronomical distances from Earth.
One of the primary relationships the authors look at in the cluster is the half-mass radius velocity dispersion of the cluster and the number of IMRI encounters between the IMBH and stellar-mass objects. One can think of the velocity dispersion as a more complicated “average velocity” of the stars in the cluster (a high velocity dispersion means, on average, the stars are moving faster, the half-mass radius is the distance from center that separates the inner half of the stars and outer half of the stars, and we use it because it is more representative of stellar motion in the overall cluster than the packed center or the mellow edge). Figure 1 shows the relationship between the number of IMRI events (y-axis) vs. the velocity dispersion (x-axis) of the cluster where the IMBH sits. Note that the y-axis is logarithmic, so a small increase in velocity dispersion actually results in a large increase in the number of IMRIs. This tells us that the number of events is much more dependent on the properties of the larger cluster than the IMBH itself.
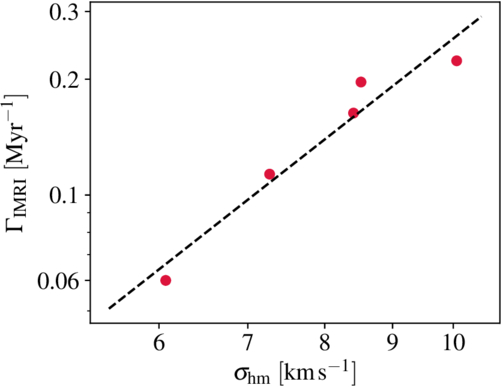
Figure 1: IMRI event rate as a function of cluster half-mass velocity dispersion (σhm) for 1,000-solar-mass IMBHs in the simulations. The IMRI merger rate is highly sensitive to the velocity dispersion of the cluster as a whole, making it a key observable of how efficiently IMRIs can form and merge in a given cluster. [Lee et al. 2025]
How do the authors translate the gravitational wave signal from the IMRI into what might be observed on Earth? First, they must pick a signal-to-noise ratio threshold, which is the ratio of the gravitational wave signal to the background noise in the detector. In this case, they chose a signal-to-noise ratio of 8, a commonly chosen threshold in the gravitational wave literature. From the signal-to-noise ratio, the authors can calculate a horizon distance. The horizon distance is the distance that a detector can measure a specific gravitational wave event with a given set of properties at or above the threshold chosen. Figure 2 shows the horizon distances (y-axis) for each detector for sets of gravitational wave sources with different properties vs. the mass of the IMBH generating the gravitational wave (x-axis). The solid and dotted lines represent two chosen masses of the IMBH’s stellar-mass companion. The figure shows that aLIGO (blue circles) can detect only low-mass IMBHs (≲ 300 solar masses) at a redshift of z ≲ 0.05. ET (red triangles) is sensitive to lower-mass IMBHs, and LISA (green diamonds) excels at detecting higher-mass IMBHs. aSORGO (purple triangles) covers a broad mass range but at lower redshifts. DECIGO (yellow Xs) offers the broadest mass range at the highest redshift.
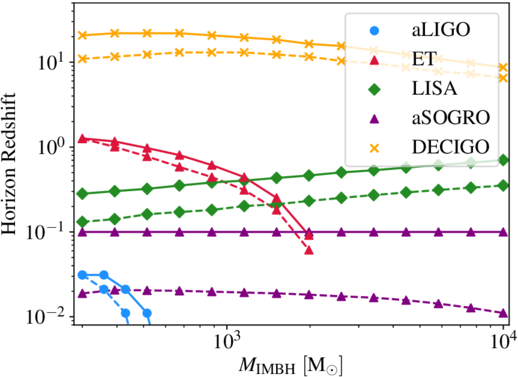
Figure 2: Horizon redshift vs. IMBH mass for several gravitational wave observatories (aLIGo represented by blue circles, ET by red triangles, LISA by green diamonds, aSOGRO by purple triangles, and DECIGO by yellow x‘s). Solid vs. dotted lines represent the mass of the stellar-mass black hole interacting with the IMBH, with the dashed line representing a 10-solar-mass companion and the solid lines representing a 60-solar-mass companion. [Lee et al. 2025]
Original astrobite edited by Kasper Zoellner.
About the author, William Smith:
Bill is a graduate student in the astrophysics program at Vanderbilt University. He studies gravitational wave populations with a focus on how these populations can help inform cosmology as part of the LIGO Scientific Collaboration. Outside of astrophysics, he also enjoys swimming semi-competitively, music and dancing, cooking, and making the academy a better place for people to live and work.
The post From Globs to Gravitational Waves: A Simulated Cosmic Choreography appeared first on AAS Nova.
]]>
An incredible beacon from the first billion years of the universe, Earendel has been touted as the most distant single star ever seen — but it might not be a single star at all.
The post Examining Earendel: Is the Most Distant Lensed Star Actually a Cluster? appeared first on AAS Nova.
]]>What’s the nature of the distant source Earendel, which appears as a point of light in a dramatically gravitationally lensed galaxy?
Record-Breaking Discovery
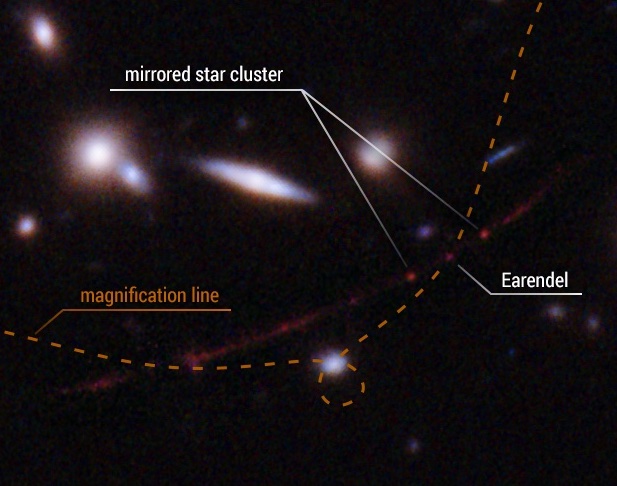
Hubble image zooming in on the Sunrise Arc and Earendel. The two images of the mirrored star cluster are called 1a and 1b. [NASA, ESA, Brian Welch (JHU), Dan Coe (STScI); Image Processing: Alyssa Pagan (STScI)]
But there’s a catch — at the distances involved, distinguishing between one star and many isn’t easy, and Earendel might not actually be just one star. New research uses stellar population modeling to explore the possibility that what has been touted as a single star is really a cluster.
The Light of Earendel, Our Most Beloved Star… Cluster?
The question sounds simple: does the light from Earendel resemble that of one star, or does it more closely align with the emission from a collection of many stars? What complicates matters is that Earendel’s light has been warped and magnified by an intervening galaxy cluster in a process called gravitational lensing. Because the degree of magnification isn’t known precisely, it’s not clear exactly how large the source is — leaving wiggle room for Earendel to be one or many stars.
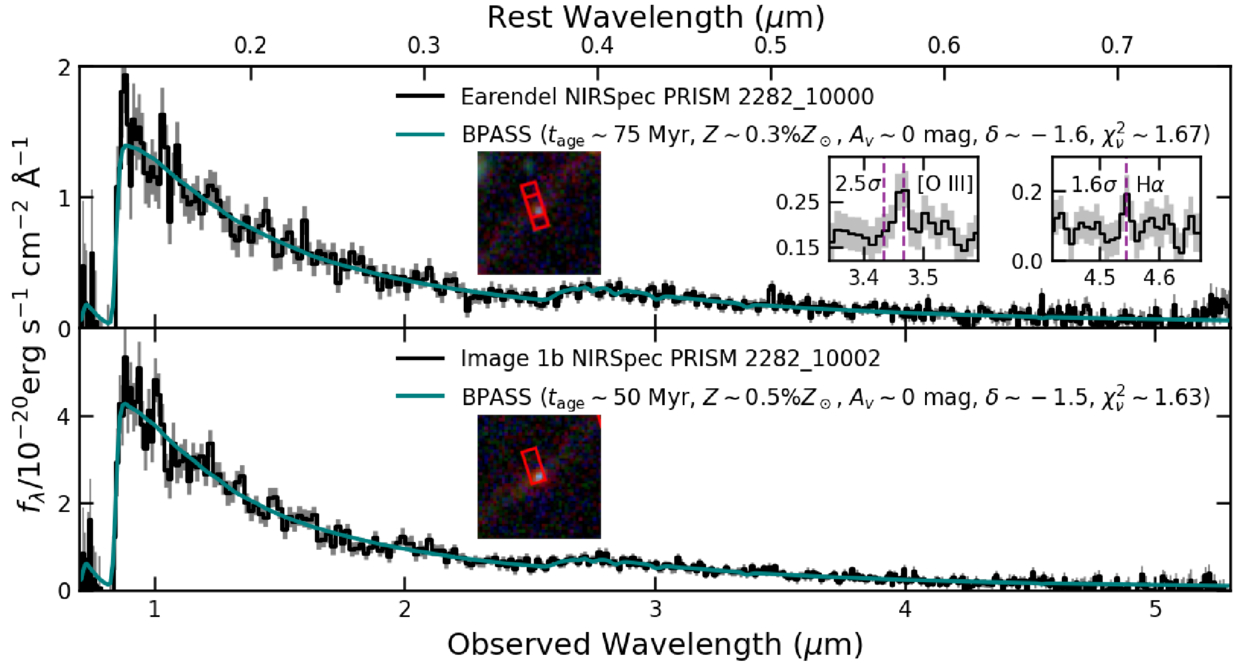
JWST spectra of Earendel (top) and 1b (bottom), along with the best-fitting models. Click to enlarge. [Pascale et al. 2025]
Both Earendel and 1b were well fit by all three stellar population models, supporting the hypothesis that Earendel is a cluster. Earendel and 1b share certain similarities, such as metallicity (less than 10% of the Sun’s), stellar surface density (high, rivaling the maximum density seen in the local universe), and age (more than 30 million years old).
Cluster Comparison
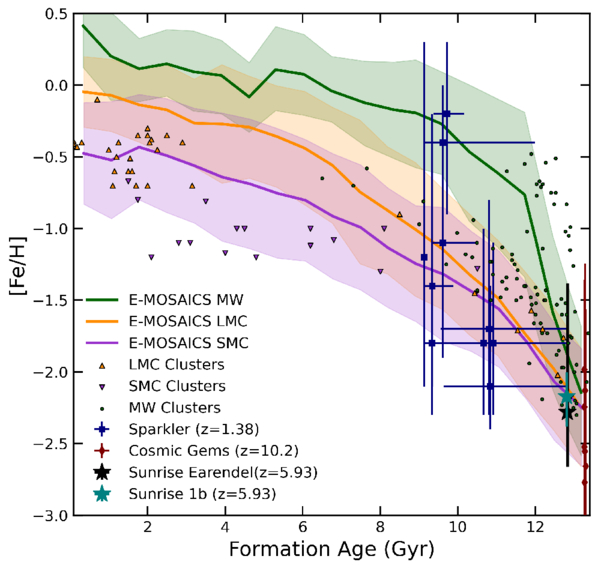
Metallicity and formation age of star clusters in the local universe, in the Milky Way and Magellanic Clouds, and at high redshifts. Click to enlarge. [Pascale et al. 2025]
While this work demonstrates that Earendel could be a cluster, it doesn’t prove that it is. Doing so is challenging, especially since certain features predicted to exist for a single star might be beyond our observational capabilities, or they could be reproduced by clusters with certain properties. The authors pointed to one smoking-gun signal for Earendel being a single, massive star: brightness fluctuations due to microlensing by stellar winds. So far, no such variability has been found, and the cluster hypothesis remains viable.
Citation
“Is Earendel a Star Cluster?: Metal-Poor Globular Cluster Progenitors at z ∼ 6,” Massimo Pascale et al 2025 ApJL 988 L76. doi:10.3847/2041-8213/aded93
The post Examining Earendel: Is the Most Distant Lensed Star Actually a Cluster? appeared first on AAS Nova.
]]>
Astrobites reports on the three galactic suspects in the case of an ultra-high-energy neutrino.
The post Ultra-High-Energy Neutrino Emission on the Extragalactic Express: A Mystery appeared first on AAS Nova.
]]>Editor’s Note: Astrobites is a graduate-student-run organization that digests astrophysical literature for undergraduate students. As part of the partnership between the AAS and astrobites, we occasionally repost astrobites content here at AAS Nova. We hope you enjoy this post from astrobites; the original can be viewed at astrobites.org.
Title: ASKAP and VLASS Search for a Radio-Continuum Counterpart of Ultra-High-Energy Neutrino Event KM3–230213A
Authors: M. D. Filipović et al.
First Author’s Institution: Western Sydney University
Status: Published in ApJL
The Scene of the Crime
On Galentine’s Day this year, an ultra-high-energy neutrino attempted to sneak through the Mediterranean Sea, likely expecting she wouldn’t be caught. The odds were in her favor; neutrinos, ghostly particles with no electric charge and infinitesimal mass, only very rarely interact with matter. However, what she failed to account for was the awaiting undersea neutrino detector, KM3NeT, and the clever lepton within who would finally notice her. She slammed into the lepton, spewing charged particles everywhere at speeds greater than the speed of light in the water. While no particle can outrun a photon in a vacuum, water slows light down, giving us the familiar effect of refraction; similar to supersonic jets creating a boom when they break the sound barrier, these charged particles produced a distinctive blue light, known as Cherenkov light, exposing the neutrino’s position to astronomers and physicists everywhere. Busted.
The Investigation Begins
However, the neutrino was only the messenger; of even more interest is the astrophysical object that produced her. It’s not easy to generate such a high-energy particle, and no one can create a neutrino from thermal emission alone, indicating that wherever she originated, something extreme was going on. To date, only three astrophysical sources have been caught emitting neutrinos at all, and none of them are extragalactic: the Sun, although this is old news (in the 1960s, detections of solar neutrinos showed definitively that the Sun is powered by nuclear fusion, resolving the issue of how the Sun has burned long enough for life to evolve on Earth); the nearest core-collapse supernova to our galaxy in modern times, SN 1987A; and the galactic plane.
Theoretical models predict a much wider variety of objects, including extragalactic sources, to produce neutrinos, usually via cosmic-ray production: supernova remnants, star-forming galaxies, gamma-ray bursts, supermassive black holes (which are found at the centers of most galaxies), active galactic nuclei (a particularly fussy subset of supermassive black holes that are eating their host galaxies), and blazars (an extreme subset of active galactic nuclei that emit jets of radio light directly at Earth). The reason we have not detected their predicted neutrino emission is that neutrino astronomy is a new field, extragalactic sources are super far away, and neutrinos are both difficult to detect and difficult to trace back to their origin.
Rounding Up Suspects
With this in mind, today’s authors embark on a quest to catch the culprit, starting in the radio band. Radio emission, like neutrino emission, is usually an indicator of non-thermal radiative processes, and one such process, synchrotron radiation (emitted by relativistic electrons getting spun around in powerful magnetic fields), can be distinguished from other types of radiation based on its radio characteristics. Conveniently, the region our neutrino hails from is spanned by multiple radio surveys conducted with the Very Large Array (VLA) and the Australian Sub-Kilometer Compact Array Pathfinder (ASKAP), and so our authors use these surveys to round up all the radio riffraff. Unfortunately, the long wavelengths of radio photons and the scarcity of neutrinos result in reduced resolution for both compared to traditional optical telescopes, and our authors find over a thousand radio emitters in the region. Of course, no one can question that many sources, so our authors limit their investigation to objects with at least two radio brightness measurements, which can be used to calculate the brightness as a function of radio wavelength (the spectral energy distribution, which tells us about what type of radiation we see) and/or as a function of time (a light curve, which tells us if our source is variable). Our authors settle on a lineup of 10 likely blazars, any of whom could have emitted our ultra-high-energy neutrino, as well as a shortlist of prime suspects warranting further investigation: Phaedra, a spiral galaxy; Hebe, a radio galaxy; and Narcissus, an unusual compact radio emitter (see Figure 1).
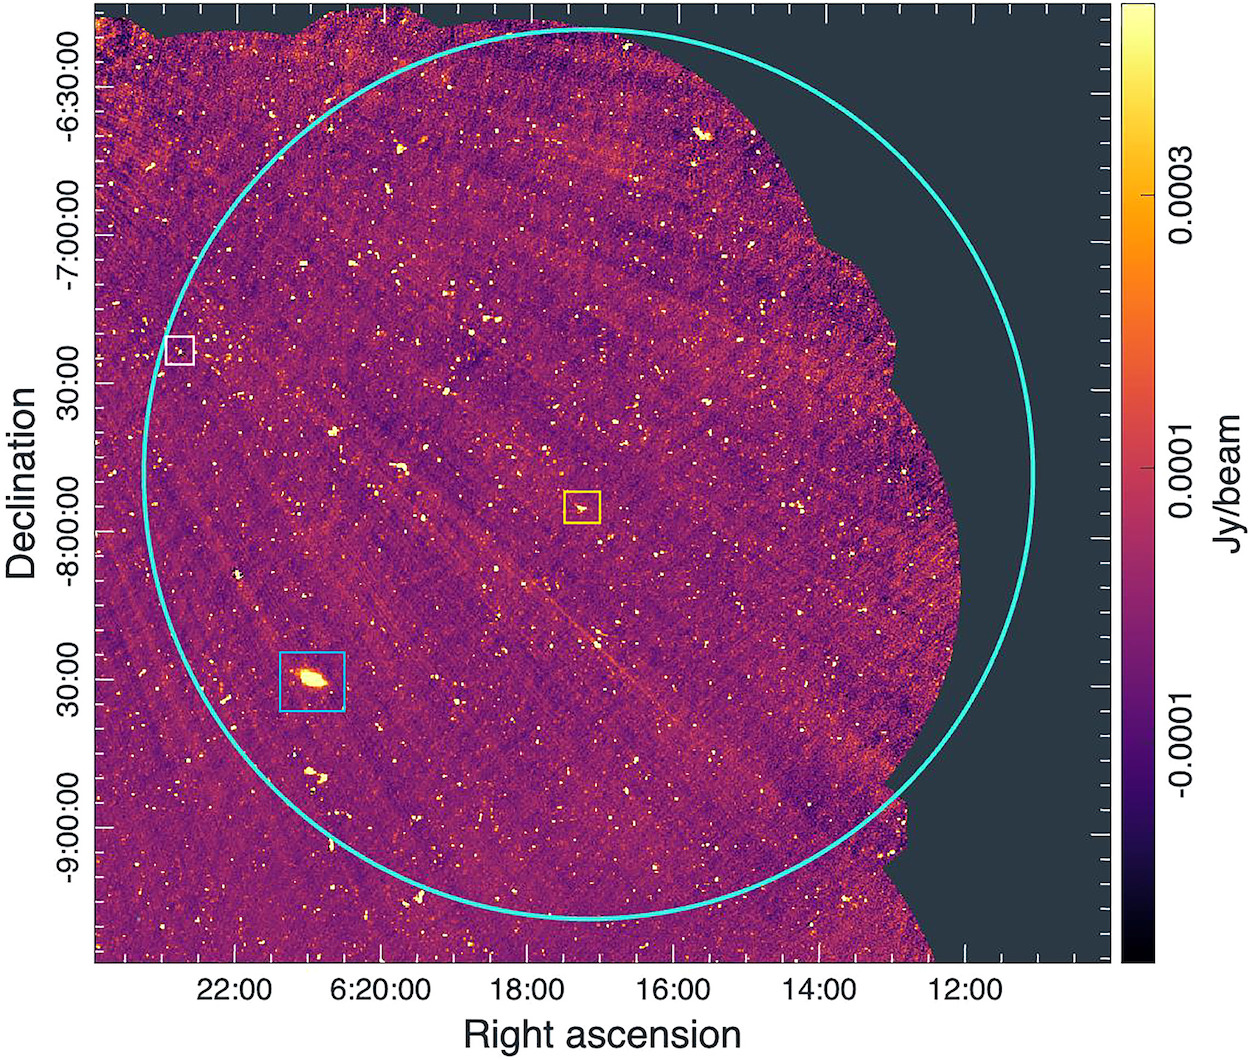
Figure 1: Radio emission detected by ASKAP in the region of the sky in which the neutrino originated. Every yellow dot should be considered suspect, but the three colored squares identify the primary guilty parties: Phaedra (in blue), Hebe (in yellow), and Narcissus (in pink). [Filipović et al. 2025]
Phaedra: A Spiral Galaxy with a Secret?
Phaedra (Figure 2), the most radio-luminous in the area, exhibits plenty of behavior typical of a galaxy guilty of neutrino emission. For starters, she has two regions of highly concentrated radio emission, and these regions are offset from her center, making them look suspiciously like active galactic nucleus jets, which are excellent particle accelerators. Furthermore, infrared observations suggest she is a starburst galaxy, churning out stars faster than a bestselling author with a team of ghostwriters churns out books. This intense star formation could have easily been triggered by jet activity. Even more suspiciously, she is closely associated with an X-ray binary, and where there are high-energy photons, there are likely to be other high-energy particles like neutrinos and cosmic rays. Phaedra’s prospects of beating the neutrino emission allegations are not looking good; these high-energy phenomena produce buckets of high-energy particles, and even if they produce only cosmic rays, the cosmic rays are bound to crash into the surrounding dense gas and photons, creating neutrinos anyway.
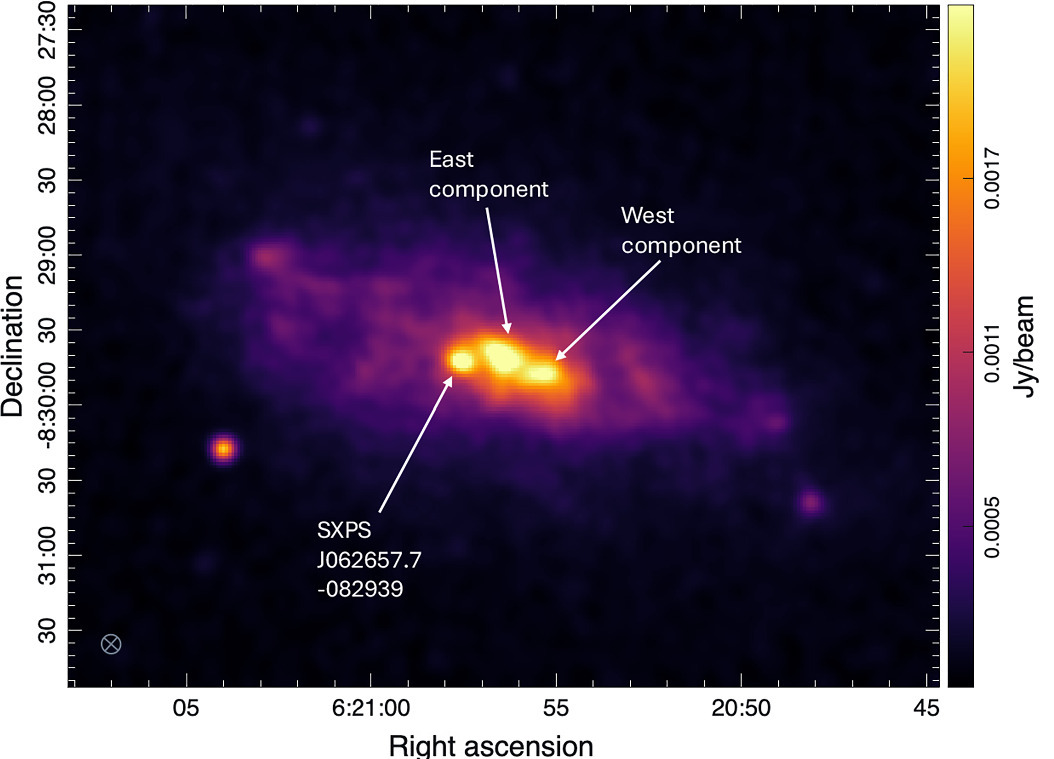
Figure 2: Radio image of Phaedra, one of our suspects. The east and west components are the likely radio jets, and the third bright blob is the radio counterpart to the X-ray binary, SXPS J062657.7-082939. [Adapted from Filipović et al. 2025]
Hebe: A Simple Radio Galaxy, or Something More?
Hebe (Figure 3), the nearest extended radio source, isn’t exactly innocent-looking either. She is one of a triplet of galaxies sharing a common envelope, like peas in an extragalactic pod. Galaxies, unlike peas, however, are so massive that they can’t help but interact dynamically in such close quarters, causing a commotion that could totally produce ultra-high-energy neutrinos. She likely also has an active galactic nucleus jet, giving her the same neutrino-wielding powers as Phaedra.
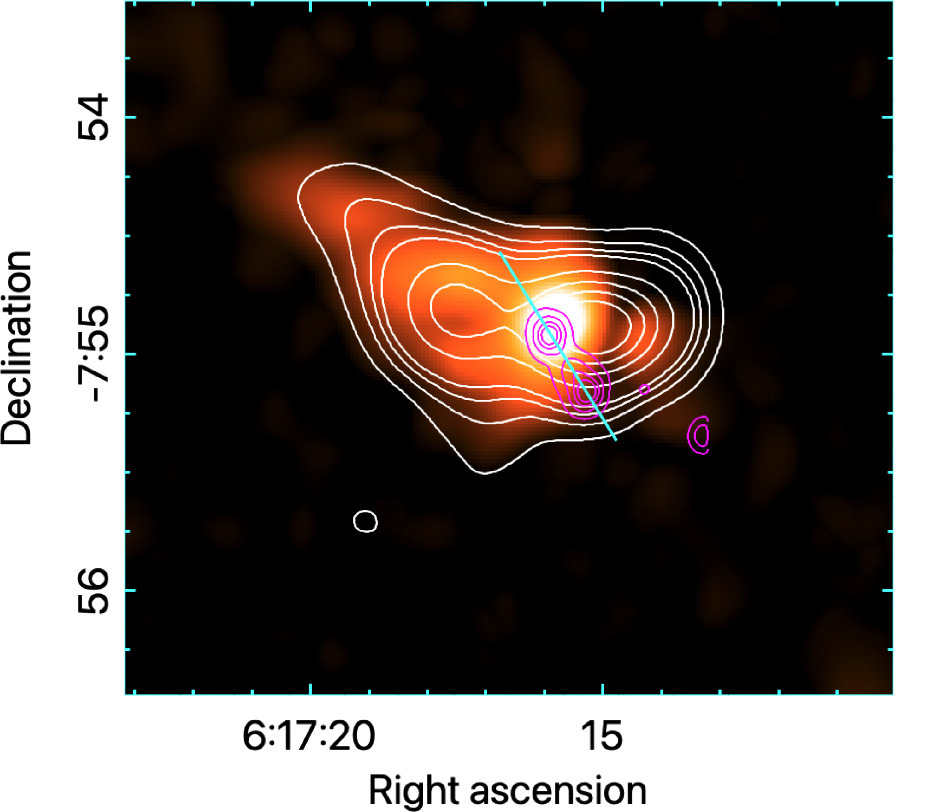
Figure 3: An infrared image of Hebe that clearly shows the common envelope surrounding the triplets. The white contour lines denote levels of polarized intensity, which indicate the presence of a magnetic field. [Adapted from Filipović et al. 2025]
Narcissus: Double Active Galactic Nucleus?
Our final suspect, Narcissus (Figure 4), consists of not one, but two active galactic nuclei. One appears to exhibit the classic synchrotron spectral energy distribution, and the other is likely a blazar, based on his notable radio variability and infrared observations.
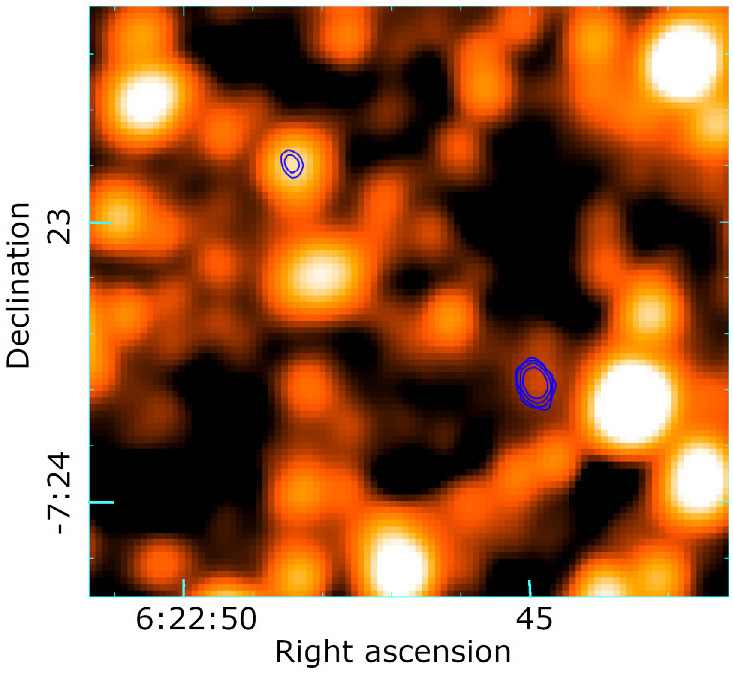
Figure 4: Infrared image of Narcissus, with the purple contours outlining the two radio sources that are likely active galactic nuclei. [Adapted from Filipović et al. 2025]
Solving the Mystery
So, who really emitted the ultra-high-energy neutrino? For now, our authors can’t jump to any firm conclusions — they’d never risk condemning an innocent galaxy — but they will continue to closely monitor the suspects and gather more evidence. In the meantime, Phaedra, Hebe, and Narcissus should find themselves a good defense attorney experienced in neutrino emission cases.
Original astrobite edited by Sandy Chiu.
About the author, Chloe Klare:
I’m a PhD student in astronomy and astrophysics at Penn State (with a physics minor, so I get to use my semester spent in QFT for something!). I study active galactic nuclei (in the radio!), and I’m currently looking for baby synchrotron jets in active galactic nuclei.
The post Ultra-High-Energy Neutrino Emission on the Extragalactic Express: A Mystery appeared first on AAS Nova.
]]>
JWST provides new evidence that one of our nearest neighbor stars, Alpha Centauri A, might host a giant planet in its habitable zone.
The post Potential Discovery of a World Next Door appeared first on AAS Nova.
]]>By pushing JWST to its limits, astronomers may have just spotted a planet around the nearest Sun-like star, Alpha Centauri A. Though another look at the star is needed next year to confirm the finding, if the detection holds up, this discovery easily earns several superlatives: the planet would be the nearest, oldest, coldest, and lowest-mass world ever directly imaged beyond our solar system.
Hi, Neighbor!
The scale of our Milky Way galaxy is hard to comprehend with our Earth-bound minds that are more attuned to measuring distances in miles than in light-years. However, even though our suburban stellar neighborhood is tens of thousands of light-years from the galactic downtown, it is not empty: there are a handful of nearby systems that offer unique opportunities to study stars and their potential planet children “up close.”
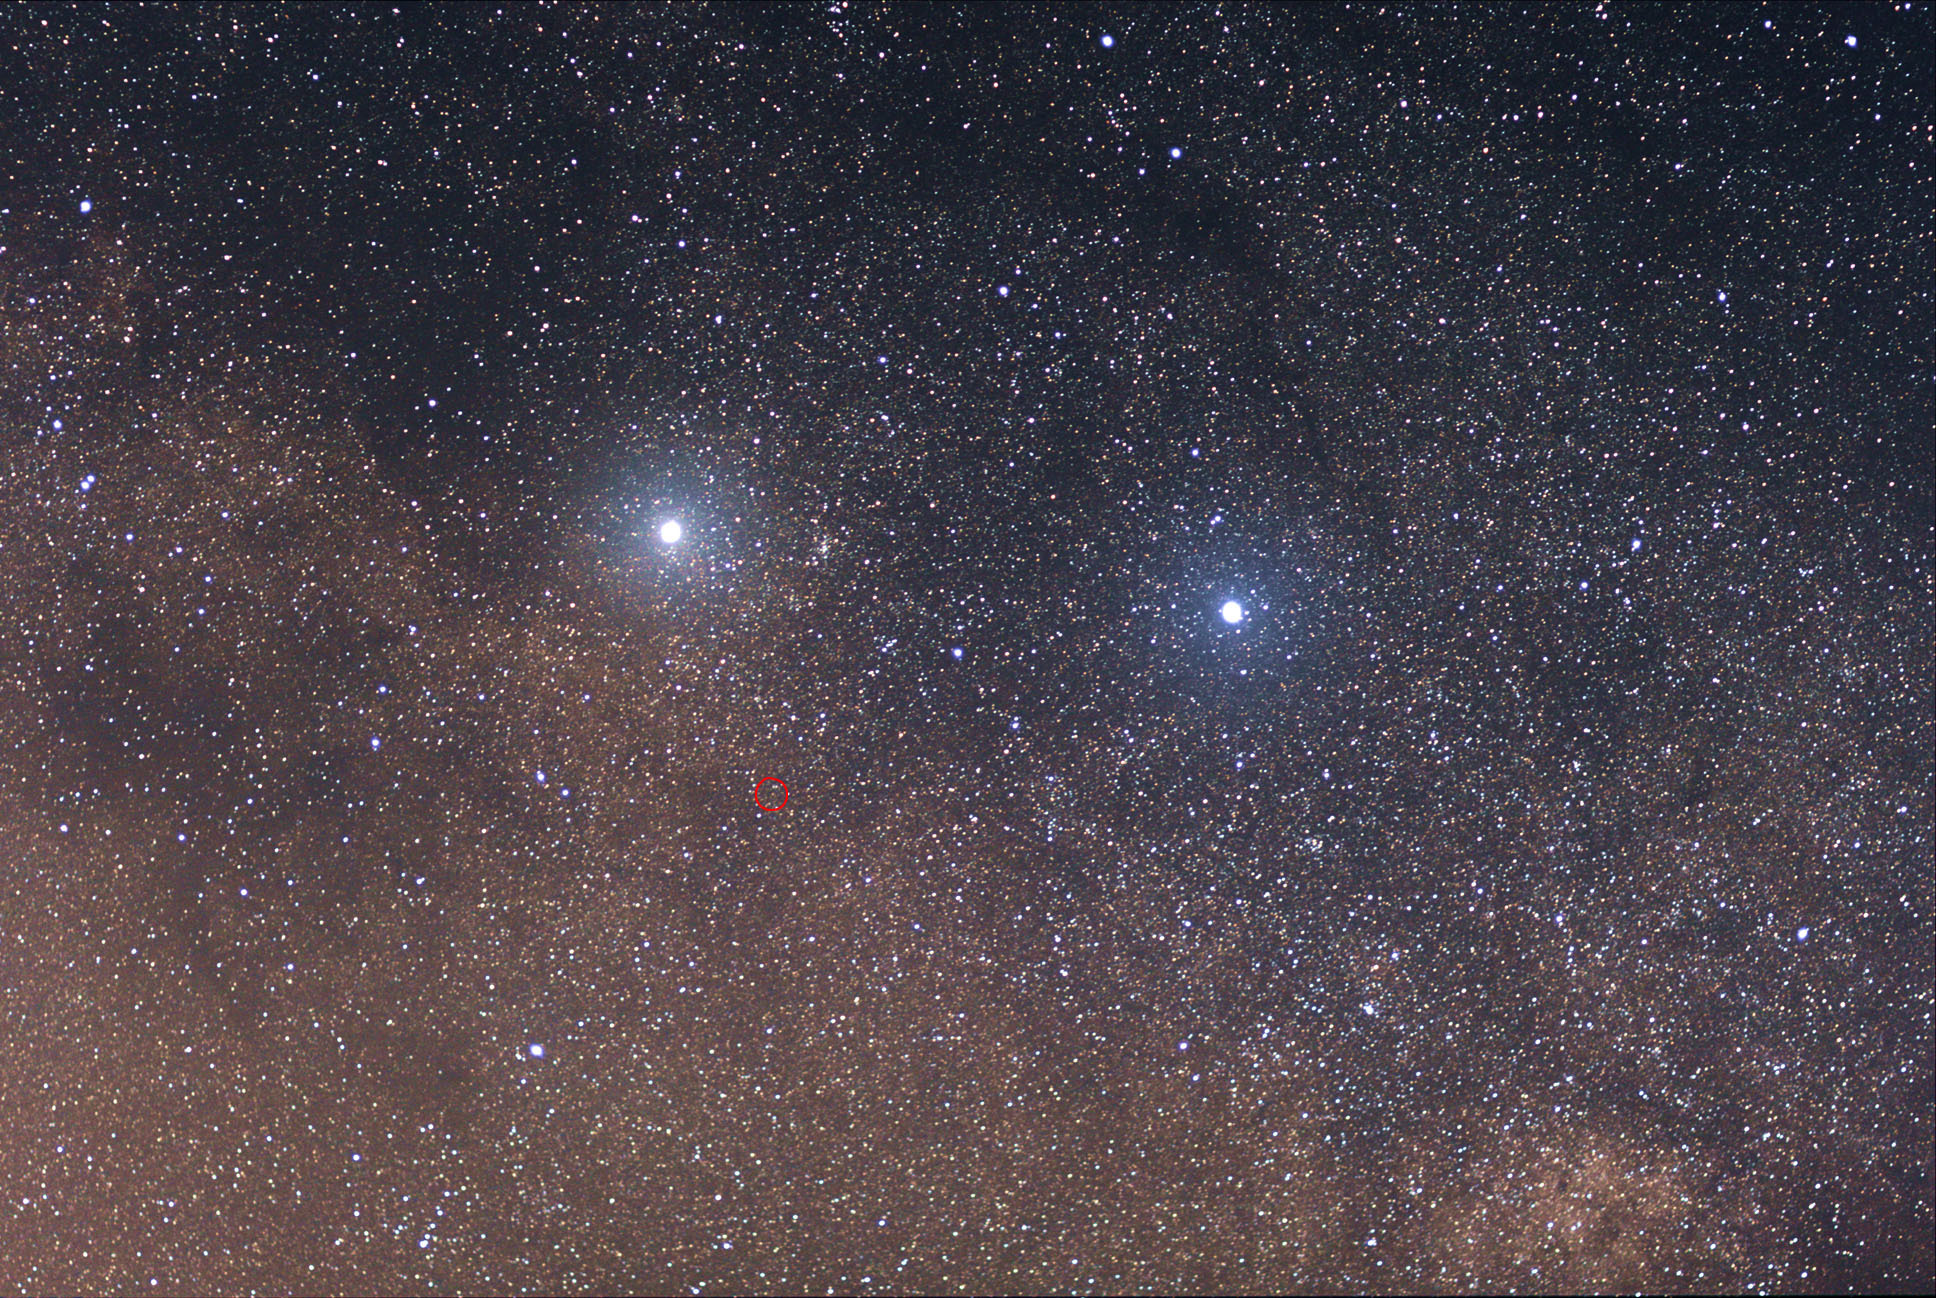
Alpha Centauri A and B (bright stars), along with Proxima Centauri, circled in red. [Wikipedia; CC BY-SA 3.0]
Though Proxima Centauri is the most famous of the trio, since it’s technically the closest star to the Sun, its larger siblings are arguably better targets for searching for planets. Since these stars are more massive, their habitable zones are large enough that astronomers can block out the star itself and search the surrounding area for planets using a tool called a coronagraph.
Challenging Observations
Back in 2019, a team of astronomers using a coronagraph on the Very Large Telescope uncovered tantalizing evidence of a giant planet orbiting Alpha Centauri A. However, confirming or rejecting this initial peek using telescopes on Earth’s surface was challenging. When JWST finally launched in 2021, following up on this hint was a top priority. Astronomers first attempted to point JWST toward the Alpha Centauri system in 2023, but unfortunately, the observations from that attempt were unusable.
Though one might think aiming a telescope at a nearby star is easier than taking a look at something more distant, this is unfortunately not the case. For one thing, the stars of the Alpha Centauri system are bright enough to overwhelm JWST’s sensitive detectors without careful calibration. For another, keeping the telescope locked on target and the star behind the coronagraph requires continuous tweaks to account for the Sun’s motion relative to Alpha Centauri, JWST’s motion relative to the Sun, and Alpha Centauri A’s motion relative to Alpha Centauri B. The team regrouped, tested a new observing strategy in mid-2024, then took three long observations in August 2024, February 2025, and April 2025.
A Planet Candidate

JWST coronagraph image of the Alpha Centauri system. Alpha Centauri B is the bright labeled star at the top, while Alpha Centauri A is labeled but hidden behind the coronagraph. The inset shows the region around Alpha Centauri A during the three different observations. The planet candidate, labeled S1, is only visible in the August 2024 observation. Click to enlarge. [Beichman & Sanghi et al. 2025]
The authors estimated that the source is a 1–1.1 Jupiter radius planet with a mass of 90–150 Earth masses (0.28–0.47 Jupiter mass) on a 2–3-year orbit. The team stressed that with just one detection, this should still be regarded as a planet candidate, not a confirmed discovery. If the planet is eventually verified, however, it stands out among its peers as the first mature, cold planet ever imaged within its star’s habitable zone. Future detectors may be able to collect spectra of the planet itself, unlocking new insights into giant planet evolution and composition in multiple-star systems with nested orbits, like the Alpha Centauri system.
Now that JWST has a proven strategy for observing this challenging system, it should be possible to take follow-up images. If the planet is real and traveling on its expected orbit, it should reappear beside Alpha Centauri A in August 2026. Hopefully, JWST will be looking when it does, and we can finally confirm that we have a planetary neighbor next door.
Citation
“Worlds Next Door: A Candidate Giant Planet Imaged in the Habitable Zone of α Cen A. I. Observations, Orbital and Physical Properties, and Exozodi Upper Limits,” Charles Beichman et al 2025 ApJL 989 L22. doi:10.3847/2041-8213/adf53f
“Worlds Next Door: A Candidate Giant Planet Imaged in the Habitable Zone of α Cen A. II. Binary Star Modeling, Planet and Exozodi Search, and Sensitivity Analysis,” Aniket Sanghi et al 2025 ApJL 989 L23. doi:10.3847/2041-8213/adf53e
The post Potential Discovery of a World Next Door appeared first on AAS Nova.
]]>
When a supermassive black hole captures a significantly smaller object, the interaction could produce gravitational waves that have not yet been detected. A new study explores such events and how future gravitational wave detectors may be able to feel them for years to come.
The post Supermassive Black Holes and Stripped Subgiants: Significant Signals for Future Gravitational Wave Detectors appeared first on AAS Nova.
]]>Current gravitational wave detectors are primarily sensitive to powerful sources like black hole–black hole mergers — what types of events may next-generation gravitational wave detectors reveal? A recent study explores stripped subgiant stars around supermassive black holes and how their gravitational waves may be detected in next-generation missions.
Inspiraling Stars and Gravitational Waves
The immense gravity of supermassive black holes at the centers of galaxies drives complicated dynamics that could generate so far undetected gravitational wave signals. One predicted source of gravitational waves is a rare event known as an extreme-mass-ratio inspiral (EMRI) — a prolonged inspiraling of a stellar-mass object around a supermassive black hole, driven inward by gravitational waves. EMRIs are thought to arise when a stellar-mass object is captured into a close-in nearly circular orbit around a supermassive black hole, emitting gravitational waves due to the object’s proximity to the black hole.
To date, most studies have explored EMRIs involving compact objects like black holes, but an EMRI with an inspiraling star is possible, though not yet well explored nor understood. In addition to generating gravitational waves, a stellar EMRI will also emit light as the supermassive black hole rips up siphoned material from the star. These events may explain recent observations of peculiar X-ray transients, but their gravitational wave counterparts remain undetected as EMRIs’ predicted signals fall outside the sensitivity range of current ground-based gravitational wave detectors. However, the Laser Interferometer Space Antenna (LISA), a space-based gravitational wave detector expected to launch in the mid-2030s, will be sensitive to the gravitational waves of EMRIs. In order to properly identify them, we must better understand what to expect.
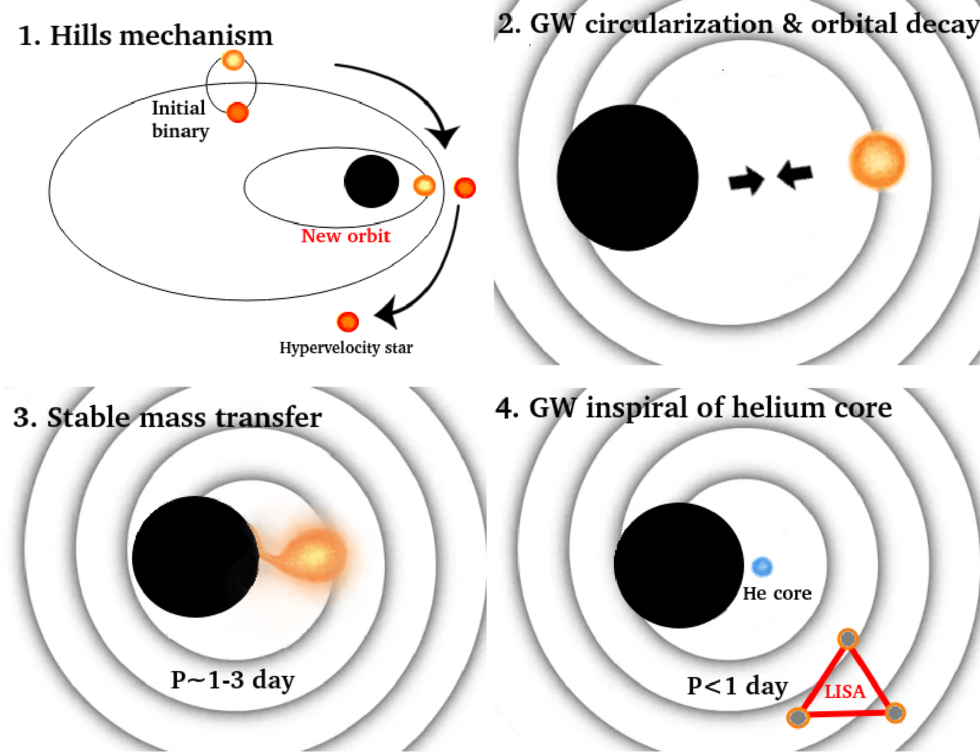
Diagram showing the evolutionary steps of a supermassive black hole capturing a subgiant star that subsequently undergoes mass transfer and gravitational wave-driven inspiral. Click to enlarge. [Olejak et al 2025]
Modeling a Subgiant Inspiral
Seeking to better predict what the gravitational waves of stellar EMRIs may look like and what LISA may detect, Aleksandra Olejak (Max Planck Institute for Astrophysics) and collaborators used stellar evolution code to simulate the evolution of a subgiant star as it transfers mass to a supermassive black hole and gravitational waves draw in its orbit. In their models, the supermassive black hole captures the star through scattering between stars or tidal interactions with a stellar binary in which the black hole catches one star and ejects the other.
Once the star is captured, its orbit becomes circularized around the black hole, pulled in closer over time until mass transfer of the star’s outer envelope begins. During this stage, the gravitational wave signal remains too weak to be detected. However, as the star is stripped down to just a helium core, it contracts and experiences an extended gravitational wave–driven orbital decay.
Possible Detections with LISA
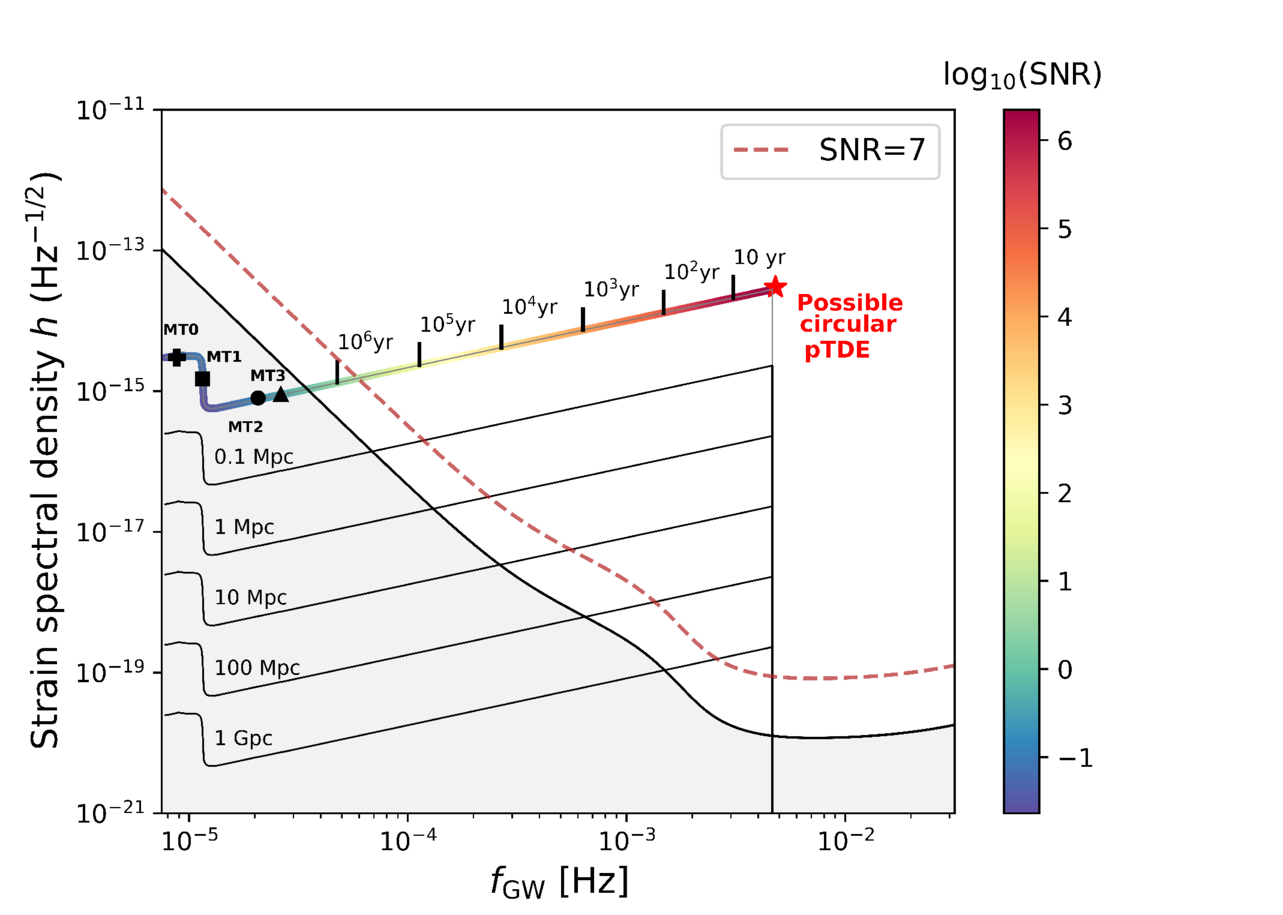
The strain spectral density as a function of the detected frequency of the gravitational wave. The colorful line indicates the signal from a stripped subgiant at the Milky Way’s center, and the gray lines are what would be observed at greater distances. LISA’s sensitivity to gravitational wave signals is shown with the black and red lines with detectable sources falling to the right of or above the line. Click to enlarge. [Olejak et al 2025]
This study provides exciting potential for what is possible with LISA, and future detections of gravitational waves will shine further light onto the complicated dynamics of galactic centers and the evolution of stars around supermassive black holes.
Citation
“Supermassive Black Holes Stripping a Subgiant Star Down to Its Helium Core: A New Type of Multimessenger Source for LISA,” Aleksandra Olejak et al 2025 ApJL 987 L11. doi:10.3847/2041-8213/ade432
The post Supermassive Black Holes and Stripped Subgiants: Significant Signals for Future Gravitational Wave Detectors appeared first on AAS Nova.
]]>
The "little red dot" CAPERS-LRD-z9 is the most distant object to show the characteristic broad emission lines of fast-moving gas around a black hole.
The post Distant Little Red Dot Hosts a Huge (and Growing) Black Hole appeared first on AAS Nova.
]]>Astronomers have confirmed the discovery of a little red dot galaxy from when the universe was roughly half a billion years old. The galaxy, CAPERS-LRD-z9, is the most distant object to show the tell-tale broad emission lines of gas spiraling around a black hole, opening a new window onto black hole growth in the early universe.
Little Red Dots in the Spotlight
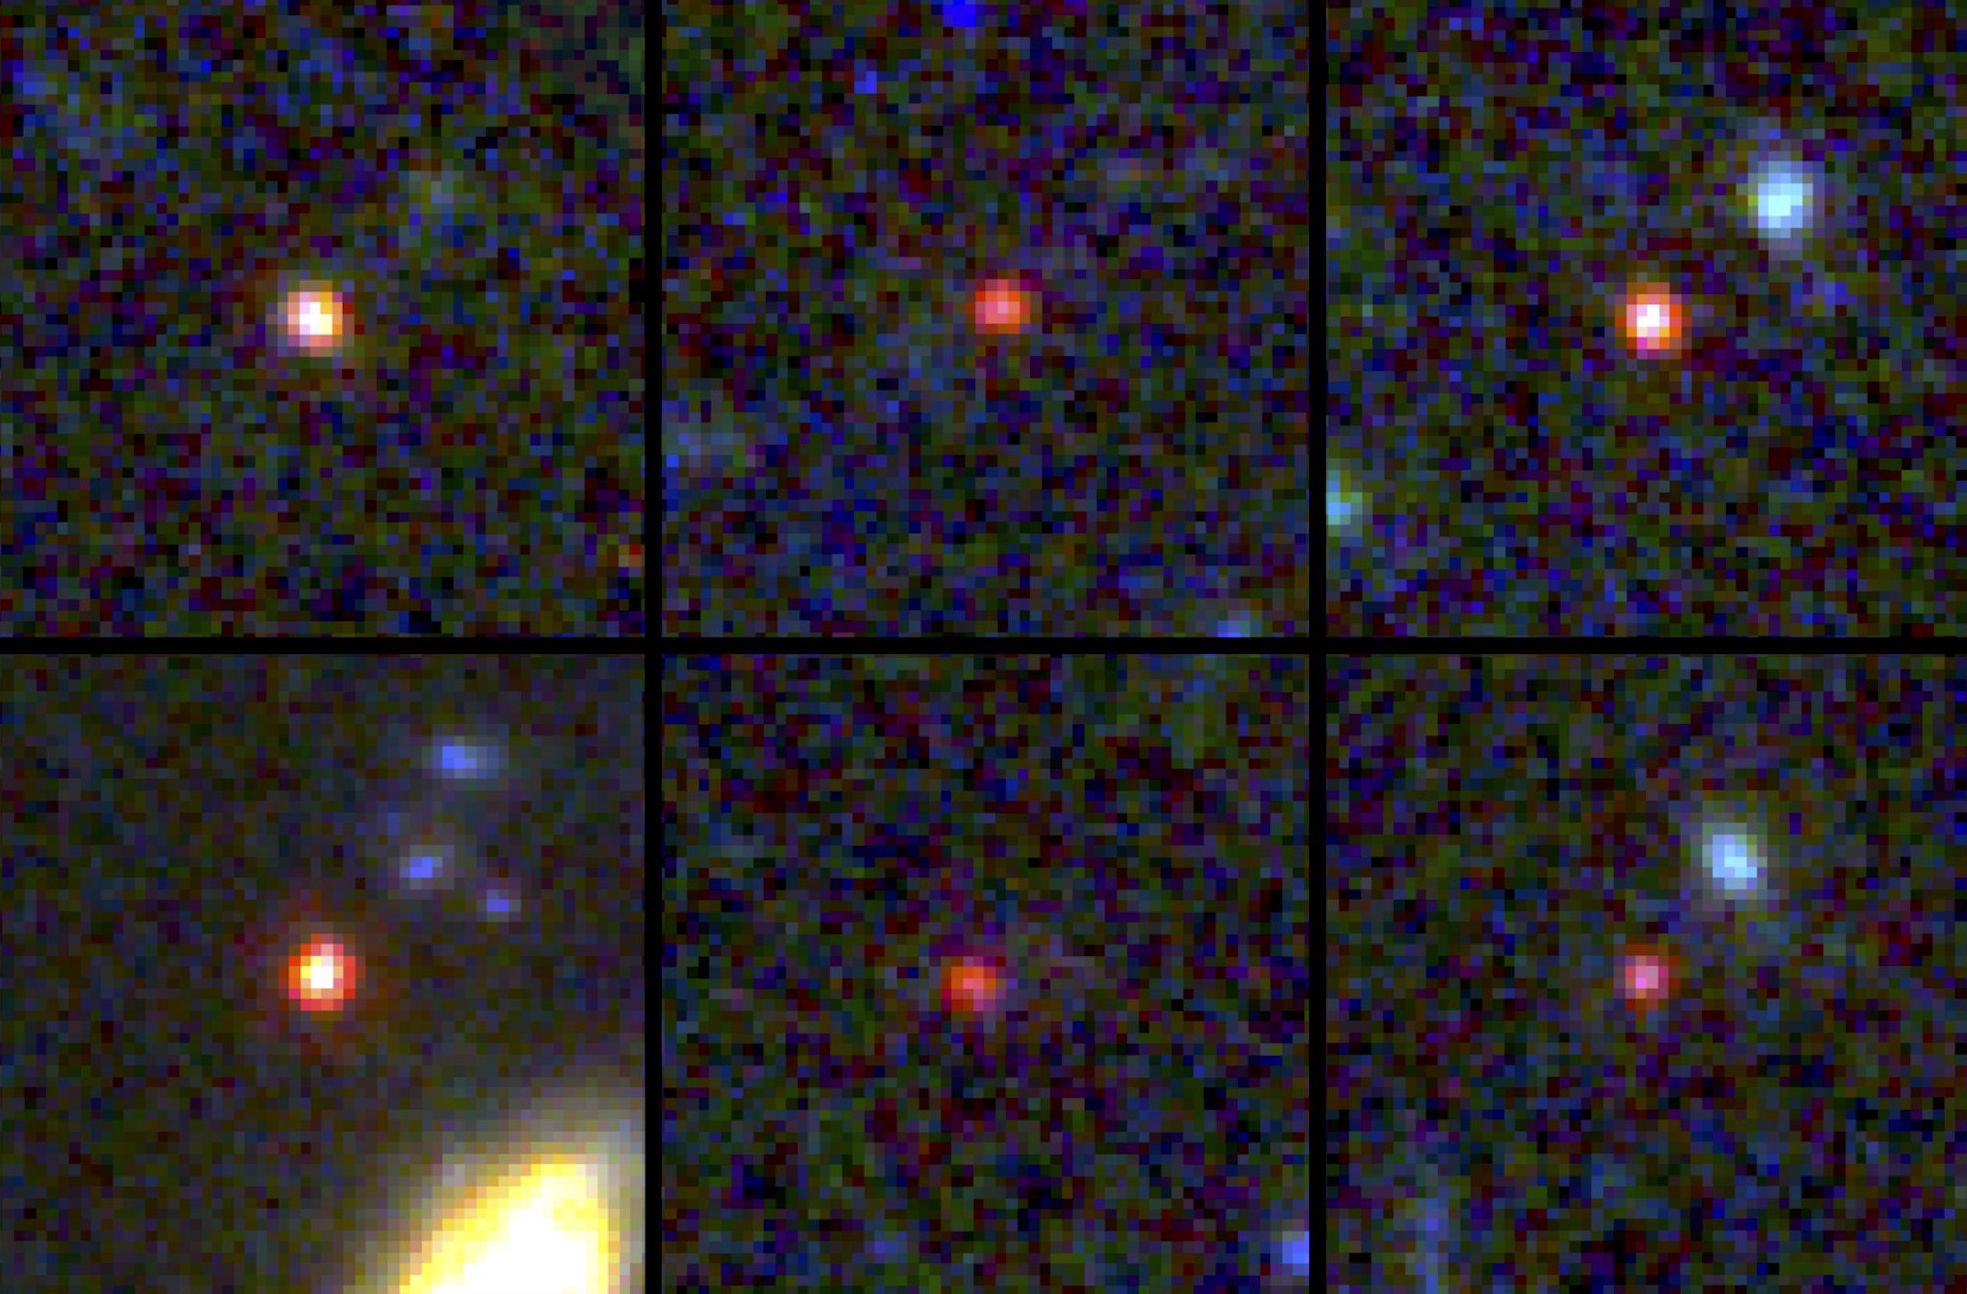
Images of six “little red dot” galaxies from JWST. [NASA/ESA/CSA/I. Labbe]
But what are little red dots? Are they growing supermassive black holes busily amassing gas? Compact collections of old stars? Shredded stars spoon-feeding baby black holes? As reported today in the Astrophysical Journal Letters, new JWST data provide answers for one particularly distant dot.
JWST Takes Another Look
CAPERS-LRD-z9 was first identified as a possible high-redshift little red dot when it was observed by the Public Release IMaging for Extragalactic Research (PRIMER) survey with JWST’s Near-Infrared Camera (NIRCam). Anthony Taylor (The University of Texas at Austin) and collaborators followed up on the discovery with JWST Near-Infrared Spectrograph (NIRSpec) observations from the CANDELS-Area Prism Epoch of Reionization Survey (CAPERS). This spectrum pinned the object’s redshift at z = 9.288, corresponding to when the universe was only about half a billion years old.
With CAPERS-LRD-z9 placed along the cosmic timeline, Taylor and coauthors turned to the question of its identity. The JWST spectra revealed a broad emission line from hydrogen gas moving at thousands of kilometers per second — evidence that CAPERS-LRD-z9 harbors an accreting supermassive black hole (an active galactic nucleus or AGN) that is spinning gas into a frenzy around it. CAPERS-LRD-z9 is the most distant object known to show this characteristic signature of a growing black hole.
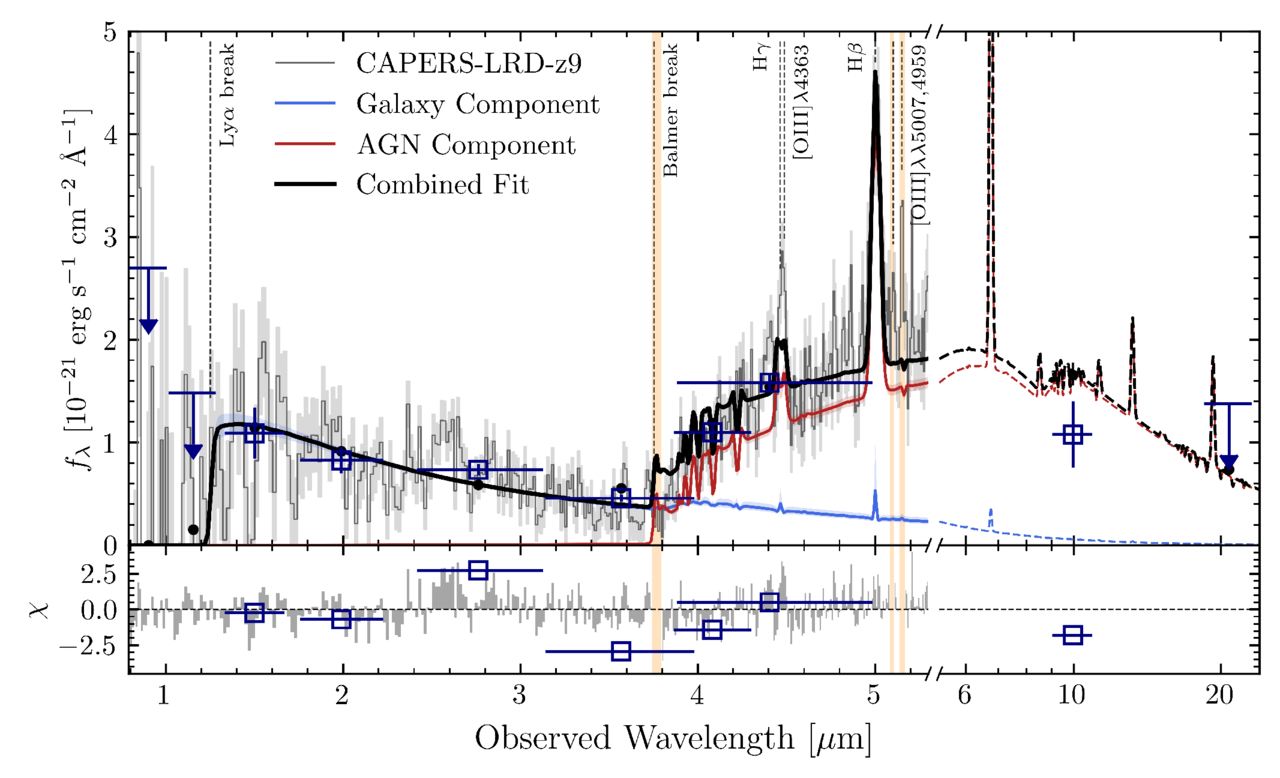
JWST NIRSpec spectrum of CAPERS-LRD-z9 with the fit from the AGN (red) plus stars (blue) model. Click to enlarge. [Taylor et al. 2025]
Seeding a Black Hole
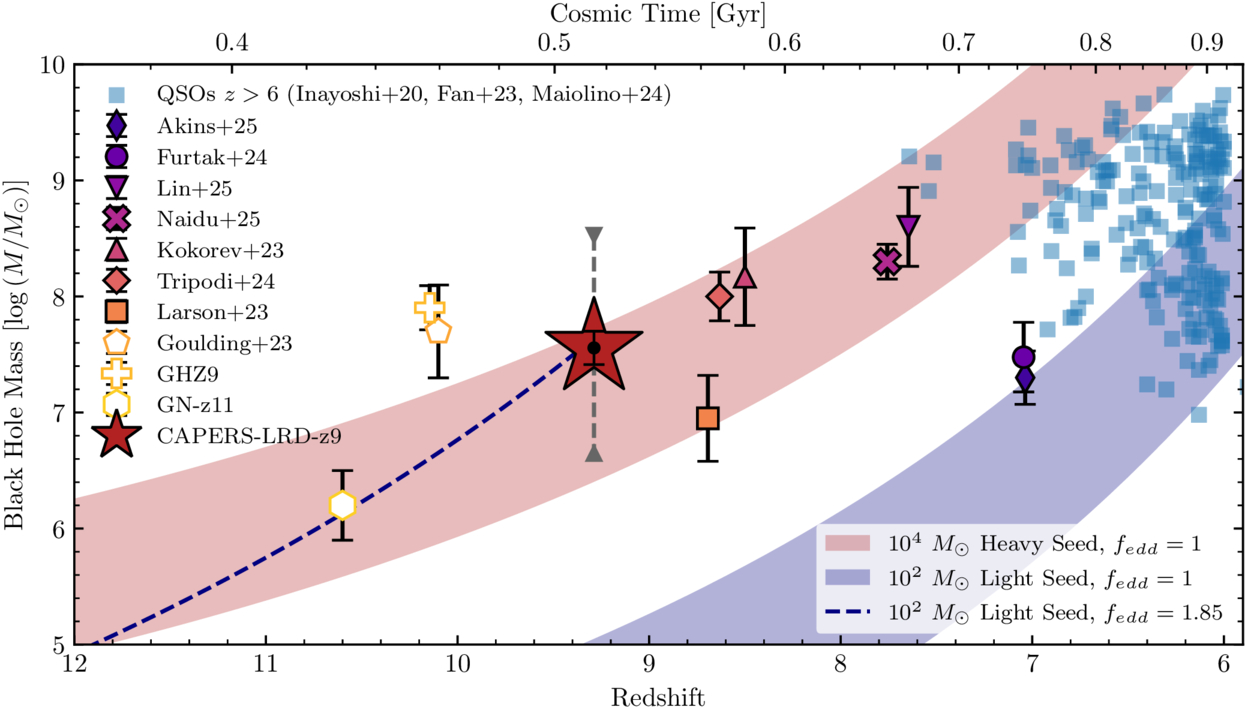
Observed black hole masses and redshifts of several sources, including CAPERS-LRD-z9 (large red star), quasars at redshifts of z > 6 (blue squares), massive spectroscopically confirmed AGN with broad emission lines (filled symbols), and the highest-redshift AGN detected to date via X-ray or ultraviolet emission. The shaded areas show the black hole masses achievable through accretion at the Eddington rate onto a massive (red) or stellar-mass (purple) seed. Click to enlarge. [Taylor et al. 2025]
This finding raises the question of how a black hole can grow to millions of solar masses in just 500 million years. The authors showed that this is possible in two scenarios: either the black hole began as a >10,000-solar-mass “seed” that grew at the Eddington rate — the hypothetical limit at which a black hole can accrete matter — or it started out as a smaller, ~100-solar-mass seed that grew at a super-Eddington rate. The observations rule out the possibility that the black hole grew from a ~100-solar-mass seed accreting at or below the Eddington rate.
In addition to setting the record for most distant broad-line AGN known, CAPERS-LRD-z9 gives new intel on the lives of black holes in the early universe. This won’t be the last we hear about this little red dot!
Citation
“CAPERS-LRD-z9: A Gas Enshrouded Little Red Dot Hosting a Broad-Line AGN at z = 9.288,” Anthony J. Taylor et al 2025 ApJL 989 L7. doi:10.3847/2041-8213/ade789
The post Distant Little Red Dot Hosts a Huge (and Growing) Black Hole appeared first on AAS Nova.
]]>
Astrobites reports on a warm, rocky exoplanet and what might be hidden beneath its atmosphere.
The post What’s Going On Inside GJ 486b? appeared first on AAS Nova.
]]>Editor’s Note: Astrobites is a graduate-student-run organization that digests astrophysical literature for undergraduate students. As part of the partnership between the AAS and astrobites, we occasionally repost astrobites content here at AAS Nova. We hope you enjoy this post from astrobites; the original can be viewed at astrobites.org.
Title: Unveiling the Interior Structure and Thermal Evolution of Super-Earth GJ 486b
Authors: Chandan K. Sahu et al.
First Author’s Institution: National Institute of Science Education and Research, India
Status: Published in ApJ
Planets between the sizes of Neptune and Earth, known as super-Earths, are the most frequently found planets in the galaxy. With no analog in our solar system, these worlds can offer a unique look at planet formation and evolution, and potentially life in the universe. To truly understand a planet’s environment and assess its potential for habitability, we must look at every part of it. This includes not just the atmosphere, but also the interior. Rocky planets, such as the inner solar system planets, typically don’t have enough gravitational pull to retain their primary atmospheres. Thus, only their secondary atmospheres remain. These secondary atmospheres are directly linked to the interior of the planet and are usually formed by volcanic outgassing, material from impacts on the planet’s surface, and other interior processes. By observing a rocky planet’s atmosphere and determining its composition, we can learn something about the interior of the planet as well.
The subject of today’s article, GJ 486b, is a warm super-Earth orbiting an M-dwarf star every 1.5 days. The transmission spectrum of the planet was recently observed by JWST, and when the data were analyzed, a potential water-rich atmosphere was discovered! Today’s authors take these recent discoveries of GJ 486b’s atmosphere and use them to model the interior of the planet.
One Model to Rule Them All
The interiors of rocky planets are not very well known. This is because the best way to understand what’s inside a rocky planet is through seismology. In order to do this, one must put a seismograph on a planet’s surface and measure how seismic waves move through the material inside the planet. Only three bodies have had seismographs landed on them: Earth, the Moon, and Mars. Rocky exoplanet interiors are even harder to understand when the only properties we know are the planet’s mass, radius, and certain aspects of its atmosphere. To understand exoplanet interiors, we have to use modeling to infer properties of the inside of the planet.
The authors of today’s article use the 1-D modeling package SERPINT (“structure and evolution model for rocky planet interiors”) to model GJ 486b’s interior based upon JWST observations of its atmosphere and assumptions made about rocky planets. Their model is broken down into four different parts, as illustrated in Figure 1.
Figure 1: Flowchart of SERPINT and the four different modules used in the overall model of GJ 486b’s interior. Arrows between each property indicate that they’re dependent on one another. [Sahu et al. 2025]
Taking all of these factors into account is important when creating a comprehensive picture of a planet. Each module models different processes that influence the planet’s interior, surface, and atmosphere, making sure that we’re taking all of these things into account when trying to understand the planet. It truly is one model to rule them all.
Outgassing and Photolysis and Escape, Oh My!
The authors start the model for the planet and star together and allow them both to evolve for 10 billion years. The planet starts with a mantle temperature of 5000K, which ensures the surface is molten, creating a magma ocean. This is typically how we think all rocky planets, including Earth, started their formation. Figure 2 illustrates how the mantle solidifies over time, influencing the overall structure of GJ 486b. Both layers of the mantle start to cool after the start of the simulation, and the lower mantle cools and solidifies first, followed by the upper mantle. This is due to the different composition in each layer and thus, a different temperature at which they will solidify. Cooling is delayed for a while due to internal heating from radioactive decay of the elements. This can be seen in Figure 2b with the shallow slope of the orange line. The orange line represents the mantle’s equilibrium temperature, and the yellow shaded region is the time in which the mantle has not yet solidified. As the mantle cools, it turns into a thick mush and then eventually into solid rock (as shown in Figure 2d). This indicates the mantle has solidified, and we move from the yellow shaded region on the graphs into the orange shaded region.
Figure 2: Evolution of different parameters associated with the modeling of the mantle (outer layer) of GJ 846b. Plot (a) shows how the host star changes its total luminosity (blue) and X-ray and ultraviolet luminosity (red) over time. Plot (b) shows how the mantle equilibrium temperature (orange) evolves towards the planet’s equilibrium temperature (blue). The red dashed line indicates the temperature at which the mantle completely solidifies. Plot (c) shows how the boundary between the mantle and other layers shifts over time as the mantle solidifies. This is shown in green. The magenta line in this plot shows the evolution of the radius at which the mantle is solidified. Plot (d) shows how the mantle viscosity changes over time as the mantle solidifies. The yellow shaded region indicates a time in which the mantle is not solid while the orange shaded region indicates a time after the mantle has solidified. [Sahu et al. 2025]
Figure 3: Evolution of the sources of water on GJ 486b. The blue line shows the mass of water in the solid part of the mantle. The orange line shows the mass of water in the melting part of the mantle. The green line shows the mass of atmospheric water, and the red line shows the escaping atmospheric water. Each of these sources of water is crucial to understanding the life cycle of water on this planet. [Adapted from Sahu et al. 2025]
Original astrobite edited by Tori Bonidie.
About the author, Kaz Gary:
I am a third-year PhD student at The Ohio State University with a focus in exoplanetary science. My current work focuses on modeling exoplanet observations for two upcoming space-based telescope missions: the Twinkle satellite and Habitable Worlds Observatory. Outside of research, I help develop exoplanet-focused shows for the Arne Sletteback Planetarium at OSU. In my free time, I enjoy playing tabletop RPGs, painting, watching terrible reality TV, and hanging out with my pet hedgehog.
The post What’s Going On Inside GJ 486b? appeared first on AAS Nova.
]]>
New observations from the X-Ray Imaging and Spectroscopy Mission (XRISM) show the multilayered winds of NGC 4151 in a whole new light.
The post Blown Away by the Winds of NGC 4151 appeared first on AAS Nova.
]]>Astronomers have known about NGC 4151’s X-ray-emitting active galactic nucleus since the 1970s. Now, observations from the X-Ray Imaging and Spectroscopy Mission (XRISM) show it in a whole new light.
Getting Feedback
Illustration of the winds and accretion disk of an active galactic nucleus. [NASA, and M. Weiss (Chandra X -ray Center)]
AGN feedback can dramatically reshape a galaxy’s star formation and evolution. One of the most powerful ways an accreting supermassive black hole can influence its host galaxy is through ionized winds, which can scour the surrounding galactic bulge clear of star-forming material. There is much still to learn about these winds, including how they are structured and what physical processes drive them.
New Insights from XRISM
NGC 4151 provides an excellent opportunity to learn about active galactic nucleus winds. Only about 60 million light-years away, NGC 4151 hosts an accreting 34-million-solar-mass black hole that is luminous, highly variable, and shows a complex absorption spectrum that suggests that the AGN’s intense radiation is filtering through outflowing winds.
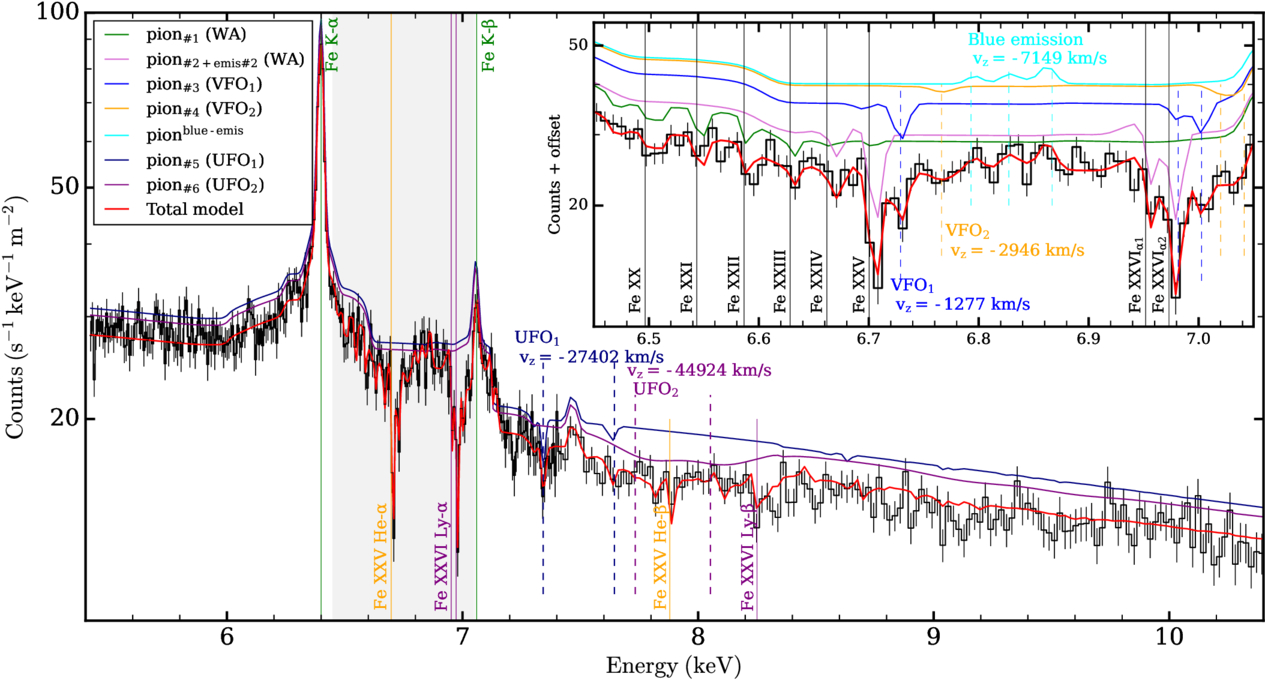
XRISM spectrum of NGC 4151, showing the multi-component model fit. Click to enlarge. [Xiang et al. 2025]
Xiang’s team modeled the array of absorption and emission lines in the XRISM spectra to tease out the properties of NGC 4151’s winds. They found that the best match to the spectra required up to six layers of absorbing material, showing that NGC 4151’s winds are highly structured. These absorbing layers took the form of slow warm absorbers (velocities between 100 and 1,000 km/s), very fast outflows (1,000–10,000 km/s), and ultra-fast outflows (10,000–100,000 km/s; up to one-third of the speed of light). While most of these components carry away mass as fast as or faster than the black hole accretes, some appeared to lack the oomph to escape the oncoming accretion flow, suggesting that they might be “failed” winds that curl back toward the AGN.
Being Blown Away
The data showed that the winds are likely magnetocentrifugally driven, meaning that material is lifted and accelerated from the surface of the disk along magnetic field lines as the disk rotates. For some of the wind components, especially warm absorbers emerging farther from the black hole, radiation pressure may be a driver as well.
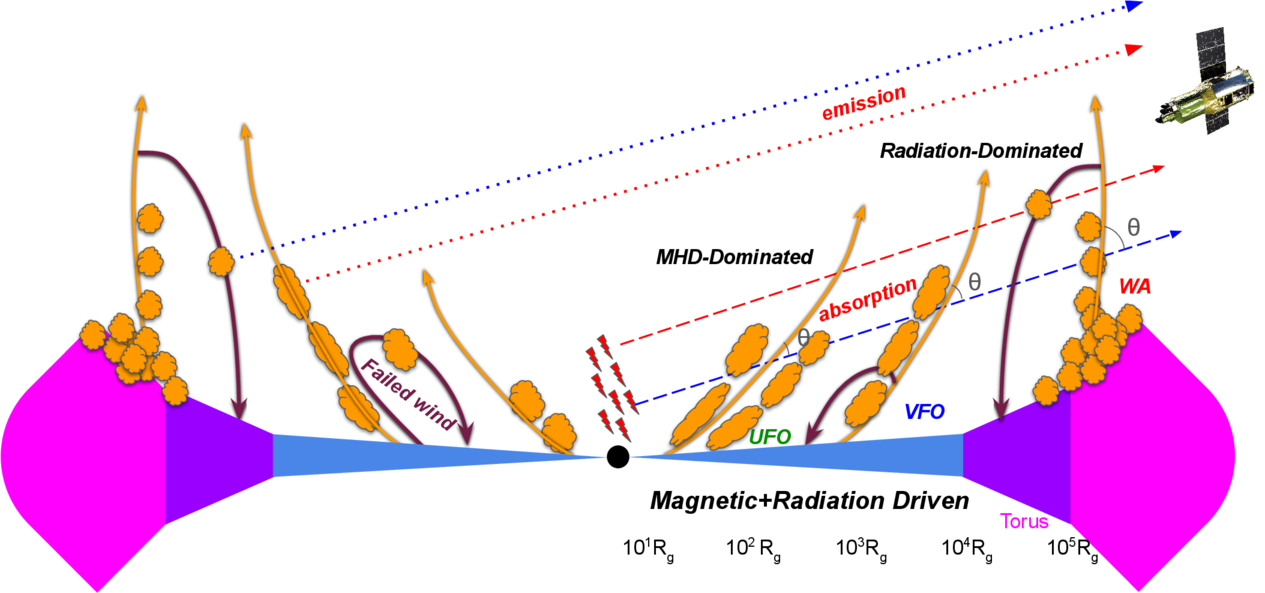
Diagram of the wind components of NGC 4151, including ultra-fast outflows (UFOs), very fast outflows (VFOs), and warm absorbers (WAs). [Xiang et al. 2025]
Citation
“XRISM Spectroscopy of Accretion-Driven Wind Feedback in NGC 4151,” Xin Xiang et al 2025 ApJL 988 L54. doi:10.3847/2041-8213/adee9b
The post Blown Away by the Winds of NGC 4151 appeared first on AAS Nova.
]]>
Worth the wait: using observations separated by 15 years, researchers have clocked the speed of a neutron star flying through space and shed light on how these stellar remnants are launched by supernova explosions.
The post Get a Kick Out of This: Researchers Waited 15 Years to Measure a Neutron Star’s Journey appeared first on AAS Nova.
]]>With a measurement 15 years in the making, astronomers have pinned down the path of a neutron star launched by a collapsing star. This finding helps to explain how neutron stars are “kicked” into space by supernovae.
Just for Kicks
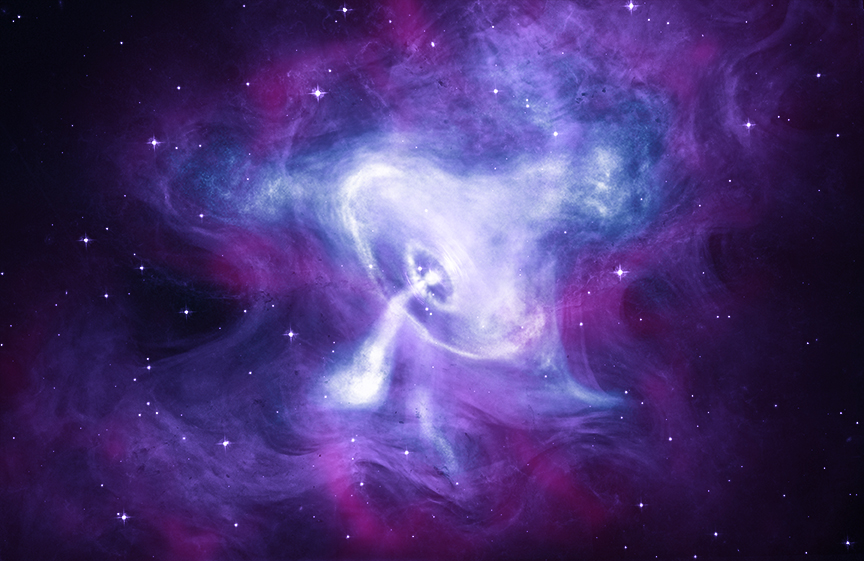
This multiwavelength image shows the pulsar — a type of neutron star — at the center of the Crab Nebula supernova remnant. [X-ray: NASA/CXC/SAO; Optical: NASA/STScI; Infrared: NASA-JPL-Caltech]
Many neutron stars have been observed to zip through space at hundreds of kilometers per second, which suggests that these stars get a “kick” when they’re born in a supernova. However, the details of this kick are not yet clear. Are neutron stars launched into space in the opposite direction from the material ejected in the explosion, as some studies suggest? Or is the neutron star’s motion determined by the burst of neutrinos that carries off most of the supernova’s energy, as other studies hint?
Worth the Wait
To answer these questions, astronomers must compare the velocities of young neutron stars to the movement of their associated supernova remnants. In a recent research article, Tyler Holland-Ashford (NASA Goddard Space Flight Center) and collaborators measured the motion of the neutron star affiliated with the G18.9–1.1 supernova remnant, using Chandra observations made 15 years apart in September 2009 and July 2024.
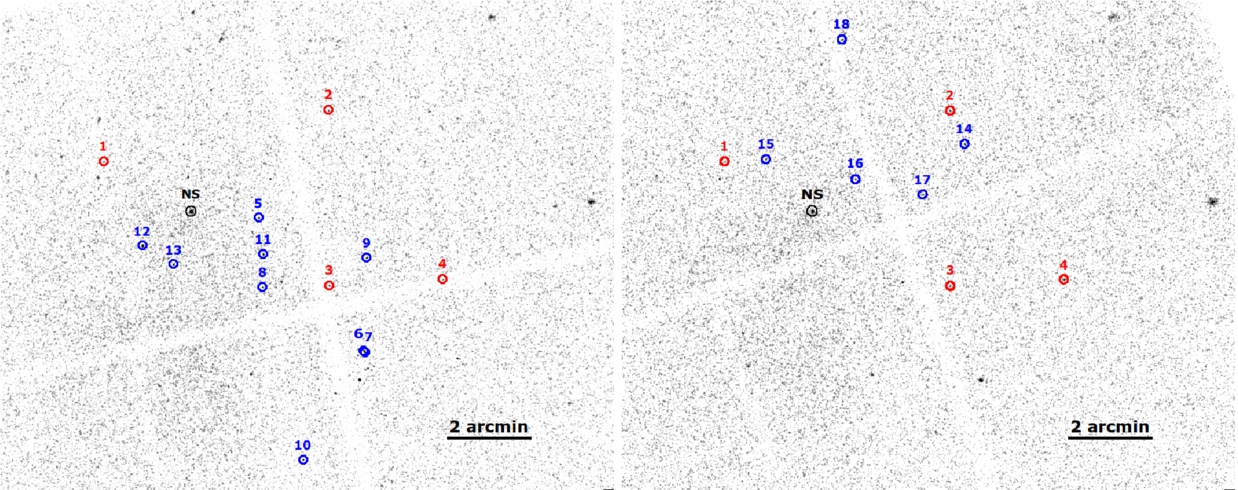
Chandra images from 2009 (left) and 2024 (right; this image is the merged product of two observations). The neutron star is shown in black. Blue and red sources were used for astrometric correction. The red sources were present in both observations. Click to enlarge. [Holland-Ashford et al. 2025]
Because the distance to the supernova remnant is uncertain, this proper motion could correspond to a range of transverse velocities. For distance estimates of 6,800 and 12,400 light-years, this puts the neutron star’s transverse velocity at 264 or 474 km/s, respectively.
A Distinct Offset
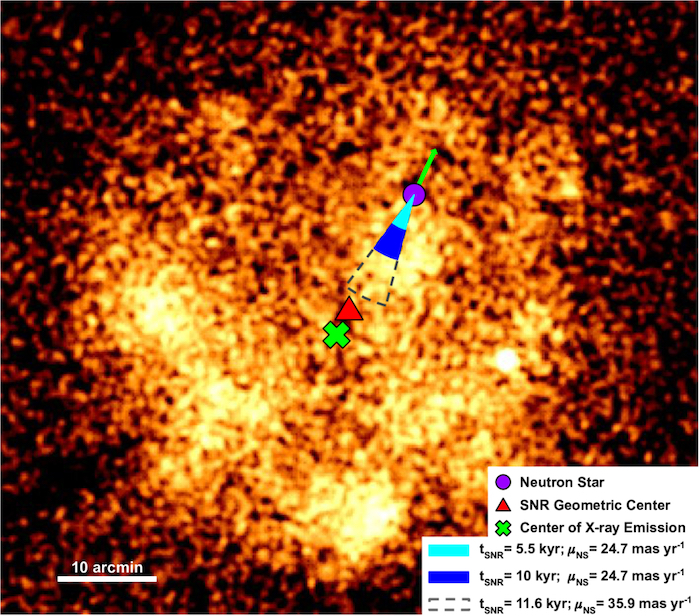
Current location of the neutron star (purple) compared to the geometric center of the supernova remnant (red) and the center of its X-ray emission (green). Even assuming the oldest reasonable age for the supernova remnant, there is a distinct offset between the neutron star’s birthplace and the center of the remnant. Click to enlarge. [Holland-Ashford et al. 2025]
Currently, Chandra is the only X-ray observatory with fine enough resolution to make the kind of measurement needed in this study. Luckily, Chandra’s observations of neutron stars stretch back to 1999, and combining this wealth of data with sensitive measurements from future high-resolution X-ray instruments should provide the long time baselines needed to trace the trajectories of more neutron stars and further explore the origins of neutron star kicks.
Citation
“Proper Motion of the Neutron Star in the Supernova Remnant G18.9–1.1,” Tyler Holland-Ashford et al 2025 ApJ 988 218. doi:10.3847/1538-4357/adeb7e
The post Get a Kick Out of This: Researchers Waited 15 Years to Measure a Neutron Star’s Journey appeared first on AAS Nova.
]]>
Catch up on recent astronomy news: a stellar navigation experiment, a doomed planet, an icy protostar, and a mysterious radio source.
The post Monthly Roundup: Astronomy in the News appeared first on AAS Nova.
]]>There’s been a lot of astronomy in the news lately! Many recent news stories have featured research published in the AAS journals, so today we’re taking a look at four research articles that have recently gotten attention from the media.
New Horizons Navigates by the Stars
Starting closest to home, the first article describes a technological demonstration that took place on the edge of our solar system. In the nearly 20 years since its launch, the New Horizons spacecraft has ventured from Cape Canaveral to its current berth in the Kuiper Belt, roughly 61 au (5.7 billion miles or 9.1 billion kilometers) from Earth. In that time, New Horizons became the first spacecraft to venture close to Pluto and its moons as well as a second Kuiper Belt object called Arrokoth.
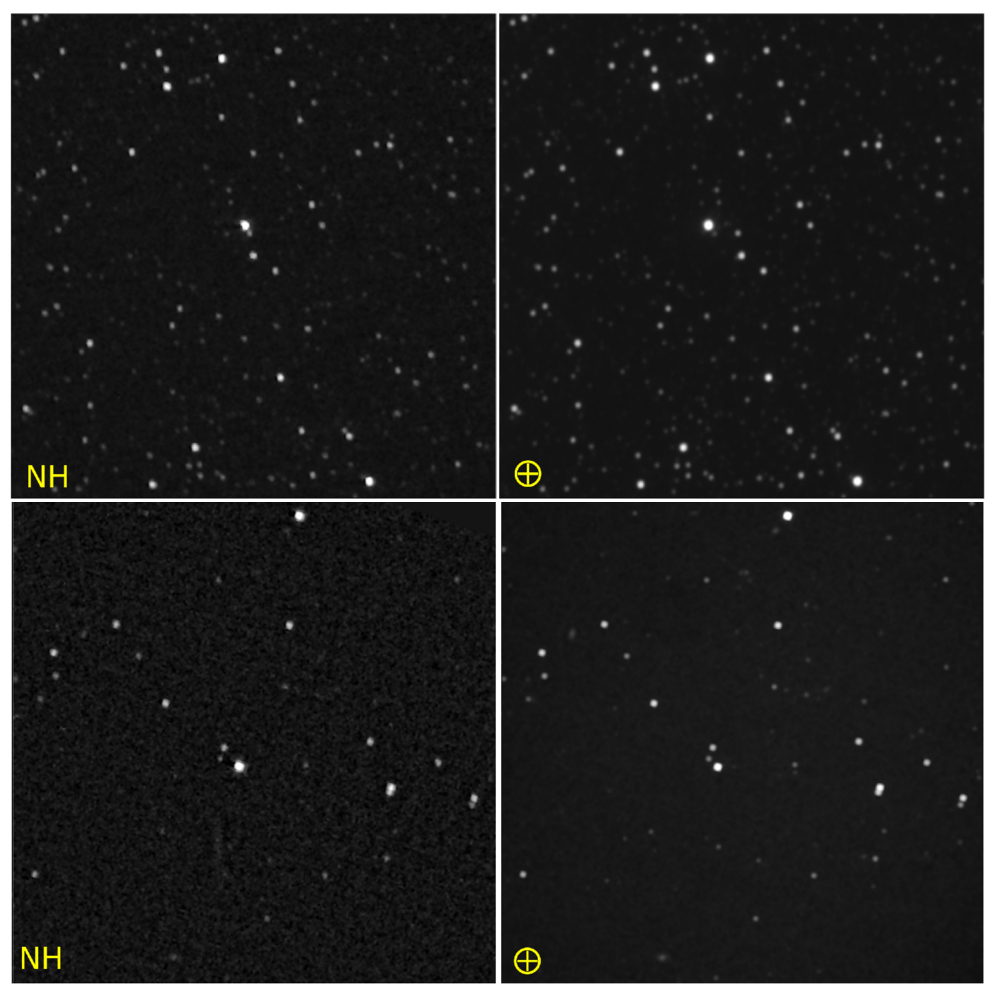
The difference in the position of Proxima Centauri (top row) and Wolf 359 (bottom row) as seen from New Horizons (left column) and Earth (right column) is evident by eye. [Adapted from Lauer et al. 2025]
From the apparent shift in position of the two stars, the team determined the location of the spacecraft in space as well as the error in their measurement. They were able to ascertain the position of the spacecraft to within 0.44 au of its true position.
Though this measurement is far less accurate than localization with the Deep Space Network, it’s still an important step toward understanding the future prospects for autonomous spacecraft navigation via the stars. Looking ahead to future interstellar navigation systems, the team showed that measurements of a few nearby stars (Proxima Centauri and Barnard’s Star are the best bets for journeys within tens of thousands of astronomical units of the Sun) are more useful than measurements of a larger number of more distant stars. Basing measurements on a larger number of images to cut down on random scatter in the position of the star would also improve the results, as would simply using newer instruments. Ultimately, other types of navigation systems, such as those based on measurements of pulsars, are more likely to reach the precision necessary for autonomous spacecraft navigation. However, this method remains interesting, given that the straightforward nature of the imaging and analysis is already well within the capabilities of modern spacecraft systems.
First Detection of Semiheavy Water Ice Around a Low-Mass Protostar
Next up is a discovery from 457 light-years away in the Taurus molecular cloud. With a mass of 0.3–0.5 solar mass, a disk spanning 75–125 au, and a surrounding envelope of 0.9 solar mass, the isolated low-mass protostar L1527 is likely to grow into a star of similar mass to the Sun. That makes it an excellent target for investigating how planetary systems like our own acquire critical molecules like water.
Katerina Slavicinska (Leiden Observatory) and coauthors used JWST to search L1527 for semiheavy water (HDO) — a water molecule in which one of the hydrogen atoms is replaced with a deuterium atom. HDO has been detected in many locations throughout our solar system, including in Earth’s oceans, and water in our solar system tends to contain a high abundance of HDO molecules. A high deuterium abundance can be linked to formation in a cold environment, suggesting that our solar system’s water may have formed in the icy clouds out of which the Sun and the planets were born.
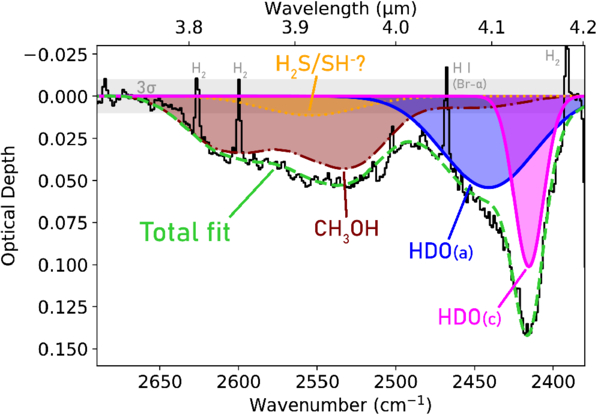
JWST spectrum of L1527. [Slavicinska et al. 2025]
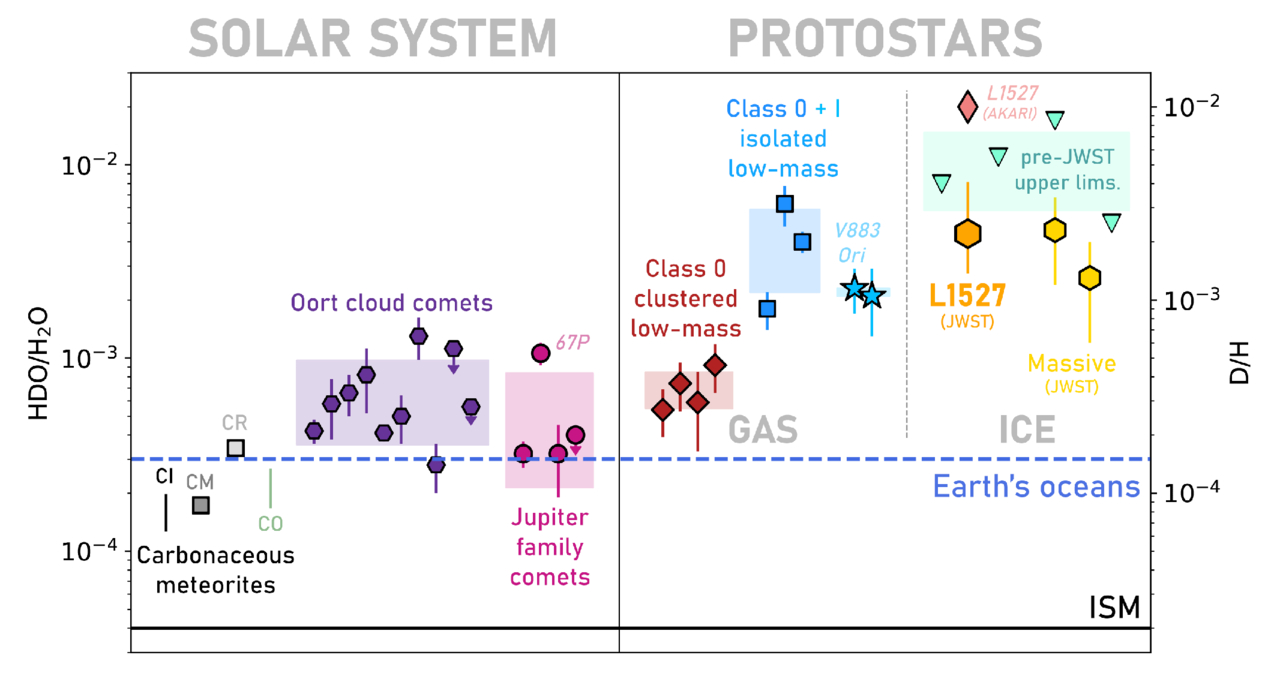
HDO/H2O ratios for various solar system objects and protostars. Click to enlarge. [Slavicinska et al. 2025]
This study demonstrates JWST’s ability to investigate the chemistry of young stars and probe the chemical evolution of protostars and planetary systems. Slavicinska and coauthors identified two important next steps to advance our understanding of the chemistry of star- and planet-forming environments: 1) measuring gas-phase and ice-phase HDO/H2O ratios in the same object to understand how gas-phase chemistry alters water around protostars and 2) measuring the HDO/H2O ratios of larger samples of isolated and clustered protostars in order to understand the impact of environmental factors.
A Massive Planet Approaches Its Doom
TOI-2109b is an ultra-hot Jupiter exoplanet that orbits its host star every 16 hours, giving it the shortest period of any known hot Jupiter. Orbiting its host star so closely, TOI-2109b is susceptible to powerful tidal forces that can lead to an exchange of angular momentum between the planet and its home star, potentially causing the planet to spiral inward and be engulfed by its star.
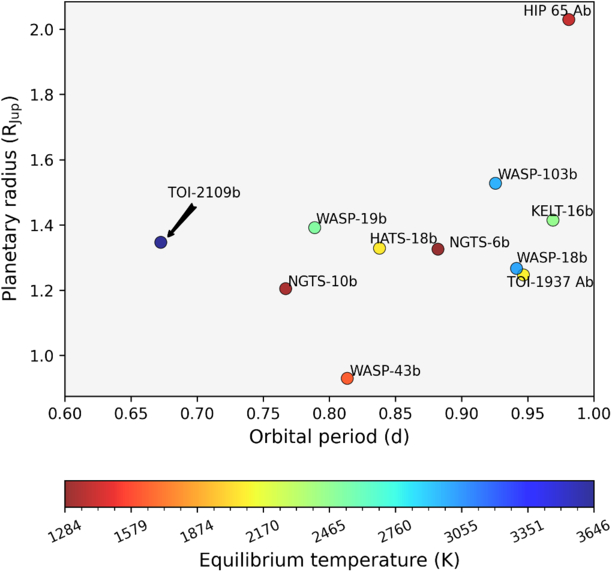
Comparison of the orbital period, temperature, and radius of TOI-2109b to other ultra-short-period Jupiters. [Alvarado-Montes et al. 2025]
Alvarado-Montes and coauthors used data from the Transiting Exoplanet Survey Satellite (TESS), the CHaracterising ExOPlanet Satellite (CHEOPS), and multiple ground-based telescopes to constrain the rate of change of TOI-2109b’s orbital period. Taking into account changes in transit timing due to an outer planet candidate in the system, deviations from spherical symmetry, and other factors, the authors find a likely orbital decay rate of just 2.6 milliseconds per year. This is consistent with the rate predicted for a “young” host star, and it’s expected to shift TOI-2109b’s mid-transit time by a few seconds over a three-year period. This change is potentially detectable with high-cadence observations, helping to understand not just the fate of TOI-2109b, but of ultra-short-period planets as a whole.
Discovery of a Mysterious Long-Period Transient
Finally, Fengqiu Adam Dong (National Radio Astronomy Observatory; Green Bank Observatory) and coauthors recently described their discovery of an unusual long-period transient radio signal. Long-period radio transients exhibit signals that repeat with periods ranging from 10 seconds to multiple hours. While the exact origin of these signals remains unknown, researchers suspect that magnetic white dwarfs and neutron stars are the cause, with the two sources perhaps representing different classes under the long-period radio transient umbrella.
The signal was detected by the Canadian Hydrogen Intensity Mapping Experiment (CHIME) radio telescope, which was searching for bursts of radio emission from pulsars within our galaxy. The newly discovered radio signal, which comes from a source named CHIME J1634+44, has a primary period of 841 seconds and a secondary period of 4,206 seconds, making it decidedly un-pulsar-like. Dong’s team performed follow-up observations of CHIME J1634+44 with the Very Large Array, the Neil Gehrels Swift Observatory, and the Green Bank Telescope. The Very Large Array and the Green Bank Telescope each detected two bursts from the source, bringing the total number of bursts reported in this study to 89.
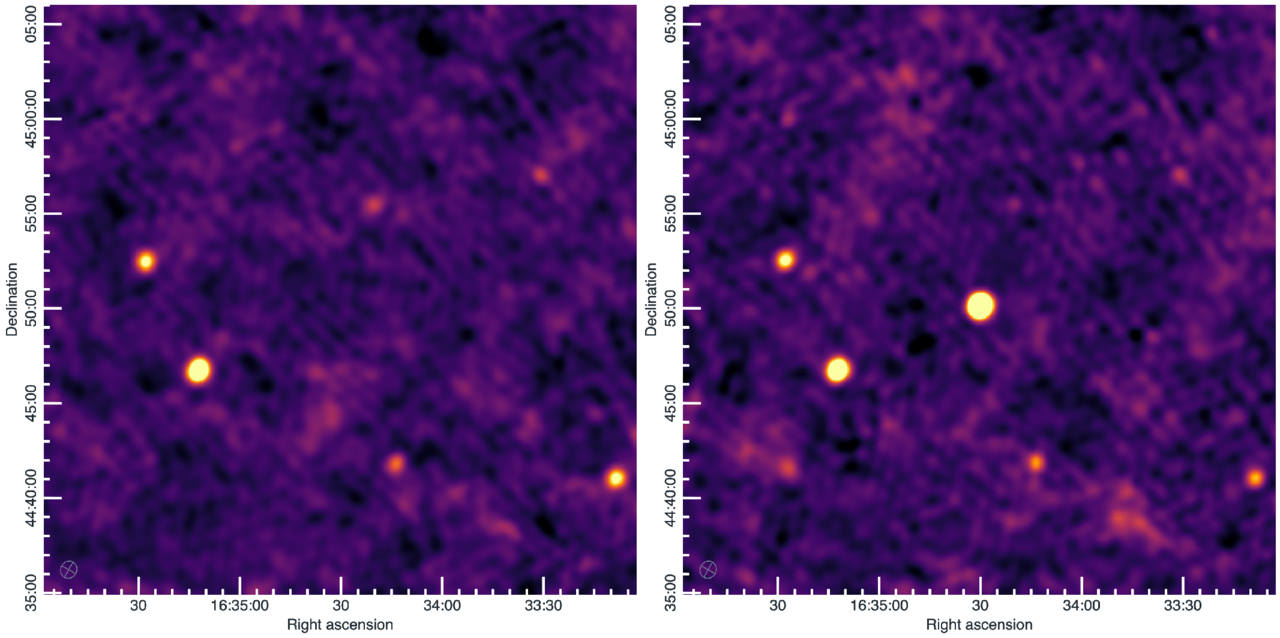
Continuum images of CHIME J1634+44 from the Very Large Array. The two panels show the autocorrelation function of the left-hand (left) and right-hand (right) circularly polarized components of the signal. CHIME J1634+44 is only detected in one of these two images, which suggests a 100% circularly polarized signal. [Dong et al. 2025]
What kind of object could produce this signal? Dong and coauthors considered binary systems containing either a white dwarf or a neutron star. Neither scenario perfectly fits the available evidence, but the team concluded that a binary system containing a neutron star is the likeliest source of the long-period, highly polarized, steadily accelerating pulses of CHIME J1634+44. The strongest evidence in favor of this scenario is that neutron stars are known to exhibit strongly polarized pulses of similar luminosity to those from CHIME J1634+44. Dong’s team expects that CHIME J1634+44 will remain an important test of theories of long-period radio transients — and as new information emerges about its identity, CHIME J1634+44 might just find its way into the news again!
Citation
“A Demonstration of Interstellar Navigation Using New Horizons,” Tod R. Lauer et al 2025 AJ 170 22. doi:10.3847/1538-3881/addabe
“HDO Ice Detected Toward an Isolated Low-Mass Protostar with JWST,” Katerina Slavicinska et al 2025 ApJL 986 L19. doi:10.3847/2041-8213/addb45
“Orbital Decay of the Ultra-Hot Jupiter TOI-2109b: Tidal Constraints and Transit-Timing Analysis,” Jaime A. Alvarado-Montes et al 2025 ApJ 988 66. doi:10.3847/1538-4357/ade057
“CHIME/Fast Radio Burst Discovery of an Unusual Circularly Polarized Long-Period Radio Transient with an Accelerating Spin Period,” Fengqiu Adam Dong et al 2025 ApJL 988 L29. doi:10.3847/2041-8213/adeaab
The post Monthly Roundup: Astronomy in the News appeared first on AAS Nova.
]]>
Astrobites reports on the intricate spin distributions created by recoil kicks from merging black holes.
The post The Black Hole Tango: Kicks and Spins in Hierarchical Mergers appeared first on AAS Nova.
]]>Editor’s Note: Astrobites is a graduate-student-run organization that digests astrophysical literature for undergraduate students. As part of the partnership between the AAS and astrobites, we occasionally repost astrobites content here at AAS Nova. We hope you enjoy this post from astrobites; the original can be viewed at astrobites.org.
Title: Gravitational-Wave Kicks Impact Spins of Black Holes from Hierarchical Mergers
Authors: Angela Borchers, Claire S. Ye, and Maya Fishbach
First Author’s Institution: Max Planck Institute for Gravitational Physics
Status: Published in ApJ
The room is large and densely packed. As you twirl across the floor, someone extends their hand, inviting you to dance. The two of you spin around each other, the tension building with every step. As you draw closer and closer, you realize this isn’t a ballroom, and you’re not people. This is outer space, and you and your partner are black holes, spiraling toward one another in one of the most energetic events in the universe: a black hole merger.
In this cosmic dance, black holes in a binary system orbit each other while also spinning around their own axes. Their spins are inherited from the angular momentum of the massive stars that collapsed to form them. After the two black holes merge, the remnant black hole also spins. The final spin depends on the spins of the two merging black holes and the ratio of the mass of the larger black hole to that of the smaller one. The higher the mass ratio, the more the larger black hole dominates the final spin. To quantify how fast black holes spin, physicists use a dimensionless spin parameter that ranges from 0 (not spinning at all) to 1, the maximum allowed by general relativity.
Observing the distribution of black hole spins helps us understand how binary systems form. For example, binaries formed through isolated channels, where the black holes are born and evolve together, are likely to have similar spin magnitudes, and the directions of their spins tend to align with their orbital motion. In contrast, black holes that form separately and later become a pair through dynamic encounters in dense environments typically have randomly oriented spins (see Figure 1). To determine which formation channels are more common, we need accurate predictions of the expected spin distributions for each scenario to compare them directly to merger observations from detectors like LIGO/Virgo or future gravitational-wave observatories.
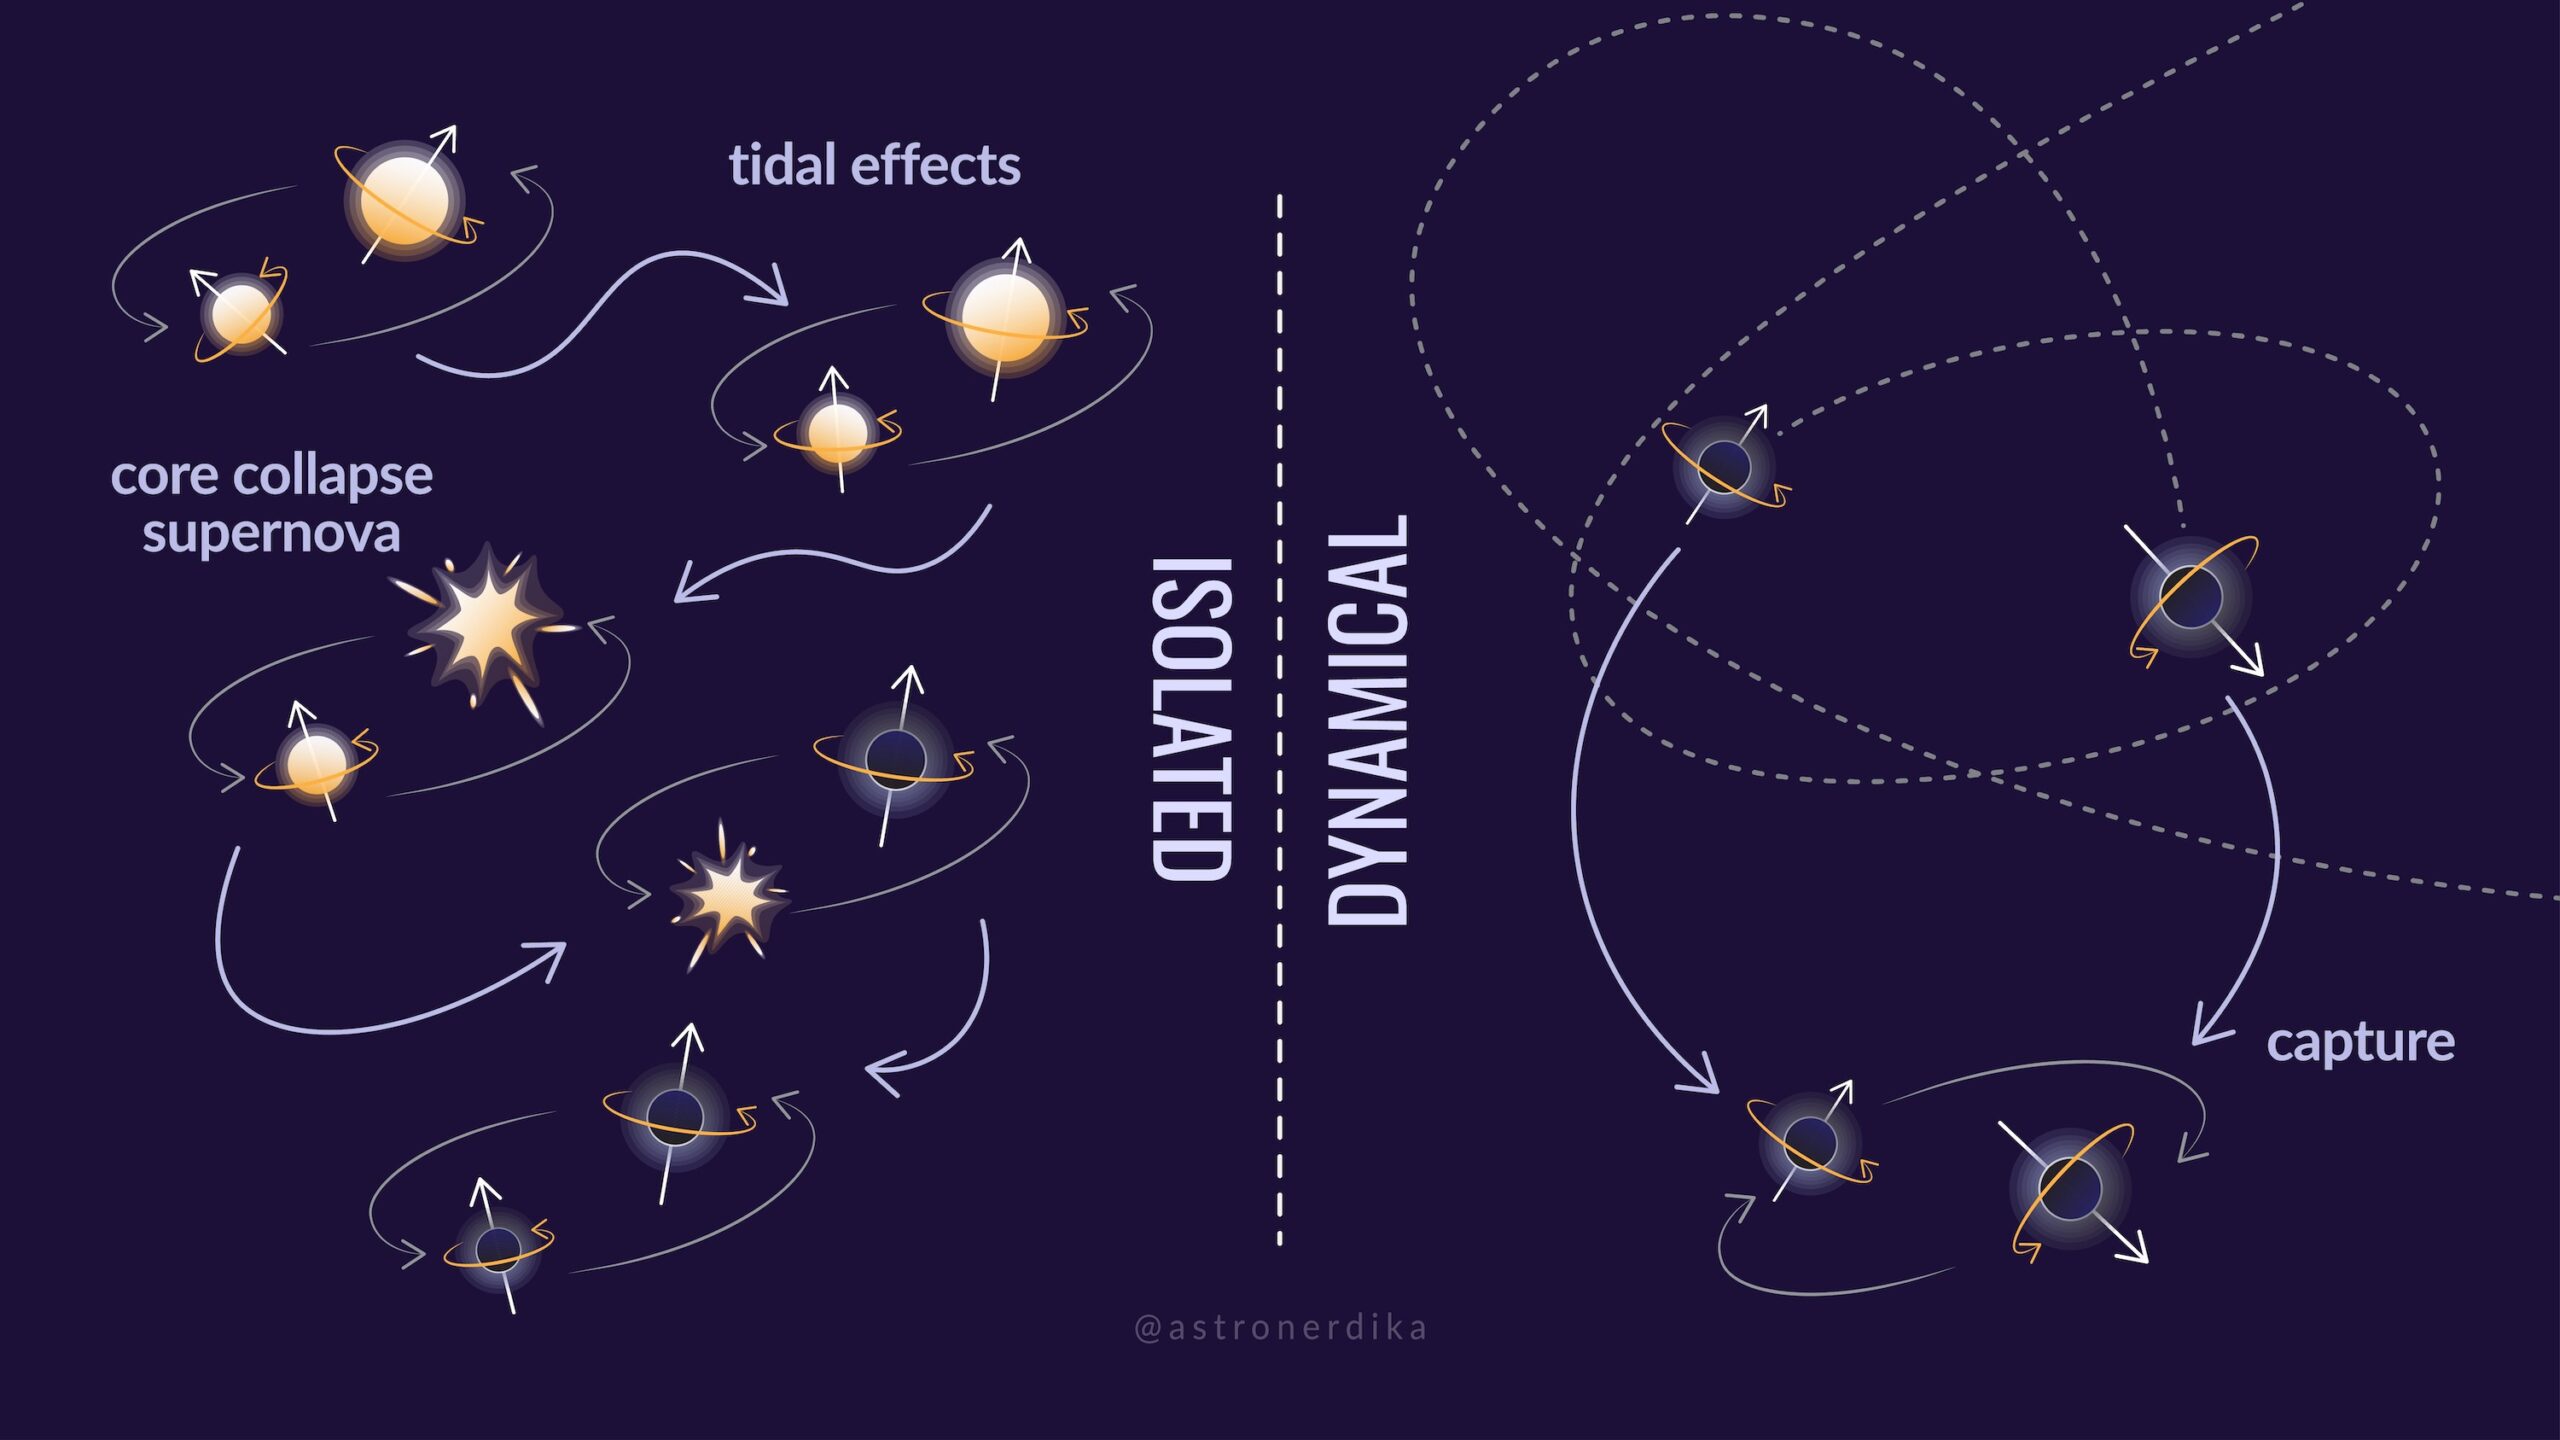
Figure 1: Graphic showing two main formation channels of black hole binaries. [Reproduced with permission from Shanika Galaudage/Space Australia]
After a merger, the newly formed black hole receives a “kick” velocity — a shove that sends it moving through space. This happens because gravitational waves carry away linear momentum asymmetrically during the merger, and to conserve momentum, the remnant black hole recoils in the opposite direction. If its kick exceeds the escape velocity of its cluster, the remnant is ejected, making it unlikely to merge again. However, remnants that receive smaller kicks are retained and can go on to merge again, contributing to the spin distribution over multiple generations. The authors of this article study the final spin distribution of black holes that remain within a cluster after forming from hierarchical mergers.
Simulating Binaries in a Globular Cluster
The authors simulate a first-generation population of one million black holes that are assumed to all have the same initial spin, labeled ai. The authors use data from globular cluster simulations to determine the properties of binaries found in dense environments. The final spin, af, and kick velocity of the black holes are calculated using a high-accuracy model of black hole merger remnants. Only black holes with kick velocities less than the escape velocity of typical globular clusters are kept in the population for future mergers. For their analysis across multiple merger generations, the authors test escape velocities of 50, 100, and 200 km/s.
Some initial binary configurations are more likely to produce high kick velocities that could eject the remnant from the cluster. Figure 2 shows that binaries with isotropic (randomly oriented) spins tend to produce larger kicks than those with spins aligned with the orbital motion.
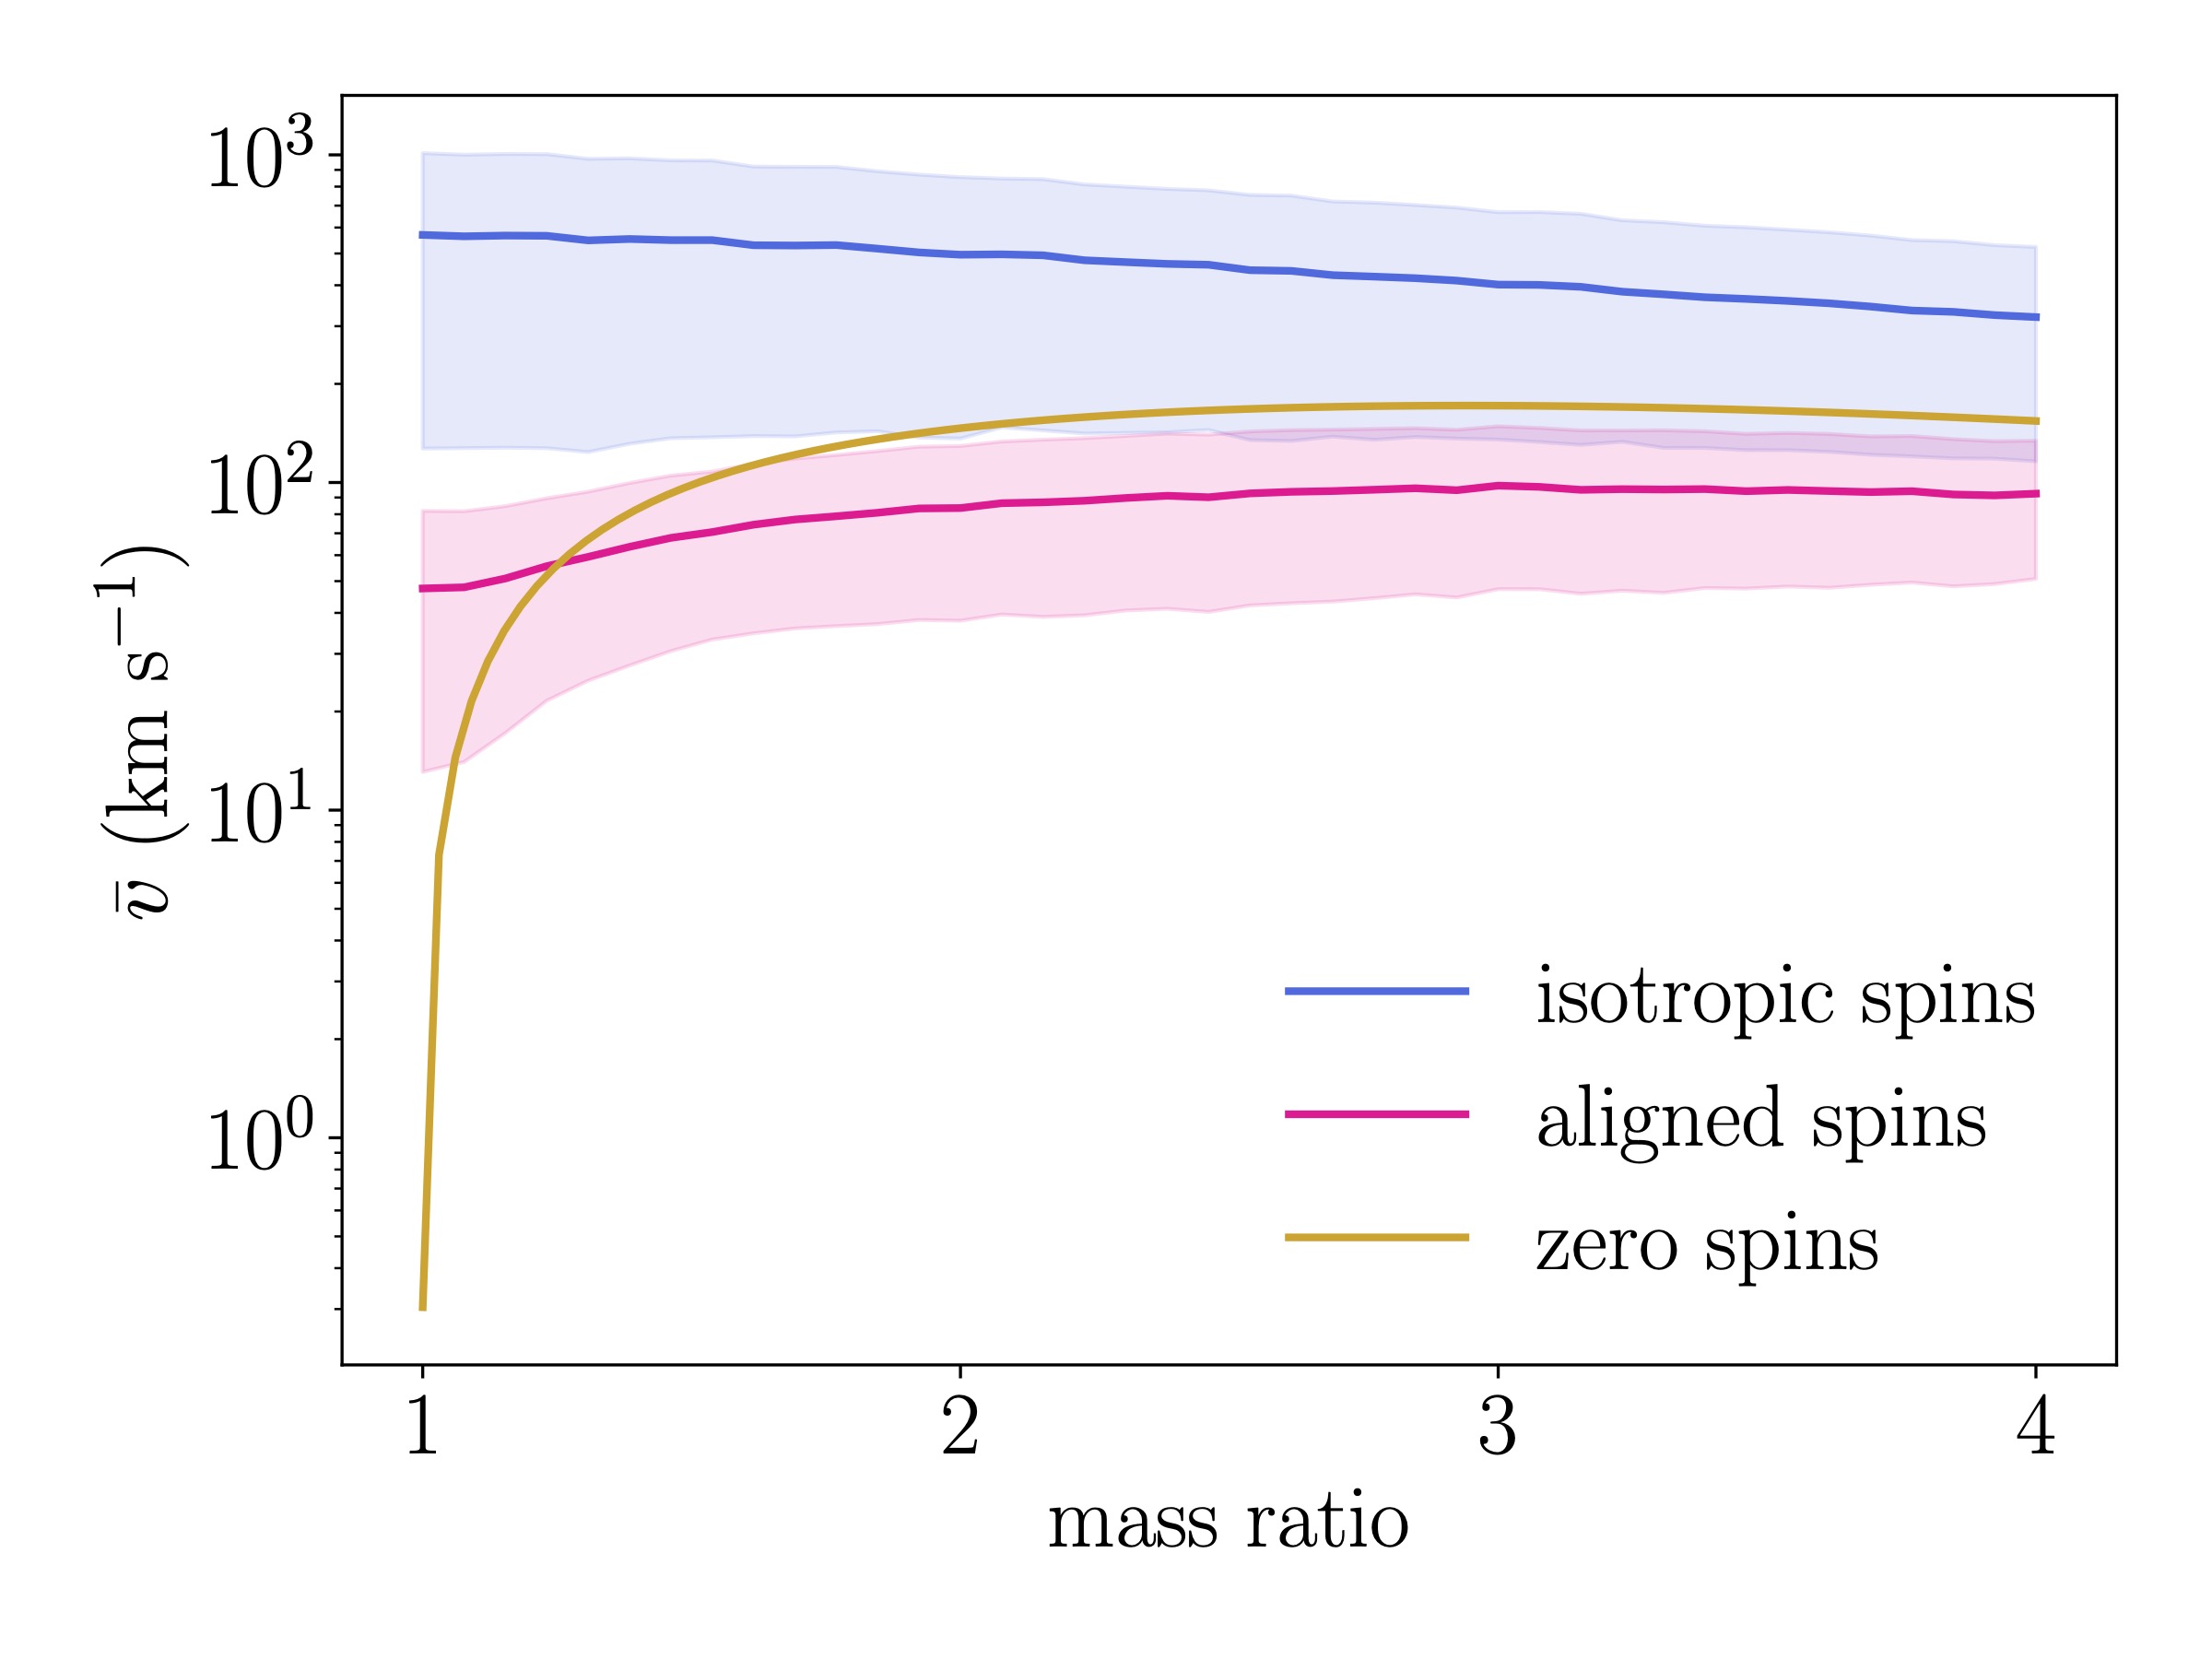
Figure 2: Kick velocity as a function of mass ratio for three types of black hole binaries: ones with random spin directions (blue), ones with spins aligned with the orbital motion (pink), and ones with zero spin (yellow). Each point shows the average from 10,000 simulated binaries, with spin magnitudes up to 0.8. Solid lines show the average kick velocity; shaded regions show the spread. [Borchers et al. 2025]
Spin Distribution of 1G + 1G Mergers
Figure 3 shows the final spin distribution from mergers between two first-generation black holes for different initial spin values. It compares all merger remnants (global population) to those that stay in the cluster (retained population). As expected, the distribution peaks around 0.7 for the global population. However, the peak shifts to higher spin values when only retained remnants are considered.
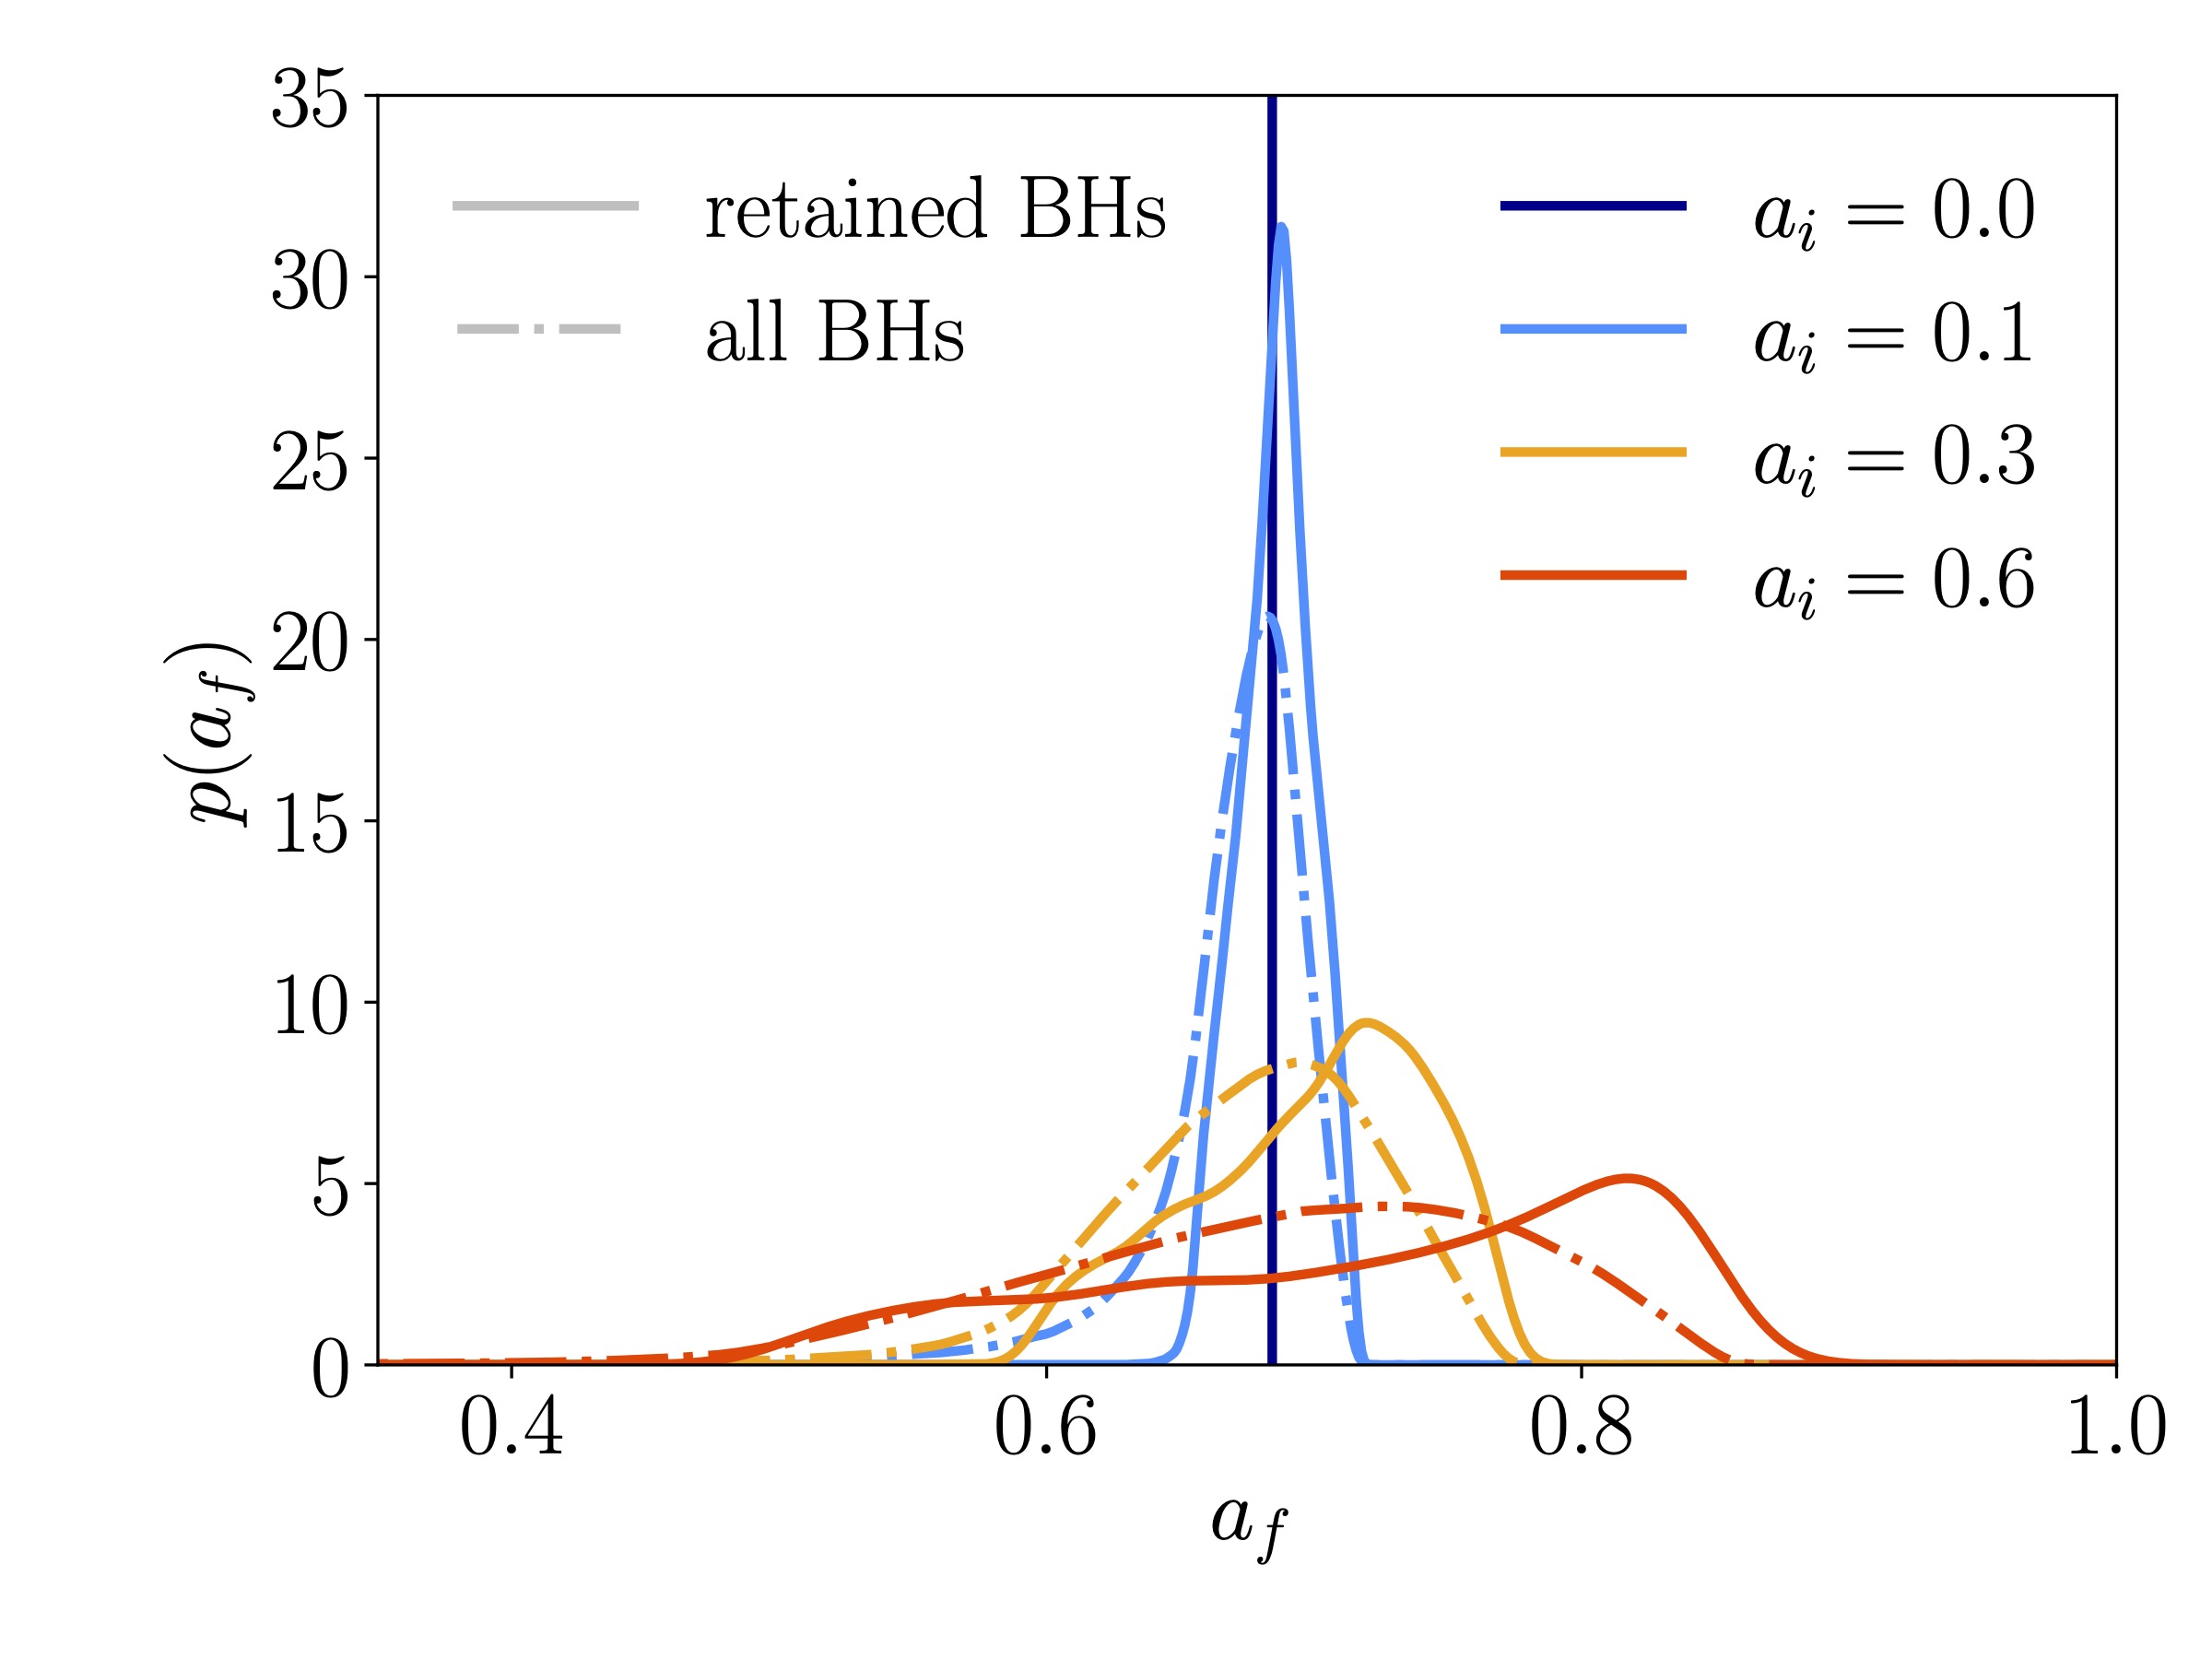
Figure 3: Spin distribution of 1G+1G merger remnants with different initial spin magnitudes and randomly oriented spins. The dashed lines show the distribution for all remnants, while the solid lines show the distribution for those that remain in the cluster. For the ai = 0.0 case, the vertical line is centered at af = 0.69. [Borchers et al. 2025]
The authors also examine the effect of escape velocity on the spin distribution. Higher escape velocities make the distribution more similar to the global population, while lower escape velocities lead to broader distributions with more support at higher and lower spins.
Spin Distributions of Higher-Generation Mergers
Figure 4 shows how the spin distribution changes over several generations of black hole mergers. As more generations pass, the spin distribution of the retained black holes starts to look quite different from the global one. In particular, it spreads out and shows a broader range of spin values.

Figure 4: Final spin distribution for different merger generations. The dashed lines show the distribution for all remnants, while the solid lines show the distribution for those that remain in the cluster. [Adapted from Borchers et al. 2025]
Hierarchical mergers are considered a pathway to forming intermediate-mass black holes, potentially explaining events like GW190521. Current gravitational-wave detectors are observing more and more black hole mergers, and future detectors will measure their spins more precisely. Accounting for the spin distributions of black holes that remain in clusters rather than the universal distribution will help us better understand and measure how hierarchical mergers contribute to the gravitational-wave population.
Original astrobite edited by Ryan White.
Authored by Viviana Cáceres.
The post The Black Hole Tango: Kicks and Spins in Hierarchical Mergers appeared first on AAS Nova.
]]>
In May 2024, the Sun put on a powerful display of solar storms, and researchers have examined the source of all this activity to understand why.
The post Featured Image: Mother’s Day Superstorms appeared first on AAS Nova.
]]>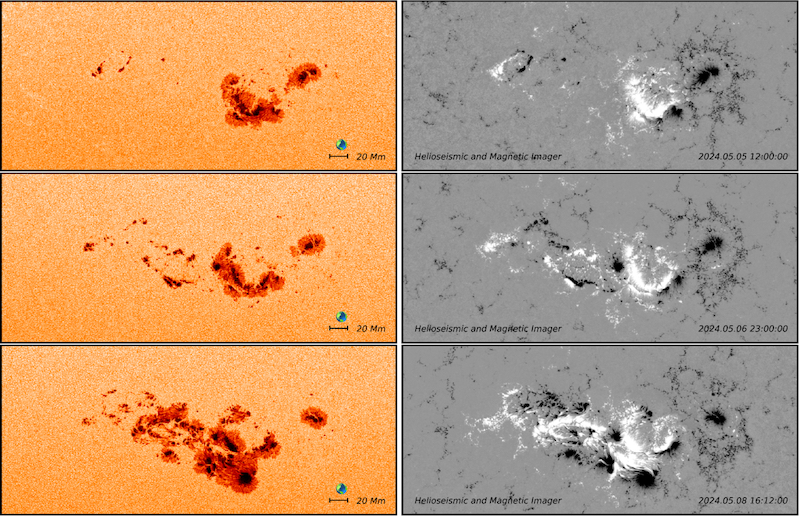
Evolution of a cluster of active regions as seen in continuum emission (left column) and radial magnetic field (right column). Click to enlarge. [Dikpati et al. 2025]
Citation
“Mother’s Day Superstorms: Pre- and Post-Storm Evolutionary Patterns of ARs 13664/8,” Mausumi Dikpati et al 2025 ApJ 988 108. doi:10.3847/1538-4357/addd09
The post Featured Image: Mother’s Day Superstorms appeared first on AAS Nova.
]]>
The dust in protoplanetary disks is subject to complicated dynamical processes that impact planet formation. Recent simulations suggest that dust may be more freely moving within disks with planets than previously thought.
The post Escaping the Dust Trap: Simulations of Dust Dynamics in Protoplanetary Disks appeared first on AAS Nova.
]]>Through detailed simulations of gas and dust, a recent study revealed that the behavior of dust within protoplanetary disks is a bit more complex than previously assumed.
Dust Traps in Protoplanetary Disks
As a planet forms within a protoplanetary disk — dust and gas orbiting a new star — tidal interactions between the budding body and the dusty material surrounding it can create pressure bumps where dust builds up. These dust traps appear as rings in observations of protoplanetary disks.
Dust traps are thought to play a critical role in the disk’s evolution and the early stages of planet formation. Dust traps may prevent solid material from migrating inward, starving the inner disk and impeding planet growth interior to the trap. These reservoirs may also serve as a chemical barrier, keeping volatile materials like water from moving to the inner regions of a disk.
While a perfect dust trap completely isolates material from the rest of the disk, recent observations and 2D simulations have shown that dust traps may be a bit more permeable — leaking smaller sized grains, mixing material, and changing the disk’s appearance. However, these results only account for two dimensions of the complex three-dimensional environment in which dust traps reside. Thus, 3D hydrodynamical simulations are necessary to provide more realistic details of dust dynamics within planet-hosting protoplanetary disks.
Dusty Simulations

Z-axis averaged dust–gas density ratios (top) and dust–gas surface density ratios for the 3D simulations after 1,500 orbits. For the simulations with higher diffusion and lower planet mass, there is clear leaking of dust beyond the dust trap ring (edges marked with dotted red lines). Click to enlarge. [Huang et al 2025]
The simulations showed that the embedded planet will perturb the gas and dust, producing density shocks that create gaps and, subsequently, pressure bumps where dust traps coalesce. From their analysis, the authors found that dust traps become leakier at higher levels of diffusion and when the embedded planet is lower in mass. Essentially, if the gas flows and mixes more efficiently, the perturbations of the planet are erased more quickly, and if the planet is sufficiently small, its ability to disrupt the disk is much weaker. Dust remains coupled to the gas, flowing through these weak traps without becoming stuck. Additionally, the 3D simulations show higher amounts of leakage compared to the 2D simulations, which the authors attributed to the asymmetric and complex vertical geometry of the disk.

Flux-trapping ratio (left) and mass-trapping ratio (right) as a function of time for the 2D (top) and 3D (bottom) simulations. The higher-mass planet in Model A causes more flux and mass-trapping than the lower-mass planets and more turbulent systems. Additionally, the 3D simulations show significantly lower flux and mass-trapping than the 2D simulations. Click to enlarge. [Huang et al 2025]
Implications and Comparison to Observations
What then are the consequences of leaky dust traps? In planet formation theory, dust traps determine the mass at which a planet creates a sufficient pressure bump that isolates small pebbles and dust exterior to its orbit. For perfect dust traps, this isolation of material from the planet and inner disk creates a clear chemical distinction between the inner and outer disk. However, as shown by the 3D simulations, dust traps are imperfect, allowing small particles to filter through; the authors suggest this may mean that the growing planet slows but does not stop the migration of solid materials in a disk.
Recent observations of protoplanetary disks reveal the presence of larger volatiles within the inner disk. Specifically, the disk PDS 70 shows water emission in its inner disk despite having two confirmed giant planets orbiting in the outer disk. Without leaky dust traps, volatiles like water would be trapped in the pressure bumps created by these planets. However, as the authors have shown, the complex reality of dust dynamics within protoplanetary disks allows heavier elements to leak through, enriching the inner disk. Further observations and detailed 3D simulations will allow astronomers to understand the extent of leaky dust traps and reveal the realistic conditions driving early planet formation.
Citation
“Leaky Dust Traps in Planet-Embedded Protoplanetary Disks,” Pinghui Huang et al 2025 ApJ 988 94. doi:10.3847/1538-4357/addd1f
The post Escaping the Dust Trap: Simulations of Dust Dynamics in Protoplanetary Disks appeared first on AAS Nova.
]]>
Finally found: using speckle imaging, researchers have spotted what is likely the predicted 1.6-solar-mass companion to the red supergiant Betelgeuse.
The post Betelgeuse’s Companion Star May Have Been Seen at Last appeared first on AAS Nova.
]]>Astronomers may have directly imaged a companion star to the famous red supergiant Betelgeuse at last. Though the tentative detection only loosely constrains the star’s physical properties, it appears to be a 1.6-solar-mass pre-main-sequence star. The discoverers suggest the name Siwarha, Arabic for “Her Bracelet,” given that the star circles Betelgeuse, “Hand of the Giant.”
Betelgeuse in the Spotlight

A photograph of the constellation Orion. Betelgeuse is the bright yellow star located left of center. [E. Slawik/NOIRLab/NSF/AURA/M. Zamani; CC BY 4.0]
Betelgeuse is a variable star. On top of its well-constrained 400-day pulsation period, the star has exhibited two behaviors that have drawn interest in recent years: a deep, prolonged dimming episode in 2019–2022 that is thought to be due to an immense ejection of mass from the star’s surface, and a 6-year variation in the star’s photometry, astrometry, and radial velocity.
Multiple studies have attributed the 6-year variability to one or more companion stars. In general, these studies predict that the companion star circles Betelgeuse on a tight, 6-year, nearly edge-on orbit. As reported in a new article published in the Astrophysical Journal Letters, observations have likely proved these predictions correct.
Speckle Detection
Steve Howell (NASA Ames Research Center) and collaborators searched for Betelgeuse’s predicted companion star using the 8.1-meter Gemini North telescope. The team used the ‘Alopeke instrument in speckle imaging mode, which involves taking thousands of milliseconds-long snapshots to avoid smearing due to atmospheric fluctuations.
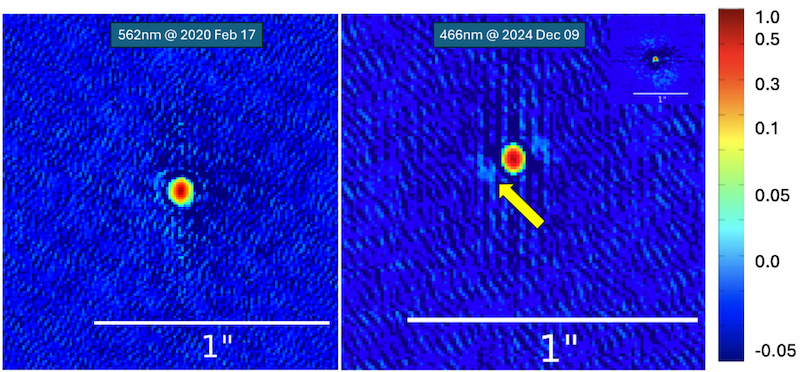
Observations of Betelgeuse from 2020 (left) and 2024 (right). An arrow points to the companion. Note that the image processing introduces a 180º ambiguity in the location of the companion, which is resolved by analyzing phase information. [Howell et al. 2025]
More to Learn
Howell and coauthors performed additional analyses to rule out interference from hot pixels, cosmic rays, or atmospheric diffraction. They also considered that the star could lie in the background or foreground, but they found both possibilities unlikely. After further calculations, the team estimated that the companion is six magnitudes fainter than Betelgeuse and separated by just 52 milliarcseconds at an angle of 115º. These quantities agree well with predictions for the companion’s position.

The on-sky proper motion of Betelgeuse from 2020 to 20204. The companion is shown as the small black circle. This shows that if the companion star were actually a background star, it would have been plainly visible in the 2020 observations. [Howell et al. 2025]
The team closed with a call to the community to turn their instruments toward Betelgeuse on 26 November 2027, when the companion will once again be at its greatest angular separation. Our exploration of this long-sought-after star has just begun!
Citation
“Probable Direct Imaging Discovery of the Stellar Companion to Betelgeuse,” Steve B. Howell et al 2025 ApJL 988 L47. doi:10.3847/2041-8213/adeaaf
The post Betelgeuse’s Companion Star May Have Been Seen at Last appeared first on AAS Nova.
]]>
Astrobites reports on very deep JWST observations and the hunt for the first galaxies in the universe.
The post A GLIMPSE of the First Galaxies? appeared first on AAS Nova.
]]>Editor’s Note: Astrobites is a graduate-student-run organization that digests astrophysical literature for undergraduate students. As part of the partnership between the AAS and astrobites, we occasionally repost astrobites content here at AAS Nova. We hope you enjoy this post from astrobites; the original can be viewed at astrobites.org.
Title: A Glimpse of the New Redshift Frontier Through Abell S1063
Authors: Vasily Kokorev et al.
First Author’s Institution: The University of Texas at Austin
Status: Published in ApJL
JWST has opened up a new era of early universe astronomy. Of particular interest is the hunt for the first galaxies, which are thought to have formed just a couple hundred million years after the Big Bang. But finding these early galaxies has proved to be somewhat of a challenge. While there have been many bright galaxies discovered by JWST at a redshift (z) greater than 10, no galaxies at z > 15 have been confirmed to date. Today’s article goes hunting for these very high-redshift galaxies in the GLIMPSE field, which is home to the strong lensing cluster Abell S1063, shown in Figure 1.

Figure 1: JWST image of the field used for this study. [Kokorev et al. 2025]
Step 1: Cut Galaxies by Color
Cutting galaxies by color involves finding the Lyman break. High-energy light is absorbed by neutral hydrogen in the galaxy and in the space between the galaxy and us. Thus, when you look at a galaxy’s spectral energy distribution, there is a drop-off at short wavelengths called a “break.” For distant galaxies, the location of this drop-off gets redshifted, allowing for an estimation of a galaxy’s distance. By comparing how bright sources are between two filters that are adjacent in wavelength, we can look for steep drop-offs that are caused by the Lyman break. Figure 2 shows a color–color plot (showing the difference in brightness between different filters), where the dashed line shows the region galaxies must be in to be considered Lyman-break galaxies at these high redshifts. In the whole field, the authors detect 38 objects in this region.
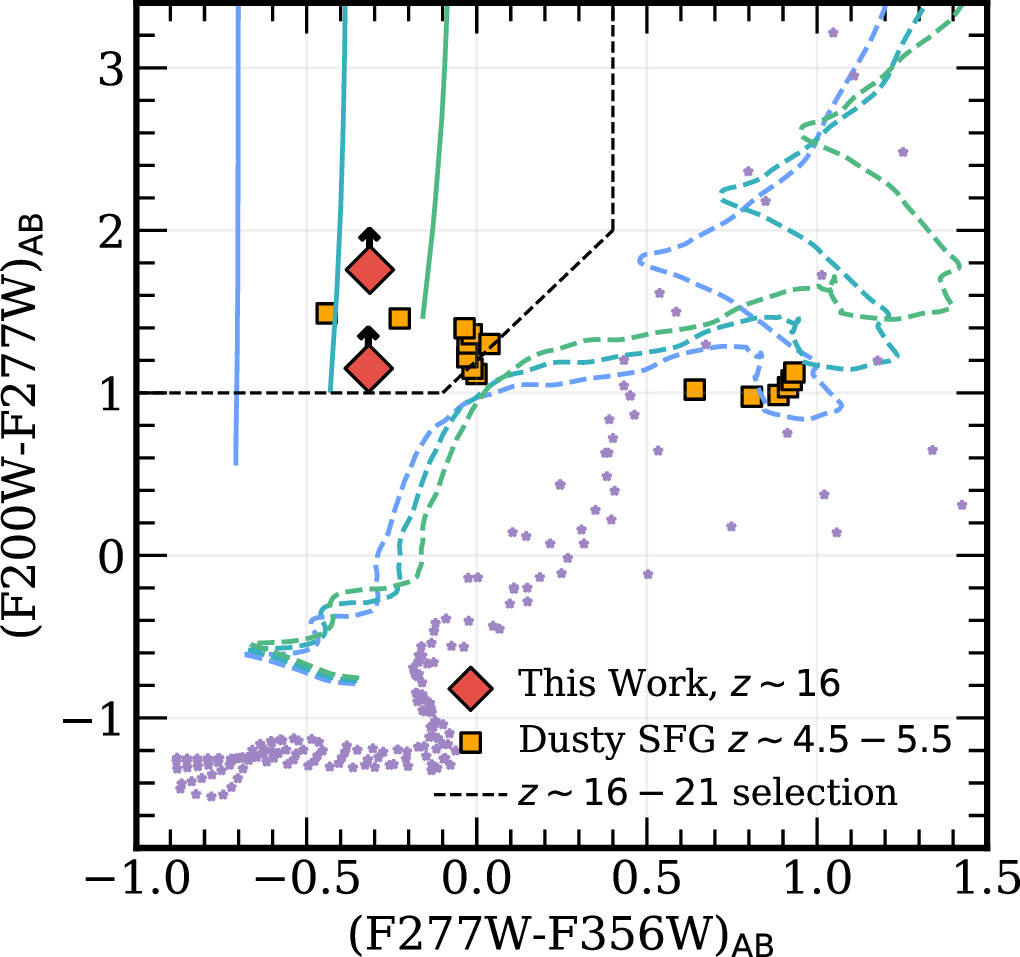
Figure 2: Color–color plot showing the selection criteria for high-redshift galaxies due to Lyman break. The upper-left region enclosed by the black dashed line represents the region that satisfies the high-redshift criteria. The various lines show properties of different populations. Solid are potential tracks for starburst galaxies at z = 16, dashed are lower-redshift quiescent galaxies, and dotted are cool stars and brown dwarfs, which can look like high-redshift galaxies in some situations. The two red diamonds show the final two high-redshift candidates in this work. [Kokorev et al. 2025]
Step 2: Calculate Redshift
However, this isn’t the end of the story. Color isn’t the only way to estimate distances to galaxies, as we can also use photometric fitting codes. These codes compare observations to templates of what we would expect galaxies to look like at different redshifts and see which templates fit best. This allows for an estimation of the redshift of each source identified in the field. All sources that the photometric fitting codes thought were at z > 16 were cross-referenced against the 38 color-identified objects, which narrowed the list to eight high-redshift candidates.
Step 3: Hunt for Imposters
But wait, there’s more! Both of these methods (looking at colors and calculating redshift photometrically) are susceptible to false positives. Lower-redshift galaxies, particularly star-forming dusty galaxies, can look just like high-redshift sources. This is apparent in Figure 2, where z ~ 4.5–5.5 dusty galaxies can also be found in the color-selected Lyman-break region. Thus, we need to explore the possibility that the sources might not be at high redshift at all. In this article, the authors do this by fitting their eight sources with a lower-redshift dusty starburst template, finding only five galaxies that match the high-redshift template better than the starburst template.
Step 4: Keep Significant Detections
The authors make one final cut to the last five sources, only keeping those that aren’t at the edges of the observation and thus have strong signals, where they can be confident we’re actually detecting something and it’s not just a hot pixel or noise. So, after all of that, they are left with only two z > 16 candidates in this field.
Figure 3 shows the images and spectral energy distributions of each of these candidates, given the wonderfully poetic names of 70467 and 72839. While there is still a lot to learn about these candidates, with the JWST data presented in this article we can uncover some things about the galaxy properties. Both sources appear to be compact, but still resolved, with effective radii of roughly 650 light-years. These observations can also tell us about the ultraviolet brightness of the two candidates, finding that they are most likely dominated by extended stellar emission, as opposed to active galactic nucleus activity. In general, these galaxy candidates are not very ultraviolet-bright, which is somewhat surprising, as JWST has found many bright galaxies at z ~ 12–14. However, it is not out of the question that galaxies at this slightly earlier epoch are just fainter than we expected, and then formed stars and increased in brightness relatively quickly.

Figure 3: Cutouts and spectral energy distributions for the two high-redshift candidates in this work. Squares show images in nine JWST filters, as well as an image of several filters combined, with a cutout width of 1.5″. Spectral energy distribution plots show different template galaxies for high-redshift (orange and red) and low-redshift dusty star-forming galaxy interlopers (blue and green). You can see how these sources are only strongly detected in a few filters, with many detections being just upper limits. [Kokorev et al. 2025]
Original astrobite edited by Bill Smith.
About the author, Skylar Grayson:
Skylar Grayson is an Astrophysics PhD Candidate and NSF Graduate Research Fellow at Arizona State University. Her primary research focuses on AGN feedback processes in cosmological simulations. She also works in astronomy education research, studying online learners in both undergraduate and free-choice environments. In her free time, Skylar keeps herself busy doing science communication on social media, playing drums and guitar, and crocheting!
The post A GLIMPSE of the First Galaxies? appeared first on AAS Nova.
]]>
What's responsible for the haphazard orbits of the stars closest to our galaxy's supermassive black hole? A second black hole, perhaps.
The post How a Black Hole Collision Could Explain the Milky Way’s S-Stars appeared first on AAS Nova.
]]>New research shows that a past collision between the Milky Way’s central black hole and a smaller black hole could explain the dynamics of the S-stars, a group of stars that orbit precariously close to our galaxy’s supermassive black hole.
Journey to the Center of the Milky Way
The center of the Milky Way harbors a supermassive black hole (Sagittarius A* or Sgr A*) with a mass of 4 million Suns. The nearest neighbors of this behemoth are a compact disk of massive young stars and a collection of stars called the S-stars, which inhabit the innermost 48 light-days of our galaxy.
While the stars in the disk are orderly, arranged on orbits with moderate eccentricities and low inclinations, the S-stars orbit Sgr A* every which way, careening around the black hole with a wide range of eccentricities and inclinations. So far, the cause of this unusual distribution of stars is unknown.
When Black Holes Collide
Past research has struggled to explain the S-stars’ orbits. A successful theory of S-star origins must account for the stars’ eccentric orbits (e = 0.61, on average) and high orbital inclinations (i = 79º, on average), and it must produce these characteristics within the 15-million-year lifetime of the stars.

Schematic showing the proposed formation pathway for the Milky Way’s S-star population. Click to enlarge. [Akiba et al. 2025]
The premise is not far-fetched: at the ripe old age of nearly 14 billion years, the Milky Way has likely gulped down neighboring dwarf galaxies and globular clusters multiple times. When a black hole embedded within one of these meals of stars and gas merges with the Milky Way’s central black hole, the collision causes Sgr A* to recoil — potentially rearranging the stars in its vicinity in the process.
Radical Reorganization
Akiba and collaborators used N-body simulations to explore the outcomes of such a collision. In their simulations, Sgr A* is situated within an axisymmetric disk of stars or gas. A smaller black hole falls toward Sgr A*, spirals inward, and merges with the larger black hole. The asymmetric emission of gravitational waves causes Sgr A* to recoil, warping the surrounding collection of stars and gas into an eccentric disk. For the eccentricity of the disk to match what is seen in the disk of stars surrounding Sgr A* today, the incoming black hole must have a mass of roughly 200,000 solar masses.
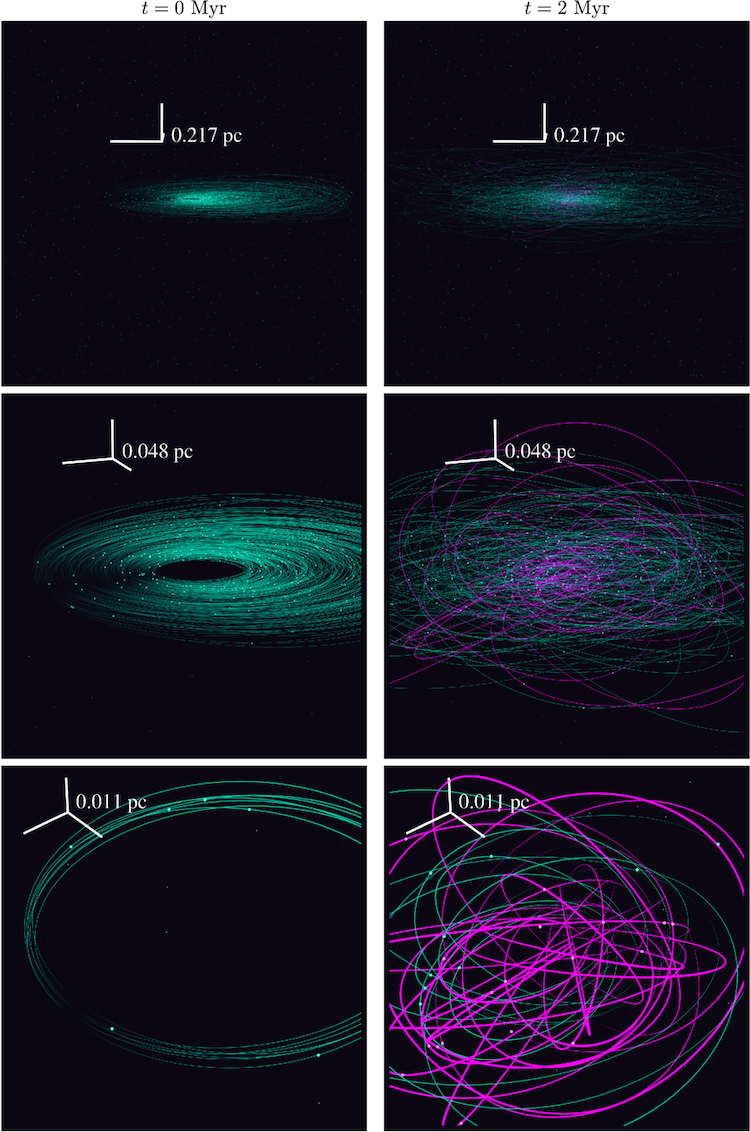
Simulation snapshots taken at the simulation onset (left column) and after 2 million years (right column). Orbits with inclination greater than 30 degrees are shown in magenta. Note the difference in scale between the rows. [Akiba et al. 2025]
While the properties of the modeled S-stars don’t exactly match the properties of the real deal — the simulated stars have, on average, lower inclinations and eccentricities — the authors noted that this work represents a first foray into their hypothesis. Modeling that explores a broader range of parameter space is needed to fully understand the origins of the stars at the center of the Milky Way.
Citation
“On the Formation of S Stars from a Recent Massive Black Hole Merger in the Galactic Center,” Tatsuya Akiba et al 2025 ApJL 987 L27. doi:10.3847/2041-8213/addc5d
The post How a Black Hole Collision Could Explain the Milky Way’s S-Stars appeared first on AAS Nova.
]]>
Astrobites reports on the origins of the unusual green structure surrounding the active galaxy NGC 5972.
The post Written in the Gas: Jet Feedback in a Voorwerp Galaxy appeared first on AAS Nova.
]]>Editor’s Note: Astrobites is a graduate-student-run organization that digests astrophysical literature for undergraduate students. As part of the partnership between the AAS and astrobites, we occasionally repost astrobites content here at AAS Nova. We hope you enjoy this post from astrobites; the original can be viewed at astrobites.org.
Title: Jet-Mode Feedback in NGC 5972: Insights from Resolved MUSE, GMRT, and VLA Observations
Authors: Arshi Ali et al.
First Author’s Institution: Savitribai Phule Pune University
Status: Published in ApJ
Voorwerp Galaxies as Laboratories for Active Galactic Nuclei
Supermassive black holes are believed to reside at the centers of nearly all massive galaxies. As supermassive black holes accrete matter, they can release enormous amounts of energy in the form of radiation, winds, and relativistic jets — powering active galactic nuclei and influencing their host galaxies. This process, known as active galactic nucleus feedback, can regulate star formation and the properties of the gas in the interstellar medium, making it a key mechanism for shaping how galaxies form and evolve over cosmic time.
Of the many diverse manifestations of active galactic nuclei, radio “loud” galaxies stand out as powerful laboratories for studying feedback in action. Not only do these galaxies have characteristic [O III] emission lines, but they also host intense radio-emitting lobes of gas that extend well beyond the structure of the galaxy, indicative of jets. (Today’s article refers to these lobes as the extended emission-line region or EELR.)
Originally discovered by a schoolteacher, Voorwerp galaxies are a special category of radio galaxies that are candidate sites of active galactic nucleus activity in terms of their emission-line signatures. Moreover, they exhibit intriguing clouds of ionized gas that may have originated from jets. Figure 1 shows some examples of Voorwerp galaxies. Exploring these galaxies can shed light on how jets interact with the interstellar medium, a major player in active galactic nucleus feedback.

Figure 1: Voorwerp galaxies are compelling laboratories for exploring the interaction between jets and the interstellar medium. Examples are Hanny’s Voorwerp (left), NGC 5972 (middle), and the Teacup Quasar (right). [NASA, ESA, W. Keel (University of Alabama), and the Galaxy Zoo Team; NASA, ESA, and W. Keel (University of Alabama, Tuscaloosa); NASA, ESA, and W. Keel (University of Alabama, Tuscaloosa)]
Evidence for Relativistic Jets in NGC 5972
To study the interstellar medium of the Voorwerp galaxy, the authors combined observations from multiple instruments that probe different phases of the galaxy’s gas. Specifically, they used data from the Very Large Telescope (VLT), the Giant Metrewave Radio Telescope (GMRT), and the Very Large Array (VLA) to create maps of the ionized gas emission, allowing them to trace the structures and movement of the gas and jet material. Together, these datasets offer a comprehensive, multi-wavelength view of how the radio jet shaped the surrounding interstellar medium. The maps of NGC 5972, shown in Figure 2, display an impressive spiraling structure that could be the result of prolonged active galactic nucleus activity.
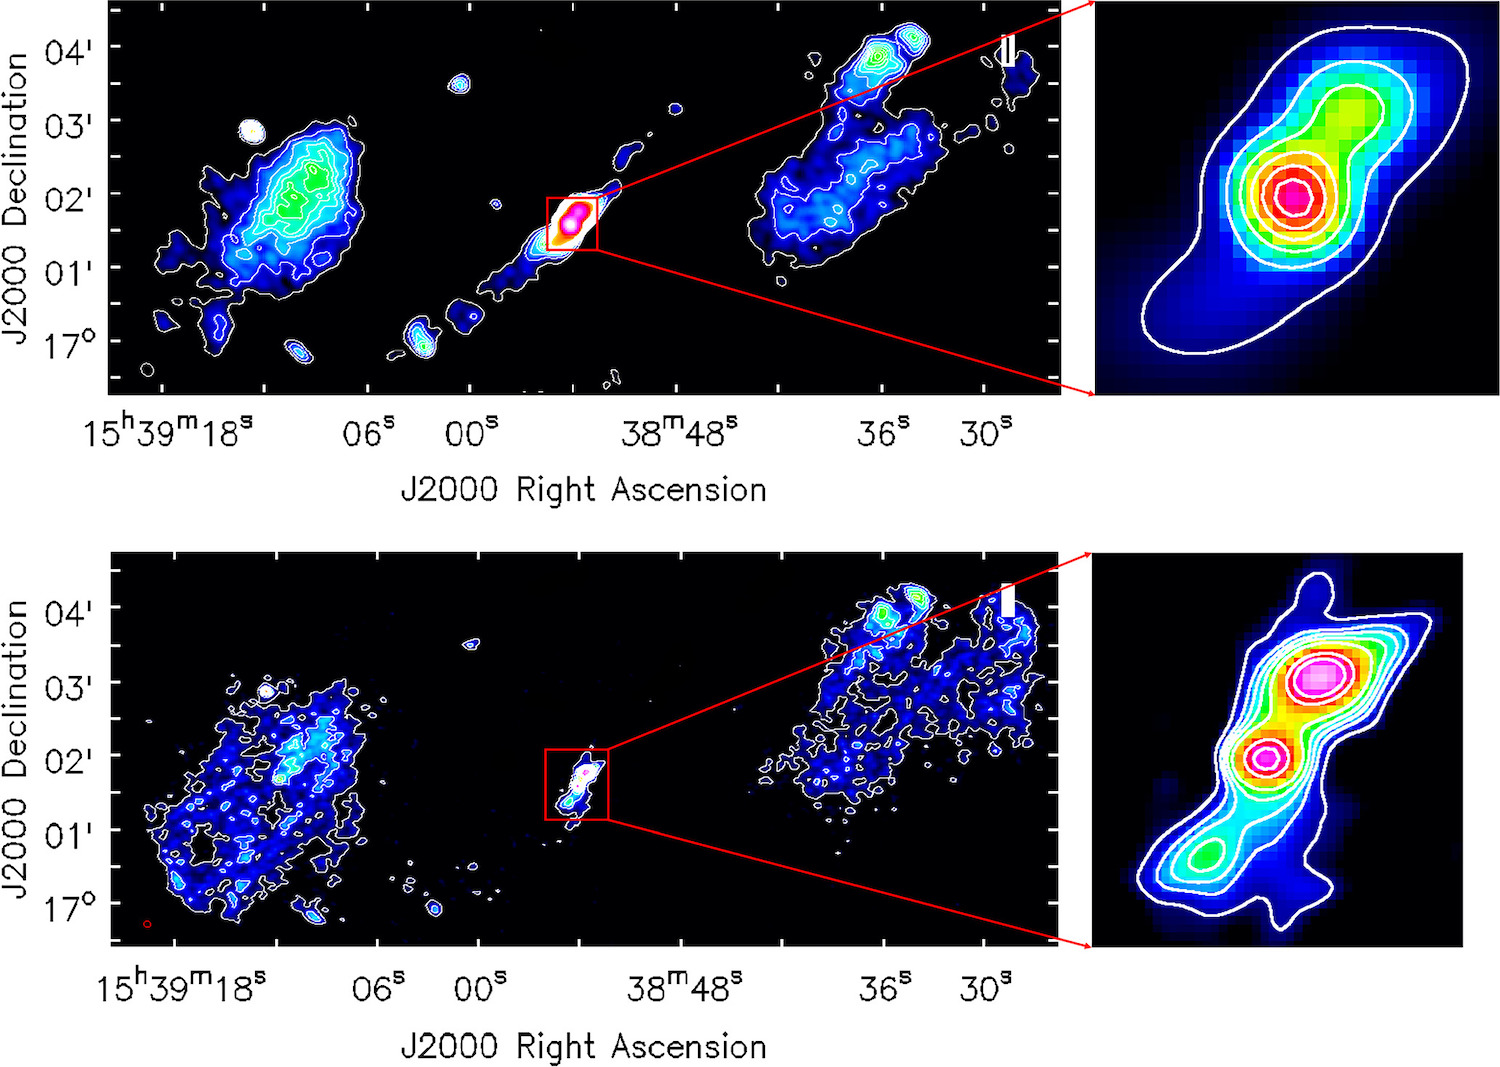
Figure 2: The radio emission of NGC 5972 reveals the extended helical, spiral structure of the ionized gas, where the inner jets are connected to the outer lobes (top: VLA, bottom: GMRT). This suggests that the intriguing shape of NGC 5972 could have originated from active galactic nucleus jets. [Ali et al. 2025]
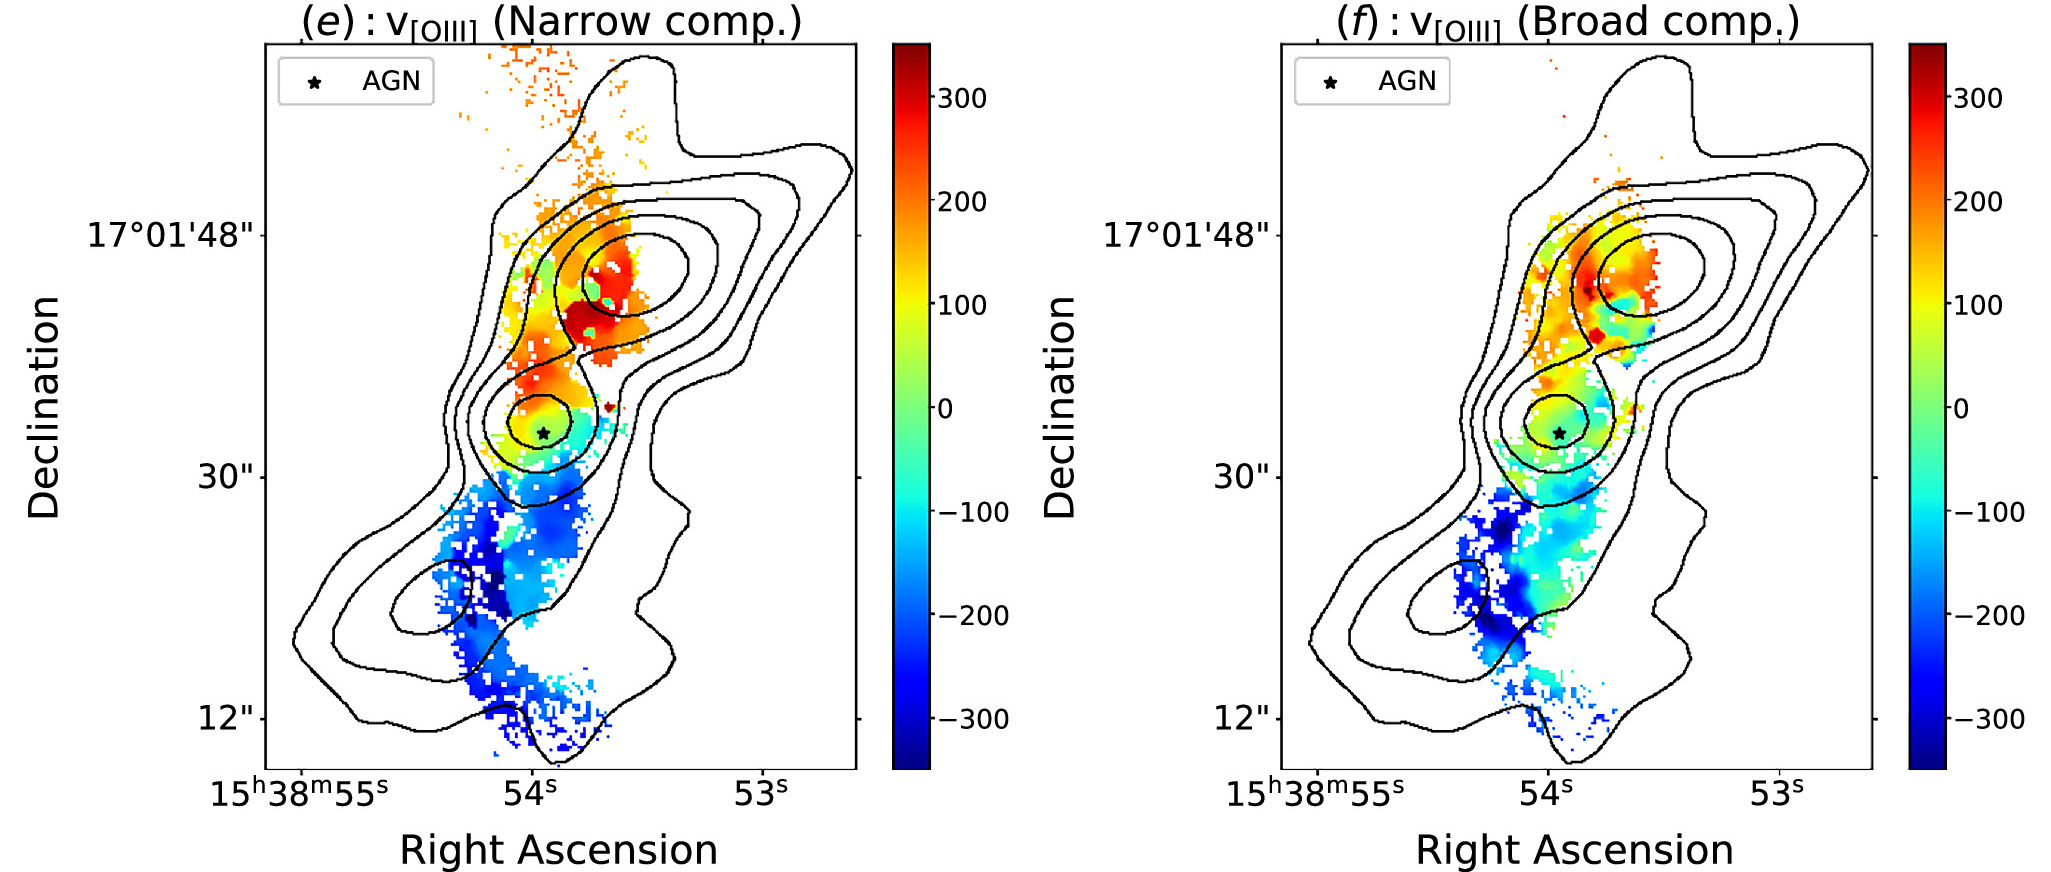
Figure 3: The velocity profiles of NGC 5972’s [O III] emission lines, a characteristic signature of the active galactic nucleus’s extended emission-line region. The velocities are aligned and enhanced along the jet axis, indicating that active galactic nucleus feedback influenced the gas by powering jets and outflows. [Adapted from Ali et al. 2025]

Figure 4: The left panel shows the ionizing sources of the gas in NGC 5972. While the gas along the jet axis is ionized by radiation from the active galactic nucleus (orange in the diagram), the regions transverse to the jet are ionized by shock waves (blue). Moreover, the gas in the jet regions is more turbulent, as shown in the right panel. [Adapted from Ali et al. 2025]
Putting the Story of NGC 5972 Together
These findings suggest that jet-driven feedback plays a crucial role in shaping the extended emission-line region of NGC 5972 (see Figure 5 for a summary). The interaction between the radio jet and the surrounding gas not only sustains ionization but also influences the gas structure. To further unravel the jet’s impact, future high-resolution radio observations will be essential, providing deeper insights into how active galactic nucleus–driven jets function.
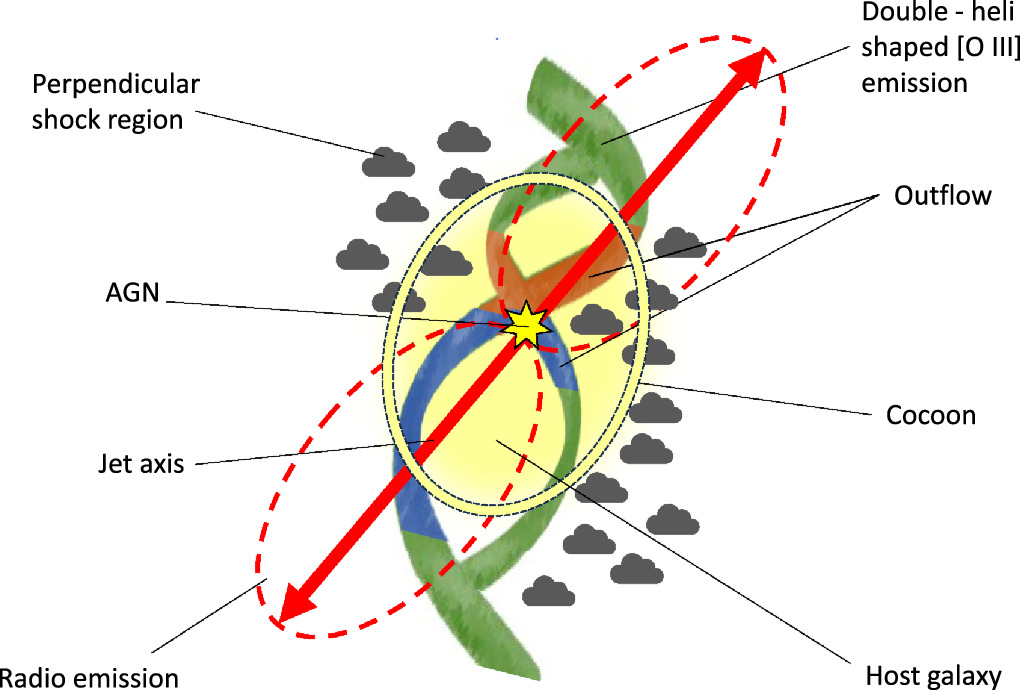
Figure 5: Cartoon schematic diagram showing various mechanisms at play in NGC 5972, including the active galactic nucleus jets, shocks, and outflows. [Ali et al. 2025]
Original astrobite edited by Alexandra Masegian.
About the author, Shalini Kurinchi-Vendhan:
After studying astrophysics and literature at Caltech, I moved onto a Fulbright Fellowship in Heidelberg, Germany. I’m passionate about using computer simulations to explore supermassive black holes and galaxy evolution—but I also love poetry and traveling.
The post Written in the Gas: Jet Feedback in a Voorwerp Galaxy appeared first on AAS Nova.
]]>
One of the first-look images from the Vera C. Rubin Observatory contained a rare find: a candidate circumstellar or protoplanetary disk in a region where few such disks have been discovered.
The post Astronomers Spot Possible Disk in Rubin Observatory First-Look Image appeared first on AAS Nova.
]]>Editor’s Note: Shortly after the publication of this article, we became aware that the disk described in this work was previously discovered by Wei-Hao Wang, as reported in the Astronomer’s Telegram in July 2024.
On 23 June 2025, the public got its first look at images from the NSF–DOE Vera C. Rubin Observatory — and the discoveries are already starting to roll in.
Trifid and Lagoon
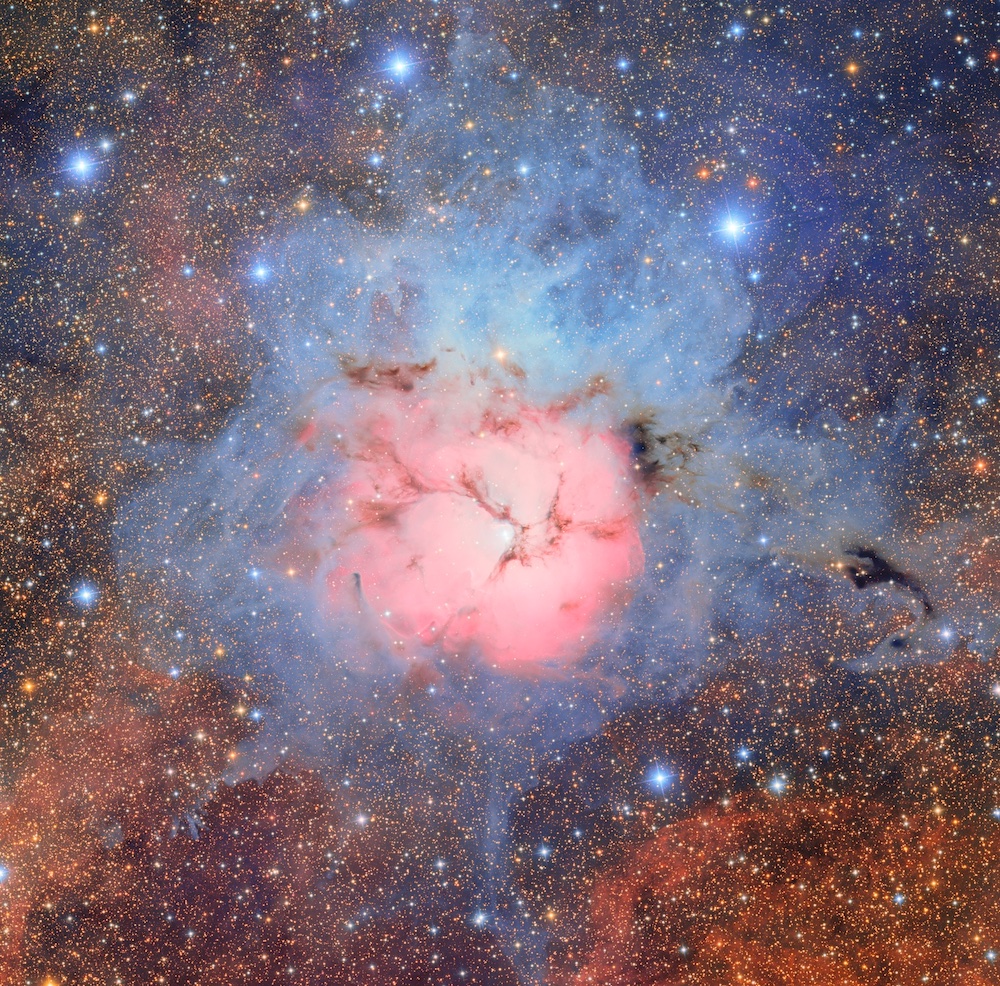
A closeup of the Trifid Nebula from one of the Rubin Observatory first-look images. [Adapted from NSF–DOE Vera C. Rubin Observatory; CC BY 4.0]
The Trifid and Lagoon nebulae are both HII regions, making them ideal places to search for circumstellar and protoplanetary disks, as well as proplyds — protoplanetary disks that are in the process of being evaporated by the intense radiation from nearby massive stars. The glowing gas of an HII region provides the background illumination needed to pick out the silhouettes of dark and dusty disks.
The Trifid Nebula disk candidate identified in this work. [Adapted from Zamani & Rector 2025]
Disk Detected
Published today in the Research Notes of the AAS, Mahdi Zamani (Zamani Scientific Visualizations & Imaging) and Travis Rector (University of Alaska Anchorage) reported the results of their search for proplyds in the Rubin image of the Trifid and Lagoon nebulae. The team detected one candidate circumstellar or protoplanetary disk on the edge of the Trifid Nebula, surrounded by tenuous, filamentary clouds of gas and dust.
The Rubin data don’t show evidence for ionized gas surrounding the disk, so it’s not yet clear if the object should be classified as a proplyd. The disk has a projected distance of 7.5 light-years from HD 164492A, the O-type star whose intense radiation is responsible for energizing the surrounding nebula, and may also be capable of ionizing the disk studied here.
Disk Detected
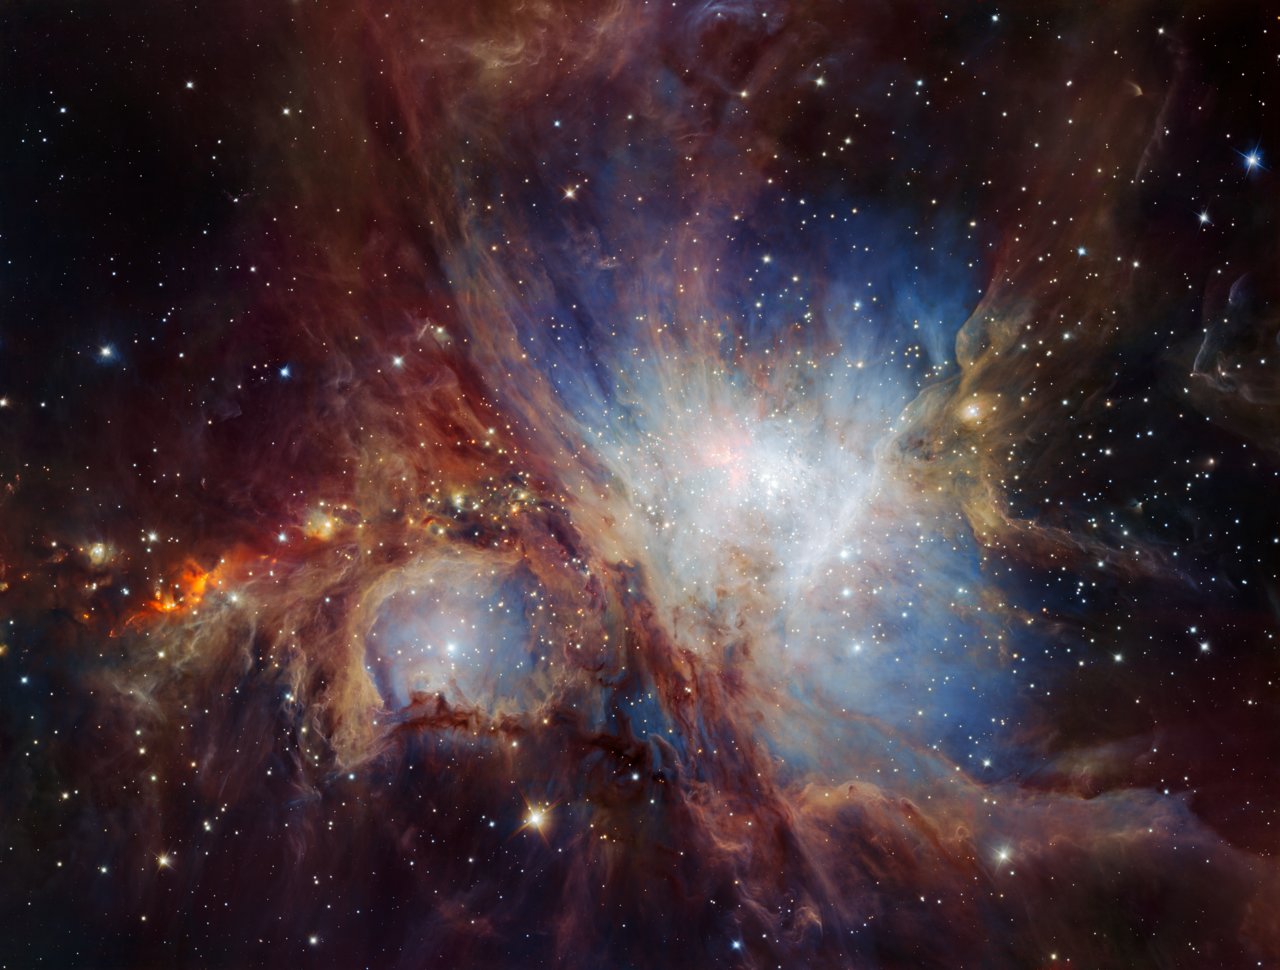
The Orion molecular cloud complex is among the most active star-forming regions in the Milky Way, home to hundreds of protostars and thousands of pre-main-sequence stars. [ESO/H. Drass et al.; CC BY 4.0]
Researchers have searched the Trifid Nebula previously for signs of protoplanetary disks, but while those searches found evidence for disks around hot stars near the center of the cluster, this particular disk candidate went undetected. Previous searches likely didn’t cover a large enough area of the nebula, or perhaps lacked the resolution needed to differentiate between the dusty disk and the nearby filamentary gas clouds. With Rubin’s broad field of view and precise resolution, the observatory was well-positioned to spot this disk candidate.
Citation
“The Potential Discovery of a Circumstellar Disk in M20 from Rubin First Look,” Mahdi Zamani and T. A. Rector 2025 Res. Notes AAS 9 172. doi:10.3847/2515-5172/ade982
The post Astronomers Spot Possible Disk in Rubin Observatory First-Look Image appeared first on AAS Nova.
]]>
A search for oddities in archival JWST data has turned up something remarkable: a rare pair of collisional ring galaxies that may have birthed a supermassive black hole during their clash.
The post A Candidate Direct-Collapse Black Hole in the Infinity Galaxy appeared first on AAS Nova.
]]>Researchers have discovered a rare ring-galaxy duo that appears to harbor a supermassive black hole formed through direct collapse — a process similar to what may have jump-started the growth of the first supermassive black holes in the universe.
Searching for Oddballs
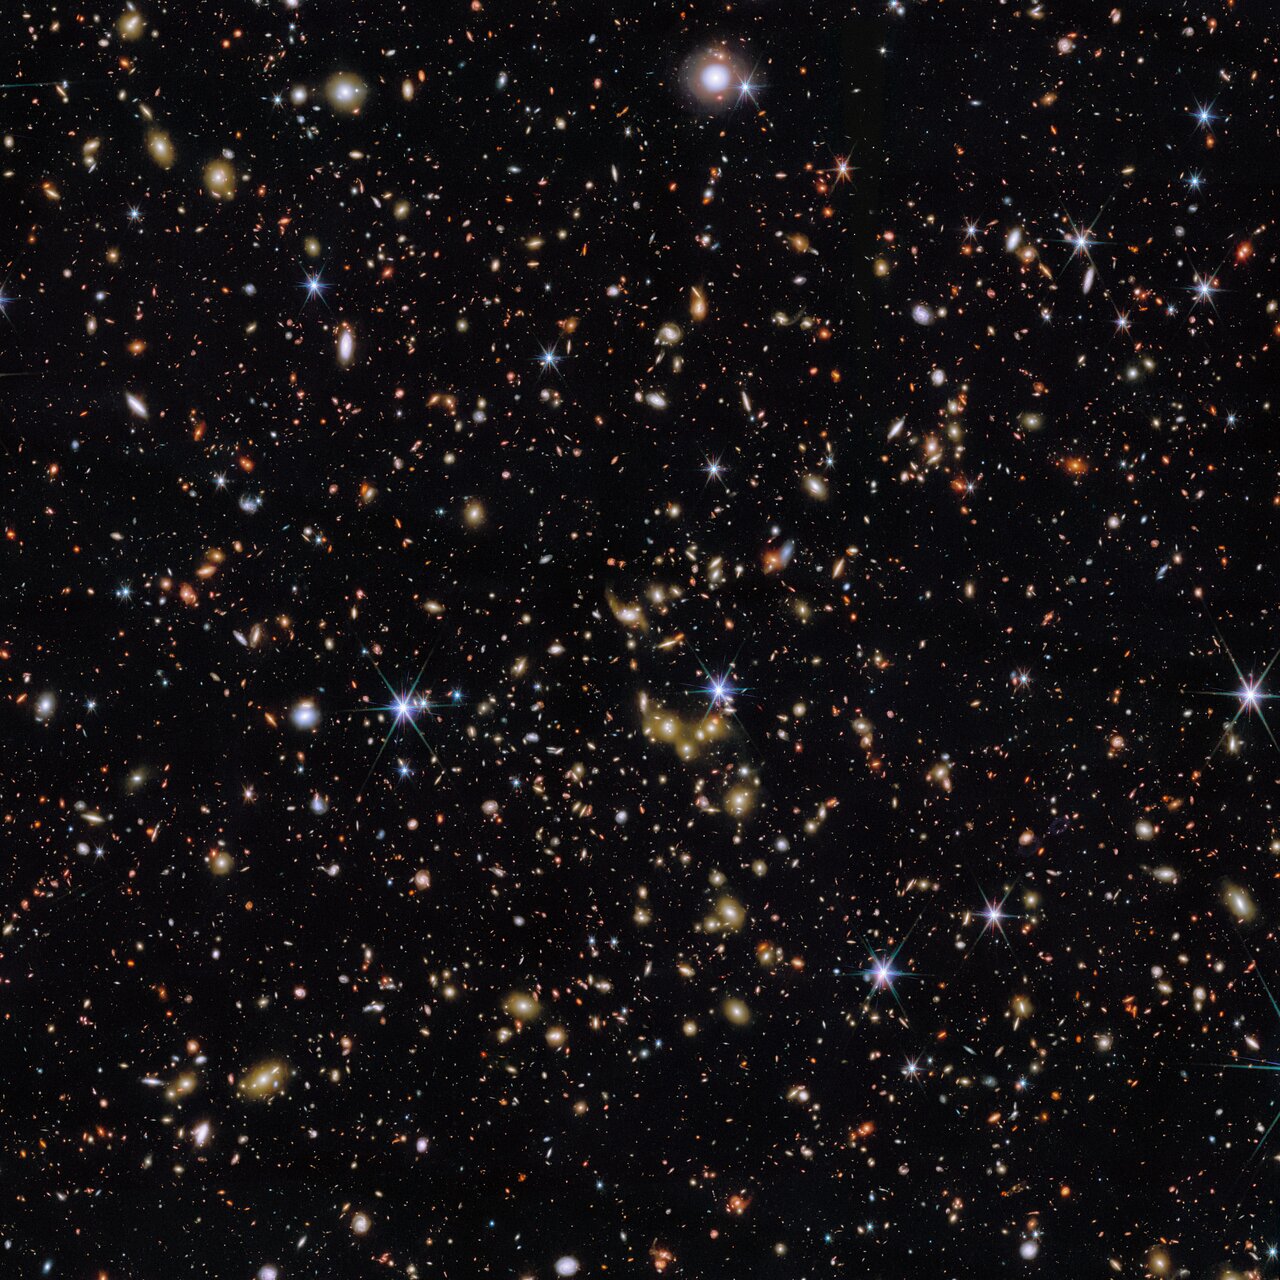
A portion of the COSMOS-Web field. [ESA/Webb, NASA & CSA, G. Gozaliasl, A. Koekemoer, M. Franco, and the COSMOS-Web team; CC BY 4.0]
Van Dokkum and coauthors searched for interesting objects in publicly available images from COSMOS-Web, a JWST program dedicated to understanding how galaxies have evolved over the course of cosmic history. Having already published their discovery of a complete Einstein ring in the COSMOS-Web field, the team is now revealing a second finding: a galaxy featuring two bright, compact nuclei, two starry rings, and an unexpected inhabitant right in the center.
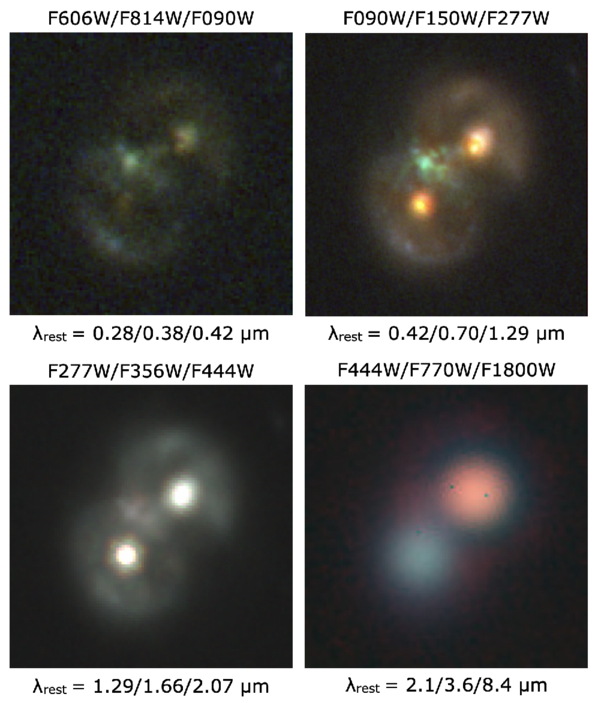
Four views of the Infinity Galaxy from Hubble and JWST. [van Dokkum et al. 2025]
Gathering Data
To learn more about this strange object, named the Infinity Galaxy for its resemblance to the infinity symbol, the team gathered data from the Hubble Space Telescope, the Keck I telescope, the Chandra X-ray Observatory, and the Very Large Array. The resulting multiwavelength portrait allowed the team to weigh the two nuclei, showing them to be massive — containing 80 billion and 180 billion solar masses of stars — and extremely compact. The new data also revealed that the cloud of gas between the nuclei contains a 1-million-solar-mass black hole.
The nuclei, the rings, and the gas between them appear to be the result of two disk galaxies that shot through one another, forming a pair of collisional ring galaxies. To achieve the infinity-symbol shape, the galaxies must have met one another face on, forming two parallel nucleus–ring systems that we see from an angle of about 40º. As the galaxies collided, some of their gas would have been torn away, left tangled together in the void between the two nuclei.
To the Infinity Galaxy and Beyond
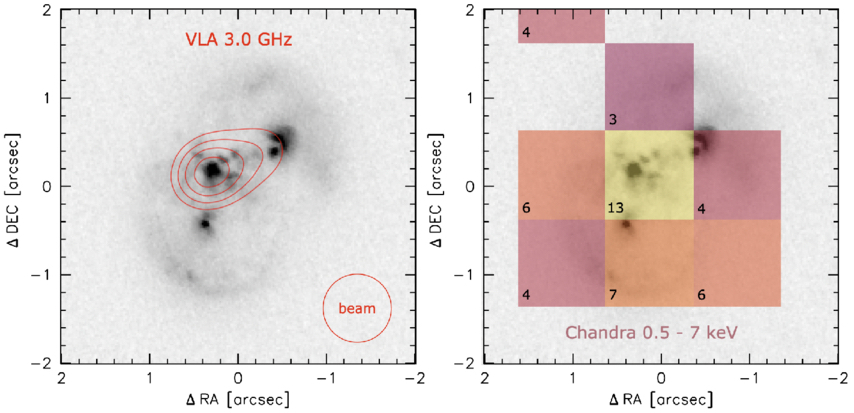
Radio (left) and X-ray (right) observations of the Infinity Galaxy, demonstrating that the black hole candidate is a strong radio and X-ray source. Click to enlarge. [Adapted from van Dokkum et al. 2025]
The authors favor a different explanation, in which the location of the black hole is no coincidence. In this scenario, the colliding galaxies crushed a gas cloud between them so forcefully that the condensed gas collapsed directly into a black hole. The authors estimated that the collision happened 50 million years ago and created a 300,000-solar-mass black hole that subsequently grew to its current mass of 1 million solar masses. Direct collapse has been proposed to be a source of the seeds of supermassive black holes in the early universe, though there are some differences between the proposed process in the early universe and what may be happening in the Infinity Galaxy.
Van Dokkum and collaborators concluded their article by saying that future observations could clarify whether the black hole is truly associated with the Infinity Galaxy — and as reported in a press release today, preliminary analysis of follow-up observations with JWST show just that. With the black hole now definitively placed within the Infinity Galaxy, the evidence for direct collapse is strengthened, though more work is needed to probe this possibility.
Citation
“The ∞ Galaxy: A Candidate Direct-Collapse Supermassive Black Hole Between Two Massive, Ringed Nuclei,” Pieter van Dokkum et al 2025 ApJL 988 L6. doi:10.3847/2041-8213/addcfe
The post A Candidate Direct-Collapse Black Hole in the Infinity Galaxy appeared first on AAS Nova.
]]>
JWST observations of the young star cluster IC 348 revealed extremely low-mass brown dwarfs with signatures of hydrocarbons in their spectra: meet the members of the proposed "H" spectral class.
The post Featured Image: Low-Mass Brown Dwarfs in a Class of Their Own? appeared first on AAS Nova.
]]>The glowing green nebula in this JWST image surrounds the star cluster IC 348, which is the subject of a recent study by Kevin Luhman (Penn State University) and Catarina Alves de Oliveira (European Space Agency). Using JWST’s Near-Infrared Camera, Luhman and Alves de Oliveira searched the cluster’s young stellar population for free-floating brown dwarfs — objects that are less massive than stars but more massive than most planets — and discovered multiple candidates with masses down to just twice the mass of Jupiter. Follow-up JWST spectroscopy confirmed the masses of these objects, making them the lowest-mass brown dwarfs known to date. In addition to their mass, these newly discovered brown dwarfs are remarkable because their spectra show evidence of hydrocarbon molecules, the exact identities of which are not yet known. Luhman and Alves de Oliveira proposed that low-mass brown dwarfs bearing this chemical signature be inducted into a new spectral class called “H” for “hydrocarbon.” To add to the intrigue of these objects, the authors also discovered signs of circumstellar disks around two of them, suggesting that they may be capable of forming and harboring planets. To learn more about the low-mass brown dwarfs in IC 348, be sure to check out the full research article linked below.
Citation
“A New Spectral Class of Brown Dwarfs at the Bottom of the IMF in IC 348,” K. L. Luhman and C. Alves de Oliveira 2025 ApJL 986 L14. doi:10.3847/2041-8213/addc55
The post Featured Image: Low-Mass Brown Dwarfs in a Class of Their Own? appeared first on AAS Nova.
]]>
A recently discovered tidal disruption event has astronomers investigating new ways in which stars may be ripped apart by supermassive black holes.
The post Double Disruption Dilemma: Exploring the Tidal Disruption Events of AT 2022dbl appeared first on AAS Nova.
]]>Falling into a supermassive black hole will leave a star mangled and destroyed but not without a fiery end. A recent study explores an intriguing case, uncovering new possibilities for stars lost to black hole bites.
Tidal Disruption Events
Invisible in light but strong in gravitational influence, some supermassive black holes reveal themselves when a star comes close enough to be ripped apart by the black hole’s tidal forces. This violent encounter produces a flare of radiation known as a tidal disruption event, allowing astronomers to explore the otherwise hidden properties of supermassive black holes and their influence on the material around them.
Tidal disruption events vary depending on the properties of the host galaxy, the supermassive black hole, and the star itself. These events often appear as X-ray flares, but over the past decade, researchers have discovered a new class of optical-ultraviolet tidal disruption events. Emitting primarily in ultraviolet and optical wavelengths, these flares are significantly less energetic than predicted, leaving researchers wondering — what drives these disruptions?
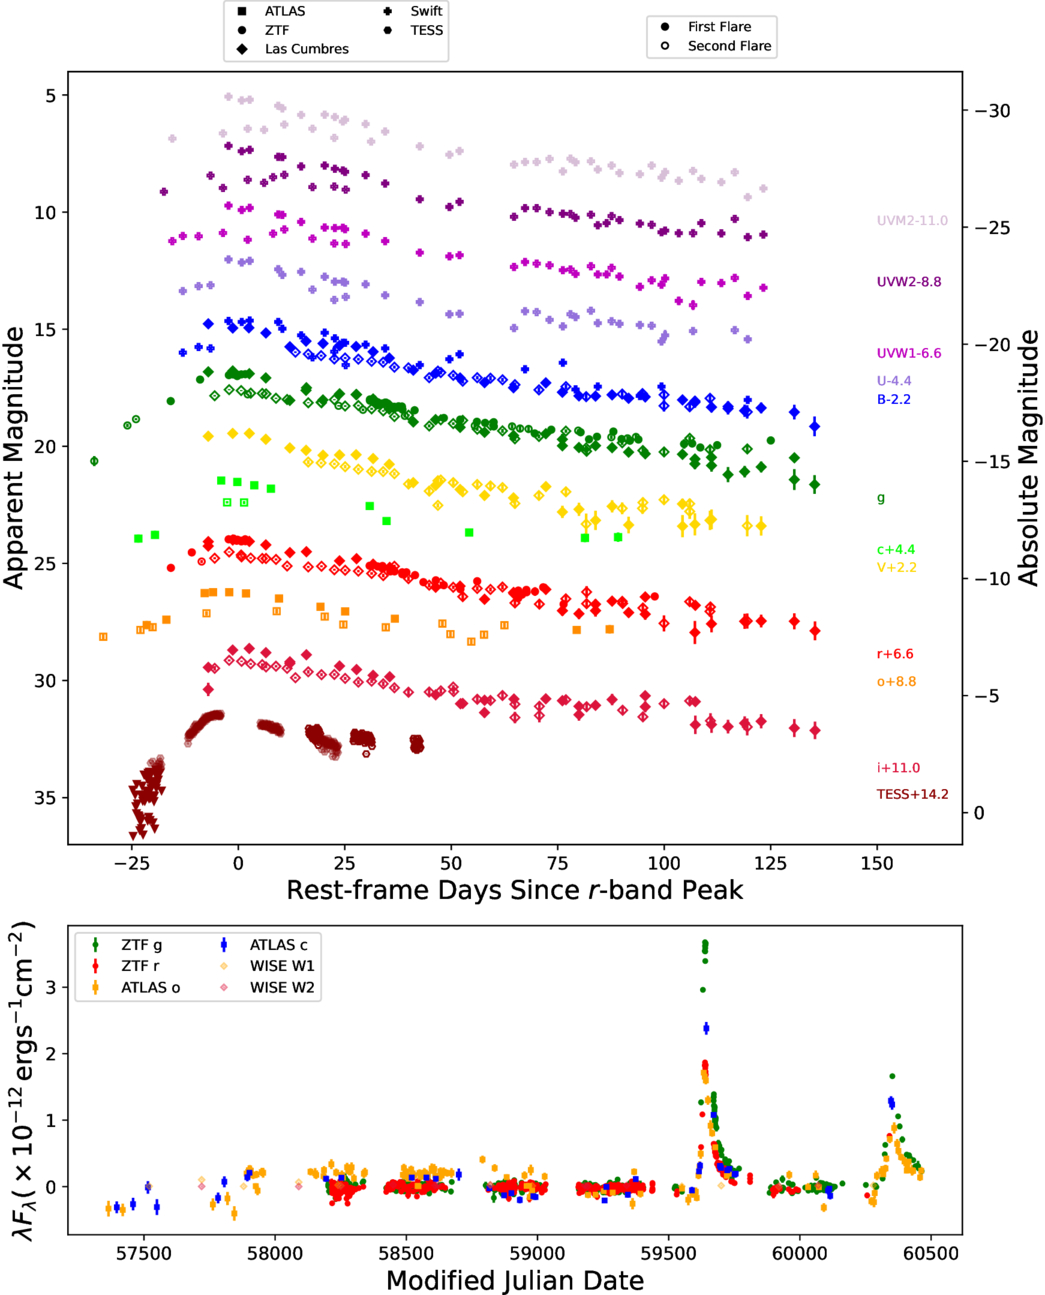
Optical and ultraviolet light curves for the two observed flares of AT 2022dbl. The flares have very similar light curves across wavelengths. Click to enlarge. [Makrygianni et al 2025]
Origins of AT 2022dbl
New detections of optical-ultraviolet tidal disruption events can provide insights into their origins, and one such discovery is particularly intriguing. AT 2022dbl first flared in 2022 and emitted a second, nearly identical flare 700 days later in 2024 — behavior uncommon among this class of tidal disruption events — raising many questions about AT 2022dbl’s origins. Did this supermassive black hole perhaps capture two unrelated stars? Is this actually the same flare seen twice due to gravitational lensing? Could a single star have survived the first flare only to be disrupted again?
Lydia Makrygianni (Lancaster University) and collaborators performed follow-up imaging and spectroscopy of AT 2022dbl to probe how the two flares compare to each other and to other observations of optical-ultraviolet tidal disruption events. With these observations and detailed analysis, the team determined that gravitational lensing, the tidal disruption of two separate stars, and even the possibility of a hidden binary companion to the supermassive black hole slurping up some stellar crumbs each cannot account for the two flares of AT 2022dbl.
Ultimately, the authors concluded that the two flares of AT 2022dbl are related to the same star, leaving two possibilities. First, loose debris from the initial flare bound to a tidal tail around the black hole could have ignited the second flare; however, the authors found that there would not be enough loose material bound to the black hole to produce the bright second flare. Rather, the second and likeliest explanation is two repeated disruptions of the same star.
Disrupting Expectations
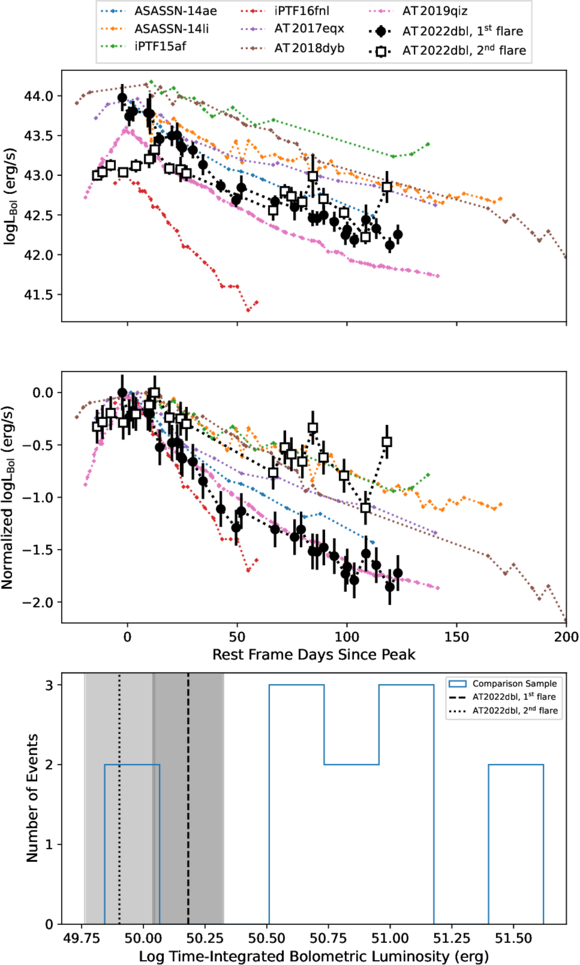
Light curves of AT 2022dbl flares compared to other optical-ultraviolet tidal disruption events. Both flares show similar peak luminosities and decline rates to other events. Click to enlarge. [Makrygianni et al 2025]
Other optical-ultraviolet tidal disruption events appear similar to the flares of AT 2022dbl, and these have generally been assumed to be complete disruptions. With the discovery and classification of AT 2022dbl, the similar optical-ultraviolet tidal disruption events could also be partial disruptions, with their second flares on longer timescales yet to be observed. Future observations of optical-ultraviolet tidal disruption events are required to further understand the mechanisms driving them, and this study opens up new possibilities to consider.
Citation
“The Double Tidal Disruption Event AT 2022dbl Implies that at Least Some ‘Standard’ Optical Tidal Disruption Events Are Partial Disruptions,” Lydia Makrygianni et al 2025 ApJL 987 L20. doi:10.3847/2041-8213/ade155
The post Double Disruption Dilemma: Exploring the Tidal Disruption Events of AT 2022dbl appeared first on AAS Nova.
]]>
A new method for handling data with significant gaps can be applied to extremely sparse datasets, such as Voyager data from the outer heliosphere.
The post Minding the Gaps in Solar Wind Data appeared first on AAS Nova.
]]>Spacecraft scattered throughout the solar system keep tabs on the solar wind, but the measurements are dotted with data gaps. How can scientists prevent these gaps from biasing their studies of the solar wind?
Sampling the Solar Wind
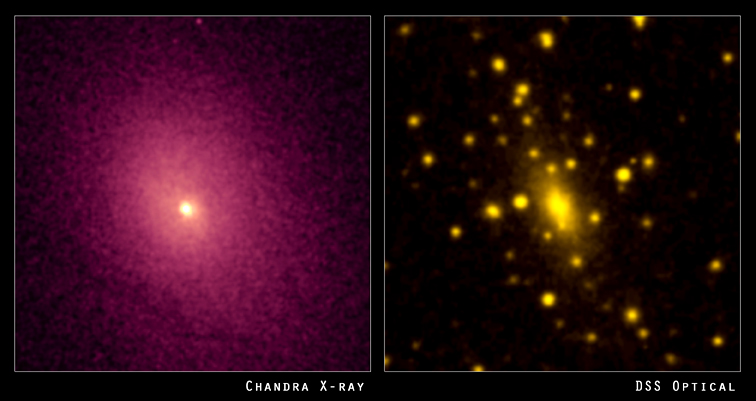
Left: the distribution of hot gas between the galaxies in the cluster Abell 2029. Right: the visible light from the galaxies in the cluster. [X-ray: NASA/CXC/UCI/A.Lewis et al. Optical: Pal.Obs. DSS]
Luckily, there are many spacecraft that sample the solar wind from various locations within our solar system. Unluckily, many of these spacecraft do not continuously monitor the solar wind. For example, when a spacecraft orbiting a planet dips into the planet’s atmosphere, this detour creates an hours-long gap in solar wind monitoring.
The Impact of Data Gaps
How do these data gaps affect studies of the solar wind? In a recent research article, Daniel Wrench and Tulasi Parashar (Victoria University of Wellington) approached this question in terms of how gaps affect the structure function: a mathematical description of how the solar wind fluctuates over different length or time scales.
Wrench and Parashar introduced random artificial gaps into data from the Parker Solar Probe, which monitors the solar wind continuously, and compared the structure functions calculated from the continuous and interrupted data sets. They used the difference between the true structure function — calculated from the continuous data set — and the structure functions from the artificially gapped data sets to develop a correction factor.
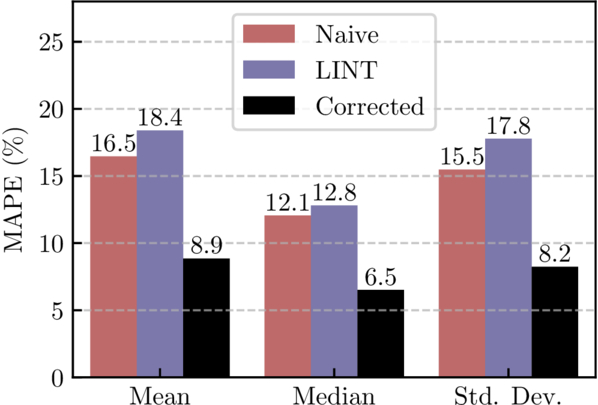
Performance of the correction factor method (black) compared to the uncorrected, gapped data (red) or gaps filled using linear interpolation (blue). MAPE is the mean absolute percentage error. [Wrench & Parashar 2025]
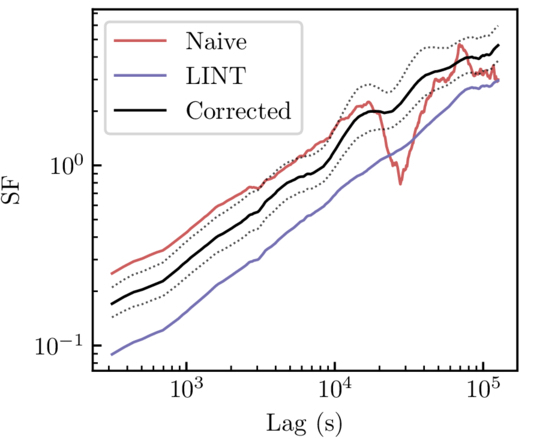
Structure function calculated from uncorrected Voyager 1 data (red), linearly interpolated data (blue), and corrected data (black). Both the linear interpolation method and the correction factor method remove the artifact around a lag of 3×10⁴ seconds, but the correction factor method does not suppress the signal like the linear interpolation method does. [Adapted from Wrench & Parashar 2025]
Correcting Voyager 1
Finally, the authors applied their validated method to data from Voyager 1. Data from the two Voyager spacecraft are extremely scientifically valuable — no other spacecraft have ventured as far from the Sun and can measure the solar wind at such large distances. The data are also extremely sparse; one segment used in this work was missing 85% of the data. This means that an effective method of correcting these data has potentially huge scientific significance.
Wrench and Parashar applied their correction factor to the Voyager 1 data, showing that this method handily removes artifacts while avoiding the underestimation introduced by linear interpolation. While the authors saved the interpretation of the newly corrected Voyager 1 data for future research, this study makes it clear that even large data gaps needn’t hinder studies of the solar wind.
Citation
“Debiasing Structure Function Estimates from Sparse Time Series of the Solar Wind: A Data-Driven Approach,” Daniel Wrench and Tulasi N. Parashar 2025 ApJ 987 28. doi:10.3847/1538-4357/addc6a
The post Minding the Gaps in Solar Wind Data appeared first on AAS Nova.
]]>
Astrobites reports on simulations that improve our understanding of how jets from active galactic nuclei interact with the interstellar medium.
The post You Shall Not Pass! Active Galactic Nucleus Jets Through the Interstellar Medium appeared first on AAS Nova.
]]>Editor’s Note: Astrobites is a graduate-student-run organization that digests astrophysical literature for undergraduate students. As part of the partnership between the AAS and astrobites, we occasionally repost astrobites content here at AAS Nova. We hope you enjoy this post from astrobites; the original can be viewed at astrobites.org.
Title: You Shall Not Pass! The Propagation of Low-/Moderate-Powered Jets Through a Turbulent Interstellar Medium
Authors: Olga Borodina et al.
First Author’s Institution: Center for Astrophysics | Harvard & Smithsonian
Status: Published in ApJ
The central black holes of some galaxies are surrounded by accretion disks of hot infalling gas. In cases when the accretion disk is massive and highly energetic, this central system forms an active galactic nucleus that outshines the rest of the galaxy. Active galactic nucleus feedback is the process of energetic interactions between the central supermassive black hole and its surroundings. Active galactic nuclei are essential for galaxy quenching, and correctly modeling their contribution is important for accurate cosmological simulations.
Active galactic nuclei release the energy from their accretion via winds, which are widespread outflows, and jets. Jets are collimated, fast outflows of baryonic matter that can spread out from hundreds to tens of thousands of parsecs from their origin. There’s a big range in power for jets, ranging from a low end of around 1038 erg/s to a high end of 1046 erg/s. For context, our Sun emits at about 1033 erg/s.
As jets pass through their host galaxy, they interact with the gas and dust of the interstellar medium. There isn’t a lot of observational evidence for what goes on in that interaction, as the scale of resolution needed is so small — on the order of parsecs within the galaxy. Cosmological simulations don’t model scales small enough to accurately simulate these interactions, and they instead rely on feedback models that implement the macroscale effects. This means we could be missing part of the picture. Today’s article considers galaxy-scale numeric models for jets passing through a turbulent interstellar medium to study how the jet is affected by the gas and dust.
To do this, the authors used the Arepo code, which has an adaptive mesh setup that improves the resolution in areas that need it. They set up a 2-kiloparsec-cubed box full of gas with properties based on real galaxies’ interstellar media. This study is unique compared to other works because the authors use a filamentary structure for the interstellar medium, while previous studies used a clumpy structure. This filamentary structure reflects our actual Milky Way’s interstellar medium and creates more low-density cavities for the jet to interact with. The authors studied three jet powers on the low to intermediate end, of 1038, 1040, and 1043 erg/s. This is also unique to the study, as many works look at higher-powered jets, which produce large-scale radio galaxies, despite lower powers being more common. The jets were launched along the x-axis and had a tracer set up to track their positions through time.
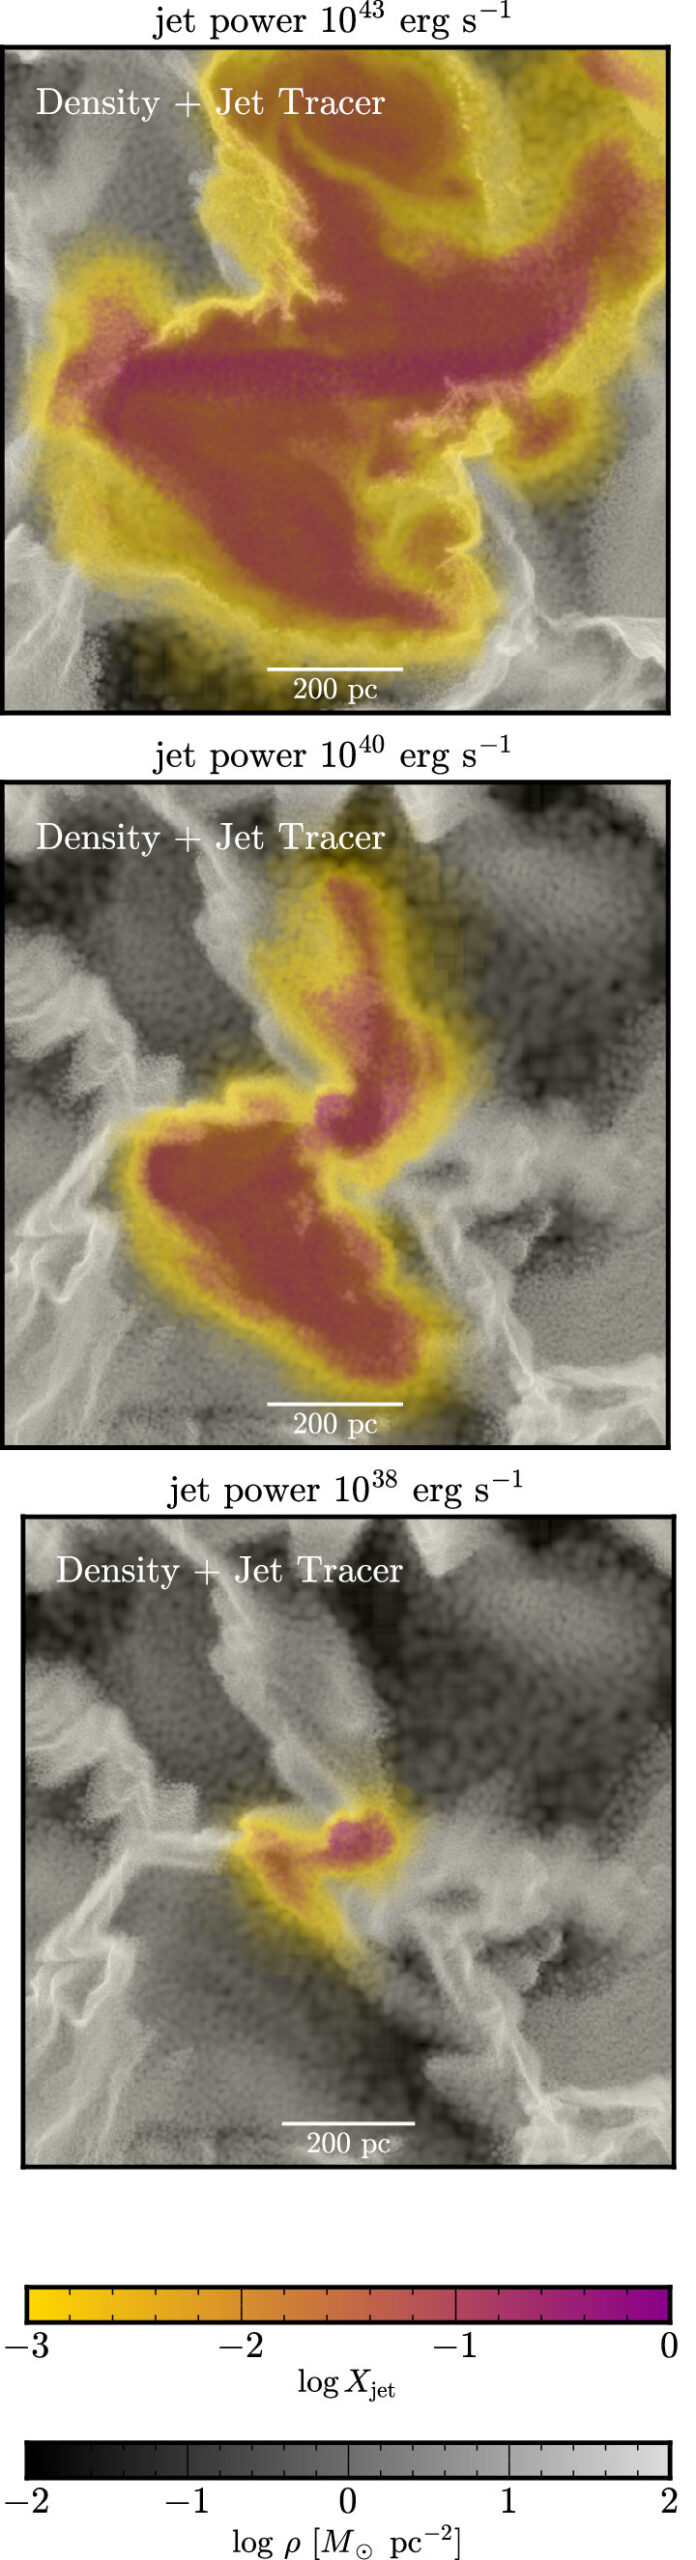
Figure 1: From top to bottom, the high to low power jets, which are traced in color against the background interstellar medium density in grayscale. The lower power jets are stalled by the interstellar medium and do not make it as far out in the simulation space. [Adapted from Borodina et al. 2025]
The highest-power jets, 1043 erg/s, were easily able to pass through the turbulent environment and reach the outer boundary of the simulation. They mostly traveled along the axis that the jet was launched along, with some lateral expansion.
The intermediate-power jets, 1040 erg/s, were highly disrupted and redirected from the axis they were launched along. The jets bent, filled the low-density cavities between the filaments, and produced bubble-like shapes. These jets did make it all the way to the simulation boundary, but at later times and not along the axis they were initialized on. These intermediate-power jets don’t have enough ram pressure — the pressure against the gas due to the jet’s motion — to push through the turbulent structure of the interstellar medium, and they have to fill pre-existing cavities rather than plowing their own. The authors developed an analytic model for the minimum energy needed for jets to be able to plow through the interstellar medium, at approximately 1041 erg/s.
The jets in the lowest-power case, 1038 erg/s, were stalled out by the interstellar medium within the first kiloparsec of travel. They couldn’t penetrate the higher-density regions of the interstellar medium the way the 1040 erg/s case could, and they couldn’t make it to lower-density cavities to expand into.
All three of these cases were slower and shorter than the same power of jets run in a non-turbulent simulation, with the most significant disruption in the lowest-powered jets. This work demonstrates that a turbulent interstellar medium–jet interaction can be the sole cause of observed asymmetric and bent active galactic nucleus jets. By improving our understanding of this small-scale interaction, the authors are contributing to making better active galactic nucleus feedback models in cosmological simulations.
Original astrobite edited by Ansh Gupta.
About the author, Lindsey Gordon:
Lindsey Gordon is a fourth-year PhD candidate at the University of Minnesota. She works on active galactic nucleus jets, radio relics, magnetohydrodynamics simulations, and how to use AI to study all those things better.
The post You Shall Not Pass! Active Galactic Nucleus Jets Through the Interstellar Medium appeared first on AAS Nova.
]]>
New research suggests that JWST is capable of directly imaging planets that resemble the gas giants in our solar system, provided they orbit nearby stars.
The post Exo-Saturns and Exo-Jupiters Are Within JWST’s Reach appeared first on AAS Nova.
]]>Of the nearly 6,000 currently known exoplanets, few closely resemble any of the planets in our solar system. New research suggests that JWST is capable of directly imaging exoplanets with temperatures and orbital distances similar to Jupiter and Saturn, placing truly familiar exoplanets within our observational grasp.
Increasingly Cold Discoveries
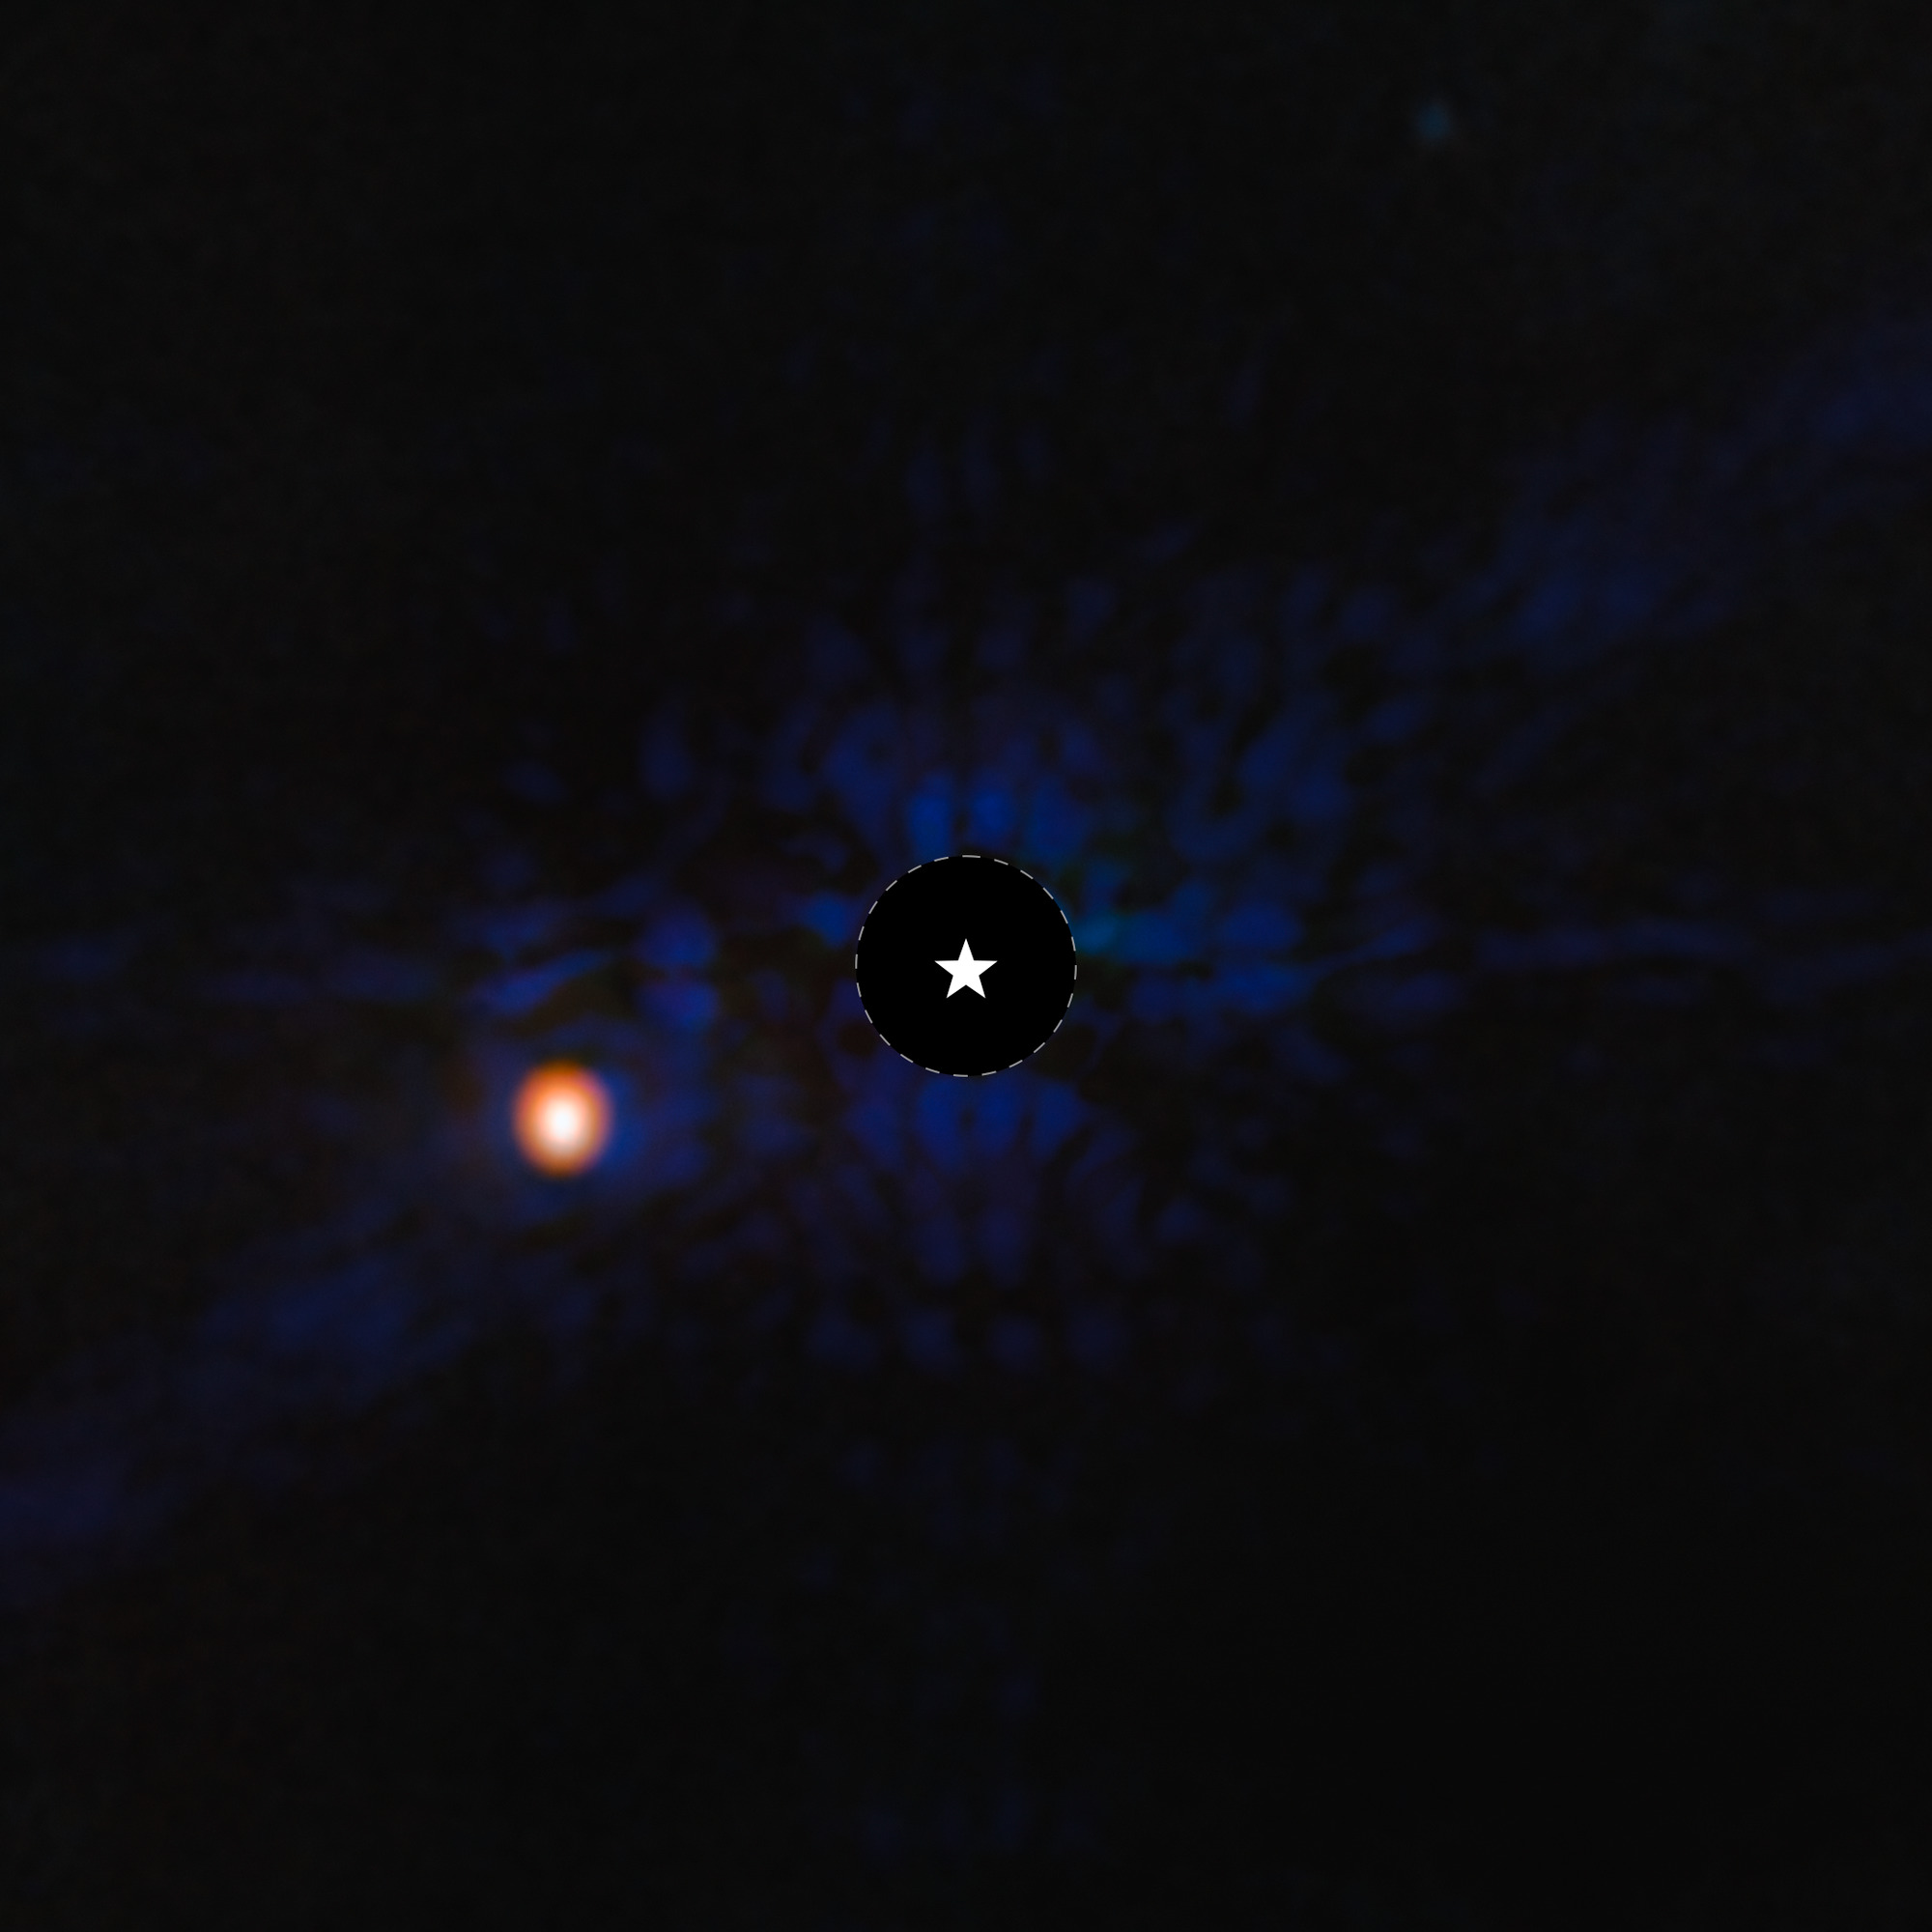
A JWST image of the exoplanet Epsilon Indi Ab, one of the coldest exoplanets to be directly imaged. The planet’s temperature is estimated to be just 275K (35℉/2℃). [NASA, ESA, CSA, STScI, Elisabeth Matthews (MPIA)]
Answering this question requires a deep dive into the abilities of JWST’s instruments. The current go-to method for directly imaging planets with JWST is coronagraphy with its Near-Infrared Camera (NIRCam). In this observing mode, the instrument blocks the light from the star, allowing the fainter thermal glow of the planet to shine through.
But as Rachel Bowens-Rubin (University of Michigan and Eureka Scientific) and collaborators note in a recent research article, this may not be the best way to detect cold giant planets. Models suggest that these planets have cloudy atmospheres, which means that they wouldn’t be bright at NIRCam’s preferred near-infrared wavelengths, and would instead be detected more easily in the mid-infrared, where JWST’s Mid-Infrared Instrument (MIRI) reigns.
Combining Data and Models
To examine the capabilities of both of these instruments, Bowens-Rubin’s team analyzed JWST observations from the Cool Kids on the Block program, which targets cold, low-mass giant planets around nearby low-mass stars with NIRCam coronagraphy and MIRI imaging. The team used observations of nearby M-dwarf stars Wolf 359 and EV Lac to construct constrast curves: the level of planet–star flux contrast that is detectable by each instrument as a function of distance from each star. These curves depend on the flux of the star and the planet as well as the limitations of the instrument — the detector noise and background noise.
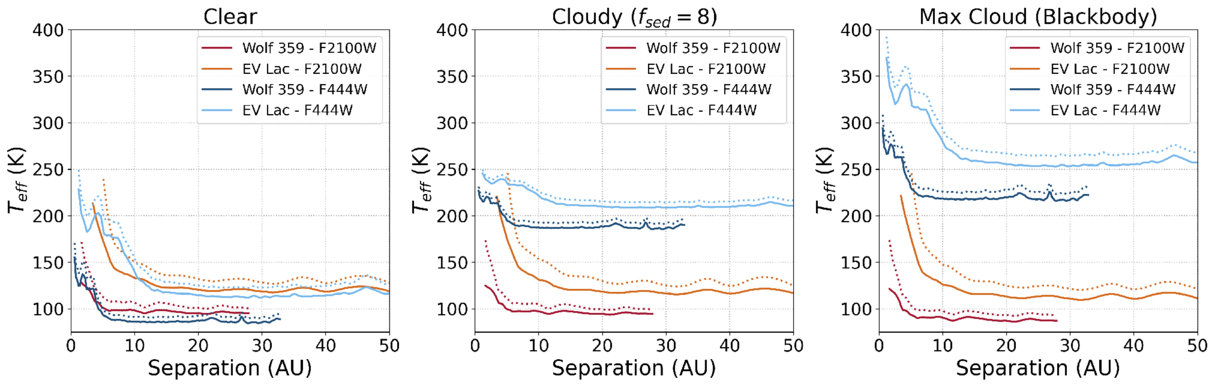
Temperatures of coldest detectable planets as a function of separation from the host star for Wolf 350 and EV Lac. Results are shown for MIRI F2100W imaging and NIRCam F444W coronagraphy. Click to enlarge. [Bowens-Rubin et al. 2025]
NIRCam vs. MIRI
This analysis showed that MIRI is the best choice for directly imaging cold planets around nearby stars (within 65 light-years). MIRI should be able to detect giant planets with temperatures down to 94K around Wolf 359 and 114K around EV Lac — about the temperature of Saturn and slightly colder than Jupiter, respectively. For Wolf 359, sub-100K planets are detectable at orbital distances of at least 4.8 au, meaning these planets could also have similar orbital separations to Jupiter and Saturn.
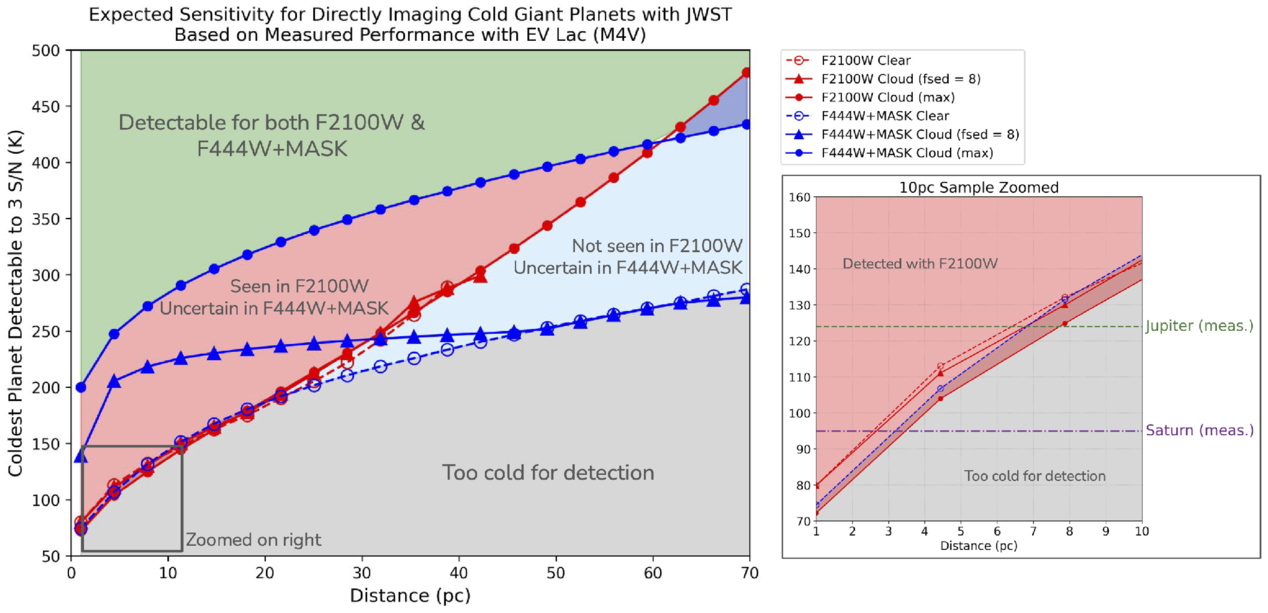
Temperatures of planets detectable to a signal-to-noise ratio of 3 as a function of distance from Earth. Detection limits for MIRI and NIRCam are shown as red and blue lines, respectively. Click to enlarge. [Bowens-Rubin et al. 2025]
As impressive as these results are already, Bowens-Rubin and coauthors noted that future work, such as developing strategies to mitigate MIRI’s “brighter-fatter effect” that limits sensitivity at small angular separations from the host star, could enhance the search for exo-Saturns and exo-Jupiters even further.
Citation
“NIRCam Yells at Cloud: JWST MIRI Imaging Can Directly Detect Exoplanets of the Same Temperature, Mass, Age, and Orbital Separation as Saturn and Jupiter,” Rachel Bowens-Rubin et al 2025 ApJL 986 L26. doi:10.3847/2041-8213/addbde
The post Exo-Saturns and Exo-Jupiters Are Within JWST’s Reach appeared first on AAS Nova.
]]>
A team of citizen scientists compared 5.4 million pairs of astronomical images, helping researchers create a database of image similarity information that can be used to test image-search algorithms.
The post Citizen Science Born in the Pandemic: The Hubble Image Similarity Project appeared first on AAS Nova.
]]>Motivated by a desire to support community members financially during the coronavirus pandemic, researchers employed 30 local citizen scientists in the Hubble Image Similarity Project. This project quantified the similarities between astronomical images, providing a way to test the results of image-search algorithms.
Seeking Similarities

The Eagle Nebula, pictured here in an image from Kitt Peak National Observatory, is a star-forming region in the Milky Way. [T.A.Rector (NRAO/AUI/NSF and NOIRLab/NSF/AURA) and B.A.Wolpa (NOIRLab/NSF/AURA); CC BY 4.0]
You might start your search with an astronomical image database, using filters for object type or instrument to sift through thousands and thousands of options. But even filtering out everything but star-forming regions might yield vastly different results, given the widely varying shapes, colors, and sizes of these regions.
Or maybe you’ll feed your image into a neural network that has been trained to spot similar images. The results may seem promising, but how can you tell whether the algorithm has found the images that are the most similar? Would another algorithm do better?
The Hubble Image Similarity Project
Astronomical image collections rarely contain information about similarities between images in their metadata, and while neural networks appear to excel at gathering similar images, the results of these models are generally unverified. The Hubble Image Similarity Project, led by Richard White (Space Telescope Science Institute) and Josh Peek (Space Telescope Science Institute and Johns Hopkins University), addressed these issues with a team of citizen scientists who generated similarity information for astronomical images, providing a quantitative means to test the results of neural networks.
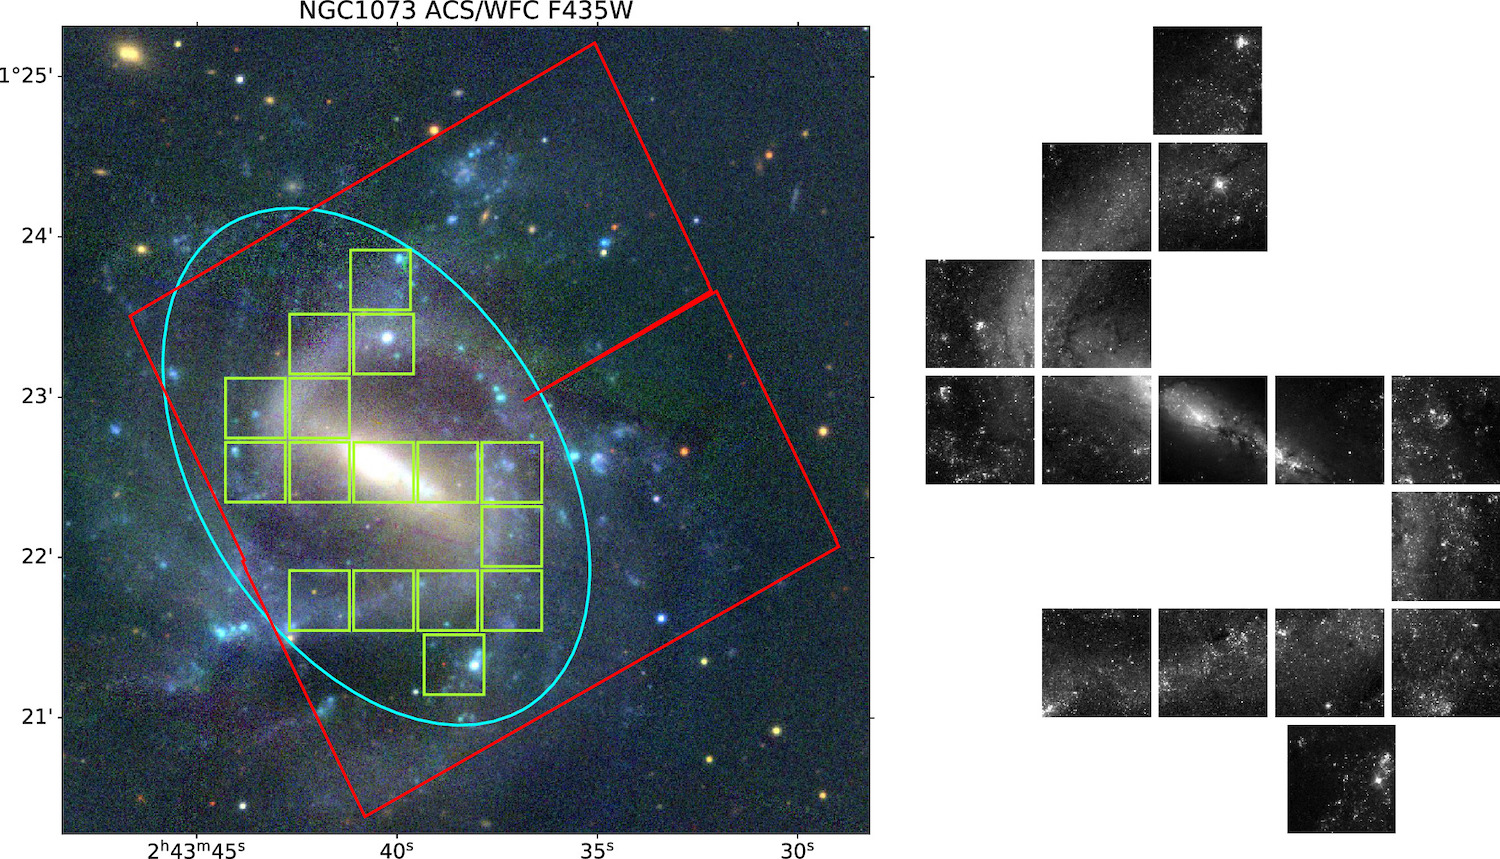
An example of individual test images (green squares) extracted from a Hubble Legacy Archive image (red square). Low-contrast areas have been excluded, leaving the galaxy’s spiral arms for analysis. Click to enlarge. [White & Peek 2025]
Citizen Scientists, Assemble
White and Peek recruited 30 members of the community within walking distance of the Space Telescope Science Institute to identify similar astronomical images, and the reviewers were paid for their work. In the three phases of the project, reviewers considered test images one at a time and 1) selected all similar images from a set of 15 comparison images, 2) selected the most similar image from a narrowed-down set of 6 comparison images, and finally 3) selected the most similar image from a set of 3 comparison images.
Examples of similar images according to the image similarity matrix. In the lower-right corner is a visualization of the similarity data. The semicircle of data points in the bottom half of this visualization represents galaxies, while star clusters occupy the small arc near the top and nebulae sit in the island in the center of the plot. Click to enlarge. [Adapted from White & Peek 2025]
Similar images resemble one another in terms of structure, texture, and other factors that White and Peek say are “difficult even to describe in words” — for example, the diffuse glow of a galaxy interrupted by a bright star with diffraction spikes, or a nebula speckled with stars and dense dusty clumps. The similarity data from this study are available online and can be used to test the performance of image-search algorithms. In future work, the authors plan to carry out a similar project using images of the Martian landscape.
Citation
“The Hubble Image Similarity Project,” Richard L. White and J. E. G. Peek 2025 AJ 169 306. doi:10.3847/1538-3881/adcb43
The post Citizen Science Born in the Pandemic: The Hubble Image Similarity Project appeared first on AAS Nova.
]]>
Astrobites reports on how researchers are preparing for future detections of merging supermassive and intermediate-mass black holes.
The post Giving Justice to Intermediate-Mass Black Hole Mergers appeared first on AAS Nova.
]]>Editor’s Note: Astrobites is a graduate-student-run organization that digests astrophysical literature for undergraduate students. As part of the partnership between the AAS and astrobites, we occasionally repost astrobites content here at AAS Nova. We hope you enjoy this post from astrobites; the original can be viewed at astrobites.org.
Title: Intermediate Mass Ratio Inspirals in Milky Way Galaxies
Authors: Jillian Bellovary et al.
First Author’s Institution: Queensborough Community College
Status: Published in ApJ
Galaxies like our Milky Way are not just serene places hosting stars, gas, and dark matter. They also undergo a host of violent activities. Evidence strongly suggests that our Milky Way interacts with nearby dwarf galaxies, pulling them in entirely or tearing them apart through tidal forces. Dwarf galaxies, though small, often host black holes with masses between 103 and 105 solar masses (intermediate-mass black holes). When these dwarfs fall into the Milky Way’s gravitational pull, tidal forces strip them of stars and gas, leaving their black holes to roam the galaxy halo. Some of these “wandering” black holes spiral toward the central supermassive black hole. This leads to an event called inspiral, where black holes slowly spiral together before merging.
Mergers between an intermediate-mass black hole and a supermassive black hole are called intermediate mass ratio inspirals or IMRIs. They represent an intermediate case between major mergers involving equal-mass black holes and extreme mass ratio inspirals (EMRIs), where a stellar-mass black hole merges with a supermassive black hole. IMRIs are expected to generate gravitational waves that are detectable by the next-generation space-based gravitational wave detector, the Laser Interferometer Space Antenna (LISA). However, their waveforms remain challenging to model as the origins and development of these IMRIs are not fully understood.
Tracking IMRIs with Simulations
In today’s article, the authors use high-resolution simulations to study how IMRIs form and evolve, offering critical insights for the upcoming LISA mission. They used the DC Justice League simulation suite (the individual simulations are all named after women who have served on the US Supreme Court: Sandra, Ruth, Sonia, and Elena!) to model four Milky Way–like galaxies at high resolution to trace the origins of IMRIs. These simulations track the formation and evolution of massive black holes in dwarf galaxies that eventually merge into larger galactic systems.
What Did the Simulations Reveal?
The study uncovered key features of IMRIs in Milky Way–like galaxies:
-
- Prevalence: About half of all massive black hole mergers were IMRIs, emphasizing their importance in galaxy evolution.
- Timing of mergers: Most IMRI events occur early in the universe, approximately 3 billion years after the Big Bang, when galaxy mergers and interactions were more frequent (Figure 1).
- Inspiral timescales: The duration of the inspiral process depends heavily on the compactness of the dwarf galaxy. Dense, compact dwarfs have faster inspiral times, whereas diffuse dwarfs slow down the process. A more compact galaxy can plunge deeper into the galaxy before being disrupted, resulting in a massive black hole that is closer to the center and will inspiral more quickly (Figure 2).
- Orbital evolution: While some IMRIs become more circular over time, others maintain eccentric orbits until the merger.
Figure 1: The yellow stars represent the merger times for IMRIs, while the purple circles show other types of black hole mergers, such as EMRIs and major mergers. Most IMRIs occurred in the early universe when black holes were smaller and mergers between galaxies were more frequent. [Bellovary et al. 2025]
Figure 2: The correlation between the compactness of the dwarf galaxy (y-axis) and the inspiral time (x-axis). More compact dwarf galaxies (indicated by larger values on the y-axis) have shorter inspiral times. Here, the IMRIs are indicated by the yellow stars. [Bellovary et al. 2025]
Why Does This Matter?
IMRIs offer a unique opportunity to study black hole demographics and galaxy assembly. The mass ratios and orbital eccentricities of these events are sensitive to the early conditions of black hole formation and the dynamics of galaxy mergers. However, IMRIs present challenges for gravitational wave detection. Unlike major mergers or EMRIs, their waveforms cannot be easily modeled using existing methods. The authors stress the need for a hybrid approach that combines post-Newtonian (commonly used for major mergers) and perturbative techniques (widely used for EMRIs) to simulate IMRI signals effectively.
The study also highlights the importance of preparing for LISA, slated to launch in the 2030s. As a space-based gravitational wave observatory, LISA will be sensitive to low-frequency waves produced by IMRIs at unprecedented distances. Accurate waveform models are essential for detecting these signals and extracting their astrophysical information. LISA’s detections of IMRIs could constrain the masses of black holes in dwarf galaxies, shed light on supermassive black hole seed formation mechanisms, and enhance our understanding of galaxy evolution across cosmic time.
Looking Ahead
While the authors of today’s article provide a detailed glimpse into the dynamics of IMRIs, they also highlight limitations. The small sample size and simplified black hole merger models call for broader studies using more comprehensive simulations. Future work must refine the physics of inspirals and develop robust waveform libraries to maximize LISA’s scientific return.
IMRIs are not just a niche class of black hole mergers; they are a treasure trove of information about the cosmic past. With LISA on the horizon, our ability to unlock these secrets is closer than ever!
Original astrobite edited by Tori Bonidie.
About the author, Archana Aravindan:
I am a PhD candidate at the University of California, Riverside, where I study black hole activity in small galaxies. When I am not looking through some incredible telescopes, you can usually find me reading, thinking about policy, or learning a cool language!
The post Giving Justice to Intermediate-Mass Black Hole Mergers appeared first on AAS Nova.
]]>
Two powerful telescopes examined the brightest gamma-ray burst ever observed by humans, hundreds of days after the burst was first detected. What did they see?
The post Featured Image: Hubble and JWST Check Up on the BOAT Gamma-Ray Burst appeared first on AAS Nova.
]]>The bright spot visible within its fuzzy host galaxy in the image above is the optical and infrared light from a superlative gamma-ray burst. Discovered in October 2022, GRB 221009A was the brightest gamma-ray burst ever observed by humans, and likely a once-in-ten-millennia event, earning it the nickname “the Brightest of All Time” or BOAT gamma-ray burst. This image shows the afterglow of this burst nearly a year after it exploded onto the scene. In a recent article, Huei Sears (Rutgers University) and collaborators analyzed Hubble and JWST observations made 185–345 days after the discovery of the burst. These observations captured the burst’s fading light and showed a distinct shift in the rate at which the light dimmed at around 50 days. This shift is evidence of powerful jets from the source of the burst. Sears’s team also discovered a blue component to the afterglow emission. This blue component may be due to the burst’s afterglow echoing off of dust in the host galaxy — if confirmed, this will mark the first time this feature has been detected. To learn more about what astronomers have discovered in the years since GRB 221009A was first spotted, be sure to check out the full research article linked below!
Citation
“Late-Time HST and JWST Observations of GRB 221009A: Evidence for a Break in the Light Curve at 50 Days,” Huei Sears et al 2025 ApJ 984 196. doi:10.3847/1538-4357/adc306
The post Featured Image: Hubble and JWST Check Up on the BOAT Gamma-Ray Burst appeared first on AAS Nova.
]]>
With their extremely low surface brightness, ultra-diffuse galaxies are very difficult to detect, but a recent study has spotted one by searching for its globular clusters.
The post Finding Galaxies in the Dark: Using Globular Clusters to Identify Ultra-Diffuse Galaxies appeared first on AAS Nova.
]]>While classic spiral and elliptical galaxies shine brightly, another class of galaxy flies under the radar. A recent study uses a new technique to search for galaxies so faint they are nearly completely dark.
Ultra-Diffuse Galaxies
Hard to see and harder to understand, ultra-diffuse galaxies are a galaxy class with extremely low surface brightness. With low luminosities but large physical extents, these galaxies appear as barely visible smudges, making them difficult to detect. Historically, astronomers have searched for ultra-diffuse galaxies using methods that search for diffuse stellar light; however, this method only catches those bright enough to spot — if even darker galaxies exist, they will not be found this way. Is there another way to discover these elusive galaxies?
Recent studies have shown that ultra-diffuse galaxies tend to have more globular clusters on average than typical galaxies. While this raises questions surrounding their formation and evolution, the abundance of globular clusters provides another way to search for ultra-diffuse galaxies. In general, globular clusters do not clump together in space unless there is additional mass, like dark matter, pulling them together. Thus, searching for overdensities of globular clusters could reveal a hidden population of ultra-diffuse galaxies.
Candidate Confirmation
Discovered as an overdensity of three globular clusters, Candidate Dark Galaxy-2 (CDG-2) was found in data from a Hubble Space Telescope (HST) program aimed at imaging the Perseus galaxy cluster. With an updated globular cluster catalog and improved statistical method for detecting overdensities, Dayi (David) Li (University of Toronto) and collaborators perform a follow-up search and analysis to confirm CDG-2 as a galaxy. Their method searches for clustering of globular clusters that do not appear to belong to any bright galaxy and are unlikely to be randomly grouped so closely in the intergalactic medium.
Euclid images of CDG-2 showing the four identified globular clusters (blue circles) and the faint diffuse emission (orange circles) associated with the galaxy. Click to enlarge. [Modified from Li et al 2025]
Globular Cluster and Dark Matter Dominated
Plot showing globular cluster total luminosity versus total galaxy luminosity for multiple galaxies. CDG-2 falls along the line corresponding to 16% of the total galaxy light coming from globular clusters. Click to enlarge. [Li et al 2025]
Through this study, the authors have confirmed the first galaxy ever detected solely through its globular cluster population. This technique opens a promising avenue to discovering more galaxies hiding out in the dark.
Citation
“Candidate Dark Galaxy-2: Validation and Analysis of an Almost Dark Galaxy in the Perseus Cluster,” Dayi (David) Li et al 2025 ApJL 986 L18. doi:10.3847/2041-8213/adddab
The post Finding Galaxies in the Dark: Using Globular Clusters to Identify Ultra-Diffuse Galaxies appeared first on AAS Nova.
]]>
The massive nearby elliptical galaxy Messier 87 hosts one of the most-studied supermassive black holes in the universe. What have researchers recently learned about this black hole's spin, jets, and flares?
The post Monthly Roundup: The Supermassive Black Hole of Messier 87 appeared first on AAS Nova.
]]>
The first detailed image of a black hole, M87*, taken with the Event Horizon Telescope. [Adapted from EHT Collaboration et al. 2019]
Today’s Monthly Roundup explores three aspects of this supermassive black hole: how fast it spins, the properties of its relativistic jet, and the source of its powerful flares.
Taking M87’s Black Hole for a Spin
Spin is one of the fundamental parameters describing a black hole, along with mass and electric charge, and it’s a challenging quantity to measure. In a recent research article, Michael Drew (University of Central Lancashire) and collaborators used data from the Event Horizon Telescope from 2017 and 2018 to measure the spin of M87*. Their goal was to measure the angular momentum of the innermost region of the disk of material swirling around the black hole. For a 10-billion-year-old black hole like M87’s, the angular momentum of the inner reaches of the accretion disk is fundamentally linked to the spin of the black hole.
Radial brightness profiles of the Event Horizon Telescope images of M87*. The variation of the brightness of the ring is due in part to Doppler beaming. Click to enlarge. [Event Horizon Telescope Collaboration 2019]
This method returned a spin parameter of 0.8, which is within the broad range of previous estimates for M87*’s spin (0.1–0.98). Given certain assumptions made in this work, the team expects that this spin measurement is a lower limit on the black hole’s spin.
Closeup of Messier 87’s relativistic jet. [NASA and the Hubble Heritage Team (STScI/AURA)]
A New Model for Bright-Edged Jets
One of the most dramatic features of Messier 87 is its prominent jet. Researchers have noted that M87*’s jet exhibits limb brightening, meaning that the jet appears brighter along its edges than in its center. This characteristic is present throughout M87*’s jet, from close to the point at which it’s launched to far down its length, and is also seen in other black hole jets.
Demonstration of limb brightening in models that include an anisotropic electron distribution. [Tsunetoe et al. 2025]
Tsunetoe’s team used both general relativistic magnetohydrodynamics (GRMHD) and general relativistic force-free electrodynamics (GRFFE) in their modeling. These two modeling techniques have different strengths and weaknesses: GRMHD allows time variations to be studied, but is only effective close to the black hole, while GRFFE applies at a large distance from the black hole, but can only give a time-averaged result. By combining these two methods, the authors were able to generate synthetic radio-frequency images of M87*’s jet and compare them to observations.
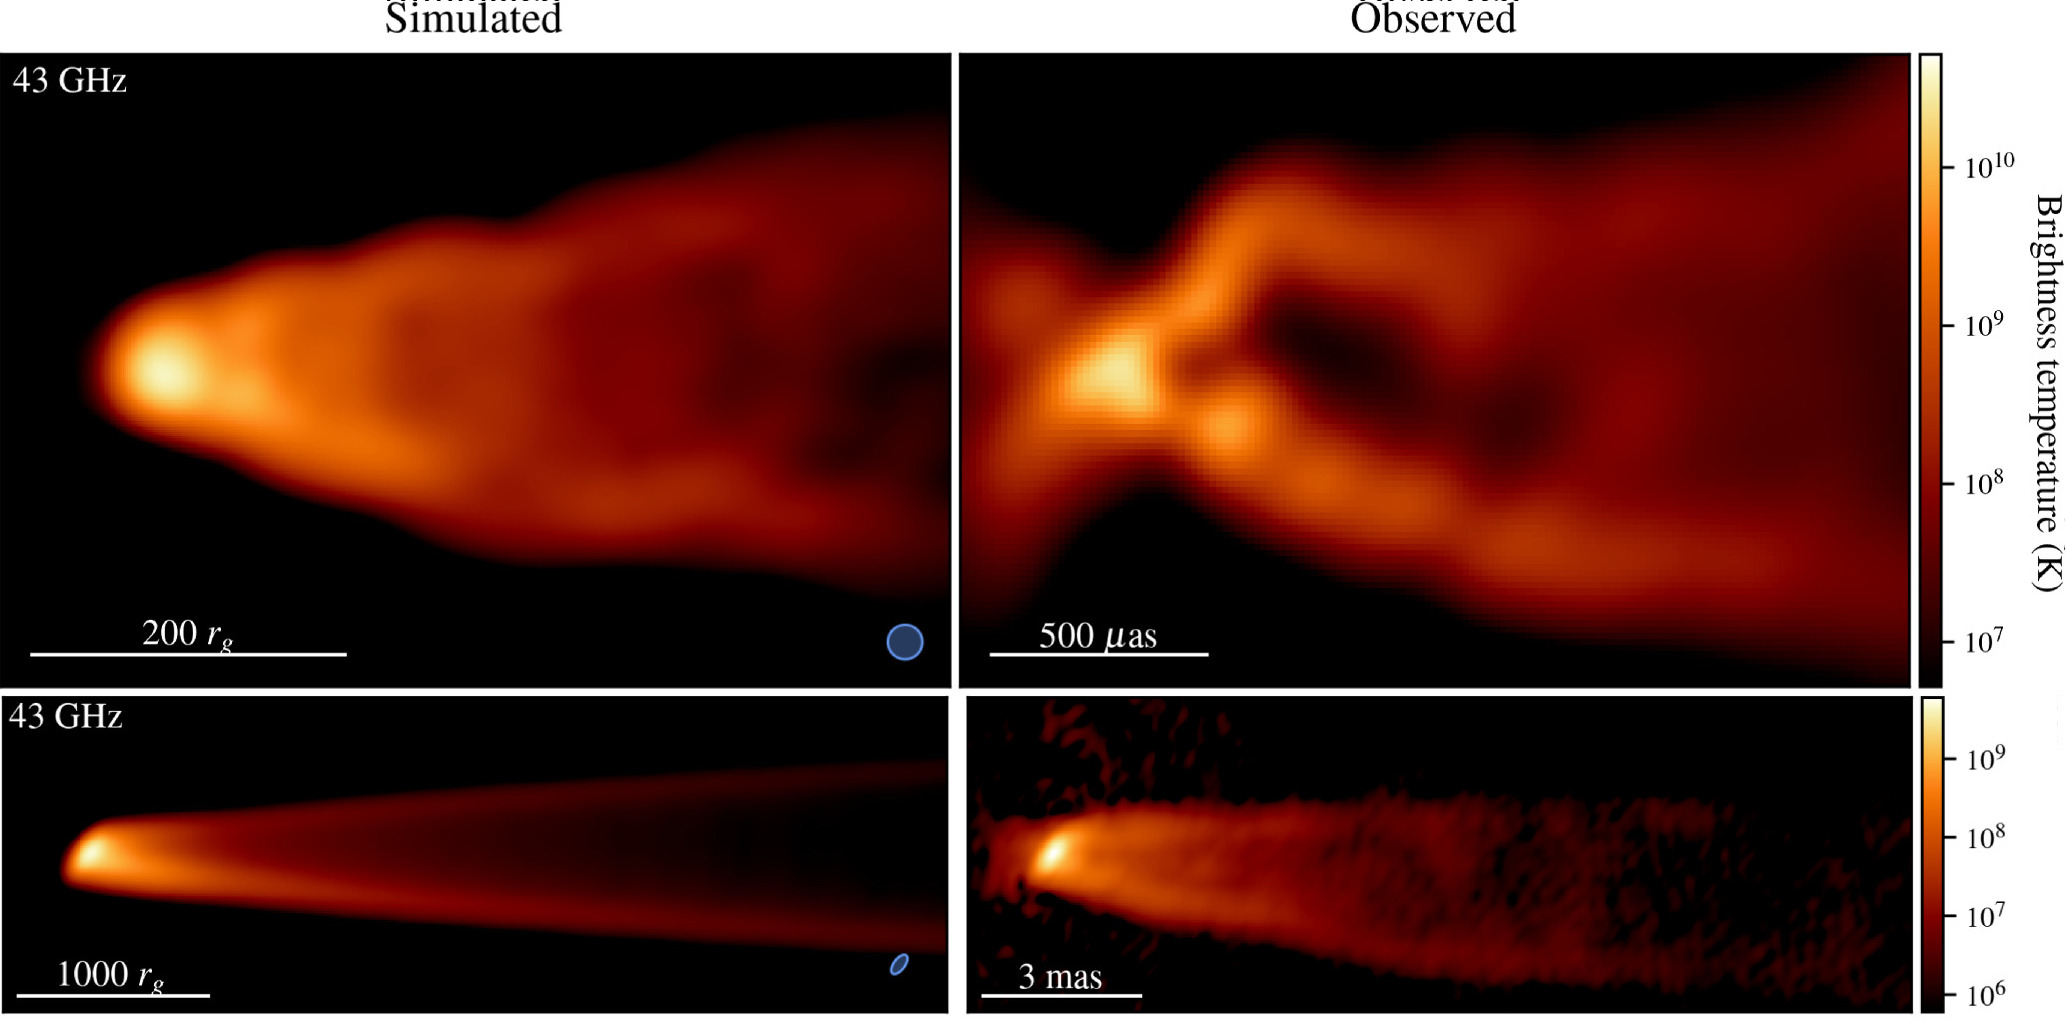
Simulated (left column) and observed (right column) jets. The top left shows the result from the GRMHD simulation and the bottom left shows the result from the GRFFE simulation. Note the difference in scale between the two simulations. Click to enlarge. [Adapted from Tsunetoe et al. 2025]
Investigating a Potential Source of Flares
Like many accreting supermassive black holes, M87* exhibits flares of high-energy radiation. These flares are highly variable, sometimes lasting only a couple of days, which suggests that they arise very close to the black hole’s event horizon. Precisely how these flares are generated is still unknown, though magnetic reconnection, in which magnetic fields rearrange and release pent-up magnetic energy, is a strong candidate.
Recently, Siddhant Solanki (University of Maryland) and collaborators investigated the source of M87*’s flares by tracing the paths of photons through a general relativistic magnetohydrodynamics simulation of an accreting spinning supermassive black hole. The simulation captured the region close to the black hole where magnetic reconnection is thought to occur, potentially launching electron–positron pairs that kick background photons up to high energies, powering a flare.
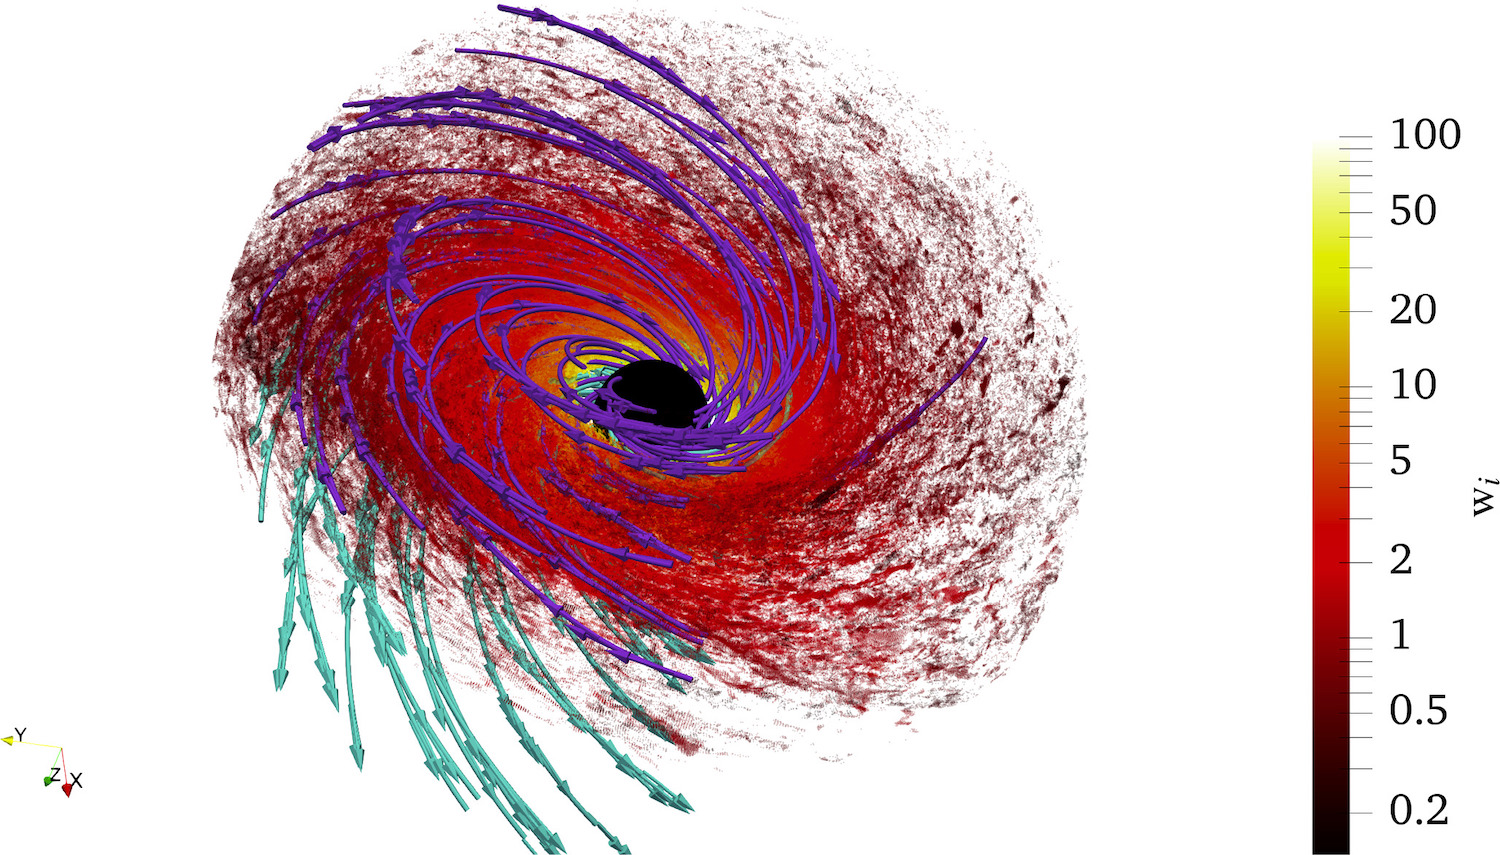
Illustration of the origin of the simulated flare emission. The majority of the emission arises from very close to the black hole. The purple and cyan curves indicate magnetic field lines. [Solanki et al. 2025]
The timescales of the simulated flares were also instructive. While the simulated flares tended to last about 130 days, each flare was composed of multiple smaller subflares, which lasted roughly as long as the rapid, ~2-day flares seen from M87*. If these flares are truly subflares arrayed within a longer-duration flare, Solanki and collaborators noted, they should have different time variability at long and short wavelengths. This suggests a need for long-term, multiwavelength monitoring of M87* to clarify the source of its flares.
Citation
“New Estimates of the Spin and Accretion Rate of the Black Hole M87*,” Michael Drew et al 2025 ApJL 984 L31. doi:10.3847/2041-8213/adc90e
“Limb-Brightened Jet in M87 from Anisotropic Nonthermal Electrons,” Yuh Tsunetoe et al 2025 ApJ 984 35. doi:10.3847/1538-4357/adc37a
“Modeling of Lightcurves from Reconnection-Powered Very High-Energy Flares from M87*,” Siddhant Solanki et al 2025 ApJ 985 147. doi:10.3847/1538-4357/adcba9
The post Monthly Roundup: The Supermassive Black Hole of Messier 87 appeared first on AAS Nova.
]]>
Astrobites reports on JWST observations of a mysterious binary quasar system from cosmic noon.
The post Duel of the Dual: The Mystery of a Quasar Pair appeared first on AAS Nova.
]]>Editor’s Note: Astrobites is a graduate-student-run organization that digests astrophysical literature for undergraduate students. As part of the partnership between the AAS and astrobites, we occasionally repost astrobites content here at AAS Nova. We hope you enjoy this post from astrobites; the original can be viewed at astrobites.org.
Title: VODKA-JWST: Synchronized Growth of Two Supermassive Black Holes in a Massive Gas Disk? A 3.8 kpc Separation Dual Quasar at Cosmic Noon with the NIRSpec Integral Field Unit
Authors: Yuzo Ishikawa et al.
First Author’s Institution: Johns Hopkins University and MIT Kavli Institute for Astrophysics and Space Research
Status: Published in ApJ
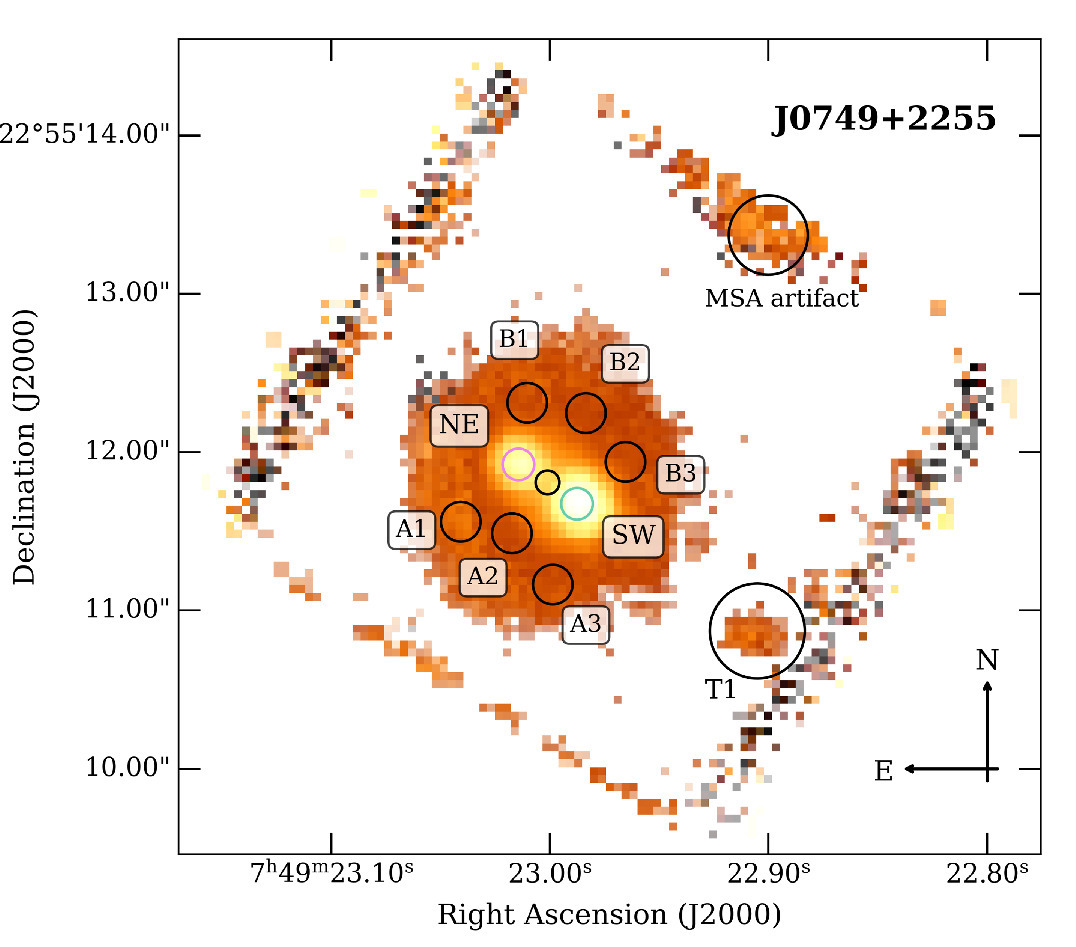
Figure 1: A map of the flux detected around the Hɑ and [NII] lines in the J0749+2255 system. The two quasars are found in the central region, denoted with “NE” and “SW.” [Adapted from Ishikawa et al. 2025]
Seeing Double?
Figure 2 shows the spectra for the SW and NE quasars, and the first thing that is impossible to ignore is just how similar they are. There are some small differences; for example, the NE quasar is slightly redder than the SW quasar, and some emission lines have different shapes and are a smidge offset from one another. But the general similarity brings up the possibility that what we’re looking at isn’t two separate quasars, but rather one object that’s being gravitationally lensed! The small differences in the spectra could be consistent with a lensing scenario, as they could be explained by time delays in the lensing or foreground contamination. A major problem with this idea, however, is that no observations of this system have provided evidence for a lens: we have not seen the massive foreground object that would actually be causing the gravitational lensing. While it’s possible that the lens is just incredibly faint, there’s no smoking gun for lensing happening here.
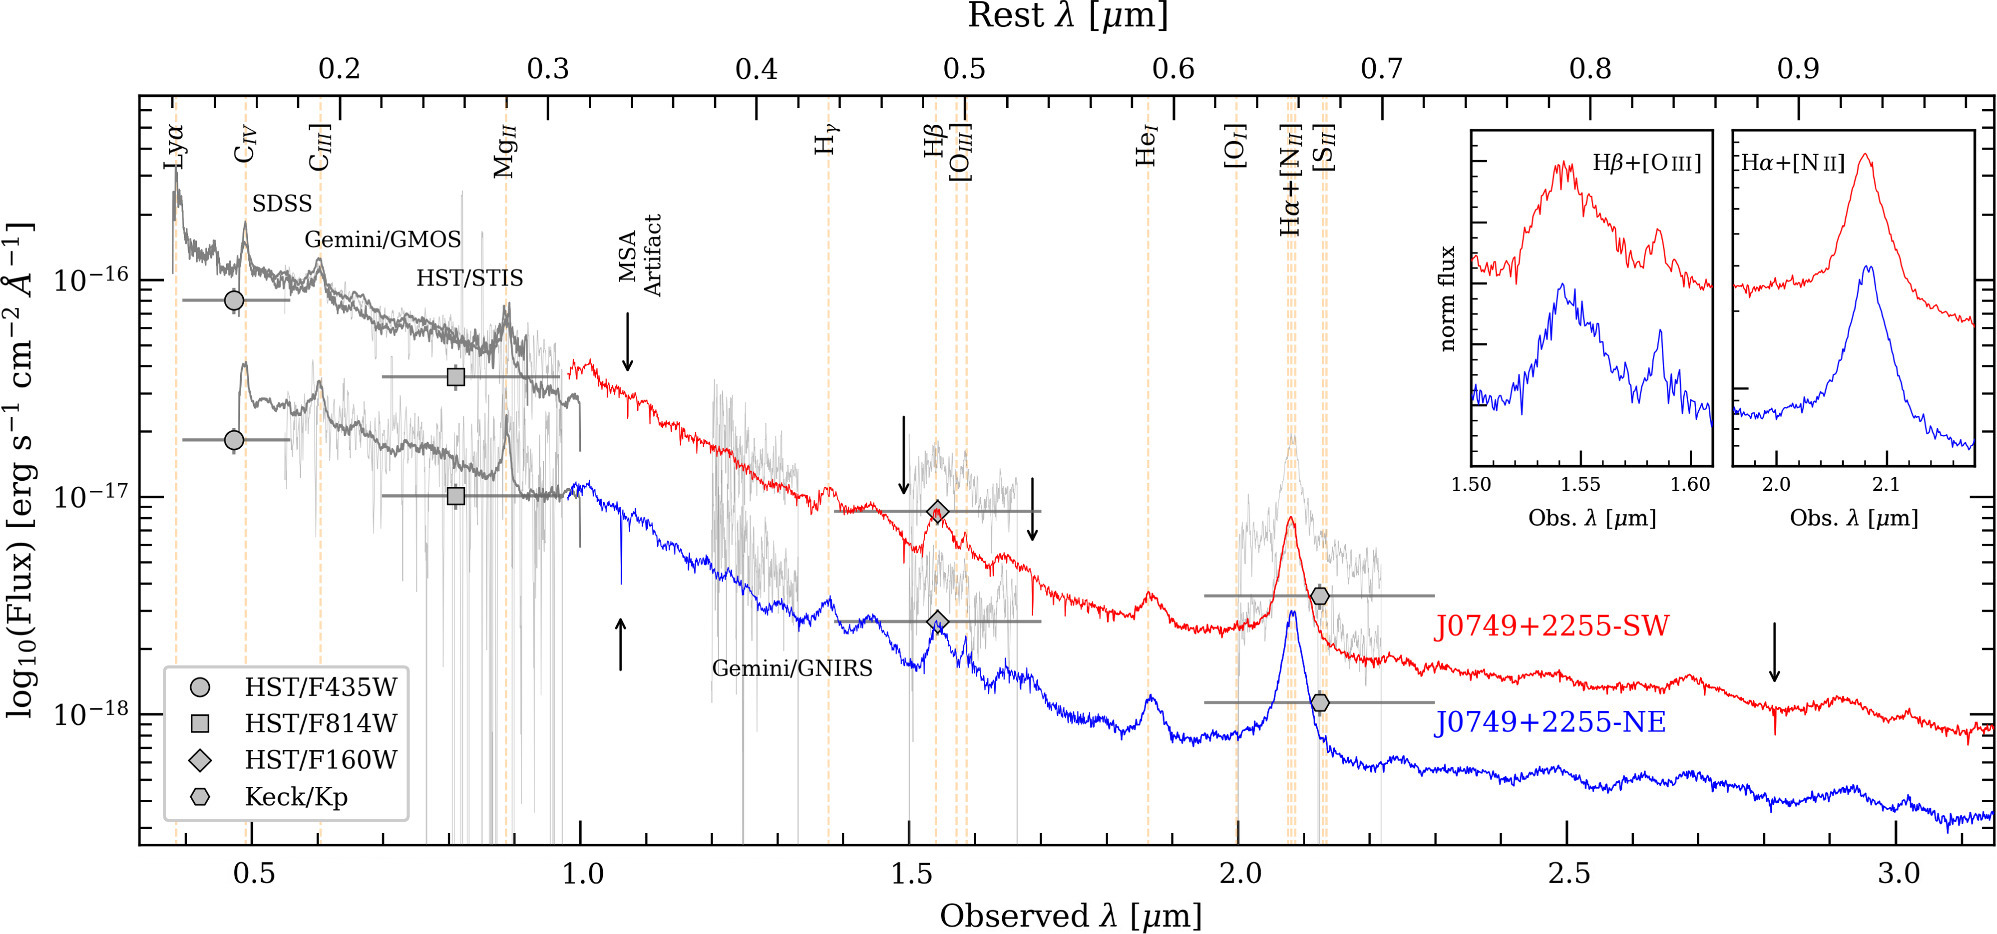
Figure 2: Spectral observations of the two quasars, vertically offset for clarity. The blue and red curves represent JWST observations, with the gray lines representing observations from previous works with other telescopes. The JWST results shown here demonstrate the remarkable similarity between the two quasars. [Adapted from Ishikawa et al. 2025]
Disk Gas Enters the Chat
The story becomes even more complicated when you look beyond the quasars, as JWST observations also detected diffuse emission from gas as shown in Figure 3. This gas is at the same redshift as the quasars, and can thus be associated with their host galaxy. And crucially, this gas doesn’t show any signs of lensing, such as the distinct arcs or symmetry you find in other lensed systems. This, coupled with the differences in the quasar spectra, suggests that this is not a lensed system, and that in fact we are looking at two different quasars.
Figure 3: Maps of Hɑ emission with the quasar contributions removed. Left panel shows the flux, middle shows the velocity dispersion, and right the radial velocity. The radial velocity measurements provide strong evidence for a disk with gas rotation and relatively little disturbance, which is not usually the case for merger environments. [Ishikawa et al. 2025]
However, this story is complicated by the dynamics within the gas surrounding the quasars. As shown in the rightmost panel of Figure 3, the quasars are embedded in a gas disk that’s rotating, with one half of the gas being redshifted and the other half blue shifted. The quasars aren’t separated into these two regions, but are rather both found at the center of the disk. And the gas is showing none of the kinematic disturbance we would expect during a major merger, as the disk seems to be relatively stable. So maybe we’re not witnessing a merger in progress, but rather a disk galaxy that is playing host to two quasars! Based on simulations, one way this could happen is if a major merger takes place at an earlier time, and two black holes form from the resulting instabilities. This is another possible explanation for why the quasars are so similar.
Overall, this work points to the complicated nature of dual quasar systems. Is this one quasar being lensed or two different quasars? If they are distinct objects, are we witnessing a merger of galaxies, or did they both form in one galaxy? Future observations may be the key to answering these questions, but for now it remains a very interesting system.
Original astrobite edited by Hillary Andales.
About the author, Skylar Grayson:
Skylar Grayson is an astrophysics PhD candidate and NSF Graduate Research Fellow at Arizona State University. Her primary research focuses on active galactic nucleus feedback processes in cosmological simulations. She also works in astronomy education research, studying online learners in both undergraduate and free-choice environments. In her free time, Skylar keeps herself busy doing science communication on social media, playing drums and guitar, and crocheting!
The post Duel of the Dual: The Mystery of a Quasar Pair appeared first on AAS Nova.
]]>
The troubles continue for planets around the smallest and coolest stars: new research suggests that it's even harder than previously suspected for these planets to hold on to their atmospheres.
The post Planets Around Small Stars Even Less Likely to Have Atmospheres Than Previously Thought appeared first on AAS Nova.
]]>Which of the nearly 6,000 known exoplanets have atmospheres? New research suggests that small, rocky planets around the smallest and coolest stars are even less likely to hang on to their atmospheres than suggested by previous research. This result will help to guide the selection of target exoplanets for atmospheric characterization.
Approaching a Milestone
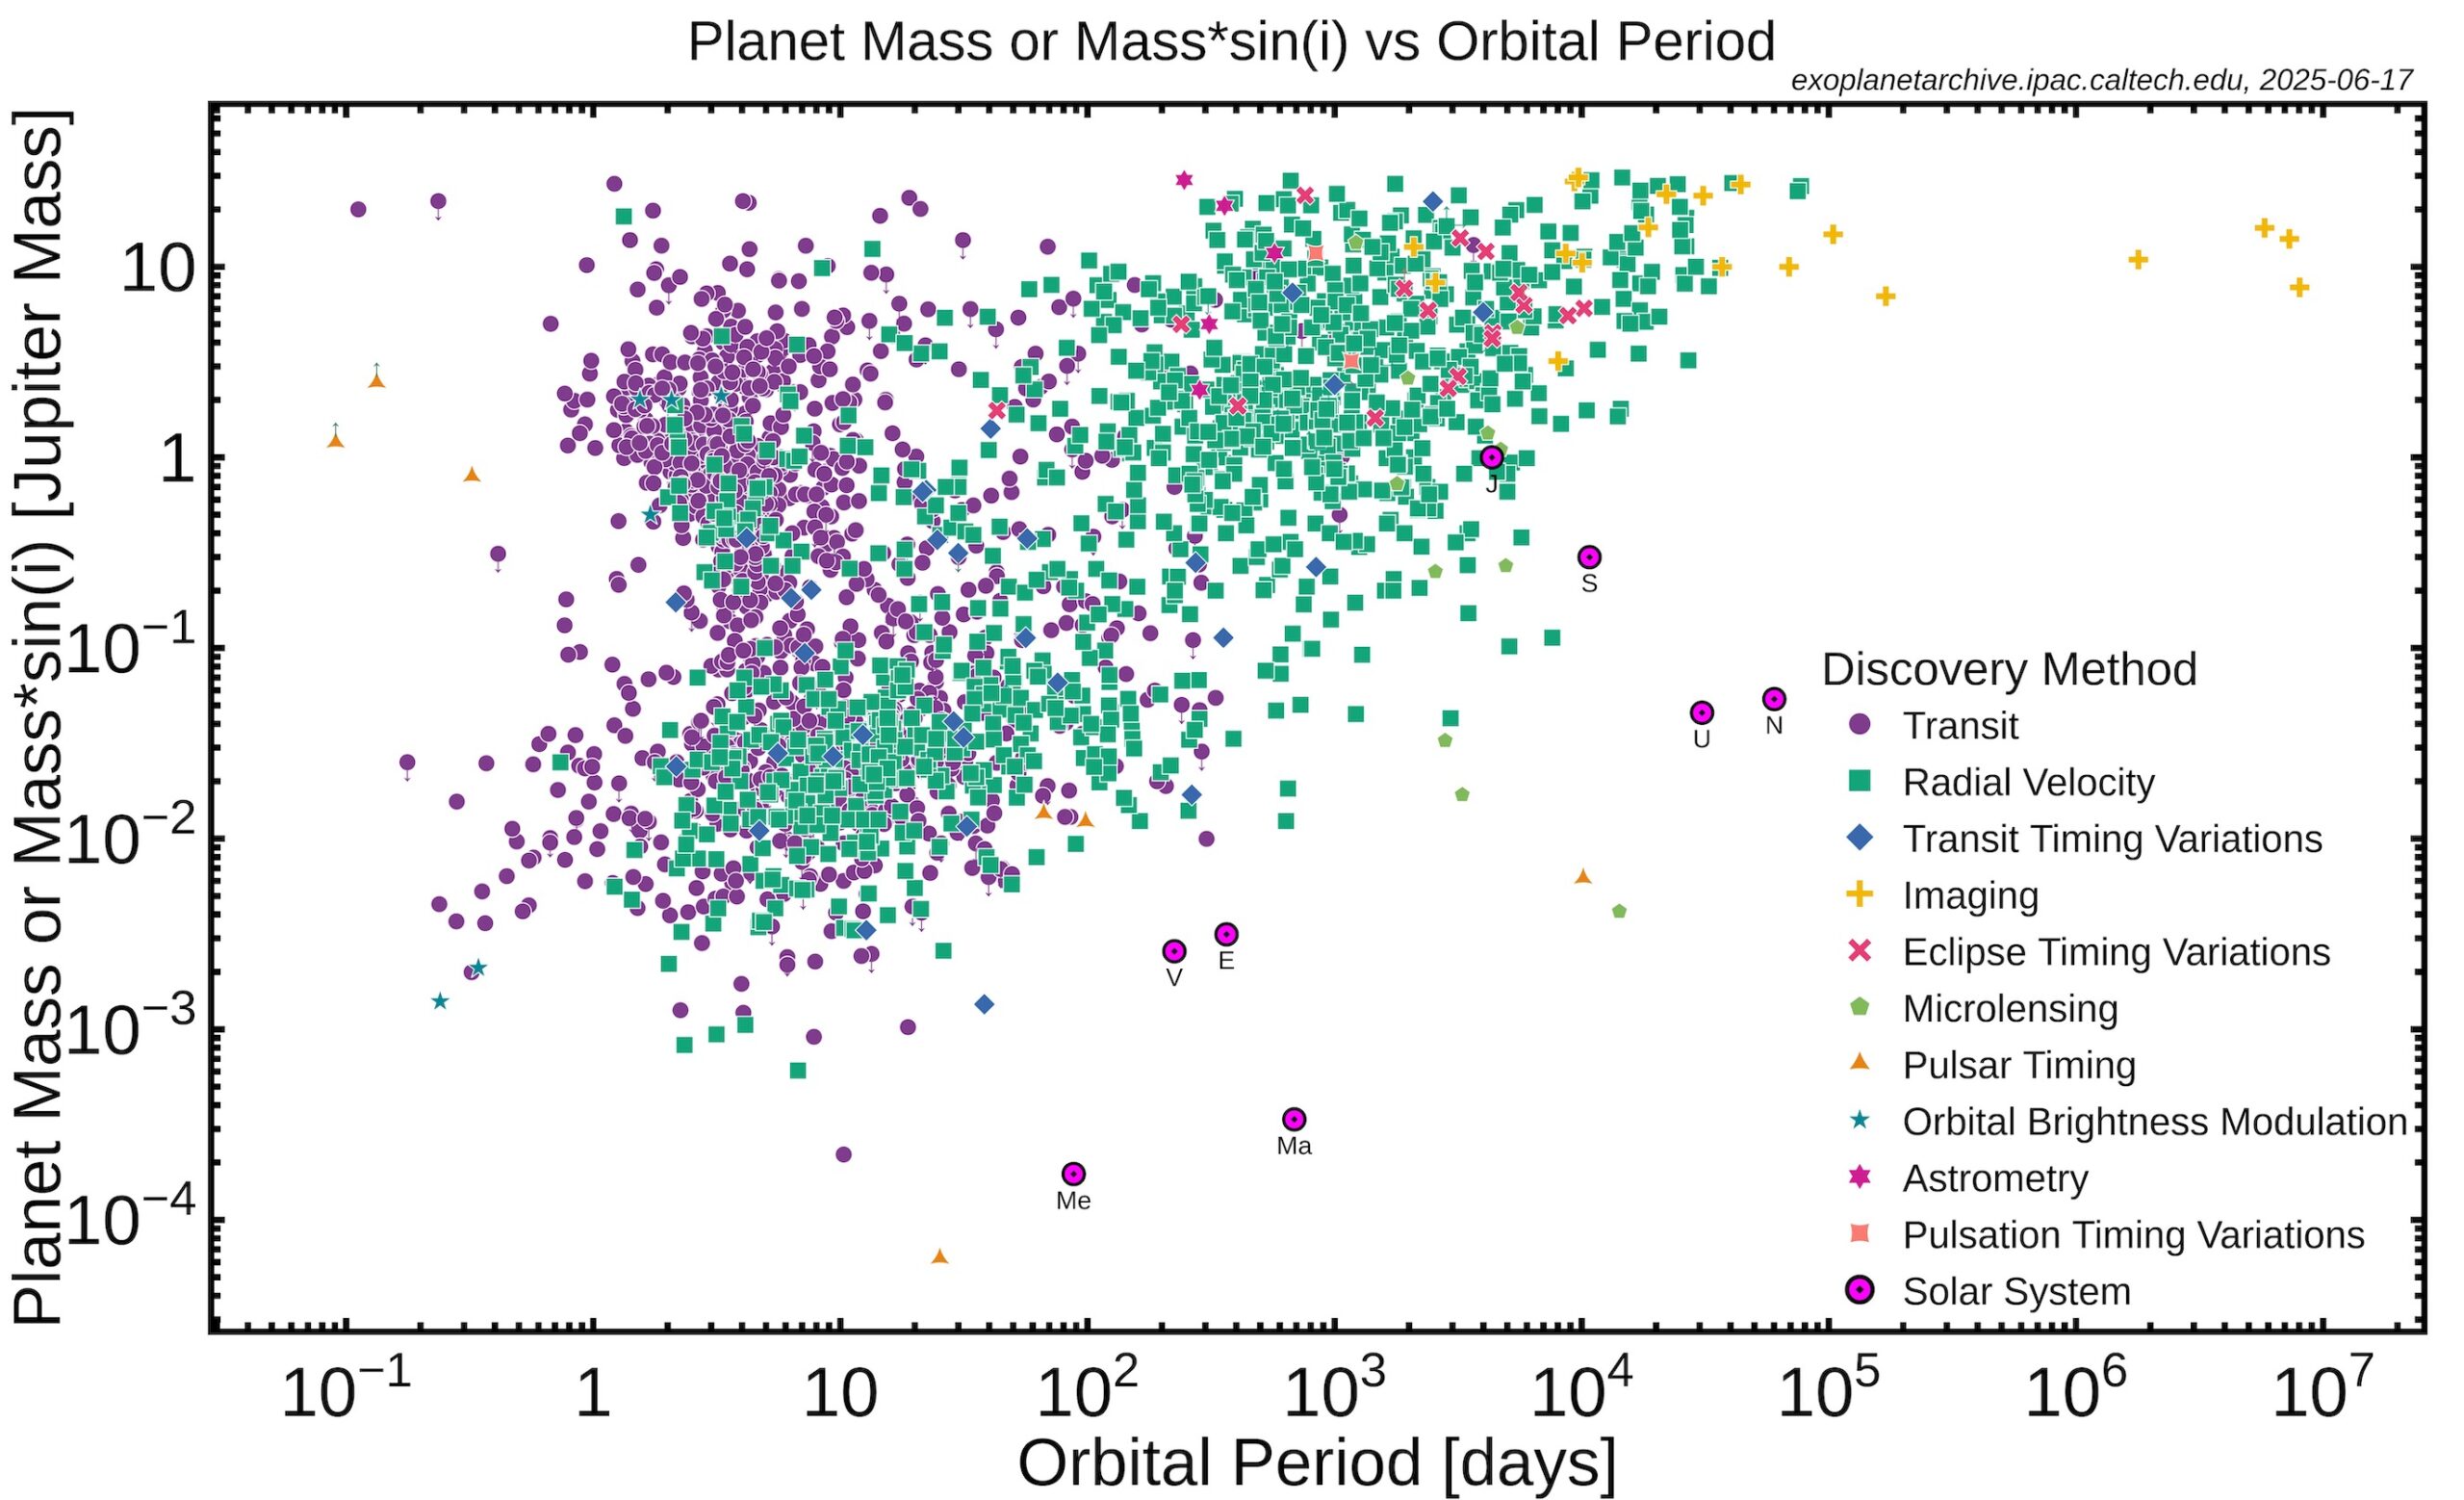
Mass, period, and detection method for confirmed exoplanets as of 17 June 2025. Click to enlarge. [Exoplanet Archive/Caltech/NASA]
When seeking planets with atmospheres, researchers must consider how a planet has fared in its lifelong battle between gravity and radiation. Massive planets orbiting calm stars are more likely to have atmospheres than lightweight planets around active stars. Astronomers define the cosmic shoreline as the dividing line between planets with atmospheres and planets without, in terms of escape velocity and the extreme-ultraviolet flux of the star.
Charting the Cosmic Shoreline
To predict on which side of the cosmic shoreline a particular planet lies, it’s not enough to know the current extreme-ultraviolet flux of its host star. A star’s extreme-ultraviolet flux changes over time, and integrating these changes over the lifetime of a planet yields its position along the shoreline. In a new research article, Emily Pass (Massachusetts Institute of Technology) and collaborators have suggested that this integration hasn’t been performed correctly for certain planets.
Rotation periods of M dwarfs with masses less than 0.3 solar mass. The lack of M dwarfs with rotation periods between 9 and 50 days suggests a rapid transition between the two regimes. Click to enlarge. [Pass et al. 2025]
Crossing the Line
Pass’s team estimated the flux of mid-to-late M dwarfs during two phases of their lives: the “saturated” phase, during which the stars rotate rapidly and their high-energy flux does not scale with their rotation rate, and the “unsaturated” phase, during which the high-energy flux declines as the rotation rate slows. The team consulted the literature to find the X-ray flux of M dwarfs during the two phases, then used a statistical approach to estimate how long the stars spend in each of these phases. The team also considered the impact of stellar flares as well as the stars’ lengthy pre-main-sequence phase, during which their overall luminosity is higher than it is once the star has fully contracted and begun its main-sequence lifetime.
Previous and new positions of known exoplanets orbiting mid-to-late M dwarfs relative to the cosmic shoreline. Click to enlarge. [Pass et al. 2025]
Citation
“The Receding Cosmic Shoreline of Mid-to-Late M Dwarfs: Measurements of Active Lifetimes Worsen Challenges for Atmosphere Retention by Rocky Exoplanets,” Emily K. Pass et al 2025 ApJL 986 L3. doi:10.3847/2041-8213/adda39
The post Planets Around Small Stars Even Less Likely to Have Atmospheres Than Previously Thought appeared first on AAS Nova.
]]>
Astrobites reports on the famous Bullet Cluster — what JWST observations reveal about its complex merger history and the constraints these observations place on self-interacting dark matter.
The post NCIS JWST: Analyzing the Aftermath of the Bullet Cluster’s Collision appeared first on AAS Nova.
]]>Editor’s Note: Astrobites is a graduate-student-run organization that digests astrophysical literature for undergraduate students. As part of the partnership between the AAS and astrobites, we occasionally repost astrobites content here at AAS Nova. We hope you enjoy this post from astrobites; the original can be viewed at astrobites.org.
Title: A High-Caliber View of the Bullet Cluster Through JWST Strong and Weak Lensing Analyses
Authors: Sangjun Cha et al.
First Author’s Institution: Yonsei University
Status: Published in ApJL
Despite the extreme depth and resolution of JWST observations, there’s still no smoking gun to be found in the hunt for dark matter. Yet, the extremely high-velocity collision in today’s article might aid in the search for what this mysterious material is made of. The target of today’s article is the Bullet Cluster (Figure 1). Despite its name, the Bullet Cluster is not one, but actually two massive clusters of galaxies gravitationally interacting with one another. Due to the high speed with which the smaller “bullet” subcluster collided and passed through the larger one, a strong bow shock caused the gas in the system to compress and heat to millions of degrees. Typically, this alone would make this system interesting to astronomers, but the real kicker here is that this collision was powerful enough to separate the dark matter from the normal, luminous matter. This has made the Bullet Cluster an important testing ground for theories on the nature of dark matter and is exactly what the authors of today’s article attempt to use it for.
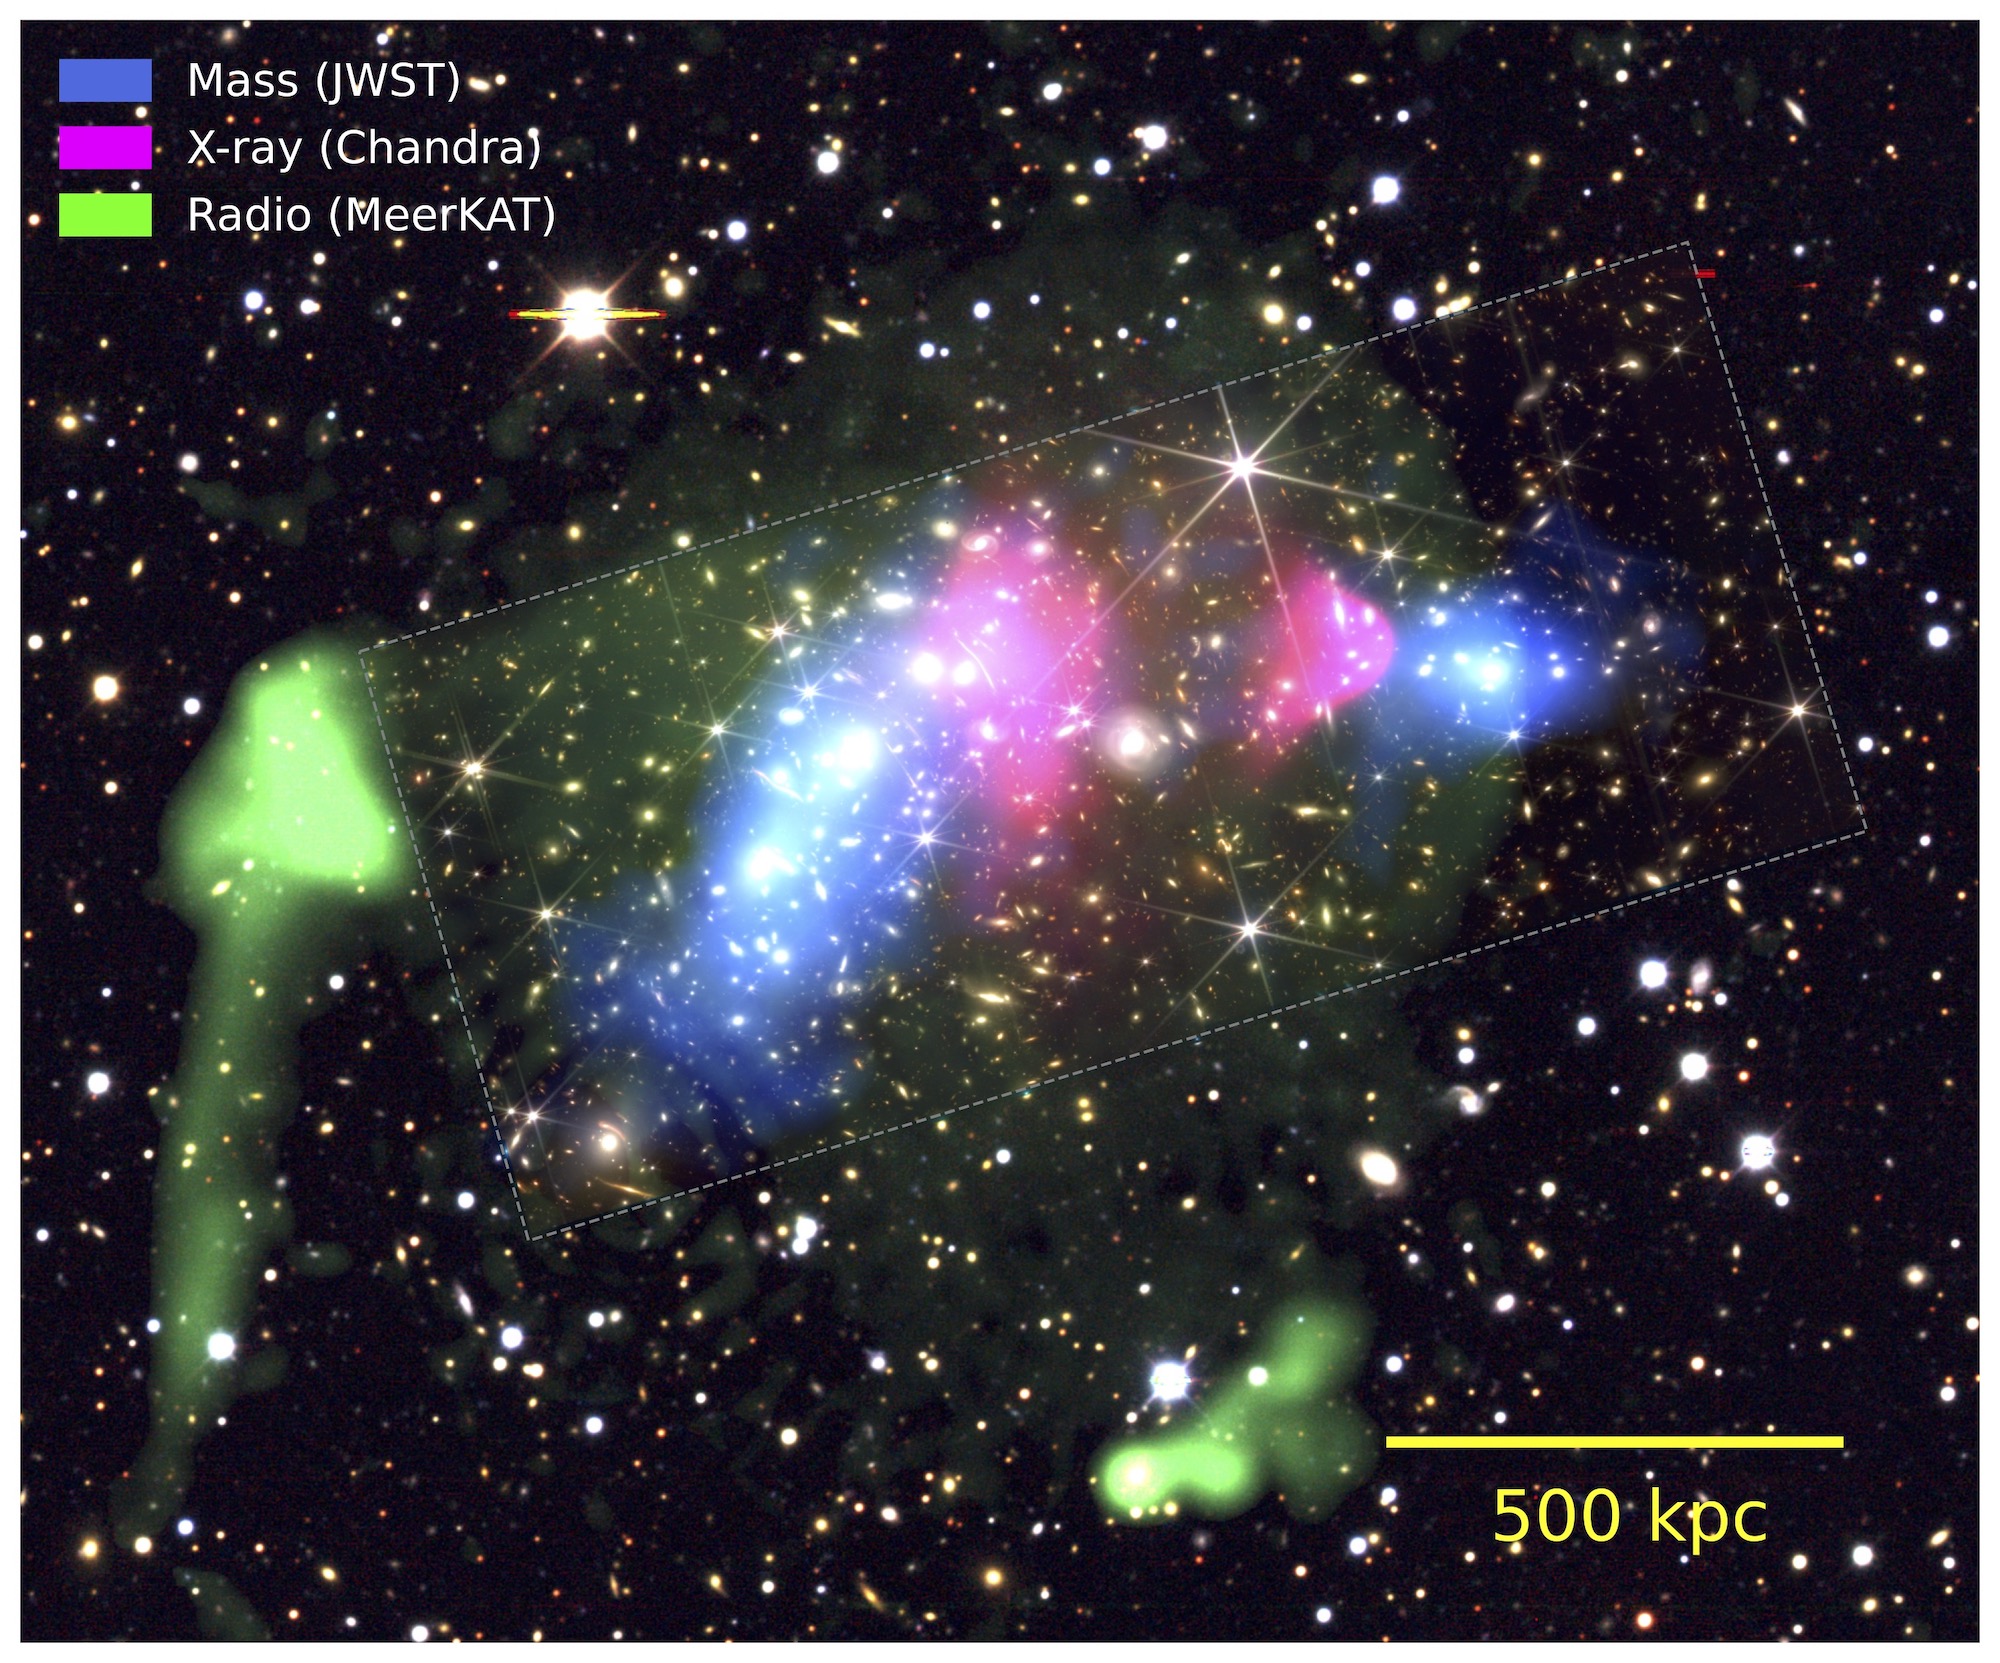
Figure 1: The Bullet Cluster, colour coded based on the strong and weak lensing–based mass reconstruction (blue/JWST), X-ray intensity (pink/Chandra), and radio intensity (green/MeerKAT) using three different telescopes. The dashed rectangle indicates JWST’s smaller field of view compared to Chandra and MeerKAT. [Cha et al., in press]
Mapping Hidden Mass
The authors used JWST imaging of the majority of the Bullet Cluster system to obtain high-resolution, multi-wavelength data. They then identified over 146 areas in the image subject to strong lensing, which is when the light from a background galaxy is bent around mass in the foreground Bullet Cluster system, since that mass distorts spacetime. They also obtained a weak lensing model for the image through statistical analysis, since the effects of weak lensing, while similar, are much more subtle than strong lensing. They then created a mass map for the system by feeding their strong lensing and weak lensing model into a reconstruction algorithm. Essentially, this algorithm creates the most likely distribution of mass, both dark matter and normal matter, that would re-create all the lensing that they observed.
What’s special about the algorithm that they used here is that it does not assume that light traces mass. In general, this assumption is correct, so other algorithms use it to get the most accurate mass estimate. But the authors here wanted to confirm that even in extreme environments like the Bullet Cluster that this is still the case, so they sent their algorithm in “blind.”
Comparing How the Light Traces the Dark
Once they had their mass map, which is dominated mostly by the dark matter in the system, they could compare it to the optical light between the system’s galaxies, referred to as the intracluster light (ICL). They used a statistical test called the modified Hausdorff distance to determine how similar the distribution of ICL and dark matter were to each other. They found that, despite the extreme gravitational interactions going on in the Bullet Cluster, the ICL still does an excellent job overall of tracing the system’s mass (see Figure 2).
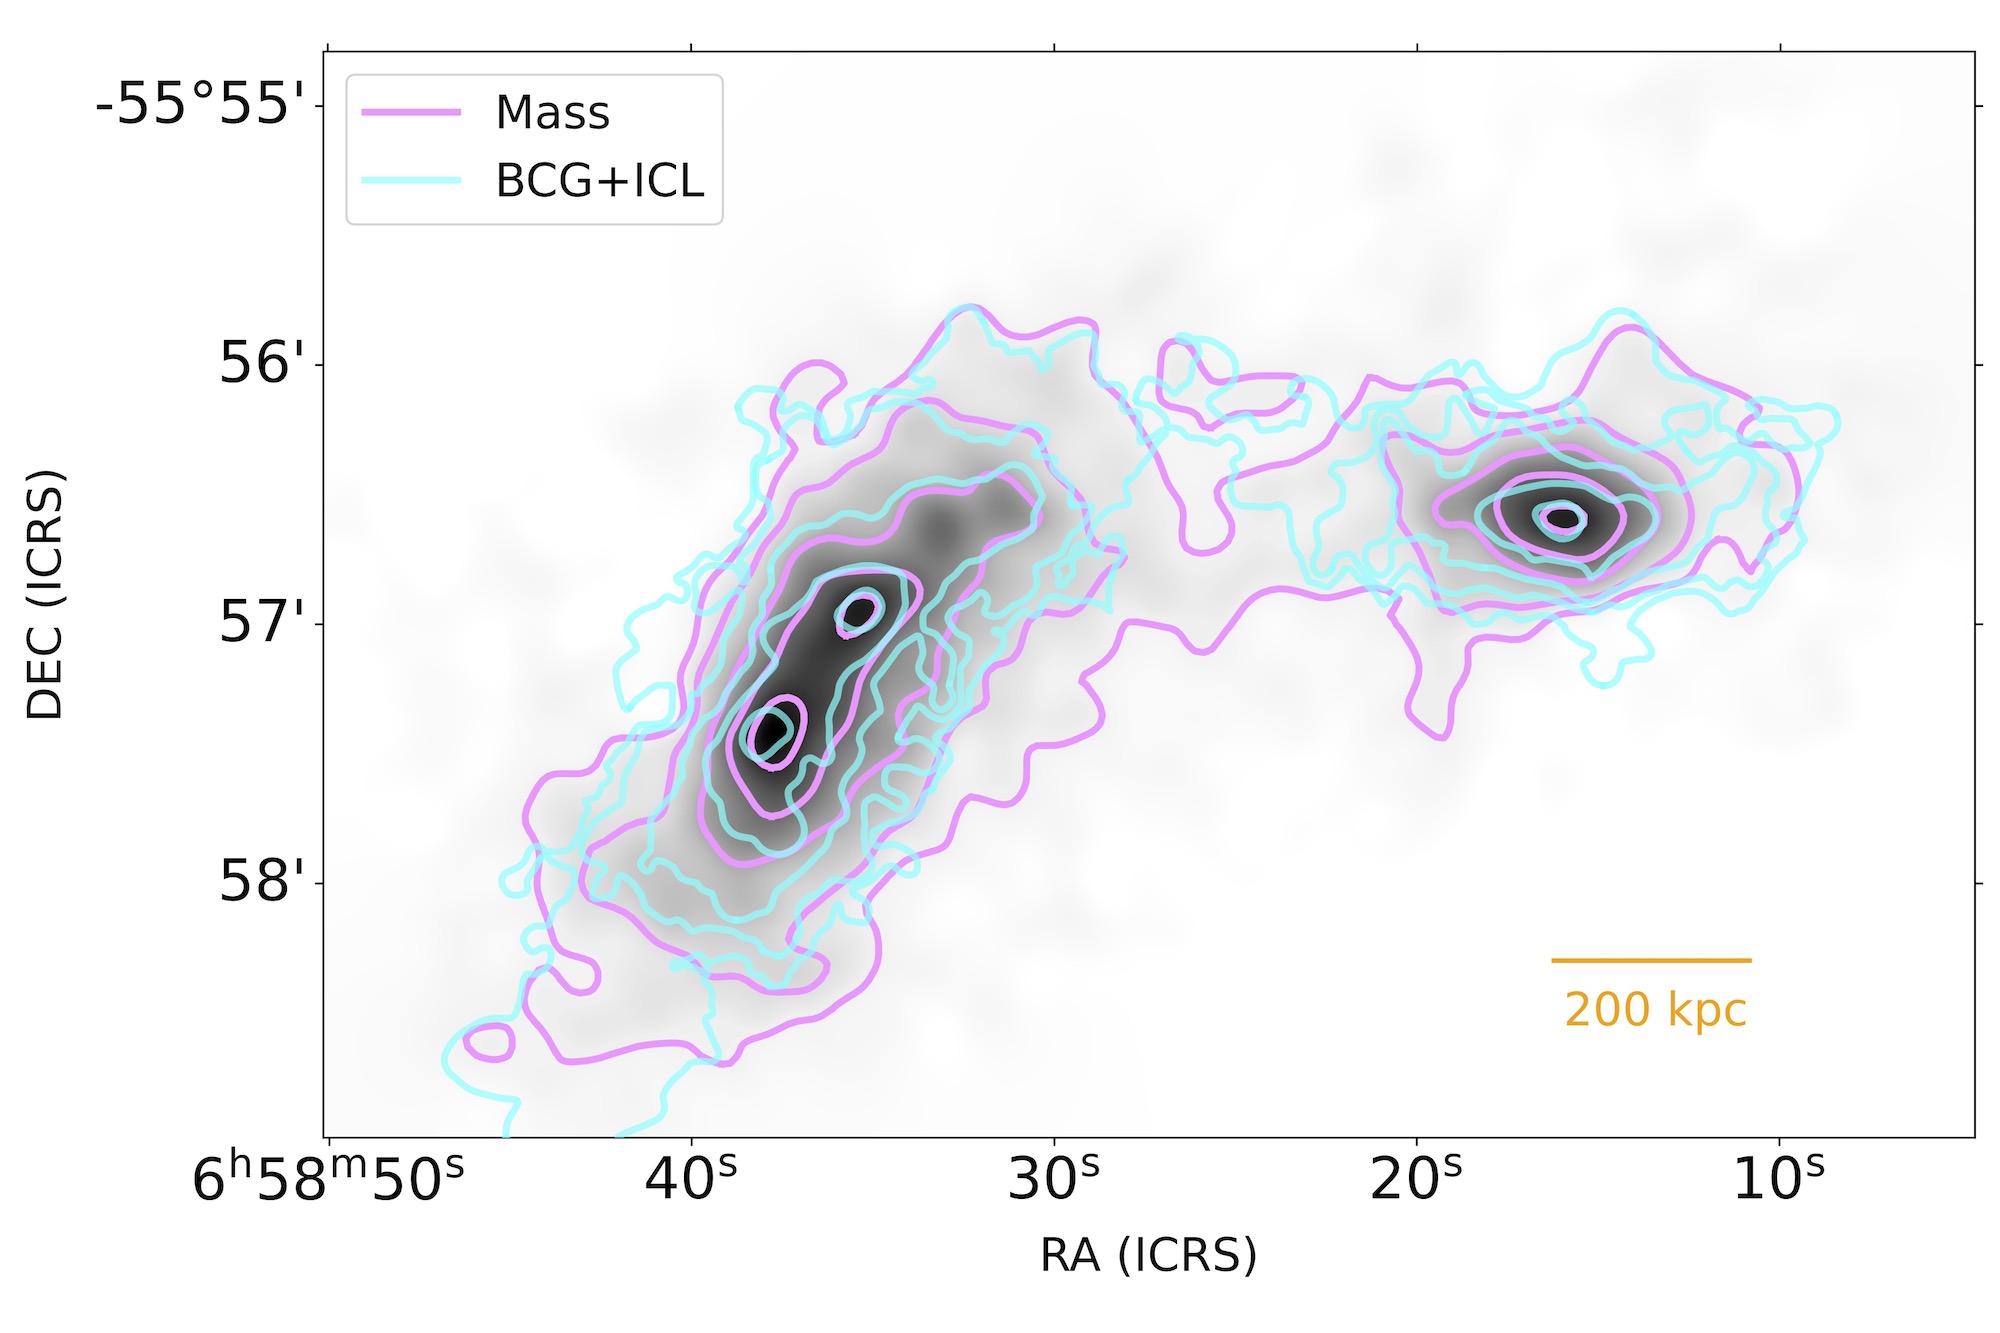
Figure 2: Comparison of the dark matter mass map from the strong and weak lensing data (pink) and the distribution of light from the ICL and the most massive galaxy, also known as the brightest cluster galaxy (BCG), combined (blue). Note how the bottom-most centroid’s dark matter and ICL contours are offset from one another. [Cha et al., in press]
What a Massive Cluster Tells Us About a Tiny Particle
Finally, the authors were able to use their mass map to put some constraints on one of the theories of dark matter: self-interacting dark matter. If dark matter particles interact with each other, then they have a cross section that can be calculated. Here, the authors calculate it from the offset between the position of the most massive galaxy in the Bullet Cluster and the position of the highest density of dark matter, which is about 60,000 light-years (see Figure 2). They were able to determine that the upper limit of this cross section is 0.5 cm2/g. This is the tightest constraint on self-interacting dark matter’s cross section to date, but we still have that pesky “per gram” in our units since we don’t know the mass of a dark matter particle (but this is being studied!).
This cross section is near the lower limit of what is thought to be a reasonable range for self-interacting dark matter theories (about 0.5–2 cm2/g), but it certainly doesn’t rule anything out. For further context, when dividing by mass, the cross section of a hydrogen atom is about 1.7×107 cm2/g, which is much bigger, but we would expect that when comparing an atom to a potential subatomic dark matter particle.
Altogether, the authors of this article were able to use both the precision of JWST and the impartiality of their mass-reconstruction algorithm to learn new things about both the structure of the Bullet Cluster and the nature of dark matter. Although there are still some open questions that will need to be answered, this study certainly is not just a shot in the dark!
Original astrobite edited by Maggie Verrico.
About the author, Veronika Dornan:
Veronika is a final-year PhD candidate at McMaster University. Her research is in observations of extragalactic globular star clusters and what they can tell us about galaxy evolution and dark matter distribution in the universe.
The post NCIS JWST: Analyzing the Aftermath of the Bullet Cluster’s Collision appeared first on AAS Nova.
]]>
Recent observations of a well-studied but confounding galaxy provide new insights into the structure of low-luminosity active galactic nuclei.
The post XRISM Spies the Remains of a Galactic Donut appeared first on AAS Nova.
]]>New X-ray observations reveal the potential remnant of a dusty torus in the galaxy Messier 81. These observations help to advance our knowledge of low-luminosity active galactic nuclei, a population of accreting black holes that is still poorly understood.
Understanding Accretion
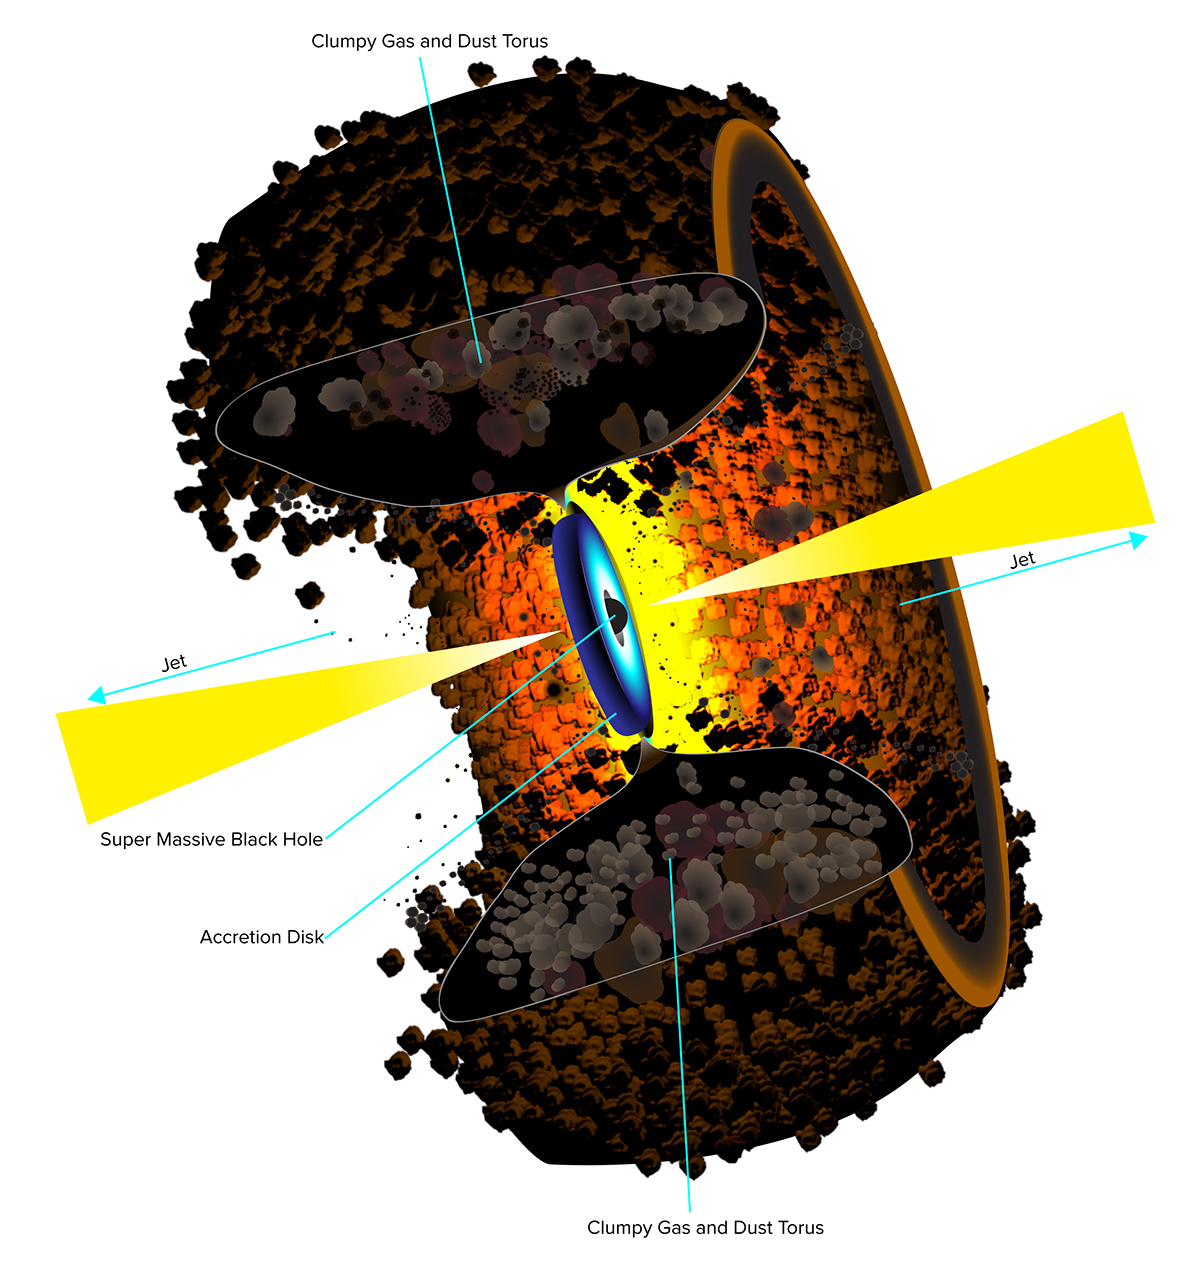
A diagram of the unified model of active galactic nuclei, showing an accretion disk, dusty torus, and jets. It’s not yet clear if LLAGNs conform to this model. [B. Saxton NRAO/AUI/NSF; CC BY 4.0]
Given how common it is for black holes to occupy this low-luminosity state, it’s critical to understand whether these systems are structured according to the typical picture of an active galactic nucleus, with a compact accretion disk surrounded by a dusty, donut-shaped torus. To probe the details of the LLAGN state, a team led by Jon Miller (University of Michigan) has turned to one of the best-studied — but still poorly understood — objects in this class.
Meet Messier 81
Just 12 million light-years away, the spiral galaxy Messier 81 is home to the nearest and brightest LLAGN. Messier 81’s central black hole was selected for observation during the 6-month Performance Verification phase of the X-ray Imaging and Spectroscopy Mission (XRISM), which launched in 2023. Messier 81 is the first LLAGN to be observed with a microcalorimeter, a type of instrument that detects photons by measuring minuscule changes in the temperature of the detector.
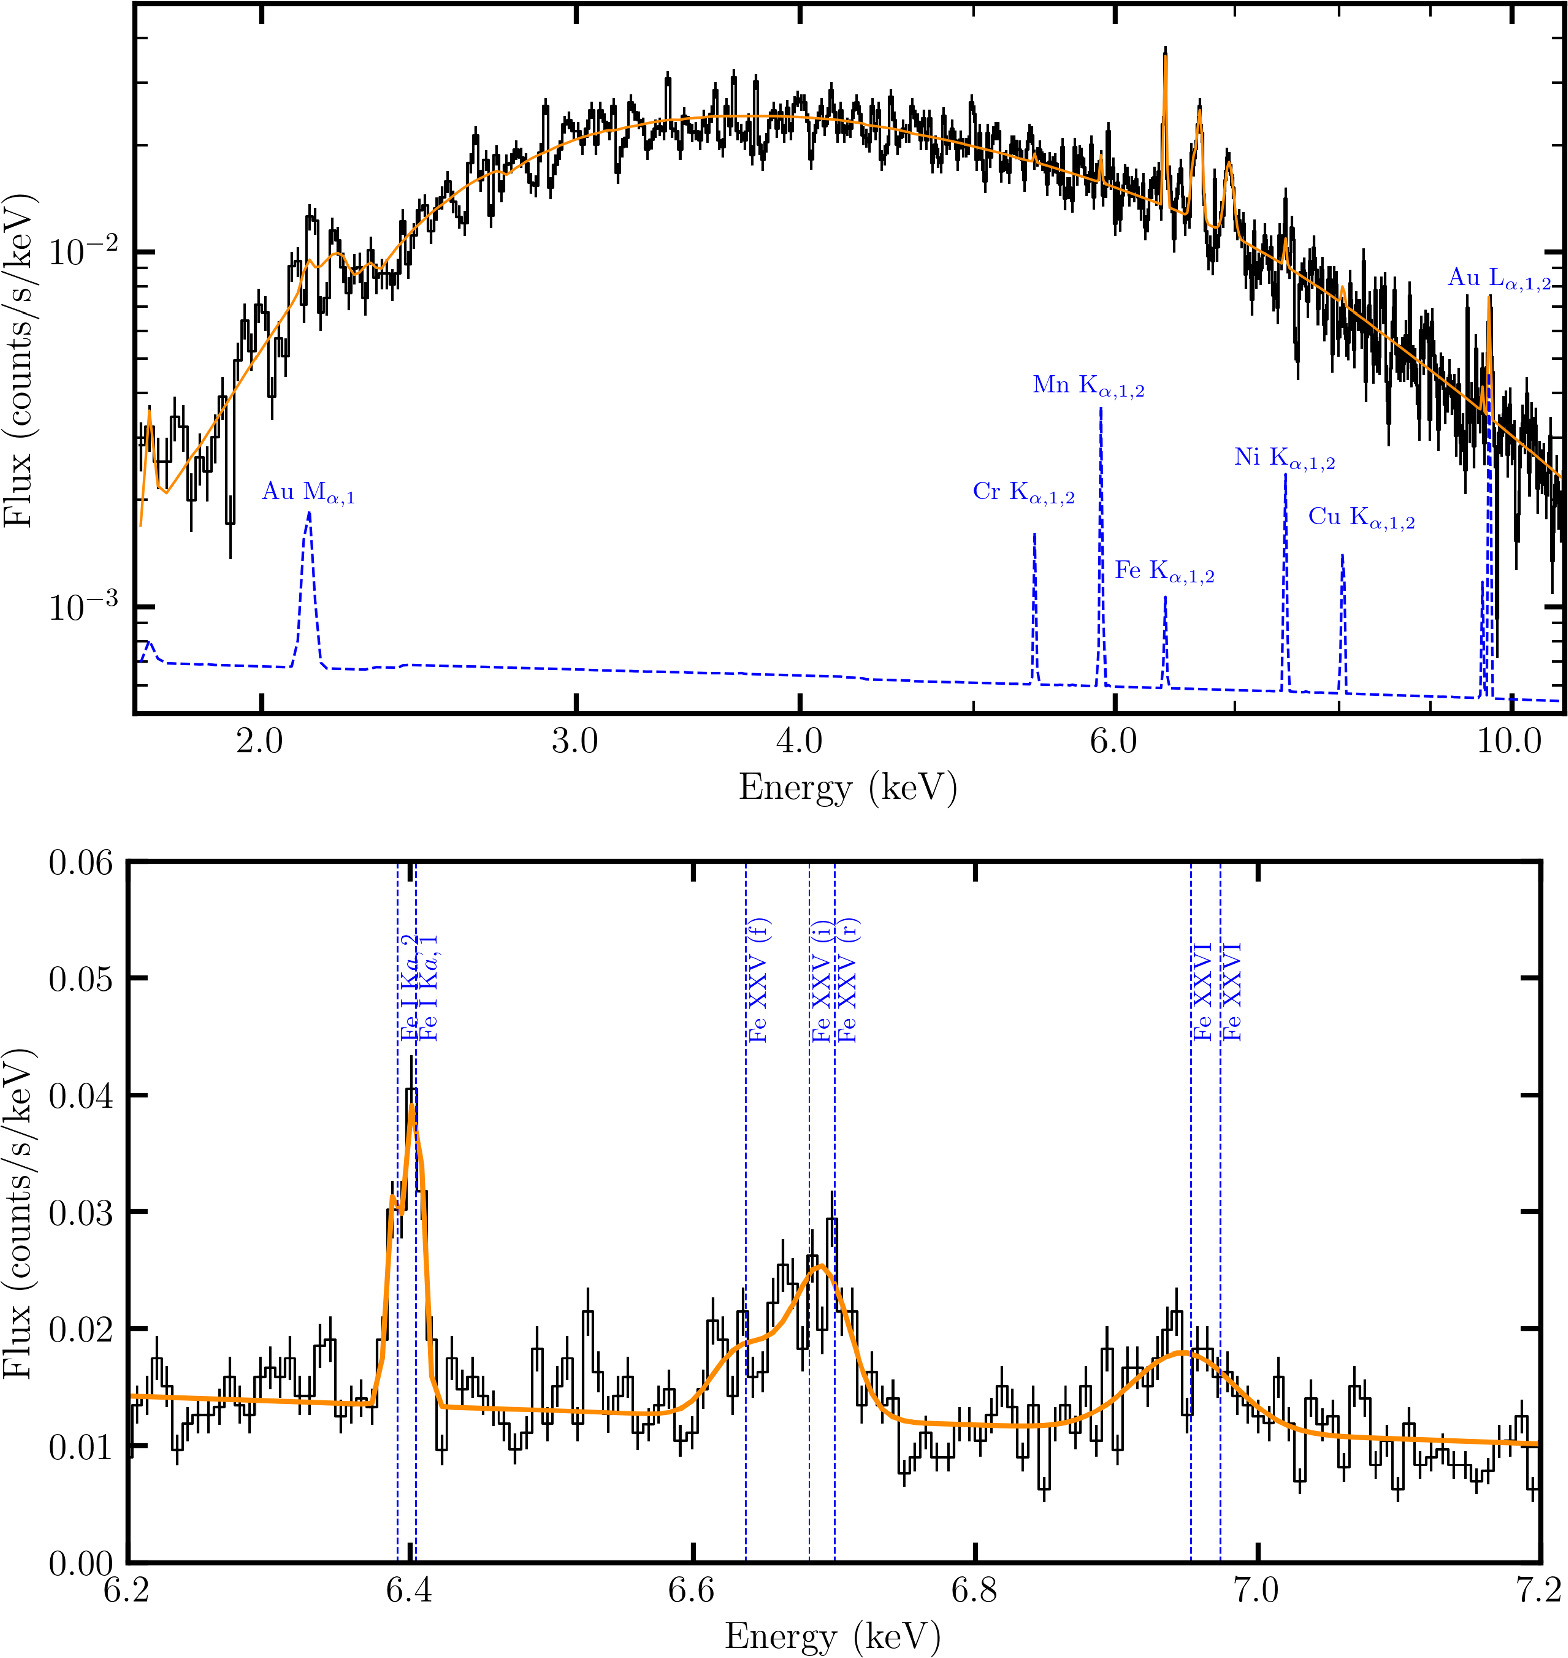
XRISM spectrum of Messier 81’s nucleus (black line). The blue line shows the expected non-X-ray background. The bottom panel zooms in on the iron Kα line and several lines from highly ionized iron. Click to enlarge. [Miller et al. 2025]
Investigating a Diagnostic Line
The iron Kα line appears in the spectra of many active galactic nuclei, and it’s key to understanding whether LLAGNs like this one have the same accretion disk and torus structure as more vigorously accreting active galactic nuclei.
Modeling of the XRISM data suggests that the iron Kα line arises from material no closer than 27,000 gravitational radii from the black hole — a large distance compared to a typical compact accretion disk that closely rings the black hole. Miller and collaborators suggest that the likeliest explanation for the origin of the iron Kα emission is the remnant of a dusty torus that is only lightly obscuring the central accretion disk. This is in line with the hypothesis that LLAGNs are winding down from a higher-luminosity state, and that they maintain certain structures (i.e., a torus) from that highly active state as their accretion rate slows.
The team found that it’s also possible for the emission to arise from an accretion disk whose inner edge lies far from the black hole, in agreement with the predictions of an accretion model called radiatively inefficient accretion flow. The XRISM data didn’t place strong constraints on another possible accretion model, the magnetically arrested disk model. Future observations that either probe more deeply or attempt to detect variability could better illuminate the structure surrounding the black hole.
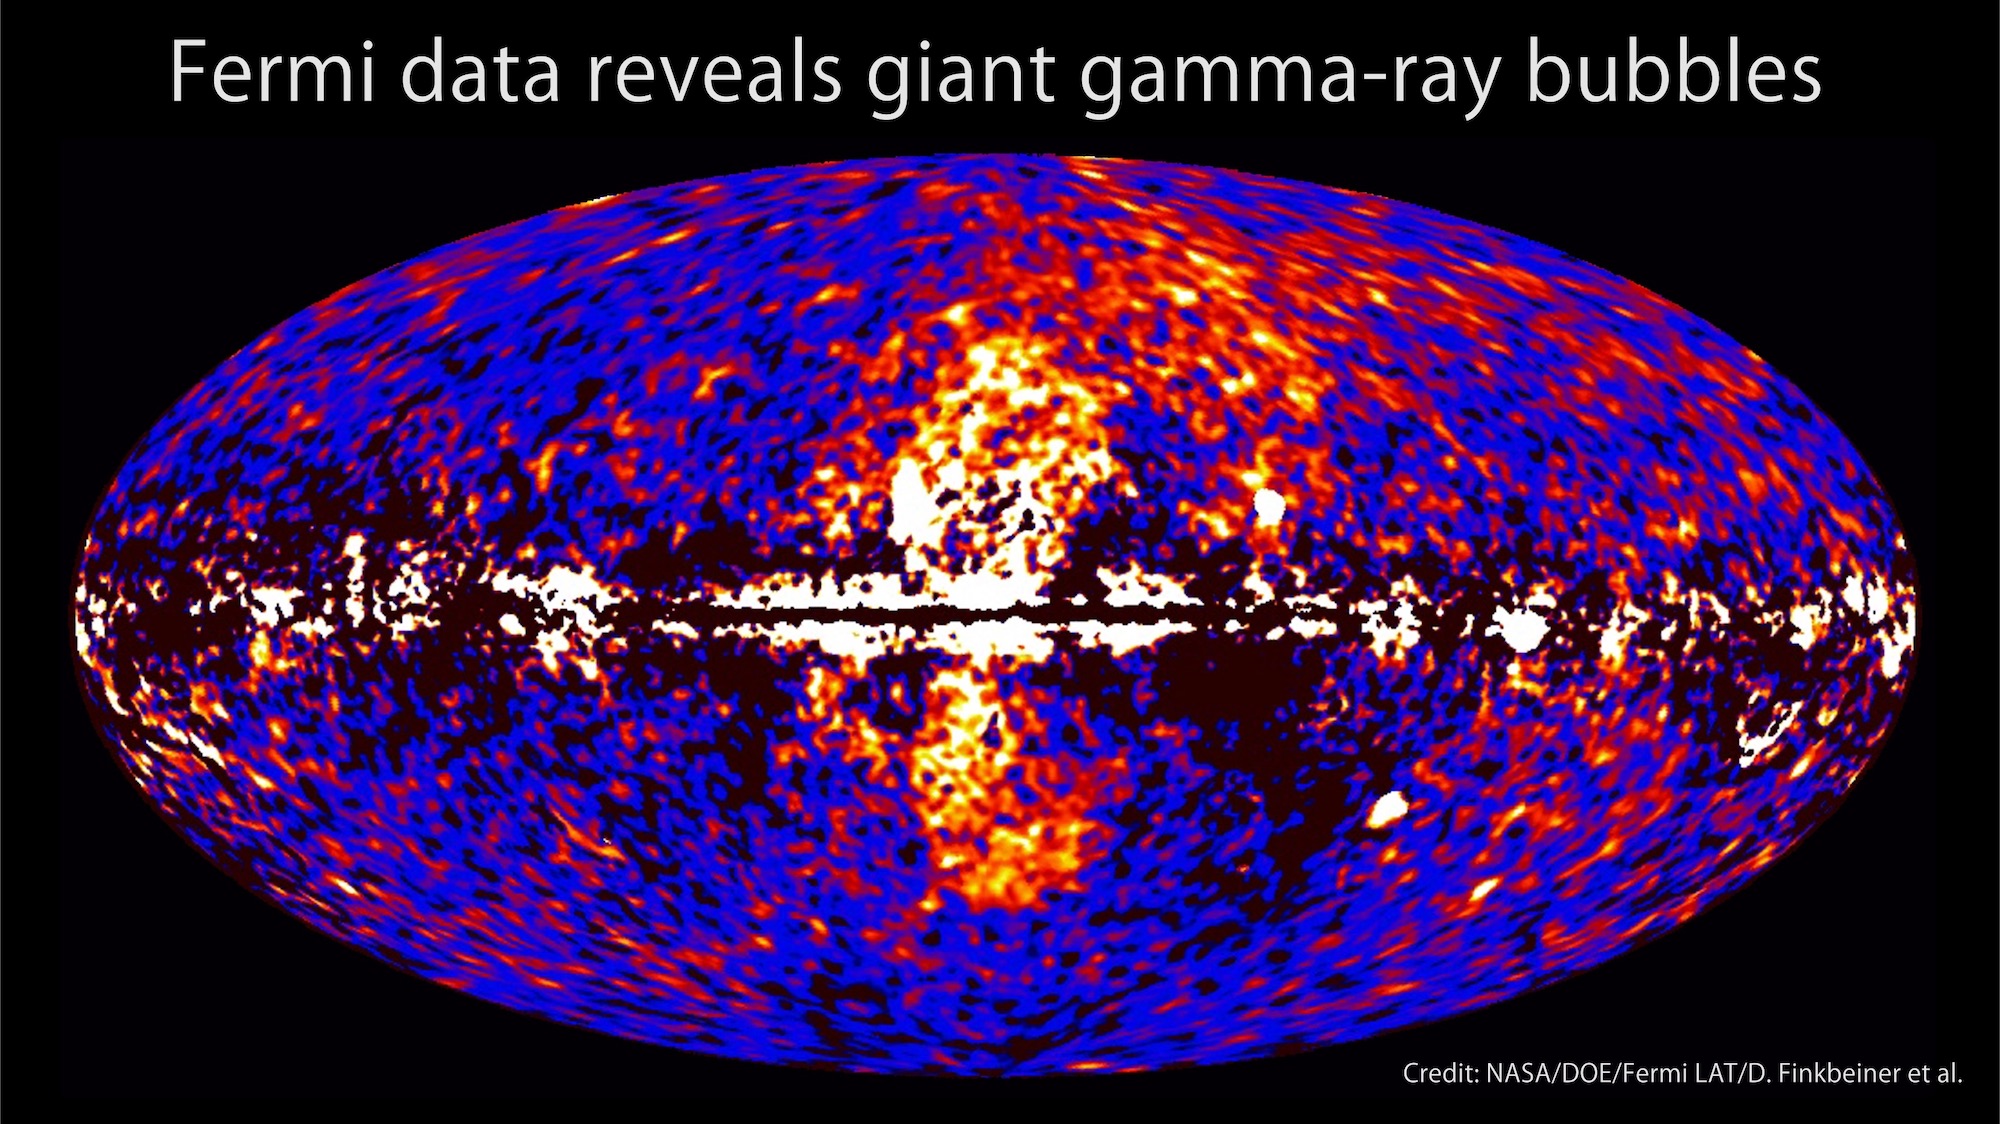
Processing of data from the Fermi Gamma-ray Space Telescope reveals a dumbbell-shaped structure emerging from the center of the Milky Way. [NASA/DOE/Fermi LAT/D. Finkbeiner et al.]
Citation
“XRISM Reveals a Remnant Torus in the Low-Luminosity AGN M81*,” Jon M. Miller et al 2025 ApJL 985 L41. doi:10.3847/2041-8213/add262
The post XRISM Spies the Remains of a Galactic Donut appeared first on AAS Nova.
]]>
Astrobites reports on research that explores the possibility of impacts delivering organics to the ocean worlds in our solar system.
The post Seeding Life in the Oceans of Moons appeared first on AAS Nova.
]]>Editor’s Note: Astrobites is a graduate-student-run organization that digests astrophysical literature for undergraduate students. As part of the partnership between the AAS and astrobites, we occasionally repost astrobites content here at AAS Nova. We hope you enjoy this post from astrobites; the original can be viewed at astrobites.org.
Title: Impacts on Ocean Worlds Are Sufficiently Frequent and Energetic to Be of Astrobiological Importance
Authors: Shannon M. MacKenzie et al.
First Author’s Institution: Johns Hopkins University Applied Physics Laboratory
Status: Published in PSJ
Asteroids and meteorites are usually associated with doom and destruction (rest easy, dinosaurs), but they may have also been essential for the emergence of life on Earth. It is popularly theorized that some of the base building blocks of life, like volatiles and organics, were delivered here by meteorites and that the energy of these impacts synthesized even more, like HCN and amino acids. Expectedly, the same should be true for other planets. Today’s article explores this possibility using nearby analogies for potentially habitable exoplanets: our solar system’s ocean worlds.
Why Do Meteorites Carry Organics?
The solar system formed from one massive cloud of gas and dust, so the composition everywhere is approximately the same. However, early Earth was an extremely hot ball of magma that destroyed its organic matter. Luckily, organics were able to survive in objects like meteorites in the cold outskirts of the solar system.
Ocean Worlds in Our Neighborhood
In the search for extraterrestrial life, we start by looking for the basic necessities — and water is a big one. Though Earth is the only planet in our solar system with liquid water, several moons of Jupiter and Saturn have it as well. These moons are beyond the balmy habitable zone, so their surfaces are covered in icy crusts, but beneath those crusts are subsurface oceans of liquid water, making these moons “ocean worlds” (see Figure 1). On their own, the presence of water makes these moons astrobiologically interesting, and they will also elucidate ocean worlds that are further away.
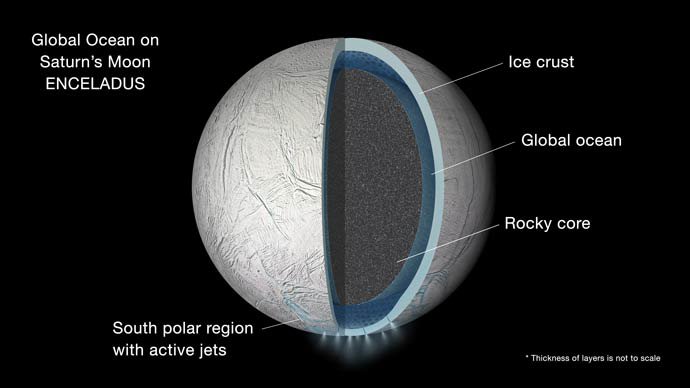
Figure 1: Saturn’s moon Enceladus with a liquid water ocean beneath the icy crust. Jets on the surface are strong indicators of hydrothermal vents on the ocean floor. [JPL]
Surviving the Impact
To evaluate survivability, the authors modeled the maximum pressure of an impact on an ocean world’s ice crust for a range of impact velocities and angles. Around Jupiter and Saturn, most impactors are either icy or rocky objects that originate from the Kuiper Belt or Oort cloud, so the authors modeled both types of impactors. Rocky impactors create higher pressures (shown in gray in Figure 2) than icy impactors (shown in black in Figure 2). From the sizes of observed craters on the ocean world moons, previous works determined the velocities and pressures of impacts, which are shown by the colored boxes in Figure 2. Finally, a number of other works have estimated the ranges of survivable pressures for biota and biologically important molecules, which are shown by the green and black bars on the right of Figure 2. Impressively, the survivable pressure ranges are within the observed and modeled pressures of impacts! So these life building blocks can be, and likely have been, deposited on the ocean world moons.
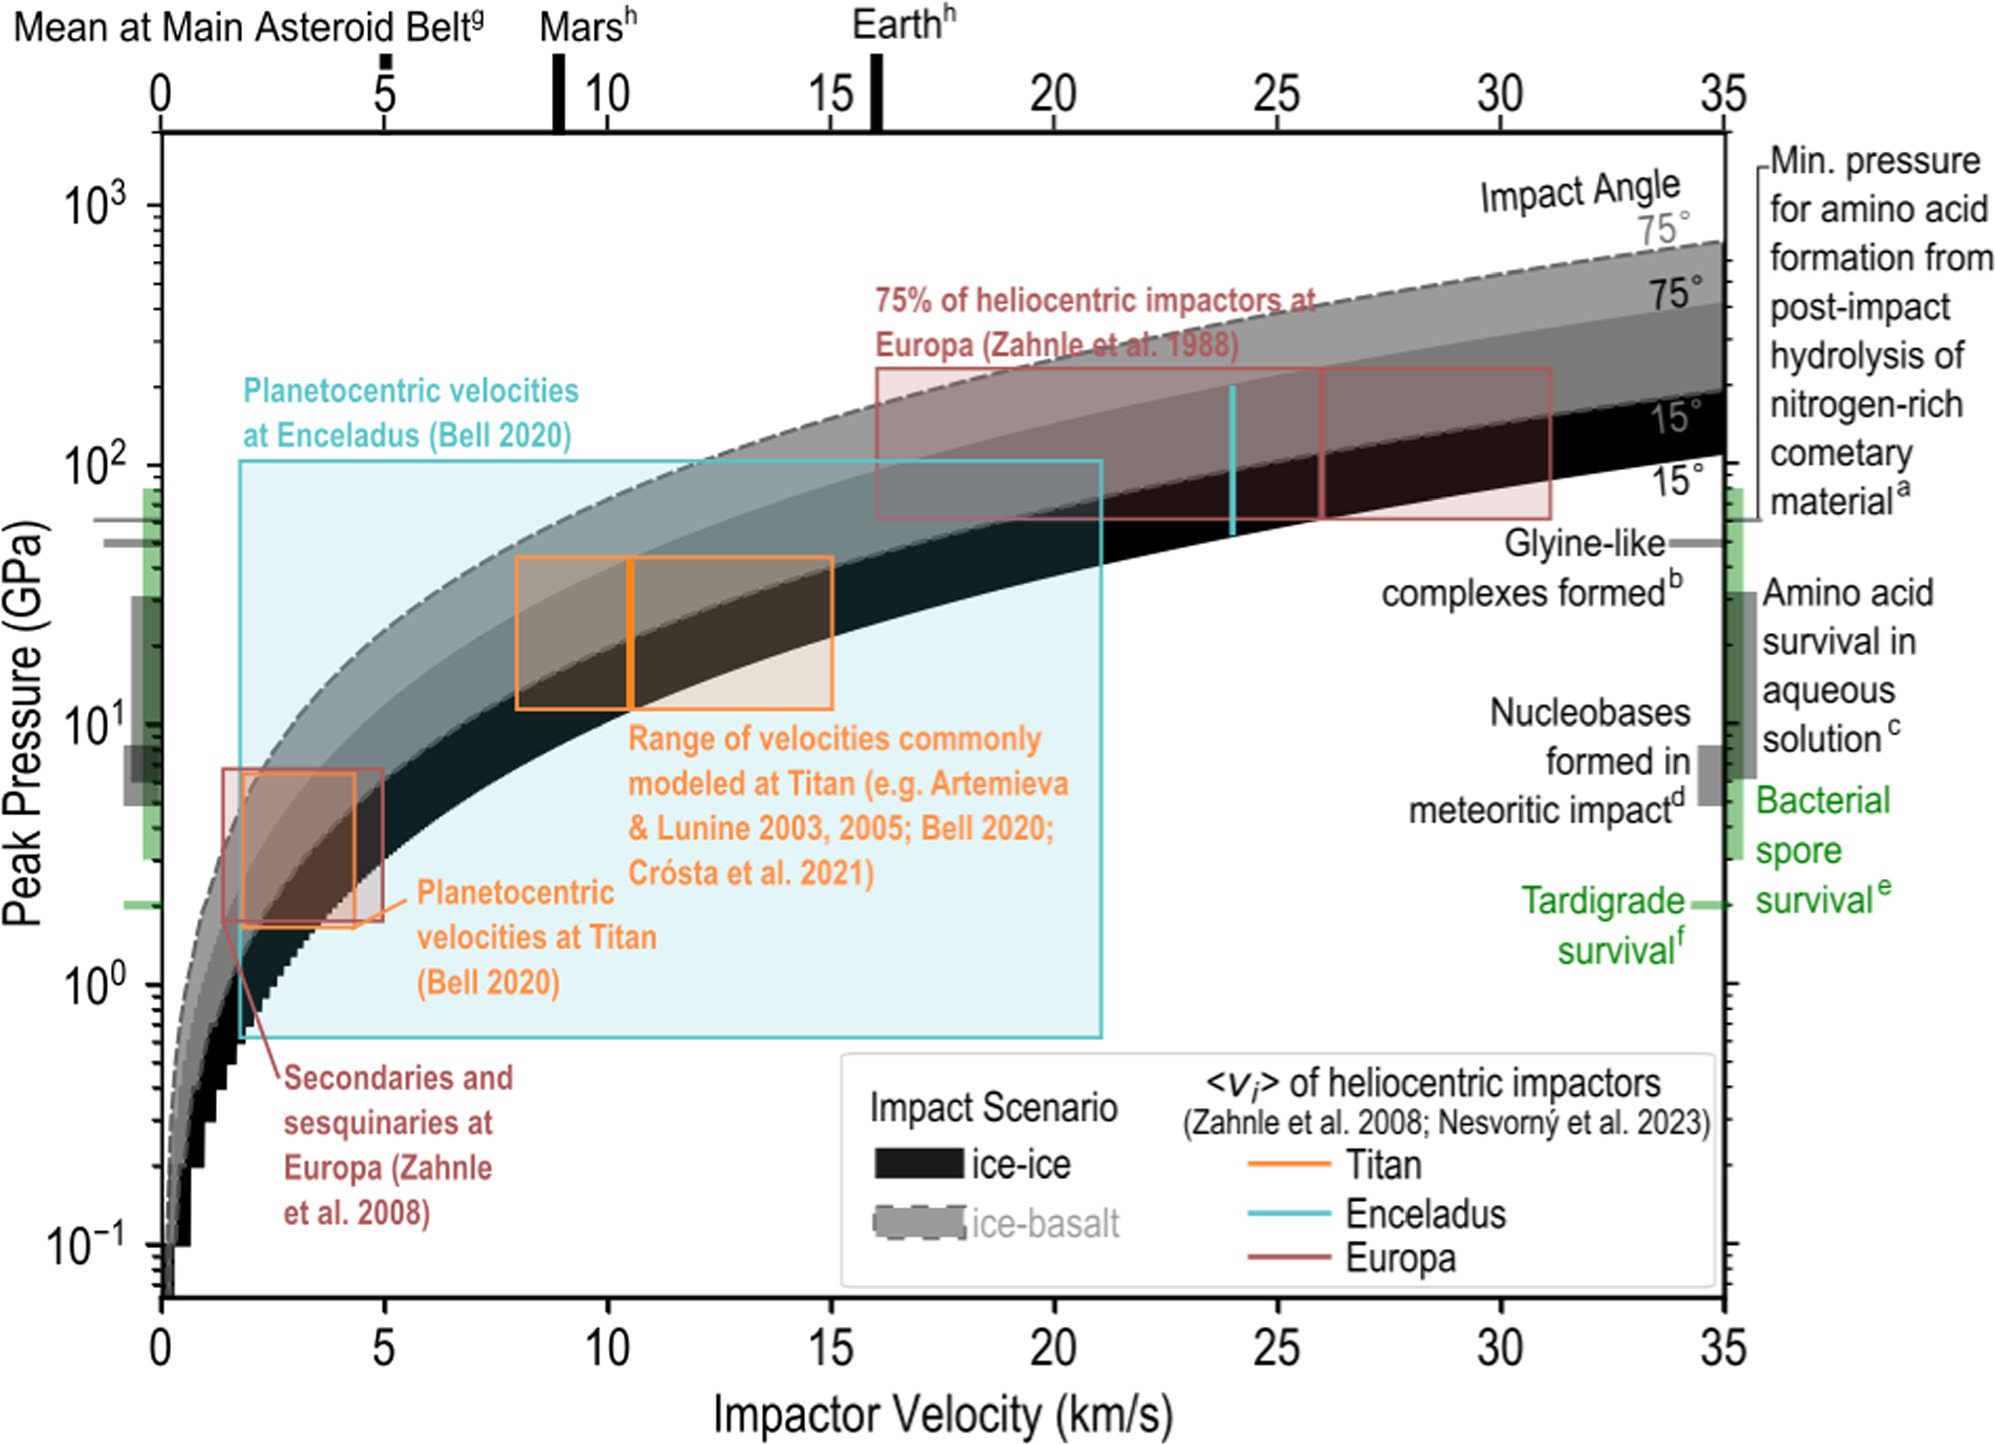
Figure 2: The modeled impact velocities and maximum pressures for icy (black) and rocky (gray) impactors. Survivable pressures of various organics (green and gray colored bars on the y-axis) are within the range of observed velocities and pressures from craters on each ocean world moon (colored boxes). [MacKenzie et al. 2024]
Crater Melt Pools
When an impactor hits the icy crust, some of the ice will melt. The deposited organics will end up in a pool of liquid water in the crater, which is an ample environment for prebiotic chemistry until the pool freezes. From the observed crater sizes and modeled velocities, the authors estimated how much liquid water could remain in a crater and how long it would take to freeze. Freeze times ranged from a few Earth years for the smallest craters (<4 kilometers in diameter) to thousands of years for the largest craters (hundreds of kilometers). In labs on Earth mimicking the crater conditions, amino acids have been synthesized in as short as a few months to a few years, so synthesis is possible in the melt pools.
The pools eventually freeze, trapping any deposited or synthesized material on the icy surface. Other processes, like future impacts, are required to break through the icy crust and transport material to the subsurface oceans where theorized hydrothermal vents could allow more complex development.
Tangible Evidence
In summary, survivable impacts on the ocean world moons are common, and each provides an opportunity for prebiotic chemistry to arise. Unlike most objects astronomers study, the proximity of these ocean worlds means that we can thoroughly understand them through physical samples. NASA’s Cassini detected organic compounds in the plumes that burst off the surface of Enceladus, and the Dragonfly mission is set to head for Titan in 2028 to collect and analyze samples once it arrives in 2034. In the coming decades, we may witness the discovery of more precursors to life or microbial life itself in the subsurface oceans of moons in our solar system, and gain radical insight into the ocean worlds beyond.
Original astrobite edited by Sonja Panjkov.
About the author, Annelia Anderson:
I’m an Astrophysics PhD candidate at the University of Alabama, using simulations to study the circumgalactic medium. Beyond research, I’m interested in historical astronomy, and hope to someday write astronomy children’s books. Beyond astronomy, I enjoy making music, cooking, and my cat.
The post Seeding Life in the Oceans of Moons appeared first on AAS Nova.
]]>
A new fast and flexible ray-tracing algorithm aims to make the complex world of general relativistic magnetohydrodynamics simulations more approachable.
The post Featured Image: Following Photons Through Curved Spacetimes appeared first on AAS Nova.
]]>Today’s featured image is a beautiful representation of how simulated images of active black holes are made. In a recent research article, a team led by Aniket Sharma (Indian Institute of Science Education and Research Mohali) introduced Mahakala, a new ray-tracing algorithm that expertly tracks photons as they navigate the warped spacetimes surrounding black holes. Mahakala is named for the Egyptian deity who, as Sharma and collaborators describe, is “believed to be the depiction of absolute black, and the one who has the power to dissolve time and space into himself.” The image above shows a simulated accreting black hole at a wavelength of 1.3 millimeters, which is the same wavelength used by the Event Horizon Telescope to view the supermassive black holes at the center of the Milky Way and the galaxy Messier 87. The dotted lines streaming off to the right represent the paths that photons took on their way to the viewer as they curved around the black hole, which is visible among the forest of lines. In this representation, the color of each dot shows the synchrotron emission generated at that point in three-dimensional space. The team hopes that Mahakala, which can be run quickly and easily from a Python Jupyter notebook, helps make the complex world of general relativistic magnetohydrodynamics simulations more accessible. You can try it for yourself or learn more from the article linked below.
Citation
“Mahakala: A Python-Based Modular Ray-Tracing and Radiative Transfer Algorithm for Curved Spacetimes,” Aniket Sharma et al 2025 ApJ 985 40. doi:10.3847/1538-4357/adc104
The post Featured Image: Following Photons Through Curved Spacetimes appeared first on AAS Nova.
]]>
The final day of AAS 246 included discussions about solar cycle research and the current landscape for science policy and advocacy.
The post AAS 246: Day 4 appeared first on AAS Nova.
]]>Editor’s Note: This week we’re at the 246th AAS meeting in Anchorage, AK, and online. Along with a team of authors from Astrobites, we will be writing updates on selected events at the meeting and posting each day. Follow along here or at astrobites.com for daily summaries, or follow @astrobites.bsky.social on Bluesky for more coverage. The usual posting schedule for AAS Nova will resume on June 16th.
Table of Contents:
- Solar Physics Division Plenary: Karen Harvey Prize Lecture: Building Connections in Heliophysics with Surface Flux Transport Modeling, Lisa Upton
- Public Policy Plenary: The Current Landscape for Science Policy and How YOU Can Make a Difference
Solar Physics Division Plenary: Karen Harvey Prize Lecture: Building Connections in Heliophysics with Surface Flux Transport Modeling, Lisa Upton (by Kerry Hensley)
The 2025 Karen Harvey Prize, “awarded in recognition of a significant contribution to the study of the Sun early in a person’s professional career,” went to Lisa Upton (Southwest Research Institute) for her work on large-scale solar flows and magnetic flux transport. Upton began by honoring Karen Harvey, with whom she shares many scientific interests. Harvey’s interest in solar physics began as a teenager observing sunspots with a small telescope, which led to her first scientific paper. She is remembered for her service to the solar physics community, her spirit of collaboration, and her education and public outreach efforts.
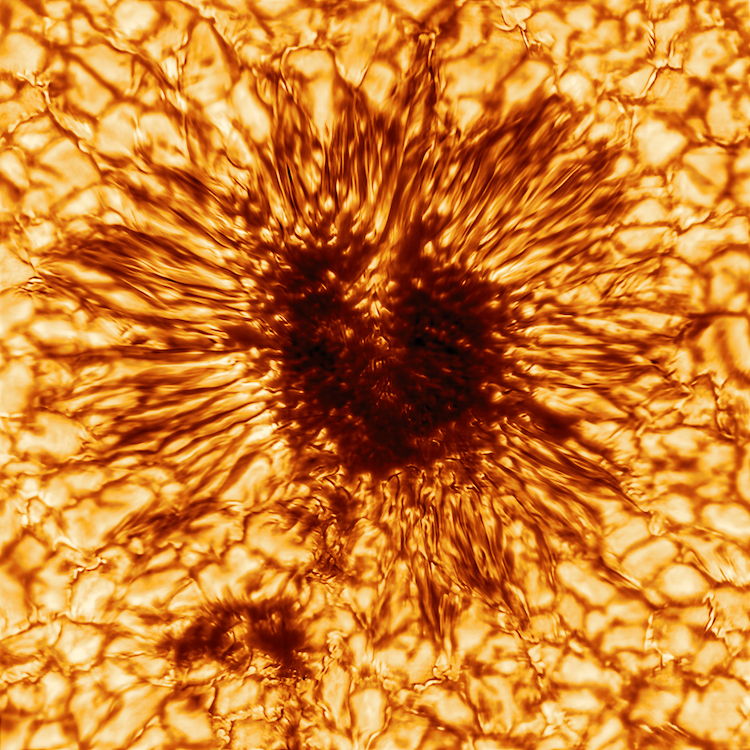
An extreme close-up of a sunspot taken by the Daniel K. Inouye Solar Telescope in Hawai’i. [NSO/AURA/NSF; CC BY 4.0]
How the Sun’s magnetic field explains the existence of the solar cycle is described by the Babcock dynamo model. In this model, the differential rotation of the Sun — the faster rotation of the Sun at its equator than at its poles — stretches the submerged magnetic field and makes it stronger. The field then becomes buoyant and causes sunspots to emerge at the Sun’s surface. The turbulent convective motion of the Sun that cycles material from the interior to the surface causes the surface magnetic flux to spread out, eventually being transported to the poles, where it cancels out the old magnetic field and creates a new field pointing in the opposite direction. This starts the solar cycle anew.
Upton described her research, which has covered a remarkably broad range of topics within solar physics. For example, she has studied large-scale flows, leading to the discovery of the long-sought-after giant cells. She also described her work on surface flux transport modeling, simulating the emergence and decay of magnetic flux through the solar surface. By incorporating observations of extreme-ultraviolet light from the far side of the Sun, Upton and collaborators greatly improved models of solar active regions emerging on the far side. More recently, Upton has been working to connect phenomena on the solar surface to the solar corona and beyond, working to predict the appearance of the solar corona during a solar eclipse, among other projects. She has also worked to generate realistic synthetic solar active regions, enabling both predictions of active region behavior as well as historical reproductions of the Sun’s appearance going back 200 years. Looking forward, she hopes to extend her research to the study of activity on other stars, where we see starspots far larger than anything on the Sun.
To close, Upton emphasized the need to remain united, support each other, and advocate for science as we navigate the challenging conditions in the world today.
Public Policy Plenary: The Current Landscape for Science Policy and How YOU Can Make a Difference (by Lucas Brown)
To finish out a wonderful week at AAS 246, we heard from a panel of AAS leadership and participants in the recent AAS Congressional Visits Day on ways to make a difference in today’s current science policy landscape. First, we heard from AAS Deputy Chief Executive Officer and Director of External Affairs and Public Policy Joel Parriott, who provided an overview of what AAS’s stated science policy priorities are — focusing on the Society’s top priority of addressing the significant global issues that affect astronomy. A common theme that echoed throughout the plenary was that the advancement of these goals requires the advocacy and voices of as many people as possible.
Next, AAS Deputy Director of Public Policy Roohi Dalal spoke about the current state of science policy — from the large amount of proposed budget cuts we have seen come from the federal government over the past six months to the actions of the AAS in advocating for funding astronomy research. Specifically, AAS launched a “share your story” campaign to highlight the human impact of these cuts and has interfaced directly with representatives and their staff through initiatives like Congressional Visits Day. Dalal’s talk once again returned to the idea that the AAS needs everyone’s voice to make change.
AAS President Dara Norman then took the stage to explain in greater detail what actions people can take in supporting the policy goals of the Society and astronomy more broadly. Her top recommendation was to pay attention to AAS action alerts, which provide detailed instructions as to what actions will have the most impact at any given moment. Right now one of those top actions is to get in contact with local elected officials either via email, phone, or through an in-person meeting.
After Norman’s speech, the plenary transformed into a panel discussion featuring Lori Porter from Columbia University, Becka Phillipson from Villanova University, and Marcel Agüeros also from Columbia University, all of whom participated in this year’s Congressional Visits Day program. They spoke about the real impact that these sort of one-on-one visits with congressional staff or representatives can have, and shared tips on how to approach communicating effectively during such a visit. Their words of advice once again underscored the power of people’s voices in ensuring the future of astronomy remains bright.

Photo of the participants in AAS’s 2025 Congressional Visits Day posing in front of the US Capitol Building. [AAS]
The post AAS 246: Day 4 appeared first on AAS Nova.
]]>
The bunny ears of a jellyfish galaxy, the journey of a 14th-century monk, and 35 years of the Hubble Space Telescope: all this and more on Day 3 of AAS 246.
The post AAS 246: Day 3 appeared first on AAS Nova.
]]>Editor’s Note: This week we’re at the 246th AAS meeting in Anchorage, AK, and online. Along with a team of authors from Astrobites, we will be writing updates on selected events at the meeting and posting each day. Follow along here or at astrobites.com for daily summaries, or follow @astrobites.bsky.social on Bluesky for more coverage. The usual posting schedule for AAS Nova will resume on June 16th.
Table of Contents:
-
- Plenary Lecture: The Hubble Space Telescope at 35: Eyeing the Future, Jennifer Wiseman (Goddard Space Flight Center)
- Press Conference: Recent and Upcoming Discoveries in the Broader Universe
- Plenary Lecture: Advancing Exoplanet Characterization: Five Years of High-Resolution Spectroscopy with KPIC, Dimitri Mawet (California Institute of Technology)
- Donald E. Osterbrock Book Prize Lecture: Where Are We? How Past Astronomers Found Their Place in the Universe — and on Earth, Seb Falk (University of Cambridge)
- Plenary Lecture: Things in Disks: Towards a New Understanding of Galactic Nuclei, K.E. Saavik Ford (CUNY Borough of Manhattan Community College/American Museum of Natural History)
Plenary Lecture: The Hubble Space Telescope at 35: Eyeing the Future, Jennifer Wiseman (Goddard Space Flight Center) (by Margaret Verrico)

Hubble image of the spots where the fragments of comet Shoemaker–Levy 9 impacted Jupiter. [Hubble Space Telescope Comet Team and NASA]
Dr. Wiseman began by describing how our science community has been transformed by Hubble’s impact. She highlighted Hubble’s multiple science instruments and ultraviolet–optical capabilities, which cover a crucial part of the electromagnetic spectrum that is not covered by other flagship observatories like JWST. She described the evolution of Hubble, from the first description of a space telescope by Dr. Lyman Spitzer in 1946 to its announcement by Nancy Grace Roman in 1977 and eventually its launch on the space shuttle in 1990. Its key science drivers originally included measurements of the expansion rate of the universe, understanding how galaxies have evolved throughout the history of the universe, determining whether supermassive black holes really exist at the centers of massive galaxies (only a theory at the time of launch), and studying planets in our solar system. Over the past 35 years, Hubble’s ~1.7 million observations of over 100 million objects have revolutionized our understanding of the solar system, star formation, and the evolution of the universe, leading to the discovery of the accelerating expansion of the universe, confirmation of the existence of supermassive black holes, and an understanding of a dynamic and evolving solar system.
Dr. Wiseman described how Hubble is a crucial part of the suite of Great Observatories in operation today. She emphasized its importance as a follow-up telescope for transient events like supernovae, its decades-long archive for long-term monitoring of solar system planet atmospheres, and its ultraviolet coverage that complements the infrared range of JWST. She promoted new support services for Hubble data, including the Hubble Spectroscopic Legacy Archive (HSLA) — a publicly available database of archival Hubble spectra — and the upcoming Hubble Advanced Spectral Products (HASP) database, which will be public later this summer. Dr. Wiseman cited Hubble’s continually improving user support and data archives as a crucial piece of the observatory’s future while warning that continued budget cuts have impacted their ability to fund new research and threaten the facility’s ability to support new science through the end of the 2020s.
Dr. Wiseman closed with a hope that the audience would leave her talk and the AAS meeting inspired to join the celebration of Hubble’s 35 years of discoveries. She expressed excitement for the new discoveries that will be enabled by Hubble through the early 2030s and its essential part in the suite of Great Observatories over the next half decade.
Read an interview with Jennifer Wiseman here.
Press Conference: Recent and Upcoming Discoveries in the Broader Universe (by Lucas Brown) (Briefing video)

HST imagery of NGC 4858, a “jellyfish” galaxy that exhibits long tails of gas and stars extending outwards from the disk. These tails are expected to form as the result of drag forces as the galaxy moves through a gas-dense region of intergalactic space. [HST/ALMA/H. Souchereau]
Next, in “In the Belly of the Beast: Massive Clump Formation in the Hearts of Major Mergers,” we heard from Sean Linden of University of Arizona about new insights from JWST into the dense star-forming clumps found in many major galaxy mergers. These clumps are unlike anything seen in typical, non-merging galaxies in the universe today, and they’re thought to be the “building blocks” of galaxies in the early universe. Thanks to the space telescope’s increased resolution and sensitivity to infrared light, it has been able to peer through the obscuring dust found within some of the universe’s biggest mergers to identify the presence and characteristics of such clumps. These new observations confirm many predictions about clump formation made in prior simulations. The full press release can be found here.
Third, we were briefed on “UNCOVERing the Drivers of Reionization with JWST” from Isak Wold of NASA and The Catholic University of America. Reionization was a period of a few hundred million years in the very early universe wherein the neutral hydrogen that permeated the cosmos at the time was nearly completely ionized. The exact origin of the necessary radiation to set off this reionization has long been a source of speculation. In Wold’s talk, new evidence was presented advancing the idea that a class of young, star-forming, and oxygen-III-emitting galaxies could completely source this ionizing ultraviolet light. Wold’s team draws on new JWST observations of such galaxies, which indicate that the galaxies are numerous, largely dust-free and metal-poor, and indeed emit abundant ultraviolet light—all the ingredients needed for a strong candidate to explain the epoch of reionization. The full press release can be found here.
Fourth, in “The ‘Dark-Matter Dominated’ Galaxy Segue 1 Modeled with a Black Hole and No Dark Halo” presented by Nathaniel Lujan of The University of Texas San Antonio, we heard about a new model for the structure of the dwarf galaxy known as Segue 1. Previous observations of the galaxy, which has few stars but a large amount of mass, suggested that the galaxy contains a large amount of dark matter. In order to derive the new model, Lujan and his collaborators compared observations of stellar motion against a set of 100,000 simulations of stellar motion given different underlying parameters describing the distribution of mass in the galaxy. The team found that a model including a central black hole with the mass of 500,000 suns and only minimal dark matter fits better than a dark matter–dominated model, challenging previous assumptions about the system, the prevalence of dark matter in dwarf galaxies, and the abundance of supermassive black holes in our universe. The full press release can be found here.

One of the very first images taken by the SPHEREx mission. The color gradient present across the frame is the result of linear variable filters that cause different parts of each image to be sensitive to different wavelengths of light. By taking many images while panning over a patch of sky, this filtering allows each pixel in the image to be spectroscopically characterized. [SPHEREx]
Plenary Lecture: Advancing Exoplanet Characterization: Five Years of High-Resolution Spectroscopy with KPIC, Dimitri Mawet (California Institute of Technology) (by Margaret Verrico)
The next plenary lecture was given by Professor Dimitri Mawet, the David Morrisroe Professor of Astronomy at Caltech and a Senior Research Scientist at NASA’s Jet Propulsion Laboratory. Professor Mawet talked about the importance of ground-based observatories and high-resolution spectroscopy for exoplanet science.

An artist’s impression of the planet K2-18b orbiting its host star. [ESA/Hubble, M. Kornmesser; CC BY 4.0]
Professor Mawet highlighted several works by his students on KPIC exoplanets. Mawet’s student Jason Wang directly imaged HR 8977, a four-planet system, and obtained spin measurements for all four planets, which can be used to study the relationship between the planets and their magnetic fields. Another one of his students, Chih-Chun (Dino) Hsu, will be giving a talk later today on the differences in the spin properties between giant planets and brown dwarfs. Using KPIC’s high-resolution spectrometer, Professor Mawet’s group has made groundbreaking discoveries in exoplanet formation science, paving the way for future work with ground-based and space-based observatories.
To wrap up the talk, Professor Mawet talked about the future of ground-based exoplanet science with the High resolution Infrared Spectrograph for Exoplanet Characterization (HISPEC) and Multi-Objective Diffraction-limited High-resolution Infrared Spectrograph (MODHIS). In particular, HISPEC is expected to nearly double the number of directly imaged planets and brown dwarfs when it comes online in 2027.
Read an interview with Dimitri Mawet here.
Donald E. Osterbrock Book Prize Lecture: Where Are We? How Past Astronomers Found Their Place in the Universe — and on Earth, Seb Falk (University of Cambridge) (by Olivia Cooper)

Figure 1: Seb Falk giving his plenary talk, pictured with the astronomical chart that is the cover image for his book. [Seb Falk / Olivia Cooper]
Throughout the talk, Falk shared a handful of lessons he has taken from the history of astronomy, about how to do astronomy in a changing world. First, everyone has a contribution to make: there are countless unknown, unnamed, historically-unrecognized people taking measurements, developing knowledge, and constructing instruments. Next, motivations matter, for better or worse. Our motivations for doing science (and for the way we conduct science) can provide momentum, and can also create biases and limit our scientific understanding. Further, astronomy is never pointless: though our work often seems abstract, the implications are quite grounded, and have led to the development of mathematical techniques, new technologies, art, storytelling, and more. Regarding the practice of astronomy, Falk reminds us that it is most impactful through physical experience, when we contextualize the act of doing astronomy by the experience of looking at the night sky. Upon these experiences, he notes that modeling matters; how we encode, distill, and distribute knowledge in turn impacts our collective interpretation of the cosmos.
Towards the end of the talk, Falk remarked that the pre-modern world was a time of amazing creativity, teamwork, patience, and interdisciplinarity. Although there were certainly misconceptions about the Universe and our place in it, he notes the importance of giving dead ends and disappointments a chance to pan out, and reminds us to persevere through times of political unrest and threat to scientific pursuit, as did astronomers of the past worldwide.
Read an interview with Seb Falk here.
Plenary Lecture: Things in Disks: Towards a New Understanding of Galactic Nuclei, K.E. Saavik Ford (CUNY Borough of Manhattan Community College/American Museum of Natural History) (by Margaret Verrico)
The final plenary of the day was given by K.E. Saavik Ford, a Professor in the Science Department at CUNY Borough of Manhattan Community College, Professor of Physics at the CUNY Graduate Center, research associate at the American Museum of Natural History, and a visiting scientist at the Flatiron Institute’s Center for Computational Astrophysics. She discussed her work understanding “things in disks,” particularly stellar- and intermediate-mass black holes in active galactic nucleus disks.

Simulation of black holes approaching a merger. [SXS, the Simulating eXtreme Spacetimes (SXS) project (http://www.black-holes.org); CC BY-NC 4.0]
Professor Ford spent most of her talk advertising McFACTS, a Monte Carlo simulation code for stellar-mass black holes embedded in AGN disks. She highlighted a few results from collaborators and students who have used the code, including her student Vera Delfavero’s modeling of the supermassive black hole mass peak at 108 solar masses (ADS link here) and predictions by Harrison Cook for the gravitational wave signatures of the AGN channel (ADS link here). She also discussed ongoing and future work to improve the software’s ability to model stars, electromagnetic signatures of black hole mergers in AGN disks, and transient events like tidal disruption events, changing-look AGN, and quasi-periodic eruptions that might result from those mergers.
Professor Ford closed out the talk with several pieces of advice. She advised working with kind people and being kind in return. She reminded the audience to control what they could control and to work sustainably. She emphasized the importance of doing research, building community, having hobbies, having a plan B, and wearing sunscreen. To close out today’s series of talks, she remarked that no one knows what the future holds, whether for good or for bad.
Read an interview with Saavik Ford here.
The post AAS 246: Day 3 appeared first on AAS Nova.
]]>
On Day 2 of AAS 246, we heard about active galactic nucleus feedback, learned how planets fare in systems with multiple stars, and saw fantastic new images of the Sun.
The post AAS 246: Day 2 appeared first on AAS Nova.
]]>Editor’s Note: This week we’re at the 246th AAS meeting in Anchorage, AK, and online. Along with a team of authors from Astrobites, we will be writing updates on selected events at the meeting and posting each day. Follow along here or at astrobites.com for daily summaries, or follow @astrobites.bsky.social on Bluesky for more coverage. The usual posting schedule for AAS Nova will resume on June 16th.
Table of Contents:
- Laboratory Astrophysics Division Plenary Lecture: Icy Ocean Worlds, Europa Clipper, and the Search for a Second Genesis, William McKinnon (Washington University in St. Louis)
- Press Conference: Planets, Exoplanets, and Brown Dwarfs
- Plenary Lecture: The Missing Link: Planet Formation from Millions to Billions of Years, Meredith Hughes (Wesleyan University)
- Press Conference: New Views and Insights into the Sun and Its Surroundings
- Plenary Lecture: Exoplanets in Multi-Star Systems, David Ciardi (NASA Exoplanet Science Institute-Caltech-IPAC)
- Plenary Lecture: Unraveling AGN Feeding and Feedback: JWST, ALMA, and Integral Field Spectrometers to the Rescue, Erin Hicks (University of Alaska Anchorage)
- SPD Plenary: González Hernández Prize Lecture: Solar Connections: Reflecting and Leaning Forward, Holly R. Gilbert High Altitude Observatory/NCAR
Laboratory Astrophysics Division Plenary Lecture: Icy Ocean Worlds, Europa Clipper, and the Search for a Second Genesis, William McKinnon (Washington University in St. Louis) (by Karthik Yadavalli)
In this talk, Dr. William McKinnon gave a detailed overview of the Europa Clipper mission and the science that is expected from this mission. The mission will fly by Europa, a moon of Jupiter. Dr. McKinnon started by comparing the Europa Clipper mission to the Cassini mission. The Cassini mission flew by Saturn during 2004–2017, learning about both Saturn and its many moons.
Europa is somewhat like a “smaller Earth,” with a large ocean and a cooler (~100 Kelvin) surface. JWST has found solid carbon dioxide on its surface. The clipper is meant to be a comprehensive mission that studies the ice, composition of the moon, and geology of the moon. Europa is expected to have many of the ingredients for life:
- Water: Europa has much more water than all of Earth’s oceans
- Essential elements: Elements like hydrogen, carbon, nitrogen, and oxygen would have been present from formation and were likely also added to Europa from impacts and collisions
- Chemical energy: Though the surface is likely too cold for life, there would be sources of energy both from Jupiter’s emission and from deep-sea vents.

Figure 1: A schematic of Europa Clipper and all of its instruments. [Slide by William McKinnon]
Dr. McKinnon then went on to describe the Clipper mission in detail. It launched in October 2024 and will enter Jupiter orbit in early 2031. During that period, it will orbit around Jupiter for several years. The Clipper already has flown past Mars and taken a thermal image of the surface of Mars (see Figure 2).

Figure 2: Thermal image of Mars taken by Europa Clipper (left) compared to a detailed thermal image of Mars by TES (right), a dedicated instrument for that task. The two images agree with each other very well, showing that the Europa Thermal Emission Imaging System works extremely well. [Slide by William McKinnon]
Dr. McKinnon finished by emphasizing that planned future exploration of the Jupiter systems is going to be very exciting. Three of Jupiter’s moons, Europa, Ganymede, and Callisto, will in particular be well-studied by the three planned missions.
Press Conference: Planets, Exoplanets, and Brown Dwarfs (by Lexi Gault) (Briefing video)
Revealing the Classical Uranian Satellites in Ultraviolet — Christian Soto (Space Telescope Science Institute)
With the Hubble Space Telescope, Christian Soto and collaborators obtained ultraviolet spectroscopy of four moons of Uranus — Ariel, Titania, Umbriel, and Oberon — to investigate how Uranus’s magnetosphere affects the surfaces of the moons. This system is particularly interesting to study because Uranus’s axis of rotation is tilted 98 degrees from the plane in which its moons orbit. This extreme tilt causes the magnetic field lines to sweep past the moons frequently, causing charged particles moving along the field lines to interact with the moons. Soto and team hypothesized that since these four moons are tidally locked, meaning that one side of the moon always faces Uranus (“leading” side) and the other always faces away (“trailing” side), interactions with the charged particles trapped in the magnetosphere would primarily hit the trailing sides, causing them to darken. However, their observations revealed that the leading sides of the two outer moons, Titania and Oberon, show evidence of darkening — the opposite of their hypothesis. Instead, the group suggests that dust from irregular satellites orbiting Uranus is hitting the leading sides of these moons, causing them to darken, and interactions with the magnetosphere are actually less influential than previously thought. Upcoming JWST observations of the system will help us to further understand this interesting result. The full press release can be found here.
Off-Polar Hint: Hottest-Star Sub-Saturn Obliquity — Emma Dugan (Indiana University)
The planets in our solar system orbit the Sun in the same direction that it spins, however, in many exoplanet systems, this is not always the case. In particular, Jupiter-mass planets orbiting hot stars tend to be misaligned, while Jupiters around cooler stars tend to be more well aligned. However, recent observations show that smaller sub-Saturn-type planets can be misaligned around cool stars, often with polar orbits — but few observations exist for sub-Saturns around hot stars, limiting our understanding of sub-Saturn formation. Aiming to add to the picture, Emma Dugan and collaborators investigated the spin–orbit alignment of the sub-Saturn TOI-1135 b, which orbits the hottest star with such measurements to date. Using observations obtained with NEID on the WIYN 3.5-meter telescope, the team found that TOI-1135 b has a near-polar orbit, unlike the polar orbits of sub-Saturns around cooler stars. This observation suggests that sub-Saturns orbiting cooler stars may be more misaligned than sub-Saturns orbiting hot stars, the opposite of what is observed for Jupiter-mass planets. Further observations of sub-Saturns will aid in filling out this dataset and understanding the formation mechanism governing sub-Saturns.

The new image of the exoplanet 14 Herculis c from JWST. The white star marks the location of the host star, which is blocked from view by a coronagraph. [NASA, ESA, CSA, STScI, W. Balmer (JHU), D. Bardalez Gagliuffi (Amherst College)]
When studying exoplanets, astronomers want to understand how planetary systems form and evolve over time. One of the best ways to understand and characterize exoplanets is through directly imaging them, but this is a difficult task when these planets, especially cold ones, are so faint next to their host stars, hidden within the overpowering bright stellar light. However, with JWST’s great sensitivity to longer wavelengths where cold planets appear brighter, direct imaging becomes a possibility. William Balmer and Mark Giovinazzi presented the first JWST direct image of the cold giant planet 14 Her c, which was one of two planets previously detected through radial velocity measurements of the system. Their observations reveal that 14 Her c was fainter than anticipated based on modeling, which is likely due to updrafts and water-ice clouds in its atmosphere. Additionally, the team refit the orbits of the two planets and determined that 14 Her c was likely scattered out to its current, far-out orbit due to dynamics and interactions with the other planet in the system. See the full press release here.
Detailed JWST Observations of a Multi-Planet System Around a Sun-Like Star — Kielan Hoch (Space Telescope Science Institute)
YSES-1 is an exoplanetary system with multiple planets orbiting a young Sun-like star, only ~16 million years old, that was originally directly imaged in the Young Suns Exoplanet Survey. This system is interesting because it has two planets that are both orbiting very far from the central star — YSES-1 b at 160 times the distance of Earth to the Sun and YSES-1 c at 320 times the distance of Earth to the Sun. With the launch of JWST, Kielan Hoch and her collaborators wanted to directly image these planets again with the high-resolution spectroscopy and imaging of JWST. From their observations, the team was able to detect different molecules in the atmospheres of the two planets. For YSES-1 c, the spectra show evidence of silicate clouds in its atmosphere, demonstrating the strongest absorption feature observed in an exoplanet to date. For YSES-1 b, the team observed a disk around the planet that is likely material that will feed onto the planet. However, such disk-like features are typically only present for planets younger than YSES-1 b, so the team suggests that this may be a second-generation disk of material that is involved in forming a moon. Further observations and modeling will reveal more information and clues into the formation history of these planets. See the full press release here.
Plenary Lecture: The Missing Link: Planet Formation from Millions to Billions of Years, Meredith Hughes (Wesleyan University) (by Karthik Yadavalli)
In her talk, Dr. Meredith Hughes (Wesleyan University) presented results from the ALMA survey to resolve exoKuiper belt structure (ARKS). She started by emphasizing how rapidly the field of exoplanet observations has evolved in the past two decades, and that we now know that on average every star in the galaxy likely has at least one planet. As such, it is now possible to ask detailed questions about how planets are formed around stars. When a star forms from a large dust cloud, a protoplanetary disk also forms alongside it. Planets will eventually form in this disk. Protoplanetary disks only last about ~10 million years after the star forms, whereas the planets we detect are expected to have ages of ~billions of years. As such, the evolution stages in between the protoplanetary disk and the full-fledged planet have not been observationally mapped out.
Dr. Hughes focuses on trying to find systems that are in between these two stages. With ALMA, Dr. Hughes has been able to take very detailed images of the “debris disk,” the intermediate stage between the protoplanetary disk and fully formed planets. The solar system’s Kuiper Belt is the analog of a debris disk. ALMA is now sensitive enough to take detailed images of debris disks. In particular, the ARKS survey has obtained 18 new high-resolution observations of previously not observed debris disks.

Figure 1: Vertical structure in a debris disk can reveal the mass of the planet living in the disk. More massive planets will cause the disk to flare up, whereas lower-mass planets will keep the disk quite flat. [Slide by Meredith Hughes]
Dr. Hughes concluded by briefly describing the institution at which she works, Wesleyan University. Wesleyan is primarily an undergraduate institution and therefore the research at the university is primarily done by younger students rather than by postdocs and PhD students. It also offers a path to an astronomy PhD for nontraditional students, including those who have not started their academic careers in astronomy (see Figure 2).

Figure 2: Wesleyan University offers a path into astronomy academia for nontraditional students and primarily focuses on undergraduate studies. [Slide by Meredith Hughes]
Press Conference: New Views and Insights into the Sun and Its Surroundings (by Lucas Brown) (Briefing video)

[An image from the Narrow Field Imager (NFI) camera on board a spacecraft that is part of the PUNCH mission. PUNCH enables extremely wide field-of-view observation of the Sun’s corona. [SwRI]
Second, in “The Coronal Diagnostic Experiment (CODEX): First Light,” Nicholeen Viall of NASA Goddard Space Flight Center presented on another new solar physics experiment that has recently been initiated. Whereas PUNCH focused on achieving a wide field of view of the Sun, Viall explained that CODEX is all about getting up close and personal with the dynamics of the corona closer to the solar surface. The experiment is mounted on the International Space Station and uses occulting disks to create an artificial eclipse, blocking out light from the disk of the Sun in order to view the corona. CODEX features numerous innovative technologies that allow it to measure temperatures and velocities of coronal material better than previous experiments, which will hopefully improve our understanding of the intricate dynamics and flow of energy that occurs within the solar corona. The full press release can be found here.
Third, we heard a briefing on “Cracking the Solar Code: Hybrid Machine Learning for Predicting Hemispheric Bursts and Cycle Trends,” given by Juie Shetye of New Mexico State University & Armagh Observatory and Planetarium and Mausumi Dikpati of High Altitude Observatory/NSF-NCAR. Their work focuses on trying to employ mathematical modeling, statistics, and machine-learning methods to better predict individual “bursts” of solar activity. Whereas solar cycles are periodic and fairly predictable, understanding when solar activity is going to suddenly rise on short timescales to produce things like coronal mass ejections is very difficult. Their team hopes that through synthesizing physics-informed models and advanced machine learning techniques, they can improve our ability to predict these events and therefore minimize the damage they cause here on Earth.

Simulated and real imagery of the solar corona during the April 2024 total solar eclipse. The image on the left is simulated using software from Predictive Science Inc., relying on solar magnetic field data taken in the days leading up the eclipse. The central image shows an actual image of the solar corona on the day of the eclipse. The final image shows a further-updated simulation. The simulations share many of the major structural features of the real image. [Jon Linker/Predictive Science Inc.]
Plenary Lecture: Exoplanets in Multi-Star Systems, David Ciardi (NASA Exoplanet Science Institute-Caltech-IPAC) (by Kerry Hensley)
The first of three back-to-back plenary sessions was given by David Ciardi, the deputy director of the NASA Exoplanet Science Institute. Ciardi described what we’ve learned about the properties of planets in multi-star systems and compared them to single-star systems.
Though our solar system contains only one star, many stars have companions: essentially all stars with spectral types O, B, and A have companions, as do 50% of F, G, and K stars and 25% of M stars. On average, every star also has a planet, which means that a rather large number of planets must occupy systems with more than one star.
As Ciardi explained, the presence of stellar companions affects how we detect and characterize planets. Many exoplanets are discovered via the transit method, in which a planet blocks some of the light from its host star as seen from our perspective. If the host star has an unknown companion, the planet radius derived from the transit method can be underestimated by a factor of two or more — and the planet might even orbit the unseen star instead of the star that’s being studied!
Using transit fitting, researchers have developed ways to determine which star in a binary or multiple system a planet is orbiting. These methods suggest that most planets orbit the primary star in the system. This is likely a result of observational bias, because primary stars are typically brighter, and it’s easier to detect a planet around a brighter star. However, a nonzero fraction of planets have been found to orbit the secondary stars of their systems, with more waiting to be found.
In terms of how binarity affects the likelihood of a star hosting planets, studies have shown that roughly 20% of single stars host giant planets, compared to just 10–12% of binary stars. However, wide binaries (orbital separations greater than 100 au) host giant planets at essentially the same rate as single stars, while close binaries host giant planets at a greatly reduced rate. In contrast, research suggests that wide and close binaries might host small planets at approximately the same rate.
Researchers have also discovered a small but growing number of planets in extremely close binary systems that are orbiting both stars at once. Estimates suggest that 10–40% of close binaries might have circumbinary planets, but this number is still uncertain. Recent findings suggest that essentially all of these systems are aligned, with the orbit of the planet in the same plane as the orbits of the stars.
Finally, Ciardi noted that while finding small planets is already difficult, the presence of a stellar companion makes it even more difficult. Research shows that we’re likely sensitive to only about 50% of Neptune-size planets in binary systems and scarcely any Earth-size planets. Combining this information with existing observations suggests that there are likely 10–30% more small planets in our galaxy than previous estimates that don’t account for binarity have suggested.
Plenary Lecture: Unraveling AGN Feeding and Feedback: JWST, ALMA, and Integral Field Spectrometers to the Rescue, Erin Hicks (University of Alaska Anchorage) (by Maggie Verrico)
Professor Erin Hicks from the University of Alaska Anchorage gave the second plenary talk of the session. She highlighted several recent results by the Galaxy Activity, Torus, and Outflow Survey (GATOS) collaboration on active galactic nucleus fueling and feedback mechanisms which were made possible by high-resolution instruments like the Atacama Large Millimeter/submillimeter Array (ALMA) and JWST.
A diagram of the unified model of active galactic nuclei, showing an accretion disk, dusty torus, and jets. [B. Saxton NRAO/AUI/NSF; CC BY 4.0]
Professor Hicks first highlighted several studies of individual active galactic nucleus hosts in the nearby universe to demonstrate that active black holes can have very different relationships with their host galaxies, even when they are similar in luminosity. In particular, she discussed how the relative orientation between the torus and the host galaxy is crucial for understanding active galactic nucleus feedback. When the torus is aligned with the host galaxy, the active galactic nucleus drives outflows perpendicular to the plane of the galactic disk, sometimes inducing star formation outside the galactic disk (so-called “positive active galactic nucleus feedback”; seen in this work by GATOS collaborator Laura Hermosa Muñoz). On the other hand, when the torus is perpendicular to the plane of the disk, the active galactic nucleus drives outflows that deplete the molecular gas in the central region of the galaxy. In theory, this should drive “negative active galactic nucleus feedback,” a process by which the active black hole limits star formation in its host.
Professor Hicks hinted at future work regarding this active galactic nucleus–host galaxy coupling, particularly in finding ways to test how well-coupled the black hole system is with the host galaxy molecular gas reservoir. She highlighted a recently submitted work by her graduate student Lulu Zhang studying different ionized emission lines as a tracer of the chemical and physical qualities of gas in the nucleus around active black holes. She also discussed the need for population studies which can reveal larger patterns in behavior, like this article by Santiago Garcia-Burillo that uses decades of ALMA observations to find evidence of feedback in the central 50 parsecs of high-luminosity active galactic nucleus hosts. These high-resolution datasets will be crucial for understanding the complex relationship between active galactic nuclei, their dusty tori, and the galaxies in which they live.
SPD Plenary: González Hernández Prize Lecture: Solar Connections: Reflecting and Leaning Forward, Holly R. Gilbert (High Altitude Observatory/NCAR) (by Lexi Gault)
Dr. Holly R. Gilbert was awarded the inaugural Irene González Hernández Prize, which recognizes mid-career scientists for their outstanding contributions to the field of solar physics. This award, as Dr. Gilbert began her talk acknowledging, honors the memory of Irene González Hernández, a solar physicist remembered for her significant contributions and dedication to the solar physics community.
Following this recognition, Dr. Gilbert provided an overview of her career path that she fondly referred to as a “random walk.” Having originally planned to become a concert cellist, Gilbert was drawn to astronomy and decided to pursue a career as a solar physicist. Interested and inspired by images of the Sun, she wanted to understand how it worked and what mechanisms were behind this extremely close star.

An example of a solar prominence. If this prominence were viewed against the Sun’s disk, the relatively cool plasma would appear dark against the solar surface. [NASA/STEREO]
From here, Dr. Gilbert discussed the importance of continuing to study the Sun’s magnetic field and how understanding the corona and solar surface will allow for better predictions and monitoring of solar weather. She highlighted a number of proposed missions including the Chromospheric Magnetism Explorer (CMEx), the Coronal Solar Magnetism Observatory (COSMO), and the Next Generation Global Oscillations Network Group (ngGONG), which would all aid in understanding space weather, unlocking huge discoveries and advancing the field of solar physics. However, Gilbert acknowledged that looking toward the future in the current climate is hard. All of these planned missions and hopes for advanced science are at risk, but she charged the community to stay resilient and work together in order to continue doing the impactful and critical science we are passionate about.
The post AAS 246: Day 2 appeared first on AAS Nova.
]]>
Day 1 of AAS 246 in Anchorage, AK, brought us jets, winds, super-heated stellar coronae, and stunning images of supernovae.
The post AAS 246: Day 1 appeared first on AAS Nova.
]]>Editor’s Note: This week we’re at the 246th AAS meeting in Anchorage, AK, and online. Along with a team of authors from Astrobites, we will be writing updates on selected events at the meeting and posting each day. Follow along here or at astrobites.com for daily summaries, or follow @astrobites.bsky.social on Bluesky for more coverage. The usual posting schedule for AAS Nova will resume on June 16th.
Table of Contents:
- Fred Kavli Plenary Lecture: Unveiling the First 500 Myr of the Universe with CEERS, Steven Finkelstein (University of Texas, Austin)
- Press Conference: Cosmic Accelerators and Active Black Holes
- Helen B. Warner Prize Lecture: Magnetism and Morphology: Decoding the Interstellar Medium, Susan Clark (Stanford University)
- Press Conference: From Molecules to Molecular Clouds: Discoveries in the Milky Way
- George Ellery Hale Prize Lecture: Why are the Coronae of the Sun and Other Stars so Darned Hot?, James Klimchuk (NASA GSFC)
- Plenary Lecture: Supernovae: The Ultimate Laboratories of Extreme Astrophysics, Danny “Dan” Milisavljevic (Purdue University)
Fred Kavli Plenary Lecture: Unveiling the First 500 Myr of the Universe with CEERS, Steven Finkelstein (University of Texas, Austin) (by Olivia Cooper)
Kicking off Day 1 of AAS 246, Professor Steve Finkelstein (UT Austin) gave his prize plenary titled “Unveiling the First 500 Myr of the Universe with CEERS.” In it, he shared the stories and surprises of CEERS (Cosmic Evolution Early Release Science Survey), one of the earliest programs with JWST, comprised of an international team of extragalactic astronomers led by Prof. Finkelstein. Though he admittedly “suffered from a lack of imagination” at first and supposed the survey would merely confirm past assumptions about galaxy evolution, instead CEERS has uncovered new mysteries about galaxies in the very early universe.
Prof. Finkelstein’s main scientific goal is to find out when the lights first turned on, or when galaxies formed out of the cosmic dark ages. To understand this beginning of everything, Finkelstein and his team work to observe galaxies at earlier and earlier times, count them up, and investigate what they look like. With the longer wavelength coverage and sensitivity of JWST, we can push this galaxy counting technique to even earlier times, within the first few 100 million years (of about 14 billion years from the Big Bang to now). Even in the first few days after receiving the first data from CEERS (see Figure 1), the team found a few surprises, all of which have since held up: the early universe is full of (1) too many unexpectedly bright galaxies, (2) galaxies that are too massive, and (3) lots of accreting supermassive black holes. With more detailed data coming in from spectroscopic follow-up programs, the team is now working towards confirming these galaxy puzzles, and eventually determining the physical origins of the seemingly rapidly evolving early universe.

A few team members looking at some of the first data from CEERS at the TACC visualization lab at UT Austin. The image is full of galaxies, and is displayed over multiple screens spanning the room, with the scientists’ silhouettes appearing over the image. [R. Larson]
Press Conference: Cosmic Accelerators and Active Black Holes (by Lucas Brown) (Briefing video)
This press conference session marked the very first of the meeting, and featured five presentations covering various exciting developments in the study of our universe’s biggest and brightest natural particle accelerators.
The first of these presentations, “Multimessenger Probes of Galactic PeVatrons,” was given by Shuo Zhang from Michigan State University. PeVatrons are, broadly speaking, any astrophysical source that is able to accelerate particles to PeV-scale energies. These are thought to include pulsar wind nebulae, supernova remnants, molecular cloud interactions, star-forming regions, and various black hole systems. Zhang shared that her team recently identified a pulsar wind nebula candidate that was spatially associated with an energetic cosmic-ray event detected by the Large High Altitude Air Shower Observatory (LHASSO) known as J0343+5254u. They believe this system could be the source of this particular high-energy event. Additionally, Zhang shared that her team has launched new searches for PeVatron star-forming regions using the IceCube neutrino detector. The full press release can be found here.

A composite image of the galaxy cluster PLCK G287.0+32.9 shown in radio and X-ray emission is displayed. The X-ray signal shines strongest in a central spherical region, while the radio is offset and in the form of two large arcs. [X-ray: NASA/CXC/CfA/K. Rajpurohit et al.; Optical: PanSTARRS; Radio: SARAO/MeerKAT; Image processing: NASA/CXC/SAO/N. Wolk]
Third, in “Chandra Reveals Two Distant Quasars Transforming Universe’s First Light into High-Energy X-Ray Jets,” Jaya Maithil from the Center for Astrophysics | Harvard & Smithsonian talked about quasars, which are the brightest objects in the entire universe. She shared that her team identified two quasars in the early universe (with the light from them originating only 3 billion years after the Big Bang). Quasars from this era are important to understand because this cosmic epoch is when star formation and quasar activity is thought to have peaked. These quasars were detectable thanks to the exceptional power of the Chandra X-ray Observatory and the quasars’ ability to boost cosmic microwave background photons to X-ray energies due to their strong jets. In one of the quasars, the team found that the jet contributed a whopping half of the quasar’s entire energy output, the equivalent of 10 trillion suns! This discovery will hopefully shed light (literally) on the role of quasars in shaping galactic environments in the early universe. The full press release can be found here.
Finally, in “Multi-Phase Shocks and Feedback in a Nearby Spiral Galaxy Revealed by JWST Imaging,” Travis Fischer from the Space Telescope Science Institute informed us on JWST’s new insights into the role of shocks and active galactic nucleus feedback within galaxies. This work focused specifically on a nearby galaxy NGC 4258. While radio emission features in this galaxy have long been assumed to result from active galactic nucleus jets, JWST’s high-resolution observations of substructure in the galaxy for various different materials like iron or dust grains makes the jet-origin scenario less likely. Instead, Fischer’s team believes that a slower-moving active galactic nucleus wind provides a better explanation for the distribution of materials along the regions where radio emission is observed, supporting the idea that extended radio features in galaxies may not always be the result of jets as previously assumed.

This collage features three views of Messier 106, also known as NGC 4258. The first two images show the target in visible light as seen by Kitt Peak National Observatory and the Hubble Space Telescope. The image on the right is from JWST in the infrared. [ESA/Webb, NASA & CSA, J. Glenn, KPNO/NOIRLab/NSF/AURA, the Hubble Heritage Team (STScI/AURA), R. Gendler, M.T. Patterso, T.A. Rector, D. de Martin & M. Zamani; CC BY 4.0]
Helen B. Warner Prize Lecture: Magnetism and Morphology: Decoding the Interstellar Medium, Susan Clark (Stanford University) (by Karthik Yadavalli)
This session, chaired by Grant Tremblay, was the lecture given by Dr. Susan Clark after receiving the Helen B. Warner Prize Lecture. Dr. Clark gave a detailed overview of the interstellar medium (ISM) and how the galactic magnetic field permeates through it. She detailed how the magnetic field can be probed through Faraday rotation, synchrotron radiation polarization of starlight, and polarization of dust emission. One of the key findings presented by Dr. Clark is that the distribution of the magnetic field in the ISM is correlated with the distribution of neutral hydrogen in the ISM. It turns out that even though the neutral hydrogen component isn’t charged, a very small fraction (~10-4) of that hydrogen is actually ionized, allowing the magnetic field to couple to the gas. Therefore, Dr. Clark and her group are able to learn about dust polarization from observations of the neutral hydrogen density and velocity fields.

The velocity field of neutral hydrogen overlaid with the direction of the magnetic field. Color gives the observed line-of-sight velocity and the contours give the direction of the magnetic field. The two are correlated over this patch of the sky. [Adapted from Ade et al. 2023]

A decomposition of the interstellar material into a cold component (top), warm component (middle), and residual noise (bottom) using an autoencoder. [Adapted from Lei et al. 2025]
Press Conference: From Molecules to Molecular Clouds: Discoveries in the Milky Way (by Olivia Cooper) (Briefing video)
This press conference covered recent findings within our home Milky Way galaxy, from the detection of complex dust molecules, to the emergence of elusive stellar activity, to advances in techniques for mapping the galaxy’s gaseous disk.

Artist’s rendition of the cyanocoronene molecule, which has seven interconnected benzene rings and a cyano group. [NSF/AUI/NSF NRAO/P.Vosteen; CC BY 4.0]
Next, in “Discovery of the Elusive Radio Burst Indicators of Massive Eruptions in a Young Active Star,” Atul Mohan (NASA-GSFC/The Catholic University of America) presented the first detection of coronal mass ejection–associated radio bursts in an active star. He noted that though these bursts of radio emission are expected alongside these energetic stellar eruptions, they have not yet been detected in a decades-long search until now, primarily due to line-of-sight effects given that the radio emission is localized.
In “The Spotty Surface of the Blue Giant Xi Persei,” Tahina Ramiaramanantsoa (Arizona State University) showed the second case of bright spots discovered on a massive star. These spots are unexpected for massive stars as they have fundamentally different structures than the Sun, where such spots are typically seen. Through time–frequency analysis of 13 years of space-based observations from small and large satellites, the team found that the spots come and go, but their origin remains unknown.
Peter Craig (Michigan State University) took us from individual molecules and stars to the larger structure of the Milky Way in “A Map of the Outer Gas Disk of the Galaxy with Direct Distances from Young Stars.” Given our viewpoint from within the galaxy, it is challenging to construct a complete map of the gaseous disk of the Milky Way, which we know must have a complex structure. In the past, astronomers have used the motions of the gas relative to our position to infer the structure from a top-down view. However, it is prohibitively challenging to measure the distance to each parcel of gas, meaning these conversions can suffer from inaccuracies. In their recent work, Craig and team demonstrated a new technique to map the disk more accurately and completely: first, they measure the motion of the gas, then, assuming young stars remain near their natal gaseous clouds, measure distances to the stars to estimate the distance to the gas. This has resulted in more accurate maps, which reveal fluffy spiral structures in the galaxy’s gas disk. See the full press release here.

Infrared images of the galactic center, showing gas and dust clouds illuminated in red and blue with a few bright red or blue stars embedded in the clouds. Two star forming regions that were studied are shown as zoomed-in insets, where hot, blue massive stars are seen causing the gas clouds to glow. [J. De Buizer (SETI) / SOFIA / Spitzer / Herschel]
George Ellery Hale Prize Lecture: Why are the Coronae of the Sun and Other Stars so Darned Hot?, James Klimchuk (NASA GSFC) (by Karthik Yadavalli)
This session, chaired by Dawn Gelino, was the lecture given by Dr. James Klimchuk after receiving the George Ellery Hale Prize Lecture. In this talk, Dr. Klimchuk specifically wanted to present about three different studies he did recently, each on three different approaches: observational, theoretical, computational. The guiding question about his research is why the Sun’s corona is so hot. Dr. Klimchuk presented what must be the story of how the corona is structured and heated in this way. Magnetic field lines travel through the solar photosphere, loop through the corona, and loop back into the photosphere. Dynamics of the plasma in the photosphere move around the “foot points” of the magnetic field lines, causing the field lines to get twisted with each other. This twisting causes the field lines to suddenly “snap,” releasing a burst of energy. This energy is thought to heat the corona.

Left: A representative ultraviolet image of the Sun, showing the magnetic field loops in the corona. Right: A zoom in on one active region where a lot of energy can be emitted into the corona. [Slide by James Klimchuk]

Left: A schematic of the simulation, showing the field tube. Right: The flux emitted along one cross section of the field tube as it “snaps.” This flux heats the solar corona. [Slide by James Klimchuk]
Plenary Lecture: Supernovae: The Ultimate Laboratories of Extreme Astrophysics, Danny “Dan” Milisavljevic (Purdue University) (by Lucas Brown)

JWST NIRCam image of the supernova remnant Cassiopeia A. [NASA, ESA, CSA, STScI, Danny Milisavljevic (Purdue University), Ilse De Looze (UGhent), Tea Temim (Princeton University)]

Dan Milisavljevic speaks at AAS 246. [Lucas Brown]
The post AAS 246: Day 1 appeared first on AAS Nova.
]]>
This week we’ll be bringing you updates from the 246th AAS meeting happening in Anchorage, AK.
The post AAS 246: Welcome! appeared first on AAS Nova.
]]>This week, AAS Nova and Astrobites are attending the American Astronomical Society (AAS) summer meeting in Anchorage, AK.
AAS Nova Editor Kerry Hensley and AAS Media Fellow Lexi Gault will join Astrobites Media Interns Lucas Brown and Maggie Verrico along with Astrobiters Olivia Cooper and Karthik Yadavalli to live-blog the meeting for all those who aren’t attending or can’t make it to all the sessions they’d like. We plan to cover all of the plenaries and press conferences, so follow along here on aasnova.org or on astrobites.org! You can also follow Astrobites on Bluesky at astrobites.bsky.social for more meeting content.
Where can you find us during the meeting? We’ll be at the Astrobites booth in the Exhibit Hall all week — stop by and say hello! You can also find Kerry and Lexi at the press conferences Monday through Wednesday, with AAS Nova Editor Susanna Kohler assisting online. AAS press conferences are open to all in-person and virtual meeting attendees, and they can also be viewed on the AAS Press Office YouTube channel for anyone not attending the meeting.
Finally, you can read the currently published AAS 246 keynote speaker interviews, which were conducted by Astrobiters Neev Shah, Lucas Brown, Maria Vincent, Sowkhya Shanbhog, Maggie Verrico, and Karthik Yadavalli. Be sure to check back all week as the remainder are released!
Education, Outreach, and More at AAS 246
AAS 246 features a broad range of sessions related to education and outreach. For a comprehensive and curated list of sessions, check out this post from AAS Education Program Manager Tom Rice. Here are a few highlights (all times AKDT; must be logged in to aas.org for links to work correctly):
Monday will kick things off with multiple education-related poster sessions in the Exhibit Hall from 9:00 to 10:00 am. This poster session will immediately be followed by the Education and Public Engagement oral session from 10:00 to 11:30 am, and there will be an eclipse-related special session from 2:00 to 3:30 pm. Close out your day at 49th State Brewing with an informal gathering of astronomy educators starting at 7:30 pm; RSVP here (optional but encouraged).
Tuesday begins with an education-related special session, Sharing Astronomy with Blind and Low Vision Audiences, from 10:00 to 11:30 am, immediately followed by an outreach event at the Anchorage Museum from 11:30 am to 1:30 pm. This event will feature a Sun observation table, solar telescopes, live music, and more; learn more about the event here. In the afternoon, check out the education-related parallel oral sessions Undergraduate Research with the Rubin Observatory and Moving Toward Mutuality in Astronomy Today from 2:00 to 3:30 pm.
On Wednesday, you can take your pick of six education-related parallel sessions, three in the morning from 10:00 to 11:30 am and three in the afternoon from 2:00 to 3:30 pm.
Thursday begins with three education-related poster sessions, Education and Public Outreach, Education Research, and Community and Profession, from 9:00 to 10:00 am in the Exhibit Hall. Finally, be sure to stick around for the closing plenary from 11:40 am to 12:30 pm, “The Current Landscape for Science Policy and How YOU Can Make a Difference.”
The post AAS 246: Welcome! appeared first on AAS Nova.
]]>
The AAS Publishing team looks forward to engaging with attendees at the upcoming summer meeting of the AAS. Here's what they'll be up to at the meeting.
The post AAS Publishing at AAS 246 in Anchorage appeared first on AAS Nova.
]]>Hundreds of astronomers are soon to assemble in Anchorage, AK, for the 246th meeting of the American Astronomical Society. The AAS Publishing team looks forward to connecting with meeting attendees, and you can find various members of the publishing and journals’ editorial staff at the AAS booth in the Exhibit Hall in the Dena’ina Civic & Convention Center. Ethan Vishniac (AAS Journals Editor in Chief) and Frank Timmes (Associate Editor in Chief and Lead Editor of the High Energy Phenomena and Fundamental Physics research corridor) will be available at the booth throughout the week, and Kerry Kroffe (AAS Director of Scholarly Publishing) will be staffing the booth on Wednesday and Thursday. Be sure to stop by the AAS booth in the Exhibit Hall to say hello, chat about the journals, and pick up some swag! While the trio of AAS data editors won’t be present at this meeting, they’re just an email away; reach out to data-editors@aas.org to have your data questions answered.
AAS Nova Editor Kerry Hensley, AAS Media Fellow Lexi Gault, Astrobites Media Interns Lucas Brown and Maggie Verrico, and the rest of the Astrobites team will also be available periodically at the Astrobites booth in the Exhibit Hall, while AAS Nova Editor Susanna Kohler will be available via the AAS 246 Slack workspace. We look forward to seeing you there!
Open Science at AAS 246
Note: The links in this section take you to the corresponding entries in the AAS 246 block schedule. You must be logged in for the links to work correctly; otherwise, they will take you to the main block schedule page.
Looking to learn more about open science? Here are a few sessions to get you acquainted. On Tuesday, the oral session “Open Science & Computation, Data Handling, and Image Analysis” will be held from 10:00 to 11:30 am AKDT in the Dena’ina Civic & Convention Center, Tubughnenq’ 4. This session will cover everything from the sonification of galaxy images to enable aural classification of galaxies to a spectroscopic data reduction pipeline that is being tuned to process JWST data.
Wednesday’s oral session “Community and Profession,” held from 10:00 to 11:30 AKDT in Dena’ina Civic & Convention Center, Tubughnenq’ 4, will also cover a broad range of topics. Of particular interest are a discussion of the past successes and future plans of the multi-institution Solar wind with Hydrogen Ion charge Exchange and Large-Scale Dynamics (SHIELD) DRIVE Science Center, which aims to advance our understanding of the heliosphere while broadening the heliospheric community; a presentation about the LightSound project, which continues to make solar eclipses more accessible to the blind and low-vision community; and an exploration of how the principles of architectural Universal Design can be used to make astronomy more accessible. This talk will include a description of how these principles can be applied to academic departments, conferences, and outreach and will offer guiding questions for departments wanting to become more accessible to those with disabilities.
Finally, on Thursday from 1:00 to 2:00 pm AKDT in the Dena’ina Civic & Convention Center Exhibit Hall, there will be a poster session on “Computation, Data Handling, Image Analysis.” These posters will focus on improving astronomical search algorithms, tools for background subtraction, high-precision image alignment, and more.
The post AAS Publishing at AAS 246 in Anchorage appeared first on AAS Nova.
]]>
If you measure the age of a star using two different methods, do those ages agree? New research shows where our age estimates might be mismatched and what this disagreement could mean.
The post Star-Crossed Clusters: When Ages Are at Odds appeared first on AAS Nova.
]]>There’s more than one way to measure the age of a star in a cluster. But do different age-assigning methods agree?
Assessing Ages
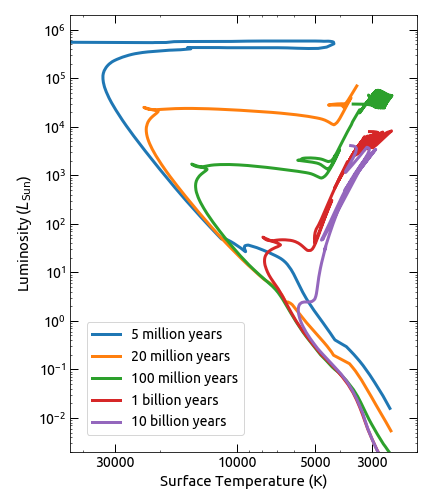
Examples of isochrones for star clusters of various ages. [Ivan Ramirez; CC BY 4.0]
However, most stars do not reside in clusters, and to measure the ages of stars that roam the galaxy solo or in small groups, astronomers must use other methods. One method is asteroseismology, in which researchers measure the changes in a star’s brightness or the motion of its surface due to sound waves bouncing around in its interior. Asteroseismology can reveal critical information about a star’s interior structure, composition, and age, but it’s not yet clear how asteroseismic age estimates compare to well-established isochrone-fitting methods for star clusters.
Measurement Matchup
To investigate how these methods compare, Jamie Tayar (University of Florida) and Meridith Joyce (University of Wyoming) compared the age estimates from asteroseismology and isochrone-fitting methods for seven well-studied open and globular clusters. The team scoured the literature for asteroseismic measurements of red giant stars, which are commonly used to calibrate studies of the Milky Way’s history and evolution, and selected a representative age for each cluster from isochrone-fitting methods from the literature.
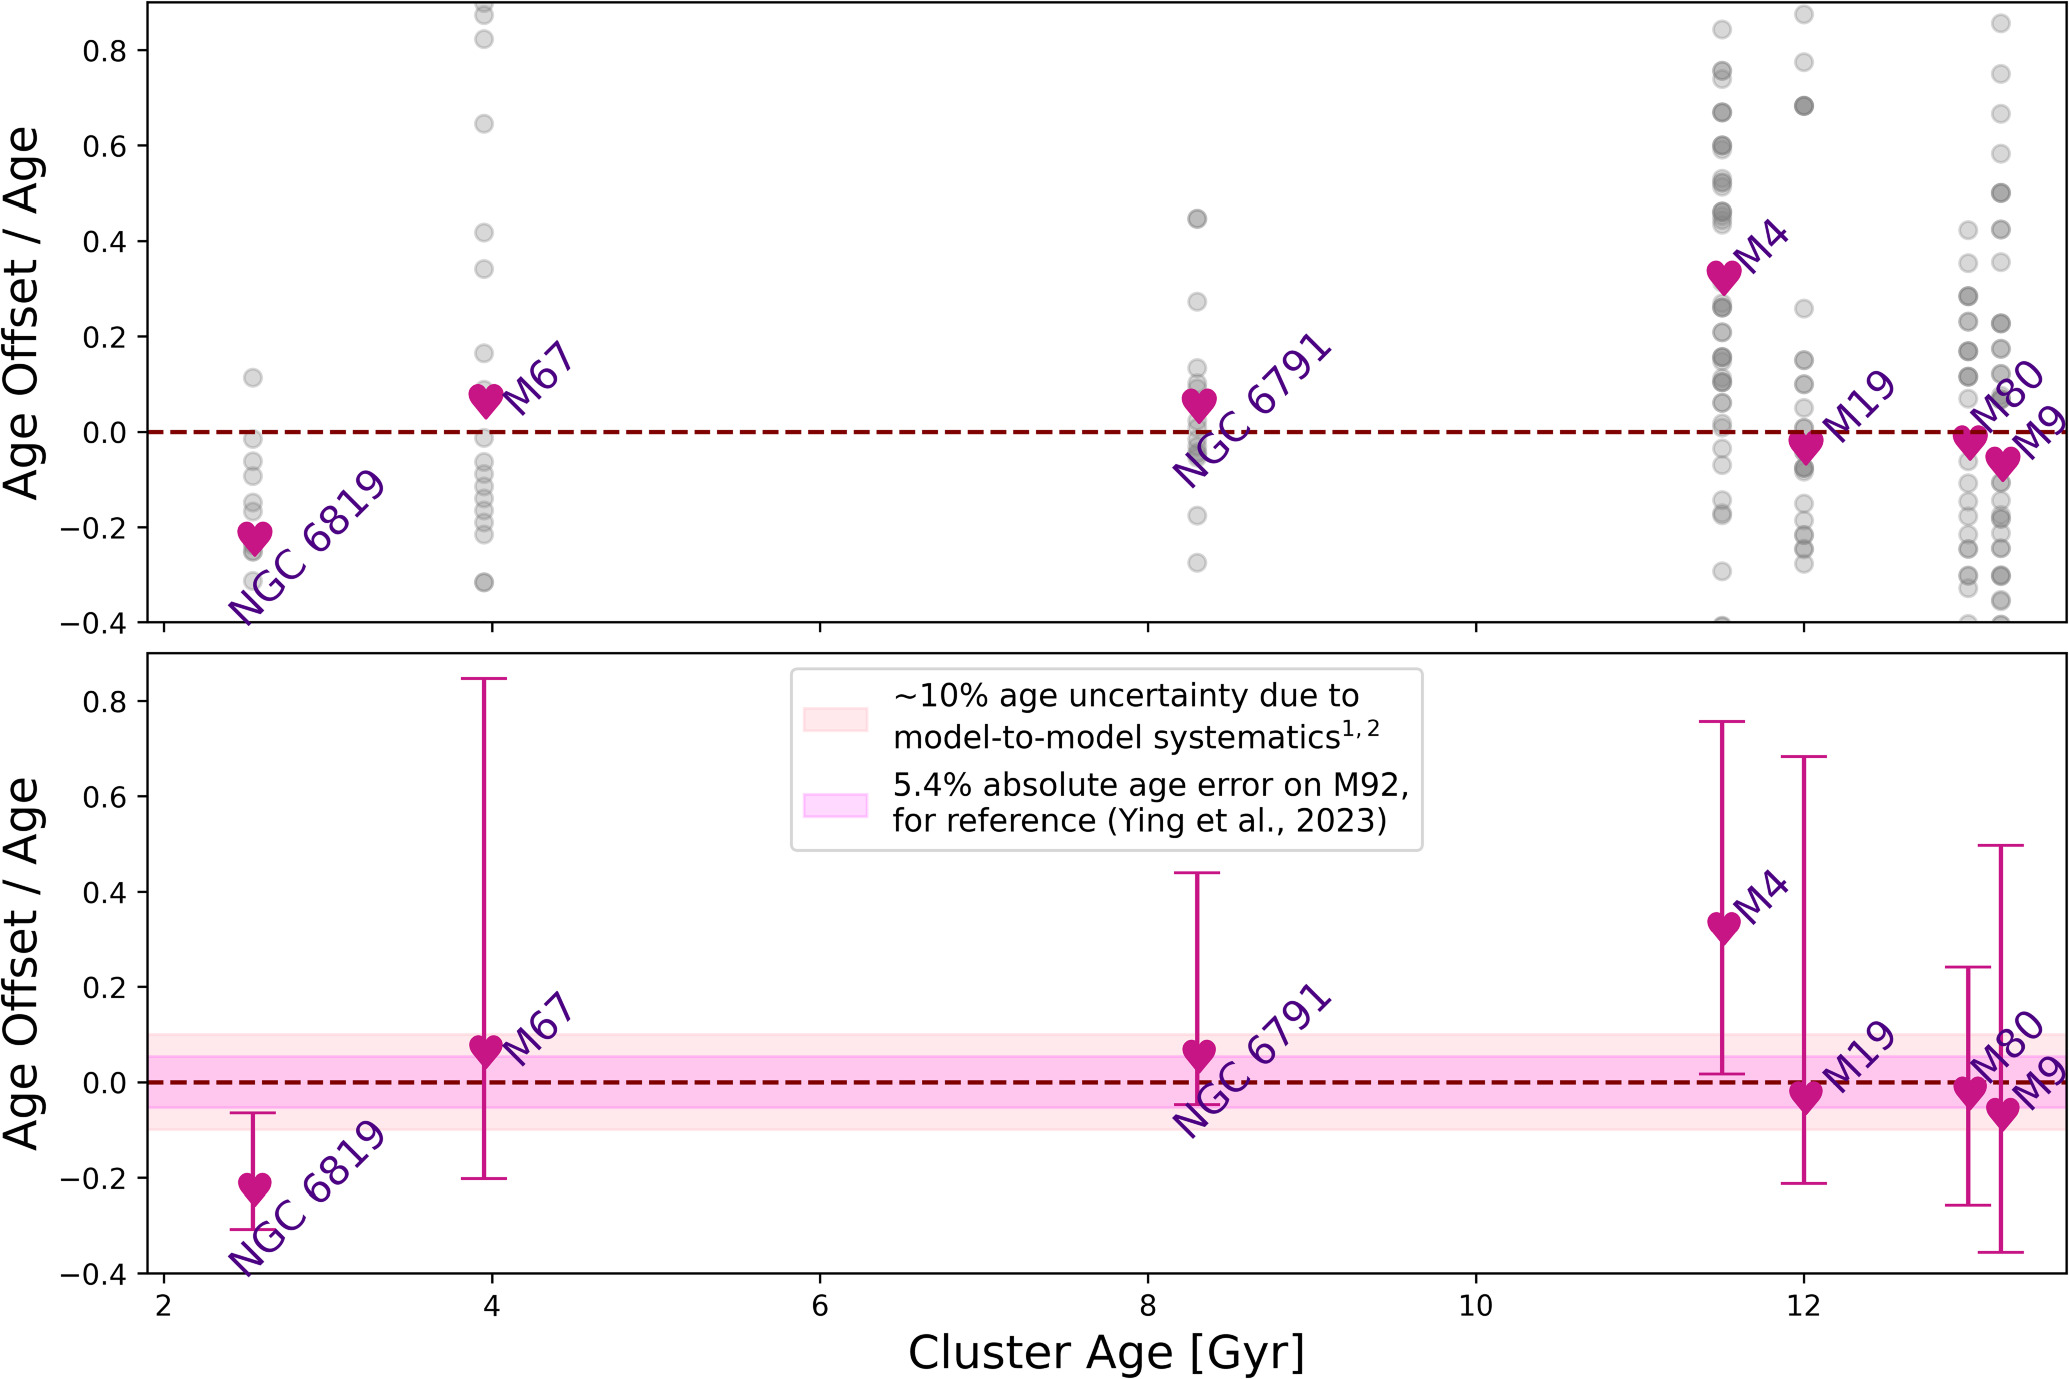
Offsets between asteroseismic ages and cluster ages for seven well-studied clusters. Asteroseismic measurements of individual stars are shown as gray circles, with the median values indicated by the pink hearts. The bottom panel shows the asymmetric dispersion of the asteroseismic data. [Tayar & Joyce 2025]
In addition, two of the seven samples had median ages far from the isochrone-fitting cluster age. For these two clusters, especially the well-constrained open cluster NGC 6819, it’s possible that the asteroseismic ages and cluster age are systematically offset from one another — a possibility that would require a dedicated asteroseismic search with a single observatory and a single analysis pipeline to investigate further.
Ages at Odds
Asteroseismic stellar ages are increasingly used to probe the history of the Milky Way and calibrate other age determination methods — so what does it mean for the asteroseismic results to be so varied and potentially offset from the cluster fitting method?
It may mean that asteroseismic measurements require further investigation and calibration before they can achieve the accuracy necessary for galactic archaeology. Part of this endeavor may involve an investigation of binary processes such as accretion or mergers that could alter the masses of individual stars, affecting their inferred ages. These efforts could potentially unlock hundreds of thousands of stellar age measurements from past, present, and future datasets, aiding studies that explore everything from individual stars and their planets to the histories of entire galaxies.
Citation
“Star-Crossed Clusters: Asteroseismic Ages for Individual Stars Are in Tension with the Ages of Their Host Clusters,” Jamie Tayar and Meridith Joyce 2025 ApJL 984 L56. doi:10.3847/2041-8213/adcd6f
The post Star-Crossed Clusters: When Ages Are at Odds appeared first on AAS Nova.
]]>
Astrobites reports on a new method being used to explore the relationship between the mass of a supermassive black hole and the properties of the galaxy it inhabits.
The post Jumping Through Hoops: A New Way to Explore the Black Hole–Galaxy Connection appeared first on AAS Nova.
]]>Editor’s Note: Astrobites is a graduate-student-run organization that digests astrophysical literature for undergraduate students. As part of the partnership between the AAS and astrobites, we occasionally repost astrobites content here at AAS Nova. We hope you enjoy this post from astrobites; the original can be viewed at astrobites.org.
Title: A Novel Approach to Understanding the Link Between Supermassive Black Holes and Host Galaxies
Authors: Gabriel Sasseville et al.
First Author’s Institutions: University of Montreal; Ciela—Montreal Institute for Astrophysical Data Analysis and Machine Learning; Center for Research in Astrophysics of Québec
Status: Published in ApJ
Most galaxies are thought to host a central supermassive black hole, and these black holes play a crucial role in shaping how galaxies evolve. There is a strong connection found between the properties of a galaxy and its central black hole. One of the most well-known examples is the relationship between the black hole’s mass and the random motions of stars near the galaxy’s center, measured by a quantity called stellar velocity dispersion (denoted as σ). This connection, known as the M–σ relationship, has been studied for decades and is often used to estimate the mass of a galaxy’s central black hole.
Interestingly, some galaxies appear to lack a central black hole. In many cases, observations only provide an upper limit on the possible mass of any black hole that might be there. In today’s article, the authors study the M–σ relationship with a new statistical approach to account for galaxies that might not have a central black hole and improve the calculation of this relationship.
Hurdle Up, the Bayesian Way
The authors use a statistical method called the Bayesian hurdle model. To update our understanding, Bayesian modeling combines prior beliefs or initial guesses with new evidence. The Bayesian hurdle model approach tackles two key questions: first, whether a galaxy is likely to host a central black hole, and second, if it does, how the black hole’s mass relates to the galaxy’s velocity dispersion (σ). The model works in two stages. In the first step, called the “hurdle,” a logistic regression determines the probability that a galaxy has a central black hole. If the galaxy clears this hurdle (i.e., is likely to host a black hole), the second step uses linear regression to establish the relationship between the black hole’s mass and the galaxy’s velocity dispersion, analyzed on a logarithmic scale.
The study examines a sample of 244 galaxies where either the central black hole mass has been measured directly or an upper limit has been estimated. From the logistic regression step, the authors find that galaxies with σ > 126 km/s have a 99% probability of hosting a central black hole. This result suggests that while massive galaxies are almost certain to have black holes, smaller dwarf galaxies are much less likely to host them.
A Steeper Correlation
The hurdle model reveals a relationship of M ∝ σ5.8 between black hole mass and velocity dispersion, as shown in Figure 1 (solid black line). This result is steeper than the correlations found in previous studies. The difference likely arises from the authors’ inclusion of upper limits on black hole masses in their hurdle model analysis. The hurdle model also predicts several under-massive black holes in the range of 101–105 solar masses compared to other linear model studies. This downward shift in the lower mass range compared to other models is seen in Figure 1. Also, the breakpoint between under-massive and over-massive black holes occurs at a lower mass than previously reported. This shift is due to the hurdle model’s handling of upper limits in the logistic regression step, which pulls the curve downward.
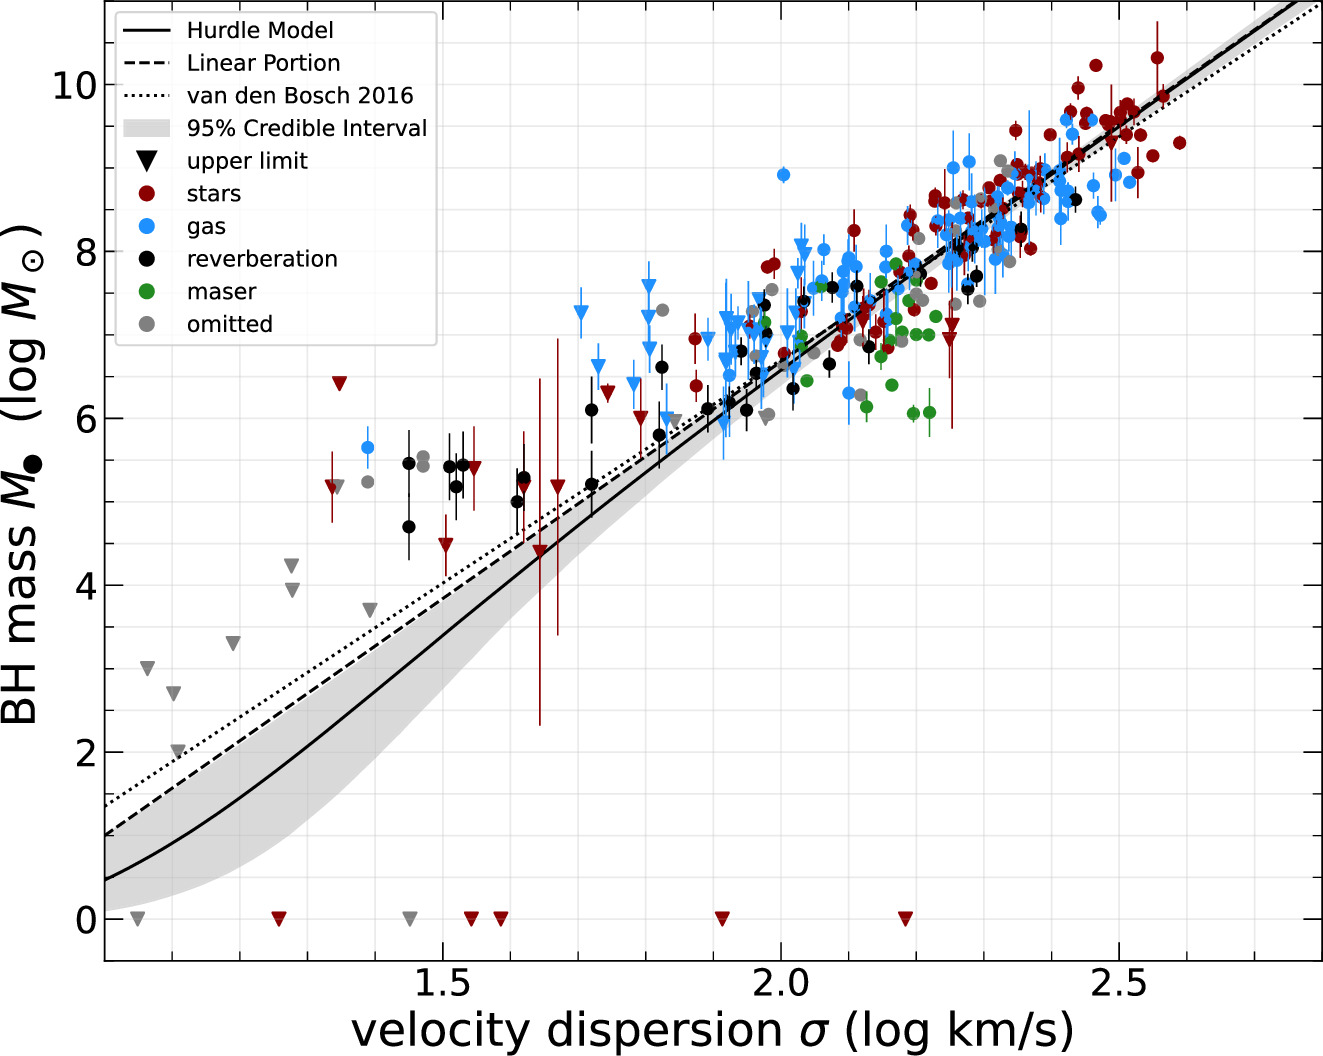
Figure 1: Relationship between the black hole mass and velocity dispersion (σ). The upper limits on the black hole masses are plotted in triangles while the circles indicate more precise measurements. The dotted black line shows the linear fit obtained in a previous study of this correlation. The hurdle model fit is shown as a solid black line while the dashed black line is the linear portion of the fit. Notice that the slope of the hurdle model fit (solid black line) is steeper than the fit from the previous study (dotted black line). [Sasseville et al. 2025]
Original astrobite edited by Cole Meldorf.
About the author, Pranav Satheesh:
I am a graduate student in physics at the University of Florida. My research focuses on studying supermassive binary and triple black hole dynamics using cosmological simulations. In my free time, I love drawing, watching movies, cooking, and playing board games with my friends.
The post Jumping Through Hoops: A New Way to Explore the Black Hole–Galaxy Connection appeared first on AAS Nova.
]]>
New JWST images of the Ring Nebula reveal a dusty disk around the nebula's central star — just the second resolved disk known around a planetary nebula's central star.
The post Featured Image: JWST Examines the Ring Nebula appeared first on AAS Nova.
]]>The iconic and widely photographed Ring Nebula is one of the most recognizable planetary nebulae: short-lived, often brilliantly colored nebulae that form when low- to intermediate-mass stars shed their outer layers. The three images above show the central region of the Ring Nebula through the eyes of JWST’s Mid Infrared Instrument. The leftmost image clearly shows the Ring Nebula’s central star: a hot, crystallized stellar core called a white dwarf. In a recent research article, Raghvendra Sahai (Jet Propulsion Laboratory) and collaborators analyzed these JWST observations, leading to the discovery of a dusty disk around the Ring Nebula’s central star. This is just the second time that a resolved disk has been discovered around the central star of a planetary nebula. Disks with radii from 0.01 to 1,000 au have been found around evolved stars in the asymptotic giant branch phase through the planetary nebula phase, but it’s not yet clear how these disks form and how long they last. Most intriguingly, the presence of disks around highly evolved stars raises the possibility of a second phase of planet formation. To learn more about the JWST observations of the Ring Nebula, and what they tell us about the properties of the central star and its disk, be sure to check out the full research article linked below.
Citation
“JWST Observations of the Ring Nebula (NGC 6720). III. A Dusty Disk Around Its Central Star,” Raghvendra Sahai et al 2025 ApJ 985 101. doi:10.3847/1538-4357/adc91c
The post Featured Image: JWST Examines the Ring Nebula appeared first on AAS Nova.
]]>
Sub-Neptunes may be the most abundant planet type in the galaxy, but they are not yet well understood. A recent study uses JWST to characterize the atmosphere of the sub-Neptune GJ 3090b to aid in the study of these planets.
The post Abundant but Ambiguous: Understanding the Atmospheres of Sub-Neptunes with JWST appeared first on AAS Nova.
]]>Recent JWST observations of exoplanet GJ 3090b reveal intriguing qualities of one of the galaxy’s most abundant planet types.
Many Sub-Neptunes, Many Mysteries
Over the past 30 years, astronomers have discovered thousands of distant worlds. Within the growing exoplanet population, the sub-Neptune — a planet with a mass and radius between Earth’s and Neptune’s — has emerged as the most common planet type in the Milky Way. However, the composition and structure of these planets are not yet well understood. While sub-Neptunes orbiting Sun-like stars seem to separate into a small, rocky population and a larger, gaseous population, sub-Neptunes around cooler, lower-mass stars do not show such a clear division.
For sub-Neptunes around Sun-like stars, the population separation between rocky and gaseous planets is inferred from a dearth of planets with radii between 1.8 and 2 times the Earth’s radius (a gap dubbed the “radius valley”). This gap provides hints to the formation and evolutionary processes that shaped the planet, but with a murkier radius valley for sub-Neptunes around lower-mass stars, their origins are more unclear. Recent observations of sub-Neptunes have revealed a diverse range of atmospheric compositions, further bolstering the need to continue exploring the galaxy’s most prevalent planet type.
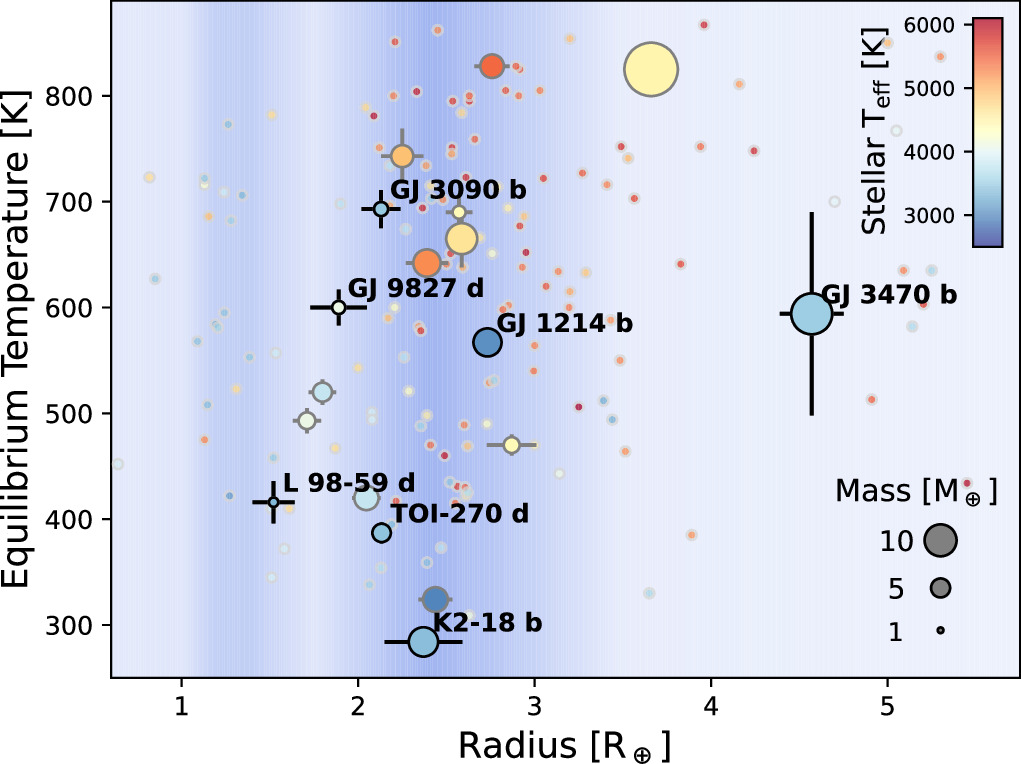
Planet equilibrium temperature versus planet radius plot showing where GJ 3090b falls with respect to the general sub-Neptune population. Click to enlarge. [Ahrer et al 2025]
JWST Observations of GJ 3090b
Aiming to add to the sample of well-characterized sub-Neptune atmospheres, Eva-Maria Ahrer (Max Planck Institute for Astronomy) and collaborators collected JWST spectroscopy of the sub-Neptune GJ 3090b. Previously discovered with the Transiting Exoplanet Survey Satellite (TESS), GJ 3090b orbits a late-type, low-mass star and has a radius that places it at the outer edge of the radius valley.
With the JWST spectroscopy, the authors search for a helium signature that traces how hydrogen and helium may be escaping the planet’s atmosphere. The authors detect a low-amplitude helium signature that suggests GJ 3090b has a metal-enriched atmosphere that slows down mass loss and weakens the helium feature. Additionally, the spectrum reveals the presence of heavy molecules like water, carbon dioxide, and sulfur dioxide, which points again to the planet’s atmosphere being metal enriched. What does this composition tell us about the planet?
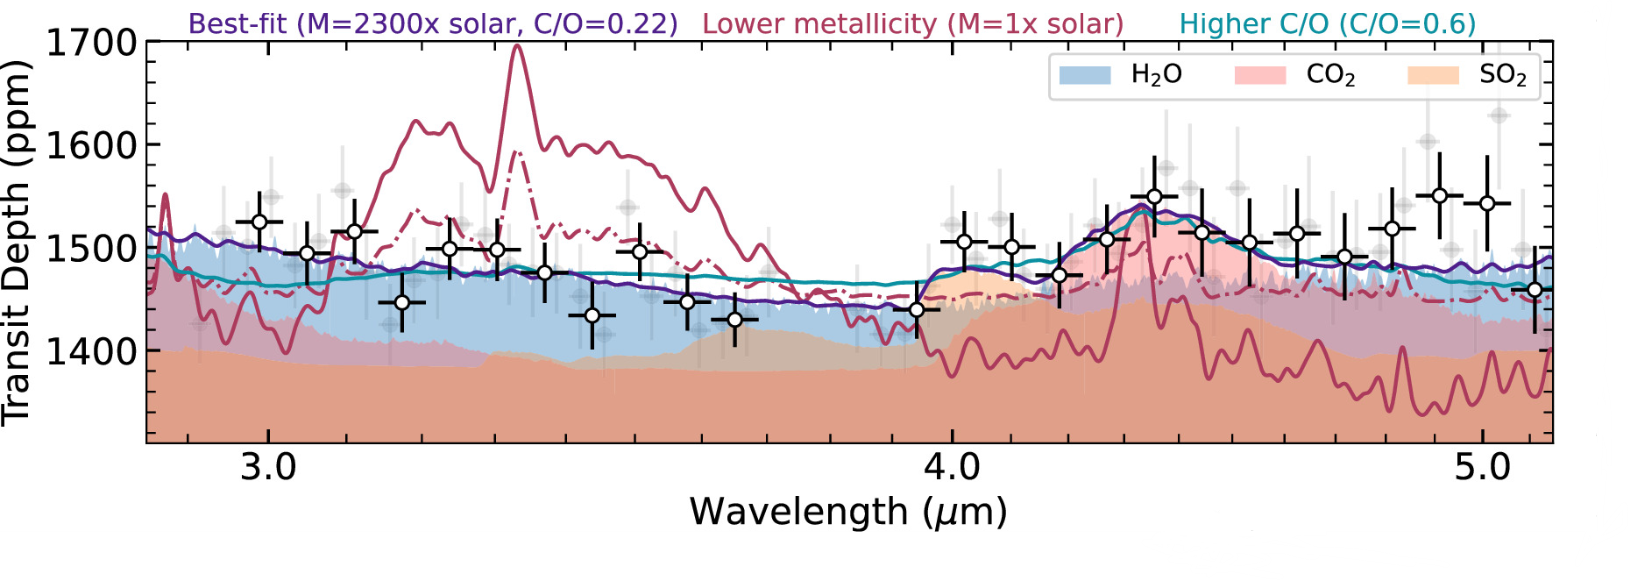
JWST spectrum of GJ 3090b’s atmosphere. The spectrum is best fit with a high-metallicity model. Click to enlarge. [Modified from Ahrer et al 2025]
Exploring Metal Enrichment and Planet Structure
Given the makeup of GJ 3090b’s atmosphere, the authors explore various theoretical models to understand why this planet may have a high-metallicity atmosphere. If the planet formed past its system’s snow line, where it is cool enough for water to freeze, the planet could have accreted water ice laced with enriched material. As the planet migrated inwards, the heat from the star melted the ice, allowing the enriched material to escape into the atmosphere.
Alternatively, sub-Neptunes close to their host stars are expected to lose significant amounts of hydrogen and helium due to hydrodynamic effects. When these light elements escape the atmosphere, the remaining gas contains a higher fraction of metals as it is now less diluted with hydrogen and helium. Additionally, using structure models, the authors predict that GJ 3090b has a well-mixed core of rock and ice, further supporting the idea that it formed farther out where water could freeze and then migrated inward.
However, further high-resolution observations are needed to better constrain the true abundances of the metals in GJ 3090b’s atmosphere, which leaves the planet’s history and structure still a little hazy. With JWST opening the window for detailed atmospheric studies of exoplanets, more observations will allow astronomers to understand and characterize planets across the Milky Way.
Citation
“Escaping Helium and a Highly Muted Spectrum Suggest a Metal-enriched Atmosphere on Sub-Neptune GJ3090b from JWST Transit Spectroscopy,” Eva-Maria Ahrer et al 2025 ApJL 985 L10. doi:10.3847/2041-8213/add010
The post Abundant but Ambiguous: Understanding the Atmospheres of Sub-Neptunes with JWST appeared first on AAS Nova.
]]>
Introducing exoALMA: a survey of 15 large, bright protoplanetary disks that has revealed gas structures that point to potential planet formation.
The post Monthly Roundup: A Deep View of Planet-Forming Disks with ALMA appeared first on AAS Nova.
]]>Protoplanetary disks, the sites of planet formation around young stars, are rich and complex objects. An in-depth investigation of 15 protoplanetary disks has recently been published in a Focus Issue of the Astrophysical Journal Letters. This investigation leveraged the exquisite resolution and sensitivity of the Atacama Large Millimeter/submillimeter Array (ALMA), a moveable network of 66 radio dishes in the Atacama Desert in Chile.
Featuring high-resolution observations of multiple gas species, updated image processing techniques, and state-of-the-art modeling, the exoALMA project examines the early stages of planet formation, when protoplanets embedded within dusty disks induce rings, gaps, spirals, and other structures.
This Monthly Roundup consists of quick snippets describing each of the currently published research articles in the exoALMA Focus Issue of the Astrophysical Journal Letters. Each snippet links to the corresponding research article, and the Focus Issue landing page is linked at the bottom of this post.
Introducing exoALMA
The full exoALMA sample. All 15 disks show evidence of substructure in their gas emission. [Teague et al. 2025]
Interpreting interferometric data from ALMA requires special care, as Ryan Loomis (National Radio Astronomy Observatory) and coauthors show in their overview of the data calibration and imaging pipeline. The team described their methods of processing the data, including a recently developed alignment method that greatly reduces the number of artifacts that could be mistaken for planet-induced velocity perturbations.

Emitting height from images processed using the standard method (CLEAN) and using regularized maximum likelihood (RML). [Adapted from Zawadzki et al. 2025]
Analysis Methods and Toolkit Testing
Analyzing observations of protoplanetary disks is challenging, motivating Thomas Hilder (Monash University) and collaborators to take the first step toward addressing issues like beam smearing, the creation of probabilistic data products, and incorporating a realistic noise model. Using their newly developed methods, the team analyzed several disks in the exoALMA sample, finding velocity substructures at greater velocities than existing methods.

Vertical structure and Keplerian rotation of the exoALMA sample as inferred from modeling. Click to enlarge. [Izquierdo et al. 2025]
Jaehan Bae (University of Florida) and collaborators drew attention to the tools astronomers use to interpret observations of protoplanetary disks — namely, forward models. Bae’s team used five different hydrodynamics models to simulate a protoplanetary disk harboring an embedded giant planet. Then, they used two radiative transfer models to simulate carbon monoxide channel maps and calculate the temperature of the disk. Finally, they extracted the location of the synthetic planet. This investigation ultimately showed good agreements between the model outputs, showing that any combination of the models tested in this work is suitable.

Residual signal-to-noise ratio for the exoALMA sample, ordered from least to most nonaxisymmetric. Rings and gaps are marked with solid and dashed ellipses, respectively. Click to enlarge. [Curone et al. 2025]
Seeking Structure
A team headed by Pietro Curone (University of Milan; University of Chile) examined the rich ALMA dataset for signs of structure within the disks. The team modeled each disk with an axisymmetric model, then subtracted off the best-fitting model to reveal substructures and asymmetries in the disks. Several features were revealed, including shadows, offsets between inner and outer disks, spiral structures, and crescent-shaped asymmetries. Though one disk, PDS 66, was apparently without any internal structure, this investigation showed that structures are common in this sample of large, bright disks. Further work is needed, however, to explore whether these features are common in the disk population as a whole.
Maria Galloway-Sprietsma (University of Florida) and collaborators identified the disk surfaces that emit particular spectral lines. The team found that 12CO traced the upper atmosphere of the disks, while 13CO — an isotopologue of the more common molecule 12CO — and CS (carbon monosulfide) probed deeper regions. In addition, nearly all of the disks showed evidence of localized substructure, highlighting the need for theoretical work to explain the wide variety of disk structures and behaviors.
Evidence for Planets

From top to bottom: velocity kinks associated with an embedded planet; 12CO observations with the identified velocity kinks; filtered ALMA observations, showing the location of the planetary wake; exoALMA continuum emission; and polarimetric images. The blue circles show the locations of the purported planets. Click to enlarge. [Pinte et al. 2025]
Charles Gardner (Rice University; Los Alamos National Laboratory) and coauthors focused on LkCa 15, a disk that appears markedly different in dust and gas emission. The disk’s dust continuum emission shows a 40-au-wide region depleted of dust, while the gas emission, traced by CO, shows no depletion of gas in the same region. Though previous infrared observations have suggested that this dust-depleted region could host massive planets, Gardner’s team concluded that a chain of small planets or processes unrelated to planet formation likely excavated the region instead.
A team led by Jochen Stadler (Côte d’Azur University) searched for deviations from Keplerian rotational velocity — potential evidence for embedded protoplanets. The team discovered deviations up to 15% from the background velocity, with deviations appearing at both large and small radial scales. Rings and gaps visible in the dust emission tended to align with gas pressure maxima and minima, respectively. However, the team also found gas pressure structures in the outer disk that were beyond the dust emission and were not accompanied by rings or gaps.

Comparison of kinematic and emission-line-derived masses. Click to enlarge. [Trapman et al. 2025]
Masses and Abundances
A team led by Cristiano Longarini (University of Cambridge; University of Milan) put the disks of the exoALMA sample on the scale. By modeling the rotation curves of 12CO and 13CO, the team constrained the masses of 10 disks and their central stars. Leon Trapman (University of Wisconsin-Madison) and collaborators also considered the problem of disk masses. The team used CO and N2H+ emission to measure the gas masses of 11 disks in the exoALMA sample and compared the results to previous kinematic measurements. The two sets of measurements tend to agree within a factor of three.
Giovanni Rosotti (University of Milan) and collaborators introduced a new model that connects the emitting height of CO molecules to the gas surface density and temperature. Unlike existing models, the team’s new model can be applied to optically thick observations. Comparing the results of this new method with dynamical estimates relying on interstellar medium abundances of CO yields lower gas masses, suggesting that the CO abundance in the protoplanetary disks studied is depleted relative to the interstellar medium.
Turbulence, Traps, and Vortices
Protoplanetary disks are expected to experience turbulence, large-scale gas motions, and instabilities. Marcelo Barraza-Alfaro (Massachusetts Institute of Technology) and collaborators investigated whether a program like exoALMA could detect signs of these processes at work. The team used 3D numerical simulations to explore the observational signatures of the vertical shear instability, the magnetorotational instability, and the gravitational instability. They found that rings, arcs, and spirals can arise from instabilities. While spirals present in the disks in the exoALMA sample could feasibly be due to the magnetorotational instability or the gravitational instability, ring-like and arc-like features due to the vertical shear instability were not detected.
Tomohiro Yoshida (National Astronomical Observatory of Japan; The Graduate University for Advanced Studies) and collaborators reported on their detection of pressure-broadened emission-line wings in RX J1604.3−2130 A. This detection allowed the team to constrain the disk’s gas surface density — a critical property related to the mass available to form planets. They also clearly showed a dust ring coinciding with a gas pressure maximum, proving that gas pressure maxima can create dust traps. The gas-to-dust surface density ratio at the location of this dust trap suggests that the disk has already birthed protoplanets or the dust trapping efficiency is low.

Locations of crescent-shaped dust clumps in the four disks from this study. Click to enlarge. [Adapted from Wölfer et al. 2025]
The full list of articles in this Focus Issue can be found here.
Citation
“exoALMA. I. Science Goals, Project Design, and Data Products,” Richard Teague et al 2025 ApJL 984 L6. doi:10.3847/2041-8213/adc43b
The post Monthly Roundup: A Deep View of Planet-Forming Disks with ALMA appeared first on AAS Nova.
]]>
Astrobites reports on a curious cluster of stars moving together near Sgr A*. Is it a stellar coincidence, or a sign of a hidden black hole?
The post Stars on the Move: New Insights from the Galactic Center appeared first on AAS Nova.
]]>Editor’s Note: Astrobites is a graduate-student-run organization that digests astrophysical literature for undergraduate students. As part of the partnership between the AAS and astrobites, we occasionally repost astrobites content here at AAS Nova. We hope you enjoy this post from astrobites; the original can be viewed at astrobites.org.
Title: Discovery of a Dense Association of Stars in the Vicinity of the Supermassive Black Hole Sgr A*
Authors: S. Elaheh Hosseini et al.
First Author’s Institution: University of Cologne and Max Planck Institute for Radio Astronomy
Status: Published in ApJ
The galactic center is a dynamic region at the heart of the Milky Way that is home to a supermassive black hole named Sgr A* (Sagittarius A-Star). It is densely packed with stars, gas, and dust, all interacting in fascinating ways. One challenge in studying this region is understanding the movement of stars, particularly those near the black hole, where gravitational forces are intense.
Astronomers have previously observed stars with unusual motions near Sgr A*, but a recent study highlights 42 sources near IRS 1W, an infrared source and well-known bow-shock source near the center of the galaxy. These sources are moving northward towards Sgr A*, and their behavior offers new insights into the region’s dynamics. What do the distributions, origins, and potential connections of these stars reveal about the enigmatic region surrounding Sgr A*?
What Are the N-Sources?
The study identifies these 42 sources, referred to as the N-sources (see Figure 1), as a group of stars moving northward relative to the central black hole. Their spatial distributions and proper motions reveal they are more clustered than stars in random regions at a similar distance from Sgr A*. This clustering, combined with their motion, suggests that the N-sources near the galaxy’s center may be part of a stellar association — a group of stars moving together in the same direction but not held together by gravity.

Figure 1: Image from 2005 showing the location of the N-sources and other IRS sources near the galactic center. The position of Sgr A* (the supermassive black hole) is indicated by the “x.” The N-sources are located about 6.05′′ from Sgr A* in this Ks-band image, which is sensitive to wavelengths of light slightly longer than visible light and is often used to observe regions obscured by dust. [Hosseini et al. 2024]
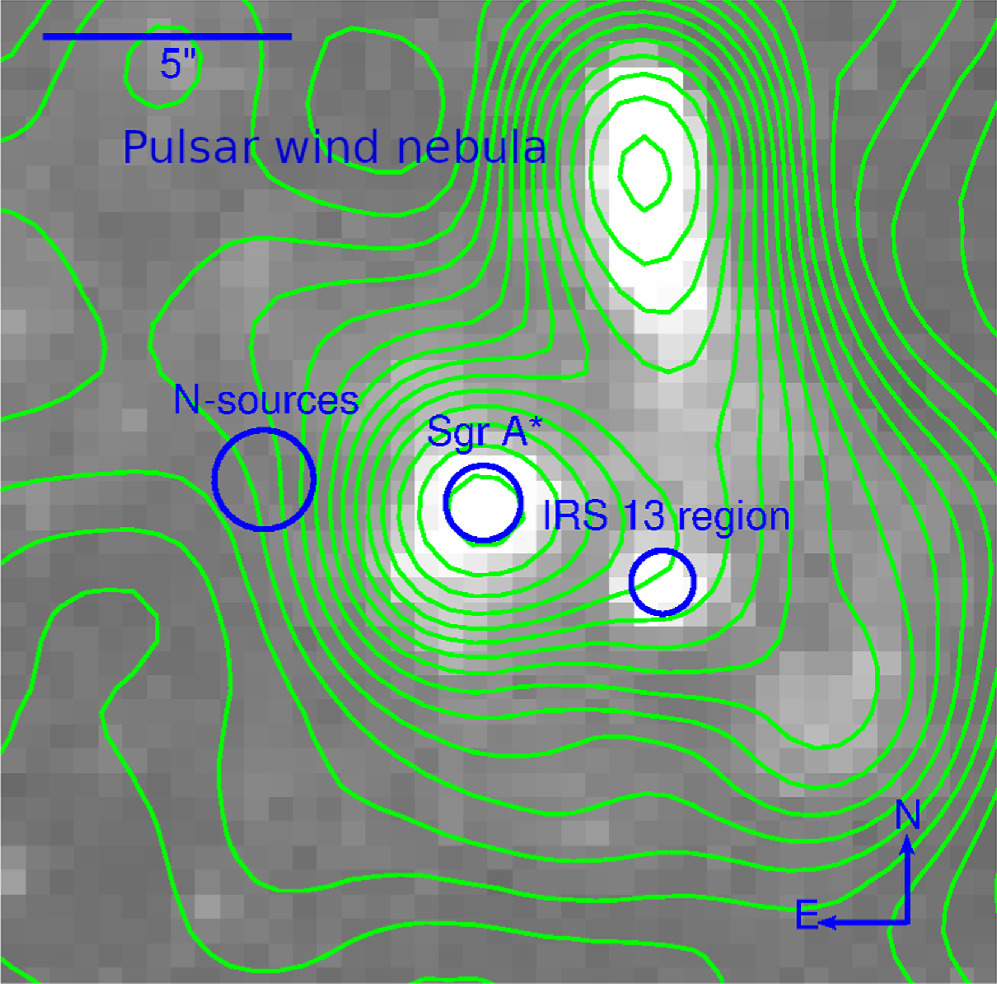
Figure 2: X-ray image from Chandra showing the position of Sgr A*, IRS 13, and other bright X-ray sources. The lack of a significant X-ray source at the position of the N-source association further supports the idea that these stars may not be part of a typical stellar cluster. [Hosseini et al. 2024]
Two Possible Origins
The study suggests two primary scenarios for the origin of the N-sources:
- A stellar cluster around an intermediate-mass black hole: One possibility is that the N-sources are part of a stellar cluster that is stabilized by an intermediate-mass black hole, a type of black hole with a mass between stellar-mass black holes and supermassive black holes like Sgr A*. The authors suggest the intermediate-mass black hole could have formed from stellar-mass black holes colliding with stars. If the N-sources are associated with this black hole, their motion could be influenced by its gravitational forces, keeping the cluster intact in the dense environment of the galactic center. Data from the Chandra X-ray Observatory suggest that this hypothetical intermediate-mass black hole would be surrounded by a faint accretion flow. Since weaker flows with less infalling material typically produce less X-ray radiation, this could explain the lack of bright X-ray emission at the N-source locations.
- A projection effect from a stellar disk: Alternatively, the N-sources and IRS 13, another stellar association, might simply appear clustered because of their position along the same stellar disk. This disk could be a projection of stars from a larger structure, such as the clockwise stellar disk observed in other regions near Sgr A*. In this case, the N-sources might not be physically bound to an intermediate-mass black hole but could just be stars from a local disk-like structure.
Looking Ahead: What’s Next for Studying the N-Sources?
To better understand the N-sources’ origin, future spectroscopic observations, especially with JWST, will be crucial. These observations could provide key data on the stars’ velocities, helping astronomers determine whether they are part of a stellar cluster around an intermediate-mass black hole or just a projection from a larger stellar disk.
The study of the N-sources offers important insights into the dynamics of the galactic center, a region that is both an astrophysical laboratory and a challenging environment for astronomers. By understanding how stars move in this dense, gravitationally extreme region, researchers can learn more about the role of supermassive black holes, intermediate-mass black holes, and stellar clusters in shaping the structure and evolution of our galaxy.
Original astrobite edited by Viviana Cáceres and Lucas Brown.
Original astrobite authored by Sparrow Roch.
The post Stars on the Move: New Insights from the Galactic Center appeared first on AAS Nova.
]]>
Some neutron stars might arise from the collapse of a white dwarf. Simulations show that this transformation is likely accompanied by a burst of element creation.
The post Creation from Collapse: Making Elements in a White Dwarf’s Final Moments appeared first on AAS Nova.
]]>Do neutron stars form solely through core-collapse supernovae, or is there another way? New research explores theorized processes in which a white dwarf shrinks down to become a neutron star.
Alternate Pathways

Accretion-induced collapse and merger-induced collapse are potential formation pathways for magnetized neutron stars called magnetars, illustrated here. [NASA/Swift/Sonoma State University/A. Simonnet]
So far, researchers have yet to definitively associate any transient signal with the creation of a neutron star from a collapsing white dwarf, though there are several candidates. To advance the search for these signals, researchers must understand the details of the collapse and predict its electromagnetic signature.
Collapsing Further
Eirini Batziou (Max Planck Institute for Astrophysics and Technical University of Munich) and collaborators investigated the burst of nucleosynthesis that might follow a white dwarf’s collapse, potentially powering an electromagnetic transient. The team performed two-dimensional hydrodynamic simulations of six white dwarfs on the cusp of collapsing into neutron stars. Each simulation run varied the mass, central density, rotation rate, and angular momentum profile of the white dwarf. Two of the modeled white dwarfs had masses very close to the Chandrasekhar limit, the mass above which a white dwarf can hypothetically no longer support itself through electron degeneracy pressure. The remaining synthetic stars had higher masses that were bolstered by rapid rotation.
Each of the modeled white dwarfs began to collapse when the crushing pressure of gravity forced the star’s sea of electrons to invade atomic nuclei, removing the support of electron degeneracy pressure. The white dwarfs’ cores shrank and condensed into protoneutron stars, while their outer layers fell inward and rebounded.

Simulation snapshots showing the evolution of ejected material over time. The top row shows a non-rotating white dwarf and the bottom row shows a rapidly rotating white dwarf. The left side of each panel shows the mass density and the right side shows the radial velocity. Note that the times and the values represented by the color bars are different between the two rows. Click to enlarge. [Adapted from Batziou et al. 2025]
Setting the Stage for Element Creation
The simulations show that rotating and non-rotating white dwarfs have different outcomes when they collapse. Non-rotating white dwarfs cast off material in all directions, while rapidly rotating white dwarfs tend to lose material through wide outflows at their poles. The equator of the rapidly rotating white dwarf is ringed by a torus of material that feeds the neutron star as it forms.
These divergent outcomes affect the amount of ejected material and the production of neutrinos. Ultimately, these differences result in opposite behavior: in the non-rotating case, the ejected material is initially rich in neutrons before transitioning to a proton-rich outflow, while the rotating case starts out with proton-rich ejecta that transitions to a neutron-rich outflow. This suggests that elements created through the rapid capture of neutrons, like gold, can form when white dwarfs collapse into neutron stars, potentially powering an observable electromagnetic signal.
These simulations by Batziou and coauthors are the first to extend substantially beyond the moment the outer layers of the collapsing white dwarf bounce off the central protoneutron star, illuminating the ejection of material, production of neutrinos, and nucleosynthesis. Future work will dive deeper into the details of element creation, predict the luminosity of these events, and explore the role of magnetic fields.
Citation
“Nucleosynthesis Conditions in Outflows of White Dwarfs Collapsing to Neutron Stars,” Eirini Batziou et al 2025 ApJ 984 197. doi:10.3847/1538-4357/adc300
The post Creation from Collapse: Making Elements in a White Dwarf’s Final Moments appeared first on AAS Nova.
]]>
Could tidal disruption events, which happen when a star gets too close to a black hole, explain the unusual properties of little red dot galaxies?
The post A New Theory for Little Red Dots: Shredded Stars Feeding Growing Black Holes appeared first on AAS Nova.
]]>When JWST peered back into the early universe, its keen eyes revealed an unexpected population of galaxies nicknamed “little red dots” for their compact size and bright red hue. A new research article proposes that tidal disruption events could be responsible for the surprising appearance of these galaxies.
Galactic Surprises

Six “little red dot” galaxies seen by JWST. [NASA, ESA, CSA, STScI, Dale Kocevski (Colby College)]
A successful theory of little red dot identity must account for several observed properties: “V”-shaped spectra, broad H-alpha lines, and little or no emission at X-ray wavelengths. In a recent research article, Jillian Bellovary (Queensborough Community College; CUNY Graduate Center; American Museum of Natural History) has theorized that little red dots get their curious characteristics from stars being torn apart by a young and growing black hole.
A New Hypothesis
In this scenario, little red dots arise in the extremely dense star clusters created in the early universe. Because of their extraordinary density, these star clusters are vulnerable to gravitational collapse, causing the packed-together stars to crash into one another. The colliding stars combine to form a supermassive star that collapses, leaving behind an intermediate-mass black hole — a seed that could someday grow into a supermassive black hole.
Situated at the center of a dense star cluster, an intermediate-mass black hole would be poised to ensnare stars in its gravitational web, pulling the stars apart with its powerful tidal forces and stealing their mass. These star-shredding events are known as tidal disruption events.

Predicted number density of intermediate-mass black holes (blue and orange lines). The symbols show the observed number densities of little red dots as a function of redshift. [Bellovary 2025]
Because tidal disruption events tend to remain bright for about a year, this implies that a tidal disruption event rate of one per 10,000 years is necessary for tidal disruption events to explain little red dots.
Matching Predictions

Modeled tidal disruption event (TDE) rates for two different models and various values of velocity dispersion, σ, and stellar density, nstar. [Adapted from Bellovary 2025]
As Bellovary notes, little red dots could have multiple causes. Some might be due to tidal disruption events, while others could contain active black holes, ancient populations of red stars, or dusty starburst galaxies, as others have suggested.
To verify the tidal disruption event hypothesis, astronomers would need to find evidence for time variability at rest-frame ultraviolet wavelengths, as well as a characteristic decrease in brightness over time. These changes are expected to unfold over the course of years or decades, meaning that while observations may settle this question in due time, there will be plenty of time to ponder the mysteries of little red dots while we wait.
Citation
“Little Red Dots Are Tidal Disruption Events in Runaway-Collapsing Clusters,” Jillian Bellovary 2025 ApJL 984 L55. doi:10.3847/2041-8213/adce6c
The post A New Theory for Little Red Dots: Shredded Stars Feeding Growing Black Holes appeared first on AAS Nova.
]]>
Astrobites reports on potential formation mechanisms for hot Neptunes, the rarest type of sub-Neptune exoplanets.
The post Are Hot Sub-Neptunes Just Failed Hot Jupiters? Maybe. appeared first on AAS Nova.
]]>Editor’s Note: Astrobites is a graduate-student-run organization that digests astrophysical literature for undergraduate students. As part of the partnership between the AAS and astrobites, we occasionally repost astrobites content here at AAS Nova. We hope you enjoy this post from astrobites; the original can be viewed at astrobites.org.
Title: The Hottest Neptunes Orbit Metal-Rich Stars
Authors: Shreyas Vissapragada and Aida Behmard
Authors’ Institutions: Carnegie Science Observatories; Flatiron Institute and American Museum of Natural History
Status: Published in AJ
Sub-Neptune exoplanets, those between the size of Earth (1.0 REarth) and Neptune (4.0 REarth), are the most common type of planet discovered to date, with every other star hosting at least one on average. However, the class of “sub-Neptunes” is itself divisible into sub-categories based on the planet’s orbital period: these are called “hot,” “warm,” and “cold” for planets that are very close to their star, at a medium distance from their star, and farthest out, respectively. While the lines dividing these three categories are a little blurry, recently the community has begun roughly defining them as those with orbital periods shorter than 3.2 days (hot), those with periods between 3.2 and 5.7 days (warm), and those with periods longer than 5.7 days (out to 100 days, cold). The orbital period of the planet is directly related to the planet’s distance from its host star, so planets with longer orbital periods are farther out from their stars.
Furthermore, it seems that planets in these three categories are not equally abundant across the galaxy: cold sub-Neptunes are far more common than warm sub-Neptunes, which in turn are more common than hot sub-Neptunes. In fact, hot sub-Neptunes are seemingly so rare that exoplanet scientists have coined the term “the Neptune desert” to convey the emptiness of this region of parameter space (see Figure 1 below). But if sub-Neptunes are so common overall, why are the hottest of this class of planets so rare?
There are a few working hypotheses for how hot sub-Neptunes form, each of which predicts that their formation be very rare. First, perhaps they formed in the same way as the common cold versions, but through unique circumstances avoided having their atmospheres stripped by photo-evaporation from the star. Second, they may have formed via collisions of many small planets in the early days of the planetary system, creating one large planet on a short orbit. Or third, they could be “failed” hot Jupiters, meaning they initially formed as much more massive Jupiter-like planets and then, through one or more mechanisms, lost most of their mass until reaching their present-day size.
Today’s Astrobite reports on an article that attempts to find the most likely of these three formation mechanisms. The authors focus on the metallicity of the host stars of hot Neptunes (defined as those with masses between 10 and 100 Earth masses) and ask the question, “Do the host stars of hot Neptunes have a similar metallicity distribution to host stars of any other class(es) of planets?” The idea being, if another class of planets forms around similar host stars, perhaps the planets themselves formed through similar mechanisms.
The authors set out to test the hot Neptune (A) host-star population against four other populations of planet hosts: warm Neptunes (B), cold Neptunes (C), hot Earths (E), and hot Jupiters (D). See Figure 1 for where these populations lie on the period–mass plane. Metallicity studies are often difficult to perform for a number of reasons: first, it is difficult to measure precise metallicity for a single star, and second, data from different instruments and/or different measurement techniques are often inconsistent with each other. The authors have come up with a way to get around both of these issues by using a single source for their data: the Gaia mission’s radial-velocity spectrometer, through which they were able to collate precise measurements in a homogeneous fashion.
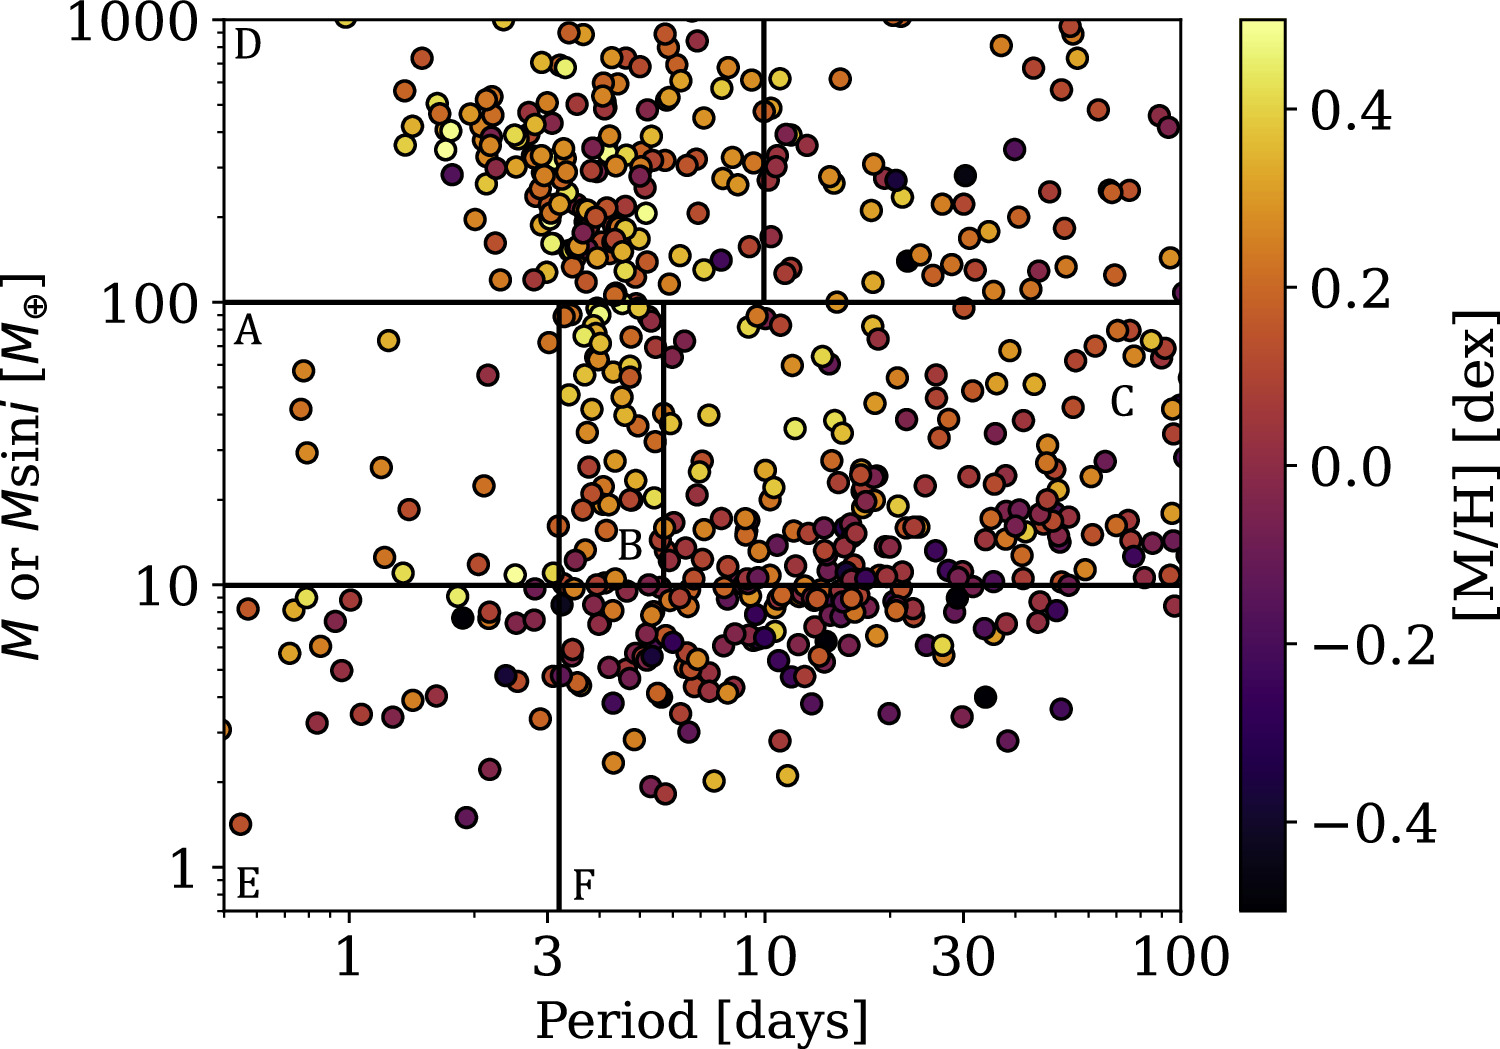
Figure 1: The mass–period plane of exoplanets with metallicity color-coded. The lettered boxes denote different classes of planets, with hot sub-Neptunes marked as “A.” The authors compare the host stars of these planets to the host stars of other populations of planets. The orbital period of the planet is on the x-axis, the mass (or best mass estimate) is on the y-axis, and color indicates metallicity. [Vissapragada & Behmard 2025]
Original astrobite edited by Catherine Slaughter.
About the author, Jack Lubin:
Jack received his PhD in astrophysics from UC Irvine and is now a postdoc at UCLA. His research focuses on exoplanet detection and characterization, primarily using the Radial Velocity method. He enjoys communicating science and encourages everyone to be an observer of the world around them.
The post Are Hot Sub-Neptunes Just Failed Hot Jupiters? Maybe. appeared first on AAS Nova.
]]>
The 1,000-foot-wide Arecibo Telescope discovered nearly 60 binary or triple asteroid systems. 2020 BX12 was the final binary asteroid discovered with Arecibo before the telescope collapsed in 2020.
The post Featured Image: The Last Asteroid Pair Discovered by Arecibo appeared first on AAS Nova.
]]>There are more than 37,000 asteroids known to come within 1.3 au of the Sun. Of this near-Earth asteroid population, roughly 2,500 are classified as potentially hazardous — being more than about 140 meters across and coming within 0.05 au of Earth’s orbit (about 20 times the distance between Earth and the Moon). In the image above, Luisa Fernanda Zambrano-Marin (University of Granada and University of Central Florida) and collaborators present observations of 2020 BX12, a potentially hazardous binary asteroid. The larger of the two asteroids in the system was discovered in January 2020 by the Asteroid Terrestrial-impact Last Alert System. About a week after the initial discovery, the 1,000-foot-wide Arecibo Telescope aimed its powerful planetary radar at 2020 BX12 and revealed the asteroid’s small companion. 2020 BX12 was the last of nearly 60 binary or triple near-Earth asteroids discovered with Arecibo before the telescope collapsed in December 2020. As Zambrano-Marin‘s team notes, the loss of Arecibo hampers scientists’ ability to find companions to near-Earth asteroids, which can be critical for determining the properties of these asteroids and guiding our planetary defense strategies. To learn more about this discovery, as well as what the team learned from follow-up spectroscopy, be sure to check out the full research article linked below.
Citation
“2020 BX12—The Last Binary Asteroid Discovered at Arecibo,” Luisa Fernanda Zambrano-Marin et al 2025 Planet. Sci. J. 6 91. doi:10.3847/PSJ/adbe39
The post Featured Image: The Last Asteroid Pair Discovered by Arecibo appeared first on AAS Nova.
]]>
How do globular clusters, some of the universe's oldest objects, originate? Recent simulations of early universe star formation provide potential pathways for their formation and how JWST might be able to spot their high-redshift progenitors.
The post From Gas to Cluster: Simulating Star Formation in the Early Universe appeared first on AAS Nova.
]]>JWST observations have begun uncovering some of the oldest star clusters in the universe, but their formation mechanisms are still uncertain. A recent study uses high-resolution simulations to understand early star formation and how local globular clusters may have originated.
Supersonically Induced Gas Objects
Our leading cosmological model of the universe suggests that stars and galaxies coalesce within dark matter halos, eventually forming the larger structures we see today. However, some of the oldest astronomical objects in the universe — massive collections of stars called globular clusters — contain little to no dark matter, making their formation mechanisms somewhat mysterious. How do large clusters with thousands of stars form outside of dark matter halos?

Visualizations of the gas density in the simulated star-forming regions in this study. Click to enlarge. [Lake et al 2025]
Over the past decade, simulations and theory have shown that supersonically induced gas objects can form star clusters, which may be the origin story of many of the local globular clusters seen today. However, these simulations have been limited by their resolution. Unable to resolve individual star formation and not including key aspects like feedback, these simulations have left open questions about these dark-matter-free objects.
High-Resolution Simulations
Seeking to more deeply understand supersonically induced gas objects, William Lake (University of California, Los Angeles; Dartmouth College) and collaborators perform high-resolution simulations that include detailed physics and can track the formation of individual stars. The simulations varied the metallicity and presence of protostellar jets, properties that are both known to impact the star formation process in gas clouds.

Mass distribution for the stars formed in the simulated supersonically induced gas objects. The simulated clusters form more high-mass stars than what is seen in local star-forming regions. Click to enlarge. [Lake et al 2025]
Given that these objects likely form very high-mass stars, these primordial star clusters will have extremely high stellar mass surface densities and brightnesses compared to what is observed locally. With such enhanced brightness, these objects may be bright enough for JWST to observe them. Further high-redshift observations of star clusters will allow for further constraints on the formation of the universe’s first stars and will yield more information about the possible origins of the globular clusters we see in the local universe.
Citation
“The Stellar Initial Mass Function of Early Dark Matter–Free Gas Objects,” William Lake et al 2025 ApJL 985 L6. doi:10.3847/2041-8213/add347
The post From Gas to Cluster: Simulating Star Formation in the Early Universe appeared first on AAS Nova.
]]>
New JWST observations provide a richly detailed look at the jets from young stars still shrouded in dusty disks.
The post Winds, Jets, and Wigglings from Young Stars and Their Disks appeared first on AAS Nova.
]]>New JWST observations provide a detailed look at the jets of four young stars, revealing shocks, mass loss, and wiggly behavior that hints at a hidden binary companion.

A portion of the Taurus star-forming region. [ESO/Digitized Sky Survey 2. Acknowledgement: Davide De Martin; CC BY 4.0]
From Cloud to Star to Planetary System
The transformation from a turbulent cloud of hydrogen gas to a star circled by planets is complicated. As stars coalesce from their natal clouds, they gather gas from their surroundings and flatten it into a dense, dusty disk. While feeding on the gas from this disk, young stars launch powerful, narrow jets and broad, slower-moving winds. As accretion slows, planets begin to form, getting their start from clumps of dust grains.
In a recent research article, JWST observations give insight into the details of this process, illuminating the winds and jets of the disks surrounding young stars.
JWST’s View
Naman Bajaj (Lunar and Planetary Laboratory, The University of Arizona) and collaborators investigated four protoplanetary disks with JWST’s Near Infrared Spectrograph (NIRSpec). The four disks — Tau 042021, HH 30, FS Tau B, and IRAS 04302 — reside in the Taurus star-forming region, which is 1–2 million years old and roughly 450 light-years away.

JWST images of the four disks as seen in a selection of emission lines. Green contour lines show the location of continuum emission. [Adapted from Bajaj et al. 2025]
Bajaj’s team identified more than 40 emission lines for each disk, allowing them to determine the properties of the jets, such as the density and shock speed. One important aspect that can be gleaned from these observations is an estimate of the mass carried away by the jets. Using three independent methods, the team found that jet mass-loss rates for the four disks was on average a billionth of a solar mass per year.
The Wiggly Jet of Tau 042021

Observed locations of the center of the redshifted and blueshifted jets (circles) as well as a fit to a binary orbit model (green dashed line). [Bajaj et al. 2025]
Bajaj and coauthors presented a rich dataset that illuminates the behavior of jets from young stars, and their work isn’t yet done; this is the second research article the team has produced from these data, and more are in the works.
Citation
“Class I/II Jets with JWST: Mass-Loss Rates, Asymmetries, and Binary-Induced Wigglings,” Naman S. Bajaj et al 2025 AJ 169 296. doi:10.3847/1538-3881/adc73c
The post Winds, Jets, and Wigglings from Young Stars and Their Disks appeared first on AAS Nova.
]]>
Astrobites reports on a radio search for stars that have been ripped apart by supermassive black holes.
The post Did That Supermassive Black Hole Rip Apart a Star, or Is It Eating Lunch Like Normal? appeared first on AAS Nova.
]]>Editor’s Note: Astrobites is a graduate-student-run organization that digests astrophysical literature for undergraduate students. As part of the partnership between the AAS and astrobites, we occasionally repost astrobites content here at AAS Nova. We hope you enjoy this post from astrobites; the original can be viewed at astrobites.org.
Title: An Untargeted Search for Radio-Emitting Tidal Disruption Events in the VAST Pilot Survey
Authors: Hannah Dykaar et al.
First Author’s Institution: University of Toronto
Status: Published in ApJ
The supermassive black holes in the centers of most galaxies are notoriously, and predictably, violent actors in the universe. While some, classified as active galactic nuclei, act like a drain on their host galaxies, swallowing anything and everything that falls into them, even dormant black holes will react destructively when provoked. Orbit too closely, and any galactic nucleus will break you apart like a first-year chemistry student bumping an unsuspecting beaker off the lab bench.
If an ill-fated star falls into a black hole, the system will briefly glow across the electromagnetic spectrum. When and where these mishaps, known as tidal disruption events (TDEs, shown in Figure 1), occur, as well as the exact physical processes causing the brief glow, are not well understood. TDEs have been detected overwhelmingly in galaxies that do not have active galactic nuclei and are calming down after an era of intense star formation, and current models of the TDE occurrence rate disagree with observations. We expect to see more types of galaxies, such as those with active galactic nuclei, that host TDEs at similar rates, but we don’t — however, we might just be looking in the wrong places, or rather, with the wrong set of eyes.
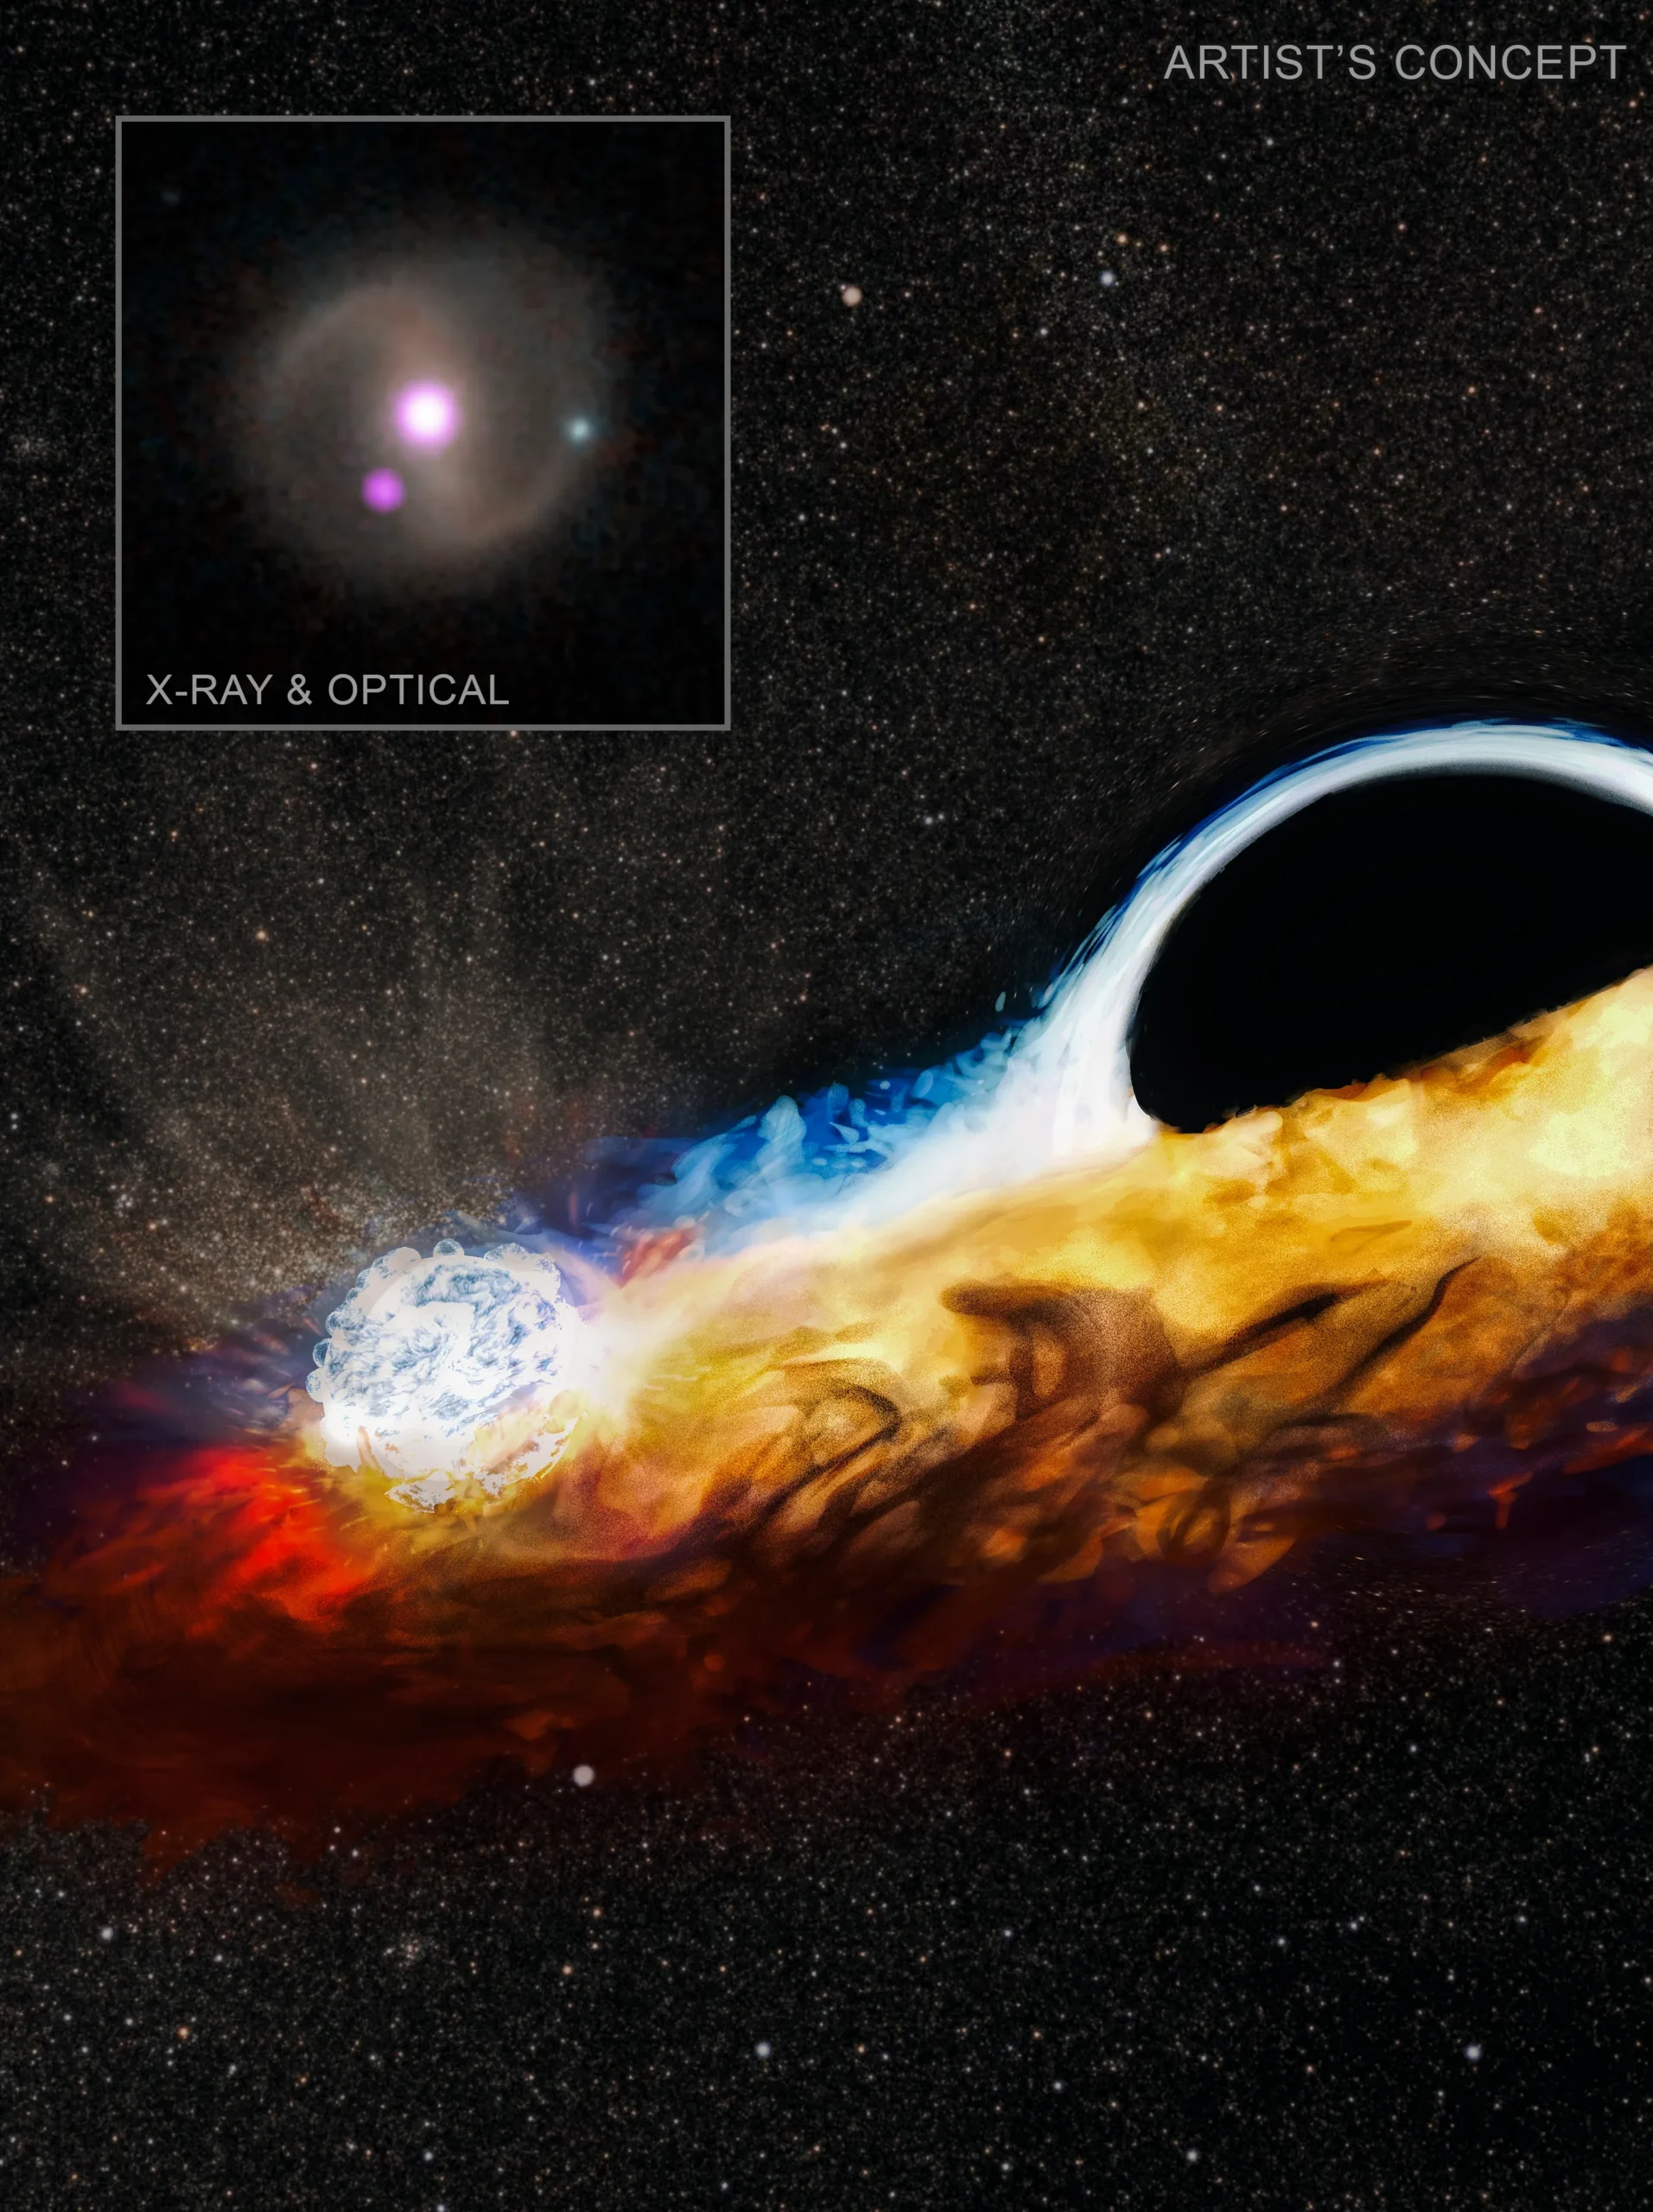
Figure 1: An artist’s impression of a tidal disruption event observed with X-ray and optical telescopes. [X-ray: NASA/CXC/Queen’s Univ. Belfast/M. Nicholl et al.; Optical/IR: PanSTARRS, NSF/Legacy Survey/SDSS; Illustration: Soheb Mandhai / The Astro Phoenix; Image Processing: NASA/CXC/SAO/N. Wolk]
Searching for TDEs at Radio Wavelengths
Today’s authors decide to take on this challenge, armed with data from the Variable and Slow Transients (VAST) pilot survey, which observes large swaths of the sky at regular intervals to track variability on the order of days to months. VAST is optimized for observing TDEs, but unfortunately, it is also excellent at finding active galactic nuclei. How do we know what to look for, and how can we distinguish a TDE from an active galactic nucleus? Easy, we can just identify characteristics common to all the known radio-emitting TDEs in the VAST field of view — all one of them, that is. Surely, that won’t do. Instead, our authors simulate the evolution of TDEs as seen by VAST, which can only catch discrete snapshots of light at a specific radio wavelength. Their models of TDE radio emission assume one of three cases: either the TDE produces a relativistic jet directed at us (on-axis), directed away from us (off-axis), or none at all. The presence or absence of a jet, and its direction, determine the shape of the light curve, as shown in Figure 2.
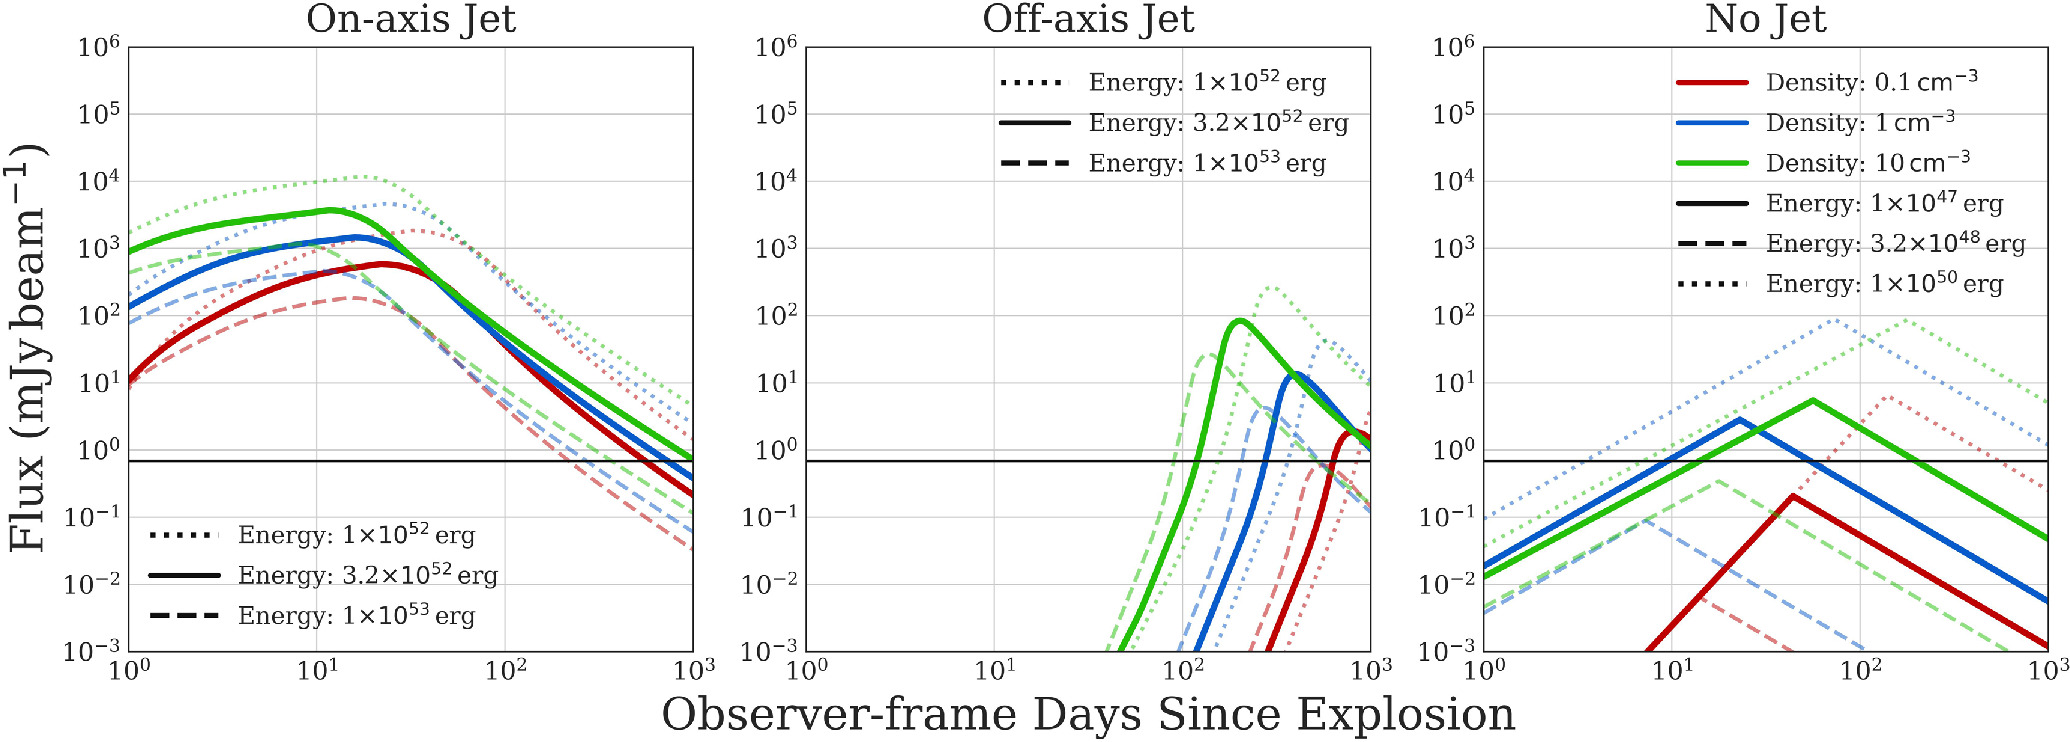
Figure 2: This figure shows the change in radio brightness over time we expect to see from a galaxy during a TDE given different models. The shape of the radio flare depends strongly on whether the TDE results in a relativistic jet, and if so, whether the jet points toward us (on-axis) or not (off-axis). These simulated light curves were used to establish criteria for TDE candidacy, and compared with observations from the final sample to constrain the incidence rate of TDEs and likelihood of different jet geometries. [Dykaar et al. 2024]
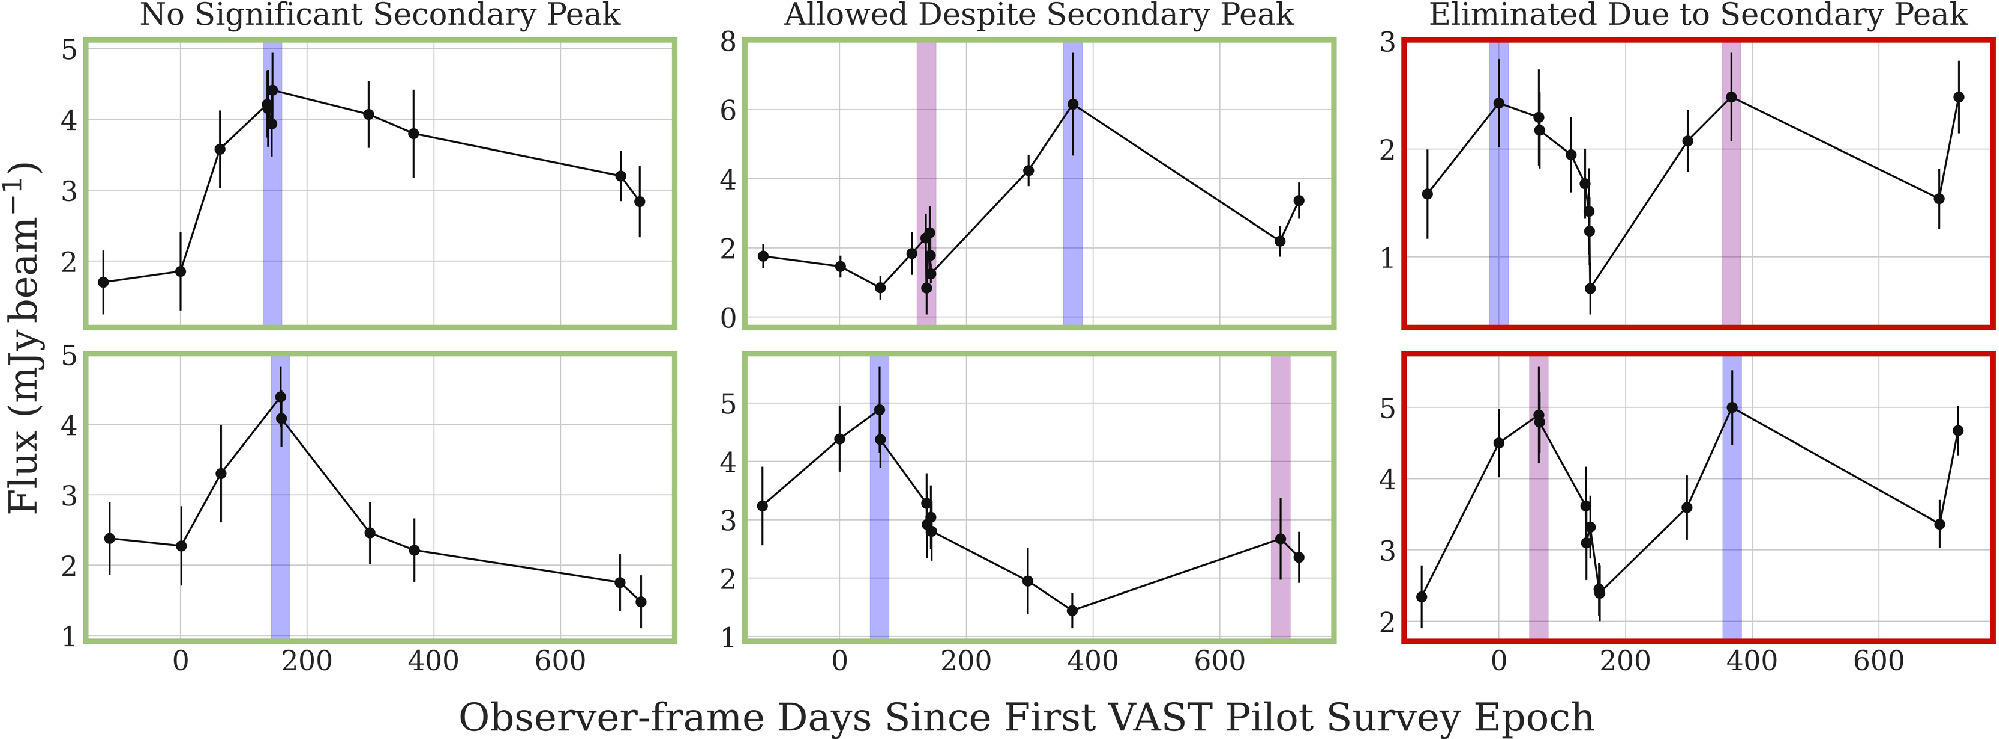
Figure 3: To distinguish TDEs from active galactic nucleus imposters, the authors kept only sources that exhibited one dominant peak in their radio flux, shown by the blue windows. Sources with secondary peaks (shown by the purple windows) that were much smaller than the primary peak were allowed, as the secondary peak could reasonably be due to ambient active galactic nucleus activity. However, multiple comparable peaks are indicative of only intrinsic active galactic nucleus fluctuations, not a TDE. [Dykaar et al. 2024]
Following Up on TDE Candidates at Other Wavelengths
The authors next subject these TDE candidates to thorough multi-wavelength scrutiny using archival survey data. First, they investigated whether the candidates are associated with gamma-ray bursts, which are extremely luminous and energetic events that may accompany TDEs. Unfortunately, gamma rays are easily absorbed, making them notoriously difficult to trace back to their sources. (After all, the journey of a gamma ray through light-years of dust and gas to Earth is not unlike Odysseus’s return to Ithaca, and we all know how many made that journey unscathed.)
The authors found that all 12 sources were coincident with a gamma-ray burst, but all 12 sources were also coincident with multiple gamma-ray bursts (which is unlikely to be physical), as were randomized, TDE-free regions of the VAST sky. In other words, the gamma-ray burst association is inconclusive. Contemporary optical and infrared observations of the candidates revealed no corresponding flares, which leads to more questions. Are the sources simply too far away for their optical and infrared flares to be discernible, or could dust absorption be at play? Additionally, nearly all candidates maintained an increased radio flux after the TDE flare. This may indicate that the TDE occurred within an active galactic nucleus as it was transitioning to a higher radio flux state, that the TDE was followed by intense star formation, or both.
By comparing their candidates to the expected observational manifestations of their TDE models, the authors conclude that the candidate sources are consistent with TDEs that have relativistic jets. They also independently constrain the TDE incidence rate, which agrees with current theory. As our window into the variable radio universe expands with future observations, such as with the ongoing VAST survey, we will have a growing population of such radio-detected TDEs to study, and the ability to distinguish them from regular active galactic nuclei will be ever more valuable in our quest to understand them.
About the author, Chloe Klare:
I’m a PhD student in Astronomy and Astrophysics at Penn State, with a physics doctoral minor. In my research, I’m looking for newly evolving synchrotron jets in active galactic nuclei (in the radio!).
The post Did That Supermassive Black Hole Rip Apart a Star, or Is It Eating Lunch Like Normal? appeared first on AAS Nova.
]]>
Monster shocks and a "pulsar-like" black hole phase might form when a black hole collides with a neutron star. Could this cosmic clash produce observable electromagnetic signals?
The post Black Hole vs. Magnetized Neutron Star: Matchup Predictions appeared first on AAS Nova.
]]>When a black hole consumes a neutron star, it’s typically thought to do so without an electromagnetic belch. New research explores the conditions under which a black hole’s neutron-star feast produces an observable electromagnetic signal.
Signaling a Collision
In the past few years, gravitational-wave detectors across the globe have detected a handful of neutron star–black hole mergers. What sorts of electromagnetic signals might accompany these outbursts of gravitational waves is a matter of intense interest.
In rare cases, if the black hole and neutron star are relatively close in mass, their gravitational tussle will rip the neutron star apart. As the shredded stellar material collects in a searingly hot disk around the black hole, it is expected to power a bright transient like a kilonova or a gamma-ray burst.
More commonly, the black hole is much more massive than the neutron star. In this case, the black hole should swallow the neutron star whole and without an electromagnetic trace — unless, as recent research shows, a strong magnetic field surrounds the neutron star.
Detailed Simulations

The simulated merger of a neutron star and a black hole, in which the neutron star is swallowed whole. Click to enlarge. [Kim et al. 2025]
As the simulated neutron star plunges toward the black hole, the neutron star’s magnetosphere — the region of space in which particles bend to the will of the neutron star’s magnetic field — begins to ripple with waves. The waves expand outward at nearly the speed of light, launching an exceptionally massive shock. This monster shock drives the creation of an electromagnetic transient: a flash of radio waves called a fast radio burst.

The “striped” pulsar-like wind, shown at 7 milliseconds post-merger. The color scale shows the toroidal magnetic field component. [Adapted from Kim et al. 2025]
Striped Winds and a Fleeting Pulsar Phase
A second type of transient arises after the neutron star merges with the black hole. After the neutron star vanishes within the black hole’s waiting maw, its leftover magnetic field rearranges and begins to rotate, dragged along by the spinning black hole. Briefly, the black hole enters a pulsar-like state, surrounded by a “striped” wind created by spiraling magnetic field lines in alternating directions. As this magnetic field dissipates, a “fireball” of magnetized electron–positron plasma is ejected. When these electron–positron pairs annihilate, they briefly release another electromagnetic signal: a burst of X-rays and gamma rays.
Kim and coauthors noted that their simulated neutron star–black hole pair is similar in mass to the colliding pairs spotted by gravitational-wave detectors. This suggests that detectable gravitational-wave events may be accompanied by brief bursts at radio, X-ray, and gamma-ray wavelengths, providing another avenue to learn about these cosmic collisions.
Citation
“Black Hole Pulsars and Monster Shocks as Outcomes of Black Hole–Neutron Star Mergers,” Yoonsoo Kim et al 2025 ApJL 982 L54. doi:10.3847/2041-8213/adbff9
The post Black Hole vs. Magnetized Neutron Star: Matchup Predictions appeared first on AAS Nova.
]]>
Brr! A newly confirmed exoplanet orbiting a white dwarf has a temperature of just 186K, making it the coldest exoplanet whose light has been directly detected.
The post First Confirmed Planet in a White Dwarf’s “Forbidden Zone” appeared first on AAS Nova.
]]>Using JWST, researchers have spotted a freezing cold 5.2-Jupiter-mass exoplanet orbiting an old white dwarf at a distance of just 0.02 au. With a temperature of 186K (−125℉/−87℃), this is the coldest exoplanet whose light has been directly detected.
The Fate of Sun-Like Stars
Low- to intermediate-mass stars eventually evolve into red giants and then white dwarfs: crystallized, superheated stellar cores that slowly cool and fade over millennia. What happens to the planets around stars that evolve into white dwarfs is an open question, one that can be answered by detecting and characterizing the planets that remain in these systems.
Planets orbiting at radii beyond 2 au are expected to weather their host star’s transition to a red giant, and dedicated searches for white-dwarf exoplanets have revealed a small number of planets at this safe distance. Observations have also begun to hint at planets orbiting white dwarfs more closely — within the “forbidden zone” thought to be scoured out by the host star’s transformation into a red giant — and researchers have now confirmed the presence of a planet eking out an existence extremely close to its white dwarf host.
Companion Detection

Excess infrared emission of WD 1856+534b and WD 0310-688b, a planet candidate. The blue lines show the white dwarfs from the MIRI Exoplanets Orbiting WDs (MEOW) survey with no infrared excess. [Limbach et al. 2025]
The original observations couldn’t discern whether the object, cataloged as WD 1856+534b, was a massive exoplanet or a low-mass brown dwarf. Now, a team led by Mary Anne Limbach (University of Michigan) has performed follow-up observations of the system. Using JWST’s Mid-Infrared Instrument (MIRI), Limbach’s team detected WD 1856+534b by subtracting a detailed model of the white dwarf’s flux from the observed flux. The object’s faint thermal glow was detected with an overall statistical significance of 5.7 sigma.

Temperature and radius of WD 1856+534b (yellow star) compared to several known exoplanets, solar system planets, and free-floating planets (FFPs). Click to enlarge. [Limbach et al. 2025]
Brown Dwarf or Planet?
By modeling this thermal emission, Limbach and collaborators definitively showed that WD 1856+534b is a planet. Its mass is likely around 5.2 Jupiter masses, though masses between 0.84 and 5.9 Jupiter masses are possible. With an exceedingly chilly temperature of just 186K — only 60K warmer than Jupiter — WD 1856+534b is the coldest exoplanet whose emission has been directly detected.
Because WD 1856+534b couldn’t have survived its host star’s transformation into a red giant at its current position, it must have migrated inward from a more distant orbit. The cause of this migration isn’t yet clear, though common-envelope evolution or gravitational nudges from another planet or star may have played a role. Upcoming JWST observations that probe WD 1856+534b’s atmosphere and search for other planets in the system could provide answers.
Citation
“Thermal Emission and Confirmation of the Frigid White Dwarf Exoplanet WD 1856+534 b,” Mary Anne Limbach et al 2025 ApJL 984 L28. doi:10.3847/2041-8213/adc9ad
The post First Confirmed Planet in a White Dwarf’s “Forbidden Zone” appeared first on AAS Nova.
]]>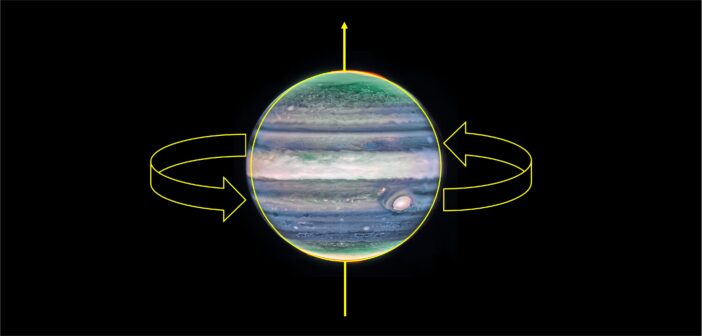
HIP 41378f — a cold, puffy exoplanet with four known siblings — becomes one of just a handful of planets with an estimate of its rotation period.
The post How Squished Is That Planet? Astronomers Measure Oblateness of a Sub-Neptune appeared first on AAS Nova.
]]>Exoplanet transit observations are now sensitive enough to detect when a planet is flattened slightly by its rotation. Using a new code tailor-made for the purpose, researchers have placed constraints on the rotation period of a cold, puffy exoplanet.
(Don’t) Assume a Spherical Planet
Though countless astronomy problem sets have asked students to consider planets to be spheres, not all planets are so perfect. Rapid rotation turns gaseous planets into slightly squished, or oblate, spheroids. Measurements of this subtle departure from a perfect sphere have the potential to reveal the rotation rates of distant exoplanets and the amount of angular momentum they carry, helping to disentangle how these planetary systems formed.
However, measuring this subtle signal is hard, and so far oblateness has been measured for only a handful of planets. Transiting planets can reveal themselves to be slightly squished only when crossing in front of the edge of their host star, requiring sensitive, high-time-cadence observations — and the right software to analyze the signal.
greenlantern Lights the Way
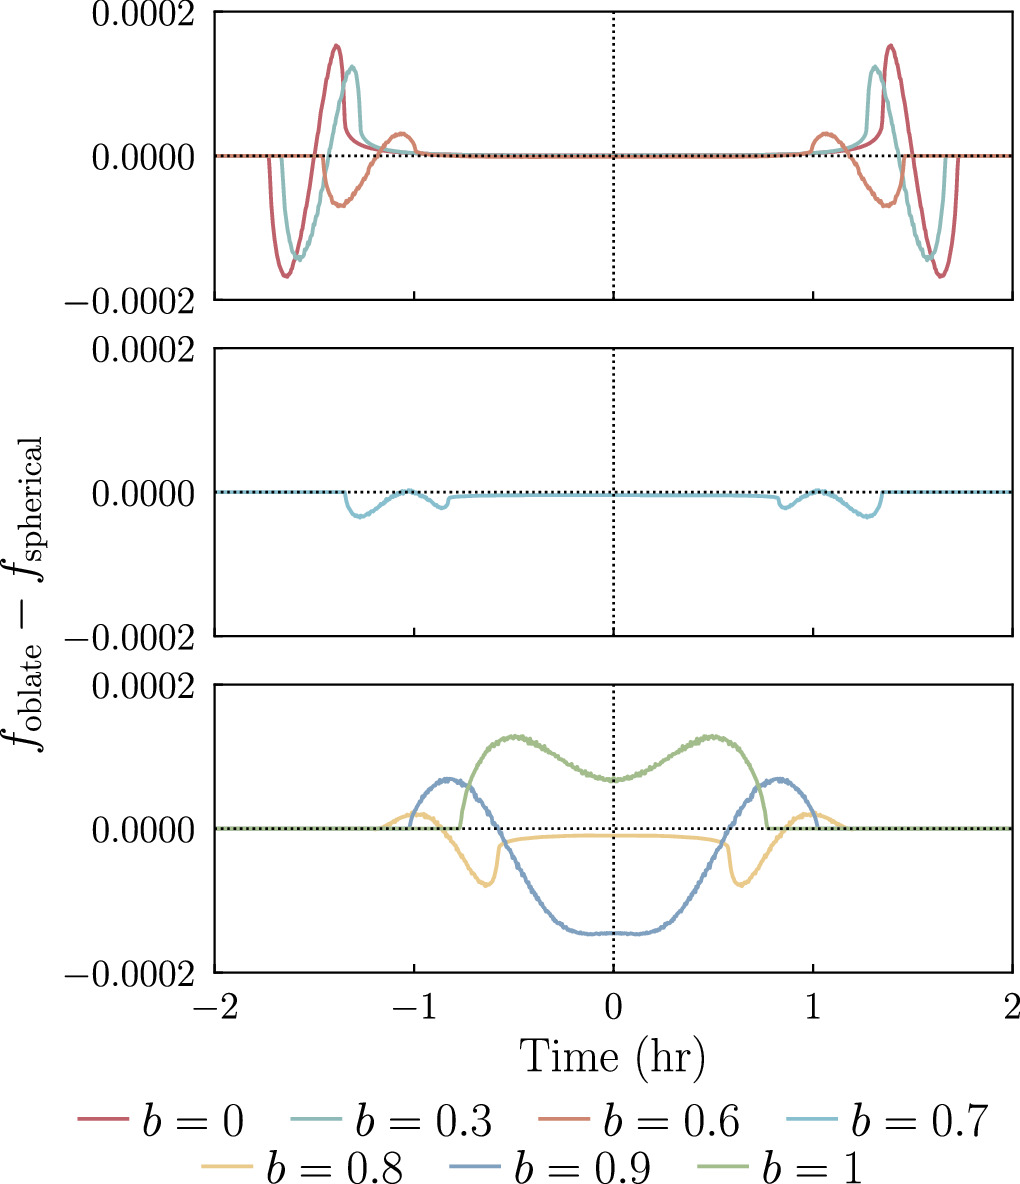
Examples of how the flux during a planetary transit differs between an oblate planet model and a spherical planet model. For all of the examples plotted, the oblate planet and its comparison spherical planet cover the same area of their host star mid-transit. The line color signifies the impact parameter. [Price et al. 2025]
After walking through the technical aspects of the model, Price’s team introduced their test subject, the sub-Neptune exoplanet HIP 41378f. HIP 41378f is notable for being the outermost of five known planets in its star system, for having an extremely low bulk density of just 0.09 gram per cubic centimeter, and for having a long, chilly, 542-day orbit around its host star.
Price’s team used their code to fit Kepler space telescope data of HIP 41378f and constrain the planet’s oblateness and, by extension, its rotation rate. They determined that the planet’s rotation period is at minimum 15.3 hours, making it a slower rotator than either Jupiter (10 hours) or Saturn (10.5 hours).
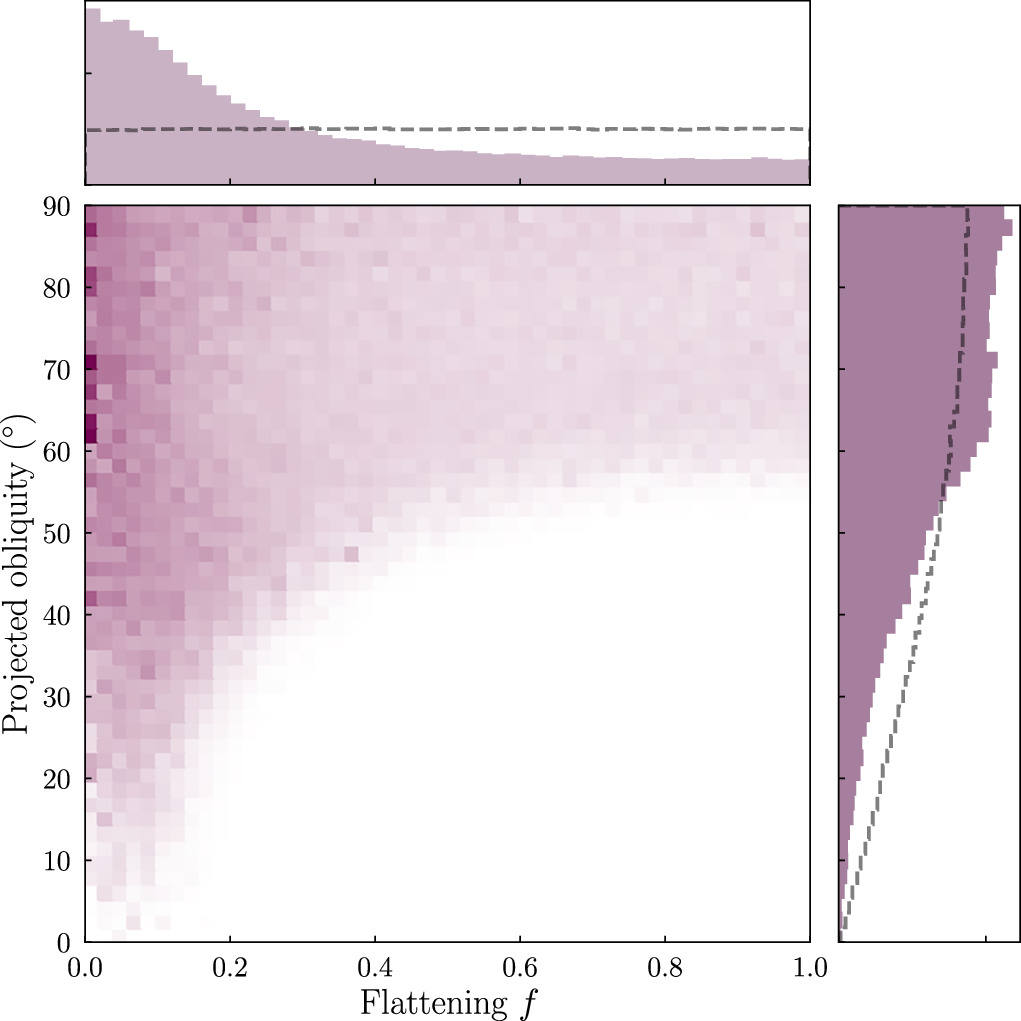
Joint probability distribution for the flattening and projected obliquity (axial tilt) of HIP 41378f. [Price et al. 2025]
Rotating Through the Possibilities
In addition to constraining the rotation rate, this work also showed that current observations of HIP 41378f are consistent with a broad range of axial tilts. What does this mean for how HIP 41378f formed? Given the planet’s mass — 12 Earth masses, give or take a few — a large axial tilt could arise in a variety of ways, including gravitational interactions between the planets in the system. However, with HIP 41378f orbiting quite far from its siblings, it’s not clear why it would be so tilted, and more data are needed to pin down HIP 41378f’s axial tilt.
Finally, Price’s team interpreted the results in the context of HIP 41378f’s possible ring system. Given the planet’s extremely low bulk density, it’s possible that a system of rings has artificially inflated the planet’s apparent radius. In this case, the measured oblateness would reflect the influence of the ring system and could not be used to constrain the planet’s rotation rate.
Citation
“A Long Spin Period for a Sub-Neptune-Mass Exoplanet,” Ellen M. Price et al 2025 ApJL 981 L7. doi:10.3847/2041-8213/adb42b
The post How Squished Is That Planet? Astronomers Measure Oblateness of a Sub-Neptune appeared first on AAS Nova.
]]>
Astrobites reports on the results of a cosmic-ray investigation of the starburst galaxy Messier 82 using the VERITAS gamma-ray telescopes.
The post Messier 82 (Star)bursts onto the Scene! appeared first on AAS Nova.
]]>Editor’s Note: Astrobites is a graduate-student-run organization that digests astrophysical literature for undergraduate students. As part of the partnership between the AAS and astrobites, we occasionally repost astrobites content here at AAS Nova. We hope you enjoy this post from astrobites; the original can be viewed at astrobites.org.
Title: An In-Depth Study of Gamma Rays from the Starburst Galaxy M82 with VERITAS
Authors: The VERITAS Collaboration
Status: Published in ApJ
Starbursts: Not Just a Candy!
Cosmic rays are charged particles (electrons, protons, and atomic nuclei) that we’ve known about for more than a century. These particles notoriously zig and zag around the universe due to magnetic fields that attract them and then shoot them off in whichever direction the field goes. This makes it really hard to figure out what’s making them, especially because we detect them up to really high energies (petaelectronvolt-scale) — thousands of times more energetic than the particles accelerated at accelerators like the Large Hadron Collider! The mystery of what out there in the universe is making cosmic rays at these high energies has plagued astronomers ever since we discovered that cosmic rays exist in the first place.
Luckily, there are other ways to figure out where these enigmatic particles are made, including using plain old light — namely, gamma rays. Cosmic rays produce gamma rays in all sorts of different interactions with the material in the sources where they’re born. In other words, a cosmic-ray source should also be a gamma-ray source! By looking at how the gamma rays from a given astronomical object are distributed in brightness and energy (i.e., the spectral energy distribution), we can figure out what sort of cosmic rays make the gamma rays we observe and identify the big cosmic-ray factories of the universe.
Starburst galaxies (often just called “starbursts”), as their names imply, are galaxies that are forming stars very quickly — at rates 10–30 times higher than the Milky Way. This is probably just a phase, though, since these galaxies will quickly use up all their star-forming material (i.e., gas and dust) and will need to wait for this material to be re-released in supernovae or planetary nebulae when their stars eventually die.
We’ve long thought that starbursts might be cosmic-ray factories, as they host several high-energy processes such as supernovae and stellar winds launched by massive stars, hitting the dense material in star-forming regions. Since these processes don’t occur on anywhere near the same scales in our own Milky Way galaxy, we need to look elsewhere to understand if these processes are responsible for cosmic-ray production.
Figure 1: The VERITAS gamma-ray telescopes, which are located in southern Arizona, USA. [Center for Astrophysics | Harvard & Smithsonian]
Long Time, No Gammas
Today’s article follows up on a previous attempt to study M82 with VERITAS in 2009, which frustratingly resulted in the weakest detection VERITAS has ever reported — even after 137 hours of observations! More than a decade later, the VERITAS collaboration is back with a solid detection of gamma-ray emission from M82 (see Figure 2) and enough data to give M82 the attention it deserves!
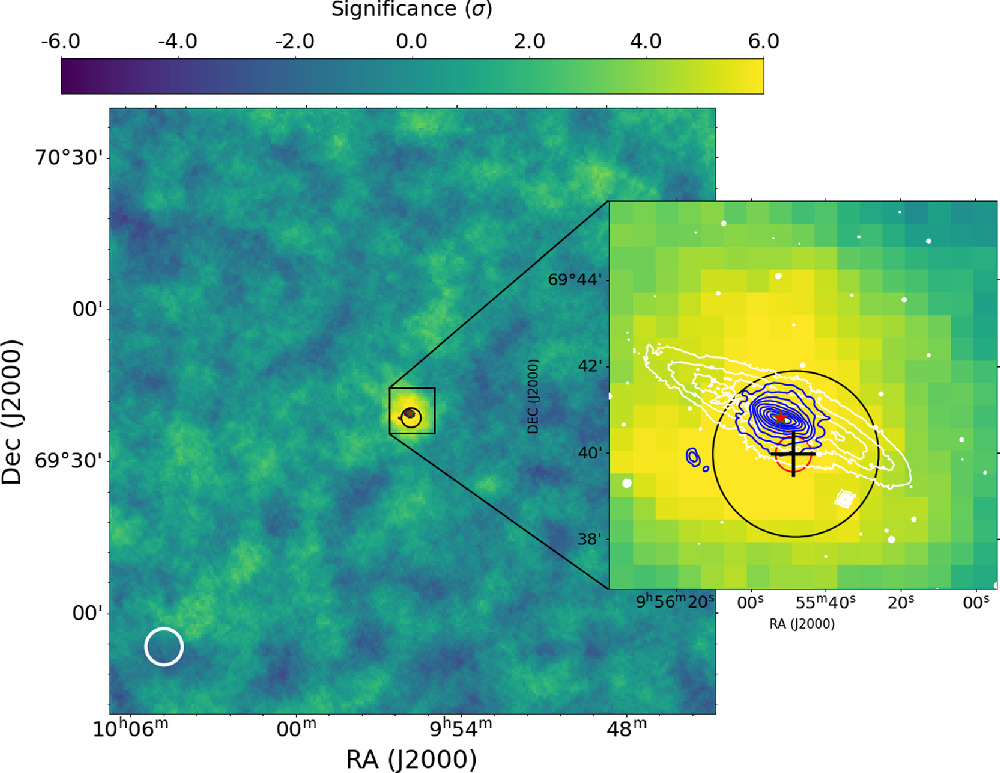
Figure 2: Sky map of the region surrounding M82, showing the statistical significance that the gamma rays observed aren’t just random background gamma rays or cosmic rays (higher significance is better!). The angular resolution of gamma-ray telescopes is not very good compared to other wavelengths. This can be seen in the inset, which shows the contours of optical data (white) and radio data (blue), with the best-fit and location of the VERITAS data denoted by the black circle and cross. The white circle in the bottom left shows VERITAS’s point spread function, which dictates the resolution of the image. [VERITAS Collaboration 2025]
It’s All in the Spectrum!
Even though M82 is 12 million light-years away (or more than a billion trillion kilometres), we can still learn an incredible amount of information about its subatomic particles, which are over half a million times smaller than a single human hair! The authors accomplish this by looking at the spectral energy distribution (see Figure 3), which shows how M82’s brightness changes with the energy (or frequency) of the gamma rays and any other light we observe.
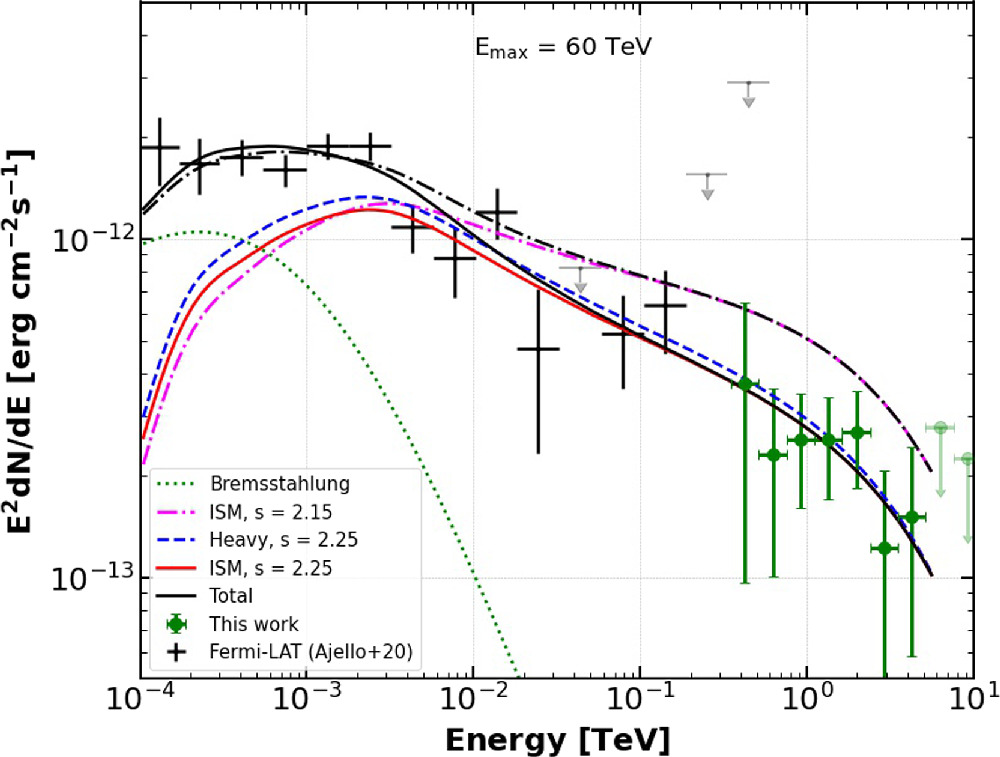
Figure 3: The leptonic and hadronic fits to the gamma-ray emission from M82, with Fermi-LAT data in black and VERITAS data in green. The leptonic (electron-only) model is shown by the green dashed line (called bremsstrahlung or braking radiation). The hadronic components are any of the pink, blue, or red lines, with each representing different average particle masses (denoted here with the particle’s rigidity, s, which is sort of a proxy for mass — or more precisely, how easily the particle is deviated by magnetic fields). They infer the types of particles from our own galaxy’s interstellar medium (ISM) and assume that M82 should be similar. All of these components are needed to find a fit to the data, as represented by the black solid line. [VERITAS Collaboration 2025]
What gets a little bit hairy is that hadronic particle interactions (protons/nuclei hitting things, accelerating, decaying, etc.) will also make a bunch of electrons called secondary electrons in the process, making it so that the authors are unlikely to see the proton/nuclei-only scenario. The spectrum is more likely to look more like a blend of both electrons and hadrons, even if electrons aren’t initially involved. These electrons are created after sudden bursts of star formation produce a bunch of cosmic rays, which will go on to make these secondary electrons that will stay within the galaxy over much longer timescales, leaving a lasting imprint of the cosmic-ray production that can be measured long after the star formation stops.
The authors compare leptonic (electron-only) and hadronic models to the observed gamma-ray data, to see which particles are responsible for making the gamma rays. They find that at least some hadronic component is needed to fit the observed gamma-ray data from the Fermi Large Area Telescope (Fermi-LAT) and VERITAS (see Figure 3), meaning that M82 is probably making cosmic rays that are protons and nuclei. They can also infer properties of the cosmic rays, such as the maximum energy of 60 teraelectronvolts, which is really impressive but doesn’t quite make it to the petaelectronvolt benchmark of the mystery cosmic-ray population (1,000 times the energy of M82’s particles). We know supernovae can get close to this benchmark, but we still don’t know what’s producing the higher-energy particles.
Star Light, Star Bright, Starburst!
Starbursts are promising sources that might be producing the elusive high-energy cosmic rays that astronomers have been hunting for more than a century. They also give us a larger sample size of star-powered sources that may allow us to gain more understanding about the smaller populations of supernova remnants and massive stars that exist in our own Milky Way. With the next-generation gamma-ray telescopes coming online soon (like the Cherenkov Telescope Array Observatory, which can detect gamma-ray sources in one-tenth the time it takes current-generation telescopes like VERITAS), hopefully studying these challenging and gamma-ray-dim sources will only be easier and more fruitful from this point forward!
Disclaimer: Today’s author was an author on this research article as a member of the VERITAS collaboration but was not directly involved in this project.
Original astrobite edited by Pranav Satheesh.
About the author, Samantha Wong:
I’m a graduate student at McGill University, where I study high energy astrophysics. This includes studying all sorts of extreme environments in the universe like active galactic nuclei, pulsars, and supernova remnants with the VERITAS gamma-ray telescope.
The post Messier 82 (Star)bursts onto the Scene! appeared first on AAS Nova.
]]>
What at first appeared to be an unremarkable low-mass galaxy cluster has been revealed to host a rare pair of parenthesis-shaped radio sources.
The post Featured Image: Rare Double Radio Relic appeared first on AAS Nova.
]]>Early investigations suggested that the galaxy cluster PSZ2G181.06+48.47, shown above, was an ordinary low-mass collection of galaxies. Later, radio observations revealed something remarkable: a pair of parenthesis-shaped radio sources located several million light-years from the center of the cluster. In a recent research article, Kamlesh Rajpurohit (Center for Astrophysics ∣ Harvard & Smithsonian) and collaborators used the Giant Metrewave Radio Telescope and the Karl J. Jansky Very Large Array to investigate PSZ2G181.06+48.47’s double radio sources, which are visible in red in the composite radio, optical, and X-ray image shown above. The team classified these features as radio relics, which are diffuse, extended, highly polarized radio sources that may be generated by shocks propagating through the intracluster medium. Radio relics are fairly rare, and PSZ2G181.06+48.47’s relics are unusual for several reasons: 1) there are two of them, and only about 30 double radio relics are known; 2) the galaxy cluster isn’t very massive, and relics are rare in low-mass clusters; and 3) the relics are separated from one another by about 11 million light-years, which is the largest separation known. To learn more about this pair of radio relics, including their likely cause, be sure to check out the full research article linked below.
Citation
“PSZ2 G181.06+48.47. II. Radio Analysis of a Low-Mass Cluster with Exceptionally Distant Radio Relics,” Kamlesh Rajpurohit et al 2025 ApJ 984 25. doi:10.3847/1538-4357/adbbb9
The post Featured Image: Rare Double Radio Relic appeared first on AAS Nova.
]]>
What is pulling exoplanet XO-3b out of alignment with its host star? A recent study explores the system and reveals an emerging trend that provides a boundary for planet formation mechanisms.
The post To Be or Not to Be Aligned: Exploring Spin–Orbit Alignment Trends for Exoplanetary Systems appeared first on AAS Nova.
]]>Understanding exoplanetary system architectures is crucial to uncovering how planetary systems form and evolve. A recent study homes in on the XO-3 system to explore how planets orbit their host stars and what that may mean for their formation pathways.
Alignment Trends
Observations of exoplanetary systems have unveiled multiple interesting properties and characteristics that have expanded our understanding of planet formation beyond our solar system. One such property is the spin–orbit alignment — the direction a planet orbits its host star with respect to the star’s spin. In our solar system, the planets orbit in the same direction the Sun is spinning, but for many exoplanets, this is not the case.

Star–planet systems demonstrating spin–orbit alignment and an example of a 40 degree spin–orbit misalignment. Click to enlarge. [AAS Nova/Lexi Gault]
There’s one exception to this trend: planet XO-3b. Orbiting a hot star and within a high planet-to-star mass ratio system, XO-3b was the first exoplanet observed with a high spin–orbit misalignment and has thus been the subject of multiple studies. However, its orbital angle is still uncertain. If this planet is truly an outlier, this would further complicate our understanding of planet formation mechanisms.
Getting to Know XO-3b
To confirm whether XO-3b is a true outlier and understand why this planet does not bend to the trend, Jace Rusznak (Indiana University) and collaborators acquired new observations of the XO-3 system with NEID, a radial velocity instrument on the WIYN 3.5-meter telescope. By observing how the star’s radial velocity changes as the planet passes in front of the star, they can precisely determine the spin–orbit alignment of the planet as well as measure the properties of the XO-3 system.
Combining the new radial velocity measurements with previous Transiting Exoplanet Survey Satellite (TESS) data for XO-3b, the authors determine that the planet has a spin–orbit misalignment of 40.2 degrees. To confirm that this planet is truly an outlier, the team constructs a sample of single-star exoplanetary systems using the NASA Exoplanet Archive. They find a statistically significant difference in the alignment of systems with planet-to-star mass ratios above and below 2×10⁻³. With a high planet-to-star mass ratio of 9×10⁻³, the XO-3 system is unusually misaligned compared to other systems with similar planet-to-star mass ratios.

Spin–orbit angle distribution for cool-star systems (top) and hot-star systems (bottom) as a function of planet-to-star mass ratio. The location of the XO-3 system is labeled, showing its high misalignment compared to other systems of similar planet-to-star mass ratios. Click to enlarge. [Rusznak et al 2025]
Undetected Companion
Now left with the conundrum of how XO-3b wound up misaligned, the authors consider the possibility of an undetected stellar binary companion that could have pulled the planet out of line. Previous observations of XO-3 did not directly observe a physically associated stellar companion, but errors in the Gaia astrometry of the star are atypically high for a single-star system. These errors could be the result of an undetected stellar companion gravitationally interacting with both XO-3 and its planet.
Further observations of the XO-3 system are required to confirm that the system is actually a stellar binary, but if a second star is found, XO-3b would no longer be an outlier in the spin–orbit alignment versus planet-to-star mass ratio trend. This would increase the significance of the emerging relationship that, for single-star systems, planets with high planet-to-star mass ratios tend to be aligned even around hot stars, suggesting that planets in such systems are born aligned and stay that way.
Citation
“From Misaligned Sub-Saturns to Aligned Brown Dwarfs: The Highest Mp/M* Systems Exhibit Low Obliquities, Even around Hot Stars,” Jace Rusznak et al 2025 ApJL 983 L42. doi:10.3847/2041-8213/adc129
The post To Be or Not to Be Aligned: Exploring Spin–Orbit Alignment Trends for Exoplanetary Systems appeared first on AAS Nova.
]]>
Sensitive polarized-light observations of the relativistic jets of supermassive black holes may provide an entirely new way to measure the spin of a black hole.
The post A New Way to Measure Black Hole Spin appeared first on AAS Nova.
]]>Upgraded interferometers will give researchers a never-before-seen view of the jets of active supermassive black holes. By modeling what might be seen when these instruments come online, researchers have discovered a new way to measure black hole spin.
Black Holes and Relativistic Jets
Closeup of Messier 87’s relativistic jet. [NASA and the Hubble Heritage Team (STScI/AURA)]
Some supermassive black holes produce relativistic particle jets that are thought to be powered by the black hole’s spin. This means that precise observations of black hole jets could provide a potential way to measure the spin of a black hole.
Planned and proposed interferometers will stretch observing baselines to great distances — even into space — to attain the high resolution necessary for this sensitive measurement. Building on the successes of the Event Horizon Telescope, a planet-spanning interferometer that has revealed images of the supermassive black holes at the center of the giant elliptical galaxy Messier 87 and the Milky Way, observatories like the Next-Generation Event Horizon Telescope and the Black Hole Explorer will advance our understanding of supermassive black holes and relativistic jets.
Tracing Rays from Modeled Jets
To learn what might be gleaned from future images of black holes and black hole jets, Zachary Gelles (Princeton University) and collaborators developed a model of a nearly face-on relativistic black hole jet, much like the jet from Messier 87’s black hole. The team’s model incorporates both general relativistic magnetohydrodynamics, which describes a magnetized fluid subjected to the rules of Einstein’s General Theory of Relativity, and force-free electrodynamics, which focuses on the dynamics of the system’s electromagnetic fields.

Ray-traced polarized image of a collimated black hole jet. The white bars show the direction of polarization, while the color scale shows the normalized intensity. Several abrupt changes in the polarization direction as a function of radius are visible. Click to enlarge. [Adapted from Gelles et al. 2025]
Gelles and coauthors demonstrated that one of these sudden polarization changes happens at the black hole’s light cylinder, or the radius at which the jet becomes relativistic and the magnetic field switches from being mostly poloidal to mostly azimuthal. Because the position of the light cylinder is dependent upon the spin of the black hole, measuring the location of this polarization swing allows for a measurement of the black hole’s spin.
The Promise of Polarization
This method has several potential advantages over other methods. Unlike the current leading method for measuring black hole spin, X-ray spectroscopy, this method applies to low-luminosity active black holes, which are thought to be common throughout the universe. And while the model includes a number of simplifications, the team asserts that incorporating features of more realistic jets, such as asymmetry, is unlikely to change the outcome.

Polarization direction as a function of impact parameter, showing the locations and causes of the abrupt changes in polarization angle. Click to enlarge. [Gelles et al. 2025]
Looking forward, Gelles’s team plans to continue their simulations, shoring up their predictions until they can be tested when future interferometers come online.
Citation
“Signatures of Black Hole Spin and Plasma Acceleration in Jet Polarimetry,” Z. Gelles et al 2025 ApJ 981 204. doi:10.3847/1538-4357/adb1aa
The post A New Way to Measure Black Hole Spin appeared first on AAS Nova.
]]>
Astrobites reports on an investigation of Cloud-9, a cloud of hydrogen gas that may be a galaxy containing dark matter but no stars.
The post A Long, Hard Look at (Potentially) Nothing to See appeared first on AAS Nova.
]]>Editor’s Note: Astrobites is a graduate-student-run organization that digests astrophysical literature for undergraduate students. As part of the partnership between the AAS and astrobites, we occasionally repost astrobites content here at AAS Nova. We hope you enjoy this post from astrobites; the original can be viewed at astrobites.org.
Title: Examining the Nature of the Starless Dark Matter Halo Candidate Cloud-9 with Very Large Array Observations
Authors: Alejandro Benítez-Llambay et al.
First Author’s Institution: University of Milano-Bicocca
Status: Published in ApJ
Astronomy, in many ways, is the study of light — in every wavelength that exists — coming at us from light-years away. But most of the mass in our universe is made of dark matter, a material that neither emits nor reflects any light. So, how exactly are we supposed to find this dark matter? Well, the dominant theory of what our universe is made of, Lambda cold dark matter (ΛCDM), predicts that this dark matter can form small halos — regions of gravitationally bound matter — that host reservoirs of cold gas but no stars. While we cannot directly observe dark matter, this cold gas can reflect light at radio wavelengths. Finding these dark halos, referred to as reionization-limited neutral atomic hydrogen clouds (RELHICs), is therefore rather important to confirm ΛCDM. The authors of this article are attempting to do just that by taking a close look at Cloud-9, a potential RELHIC.
How to “See” in the Dark
Cloud-9 was first discovered in 2023 when a team of astronomers noticed an excess of neutral hydrogen (HI) gas with no bright stars around it, near the spiral galaxy Messier 94 (M94). This discovery was made with the Five-hundred-meter Aperture Spherical radio Telescope (FAST), which doesn’t have the best resolution. For reference, this article found Cloud-9’s diameter to be roughly 3 arcminutes in the sky, while FAST’s resolution is 2.9 arcminutes. So, the authors of this article decided to look at Cloud-9 again, this time with the Very Large Array (VLA), an array of radio telescopes that can pick out more of the structure of this system.
With this upgraded resolution, the authors were able to get a clearer picture of the shape of Cloud-9 and compare it to the previous study (see Figure 1). They found that Cloud-9 was slightly smaller and much more lopsided than previously thought. This funky shape is likely due to gravitational interactions with the larger nearby galaxy M94, causing the gas in Cloud-9 to squish and stretch.
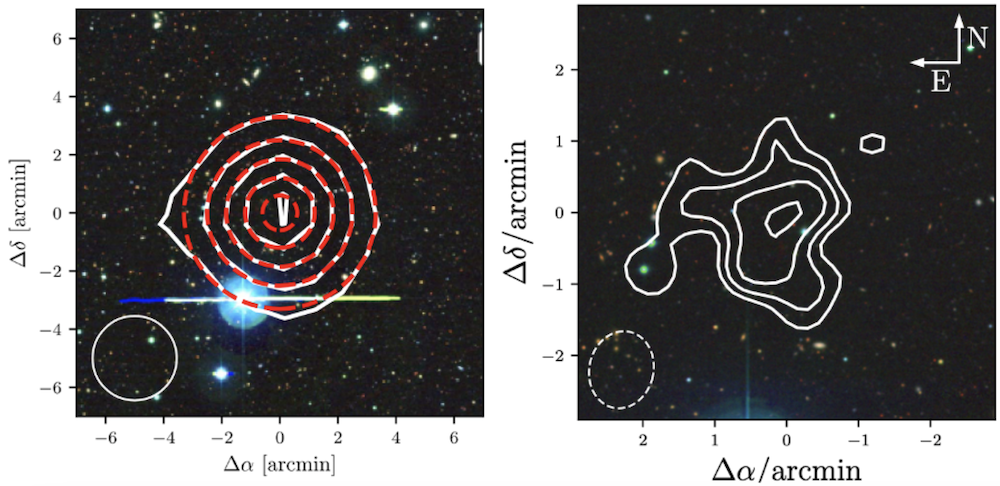
Figure 1: Left: The HI gas column density from the previous FAST observations. [Benítez-Llambay & Navarro 2023] Right: The HI gas column density from the VLA observation in this article. [Benítez-Llambay et al. 2024] Corner circles represent the resolution of each telescope and the x and y axes are the position on the sky. Note the scale of the axes in each plot; the right plot is a zoomed-in version of the left.
RELHIC or Just RELHIC-tively Dim?
To determine if Cloud-9 really is a RELHIC, the authors needed to compare its HI radial density profile to the profiles of simulated RELHICs. Density profiles are a good tool to use here since although we don’t fully understand what dark matter is, we do know how it will affect things around it gravitationally. If the only matter hosted by Cloud-9 is HI gas and dark matter, then that gas will have a specific distribution that we can observe. If other baryonic matter is hosted by Cloud-9 that we just aren’t picking up right now, it will affect that density profile.
The authors found that for a detailed, general simulation the profiles did not match well, specifically in the outer regions. But when they compared it to a sphere of gas with a constant, specific temperature, they were able to get the fits to line up (see Figure 2). However, the authors point out that these simulations are isolated, meaning there is no big galaxy next to them affecting their shape, unlike Cloud-9.
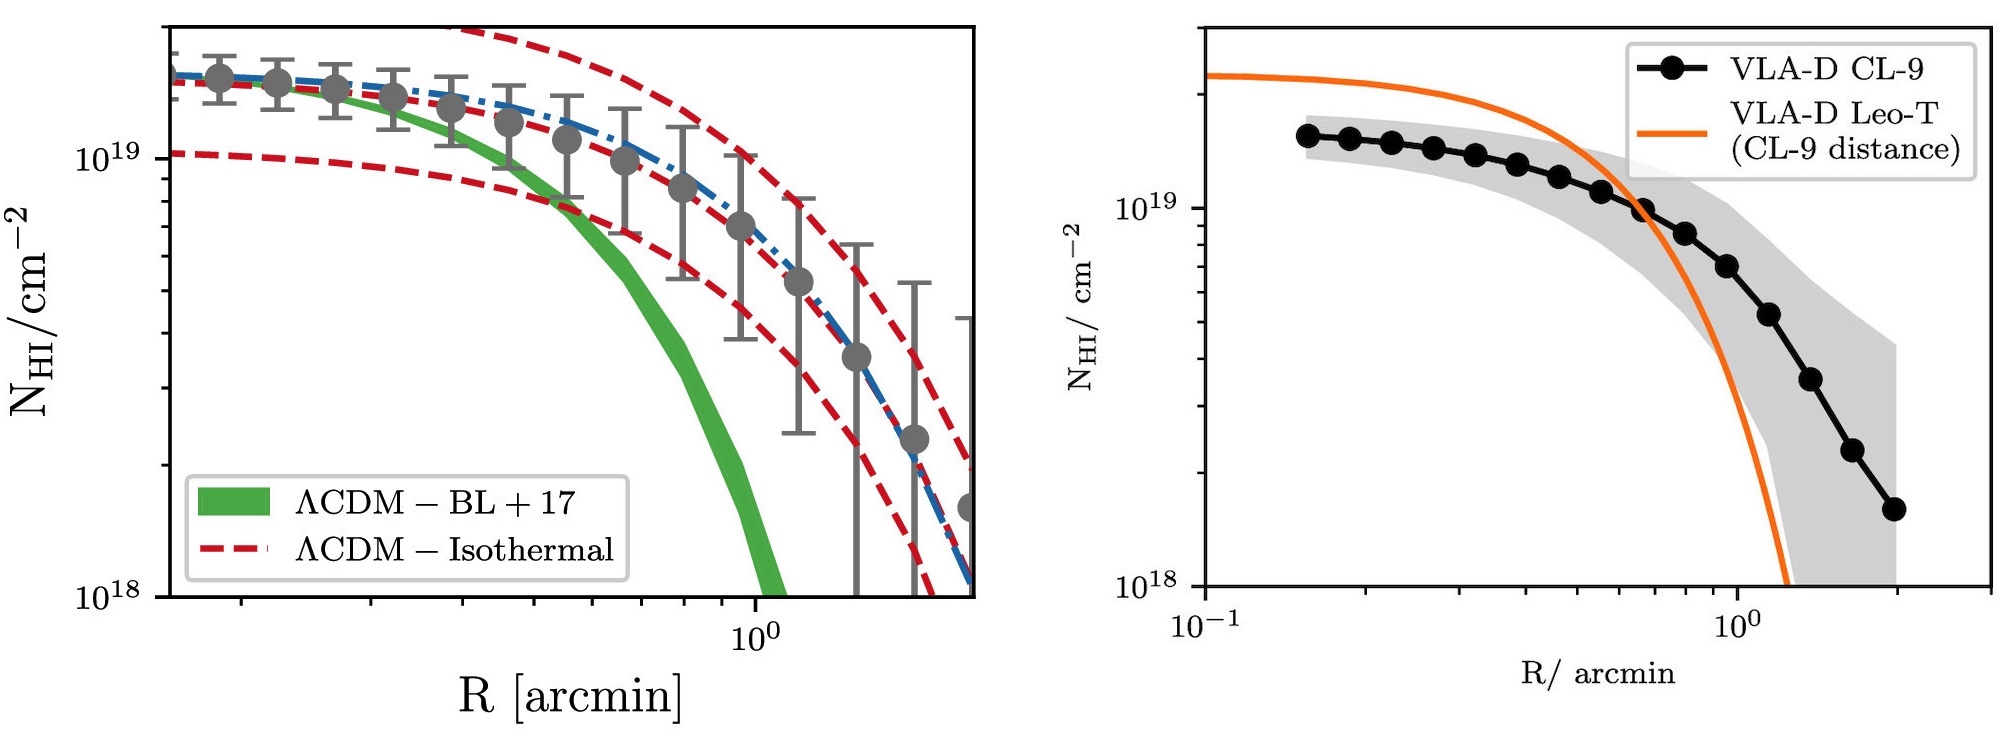
Figure 2: Left: Comparison of Cloud-9’s HI profile (grey dots) to a general simulated RELHIC’s profile (green line) and a simulated RELHIC at a specific temperature (red line). Right: Comparison of Cloud-9’s profile (black dots) to Leo T’s profile (orange line). Although the positions are shifted, the slopes of the profiles match. [Benítez-Llambay et al. 2024]
What Are the Next Steps?
The authors conclude that, as of right now, they can’t definitively say whether Cloud-9 is or is not a RELHIC, but there are a few things astronomers can do to clear things up. First, theorists can re-run the RELHIC simulations with halos that have been affected by gravity like Cloud-9. This will allow them to better compare their observations to the simulations.
Second, observers can image Cloud-9 with an optical telescope that is powerful enough to detect any stars that could be there. They suggest the Hubble Space Telescope since it would be able to detect the brightest handful of stars in the potential dim population. JWST would be an even better choice, with its even deeper imaging capabilities, but it is very difficult to get observing time on it. (JWST recently received the most proposals in one year for any telescope ever!)
We will likely have to wait a bit for a definitive answer on the nature of Cloud-9, but either way the authors are excited by this gas cloud. Either it is the first starless dark matter halo, a confirmation of one of the predictions of ΛCDM, or it is the most distant ultra-faint dwarf galaxy ever detected! Although Cloud-9 is not much to look at right now, you should still definitely keep your eye on it.
Original astrobite edited by Maggie Verrico and Cole Meldorf.
About the author, Veronika Dornan:
Veronika is a final-year PhD candidate at McMaster University. Her research is in observations of extragalactic globular star clusters and what they can tell us about galaxy evolution and dark matter distribution in the universe.
The post A Long, Hard Look at (Potentially) Nothing to See appeared first on AAS Nova.
]]>
Mark your calendars for a few tens of millions of years in the future: a core-collapse supernova at just 228 light-years away is sure to be spectacular.
The post Double-Star Discovery Suggests There’s a New Nearby Supernova Progenitor appeared first on AAS Nova.
]]>New data suggest that the second-brightest star in the constellation Sagittarius is not one star but two. The two stars will someday merge to form a single star with a mass of 12 solar masses, and at just 228 light-years away, the resulting star will be the nearest core-collapse supernova progenitor to Earth.
One Star of Two?
The star Sigma Sagittarii, formally named Nunki by the International Astronomical Union, has been under scrutiny for decades. Various studies published in the last half-century have found Nunki to be either two stars in a tight binary system or a single star, depending on the methods and instruments used.

Three of the Very Large Telescope Interferometer’s 1.8-meter Auxiliary Telescopes, which can be maneuvered into different positions. [Y. Beletsky (LCO)/ESO; CC BY 4.0]
The VLTI encompasses eight telescopes, including four 8.2-meter telescopes that are fixed in place and four 1.8-meter telescopes that can travel between different stations, changing the resolving power of the interferometer. For this search, Waisberg and collaborators positioned the smaller telescopes so that the greatest distance between them was 130 meters, achieving a resolution of just 3.5 milliarcseconds.
Future Site of a Supernova
The VLTI data clearly show that Nunki is a close binary star system. The two stars have nearly the same mass — 6.5 and 6.3 solar masses — and are separated by just 0.60 au, orbiting one another every 50 days. Stellar isochrone modeling suggests that the stars are roughly 30 million years old.

Diagram of a binary star system in which one star has filled its Roche lobe. The blue shaded areas indicate the stars, while the black lines outline the two stars’ Roche lobes. [Philip D. Hall; CC BY 4.0]
At 12 solar masses, Nunki will be massive enough to undergo core collapse, and at just 228 light-years away, it is the nearest core-collapse supernova progenitor system to Earth. Be sure to mark your calendar for tens of millions of years in the future — such a close supernova promises to be spectacular!
Citation
“Hidden Companions to Intermediate-Mass Stars. XXVI. Uncovering Nunki = Sigma Sagittarii as a 6.5 M⊙ + 6.3 M⊙, 0.60 au Binary,” Idel Waisberg et al 2025 Res. Notes AAS 9 71. doi:10.3847/2515-5172/adc739
The post Double-Star Discovery Suggests There’s a New Nearby Supernova Progenitor appeared first on AAS Nova.
]]>
From its vantage point in orbit around Saturn, the Cassini spacecraft captured the brilliant gleam of sunlight reflecting off of Titan's oily hydrocarbon seas. New research explores what sunglint can tell us about the interaction between Titan's seas and atmosphere.
The post Sun Glitter and Sunglint on Titan’s Hydrocarbon Seas appeared first on AAS Nova.
]]>Earthlike yet alien, Titan is the only solar system body other than Earth known to host persistent liquid on its surface. The glint of sunlight on this surface liquid provides a means to study the complex interplay between Titan’s seas, shorelines, and atmosphere.
When the Sun Hits the Sea as Seen by Cassini, That’s a Mare

The first image of specular reflection of sunlight off Titan’s hydrocarbon seas, taken on 8 July 2009 by Cassini. [NASA/JPL/University of Arizona/DLR]
A recent research article from Michael Heslar and Jason Barnes (University of Idaho) yields new insight into the behavior of Titan’s seas and coastal regions in Punga Mare. Punga Mare, located nearly at the north pole, is the smallest of Titan’s named seas and holds the distinction of being the first place where extraterrestrial waves were definitively identified.
Summering at Punga Mare
In the Cassini observation selected for this study, it’s summertime in the northern hemisphere, with balmy temperatures hovering just above 90K (−298℉/−183℃). Cassini viewed Punga Mare from an altitude of roughly 6,000 kilometers and at an oblique angle of 126 degrees. From this angle, Titan’s landmasses appear dark and the sea appears bright.

The geometry of specular reflection (sunglint) and sun glitter. The incidence and emission angles, i and e, are equal. Click to enlarge. [Heslar et al. 2020]
Coasts, Islands, and Inlets

Cassini Visual and Infrared Mapping Spectrometer observation of Punga Mare at wavelengths of 5.0 (red), 2.8 (green), and 2.0 (blue) μm. Click to enlarge. [Adapted from Heslar & Barnes 2025]
The bright areas along the coast appear to overlap both the sea surface and the land surface. While it’s not yet clear exactly what causes this brilliant coastal outline, Heslar and Barnes speculated that it may be evidence for waves along the coastline; rough seas may also be the cause of the sun glitter illuminating the Hawaiki island chain and out at sea.
The specular features associated with inlets may mark where rivers flow into or out of Punga Mare. Rather than wave activity, these bright areas might mark where nitrogen has bubbled up to the surface.
Altogether, this study demonstrated the variety and depth of information that can be gleaned from a single sunglint observation — and the authors closed by noting how effective an orbiter would be for studying ocean behavior on Titan. NASA’s upcoming Dragonfly mission may also be able to capture sunglint as the spacecraft leapfrogs across Titan’s surface.
Citation
“Sea Surface and Hydrological Activity Observed in Titan’s Punga Mare,” Michael F. Heslar and Jason W. Barnes 2025 Planet. Sci. J. 6 74. doi:10.3847/PSJ/adbc9e
The post Sun Glitter and Sunglint on Titan’s Hydrocarbon Seas appeared first on AAS Nova.
]]>
Arachnophobes beware: today's post concerns the behavior of the voracious stellar remnants called spider pulsars.
The post Monthly Roundup: A Cluster of Cosmic Spiders appeared first on AAS Nova.
]]>In the vast menagerie of cosmic critters, perhaps none is as impressively deadly as the spider pulsar. Spider pulsars are a subset of millisecond pulsars: tiny, extraordinarily fast-spinning remnants of dead massive stars. Like other types of pulsars, spider pulsars emit narrow beams of radio emission that can sweep across our field of view as the pulsar spins, generating the characteristic radio pulses from which pulsars get their name. Locked in a close embrace with a low-mass stellar companion, a spider pulsar roasts its companion with high-energy radiation and strips away the companion’s atmosphere with powerful particle winds. Eventually, like the ill-fated mates of certain spiders, the companion star may be entirely destroyed.
Just as there are many species of spiders, so too does it appear that there are different “species” of spider pulsars. So far, two categories are well established, and a third has started to emerge. These categories are based on the mass of the pulsar’s companion star and the orbital period of the system. Black widows have the lowest-mass companions, weighing in at just 5% of the mass of the Sun, and orbital periods less than one day. Redbacks, named after black-and-red spiders also known as Australian black widows, are similarly closely orbiting but have companions with masses ranging from 0.1 to 1.0 solar mass. Finally, the emerging class of huntsman pulsars, named for a large, long-legged type of spider, have low-mass red giant companions and relatively long orbits of 5–10 days.
Today, the Monthly Roundup will introduce three recent investigations of spider pulsars.
Discovery of a Second Huntsman
In 2016, researchers reported the discovery of a ~2-solar-mass millisecond pulsar in a 5.4-day orbit with a 0.33-solar-mass red giant companion stripped of its outer atmosphere. This pulsar — with its evolved stellar companion and long orbital period — was unlike any other spider pulsar known at the time and is now the prototype of a new class of spider pulsars nicknamed “huntsman” pulsars. A year later, a second system with similar properties was found, though the pulsar was not directly detected and remains a candidate.
Now, a team led by Jay Strader (Michigan State University) has announced the discovery of the second confirmed huntsman: the pulsar PSR J1947–1120. This source initially came to light in gamma-ray observations by the Fermi Gamma-ray Space Telescope. Millisecond pulsars are known to emit gamma rays, and many pulsars are first discovered in gamma rays. Using new and archival observations from the Neil Gehrels Swift Observatory (X-rays), XMM-Newton (X-rays), Gaia (optical), the Zwicky Transient Facility (optical), the Southern Astrophysical Research telescope (optical), and the Green Bank Telescope (radio), Strader’s team followed up on the gamma-ray detection and identified both the pulsar and its companion.

A spectrum of the PSR J1947–1120 system. The spectrum is consistent with a cool K-type star. Click to enlarge. [Strader et al. 2025]
Strader’s team outlined a potential formation mechanism for huntsman pulsars that involves a red giant companion in the “red bump” phase. During this phase of stellar evolution, red giants temporarily become smaller and less luminous, resulting in a pileup or “bump” in the Hertzsprung–Russell diagram. Accretion onto the pulsar also ceases during this period, matching what is seen in huntsman systems. Through stellar evolution modeling, the team showed that the properties of the two known huntsman pulsars can be attained by systems containing red giant stars in the red bump phase.
Why, then, have so few huntsman pulsars been found compared to other types of spider pulsars? The red bump phase of red giant evolution is brief, cosmically speaking, lasting on the order of tens of millions of years. Other types of spider pulsars arise in setups that are longer lived, on the order of billions of years, making it simply more likely to find a black widow or redback in the field than a huntsman.
Searching for Spiders That Will Consume Their Companions
Spider pulsars often exhibit eclipses: periods during which the pulsar’s radio signal passes through the ablated material of the companion star, causing the signal to drop out. While radio eclipses are a common feature of spider pulsars, not all spider pulsars experience this phenomenon. The inclination of the system and physical size of the companion star may both influence whether a spider pulsar exhibits eclipses.
The occurrence of radio eclipses may also be related to the mass-loss rate of the companion star, with higher mass-loss rates being associated with eclipses. The rate at which spider pulsars ablate their companions is a crucial piece of information for establishing spider pulsars as the missing link in the creation of solo millisecond pulsars.
Typically, millisecond pulsars like spider pulsars are thought to arise in binary systems. Accretion onto the pulsar from the binary companion spins up the pulsar, helping it achieve its extreme speed. While this mechanism explains the origins of millisecond pulsars in binary systems, it can’t explain solo millisecond pulsars — unless these singletons are spider pulsars that have entirely ablated their companions.
To explore this possibility, astronomers need to study the eclipses and mass-loss rates of a large sample of spider pulsars; so far, none of the known spider pulsars are blowing away their companions quickly enough for their companion stars to disappear within the universe’s current age.

Example of the detected radio eclipses. [Kumari et al. 2025]
In addition to characterizing the eclipses they detected, the authors calculated the mass-loss rates for two of the pulsar’s companions. The mass-loss rates were too small to fully ablate the companion stars within the age of the universe, as has been the case for other spider pulsars under study. Additionally, the team found no correlation between the pulsar spin-down rates — thought to be related to the mass-loss rate — and the presence of eclipses, suggesting that other factors must play an important role in the creation of eclipses.
A Spider on the Dividing Line
J1908+2105 is a spider pulsar that was discovered in a search for counterparts to unidentified gamma-ray sources. The pulsar rotates every 2.56 milliseconds, and it’s in a 3.51-hour orbit with a companion star with a minimum mass of 0.055 solar mass, placing the pulsar between black widows and redbacks. As one of only a few known pulsars that may sit upon the dividing line between black widows and redbacks, studying J1908+2105 may help researchers understand whether these pulsars are evolving from one class to the other.

Average radio pulses at three different frequencies, showing the pulse behavior when not eclipsed. [Ghosh et al. 2025]
The team detected J1908+2105’s eclipses at frequencies up to 4 gigahertz, making this one of only a few pulsars with observable eclipses at such high frequency. They explored several possible sources for the eclipses, such as reaching the plasma frequency cutoff — the frequency at which radio waves are unable to travel through a plasma — and determined that synchrotron absorption is the likeliest cause.
Ghosh’s team measured the mass-loss rate from observations made at several frequencies, finding in the highest frequency band a mass-loss rate large enough for the companion to be ablated within 3 billion years. The authors caution that changes in the orbital properties of the system, spurred by the companion’s mass loss, likely mean that the rate will slow over time, and it may not be possible for the companion to be fully evaporated.
Citation
“PSR J1947−1120: A New Huntsman Millisecond Pulsar Binary,” Jay Strader et al 2025 ApJ 980 124. doi:10.3847/1538-4357/ada897
“Unveiling Low-Frequency Eclipses in Spider Millisecond Pulsars Using Wideband GMRT Observations,” Sangita Kumari et al 2025 ApJ 979 143. doi:10.3847/1538-4357/ad93ba
“Exploring Unusual High-Frequency Eclipses in MSP J1908+2105,” Ankita Ghosh et al 2025 ApJ 982 168. doi:10.3847/1538-4357/adb8e0
The post Monthly Roundup: A Cluster of Cosmic Spiders appeared first on AAS Nova.
]]>
Astrobites reports on whether planets around Sun-like stars destined to become white dwarfs are able to hold on to their oceans.
The post I’ve Got Some Oceanfront Property… Around a White Dwarf appeared first on AAS Nova.
]]>Editor’s Note: Astrobites is a graduate-student-run organization that digests astrophysical literature for undergraduate students. As part of the partnership between the AAS and astrobites, we occasionally repost astrobites content here at AAS Nova. We hope you enjoy this post from astrobites; the original can be viewed at astrobites.org.
Title: The Fate of Oceans on First-Generation Planets Orbiting White Dwarfs
Authors: Juliette Becker, Andrew Vanderburg, and Joseph R. Livesey
First Author’s Institution: University of Wisconsin–Madison
Status: Published in ApJ
Toward the ends of their lives, stars like the Sun are destined to expand into red giants, expel their outer layers, and leave behind their Earth-sized cores as white dwarfs. What happens to any planets during this stage of stellar evolution is far more uncertain. Planets sufficiently close to their host star are expected to be engulfed as the star expands into a red giant, including our very own Earth. However, some planets can survive or perhaps even form during white-dwarf formation, and we know of a handful of planets and planet candidates around white dwarfs from transits, direct imaging, and detection of mid-infrared excess.
Planets orbiting white dwarfs are particularly attractive targets for searches for biosignatures and, more speculatively, technosignatures, because their atmospheres are easier to detect due to their stars’ small sizes. We have yet to find a terrestrial planet orbiting a white dwarf, let alone one in the habitable zone, but searches are ongoing. Another important factor for habitability is the presence of water, and today’s article investigates whether a planet could retain an ocean through its star’s evolution and end up in the habitable zone, where life might exist.
Stellar Ocean Loss
To set the scene, let us imagine an ocean-bearing planet orbiting a Sun-like star evolving off the main sequence. Even if the planet survives engulfment, it could easily lose its water and become likely uninhabitable if the following steps occur: 1) high surface temperatures evaporate the ocean into the atmosphere, 2) high-energy photons dissociate the water molecules into hydrogen and oxygen, and 3) those atoms escape into space and do not re-condensate.
As the star leaves the main sequence, the planet responds to changes in the star’s size, brightness, and mass. The top four panels of Figure 1 show variations in stellar and planetary properties during this stage of stellar evolution. During the asymptotic giant branch phase, the star brightens considerably and expels ~30–80% of its mass, causing the planet’s orbit to expand. X-ray and extreme-ultraviolet flux from the star can cause the planet to lose atmospheric mass from photoevaporation (i.e., when high-energy photons deposit sufficient energy for particles to reach escape velocity). As the planet’s surface temperature increases, the ocean could evaporate, creating a predominantly water vapor atmosphere. If the extreme-ultraviolet flux is sufficiently high such that oxygen and/or hydrogen escape the atmosphere, the ocean is lost. The bottom panel of Figure 1 shows that water retention becomes more difficult if the planet’s initial orbital radius is small.

Figure 1: From top to bottom, stellar luminosity, stellar mass, planetary semi-major axis, and planetary temperature as a star becomes a red giant and subsequently a white dwarf. The bottom panel shows the fraction of the ocean retained for an Earth-like planet with various values of initial semi-major axis. [Becker et al. 2025]
Tidal Ocean Loss
Not only does the ocean have to survive the aforementioned complications, but the planet needs to end up in the habitable zone despite starting far away from the star. The planet must be perturbed to achieve high eccentricity and then tidally circularize its orbit in the white-dwarf habitable zone (~0.01 au). Planet–planet scattering (i.e., dynamical interactions between planets in a multi-planet system) is the most plausible mechanism to drive a planet inwards. These interactions could be delayed substantially after white-dwarf formation. Since white dwarfs cool and emit less extreme-ultraviolet flux over time, delaying inward scattering could enhance water retention.
Large eccentricity helps drive a planet inwards, but it also stokes tidal heating that could increase the surface temperature. The exact effects on ocean evaporation and atmospheric mass loss are highly sensitive to how energy is dissipated. In general, tidal heating can result in Jeans escape, in which atmospheric particles reach sufficient thermal motion to escape into space. The authors find that while tidal heating is effective at evaporating the ocean into the atmosphere, it is less effective than the extreme-ultraviolet-driven mechanism at driving atmospheric mass loss.
Takeaways
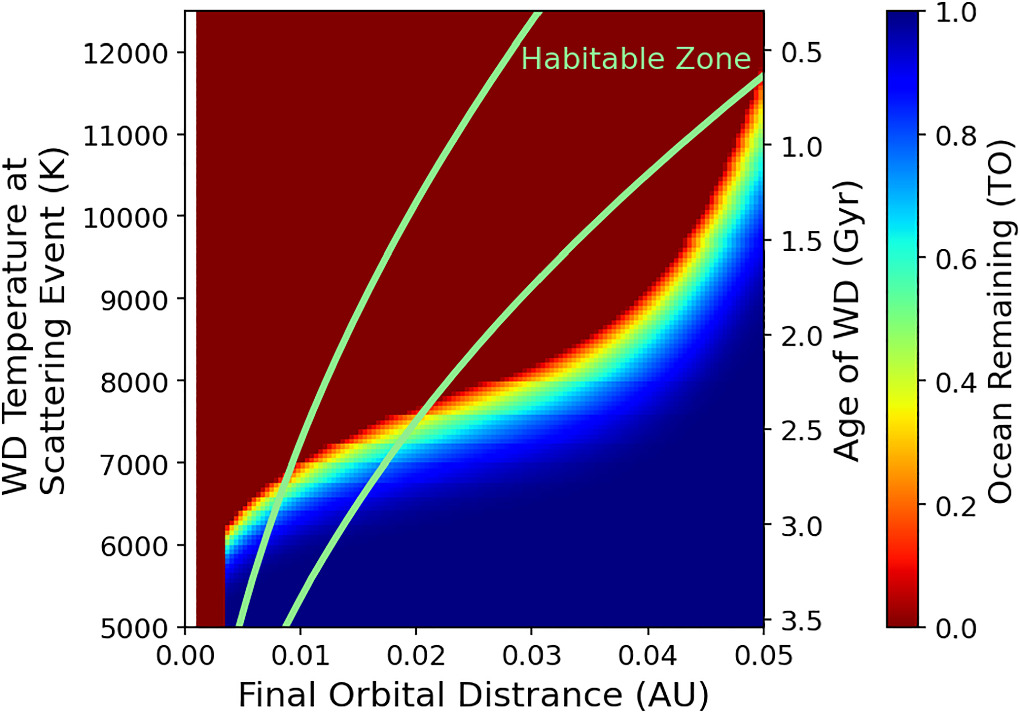
Figure 2: The effects of white-dwarf scattering temperature and final orbital radius on ocean survival. The authors use an Earth-like planet with an initial orbital radius of 5 au and varying eccentricity. [Becker et al. 2025]
Original astrobite edited by William Smith.
About the author, Kylee Carden:
I am a second-year PhD student at The Ohio State University, where I am an observer of planets outside the solar system. I’m involved with the Roman Space Telescope, a small robotic telescope called DEMONEXT, and exoplanet atmospheres. I am a huge fan of my cat Piccadilly, cycling, and visiting underappreciated tourist sites.
The post I’ve Got Some Oceanfront Property… Around a White Dwarf appeared first on AAS Nova.
]]>
New images highlight the clumpy ejecta and radial streaks surrounding WR 8, a Wolf–Rayet star that may be changing from one spectral subclass to another.
The post Featured Image: Details of a Rare Ejecta Nebula appeared first on AAS Nova.
]]>This image shows glowing ejecta flung into space by a Wolf–Rayet star called WR 8. Wolf–Rayet stars are extremely hot and luminous massive stars that have cast away their outer layers. Because of their extreme winds, mass loss, and radiation, Wolf–Rayet stars are often surrounded by intricate nebulae. The nebula surrounding WR 8 was first reported in 2010, and now, Robert Fesen (Dartmouth College) and collaborators have revealed it in great detail. This image shows observations made in three broad visible-light bands as well as narrow bands that highlight emission from hydrogen and oxygen. The nebula’s clumpy ejecta and radial streaks stand out in blue. (The bright pinkish-orange streak that cuts across the image from the upper-left corner to the lower-right corner comes from an interstellar cloud in the background or foreground.) WR 8 is an interesting target because the star’s spectrum has features from two different Wolf–Rayet subclasses, suggesting that the star may be in the midst of a rapid (on the order of 10,000 years) transition from one class to another. A deeper investigation into this nebula may improve our understanding of this transition phase. To learn more about these new images of WR 8, be sure to check out the full article linked below.
Citation
“Deep Optical Images of the Ejecta Nebula around the Wolf–Rayet Star WR 8 (HD 62910),” Robert A. Fesen et al 2025 AJ 169 231. doi:10.3847/1538-3881/adbd41
The post Featured Image: Details of a Rare Ejecta Nebula appeared first on AAS Nova.
]]>
New high-resolution maps of the Moon's north pole reveal interesting terrain and locations possibly preserving water ice, which will inform future lunar exploration.
The post Crater Cartography: Mapping the Moon’s North Pole appeared first on AAS Nova.
]]>While humans have not set foot on the Moon in over 50 years, multiple spacecraft and rovers have surveyed our closest companion in great detail for decades. Since 2009, the Lunar Reconnaissance Orbiter has orbited the Moon, collecting data in order to map the Moon’s surface and identify potential landing sites and resources for future lunar missions. A recent study focuses on the Moon’s north pole, using data from the orbiter to create new highly detailed maps.
Artist’s impression of the Lunar Reconnaissance Orbiter orbiting above the surface of the Moon. Click to enlarge. [NASA/GSFC]
Navigating the Moon’s Surface
When making the 238,900-mile journey to the surface of the Moon, it’s important to be able to stick the landing. After being pelted with rogue solar system rocks for billions of years, the Moon’s surface is home to thousands of craters, making peaks and valleys that vary significantly depending on where you land. Thus, having a detailed understanding of the Moon’s surface is imperative to choosing where to aim and knowing what can be accomplished once we get there.
In recent years, researchers have created detailed maps of the Moon’s south pole to identify regions with rough terrain, boulders, steep edges of craters, and flatter areas safer for landings. In addition to mapping geological features, these studies have found candidate water-ice sources that will be targeted in future missions. With continued observations, higher-resolution studies can reveal more detailed information about other regions on the Moon as well.
Mapping the North Pole
Recently, Michael K. Barker (NASA Goddard Space Flight Center) and collaborators used data from the Lunar Orbiter Laser Altimeter (LOLA) on the Lunar Reconnaissance Orbiter to produce high-quality topographical maps of the Moon’s north pole. LOLA uses a laser to measure variations in the Moon’s surface, and from this information, the authors computed new maps of the surface height, slope, and roughness — how bumpy or uneven the terrain is — in the north polar region. The new surface height and slope maps provide information regarding regions of high and low elevation as well as how rapidly those changes in elevation occur. Additionally, the authors created a new high-resolution map of permanently shadowed regions — areas never hit with direct sunlight, keeping any possible traces of water ice cool and intact.
Lunar surface maps of slope (left column) and roughness (right column) across smaller (top) and larger (bottom) spatial scales. Click to enlarge. [Barker et al 2025]
Where do these results take us? The differences between the north and south poles motivate further exploration of both locations. Future human and robotic missions will allow for more robust studies of the Moon’s surface, which will test for the relationship between surface features and subsurface ices, explore the geography on much smaller scales, and set the grounds for sustained science on the Moon.
Citation
“Large-Scale Roughness Properties of the Lunar North and South Polar Regions as Measured by the Lunar Orbiter Laser Altimeter (LOLA),” Michael K. Barker et al 2025 Planet. Sci. J. 6 83. doi:10.3847/PSJ/adbc9d
The post Crater Cartography: Mapping the Moon’s North Pole appeared first on AAS Nova.
]]>
Astrobites reports on observations of dwarf galaxies that show how a buddy galaxy can help trigger phases of rapid black hole growth.
The post Black Holes Grow Better with a Friend appeared first on AAS Nova.
]]>Editor’s Note: Astrobites is a graduate-student-run organization that digests astrophysical literature for undergraduate students. As part of the partnership between the AAS and astrobites, we occasionally repost astrobites content here at AAS Nova. We hope you enjoy this post from astrobites; the original can be viewed at astrobites.org.
Title: Low-Mass Galaxy Interactions Trigger Black Hole Activity
Authors: Marko Mićić et al.
First Author’s Institution: The University of Oklahoma
Status: Published in ApJL
Most galaxies have a central supermassive black hole. Over time, these black holes grow by eating up lots of gas and stars, and occasionally by merging with another black hole. As telescopes have improved, and especially with the recent launch of JWST, astronomers have discovered supermassive black holes that are more massive than we originally thought black holes should be in the early universe (you can read more about black hole growth here and here). This observation implies that black holes can grow very quickly during the first 700 million years of the universe’s existence.
But understanding this early phase of black hole growth is no easy task. In the early universe, the majority of galaxies were low-mass, dim dwarf galaxies that are difficult to observe, even with our strongest telescopes. One way that astronomers can overcome this challenge is by studying nearby dwarf galaxies that we think resemble early universe dwarf galaxies.
When a black hole is growing and eating a lot of gas, we call it an active galactic nucleus, or AGN. The process of black hole growth also releases a huge amount of energy, making an AGN very bright, especially in X-rays. Astronomers think that black holes build up a lot of their mass during these AGN phases, but it’s unclear what triggers the beginning of an AGN phase and whether AGN triggers are more common in the early universe.
One possibility is that galaxy mergers trigger AGN phases. Studies have found evidence that a higher percentage of galaxies that have recently undergone mergers also host an AGN, supporting this idea. However, these studies focus on galaxies that are much more massive than early universe galaxies, making it difficult to say whether we can extrapolate these results and apply them to low-mass dwarf galaxies.
The authors of today’s article set out to answer the question of whether galaxy mergers could trigger enough AGN activity to explain the existence of supermassive black holes in the early universe. To do so, they studied pairs of dwarf galaxies that are much closer to us but might be representative of early universe galaxies.
Figure 1: Four dwarf galaxy systems found by today’s authors. The red boxes show the galaxies that they’ve determined to be close to each other. The original images are from the 3D-HST survey. Click to enlarge. [Adapted from Mićić et al. 2024]
For each dwarf galaxy in a pair or group, the authors also identified a galaxy at a similar distance from us with a similar mass but without any nearby neighbours. This sample of isolated galaxies acted as the control sample against which the authors could compare their results.
To determine whether each galaxy was hosting an AGN, the authors crossmatched their galaxies with X-ray data taken by the Chandra X-ray Observatory. Since the AGN in these galaxies are expected to be fairly faint, very high-quality X-ray data are needed in order to definitively say whether a galaxy has an AGN or not. As a result, the authors were only able to check for AGN in 29 of their dwarf-galaxy-pair systems, and they found seven AGN within this subsample. In the control sample, they only found three AGN in a sample of 183 galaxies.
Figure 2: The AGN frequency (the two blue points) for interacting dwarf galaxies is much higher than the AGN frequency for the control sample (black point) and the AGN frequency reported in previous papers (red, yellow, green, and purple points). Click to enlarge. [Mićić et al. 2024]
The results of today’s article support the idea that dwarf galaxy mergers might be a trigger of AGN activity. Since the majority of galaxies in the early universe are dwarf galaxies, this might result in a higher AGN fraction, which could help to explain how black holes are able to grow so quickly in the early universe. Further X-ray observations of the dwarf galaxy pairs identified by the authors will help to confirm this result and better constrain the AGN fraction in dwarf galaxy mergers — so stay tuned!
Original astrobite edited by Archana Aravindan.
About the author, Nathalie Korhonen Cuestas:
Nathalie Korhonen Cuestas is a second-year PhD student at Northwestern University, where her research focuses on the chemical evolution of galaxies.
The post Black Holes Grow Better with a Friend appeared first on AAS Nova.
]]>
Since 2017, the Research Notes of the American Astronomical Society (RNAAS) has provided a venue for brief research reports, student work, null results, and more. Editor Chris Lintott shares his reflections on a recent RNAAS milestone: 2,000 Notes.
The post <em>Research Notes of the AAS</em> Celebrates Its 2,000th Publication appeared first on AAS Nova.
]]>Editor’s Note: This week, the Research Notes of the AAS (RNAAS) — a free-to-publish outlet ideal for timely observations, student work, and null results — published its 2,000th Research Note. Editor Chris Lintott shares his thoughts on this milestone below.

RNAAS editor Chris Lintott
I have the most interesting job in astronomy. Most mornings, just as the first coffee of the day is hitting the system, I open my AAS email and find a fresh Research Note sitting there. The variety is limited only by the creativity of our community; last week I handled updated observations of an intriguing planetary system, the categorisation of obscured active galactic nuclei, an updated catalogue of 50 million stars, and even a speculative piece on floating islands of lava on the surface of planet-consuming red dwarfs.
RNAAS is designed to be a simple place to publish, so these pieces in all their variety are moderated rather than peer reviewed, usually by me and that coffee, but occasionally by my colleagues across the AAS Journals editorial team. RNAAS‘s purpose is to get information of interest into the formal record quickly, without paying attention to notability. With a few exceptions (mostly for novel theory, which really does need peer review), if you have an astronomical result (even, perhaps especially, a null result), observation, or fact to write down, RNAAS will take it.
This week we published the 2,000th Note since RNAAS started back in 2017 (an interesting study of dual active galactic nuclei — galaxies with twin black holes — by Colton Burross and Krista Smith of Texas A&M University), and some modest self-congratulation is in order. Looking back over the 2,000 Notes, some themes emerge; we’ve clearly been successful in encouraging students on summer placements to submit, giving many of them a first formal publication, and the desire for large, growing, and updated catalogues across astronomy is increasingly being serviced by the rapid publication afforded by RNAAS.
That said, it is the sheer variety of submissions that stands out. From the contents of Subrahmanyan Chandrasekhar’s correspondence and observations of sunspots in 1791, to 128 new moons of Saturn, to guides on advanced statistics, the range is astonishing.
We have every intention of keeping RNAAS going as a free service to the astronomical community. But on this special occasion, if you are one of the authors who have contributed to our 2,000 Notes, then I want to say thanks. If not, then please consider if you have a thought that might be presented in a few pages (and one figure or table!). In either case, all of you are invited to do what I do, and start your day by browsing RNAAS with a coffee.
Chris Lintott
Editor, Research Notes of the AAS
Want to start your day with RNAAS?
Click here to learn how to receive alerts when new Research Notes are published.
The post <em>Research Notes of the AAS</em> Celebrates Its 2,000th Publication appeared first on AAS Nova.
]]>
A search for white dwarfs that present different compositional "faces" as they spin has dredged up two new members of the emerging class of double-faced white dwarfs.
The post Two More Double-Faced White Dwarfs Discovered appeared first on AAS Nova.
]]>A recent study brings the number of known double-faced white dwarfs to seven. These rare objects, which feature compositional changes across their surfaces, may arise under the influence of magnetic fields.
The Rise of Two-Faced Stars
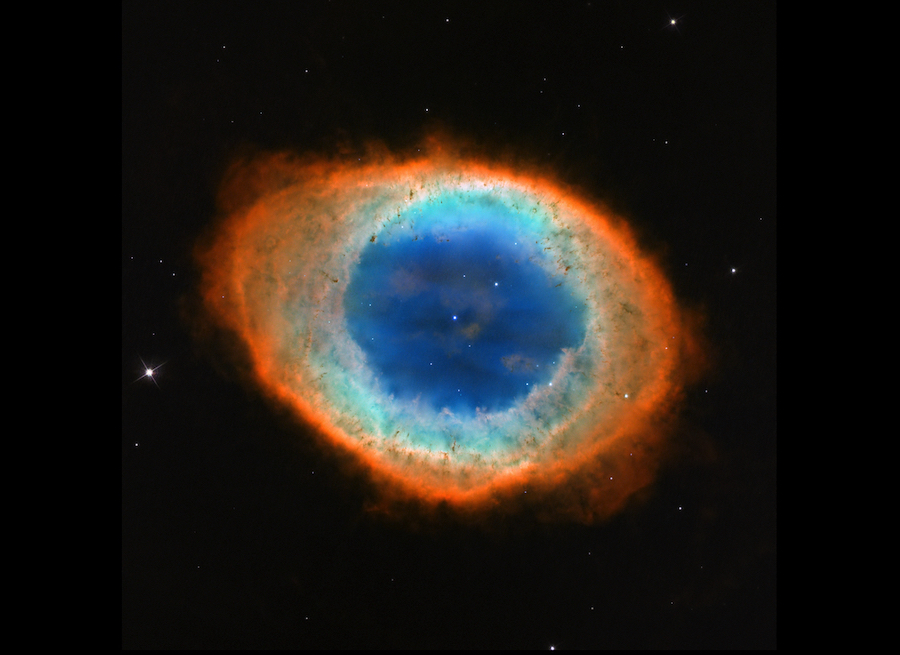
When a super-hot white dwarf illuminates the diffuse shells of gas that surround it, we see a glowing planetary nebula. The central white dwarf is visible in this image of the Ring Nebula. [NASA, ESA and the Hubble Heritage (STScI/AURA)-ESA/Hubble Collaboration]
In 2023, researchers reported the discovery of a bizarre white dwarf: one with a surface composed of hydrogen on one side and helium on the other. A handful of other white dwarfs with split or patchy surface compositions have since been discovered, giving rise to the growing class of double-faced white dwarfs.
Many aspects of these strange objects are still unknown, including exactly how they form, how common they are, and what kinds of surface composition distributions are possible. To answer these questions, researchers must find more double-faced white dwarfs — and the hunt is on.
A Closer Look at “Binary” White Dwarfs
Because the composition of a double-faced white dwarf varies across its surface, these objects can present different compositional “faces” as they spin, sometimes resembling one kind of white dwarf and sometimes another. To find white dwarfs with this behavior, Adam Moss (University of Oklahoma) and collaborators investigated six systems earmarked as being possible unresolved binary systems containing one hydrogen-rich white dwarf and one helium-rich white dwarf.
The team suspected that these “binary” systems might instead be double-faced white dwarfs exhibiting features of two types of white dwarfs. One last white dwarf, previously identified as having spectral features from both hydrogen and helium, rounded out the sample.

Spectra of white dwarf J0847+4842 taken at the beginning, middle, and end of the night from Apache Point Observatory. The spectra have been offset vertically for clarity. Vertical blue lines mark the locations of hydrogen lines, and vertical red lines mark the locations of helium lines. [Adapted from Moss et al. 2025]
Potential Magnetic Origins
These two newly discovered double-faced white dwarfs bring the number of known objects in this class to seven. What does the current sample tell us about the origins of double-faced white dwarfs?
Four of the seven sample members are known to have magnetic fields, which is a far larger proportion than the general population of white dwarfs. This suggests that magnetic fields play an important role in creating these objects’ patchwork surfaces.
Moss and collaborators favor a scenario in which magnetic fields affect the process of convection, which can alter the elemental makeup of a white dwarf’s surface as it cools. In this scenario, stronger magnetic fields at the magnetic poles suppress convection, while weaker fields near the magnetic equator allow convection to proceed. Convection brings helium-rich material to the star’s surface, creating a helium-rich belt sandwiched between hydrogen-rich polar caps. Future modeling will explore how complex magnetic field configurations affect convection and the composition of white-dwarf surfaces, advancing our understanding of this rare class of objects.
Citation
“The Emerging Class of Double-Faced White Dwarfs,” Adam Moss et al 2025 ApJ 983 14. doi:10.3847/1538-4357/adbd3a
The post Two More Double-Faced White Dwarfs Discovered appeared first on AAS Nova.
]]>
A serendipitous discovery illuminates the kinds of objects that might bridge the gap between pulsars and long-period radio transients.
The post A Slowly Spinning Pulsar Below the Death Line appeared first on AAS Nova.
]]>Researchers recently discovered an object with regular radio pulses less frequent than those of a pulsar but more frequent than those of a long-period radio transient. What do current observations tell us about what this object might be?
Between Two Extremes
The sky at radio wavelengths is inhabited by many objects that brighten, fade, and emit pulses. The most rapidly and regularly varying radio emission comes from pulsars: rotating remnant cores of massive stars that emit beams of radio waves along their magnetic poles. As the beamed emission from a pulsar sweeps across our field of view, it creates the characteristic pulses that give pulsars their name.
Pulsars have pulse periods from milliseconds to a few seconds. Over the past few years, astronomers have discovered a small but growing number of objects with radio pulses with periods of minutes to hours. Though these long-period radio transients (LPRTs) share some properties with pulsars, it’s not yet clear what powers them. One path to uncovering their identity is discovering objects in the period gap between them and pulsars — a region typically missed in searches for pulsars or LPRTs.
Serendipitous Discovery
In a recent publication, Yuanming Wang (王远明; Swinburne University of Technology and ARC Centre of Excellence for Gravitational Wave Discovery) and collaborators reported their discovery of an object that lies within this gap, PSR J0311+1402.
The discovery was serendipitous, with three of the object’s pulses appearing in two minutes of test observations made with the Australian Square Kilometre Array Pathfinder (ASKAP)’s newly installed Commensal Realtime ASKAP Fast Transient Coherent (CRACO) system. CRACO is sensitive to pulse periods within the gap between pulsars and LPRTs.

Light curve of PSR J0311+1402 from MeerKAT observations. Click to enlarge. [Wang et al. 2025]
Pulsar or Long-Period Radio Transient?
Could PSR J0311+1402 be a pulsar with an unusually long spin period? The shape of PSR J0311+1402’s pulses and the spectral index (related to how the pulses vary as a function of frequency) resemble those of typical pulsars. However, the spin-down rate of this object, measured from the minuscule change in pulse period over time, potentially places PSR J0311+1402 below the “death line.” Objects below the death line are theorized to be unable to produce radio emission through electron–positron pair production.

Change in spin period over time versus spin period for various pulsars and LPRTs. PSR J0311+1402 is shown as a star outlined in red. The dotted, dashed, and solid black lines indicate the death lines for various magnetic field models. PSR J0311+1402 falls below all death lines except for the extreme case of a twisted multipole configuration. Click to enlarge. [Wang et al. 2025]
Together, these factors suggest that PSR J0311+1402 is more likely to be a slowly rotating pulsar than a short-period LPRT, though further observations to refine the calculation of its spin-down rate are needed. And where there’s one object, there are usually more, suggesting that future searches attuned to periods within the gap between pulsars and LPRTs may find more of these in-between objects and help to illuminate their properties.
Citation
“The Discovery of a 41 s Radio Pulsar PSR J0311+1402 with ASKAP,” Yuanming Wang et al 2025 ApJL 982 L53. doi:10.3847/2041-8213/adbe61
The post A Slowly Spinning Pulsar Below the Death Line appeared first on AAS Nova.
]]>
Saturn's tiny moon Enceladus was the first moon in the solar system known to spout plumes of water ice and vapor. A new study investigates the behavior of these plumes and the network of fissures from which they emerge.
The post Mapping Eruptions on Enceladus appeared first on AAS Nova.
]]>
This enhanced-color image from the Cassini orbiter shows the southern hemisphere of Enceladus and its four prominent “tiger stripes.” [NASA/JPL/Space Science Institute]
Plumes on an Icy Moon
Enceladus, the sixth-largest moon of Saturn, is encased in a shell of reflective ice thought to be several miles thick. This icy crust is marred by craters, chaotically crisscrossed terrain, and — most notably — four long, nearly parallel fissures nicknamed tiger stripes.
The Cassini orbiter spied geysers of water ice and vapor bursting through these fissures, powered by the release of tidal stresses from interactions with another of Saturn’s moons, Dione. The plumes provided the first evidence for an ocean of liquid water beneath Enceladus’s surface. There is much still to learn about the plumes, including whether they spray directly from Enceladus’s subsurface ocean or from a network of shallow pools within the icy crust.
Drawing Back the Curtain
To learn more about the behavior of Enceladus’s plumes and the association between the plumes and the fissures, Joseph Spitale (SETI Institute) and collaborators analyzed 15 epochs of plume activity spread across the years 2009–2015. Their goal was to determine which fissure each plume originated from.

A demonstration of the advantage of the curtain-based method over a method that attempts to identify the origin of individual jets. Click to enlarge. [Spitale et al. 2025]
The team had previously used the curtain method to identify the source fissures of plumes during a few time periods. In this work, they refined their method and expanded their analysis to a broader set of observations.
Fissure Findings

Map of plume activity along the fissures of the tiger stripes. This map omits small fissures that were never active. (The full map of fissures used in this study can be seen here.) The majority of locations along each fissure were active in all 15 epochs. [Adapted from Spitale et al. 2025]
Previously, researchers have noted that the plumes on Enceladus vary in intensity by approximately a factor of three. With the finding that only the ends of the fissures ever truly become inactive, it’s unlikely that the change in intensity is due to fissures turning on and off as Enceladus encounters varying levels of tidal stress. Instead, it’s likely that most locations along the fissures are always active, regardless of tidal stress, with tidal stresses controlling the overall intensity of the eruption and the on-off behavior of just the tips of the fissures.
The distribution of fissure activity may hint that the plumes emerge directly from the subsurface ocean. In order for pools within the ice shell to be the source of the plumes, the locations of the pools must vary in a particular way with the thickness of the ice shell, or there must be a single plume-supplying chamber spanning the entire area of the tiger stripes — a configuration seemingly unable to withstand the immense weight of the ice crust.
Citation
“Curtain-Based Maps of Eruptive Activity in Enceladus’s South-Polar Terrain at 15 Cassini Epochs,” Joseph N. Spitale et al 2025 Planet. Sci. J. 6 67. doi:10.3847/PSJ/adb7d7
The post Mapping Eruptions on Enceladus appeared first on AAS Nova.
]]>
Astrobites reports on how standard candles might not be quite as standard as previously thought, and how a particular type of supernova is making a name for itself.
The post Shedding Light on Candles That Burn a Bit Too Bright appeared first on AAS Nova.
]]>Editor’s Note: Astrobites is a graduate-student-run organization that digests astrophysical literature for undergraduate students. As part of the partnership between the AAS and astrobites, we occasionally repost astrobites content here at AAS Nova. We hope you enjoy this post from astrobites; the original can be viewed at astrobites.org.
Title: 1991T-Like Type Ia Supernovae as an Extension of the Normal Population
Authors: John T. O’Brien et al.
First Author’s Institution: Michigan State University
Status: Published in ApJ
Famously, Type Ia supernovae have been used to measure the local Hubble constant, or the rate at which our universe expands. These objects earned the nickname “standard candles” since their near-constant intrinsic luminosities allow us to measure distances in space. Slowly but surely, however, we’ve learned that some of our standard candles aren’t that “standard” after all…
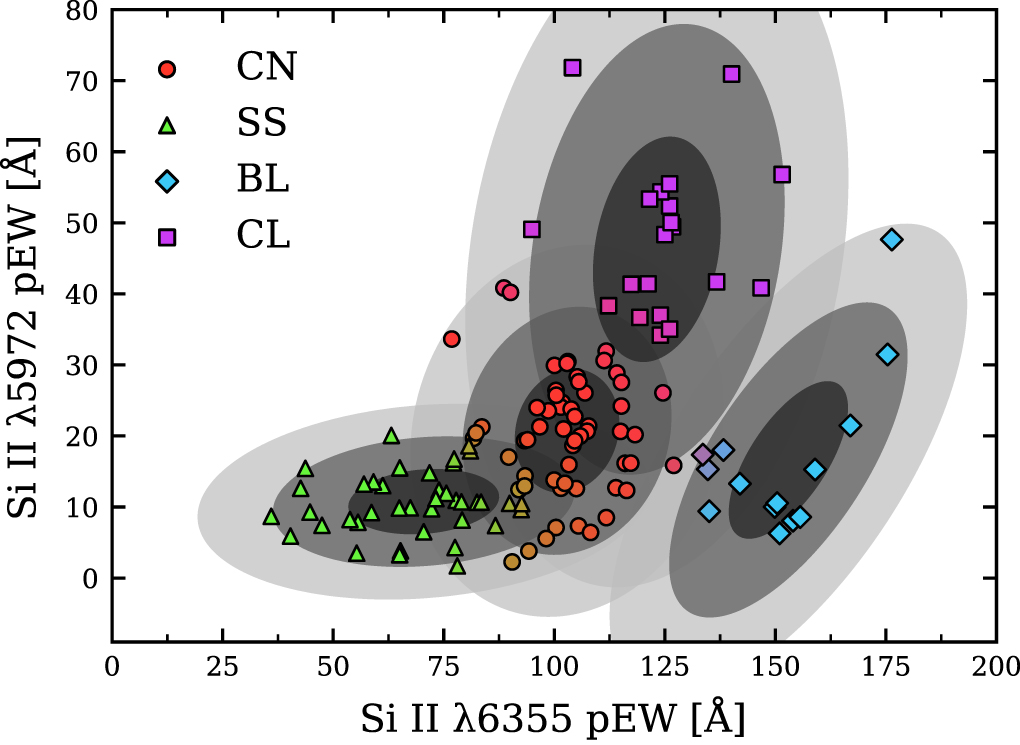
Figure 1: Example of a “Branch classification” diagram for Type Ia supernovae. This figure compares the width of two silicon lines in Type Ia supernovae. Four groups are shown: shallow silicons (SS), broad lines (BL), cools (CL), and core normals (CN). Event SN 1991T is a member of the shallow silicons group (green triangles), indicating that the widths of the minor and major silicon lines are smaller than normal Type Ia supernovae (core normals). Click to enlarge. [Burrow et al. 2020]
The supernova SN 1991T was the first observed event of its kind. What was so special about it? This event was considered over-luminous, or more luminous than the typical “near-intrinsic luminosity” of the average Type Ia supernova. Later, as observations improved, more events like SN 1991T were detected, contributing to the growing class of aptly named “1991T-like” events. The spectra of these events have shallow silicon lines compared to the normal range of Type Ia supernovae. The peculiarity of these absorption lines hints at something unique about these events, and the answer lies in studying the ejecta, or the ejected material in which chemical elements are produced. This article is a step toward understanding what differentiates these events from the norm and what we can infer about their origins.
Outside of this work, recent hydrodynamic simulations of various progenitor models, or stellar origins, have successfully recreated some of the observable signatures of Type Ia supernovae, including synthetic, or computed, optical spectra of theoretical events. Except, as previously mentioned, the observable signatures of Type Ia supernovae can vary quite a bit amongst all these subtypes and classifications! Instead of hydrodynamic simulations, the authors of this article chose to reconstruct the supernova ejecta using Bayesian inference and active learning conducted on early-time (within a few days after explosion) optical spectra of already observed normal and 1991T-like events. This is the time when 1991T-like events show their features! After training the model on this data, the authors developed a model to link the optical spectra and the ejecta properties corresponding to normal and 1991T-like events.
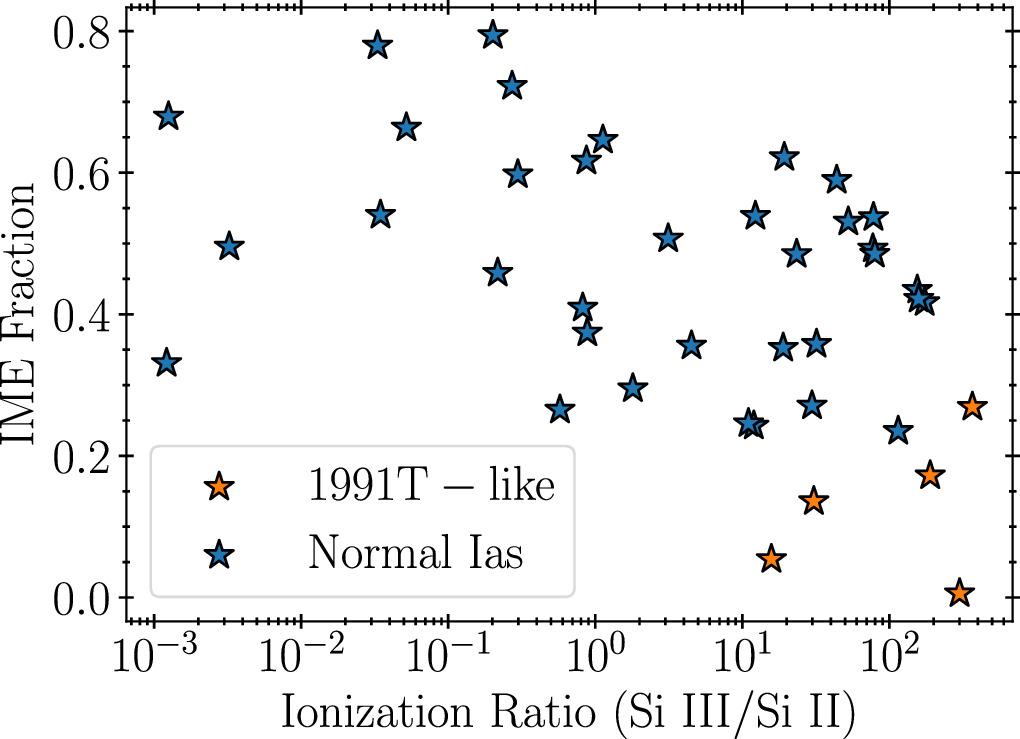
Figure 2: A plot showing the fraction of intermediate-mass elements (IME) as a function of the ionization ratio of the authors’ simulations. Moving to the right on the bottom axis indicates higher ionization states, whereas moving up on the left axis indicates more intermediate-mass elements for a given total ejecta mass. The break between blue stars (normal Type Ia supernovae) and orange stars (1991T-like supernovae) is called the “turnover.” Because the turnover is fairly smooth, it suggests that the progenitor, or stellar origin, of 1991T-like events might be similar to normal events. Click to enlarge. [O’Brien et al. 2024]
The question now becomes: what can we learn about 1991T-like origins from this? Can a single progenitor model lead to different pathways? Or do we need different progenitor models to explain these differences in spectroscopic features? The authors believe fewer intermediate-mass elements and higher ionization states hint at normal and 1991T-like events sharing similar progenitor systems. In other words, 1991T-like events might just be an extension, or extreme, of the normal population. Perhaps the candle just burned a bit too bright!
Aside from this work, in addition to these over-luminous 1991T-like events, there also exists another interesting class of Type Ia supernovae dubbed “super-luminous,” which are roughly one, maybe two, magnitudes brighter than normal Type Ia supernovae. (Only in astronomy could the words over-luminous and super-luminous mean different things, right?) Because of this, researchers advocate for Type Ia supernovae to be called “standardizable” candles instead because, as you now know, their intrinsic luminosities really aren’t that uniform after all.
Original astrobite edited by Ansh Gupta and Dee Dunne.
About the author, Mckenzie Ferrari:
I’m a grad student at the University of Chicago. Most of my research focuses on simulations of Type Ia supernovae and galaxy formation and evolution.
The post Shedding Light on Candles That Burn a Bit Too Bright appeared first on AAS Nova.
]]>
Researchers investigate the cause of bright, sinuous swirls that are associated with magnetic fields embedded within the Moon's surface.
The post Featured Image: Lunar Swirls appeared first on AAS Nova.
]]>Lunar swirls are bright, curved regions on the Moon’s surface. Though lunar swirls are known to be associated with areas where the magnetic field suffusing the Moon’s crust is unusually strong, it’s not clear exactly what causes lunar swirls. Does the stronger magnetic field protect the lunar surface from bombardment by the incessant solar wind? Have fine-grained, reflective lunar soils accumulated in these regions? Or do the swirls perhaps reflect the aftermath of an encounter with a comet that swept certain areas of the Moon’s surface clean, then snowed fine particles across the surface? To uncover the origins of lunar swirls, a team led by Mallory Kinczyk (The Johns Hopkins University Applied Physics Laboratory) investigated the three swirl areas shown above. Each region represents a different type of surface material and geography, including lunar seas and highlands. The team carried out a detailed photometric analysis and modeling of data from the Lunar Reconnaissance Orbiter Camera Narrow Angle Camera to determine the properties of the lunar soils and investigate existing hypotheses for swirl formation. Overall, the team’s results support the hypothesis that the anomalously strong magnetic fields embedded within the Moon’s crust shield the surface from solar wind impacts, creating the sinuous swirls seen today.
Citation
“Photometry of Lunar Swirls in Comparison to Fresh Crater Ejecta,” Mallory J. Kinczyk et al 2025 Planet. Sci. J. 6 57. doi:10.3847/PSJ/adafa6
The post Featured Image: Lunar Swirls appeared first on AAS Nova.
]]>
How do interactions binary black holes experience in dense star clusters impact the gravitational waves we detect on Earth? Recent simulations show that stellar collisions leave imprints on the masses and spins of these black holes.
The post Spinning Up: Impacts of Stellar Collisions on Binary Black Hole Mergers appeared first on AAS Nova.
]]>Gravitational waves from merging black holes encode the mass and spin of the original black holes in the system. These properties can be heavily influenced by the interactions the black hole binary experiences prior to merging, especially when these systems are within dense star clusters. A recent study explores how black hole binaries are impacted by stellar collisions in cluster environments and what that may mean for the gravitational waves we detect here on Earth.
Gravitational Waves from Black Hole Binaries

Animation of a black hole binary merger. As the black holes merge, they create gravitational waves, warping the fabric of spacetime. Click to enlarge. [LIGO/T. Pyle]
Multiple formation mechanisms have been proposed that are sensitive to the characteristics of the black holes in the binary. Importantly, the spin (rotation) of the black holes can be used to distinguish how the system likely formed. From theory, stellar-mass black holes likely form with little spin but will spin up as they interact with stars and other black holes throughout their lifetimes. Interactions causing spin-up are more likely to happen in crowded areas like star clusters, so understanding how binary black holes form and evolve within these dense environments will enable comparison to LVK observations.
Simulations of Clusters
To explore how collisions and close encounters with stars influence black hole properties within dense star clusters, Fulya Kıroǧlu (CIERA; Northwestern University) and collaborators performed eight simulations across a range of cluster models. Varying characteristics such as metallicity, cluster radius, and binary fraction for massive stars, the authors explore how the black holes in each cluster evolve over 12 billion years.
Through these simulations, the authors track the number of black hole–star collisions and find that, depending on the cluster properties, black holes and stars undergo collisions at early and late times in the cluster’s life. For stellar clusters with high-density cores and more massive star binaries, black holes are more likely to collide with high-mass stars, increasing the rate at which spinning black holes are formed. Additionally, the metallicity of the star cluster can significantly impact how many black hole–star interactions occur. For merging black hole binaries in star clusters, especially those with high metallicity, over 50% had at least one black hole that had spun up after a previous collision with a star. These results build an expected distribution of binary black hole merger spins that can be compared to gravitational wave detections.

Effective spin versus primary black hole mass distribution. The results from the simulations in this study are shown in purple and cyan. The background points show the predicted distribution based on LVK observations. Click to enlarge. [Kıroǧlu et al 2025]
Comparing to Observations
What do the simulation results mean when it comes to LVK observations? The authors compare the distribution of binary black hole spin and mass for all mergers in their models to the predicted distribution based on LVK observations. Their modeling reproduces the predicted trends from gravitational-wave data, and recent observations suggest a population of binary black hole mergers with high spins consistent with this work.
As LVK continues to detect gravitational waves, further simulations with more detailed hydrodynamic models will be necessary in order to uncover the full range of possible outcomes of binary black hole–star interactions. This work serves as a critical step in revealing the origins of gravitational waves.
Citation
“Black Hole Accretion and Spin-up through Stellar Collisions in Dense Star Clusters,” Fulya Kıroǧlu et al 2025 ApJ 979 237. doi:10.3847/1538-4357/ada26b
The post Spinning Up: Impacts of Stellar Collisions on Binary Black Hole Mergers appeared first on AAS Nova.
]]>
Astrobites reports on how we can use simulations of stellar populations to rapidly estimate the identity of the lensing object in a microlensing event.
The post Rapid Microlensing Classification: A Lonely SOBH Story appeared first on AAS Nova.
]]>Editor’s Note: Astrobites is a graduate-student-run organization that digests astrophysical literature for undergraduate students. As part of the partnership between the AAS and astrobites, we occasionally repost astrobites content here at AAS Nova. We hope you enjoy this post from astrobites; the original can be viewed at astrobites.org.
Title: On Finding Black Holes in Photometric Microlensing Surveys
Authors: Zofia Kaczmarek et al.
First Author’s Institution: Lawrence Livermore National Laboratory; Heidelberg University
Status: Published in ApJ
Searching for stellar-mass black holes is no simple task — how do you look for an object floating in the vastness of space, hundreds or thousands of light-years away, that is at best the size of Houston, Texas, and emits no light? As our surveys of the night sky become more and more regular and increase in resolution, there is hope that we will be able to observe more and more chance alignments of these objects with stars, generating an observable effect known as microlensing. This mechanism provides us with a way to pick a proverbial black hole needle from the galactic stellar haystack, but the data we get from these surveys are still difficult to process efficiently. Today’s article introduces a new method for rapidly assessing the chances that a given microlensing event is indeed caused by a wandering black hole, allowing astronomers to make more effective decisions about which events to follow up on with targeted observation campaigns.
A Microlensing SOBH Story
While astrophysical black holes were once squarely in the realm of speculative science fiction, it is now commonplace to find these extreme objects through a variety of techniques. One such technique involves observing a star that is moving around in a binary system, making its motion regular and predictable. Astronomers can use this regular motion to deduce the mass of the star’s partner — and if there’s no visible signal associated with the companion, it may turn out to be a black hole.
Another more recent technique that has proven successful in finding these exotic objects involves listening for the gravitational waves produced when a black hole merges with another compact object like a black hole, neutron star, or white dwarf. From these observations, astronomers can learn about the overall population of black holes in our universe, and by proxy can learn about the last stages of stellar evolution. But relying on these measurements alone would generate a biased picture of stellar evolution, because they only pick out black holes that formed in (or evolved into) binary systems. This leaves us without much information about the non-negligible fraction of stars (and therefore black holes) that prefer the “single life.”
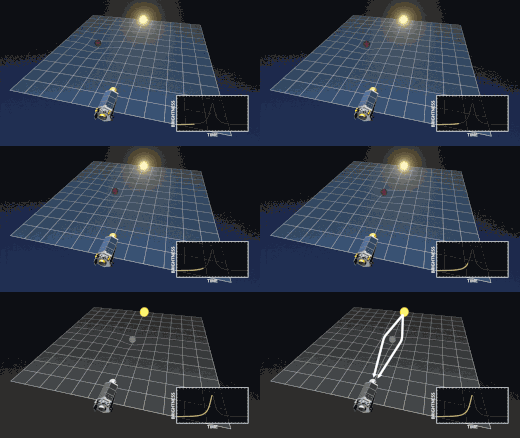
Figure 1: Cartoon depiction of the process of gravitational microlensing. A foreground object intersecting our line of sight to a bright background object can cause optical distortions like brightening and doubled images. [NASA Ames/JPL-Caltech/T. Pyle]
One Quick Classification Trick
For the most part, microlensing events are found by looking for subtle changes in the light coming from a star — this observation is a photometric measurement of the microlensing event. Photometric data for a microlensing event are generally able to provide at least some constraints on two important microlensing parameters: the Einstein timescale 𝑡𝐸 (related to how long the foreground object lenses the background as it passes by) and the microlensing parallax 𝜋𝐸, which results from Earth’s acceleration towards or away from a particular lensing event. Unfortunately, from these variables alone it can be hard to confidently determine the nature of the lensing object, motivating attempts to make higher-resolution follow-up observations of these events. Telescopes with strong spatial resolution can sometimes pick up on the way the lensing object subtly distorts the apparent position of the background star. These so-called astrometric observations can help pin down important information such as the size and/or mass of the lensing object, letting astronomers confirm the presence of a SOBH or another object of interest.
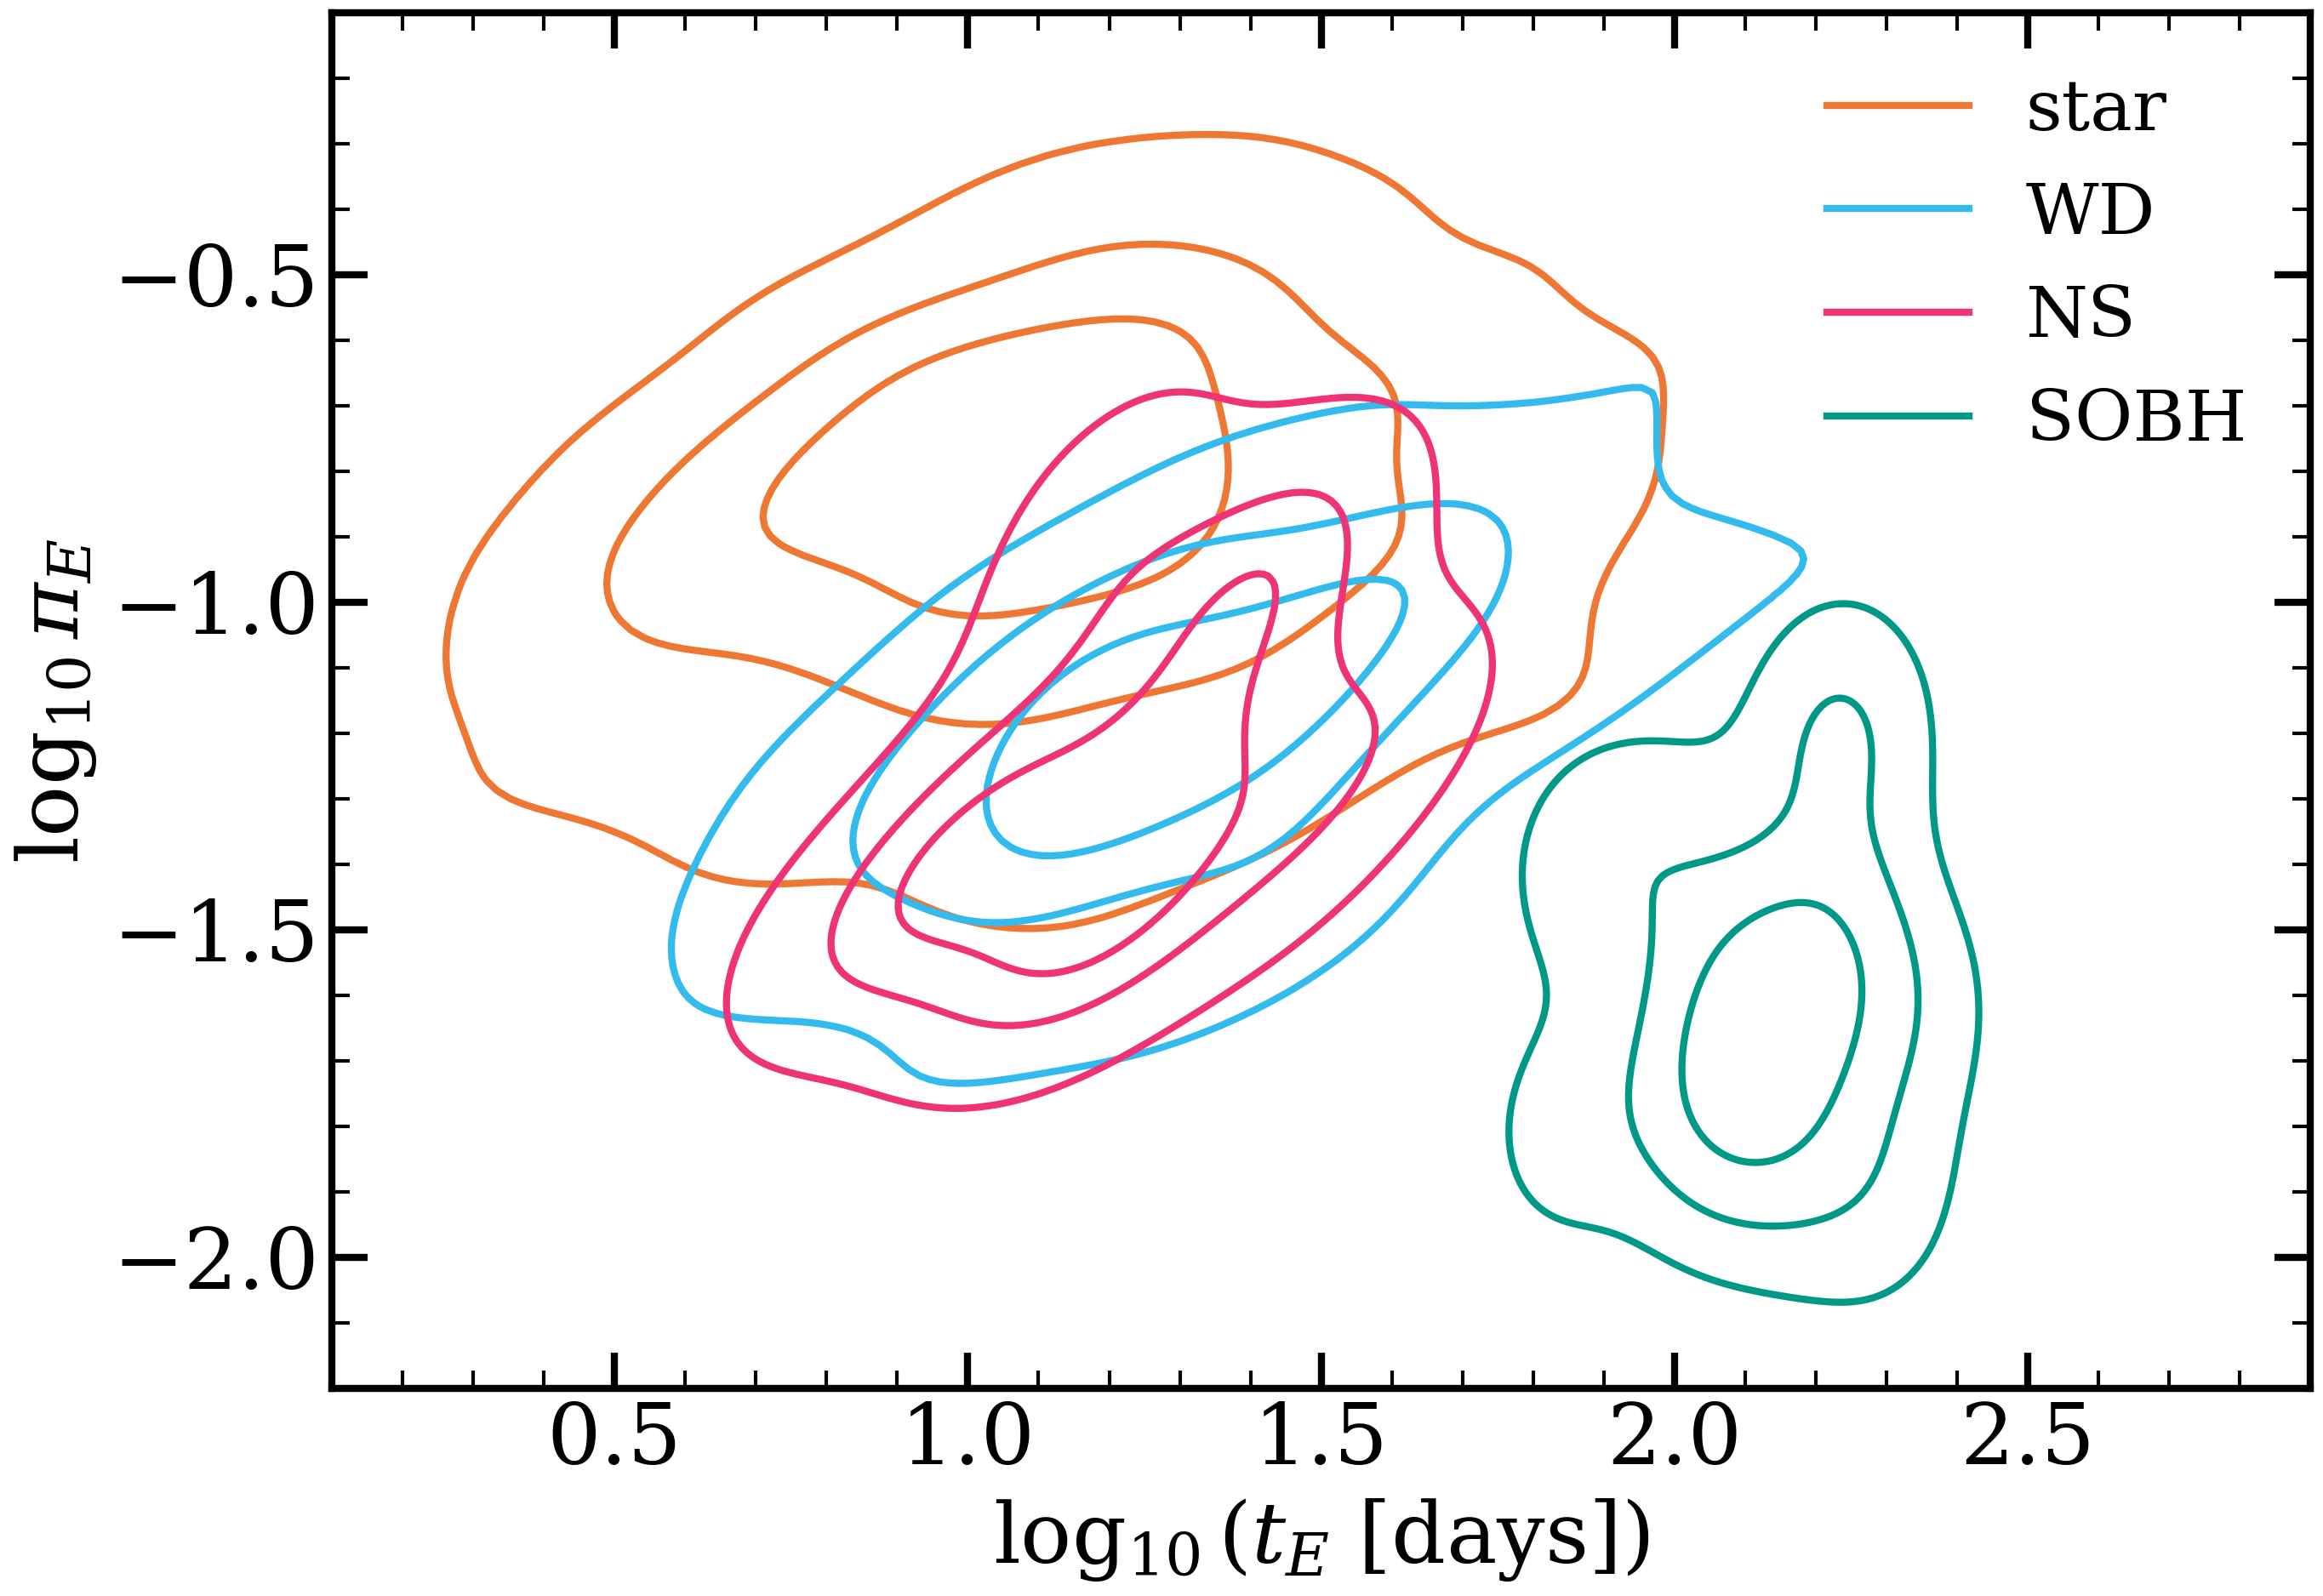
Figure 2: This plot from today’s article shows the distribution of two microlensing parameters produced by various lensing sources. The separation of SOBHs in this parameter space indicates that measurement of these parameters in photometric data may allow for the rapid identification of microlensing events caused by SOBHs. [Kaczmarek et al. 2025]
After introducing their classification pipeline, the authors applied it to an existing microlensing dataset from the OGLE collaboration. This dataset contained nearly 10,000 events, from which the classification pipeline returned 23 high-probability SOBH candidates that were agreed upon across all three models of star-to-black-hole evolution (“initial–final mass relations”) the authors used. Applying further selection rules to find candidate events that could potentially be observed by the Gaia telescope, the list was whittled down to just four events. Unfortunately, all four of these remaining candidates were found to be unlikely to produce significant astrometric deviations, meaning we will likely have to wait for larger microlensing surveys coming up in the near future for a solid chance of finding a new SOBH candidate with this method.

Figure 3: This plot from today’s article depicts the estimated 𝑡𝐸 and 𝜋𝐸 parameters for the only confirmed SOBH microlensing event compared against the regions of parameter space expected to correspond to white dwarfs (blue) and SOBHs (green). The minimal overlap with the green region indicates that this event may have been an outlier compared to galactic stellar population models. [Kaczmarek et al. 2025]
OB110462: A Chance Encounter?
Using a stellar-population-model-informed classification method like the one presented in this article may also allow us to directly examine weaknesses in these models. For example, if in the future we find many microlensing events that are later confirmed to be SOBHs but exist outside of the expected SOBH region of 𝑡𝐸–𝜋𝐸 parameter space, it could point us towards a flaw in the underlying population models. As of the publication of this article, however, we only have one confirmed SOBH microlensing event to compare to (denoted OB110462). Working with a sample size of one is pretty uninformative (to say the least), but the authors do note that this event is already somewhat of an outlier given their population model. In Figure 3, you can see the recovered 𝑡𝐸 and 𝜋𝐸 probability contour for OB110462 only barely overlaps with the region corresponding to SOBHs, and the contours fit more snugly in the region corresponding to white dwarfs. This tension is interesting, because even if it doesn’t point to a problem with the stellar population models, it could indicate that the successful confirmation of this event as a SOBH was an unlikely success, and so choosing to dedicate time on Hubble to do follow-up measurements was, in retrospect, a high-risk move that paid off.
Regardless of how things turned out with OB110462, this sort of analysis points to a more general benefit this classification scheme provides: it allows for a very rapid estimation of which microlensing events we should focus our attention on with follow-up observations. The authors propose that this makes their method ideally suited as an initial filter through which microlensing events can pass before more complicated analyses are performed. As surveys like the Vera C. Rubin Observatory Legacy Survey of Space and Time begin to take unfathomably huge amounts of time-domain data, the number of detected microlensing events is going to sharply increase, making it more important than ever that we think carefully about which events are worth following up on.
Original astrobite edited by Lindsey Gordon.
About the author, Lucas Brown:
I’m a graduate student at the University of California, Santa Cruz. My research involves figuring out how to use exotic phenomena like gravitational waves to learn about elusive astrophysical objects like primordial black holes or dark matter. Outside of physics I love playing piano, climbing, and spending time with my dog.
The post Rapid Microlensing Classification: A Lonely SOBH Story appeared first on AAS Nova.
]]>
Though the odds of asteroid 2024 YR4 striking Earth in 2032 have fallen to almost zero, the asteroid still has a slim chance of a collision with the Moon. New JWST observations tell us more about this potential impactor.
The post An Update on Asteroid 2024 YR4 from JWST appeared first on AAS Nova.
]]>The chances of the asteroid 2024 YR4 striking Earth in 2032 have tumbled from a peak of 3.1% in February 2025 to nearly zero today, though a collision with the Moon is still possible. Brand new JWST observations give a fresh perspective on this near-Earth asteroid.
From Discovery to Today
Discovery images of 2024 YR4. [ATLAS]
A New Look at 2024 YR4
As reported today in Research Notes of the AAS, a team led by Andrew Rivkin (The Johns Hopkins University Applied Physics Laboratory) used JWST to observe 2024 YR4 in March 2025. Using the Mid-Infrared Instrument (MIRI) and the Near-Infrared Camera (NIRCam), the team determined the size, albedo, and spectral energy distribution of the asteroid.
By modeling the asteroid’s thermal emission, Rivkin’s team estimated 2024 YR4’s diameter to be 60 ± 7 meters (197 ± 23 feet). This is consistent with previous size estimates that used measurements of the asteroid’s apparent magnitude and estimates of its albedo, or the fraction of light that is reflected from its surface. As a comparison, the asteroid that caused the Tunguska event — an air burst that toppled millions of trees, shattered windows, and sparked forest fires — is thought to have been in the range of 40–100 meters (130–328 feet).
Further Findings and Future Directions
The asteroid’s albedo is between 0.08 and 0.18, with a best-fit value of 0.13. Many classes of asteroids have albedos in this range, so this estimate doesn’t place 2024 YR4 in any particular class. However, Rivkin’s team noted that these values are compatible with previous spectra of the asteroid that suggest an S-type (stony) classification.
The team also estimated the potential impact of a 2024 YR4-like asteroid, finding that a collision with Earth would release the energy equivalent of 2–30 megatons of TNT, with a blast damage radius of up to 80 kilometers (50 miles).
Future modeling using sophisticated thermophysical models will help to define the asteroid’s properties further. And in early 2026, researchers may have another chance to observe 2024 YR4 with JWST and refine their understanding of a potential lunar impact in 2032.
Citation
“JWST Observations of Potentially Hazardous Asteroid 2024 YR4,” A. S. Rivkin et al 2025 Res. Notes AAS 9 70. doi:10.3847/2515-5172/adc6f0
The post An Update on Asteroid 2024 YR4 from JWST appeared first on AAS Nova.
]]>
An ultra-high-energy neutrino, a galactic PeVatron, and a fading quasar at cosmic dawn are the subjects of today's Monthly Roundup.
The post Monthly Roundup: News from the High-Energy Universe appeared first on AAS Nova.
]]>This Monthly Roundup covers three investigations of the high-energy universe, from a hunt for a cosmic particle accelerator in the Milky Way to an examination of a fading quasar in the distant past.
Investigating the Most Energetic Neutrino Ever Detected
In February 2023, the Cubic Kilometre Neutrino Telescope (KM3NeT) — a neutrino telescope at the bottom of the Mediterranean Sea — detected a particle called a muon with an energy of roughly 100 petaelectronvolts (a hundred quadrillion electronvolts). The muon was likely produced by an incoming neutrino with an energy of 220 petaelectronvolts — the highest-energy neutrino ever observed.
The orientation of the event suggests an astrophysical origin, but the source of this neutrino is unknown. One possibility is that the neutrino arose in a transient event that produced extremely high-energy cosmic rays: relativistic charged particles like protons, electrons, and atomic nuclei. Cosmic rays could produce neutrinos and gamma rays through interactions with photons of the cosmic microwave background. The neutrinos zip off into space, unhindered by intervening gas or magnetic fields, while the cosmic rays can be waylaid for thousands of years, caught up in the magnetic fields that lace the space between galaxies. Gamma rays fall in between the two extremes, slowed slightly by interactions with the photons of the extragalactic background. Repeated interactions between the gamma rays and background photons create a cascade of gamma rays across a range of energies.

Gamma-ray flux as a function of time since the neutrino’s arrival for different intergalactic magnetic field strengths. Stronger magnetic fields lead to lower flux and later arrival times. The gray lines show the five-sigma detection limits of different instruments. Click to enlarge. [Fang et al. 2025]
For weak magnetic fields, the gamma-ray cascade should have arrived at Earth hours or days after the neutrino was detected in 2023. These gamma rays are potentially detectable as long as the magnetic field is weaker than 3 × 10-13 Gauss. For magnetic field strengths greater than 3 × 10-13 Gauss, the gamma rays wouldn’t arrive until more than a decade later, and they would likely be too faint to detect. If no gamma rays are detected, the non-detection could be used to place a lower limit on the strength of the intergalactic magnetic field.
The Hunt for a Galactic PeVatron
Across the universe, charged particles are being accelerated to near the speed of light, achieving energies in the petaelectronvolt, or PeV, range. The sources of these particles are called PeVatrons, and observations have revealed that these cosmic particle accelerators exist in the Milky Way. Supernovae, massive stars, pulsars, and pulsar wind nebulae are all candidate PeVatrons. To find out more, astronomers look to gamma rays, which can be produced when cosmic rays interact with dense matter.
Recently, the Large High Altitude Air Shower Observatory (LHAASO) collaboration investigated a possible galactic PeVatron called G35.6−0.4. G35.6−0.4 is a radio source that is thought to be associated with the gamma-ray source HESS J1858+020. Observations of this region show a supernova remnant and an H II region containing multiple X-ray point sources.

LHAASO’s Water Cherenkov Detector Array (left) and Kilometer Square Array (right) observations of the region around the gamma-ray source HESS J1858+020. Black solid circles and black crosses represent extended and pointlike sources, respectively, resolved in this work. Dashed circles show sources resolved by LHAASO in previous work. The cyan symbols show the locations of gamma-ray sources identified by other facilities. Click to enlarge. [LHAASO Collaboration 2025]
Because of the crowded nature of this area, this investigation wasn’t able to clearly point to the source of the gamma rays. The authors outlined three possible sources for the gamma rays: 1) winds from hidden massive stars or outflows from protostars within the H II region, 2) particles escaping from the supernova remnant and interacting with nearby molecular clouds, and 3) an as-yet-undetected pulsar wind nebula. While none of these scenarios is a clear front-runner, neither could any of them be ruled out (though the supernova remnant scenario faces the greatest feasibility challenges). Future searches for massive stars or pulsar wind nebulae in this region may provide further clues.
Fading Light from a Quasar at Cosmic Dawn
For the third and final article, we’re looking back into the distant past at one of the most powerful objects in the universe: a quasar. Quasars are extraordinarily luminous galactic centers in the early universe, powered by accretion of gas onto a growing black hole. Because of their extreme brightness, quasars are visible from billions of light-years away, giving researchers a glimpse into the early evolution of supermassive black holes.
Jianwei Lyu (吕建伟; University of Arizona) and collaborators investigated HSC J2239+0207, a quasar located at a redshift of z = 6.2498, when the universe was roughly 900 million years old. This redshift places the quasar near the end of the epoch of reionization, when the formation of the first stars and galaxies ionized the universe’s abundant neutral hydrogen gas. This quasar is an intriguing target because previous observations have shown that the black hole that powers it is roughly 15 times more massive than expected for the stellar mass of its host galaxy. The quasar’s accretion rate is low, indicating that the black hole may be nearing the end of its growth spurt.

JWST spectrum of the quasar HSC J2239+0207 (blue line). Click to enlarge. [Lyu et al. 2025]
The team also investigated a gas cloud located one arcsecond from the quasar. This object could be several things: an isolated high-redshift galaxy, a galaxy falling toward the quasar host galaxy, tidally disrupted material stripped from a galaxy passing nearby, or material blown out of the quasar host galaxy by the quasar itself. The authors favor this final scenario, which is indicative of black hole feedback at work.
Feedback may be the reason that this black hole is so massive compared to the stellar mass of its host galaxy. Powerful radiation and winds from the black hole could have suppressed the rate of star formation as the black hole grew. With the black hole’s activity winding down, star formation should have a chance to ramp up, bringing the galaxy into alignment with the expected stellar mass–black hole mass relation.
Citation
“Cascaded Gamma-Ray Emission Associated with the KM3NeT Ultrahigh-Energy Event KM3-230213A,” Ke Fang et al 2025 ApJL 982 L16. doi:10.3847/2041-8213/adbbec
“An Enigmatic PeVatron in an Area Around H II Region G35.6−0.5,” Zhen Cao et al 2025 ApJ 979 70. doi:10.3847/1538-4357/ad991d
“Fading Light, Fierce Winds: JWST Snapshot of a Sub-Eddington Quasar at Cosmic Dawn,” Jianwei Lyu et al 2025 ApJL 981 L20. doi:10.3847/2041-8213/adb613
The post Monthly Roundup: News from the High-Energy Universe appeared first on AAS Nova.
]]>
Could there have been two massive black holes in our galaxy's center at one time? New modeling of fast-moving stars in the Milky Way's halo suggests the answer is yes.
The post Our Galaxy’s Supermassive Black Hole May Have Had a Companion in the Past appeared first on AAS Nova.
]]>Could there have been two massive black holes in our galaxy’s center at one time? New research suggests that this scenario could explain oddities in the population of hypervelocity stars in the Milky Way’s halo.
From the Center to the Halo

A near-infrared image from the Very Large Telescope of stars at the center of the Milky Way. [ESO/S. Gillessen et al.; CC BY 4.0]
Surveys of the Milky Way halo have indeed found massive hypervelocity stars that hastily departed the galactic center some 50–250 million years ago, cementing the idea that interactions between stellar binaries and Sgr A* can send stars careening through the galaxy.
There are two odd things about the observed population of hypervelocity stars, though: 1) their velocities top out around 700 km/s, though theory suggests roughly half of these stars should move faster than this cutoff; and 2) none of the stars remaining in orbit around Sgr A* appear to be the left-behind binary companions of these hypervelocity stars.
A Long Time Ago in a Galaxy Very, Very Close By
A second black hole in the Milky Way’s center, present long ago, may explain these oddities. In a research article published this week, Chunyang Cao (Peking University) and collaborators outlined how the existing population of hypervelocity stars could be produced with the help of an intermediate-mass black hole that entered our galaxy billions of years ago and has since merged with Sgr A*.
Cao’s team outlined how Sgr A* could gain an intermediate-mass black hole companion when our galaxy captures and incorporates a dwarf galaxy — something that is thought to have happened multiple times in the Milky Way’s history. Orbiting with Sgr A* in a binary system, the intermediate-mass black hole acts as a goalkeeper, gravitationally kicking away stars that approach the galactic center. The presence of the intermediate-mass black hole prevents most binary systems from being disrupted very close to Sgr A*, where they would score the largest gravitational boost and achieve the highest velocities.

Predicted (green and blue shaded areas) and observed (gray and black lines) velocity and galactocentric radius distributions of hypervelocity stars in the Milky Way. The two observation lines show the results from the Multiple Mirror Telescope (MMT) hypervelocity star survey and the MMT survey plus proper-motion corrections from the Gaia spacecraft. The pink and purple lines show the predictions of models that do not incorporate an intermediate-mass black hole. Click to enlarge. [Cao et al. 2025]
A Model Population
Cao’s team modeled the population of hypervelocity stars that would result from this scenario and found that the velocity and radius distributions of their model population closely matched what is observed. Crucially, the model predicts that just 2.5% of hypervelocity stars should have velocities greater than 700 km/s and can accurately reproduce the population of stars that remain in the galactic center. The model also predicts that 10% of ejected stars should be intact binary systems rather than lone binary members, which is consistent with observations.
The authors posited that the most likely source of an intermediate-mass black hole in the right time frame for this scenario to play out would be the merger with the Gaia–Sausage–Enceladus dwarf galaxy about 10 billion years ago. Modeling suggests that this dwarf galaxy’s black hole was roughly 300 times less massive than the Milky Way’s central black hole, and the two black holes likely merged 10 million years ago.
Though the intermediate-mass black hole may be long gone, its influence may still be felt: the merger of the two black holes would have caused Sgr A* to recoil, potentially accounting for the motion of Sgr A* seen today.
Citation
“A Recent Supermassive Black Hole Binary in the Galactic Center Unveiled by Hypervelocity Stars,” Chunyang Cao et al 2025 ApJL 982 L37. doi:10.3847/2041-8213/adbbf2
The post Our Galaxy’s Supermassive Black Hole May Have Had a Companion in the Past appeared first on AAS Nova.
]]>
Recent simulations tackle the question of how dense star clusters like those spotted by JWST formed in the early universe.
The post Crafting Compact Clusters in the Early Universe appeared first on AAS Nova.
]]>JWST observations of distant galaxies have revealed incredibly dense and bright clusters of stars in the early universe. New simulations show how these clusters may have formed through galactic disk fragmentation.
From the Early Universe to the Present Day
While JWST observations were expected to shed light on the earliest stages of galaxy evolution, certain discoveries raised more questions than answers. How structures like galactic disks, supermassive black holes, and massive star clusters developed so rapidly is an open question.

The gas density (left) and stellar density (right) for the main galaxy, labeled “0,” and its two galactic companions. Click to enlarge. [Adapted from Mayer et al. 2025]
In the wake of the galaxy collision, the resulting galaxy forms a dense, gas-rich disk. Because of the high density of this gas disk, fragmentation of the disk into massive star clusters occurs quickly, on timescales of a million years. In less extreme environments, the rate of star formation is moderated by feedback — for example, from supernova explosions that inject energy and momentum into star-forming clouds, heating and disrupting the clouds and slowing the rate of star formation. Here, however, fragmentation happens too fast for supernova feedback to stop it, resulting in massive, dense clumps of gas that collapse further to form star clusters.

The gravitationally lensed Cosmic Gems arc, imaged by JWST at a redshift of z = 10.2 (about 500 million years after the Big Bang) bears considerable similarity to the smallest of the three galaxies in this simulation. [ESA/Webb, NASA & CSA, L. Bradley (STScI), A. Adamo (Stockholm University) and the Cosmic Spring collaboration; CC BY 4.0]
Cluster Assemblage
The central galaxy and its two smaller companions all formed star clusters through this method. The mass of the clusters appears to scale with the mass of the galaxy, with the largest galaxy forming the largest number of clusters and the most massive clusters. In total, roughly 20–30% of the total stellar mass of each galaxy forms through fragmentation of the disk, creating clusters with masses of 105–108 solar masses. The large fraction of galactic stellar mass belonging to massive star clusters, as well as the rapid time frame of their formation — the simulation spans just 6 million years — are both consistent with JWST’s observations of star clusters in the early universe.
These star clusters may provide a clue to another early universe mystery: the development of supermassive black holes. The extreme density of the simulated star clusters provides a natural avenue for the formation of intermediate-mass black holes with masses up to 105 solar masses. These black holes could sink to the center of the galaxy and coalesce to form a single supermassive black hole with a mass of 10 million solar masses — comparable in mass to many of the black holes seen with JWST.
Intriguingly, in the smallest galaxy explored in the team’s simulation, the black hole’s mass would be only a factor of a few less massive than the total mass of stars in the galaxy, potentially also explaining why some galaxies appear to have over-massive black holes.
Citation
“In Situ Formation of Star Clusters at z > 7 via Galactic Disk Fragmentation: Shedding Light on Ultracompact Clusters and Overmassive Black Holes Seen by JWST,” Lucio Mayer et al 2025 ApJL 981 L28. doi:10.3847/2041-8213/adadfe
The post Crafting Compact Clusters in the Early Universe appeared first on AAS Nova.
]]>
Astrobites reports on two mysterious flares detected from a radio galaxy by the brand new MACE gamma-ray telescope.
The post An aMACEing Set of Radio Galaxy Flares appeared first on AAS Nova.
]]>Editor’s Note: Astrobites is a graduate-student-run organization that digests astrophysical literature for undergraduate students. As part of the partnership between the AAS and astrobites, we occasionally repost astrobites content here at AAS Nova. We hope you enjoy this post from astrobites; the original can be viewed at astrobites.org.
Title: Very High-Energy Gamma-Ray Episodic Activity of Radio Galaxy NGC 1275 in 2022–2023 Measured with MACE
Authors: S. Godambe et al.
First Author’s Institution: Bhabha Atomic Research Centre
Status: Published in ApJL
Figure 1: The MACE telescope. [Khurana et al. 2023]
Several other IACTs exist around the world, including the High Energy Spectroscopic System, the Major Atmospheric Gamma Imaging Cherenkov telescopes, the Very Energetic Radiation Imaging Telescope Array System, and the new Large-Sized Telescope, a prototype for the next generation array of gamma-ray telescopes like the Cherenkov Telescope Array Observatory. However, MACE is the IACT at the highest altitude (4,270 meters above sea level!) and is the third largest (after the Large-Sized Telescope and one of the High Energy Spectroscopic System telescopes), with an impressive light-collecting diameter of 21 meters of segmented mirrors. This makes MACE sensitive to lower-energy gamma rays than typical IACTs since low-energy gamma rays attenuate higher in the atmosphere and are dimmer, requiring larger mirrors and higher elevation. It’s important to look at this energy range (less than a few hundred gigaelectronvolts) since it bridges the sensitivity ranges of the Fermi Large Area Telescope (Fermi-LAT), a space-based gamma-ray telescope, and other IACTs.
In MACE’s first research article, the authors discuss observations of NGC 1275, a nearby radio galaxy. In just a month of observations, they discovered two gamma-ray outbursts from the source!
Does Jet Inclination Kill the Radio Star Galaxy?
Active galactic nuclei are understood to be supermassive black holes that accrete matter from their surroundings and often shoot out large jets that are larger than the galaxies that host them. For the very high energy (energies greater than 100 GeV) gamma rays, where IACTs operate, we expect to see mainly blazars, a class of active galactic nucleus where the jet points directly at Earth, beaming particles toward us through a process called Doppler boosting and producing gamma rays and other photons as they go. This beaming gives us bright and fast flares — bursts of gamma rays — whenever material falls into the jet.
What’s weird is that we also see flares from radio galaxies that are similar in brightness and speed to the flares from blazars. Since radio galaxies (named for having large radio lobes visible at the ends of the jets) are active galactic nuclei where the jet is misaligned from Earth and doesn’t beam directly at us, we’d expect them to be dimmer than they are. Think about looking sideways at a laser versus looking right into the laser. The latter is so bright that it will probably damage your eyesight (please don’t try this at home!), but the former is much dimmer. Observing and studying gamma-ray flares from radio galaxies is fun because they’re unexpectedly bright, and these observations are crucial for understanding how the flares are being powered.
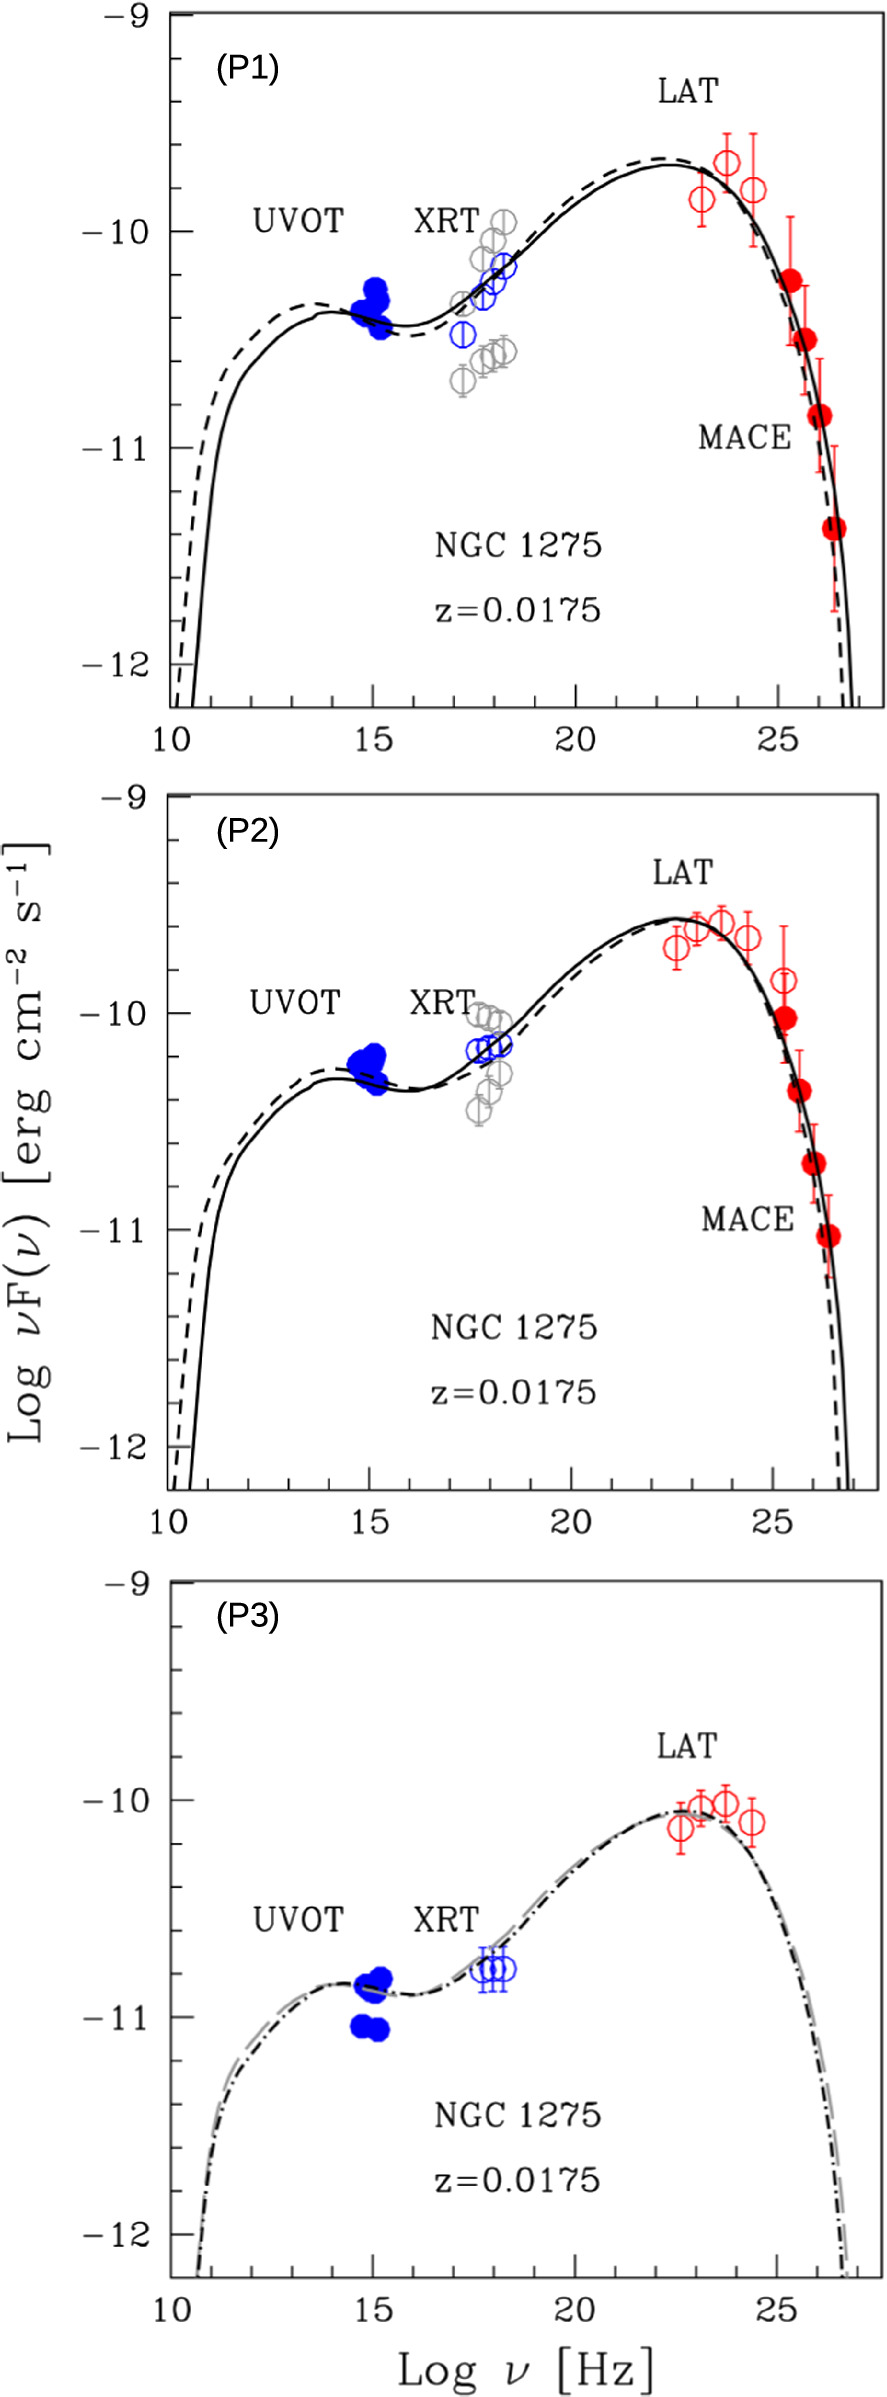
Figure 2: Spectral energy distributions composed of MACE, Fermi-LAT, and Swift Ultraviolet/Optical Telescope (ultraviolet) and X-Ray Telescope (X-ray) observations of the December flare (upper panel), January flare (middle panel), and the non-flaring period between the two flares (bottom panel). The dashed and solid lines represent the best-fit models for two different viewing angles of the jet. [Godambe et al. 2024]
New Year, New Flares
Today’s authors report on two flares from NGC 1275 that occurred in December 2022 and January 2023. Flares are unpredictable and often sporadic, so it’s impressive that two were seen within a month of each other!
Using data from Fermi-LAT and the X-ray/ultraviolet observatory Swift, they can construct a spectral energy distribution, which shows the brightness of the source across all observed energies (Figure 2). The authors fit different models to the spectral energy distribution to determine all sorts of parameters about the radio galaxy, like the size of the region that’s producing gamma rays, how tilted the jet is toward us, the maximum-energy gamma ray that can be accelerated in the jet, and more. These models are constructed by simulating the observed multi-wavelength photons from blobs of material that fall into jets of different configurations. The model that best fits the observed data should then be a good descriptor of the physical environment of the active galactic nucleus.
The authors find that the physical conditions for both flares are very similar. Consistent with other observations of NGC 1275 and other radio galaxies, they find a smaller Doppler factor and larger viewing angle (the “misalignment” of the jet with Earth’s line of sight). The “quiet” phase between flares seems to come from a reduction of either the Doppler factor — meaning that the particles in the jet aren’t being beamed as much — or an attenuation of the magnetic field strength, which makes it harder to accelerate particles to gamma-ray energies.
The authors conclude that more complicated jet processes must be happening for us to see these flares, such as different parts of the jet moving at different speeds or additional magnetic field acceleration before particles fall into the jet. The former scenario should increase the absorption of higher-energy gamma rays and make it impossible to see any gamma rays above 1 teraelectronvolt. The latter scenario requires particles to orbit large-scale magnetic fields that are the size of the active galactic nucleus’s event horizon (the radius at which light can no longer escape from the gravitational pull of the black hole), which makes it hard to see variability on timescales of less than a day.
Future observations are needed to see if higher-energy gamma-rays or faster flares are ever seen again from NGC 1275. If so, we’d need to go back to the drawing board to figure out other theories to explain how radio galaxies get so bright in gamma rays!
Original astrobite edited by Junellie Perez.
About the author, Samantha Wong:
I’m a graduate student at McGill University, where I study high energy astrophysics. This includes studying all sorts of extreme environments in the universe like active galactic nuclei, pulsars, and supernova remnants with the VERITAS gamma-ray telescope.
The post An aMACEing Set of Radio Galaxy Flares appeared first on AAS Nova.
]]>
An exploration of galaxies during our universe's star-formation heyday reveals a population of bright, compact regions called green seeds.
The post Featured Image: Green Seeds at Cosmic Noon appeared first on AAS Nova.
]]>
JWST images of the full sample of 68 hydrogen-alpha emitters that contain green seeds. [Chen et al. 2025]
Citation
“Compact [O iii] Emission-line Regions (“Green Seeds”) in Hα Emitters at Cosmic Noon from JWST Observations,” Nuo Chen et al 2025 ApJ 981 96. doi:10.3847/1538-4357/adad69
The post Featured Image: Green Seeds at Cosmic Noon appeared first on AAS Nova.
]]>
What happens when a young star captures some extra gas and dust? New observations of a dusty disk reveals how a late-stage infall event may be influencing planet formation in AB Aurigae.
The post A Late-Stage Infall Renovation: Mapping the Circumstellar Disk of AB Aurigae appeared first on AAS Nova.
]]>What happens when a newly formed star captures material from a nearby cloud? A new study provides a glimpse into how the planet-forming system AB Aurigae is under renovation.
Late Infall and Planet Formation
Gas, dust, and rocky materials swirl around recently formed stars, creating a circumstellar disk that seeds the formation of planets. Recent observations of some of these disks reveal filamentary structures of material falling into the disk, feeding the planet-forming environment with new ingredients in a process known as “late-stage infall.” According to models, this infall can significantly impact the chemical composition and dynamics within the system — shock-heating materials, forming of pressure bumps or spiral arms, and inciting gravitational instability — which complicates the picture of planet formation.
One such system is AB Aurigae, a 3.9–4.4 million-year-old young stellar object whose circumstellar disk hosts several candidate protoplanets. Observations revealing spiral arm structures that extend outside of the disk and motions suspected to be associated with gravitational instability have led researchers to believe that AB Aurigae may be experiencing late-stage infall. However, the nature of the infall and its potential consequences remain unclear.
Finding Infall in AB Aurigae

ALMA observations showing intensity maps of the gas and dust in the circumstellar disk of AB Aurigae. Each panel shows a different wavelength with the distribution of the material changing depending on what emission is being observed. Click to enlarge. [Speedie et al 2025]
Through modeling the motions within the disk, the authors successfully separate the regularly rotating disk component from an infalling “exo-disk” component that shows distinct motions consistent with material falling into the disk. The team identified three exo-disk streams, with S1 and S2 being in front of the disk moving away from us into the system, and S3 being smaller and behind the disk moving toward us into the system. S1 and S2 seem to meet the disk in a “merging zone” where their emission becomes indistinguishable from the main disk. The authors note that this merging zone aligns with where planet candidates have been identified. These findings support the idea that AB Aurigae is undergoing a late-stage infall event.

The paths of the three identified infalling streams overlaid on the dust emission intensity maps. The merging zone is shown where S1 and S2 meet the disk, which aligns with an intensity peak in the ring of dusty emission. Click to enlarge. [Speedie et al 2025]
Implications and Impacts for AB Aurigae
Where does this infalling material come from, and how will it impact AB Aurigae? Previous optical observations show a reflection nebula of dusty material nearby, and the ALMA observations of this study show a faint emission structure that appears to align with the reflection nebula. Though further kinematic analysis is required, this suggests that the infall is coming from a small cloud that has been gravitationally captured by the star.
As the infalling material enters the disk, it can cause perturbations that create vortices and pressure bumps within the disk that trap material, facilitating the growth of protoplanets. Additionally, as this late-stage infall dumps gas and dust into the system, more material is available for planet formation. Continued studies of objects like AB Aurigae will reveal more about the dynamical impacts of late-stage infall on circumstellar disks and how those changes influence planet formation.
Citation
“Mapping the Merging Zone of Late Infall in the AB Aur Planet-Forming System,” Jessica Speedie et al 2025 ApJL 981 L30. doi:10.3847/2041-8213/adb7d5
The post A Late-Stage Infall Renovation: Mapping the Circumstellar Disk of AB Aurigae appeared first on AAS Nova.
]]>
Gravitational-wave detectors have spotted dozens of merging black hole pairs. New research explores whether any of these collisions could have happened in the disk around an accreting supermassive black hole.
The post Gravitationally Lensed Gravitational Waves from Black Holes Around Black Holes appeared first on AAS Nova.
]]>Gravitational-wave detectors have captured the chirps of dozens of merging black holes. Could any of these mergers have happened in the disk around a supermassive black hole?
Black Holes Around Black Holes

Diagram of a binary black hole system orbiting within the disk of a supermassive black hole. The observer is located at N in this diagram. [Leong et al. 2025]
Detecting a gravitationally lensed gravitational-wave signal from merging black holes would provide valuable information about the population of black holes that reside in active galactic nucleus disks, as well as the properties of the disks themselves.

Constraints able to be placed on the fraction of binary black hole mergers happening in active galactic nucleus disks as a function of the number of observations, Nobs, and the distance between the binary system and the central supermassive black hole, indicated by the fill pattern. The filled area shows the values that are ruled out. This plot assumes that no gravitationally lensed gravitational waves are observed. [Adapted from Leong et al. 2025]
Lensing Likelihood
So far, no gravitationally lensed gravitational waves have been detected — but luckily, even this non-detection contains valuable information. To explore the implications of this non-detection, Samson Leong (The Chinese University of Hong Kong) and collaborators developed an analytical model that describes a binary black hole pair orbiting and merging within the disk of an active galactic nucleus. The team calculated the probability that gravitational waves from the merger of these black holes would be gravitationally lensed from the perspective of a distant observer. This probability is dependent upon the orientation of the disk relative to the viewer, as well as the distance from the binary system to the central supermassive black hole.
Then, given the fact that none of the dozens of mergers detected so far have had gravitationally lensed signals, Leong’s team constrained the fraction of observed mergers happening in active galactic nucleus disks. With only about 100 binary black hole merger observed to date, the constraining power of the non-detection is limited. For now, all that can be said is that no more than 47% of the observed mergers took place in the disks around active galactic nuclei. As the number of detected black hole mergers grows, the constraint will grow more stringent; if no lensed events have been observed after roughly 1,000 mergers have been detected, that would mean that no more than 5% of the mergers took place within an active galactic nucleus disk.
To Be Constrained

Similar to the previous figure, but this time emphasizing the impact of the orbital distance of the merging black holes. The vertical dotted lines indicate the locations of potential migration traps. [Adapted from Leong et al. 2025]
Future observations may yield new information about active galactic nucleus accretion disks. In particular, it may be possible to discern the minimum size of an accretion disk, as well as where within the disk binary black holes are most likely to merge.
Citation
“Constraining Binary Mergers in Active Galactic Nuclei Disks Using the Nonobservation of Lensed Gravitational Waves,” Samson H. W. Leong et al 2025 ApJL 979 L27. doi:10.3847/2041-8213/ad9ead
The post Gravitationally Lensed Gravitational Waves from Black Holes Around Black Holes appeared first on AAS Nova.
]]>
Astrobites reports on a study that shows that hot stars seem to host fewer small planets than their cooler stellar cousins.
The post Twenty Thousand Stars Later, They Didn’t Find a Single Planet (and That’s Cool, Too!) appeared first on AAS Nova.
]]>Editor’s Note: Astrobites is a graduate-student-run organization that digests astrophysical literature for undergraduate students. As part of the partnership between the AAS and astrobites, we occasionally repost astrobites content here at AAS Nova. We hope you enjoy this post from astrobites; the original can be viewed at astrobites.org.
Title: Small and Close-In Planets are Uncommon Around A-Type Stars
Authors: Steven Giacalone and Courtney D. Dressing
Authors’ Institutions: California Institute of Technology and University of California, Berkeley; University of California, Berkeley
Status: Published in AJ
Some of the most interesting articles in exoplanet science concern the discovery of new exoplanets. After all, most of us get into this field with dreams of discovery. Today’s article is as fascinating as it is empty of planets: the authors searched roughly 20,000 stars and found a whopping zero planets. What’s the deal?
While the Kepler mission’s survey that stared at a single patch of sky for four straight years searching for exoplanet transits has dominated exoplanet statistics for more than a decade, Kepler focused primarily on host stars with spectral types F, G, K, and M (i.e., FGKM stars). These stars all have temperatures less than about 7000K, and while there is a lot of variation among these types of stars, they are considered relatively Sun-like (our Sun is a G-type star). Through observing these stars, we were able to build up robust statistics on the occurrence rates of different kinds of planets. Astrobites has covered occurrence rate studies in the past (see these bites on small planets around M-dwarf stars, occurrence of systems with similar architecture to our own, and big planets around small stars). Essentially, the occurrence rate measures how many planets of a specified type (like “super-Earths” or “hot Jupiters”) are likely to be found if you survey a certain number of stars with a certain spectral type.
However, the Kepler mission did not observe enough A-type stars to measure the occurrence rate of different kinds of planets around hosts of this stellar type. A-type stars are hotter than our Sun, with temperatures between about 7500K and 10000K. They are bigger in both mass and radius than our Sun, and they emit more of their light in the ultraviolet portion of the electromagnetic spectrum. Very little is known about planetary systems around A-type stars, in large part due to Kepler’s blind spot, but also because these stars make for very poor targets in radial-velocity surveys. A-type stars have far fewer spectral lines than Sun-like stars and they spin much faster than our Sun, both factors that decrease radial-velocity sensitivity greatly compared to the more Sun-like stars. Most of what is known of planetary systems around A-type stars comes from direct-imaging surveys, which are only sensitive to massive Jupiter-size planets at very large separations from their stars.
Then, when the Transiting Exoplanet Survey Satellite (TESS) came along with the plan to observe most of the night sky, an opportunity to search for planets around more A-type stars became available. That’s where today’s article comes in. The authors used the TESS dataset to search A-type stars for small planets (between 1 and 8 Earth radii) on short orbits (orbital period less than 10 days). To say that this search was an immense labor is almost an understatement. The authors wrote a custom software pipeline to search through the dataset, identify potential transits, and then apply a few rounds of vetting on each candidate.
The authors first had to identify all the A-type stars in the TESS catalog — about 20,000 stars. Of these, the pipeline identified 299 transit candidates. Looking more closely at these with a complementary dataset, the authors ruled out many as false positives (mostly obvious-by-eye eclipsing binaries), leaving only 88 candidates remaining. Next, they inspected the candidates for secondary eclipses, which would indicate the transit is not planetary but stellar; this effort ruled out another half, leaving only 44 candidates. Next they tested for background eclipsing binaries, which can mimic planet transits, cutting more candidates so that only 10 remained. Lastly, they performed statistical tests on the leftovers by analyzing the way nearby stars get brighter or dimmer during the time of the transits to see if anything is correlated. In the end, they found that not one candidate passed and therefore the pipeline found zero planets.
Despite finding no planets, this null result is still very important. In this study, the null result was used to place constraints on the occurrence rates of different kinds of planets that orbit A-type stars. In particular, the authors found that sub-Neptune-sized planets occur six times less frequently around A-type stars than they do around FGKM stars. The authors dive into this result and point to earlier studies that show a decrease in planet occurrence as the host stars get hotter. In fact, this result is well in line with these earlier studies, but now the trend is finally investigated for the even hotter A-type stars, as shown in Figure 1. This is a fascinating result: big hot stars seem to host fewer planets than smaller, cooler stars. Why?
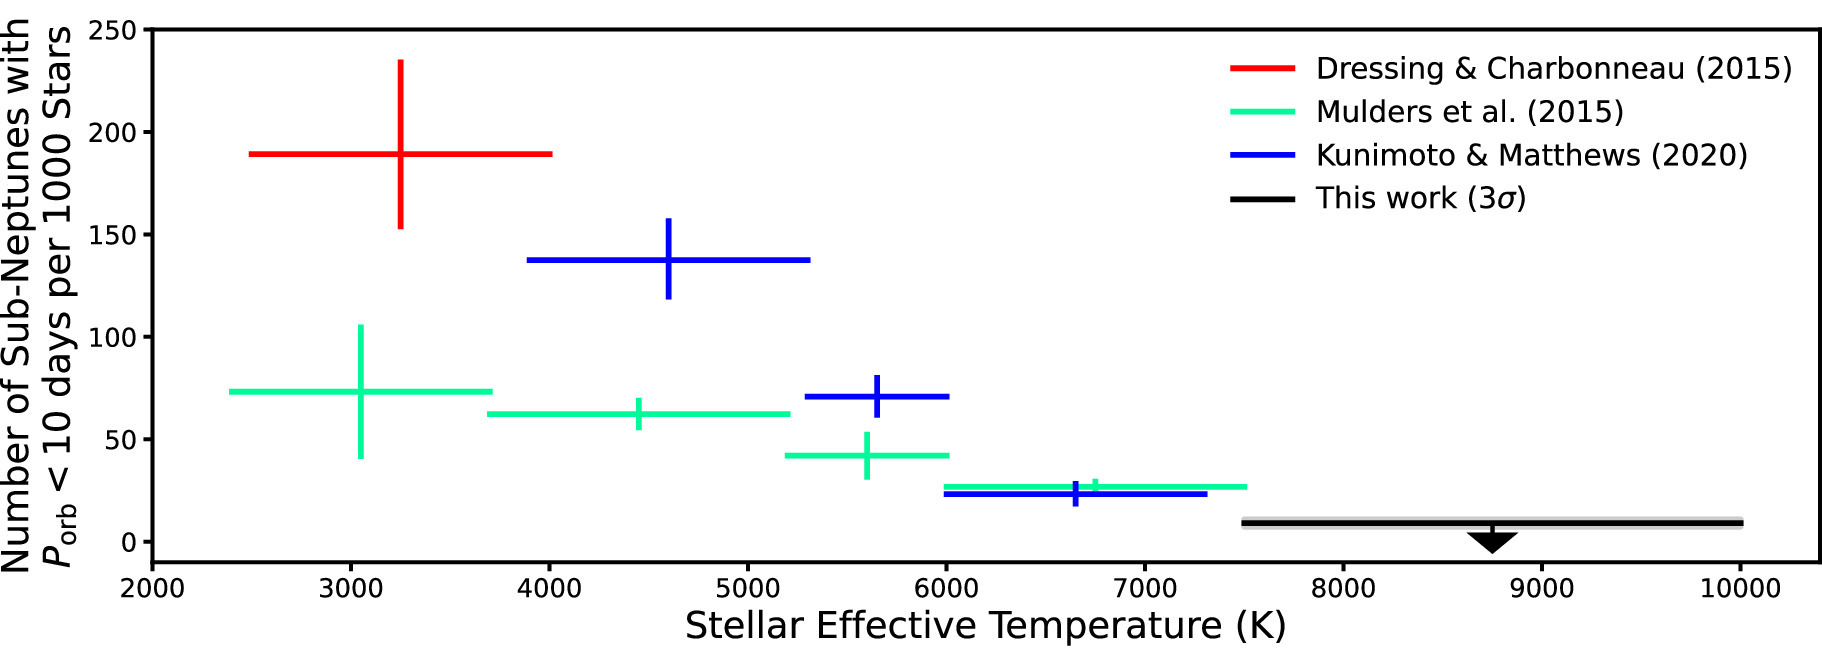
Figure 1: The occurrence rate of sub-Neptune planets versus host-star temperature. Previous studies show that sub-Neptunes are common around smaller, cooler stars. As host-star temperature increases, the occurrence of sub-Neptunes goes down. This has been noted in earlier works, but this work extends the temperature regime greatly at the hot end and shows that sub-Neptunes are very rare around hotter A-type stars. [Adapted from Giacalone and Dressing 2025]
Next, the authors discuss what their result means for the big picture of our understanding of planet formation. First, they discuss if this could be part of an observing bias. There are two ways that A-type stars make finding transits more difficult. A-type stars emit lots of their light in the ultraviolet, which can strip the atmospheres of Neptune-like planets through a mechanism called photoevaporation. Perhaps all the gaseous planets that orbit A-type stars have been stripped of their atmospheres and all that is left behind are the relatively small rocky cores, which are very hard to detect via transits. Additionally, the existence of binary systems, to which many A-type stars belong, can make planets harder to detect. If what is thought to be a single star is in fact a binary, the second star’s extra light can make the transit depths even smaller and therefore even harder to detect.
Finally, the authors pose the question of whether A-type stars simply make fewer planets or are able to retain fewer planets. The disks of gas and dust that form around all stars when they are born, and from which planets are born, are dissipated by the strong A-type star’s stellar winds much faster than those of FGKM stars. Perhaps these disks don’t survive long enough to produce many planets. On the other hand, A-type stars are very massive and studies show that the large gas disks they produce when they are born should produce many planets and in particular many big planets. Perhaps these systems are born with many large planets that make the system gravitationally unstable and all the inner, small planets get flung out of the system.
In all, the authors provide a rigorous study of the occurrence (or lack thereof) of small planets in close orbits of A-type stars. This work sheds light on a severely understudied population and better rounds out our understanding of planet formation across stellar mass and temperature regimes. Sometimes finding nothing is just as meaningful!
Original astrobite edited by Maria Vincent.
About the author, Jack Lubin:
Jack received his PhD in astrophysics from UC Irvine and is now a postdoc at UCLA. His research focuses on exoplanet detection and characterization, primarily using the radial velocity method. He enjoys communicating science and encourages everyone to be an observer of the world around them.
The post Twenty Thousand Stars Later, They Didn’t Find a Single Planet (and That’s Cool, Too!) appeared first on AAS Nova.
]]>
What has the supermassive black hole at the center of the Milky Way's galactic neighbor been up to? The Chandra X-ray Observatory provides all the details.
The post Fifteen Years of X-Rays from Andromeda’s Supermassive Black Hole appeared first on AAS Nova.
]]>The Chandra X-ray Observatory has been keeping tabs on the Andromeda Galaxy for years. What do these observations tell us about the supermassive black hole at the center of our nearest major galactic neighbor?
Examining a Moderate Black Hole

Illustration of the relative sizes of the supermassive black holes at the center of the Milky Way (Sgr A*) and Messier 87 (M87*). Click to enlarge. [EHT collaboration (acknowledgment: Lia Medeiros, xkcd); CC BY 4.0]
The Milky Way’s nearest massive galactic neighbor, the Andromeda Galaxy, provides an opportunity to study a supermassive black hole that falls between these two mass extremes. Andromeda’s central supermassive black hole has a moderate mass of roughly 100 million solar masses and is known to exhibit flaring behavior. The Chandra X-ray Observatory has provided a wealth of X-ray observations of Andromeda’s center since 2000. What do these data tell us about what Andromeda’s black hole has been up to recently?
Journey to Center of Andromeda
In a recent publication, Stephen DiKerby (Michigan State University) and collaborators examined the behavior of Andromeda’s central supermassive black hole over the past 15 years. The team amassed a large sample of Chandra observations of Andromeda’s center from 2009 to the present, including all of the observations in the public archive. These data were stitched into an extensive light curve to investigate the supermassive black hole’s behavior.

Stacked image from Chandra’s High Resolution Camera showing the locations of the four X-ray sources near Andromeda’s center. [DiKerby et al. 2025]
Staying Active

Count rate for the X-ray source P2 over the past 15 years. An X-ray flare is highlighted in red. Click to enlarge. [DiKerby et al. 2025]
Another aspect of the black hole’s X-ray emission is its hardness ratio: a measure of whether more high-energy or low-energy X-rays were emitted. The team found that the hardness ratio was about the same during the 2013 flare as it was during non-flaring times. This suggests that the emission mechanism is the same for both flaring and non-flaring states.
Interestingly, the emission from Andromeda’s black hole has a similar hardness ratio to the Milky Way’s black hole when both black holes are quiescent, but the flares from Andromeda’s black hole are significantly softer (i.e., they have a greater proportion of low-energy X-rays) than those from the Milky Way’s black hole. This suggests that more investigation of the flaring mechanisms of the two black holes is needed, as is continued monitoring of the black hole at the heart of our neighboring galaxy.
Citation
“Fifteen Years of M31* X-Ray Variability and Flares,” Stephen DiKerby et al 2025 ApJ 981 50. doi:10.3847/1538-4357/adb1d5
The post Fifteen Years of X-Rays from Andromeda’s Supermassive Black Hole appeared first on AAS Nova.
]]>
When mapping energetic atoms from the edge of our solar system, the Interstellar Boundary Explorer discovered an unexpected ribbon-like feature that researchers are still working to understand.
The post Featured Image: A Ribbon Around the Heliosphere appeared first on AAS Nova.
]]>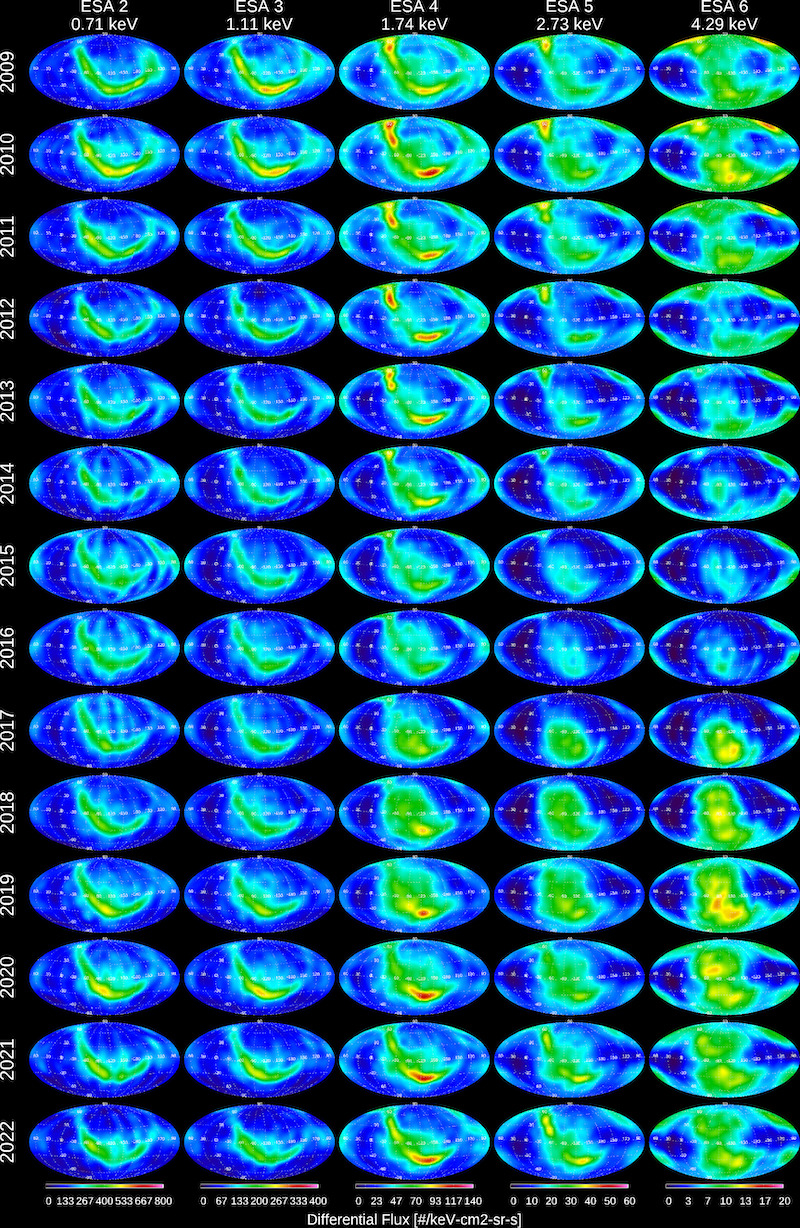
Maps of energetic neutral atom flux from 2009 to 2022 and from 0.71 keV to 4.29 keV. Click to enlarge. [Noh et al. 2025]
Citation
“Characteristics of the IBEX Ribbon and Their Implications for a Source Region Outside the Heliopause,” Sung Jun Noh et al 2025 ApJ 980 8. doi:10.3847/1538-4357/ada36a
The post Featured Image: A Ribbon Around the Heliosphere appeared first on AAS Nova.
]]>
Astrobites reports on what might be powering the strange, puzzling young galaxies known as little red dots.
The post Them’s the (Balmer) Breaks appeared first on AAS Nova.
]]>Editor’s Note: Astrobites is a graduate-student-run organization that digests astrophysical literature for undergraduate students. As part of the partnership between the AAS and astrobites, we occasionally repost astrobites content here at AAS Nova. We hope you enjoy this post from astrobites; the original can be viewed at astrobites.org.
Title: Extremely Dense Gas Around Little Red Dots and High-Redshift AGNs: A Non-Stellar Origin of the Balmer Break and Absorption Features
Authors: Kohei Inayoshi and Roberto Maiolino
Authors’ Institutions: Peking University; University of Cambridge and University College London
Status: Published in ApJL
Since its launch in late 2021, JWST has discovered all kinds of weird and wonderful objects. Its impressive sensitivity to infrared wavelengths has allowed astronomers to peer billions of years into the past and discover previously unseen populations of early galaxies. One distinct group of new galaxies was dubbed “little red dots,” or LRDs for short, and these galaxies were observed to be red and compact with distinctive “V”-shaped spectra. You can read more about LRDs here and here.
There’s been a lot of speculation about what kinds of galaxies LRDs might be. One of the most popular interpretations is that a little red dot is a galaxy hosting a supermassive black hole that’s being fed by a rapidly rotating disc of gas. This is known as an active galactic nucleus or AGN. One of the key signatures of an AGN is the presence of broad Balmer emission lines in the galaxy’s spectrum.
Electrons in an atom can only inhabit specific energy levels, and to jump down from one level to another, a photon with the exact same energy as the difference between the two levels must be emitted. Each element has unique energy levels, allowing astronomers to attribute different emission lines to specific transitions within specific elements. Wavelengths in the Balmer series are emitted when an electron in a hydrogen atom jumps from a higher energy level to the second energy level.
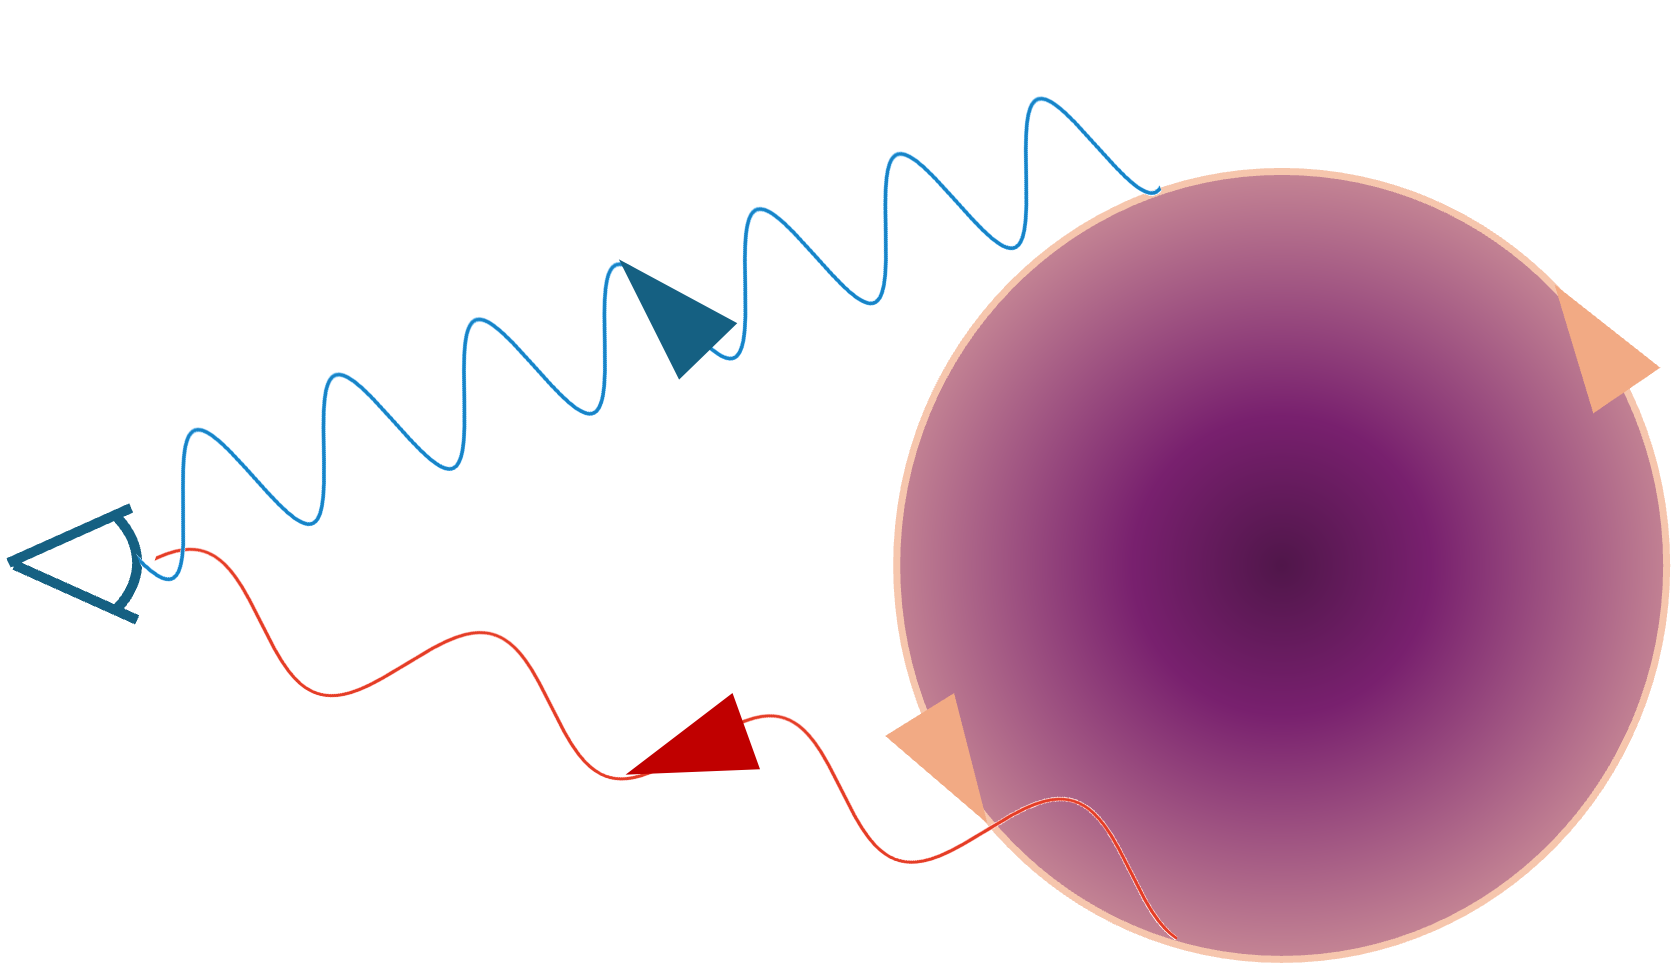
Figure 1: This diagram shows how a spinning disc creates Doppler broadening. The side that’s moving towards the viewer will emit blueshifted light and the side that’s moving away from the viewer will emit redshifted light. When you add up the slight shifts from each part of the disc, you end up with a broad emission line. [Nathalie Korhonen Cuestas]
But there are other possible explanations for what LRDs might be. One explanation that’s garnered some attention is the possibility that LRDs are not AGN and are instead very dusty starburst galaxies. This explanation is supported by the presence of a Balmer break (sometimes also called a Balmer jump) in the spectra of some LRDs. A Balmer break refers to a significant dip in a spectrum for wavelengths shorter than the Balmer limit — or, the maximum wavelength of light that can ionise a hydrogen atom with an electron in the second energy level. Observing a Balmer break means that a significant fraction of hydrogen atoms with electrons in or above the second energy level have been ionised by high-energy photons. Typically, a Balmer break is associated with recent star formation, since you need lots of hot stars to be emitting photons beyond the Balmer limit.
There’s a problem with this explanation of LRDs. If LRDs are in fact dusty starbursts, then their spectra are consistent with stellar masses of tens of billions (or even up to hundreds of billions) of solar masses. In the local universe, these kinds of masses are pretty normal, but local galaxies have had 13.8 billion years to grow — an LRD at a redshift of z = 7 has not even had 1 billion years to grow. Our current understanding of the universe makes it seem pretty unlikely that this could happen.
Luckily, today’s authors are on the case and have shown how an AGN spectrum could have a Balmer break, allowing astronomers to assume a much lower stellar mass for LRDs. The authors suggest that if LRDs contain AGNs covered by a thick blanket of dense gas, then we could expect to see a Balmer break.
To test this idea, the authors use a photoionisation modelling code called Cloudy, which essentially calculates how many electrons should be in each energy level, given the temperature and density of the gas, as well as the light source illuminating the gas. The authors model the gas in the LRD and surrounding the AGN as a single slab of low-metallicity (10 times lower abundance of heavy elements than in the Sun) gas at a uniform temperature and density and use an AGN spectrum as the light source. They vary the density of the gas between 10 million and 100 billion atoms per cubic centimeter.
At low densities (see the magenta line in Figure 2), there’s no Balmer break because there just aren’t many electrons in the second energy level. As the density increases, collisions between particles become more common, and some electrons will excite to the second energy level due to these collisions. As a result, there are more electrons at the right energy level to absorb photons bluewards of the Balmer limit and photoionise. In Figure 2, you can see that the strength of the Balmer break increases as you go from 108 cm-3 to 1010 cm-3.

Figure 2: This plot shows you the spectrum produced by slabs of different densities. You can see that the Balmer break (highlighted in yellow) becomes deeper at higher densities, although it becomes slightly shallower at the highest density. [Adapted from Inayoshi & Maiolino 2025]
You can see from Figure 3 that the authors’ simulated spectra produced Balmer breaks that are just as strong as the Balmer breaks seen in LRDs. This means that the picture of LRDs as AGNs surrounded by very dense gas is consistent with observations! The authors also show that such dense gas can produce absorption features at the Balmer wavelengths and an oxygen emission line, which are also sometimes observed in LRD spectra.
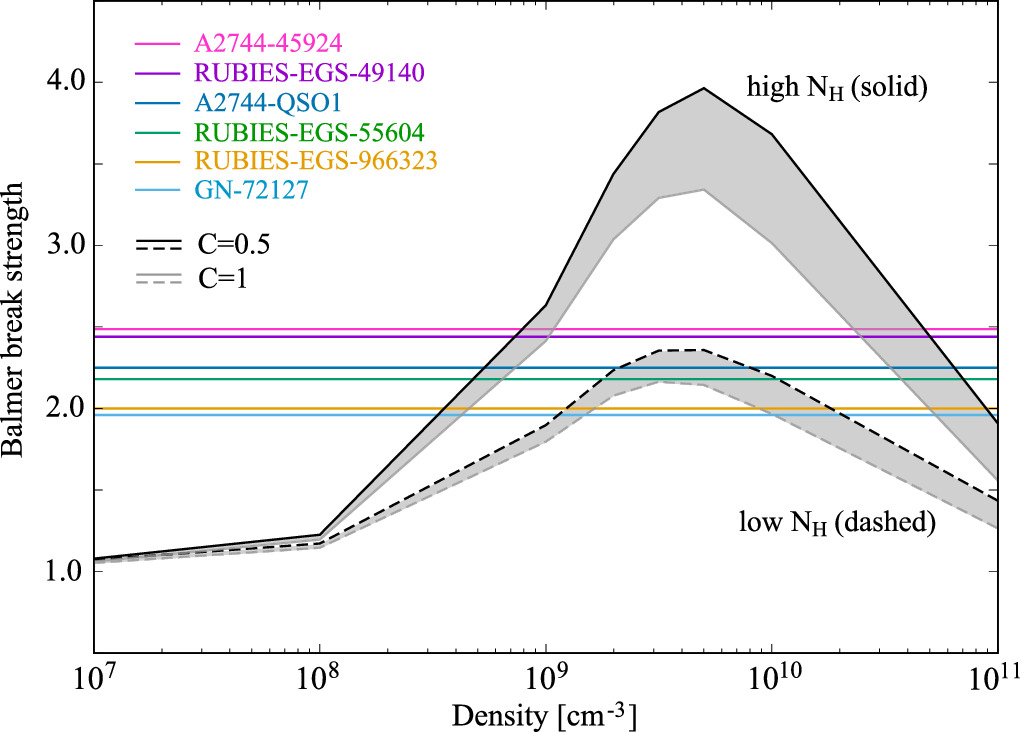
Figure 3: Balmer break strengths as a function of density for a range of the authors’ simulated AGN spectra. The colorful horizontal lines show the Balmer break strengths actually observed in different LRDs. [Inayoshi & Maiolino 2025]
Original astrobite edited by Storm Colloms.
About the author, Nathalie Korhonen Cuestas:
Nathalie Korhonen Cuestas is a second-year PhD student at Northwestern University, where her research focuses on the chemical evolution of galaxies.
The post Them’s the (Balmer) Breaks appeared first on AAS Nova.
]]>
Following decades of disproven claims, four small exoplanets have been confirmed to orbit Barnard's Star, the second-closest star system to Earth after Alpha Centauri.
The post Confirmed at Last: Barnard’s Star Hosts Four Tiny Planets appeared first on AAS Nova.
]]>Following decades of disproven claims, four small exoplanets have been confirmed to orbit Barnard’s Star, the second-closest star system to Earth after Alpha Centauri.
System Under Scrutiny

Illustration of the nearest star systems to Earth. Barnard’s Star is the nearest single star and second-nearest star system; the triple-star Alpha Centauri system is closer. The remaining two systems shown here contain brown dwarfs. [NASA/Penn State University]
Now, the white whale appears to have been caught at last. Just last November, researchers reported the discovery of a planet orbiting Barnard’s Star with a period of 3.154 days. The data hinted at the presence of three other planets, but these candidates could not be confirmed. In a new research article published today, Ritvik Basant (University of Chicago) and collaborators leveraged years of data to confirm that Barnard’s Star hosts not just one, but four planets.
Continuing the Search
The team observed Barnard’s Star from 2021 to 2023 with the M dwarf Advanced Radial velocity Observer Of Neighboring eXoplanets (MAROON-X), a spectrograph tailored to the properties of M dwarfs. Basant and coauthors searched the MAROON-X data for subtle shifts in spectral lines indicating the change in the star’s radial velocity from planets tugging on the star as they orbit.

Phase-folded fits to the MAROON-X data from this work (red triangles) and the data from other authors (beige and gray squares). Click to enlarge. [Adapted from Basant et al. 2025]
After removing the signals from the three confirmed planets, a tiny amount of signal remained at the period of the planet candidate e — but not enough to confirm its presence. To investigate further, Basant’s team jointly modeled their MAROON-X data with the data that led to the discovery of Barnard b last November. This improved the statistics and strengthened the evidence for planet e, confirming its existence.
More to Learn
Ultimately, Basant’s team confirmed the presence of four planets with minimum masses between 19% and 34% of Earth’s mass. Barnard e is possibly the lowest-mass planet to be detected using the radial-velocity method.

Compactness of the Barnard’s Star system compared to other compact M-dwarf planetary systems. Click to enlarge. [Adapted from Basant et al. 2025]
Now, for the million-dollar question: could any of these planets be habitable? None of the newly discovered planets lie within Barnard’s Star’s habitable zone, which spans orbital periods from 10 to 42 days. The current data also rule out the presence of habitable-zone planets with masses greater than 0.57 Earth mass, though smaller planets are still possible.
Citation
“Four Sub-Earth Planets Orbiting Barnard’s Star from MAROON-X and ESPRESSO,” Ritvik Basant et al 2025 ApJL 982 L1. doi:10.3847/2041-8213/adb8d5
The post Confirmed at Last: Barnard’s Star Hosts Four Tiny Planets appeared first on AAS Nova.
]]>
When a gas cloud collapses to form a star cluster, how many objects form, and what are their masses? Research published today provides answers about the low-mass end of the star and brown dwarf formation process.
The post Astronomers Measure Turnover in Initial Mass Function for the First Time appeared first on AAS Nova.
]]>For the first time, researchers have identified a turnover in the initial mass function of a star cluster. The new finding suggests that newborn stars and sub-stellar objects become more prevalent with decreasing mass down to the turnover at 12 Jupiter masses. The study also suggests that the fundamental lower limit of the process through which stars and brown dwarfs form may lie around 3 Jupiter masses.
How Low Does the Mass Function Go?
Take a cloud of turbulent hydrogen gas and give it time to coalesce into a cluster of stars. How many stars do you get, and how massive are they? These questions are answered by the initial mass function, which describes the mass distribution of newborn objects in a cluster. The initial mass function decreases from just a few stars at high masses to myriad stars, brown dwarfs, and planetary-mass objects at low masses.
However, the increase in number with decreasing mass doesn’t go on forever; star-formation theories predict that the initial mass function turns over, with objects becoming less prevalent below the turnover mass. The turnover of the initial mass function has never been observed — until now.
Searching for the Turnover

This Hubble Space Telescope view of NGC 2024 shows the thick clouds of dust throughout the region. [NASA, ESA, and N. Da Rio (University of Virginia); Processing: Gladys Kober (NASA/Catholic University of America)]
NGC 2024’s extreme dustiness was actually a plus for this investigation. Though dust is often a hindrance for astronomers, in this case it helped to screen out background sources that might contaminate the exploration of the cluster. Using JWST’s Near-Infrared Camera (NIRCam), De Furio’s team picked out the faint point sources indicating low-mass objects in the star cluster. Existing star-finding algorithms were stymied by the dusty nebula, so the team developed a new automated routine, which detected 100 point sources in their images.
De Furio’s team trimmed this initial sample by removing background objects and sources that saturated the detector, were too heavily obscured by dust, or were likely more massive than the tail end of the initial mass function being studied here. This left 28 objects, for which the team used evolutionary models to calculate the masses. The least-massive object in the sample weighed in around 3 Jupiter masses.

Histogram showing the masses of the 28 cluster members used in this study. The vertical red dashed line shows the breakpoint mass, or where the initial mass function turns over. [Adapted from De Furio et al. 2025]
Sampling Sub-Stellar Sources
Using Bayesian statistics, the team constructed the initial mass function for the cluster given the masses of the detected objects and the varying sensitivity across the field of view; NIRCam can detect objects down to 0.5–2.0 Jupiter masses, depending on the amount of obscuring dust. The resulting initial mass function shows a clear turnover around 12 Jupiter masses — the first time this feature has been identified for any cluster.
Although NIRCam is sensitive to objects down to 0.5–2.0 Jupiter masses, the team found no objects below 3 Jupiter masses. This suggests that the end of the initial mass function — the minimum-mass of an object that a turbulent cloud can create through fragmentation — may lie around this mass. Previous work predicted the end of the initial mass function to be between 1 and 10 Jupiter masses.
De Furio and coauthors plan to continue their investigation of the initial mass function in NGC 2024, using JWST spectra to confirm the masses of the objects in the sample, as well as to investigate whether the mass function varies from the center of the cluster, where this study was performed, to its outskirts.
Citation
“Identification of a Turnover in the Initial Mass Function of a Young Stellar Cluster Down to 0.5 MJ,” Matthew De Furio et al 2025 ApJL 981 L34. doi:10.3847/2041-8213/adb96a
The post Astronomers Measure Turnover in Initial Mass Function for the First Time appeared first on AAS Nova.
]]>
Recent JWST observations have stirred up concerns about over-massive black holes in the early universe. A new study allays these concerns while showing that over-massive black holes are just scratching the surface of the full black hole population.
The post Observational Obstacles to Detecting Early Universe Supermassive Black Holes appeared first on AAS Nova.
]]>Is JWST observing impossibly huge supermassive black holes in the early universe? A new study suggests that observational biases can explain the recently discovered population of over-massive black holes.
Too Supermassive Black Holes
Most galaxies in the universe house a central supermassive black hole. Even galaxies that populate the early universe are home to black holes that somehow grew to millions of times the mass of the Sun within the first billion years after the Big Bang. Recent JWST observations have uncovered a seemingly “over-massive” population of central black holes with redshifts of z ≳ 4, which corresponds to galaxies from the first ~1.5 billion years of the universe.
Why do these black holes seem over-massive? Compared to galaxies in the local universe, these early universe black holes appear to be too massive given the masses of their host galaxies. In other words, these black holes fall above the local universe black hole mass–stellar mass relation. This suggests that most black holes within the early universe are over-massive and were probably born out of heavy seeds — likely clouds of material that directly collapsed into massive black holes. However, in the high-redshift observational regime, the impacts of observational biases and measurement uncertainties must be fully understood to confidently draw these conclusions.

The impacts of selection bias and measurement uncertainties on the black hole mass–stellar mass relation. Top left: Distribution of this study’s mock galaxies with active supermassive black holes (AGNs). The local black hole mass–stellar mass relation is overlaid. Top right: Distribution of mock AGN with the selection criteria (limiting luminosity and spectral line width) applied. Bottom left: Distribution of mock AGN including measurement uncertainties in black hole mass and host galaxy stellar mass. Bottom right: Distribution of mock AGN including both selection biases and mass uncertainties. Click to enlarge. [Li et al 2025]
Examining Observational Biases
Even with JWST’s advanced observational capabilities, there are selection effects and observational limitations at play when studying galaxies in the very distant past. In order to detect supermassive black holes at high redshifts, the galaxies must be bright enough to be seen from so far away and must have black holes that are actively accreting material and producing broad emission lines. To understand how these selection effects impact the interpretation of observations, Junyao Li (University of Illinois at Urbana-Champaign) and collaborators performed a rigorous statistical analysis to determine if the recently discovered over-massive black hole population is truly over-massive.
Assuming that galaxies at the mean redshift of current JWST observations follow the local black hole mass–stellar mass relation, the authors create a mock sample of galaxies with active central supermassive black holes to model the expected distribution of black hole mass and host galaxy stellar mass in the early universe. The authors then carefully apply the observational biases and inherent uncertainties in mass measurements to their mock sample to produce the relation that would be detected with JWST. With these limitations taken into account, the authors show that in practice, JWST is only sampling the brightest, most massive black holes — creating a seemingly over-massive black hole population when compared to the local universe. Their modeling suggests that a population of “under-massive” or lower-mass black holes is likely being missed in JWST observations, which if detected, would mean that the mass distribution of early universe black holes does not deviate from that in the local universe.
Small Seed Suggestions

The distribution of mock galaxies with active central supermassive black holes (AGN) with observations from JWST shown with blue stars. The evolutionary paths of black holes with light (circles) and heavy (triangles) seeds are plotted. The predicted depth of JWST survey JDEEP is outlined in blue, showing that the lowest mass black holes with light seeds would not be detected by this survey. Click to enlarge. [Li et al 2025]
This study highlights the need for careful consideration of selection effects and uncertainties, even with advanced and deep instruments like JWST. Obtaining measurements for low-mass black holes is imperative to gaining a further understanding of black hole seeding and the ways supermassive black holes evolve with their host galaxies. Using these measurements in tandem with improving theoretical predictions for the assembly history of black holes, the distant past will become a bit more familiar.
Citation
“Tip of the Iceberg: Overmassive Black Holes at 4 < z < 7 Found by JWST Are Not Inconsistent with the Local MBH–M* Relation,” Junyao Li et al 2025 ApJ 981 19. doi: 10.3847/1538-4357/ada603
The post Observational Obstacles to Detecting Early Universe Supermassive Black Holes appeared first on AAS Nova.
]]>
Astrobites reports on the star-forming histories of early galaxies and galaxies that form their stars in bursts interspersed with lulls.
The post Baby Galaxies Love to Take 100-Million-Year Naps appeared first on AAS Nova.
]]>Editor’s Note: Astrobites is a graduate-student-run organization that digests astrophysical literature for undergraduate students. As part of the partnership between the AAS and astrobites, we occasionally repost astrobites content here at AAS Nova. We hope you enjoy this post from astrobites; the original can be viewed at astrobites.org.
Title: CEERS: Increasing Scatter Along the Star-Forming Main Sequence Indicates Early Galaxies Form in Bursts
Authors: Justin W. Cole et al.
First Author’s Institution: Texas A&M University
Status: Published in ApJ
In the local universe, galaxies tend to form stars at a slow and steady rate, but new observations suggest this is not the case in the early universe. JWST has allowed astronomers to peer further back into the universe’s history, and the galaxies that they’ve found seem to defy expectations. For example, astronomers keep observing more bright galaxies than initially expected. One explanation for the observations made by JWST is that galaxies in the early universe form their stars in bursts interspersed with periods of less intense star formation.
The average rate at which galaxies form stars varies over cosmic time: from the beginning of the universe, it rises for about 3.3 billion years, peaks at around a redshift of z = 2 (equivalent to about 10.4 billion years ago), and then begins to decline. While an individual galaxy might deviate from this general trend, it’s a good description of how an entire population of galaxies behaves over time. Importantly, this trend is slightly different depending on a galaxy’s mass. More massive galaxies tend to form more of their stars and reach their peak star formation rate earlier in the universe’s history.
The correlation between mass and star formation rate gives rise to a relationship known as the star-forming main sequence, or SFMS. The SFMS is an observed correlation between a galaxy’s stellar mass and its star formation rate — higher-mass galaxies generally form stars at a higher rate. Since the cosmic star formation rate changes with time, so does the SFMS. For example, the SFMS of galaxies close to the peak of cosmic star formation will be shifted towards higher star formation rates than the SFMS of local galaxies.
To make things more interesting, astronomers can use different features in a galaxy’s spectrum to estimate the star formation rate averaged over a different amount of time. For instance, you can use the luminosity of the Hα emission line to estimate the star formation rate averaged over the last 10 million years. This is because the Hα emission line is produced in ionised gas surrounding the most massive stars (O types), which only live for a couple million years. By contrast, the ultraviolet luminosity of a galaxy is more sensitive to the emission from lower-mass, longer-lived stars, giving astronomers a way to estimate the star formation rate over the past 100 million years.
The authors of today’s article use these two measures of star formation rate to investigate the star-forming histories of over 1,800 high-redshift galaxies. They find that the SFMS has a lot more scatter if you use a short-timescale, Hα-based star formation rate as opposed to a longer-timescale, ultraviolet-based star formation rate. This suggests that the star formation rate is more variable on short timescales and supports the idea of bursty star formation.
The galaxies used in the analysis were observed as part of the Cosmic Evolution Early Release Science (CEERS) survey using the Near Infrared Camera (NIRCam) on JWST. All of the galaxies are in a very well-studied region of the sky known as the Extended Groth Strip, so the authors were able to combine the JWST data with pre-existing Hubble data.
To determine how the SFMS evolves with time, the authors divided the sample into five different bins, each in a different redshift range. For each bin and each star formation rate indicator, they estimated the slope, normalisation (y-intercept), and scatter of the SFMS. Across all redshifts, the authors found that the shorter-timescale, Hα-based star formation rate generated an SFMS with more scatter (see Figure 1) and a lower normalisation than an SFMS based on a longer-timescale star formation rate. Larger scatter shows that the star formation rate varies more on short timescales than long timescales, reflecting a bursty star-formation history. The lower normalisation shows that the short-timescale star formation rate is, on average, lower than the long-timescale rate. So, the authors conclude that while star formation does happen in bursts, it’s more accurate to describe the star-formation history as interruptions to normal star formation (lulls or naps that last between 100 and 250 million years), as opposed to short periods of very intense star formation.
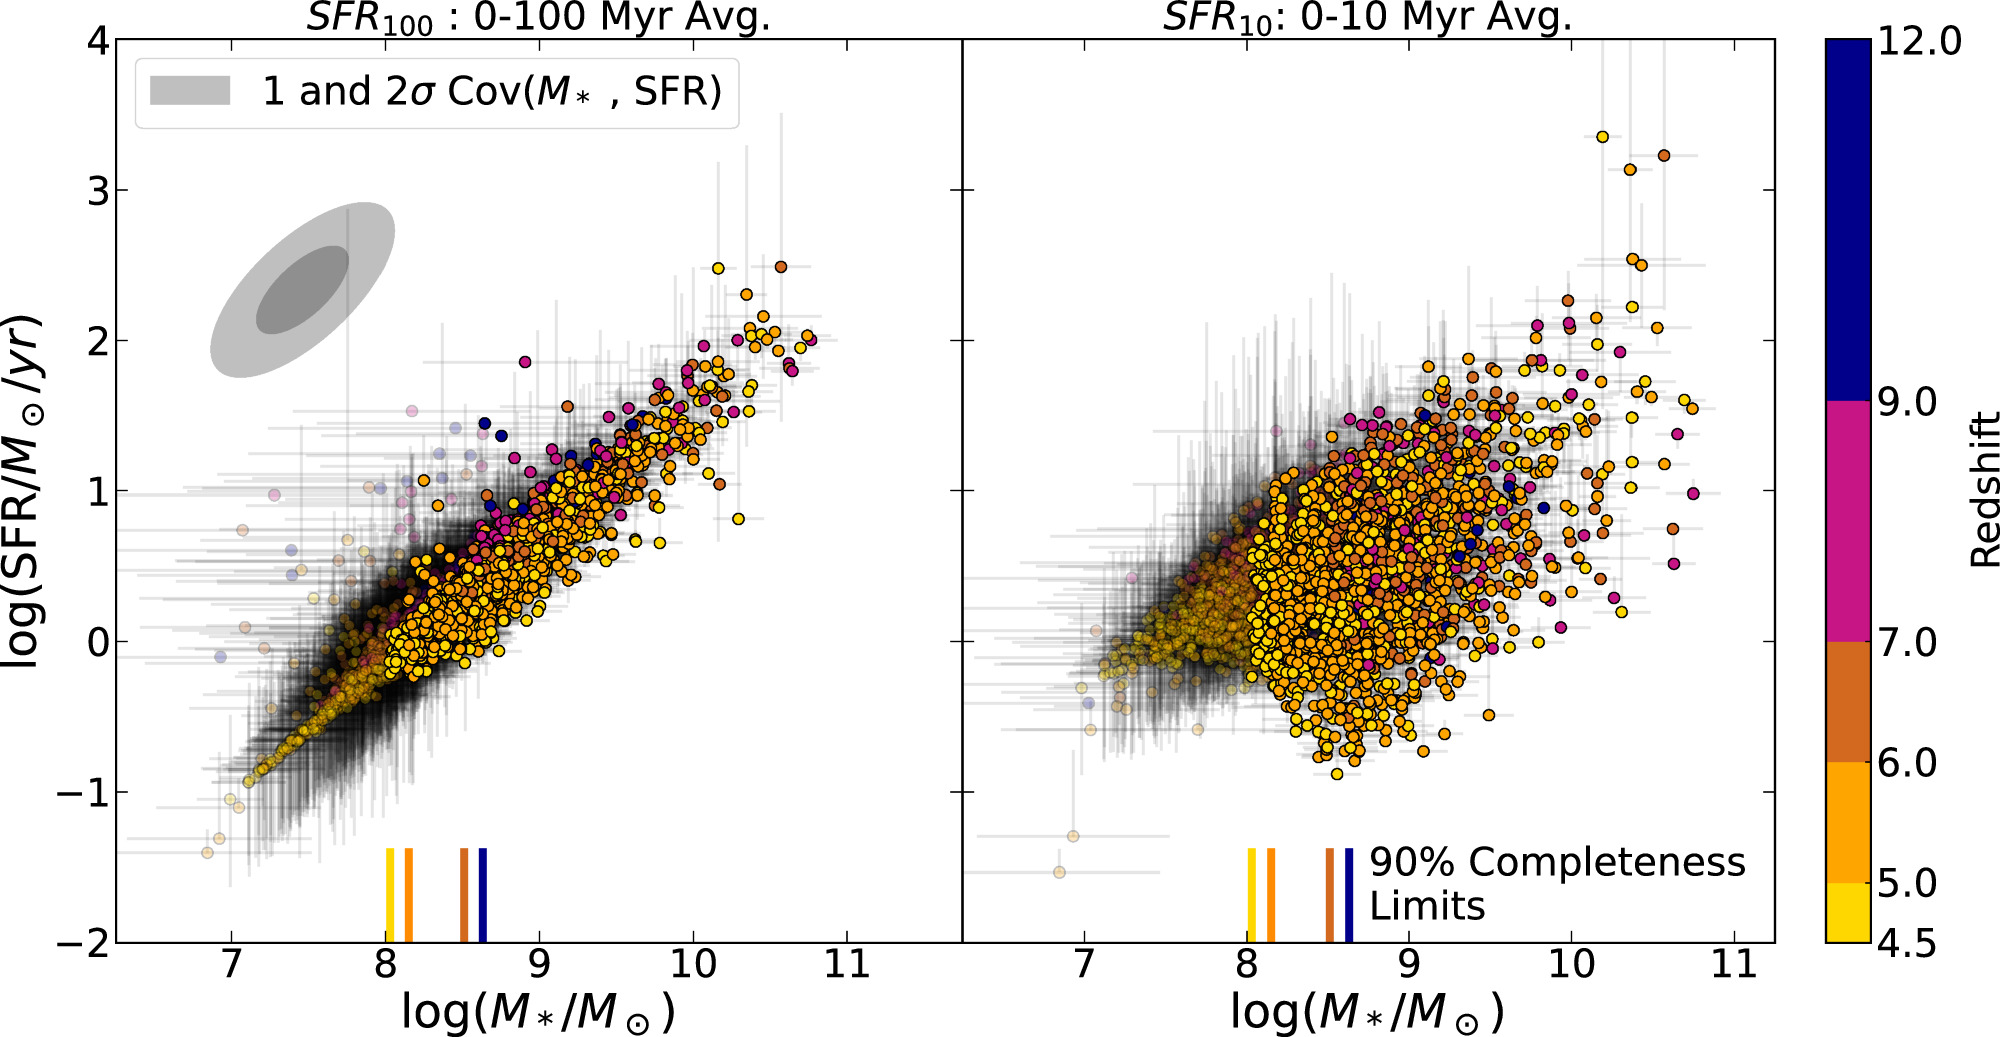
Figure 1: The left-hand panel shows a long-term star formation rate (averaged over 100 million years) and the right-hand panel shows a shorter-term star formation rate (averaged over 10 million years). You can see that the right-hand panel has a lot more scatter than the left. [Cole et al. 2025]
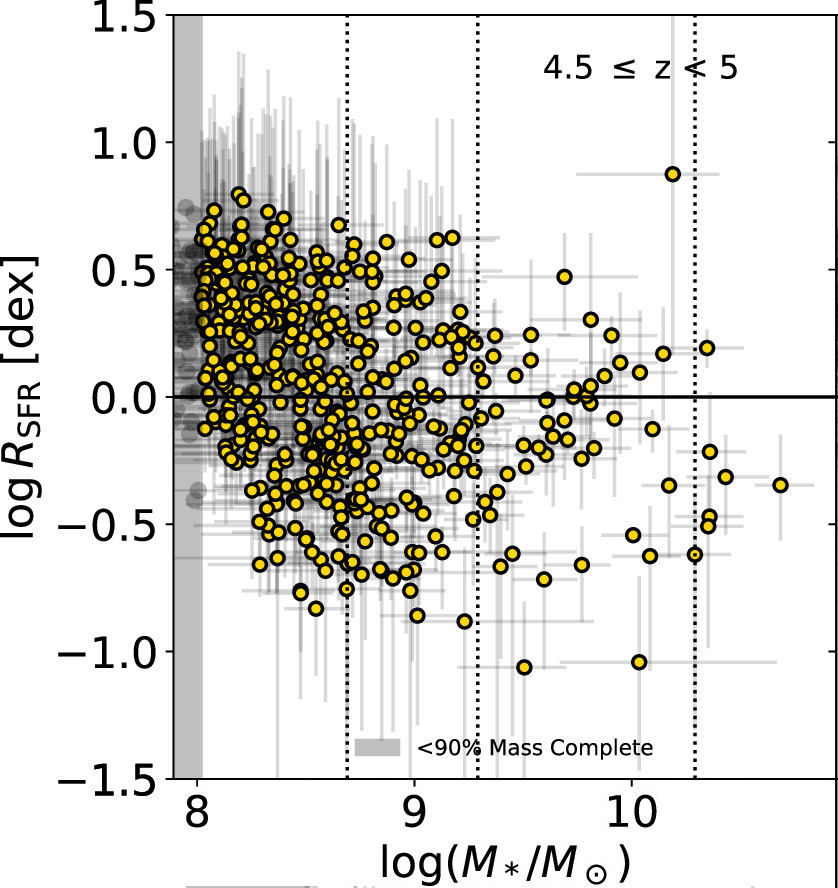
Figure 2: Higher-mass (x-axis) galaxies have a lower short-term star formation rate as compared to their long-term star formation rate, suggesting that higher-mass galaxies have shorter periods of activity. Click to enlarge. [Adapted from Cole et al. 2025]
The results of today’s article give us an exciting insight into the early stages of galaxy evolution and will help us to model these newly observed baby galaxies. There are still lots of open questions regarding why star-formation histories seem to be so different in the early universe, so stay tuned as astronomers learn more about galaxy evolution!
Original astrobite edited by Will Golay.
About the author, Nathalie Korhonen Cuestas:
Nathalie Korhonen Cuestas is a second-year PhD student at Northwestern University, where her research focuses on the chemical evolution of galaxies.
The post Baby Galaxies Love to Take 100-Million-Year Naps appeared first on AAS Nova.
]]>
Are you considering submitting a paper to an AAS journal? There's a new tool available now to help you prepare your manuscript.
The post AAS Publishing News: A New AASTeX Has Dropped! appeared first on AAS Nova.
]]>Are you an astronomer considering submitting a manuscript to an AAS journal (i.e., AJ, ApJ, ApJ Letters, ApJ Supplements, or PSJ)? If so, this post is for you! Read on to find out about the exciting new things you can do with the AAS’s newest LaTeX class file, available for download now.
Why the Update?
AAS publishing has maintained a consistent class file for LaTeX manuscript preparation for nearly two decades. But academic publishing continues to change rapidly! As the AAS has added new publishing capabilities based on the recommendations of the Journals Task Force and the needs and requests of AAS authors, the class file that authors use to prepare their manuscripts has also needed to change. The newest version of AASTeX, v7.0, is built entirely from scratch and will accommodate a variety of new features to make preparing manuscripts for publication a simpler process.
What’s New in AASTeX 7.0?
There are many exciting new features and capabilities in AASTeX 7.0. Here are four of the biggest changes:
- New metadata components in the \author command
Want more freedom in how you express your name on your manuscript? In addition to linking to your ORCID profile, authors can now specify surnames (family or last names), given names (personal or first names), and suffixes while still expressing their full names as they want in the compiled PDF. - Changes in how the \email command works
Starting soon, submitters will need to provide email addresses for all authors on a manuscript. In AASTeX v7.0, it’s now easy to include these within each author block with the \email command. A new error message will alert you when emails are missing. - A new .bst file for inline citation changes and titles in PSJ
AAS journals have made two recent style changes to how citations appear in articles: inline citations now include first initials (e.g., “G. Smith et al. (2022)”) in all AAS journals, and article titles have been added to references in Planetary Science Journal articles. The .bst file in AASTeX v7.0 reproduces these style changes. - A new environment command for specifying author contributions

A sample author contribution section generated using AASTeX v7.0.
Wish you had a way to briefly explain the individual contributions of your manuscript’s authors? There’s a new feature for that, and you’re encouraged to use it to make sure your coauthors get the credit they deserve. Like the acknowledgments environment, this environment is anonymized when dual anonymous review is used. And don’t worry, this section won’t be included in your word count!


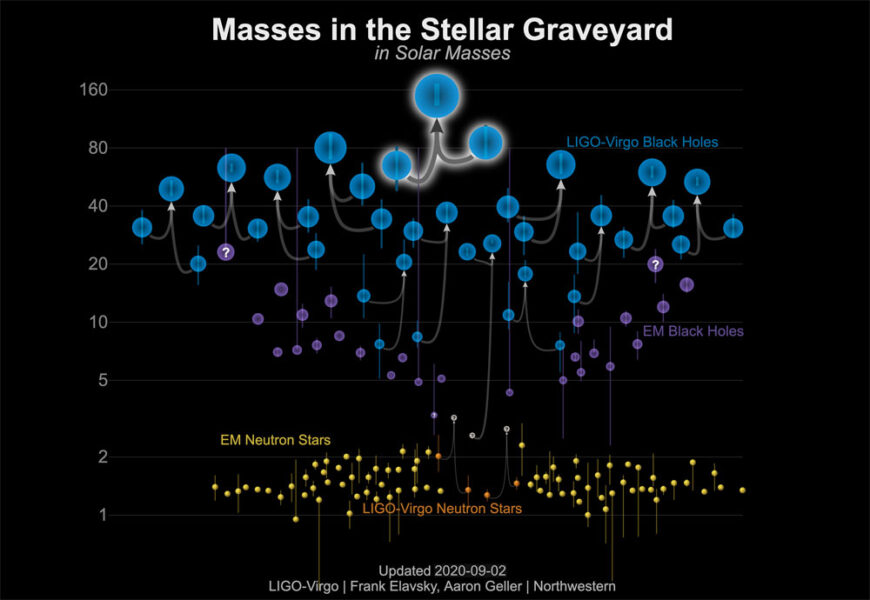


Where Can You Get More Information?
Wishing for Still More Improvements?
The AAS publishing team would love your input! You can contact them at aastex-help@aas.org with additional suggestions or ideas for the next iteration of AASTeX.
The post AAS Publishing News: A New AASTeX Has Dropped! appeared first on AAS Nova.
]]>
What caused this strange red transient that's too bright to be a nova and too faint to be a typical supernova?
The post Between a Nova and a Supernova: The Case of AT 2019abn appeared first on AAS Nova.
]]>
This composite image combines X-ray data from the Chandra X-ray Observatory and optical data from the Hubble Space Telescope to create this unique view of the galaxy Messier 51, home to the transient AT 2019abn. [X-ray: NASA/CXC/Wesleyan Univ./R.Kilgard, et al; Optical: NASA/STScI]
What Caused AT 2019abn?
Across the universe, cosmic mysteries are afoot. Collisions, explosions, flares, and other phenomena are sending transient signals into space, and new surveys are detecting more of these fleeting events than ever before. Many of these transients are easily identified, their brightness, color, and evolution neatly matching expectations for known types of events.
Others are not so readily classified, like intermediate-luminosity red transients, or ILRTs. ILRTs are red in color and lie between novae and supernovae in peak brightness. While ILRTs span a broad category of events that might have many different causes, today’s article focuses on the small but growing group of ILRTs that contains AT 2019abn, which was spotted in the galaxy Messier 51 in January 2019.

Spectrum of AT 2019abn (black) compared to the spectra of several classes of polycyclic aromatic hydrocarbons (PAHs) as well as other transient events. NGC 300 2008-OT is a prototypical red transient belonging to the same group of ILRTs as AT 2019abn. Click to enlarge. [Rose et al. 2025]
Assembling the Clues
To learn more about the origins of this class of transients, a team led by Sam Rose (California Institute of Technology) analyzed JWST spectra of AT 2019abn taken nearly four years after the transient was discovered. The spectra show features that likely come from a class of large molecules called polycyclic aromatic hydrocarbons (PAHs). These features most closely resemble those from class C PAHs, which are relatively rare and appear only in carbon-rich environments.
Rose’s team also tracked AT 2019abn’s brightness in the years after it hit its peak. At the time of the JWST observations reported in this article, the source was still brighter than it was before its 2019 outburst. However, more recent observations show that the source has now faded below the brightness of its progenitor, indicating that the star may have been destroyed in the outburst.
Possible Identification

Luminosity of AT 2019abn and two other similar ILRTs. The horizontal lines show the pre-outburst luminosity of each system. Click to enlarge. [Rose et al. 2025]
These low-luminosity supernovae are thought to arise from super-asymptotic giant branch stars that are less massive than the progenitors of core-collapse supernovae. After these stars cease their core nuclear fusion — ending with an oxygen-neon-magnesium core rather than an iron core like a core-collapse supernova progenitor — their cores are fortified by electron degeneracy pressure. When atomic nuclei in the core capture some of these electrons, the core collapses, triggering a supernova that destroys the star. This premise is compatible with AT 2019abn’s progenitor mass and could create the carbon-rich environment necessary to craft class C PAHs.
The stellar merger and stellar eruption hypotheses both run into trouble in terms of AT 2019abn’s progenitor mass and the presence of class C PAHs. However, there’s enough uncertainty in the details of these scenarios that they can’t be ruled out fully. The final necessary clue to this mystery is confirmation of the fate of the progenitor star. If future long-wavelength observations detect a surviving dust-shrouded progenitor, that would rule in favor of the stellar merger or stellar eruption scenarios, leaving astronomers puzzling over how to create a cohesive picture out of the mismatched clues. If no surviving progenitor is found, the evidence paints a clear portrait of an electron-capture supernova.
Citation
“Investigating the Electron-Capture Supernova Candidate AT 2019abn with JWST Spectroscopy,” Sam Rose et al 2025 ApJL 980 L14. doi:10.3847/2041-8213/adad61
The post Between a Nova and a Supernova: The Case of AT 2019abn appeared first on AAS Nova.
]]>
A newly investigated ultra-massive white dwarf may provide the best opportunity to study the interior of a white dwarf through its pulsations.
The post Record-Breaking Pulsating White Dwarf Discovered appeared first on AAS Nova.
]]>Researchers have discovered the most richly pulsating ultra-massive white dwarf to date — a crystallized stellar remnant that vibrates with 19 distinct modes. This discovery paves the way for future studies of the white dwarf’s interior structure and composition.
Stellar Remnants in the Instability Strip
The tiny white dwarf Sirius B hides in the glare of its larger and brighter companion, Sirius A. [NASA, ESA, H. Bond (STScI) and M. Barstow (University of Leicester)]
Observing a white dwarf’s pulsations allows researchers to peer inside the star, precisely measuring its mass and determining its composition and interior structure. These measurements are critical for understanding the origins of ultra-massive white dwarfs — those at least 10% more massive than the Sun. Ultra-massive white dwarfs might form through the evolution of the most massive white-dwarf progenitor stars, or they might be the result of a merger of two lower-mass white dwarfs.
A Search for Massive Pulsators
To date, researchers have detected pulsations from just a handful of ultra-massive white dwarfs. Of these known pulsators, only one, with eight pulsation modes detected, has provided data detailed enough to allow researchers to investigate the white dwarf’s interior. Francisco De Gerónimo (Astrophysics Institute of La Plata, Argentina) and collaborators aimed to increase those statistics with a search for pulsations in ultra-massive white dwarfs.
De Gerónimo and collaborators began their search with a list of more than 12,000 white dwarfs within 326 light-years of the Sun. To find ultra-massive white dwarfs that are likely to be pulsating, the team selected from this list white dwarfs that are at least as massive as the Sun and have temperatures that should place them in the instability strip.
Fuel for Future Findings
This article focuses on one white dwarf in the team’s sample, WD J0135+5722, which De Gerónimo and coauthors observed with the 10.4-meter Gran Telescopio Canarias and the 3.5-meter Astrophysical Research Consortium telescope at Apache Point Observatory. Applying Fourier transforms to the hours of observations, the team extracted the periods and amplitudes of the white dwarf’s pulsations.

Fourier transform of WD J0135+572’s light curve from the Gran Telescopio Canarias. Click to enlarge. [De Gerónimo et al. 2025]
While that investigation is still pending future work, De Gerónimo’s team was able to estimate the white dwarf’s mass from the existing data. Since the composition of WD J0135+5722’s core is unknown, the team used several models to estimate the mass. If the white dwarf’s core is composed of oxygen and neon, as is expected for an ultra-massive white dwarf, its mass is 1.118 solar masses. If instead the core is carbon and oxygen — possible, but less likely — its mass is larger, 1.135 solar masses. Be on the lookout for more information about this pulsating white dwarf in the future!
Citation
“Discovery of the Richest Pulsating Ultramassive White Dwarf,” Francisco C. De Gerónimo et al 2025 ApJL 980 L9. doi:10.3847/2041-8213/adad73
The post Record-Breaking Pulsating White Dwarf Discovered appeared first on AAS Nova.
]]>
New research investigates the infrared echo from a star being ripped apart in a dusty accretion disk around a supermassive black hole.
The post Echoes of a Tidal Disruption Event appeared first on AAS Nova.
]]>What happens when a star is ripped apart within the accretion disk of an active black hole? New research probes the infrared echo from one of the first known events of this kind to learn more.
Feeding Habits of Black Holes
The centers of galaxies are hubs of activity, and in many galaxies, it’s mealtime. A galaxy’s central supermassive black hole can feast on a disk of dust and gas that persists for tens to hundreds of thousands of years, creating a luminous and variable active galactic nucleus.
On shorter timescales — more of a galactic snack — there are tidal disruption events, which occur when a star ventures too close to a supermassive black hole and is summarily torn apart by the black hole’s titanic tidal forces.
In the past decade, it’s become clear that these events aren’t mutually exclusive, and a black hole might snack on a star while dining on a disk. What does it look like when a tidal disruption event happens in the accretion disk of an active galactic nucleus?
Dusty Disk and Shredded Star
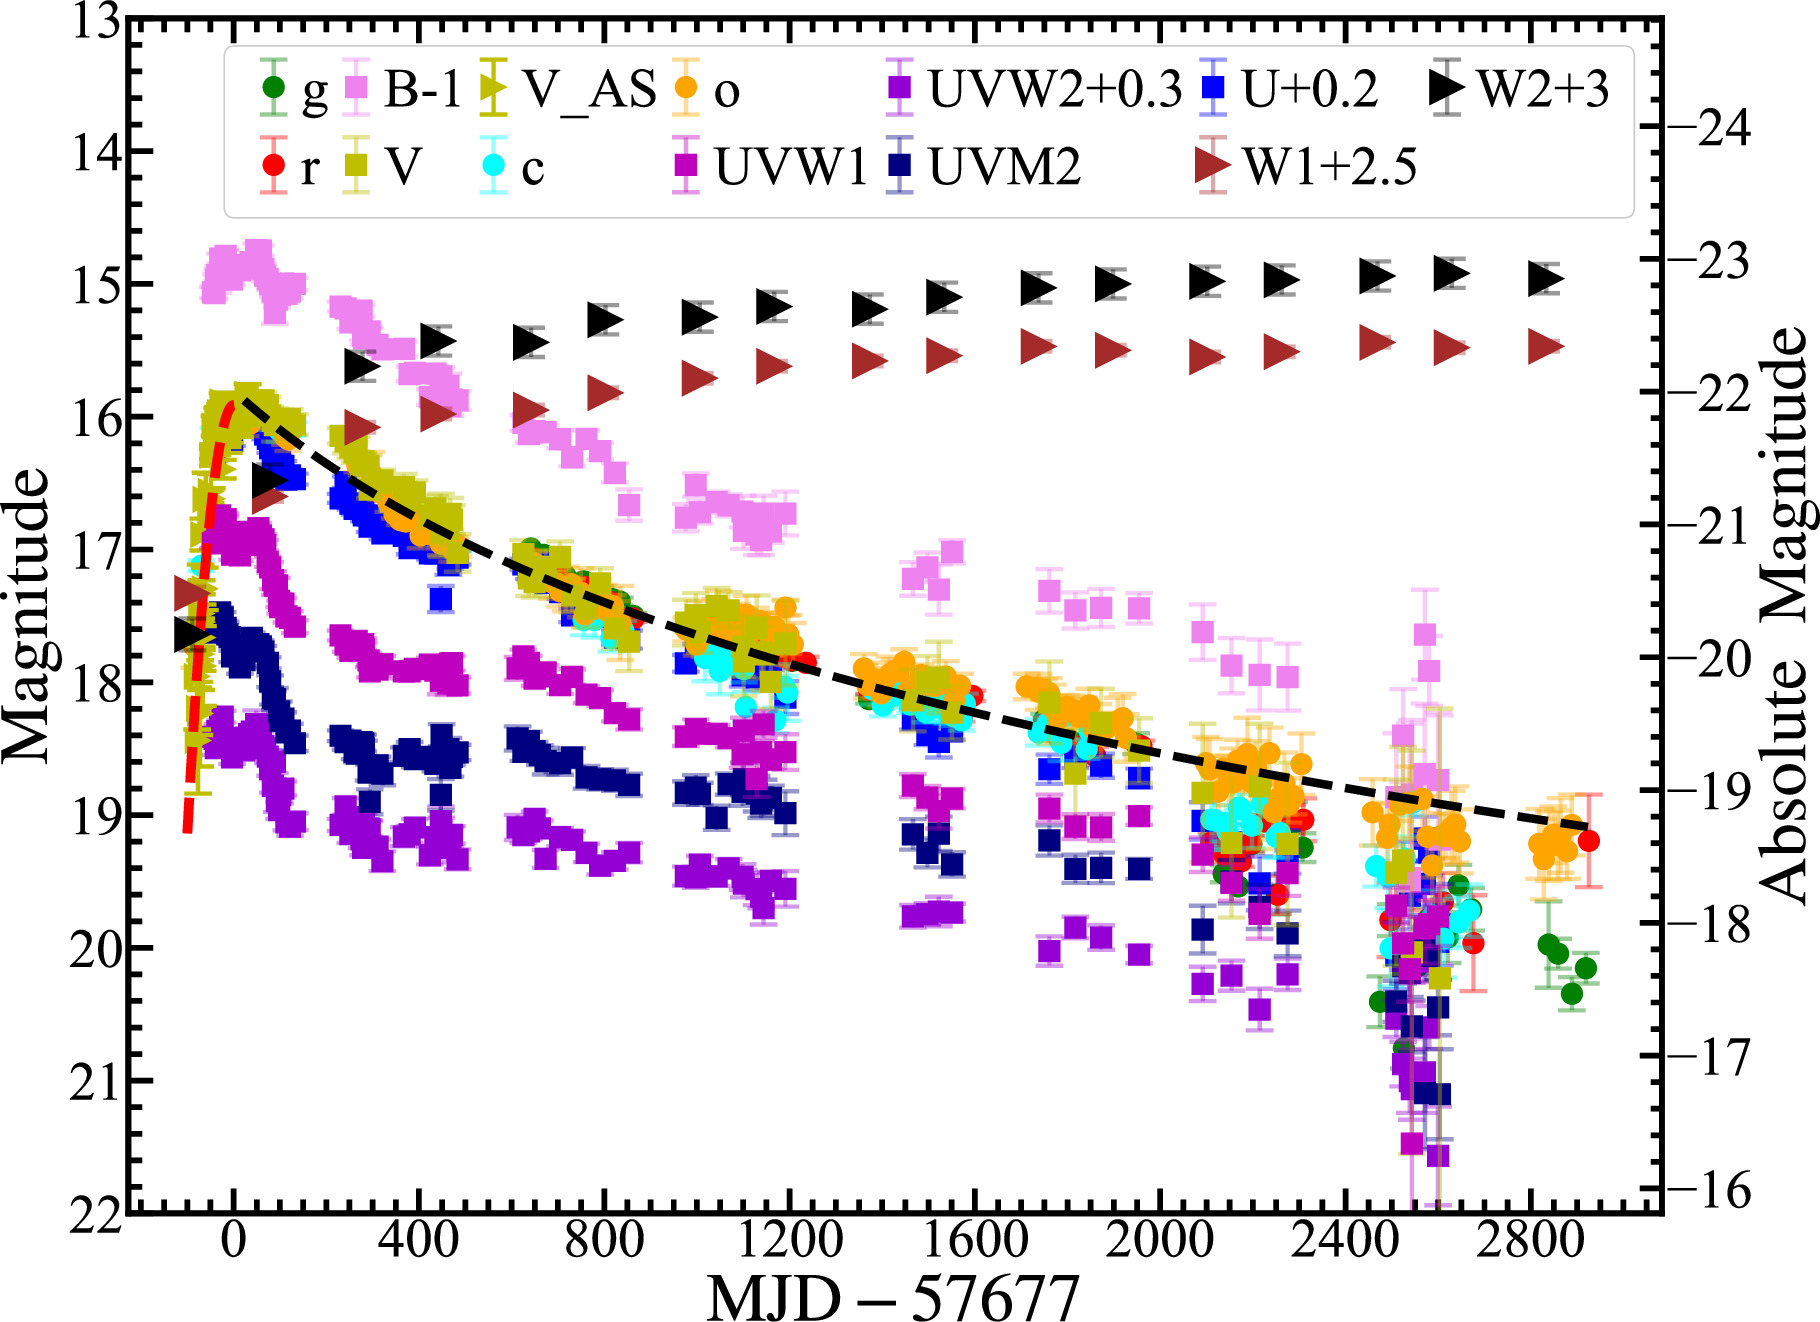
Multi-wavelength light curves of PS16dtm. The infrared behavior (triangles) is significantly different from the optical and ultraviolet behavior (squares and circles). Click to enlarge. [Jiang et al. 2025]
These data show that the ultraviolet and optical emission from the event rocketed to peak brightness in a matter of weeks before declining more gradually over the course of multiple years. The infrared emission behaved differently, rising more slowly and remaining high rather than falling. This persistently bright infrared emission is not a universal feature of tidal disruption events and instead appears to be a unique feature of tidal disruption events in active galactic nucleus disks.
Torus Insights
Why does the infrared emission behave so differently from other wavelengths? The answer lies beyond the accretion disk of the active galactic nucleus, in a vast dusty torus that surrounds the system. As light from the disrupted star reaches the torus, the dusty gas absorbs the light and re-emits it in the infrared, creating an infrared “echo” of the tidal disruption event.
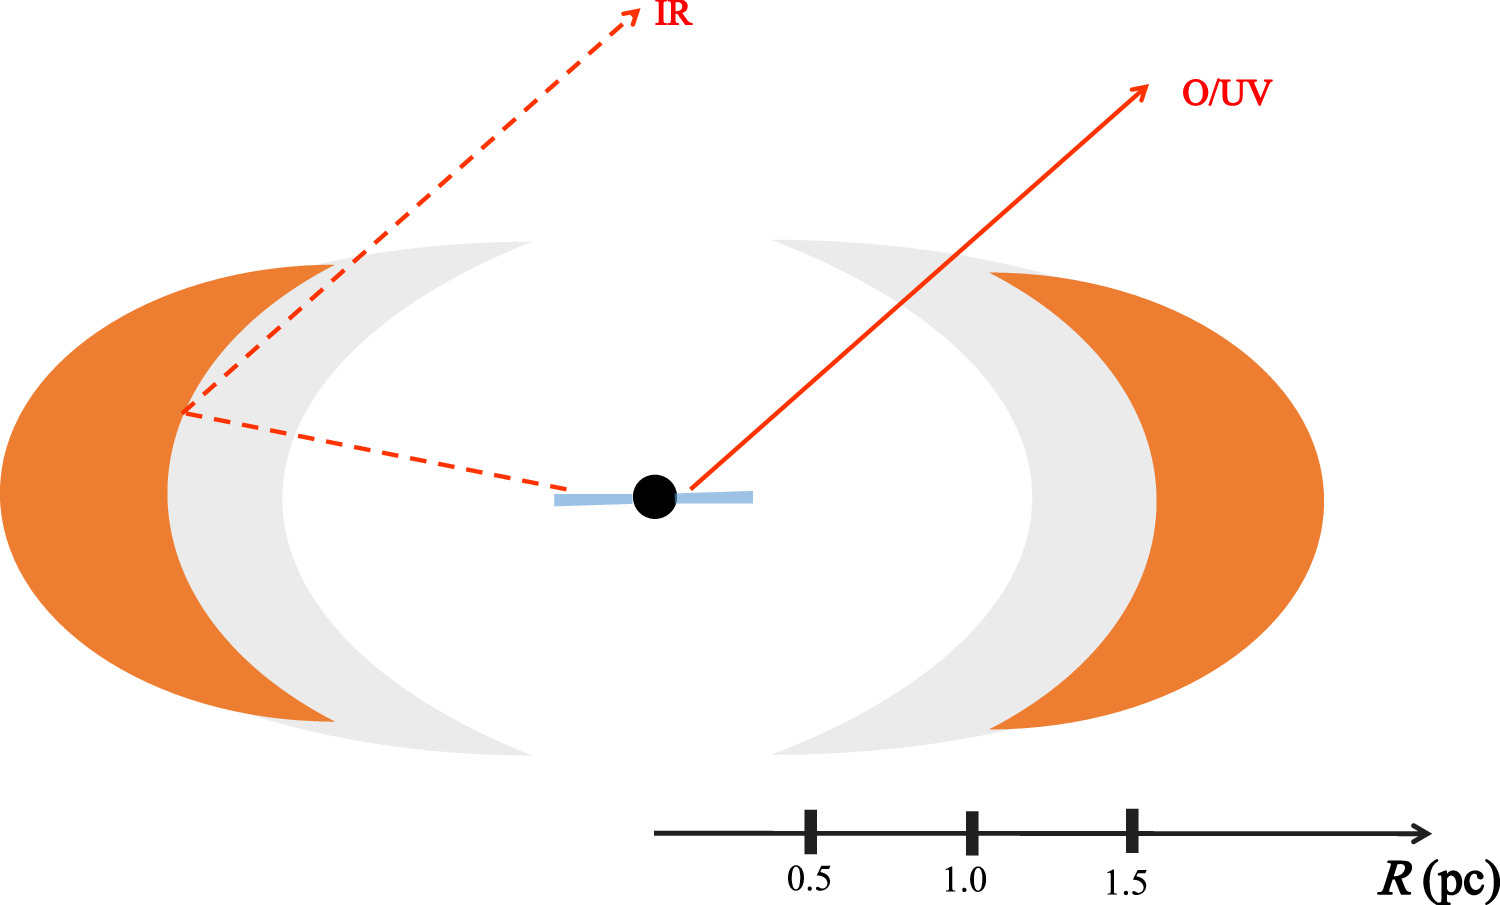
A schematic of the black hole, accretion disk, and dusty torus. The gray area shows the portion of the torus that may have been evaporated due to the tidal disruption event. The black hole and accretion disk are not to scale; if they were to scale, they would be too small to be visible in this diagram. [Jiang et al. 2025]
For now, observing this dusty torus directly is out of reach, as it is too faint and too small to be captured by existing facilities. Jiang and coauthors speculated that GRAVITY+, an upgrade to the existing GRAVITY instrument on the Very Large Telescope, may be able to observe the torus directly. In the meantime, upcoming surveys like the Vera C. Rubin Observatory Legacy Survey of Space and Time will discover hundreds to thousands more tidal disruption events, giving researchers a glimpse into the intricacies of stellar disruption.
Citation
“The Extraordinary Long-Lasting Infrared Echo of PS16dtm Reveals an Extremely Energetic Nuclear Outburst,” Ning Jiang et al 2025 ApJL 980 L17. doi:10.3847/2041-8213/adaeb9
The post Echoes of a Tidal Disruption Event appeared first on AAS Nova.
]]>
Astrobites reports on whether green pea galaxies are the local counterparts of the famous little red dots that are found in the early universe.
The post A Little Red Dot by Any Other Name Would Smell Just like a Green Pea!? appeared first on AAS Nova.
]]>Editor’s Note: Astrobites is a graduate-student-run organization that digests astrophysical literature for undergraduate students. As part of the partnership between the AAS and astrobites, we occasionally repost astrobites content here at AAS Nova. We hope you enjoy this post from astrobites; the original can be viewed at astrobites.org.
Title: Discovery of Local Analogs to JWST’s Little Red Dots
Authors: Ruqiu Lin et al.
First Author’s Institution: Shanghai Astronomical Observatory
Status: Published in ApJL
The universe is home to many fascinating objects! In today’s bite, let’s take a closer look at two of them:
Little red dots: These compact red galaxies are peppered throughout the early universe (as seen in JWST images), and evidence suggests that each little red dot hosts an active black hole (active galactic nucleus) at its center. This raises essential questions about how black holes got so huge in a very short time since the formation of the universe. You can read more about little red dots here and here.
Green pea galaxies: These are small and green (resembling peas!) and are found in the nearby universe (0.1 < z < 0.4). They appear green because a large fraction of light from these galaxies originates from bright, glowing gas clouds that emit light at specific wavelengths (such as emission from [O III], which falls in the part of the electromagnetic spectrum that corresponds to green color) rather than the broad spectrum of light and continuous colors emitted by stars in other galaxies. The presence of broad emission lines in the spectrum of green peas suggests that these galaxies could also host an active galactic nucleus. Interestingly, green peas were first discovered in 2007 by citizen scientists through the Galaxy Zoo project.
Wait, Are These the Same Thing?
The similarities between little red dots and green pea galaxies suggest that green peas could be early-universe little red dots that evolved with little change and survived to the present-day universe. The authors of today’s article set out to explore this possibility. A good approach is to list the characteristics of little red dots and determine whether green peas share those same traits. The authors start with a large sample of around 2,000 green pea galaxies and then systematically select the galaxies that have the closest resemblance to little red dots.
What Are the Defining Characteristics of Little Red Dots?
- They have broad H-alpha lines. One of the characteristic features of little red dots is the presence of broad hydrogen lines, which indicates that they host an active galactic nucleus. Thus, only the green peas with signatures of broad lines (full width at half-maximum of the emission line is greater than 1,000 km/s) were selected, narrowing the list down to 19 green peas with broad H-alpha lines.
- They are little! If the name wasn’t clear enough, little red dots have compact sizes. Fourteen out of the 19 broad-line green peas were compact, with the radius of the image being less than 2.5 arcseconds, which is similar to the size of little red dots.
- They have “V”-shaped spectral energy distributions. Perhaps the most defining feature of little red dots is that they have a spectral energy distribution that looks like a “V,” with a sharp rise in the ultraviolet part of the spectral energy distribution, which gradually slopes downwards and then rises steeply again in the infrared. While the increase in the infrared can be attributed to dust reddening, the ultraviolet spike is still poorly understood. Nevertheless, seeing that this is the defining characteristic of little red dots, the authors only select compact, broad-line green peas that have similar (based on the calculated slopes from little red dots) V-shaped spectral energy distributions, using ultraviolet data from the Galaxy Evolution Explorer survey and optical data from the Sloan Digital Sky Survey (Figure 1).
Figure 1: The ultraviolet–optical spectrum of a little red dot plotted in red with the spectrum of a green pea candidate overplotted in green to show the similarities between the two spectra. The broad H-alpha feature can be noticed in both spectra at around 6564 Å. The rising continuum in the ultraviolet for the little red dot spectrum is visible here, which is also seen in the green pea spectrum (indicated by the green dots). [Adapted from Lin et al. 2025]
Figure 2: A plot showing the stellar mass of the galaxy on the x-axis with the black hole mass on the y-axis. The various black lines are the expected masses from scaling relations. The little red dots (red diamonds, crosses, and triangles) and green peas (green stars, with the broad-line green peas with V-shaped spectral energy distributions highlighted with the blue box) have higher black hole masses than expected. [Lin et al. 2025]
Original astrobite edited by Erica Sawczynec.
About the author, Archana Aravindan:
I am a PhD candidate at the University of California, Riverside, where I study black hole activity in small galaxies. When I am not looking through some incredible telescopes, you can usually find me reading, thinking about policy, or learning a cool language!
The post A Little Red Dot by Any Other Name Would Smell Just like a Green Pea!? appeared first on AAS Nova.
]]>
Researchers explore the use of machine-learning techniques for classifying maria, cryptomaria, and plains regions on the surface of the Moon.
The post Featured Image: How Do You Solve a Problem like (Lunar) Maria? appeared first on AAS Nova.
]]>An increasingly large fleet of robotic explorers is flying by, orbiting, landing upon, and crawling around on the planetary bodies of our solar system, radioing home increasing amounts of data that often require labor-intensive analysis. Luckily, machine learning may be able to help researchers handle growing data demands. To explore how machine learning can assist planetary scientists, a team led by Frank Chuang (Planetary Science Institute) applied machine-learning techniques to the challenge of classifying surface materials on the Moon. Their goal was to differentiate between three types of surface materials: maria (dark areas where lava has pooled and cooled in ancient craters), cryptomaria (buried maria), and light plains (brighter regions thought to have been deposited by impacts). They first used unsupervised machine learning to identify different types of surface regions. As shown in the left-hand image above, the unsupervised algorithm easily recognized large dark areas corresponding to lunar maria (shown in red), but it was less proficient at discerning between the lighter cryptomaria and plains. The right-hand image shows the results of the second step, in which the classes identified in the first step guided a supervised machine-learning investigation. Here, the algorithm found that within areas mapped as cryptomaria, there are speckles of maria still visible, a finding that Chuang’s team suggests could be evidence for spotty resurfacing of these ancient lava seas. To get more detail on the results of this machine-learning exploration of the lunar surface, be sure to check out the full research article linked below.
Citation
“Application of Machine Learning Techniques to Distinguish Between Mare, Cryptomare, and Light Plains in Central Lunar South Pole−Aitken Basin,” Frank C. Chuang et al 2025 Planet. Sci. J. 6 35. doi:10.3847/PSJ/ada4a6
The post Featured Image: How Do You Solve a Problem like (Lunar) Maria? appeared first on AAS Nova.
]]>
Clues within Earth's crust have led astronomers to discover how the solar system's path through the Local Bubble may have impacted the evolution of our planet's life.
The post Supernova Signatures on Life in the Local Bubble appeared first on AAS Nova.
]]>As the solar system travels through the Milky Way, our planet and the life it harbors are exposed to a variety of environments. A recent study suggests that a nearby supernova may have played a role in the evolution of life on Earth.
Map of the Local Bubble showing the locations of surrounding stellar associations. The solar system lies near the center of the Local Bubble, and the surrounding stellar associations hosted supernovae that blew up the bubble. Click to enlarge. [Modified from Nojiri et al 2025]
The Local Bubble
About 6 million years ago, the solar system wandered into a 1,000 light-year-wide void known as the Local Bubble. Winds from massive stars and ionizing radiation from an estimated 15 supernovae carved out this bubble over the last 15 million years. As the solar system traveled from the bubble’s edge to its current position in the center, at least nine of the bubble-sculpting supernovae exploded, showering the Earth with supernova byproducts and intense radiation.
Evidence of these past explosions is embedded within the Earth’s crust — radioactive isotopes formed only in supernovae have decayed over time in deep-sea sediments. Less conspicuous are the ways cosmic rays from supernovae may have impacted the Earth; high-energy charged particles rained into the solar system, exposing the planet and the life on it to powerful radiation. Studying the Local Bubble and tracing the history of supernova explosions within it will allow researchers to gauge how the local environment has impacted our planet and the life it harbors.
Modeling Nearby Supernovae and Cosmic Radiation
Starting with the decay rate of the deep-sea isotopes, scientists estimate peaks in radioactive iron deposits approximately 2–3 and 5–6 million years ago. Using this information and the recent mapping of stellar associations in the Local Bubble, Caitlyn Nojiri (University of California, Santa Cruz) and collaborators modeled the necessary supernova input to produce the level of radioactive material present on Earth. From their modeling, they estimate that the iron peak ~2.5 million years ago can be attributed to a single supernova explosion from either the Upper Centaurus Lupus or Tucana Horologium stellar associations. The iron peak 5–6 million years ago, the authors suggest, arises from the solar system passing through the enriched outer shell of the Local Bubble.
Cosmic-ray spectra (top panel) and the amount of cosmic radiation received at various depths on Earth (bottom panel) for the modeled supernova in the Upper Centaurus Lupus stellar association. Click to enlarge. [Modified from Nojiri et al 2025]
Impacts on Life
What does this cosmic-ray exposure mean for life on Earth? Though the exact effects of this radiation are not certain, biological studies have shown that radiation exposure can cause DNA to break, which can accelerate the rate at which genetic mutations and evolutionary changes occur. The authors note a prior study that showed the rate of virus diversification in Lake Tanganyika in Africa accelerated 2–3 million years ago. Though this cannot be definitively attributed to the supernova, the overlapping timeframes are suggestive of cosmic radiation playing a role in the evolution of life on our planet.
This study underscores the importance of considering cosmic radiation when it comes to understanding the environmental factors that drove biological evolution on Earth. Further studies must be performed in order to constrain the threshold at which this radiation goes from driving species diversification to becoming detrimental to life and its evolution. The Local Bubble has left imprints on the solar system and on Earth in ways that astronomers and biologists will continue to uncover.
Citation
“Life in the Bubble: How a Nearby Supernova Left Ephemeral Footprints on the Cosmic-Ray Spectrum and Indelible Imprints on Life,” Caitlyn Nojiri et al 2025 ApJL 979 L18. doi: 10.3847/2041-8213/ada27a
The post Supernova Signatures on Life in the Local Bubble appeared first on AAS Nova.
]]>
Clouds getting in the way of ground-based solar images? A new machine learning method can identify and remove clouds, revealing the hidden solar features underneath.
The post I Can See Clearly Now: A Deep Learning Method to Remove Clouds from Solar Images appeared first on AAS Nova.
]]>Even in the sunny spots where solar telescopes are stationed, clouds are a fact of life. Rejecting cloud-obscured solar images means losing a lot of data, but new machine-learning methods show that we don’t have to cast off cloudy images after all.
Contending with Clouds
The Richard B. Dunn Solar Telescope in Sunspot, New Mexico. Even this sunny site experiences clouds. [NSF/NSO/AURA; CC BY 4.0]
So far, existing methods of handling cloud-contaminated images fall short, either failing to remove the clouds fully or failing to reconstruct the obscured solar features underneath. Now, a study led by Zhenhong Shang (Kunming University of Science and Technology) has shown how a new machine learning method rescues clouded-out images of the Sun’s disk.
Machine Learning Method
The model developed by Shang’s team handles the two critical aspects of cloud removal: 1) identifying and characterizing cloudy images and 2) removing the clouds and recovering the features underneath.
Examples of (a) clear, (b) mildly cloudy, (c) moderately cloudy, and (d) severely cloudy images from various telescopes in the GONG network. [Shang et al. 2025]
For the second step of the procedure, Shang’s team used data from the Global Oscillation Network Group (GONG), six solar telescopes that maintain eyes on the Sun every hour of every day. The team selected mildly, moderately, and severely cloud-covered images from this dataset. To train the machine learning model to remove clouds, they used 760 pairs of clear and cloudy images from the GONG telescopes. When cloud cover is intermittent, these clear–cloudy pairs are constructed from images taken by the same telescope. When cloud cover is persistent, a cloudy image from one observatory is paired with a clear image from another observatory, taken just seconds later. This dataset was also augmented by resizing and rotating some of the images, making sure it can handle even more cloud-cover scenarios.
Examples of the model’s cloud-removal and feature-retrieval performance. This particular test used data from solar telescopes not in the GONG network. [Shang et al. 2025]
Clear Skies Ahead
After testing and validating their method against a separate set of GONG images, Shang’s team compared the model’s performance to that of existing methods. On nearly every quantitative and qualitative metric, the new machine learning method outperformed existing methods. The new method showed particular improvements in recovering details of the solar surface under dense cloud cover.
The team also demonstrated the method’s performance on data from other ground-based solar observatories, showing its generalizability and readiness to tackle the challenge of cloud removal.
Citation
“Cloud Removal in Full-Disk Solar Images Using Deep Learning,” Zhenhong Shang et al 2025 ApJS 276 56. doi:10.3847/1538-4365/ad93ca
The post I Can See Clearly Now: A Deep Learning Method to Remove Clouds from Solar Images appeared first on AAS Nova.
]]>
Astrobites reports on the complicated effects of black hole and stellar feedback in cosmological simulations.
The post Feeding CAMELS: An Exploration of Galactic Feedback Effects in Simulations appeared first on AAS Nova.
]]>Editor’s Note: Astrobites is a graduate-student-run organization that digests astrophysical literature for undergraduate students. As part of the partnership between the AAS and astrobites, we occasionally repost astrobites content here at AAS Nova. We hope you enjoy this post from astrobites; the original can be viewed at astrobites.org.
Title: Quantifying Baryonic Feedback on Warm-Hot Circumgalactic Medium in CAMELS Simulations
Authors: Isabel Medlock et al.
First Author’s Institution: Yale University
Status: Published in ApJ
Simulating the Universe
Galaxies are complex ecosystems with a wide variety of physical processes impacting how they form and evolve. Studying these processes is often quite difficult, in part because we can’t actually travel to galaxies and poke and prod at them to see what’s going on. So we have to turn to another handy tool in the astrophysicist’s toolkit: simulations. Cosmological hydrodynamic simulations can model how giant swaths of the universe have evolved since the universe’s early years, and take into account a wide range of processes ranging from dark matter structure formation to star formation to galaxy mergers. But because these simulations are so large and complex, there is a limit to how small of a scale can be resolved, and a lot of the activity falls into what we call “subgrid physics”: phenomena that occur on scales below a simulation’s resolution. Instead of modeling activity from foundational behavior, we have to approximate what impact the subgrid physics would have on the scales we can resolve. For example, instead of directly modeling how a molecular cloud collapses, we would say if a volume of gas reaches some critical density it automatically forms some amount of stars with some initial mass function. (If that sounds a bit hand-wavy, that’s because it is, but we gotta work with what we’ve got, and right now we don’t have the computing power to model all the scales of astrophysics at once.)
Some of the most important subgrid processes are stellar and black hole feedback. Stellar feedback refers to how star-related events like star formation and supernovae deposit energy into the interstellar medium, which can impact the galactic environment significantly, slowing down star formation and even ejecting material from the galaxy entirely. Black hole feedback (sometimes called active galactic nucleus or AGN feedback) comes from activity around the supermassive black holes found in the centers of practically every large galaxy. As material accretes around the black hole, the material can heat up or even be ejected at high velocities, causing large amounts of energy to be expelled into and around the host galaxy. Between stars and black holes, these feedback processes have a large impact, and without their inclusion in simulations the results look nothing like the universe as we observe it.
A Flock of Camels
There are many cosmological simulations widely used today, but comparing their differing feedback implementations can be difficult as other parameters (i.e., initial conditions, cosmological parameters, resolution and simulation volume) are varied. The simulations used in this work come from the Cosmology and Astrophysics with MachinE Learning Simulations (CAMELS) project, which provides a suite of model runs that change feedback parameters but keep everything else constant. CAMELS pulls feedback implementations from several simulations, but this work looks specifically at comparing the simulations SIMBA and IllustrisTNG. For each of these simulations, CAMELS identifies four parameters that drive feedback (two each for stellar and black hole processes) and provides a range of runs that span this parameter space. These parameters describe things like the mass loading and speed of winds, accretion rates, and energy and momentum flux.
SIMBA and IllustrisTNG are broadly similar in their feedback treatments, but they have a few key differences. To model stellar feedback, both codes heat and move around gas particles, but the means in which they calculate temperature gains and velocities are different. Both simulations have two modes of AGN feedback: one associated with low accretion rates around the black hole, and the other associated with high accretion rates. For IllustrisTNG, when accretion rates are high the feedback is all thermal, heating nearby gas particles. At lower accretion rates, the feedback is more kinetic, where particles are ejected with energies set by the CAMELS black hole feedback parameters. In SIMBA, both AGN modes have some form of kinetic feedback, with high accretion rates corresponding to lower velocities.
This work compares how the different feedback treatments in CAMELS-SIMBA and CAMELS-IllustrisTNG impact black hole growth, feedback energies, and gas distribution in and around galaxies. The authors do this by comparing two different values: fCGM and the closure radius. The quantity fCGM provides a ratio of the mass found in the circumgalactic medium (the region surrounding a galaxy) relative to the total mass found in the halo. The closure radius takes a different approach, by looking at the physical scale at which the ratio between the mass of baryons (gas, stars, and black holes) and all the mass (including dark matter) is the same as the ratio for the universe as a whole. The measurement provides a way of determining the scale at which matter is associated with a given galaxy.
Some Feedback on the Feedback
Figure 1: Relationship between the halo mass and closure radius in different simulations run with varying stellar feedback strengths. Here, we can see the ability of SIMBA (purple) to disperse gas to a larger radius than IllustrisTNG (green). [Adapted from Medlock et al. 2025]
Figure 2: Relationship between the halo mass and energy coming from the thermal AGN mode in IllustrisTNG (left) and SIMBA (right). The different colors represent different strengths of stellar feedback, with purple being the lowest and orange the highest. Here we see how changing the stellar feedback parameters impacts the black hole feedback, with stronger stellar feedback corresponding to lower AGN energies in IllustrisTNG, but slightly higher energies in SIMBA. [Adapted from Medlock et al. 2025]
Original astrobite edited by Lucie Rowland.
About the author, Skylar Grayson:
Skylar Grayson is an Astrophysics PhD Candidate and NSF Graduate Research Fellow at Arizona State University. Her primary research focuses on active galactic nucleus feedback processes in cosmological simulations. She also works in astronomy education research, studying online learners in both undergraduate and free-choice environments. In her free time, Skylar keeps herself busy doing science communication on social media, playing drums and guitar, and crocheting!
The post Feeding CAMELS: An Exploration of Galactic Feedback Effects in Simulations appeared first on AAS Nova.
]]>
Will the asteroid 2024 YR4 crash into Earth in 2032? Maybe, but probably not. Today's Monthly Roundup looks at three studies that advance our understanding of asteroid redirection — just in case.
The post Monthly Roundup: Preparing for a Potential Impact appeared first on AAS Nova.
]]>
The final full image from DART, taken 2 seconds before the spacecraft crashed into the asteroid moonlet Dimorphos. [NASA/Johns Hopkins APL]
Could an impact from a spacecraft like DART actually nudge a hazardous asteroid onto a safer course? The timeliness of this question recently ratcheted up a notch: the probability of the asteroid 2024 YR4 striking Earth on 22 December 2032 has risen above 2%.
Discovery images of 2024 YR4. [ATLAS]
Subsurface Structure and Impact Outcomes
First up, a team led by Kaiyi Dai (Macau University of Science and Technology; Imperial College London) and Xi-Zi Luo (Macau University of Science and Technology) simulated the outcome of an impactor striking an asteroid at an angle, just as DART did, rather than head on. Their goal was to understand how the presence of boulders — like those expected to make up “rubble-pile” asteroids like Didymos and Dimorphos — affects the transfer of momentum from the impactor to the target asteroid. Specifically, the team used a three-dimensional shock physics code to explore the effect of different subsurface arrangements of boulders.
Momentum transfer efficiency as a function of the impact angle for different boulder configurations. Click to enlarge. [Adapted from Dai et al. 2024]
An impactor striking a rubble-pile asteroid doesn’t just dislodge material: it also melts some of it. The simulations showed that the amount of melted material, as well as whether the melted material remained on the surface or was ejected into space, varied substantially with the angle of the impact and the configuration of subsurface boulders. This suggests that the volume of melted material remaining on an asteroid’s surface could be used to discern the structure of the material beneath the surface.
Dai and Luo’s team noted that applying these simulation results to the outcome of the DART mission will require simulating a more realistic impactor, as the DART spacecraft’s shape and composition is more complicated than that of the spherical projectile used in these simulations.
Impact of Asteroid Strength and Porosity
Mallory DeCoster (Johns Hopkins University Applied Physics Laboratory) and collaborators also investigated the outcomes of high-velocity impacts on rubble-pile asteroids. The team focused on the effects of not only the boulders at the impact site, but also the “matrix material” of finer particles between the boulders. Because this matrix material effectively holds a rubble-pile asteroid together, the strength of the material plays a large role in determining the outcome of an impact.
Examples of matrix, large boulder, and small boulder configurations. Matrix material is shown as gray, the impactor is the small gray rectangle, and boulders are shown in different colors (the color of the boulder does not have any meaning). [Adapted from DeCoster et al. 2024]
DeCoster and collaborators placed boulders with diameters of 1–10 meters randomly within their simulated asteroids, filling 62% of each asteroid with boulders before topping off the rest of the volume with matrix material. The simulated asteroids were categorized as “matrix,” “large boulders,” and “small boulders” depending on the primary makeup of the impact site. The strength and porosity of the matrix material were varied between simulations.
The simulations showed that more porous matrix material resulted in larger impact craters, but this outcome was moderated by the distribution of boulders on and under the surface; for matrix-rich asteroids, the presence of weaker, more porous material boosted the crater width, while asteroids with many large or small boulders showed smaller differences in crater width with matrix strength and porosity. None of these factors particularly influenced the depth of the crater.
Matrix-rich asteroids tended to experience larger momentum transfer than boulder-rich asteroids, but this finding was complicated by certain boulder-rich simulations in which entire boulders were thrown into space, resulting in a large momentum transfer for those simulation runs. These results highlight the complex factors that determine how an asteroid responds to an impact.
Estimating Cratering on Dimorphos
The final of today’s three research articles focuses on simulations of the DART spacecraft impacting Dimorphos. After DART slammed into the asteroid, the Italian Space Agency’s Light Italian CubeSat for Imaging of Asteroids (LICIACube) surveyed the aftermath from a safe distance. LICIACube imaging showed fantastic sprays of ejecta and boulders tumbling through space, but the precise size of the crater excavated by DART’s impact is still unknown. That will change with the arrival of the European Space Agency’s Hera mission, which launched in October 2024. Upon reaching Dimorphos and Didymos in late 2026, Hera will assess the impact site and measure the size of the impact crater.
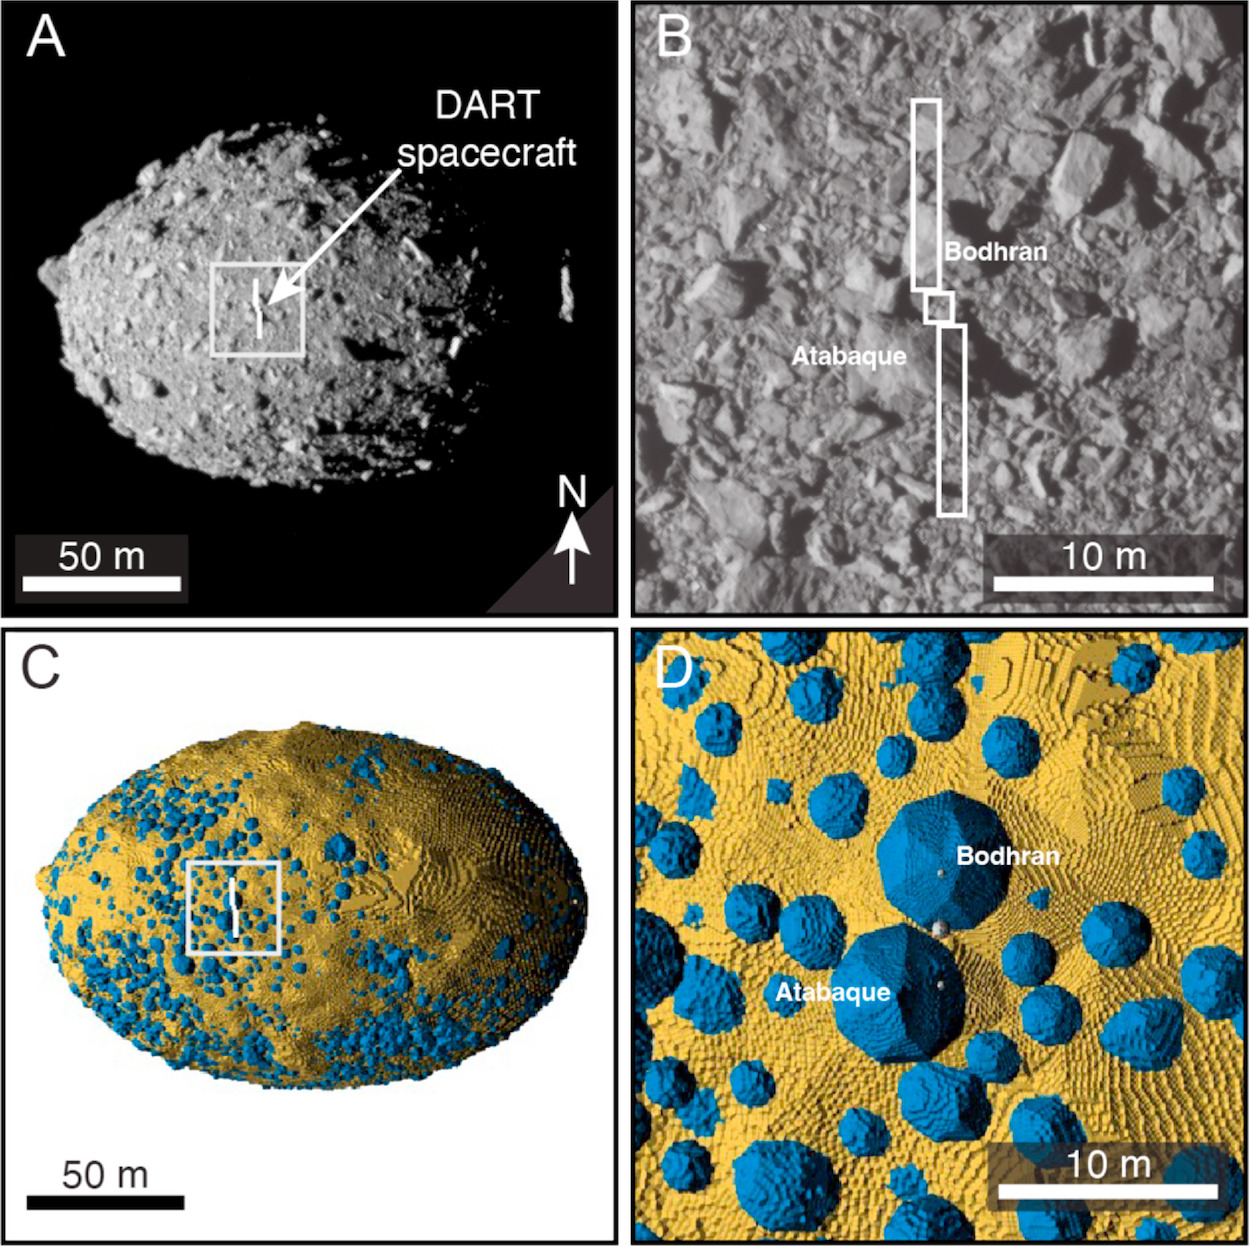
DART observations of Dimorphos before impact (panels a and b). Panels c and d show the rubble-pile target constructed to match the DART observations. Click to enlarge. [Stickle et al. 2025]
Stickle’s team modeled Dimorphos as a collection of boulders held together by matrix material, with the sizes and positions of the surface boulders determined from pre-impact photographs of the asteroid. The sizes of the subsurface boulders were drawn from the same size–frequency distribution as observed for the surface boulders, and these boulders were given random non-spherical shapes. The impactor was a DART-like conglomeration of three spheres, with the large central sphere representing the body of the spacecraft and two smaller, lower-mass side spheres representing the spacecraft’s solar panels.
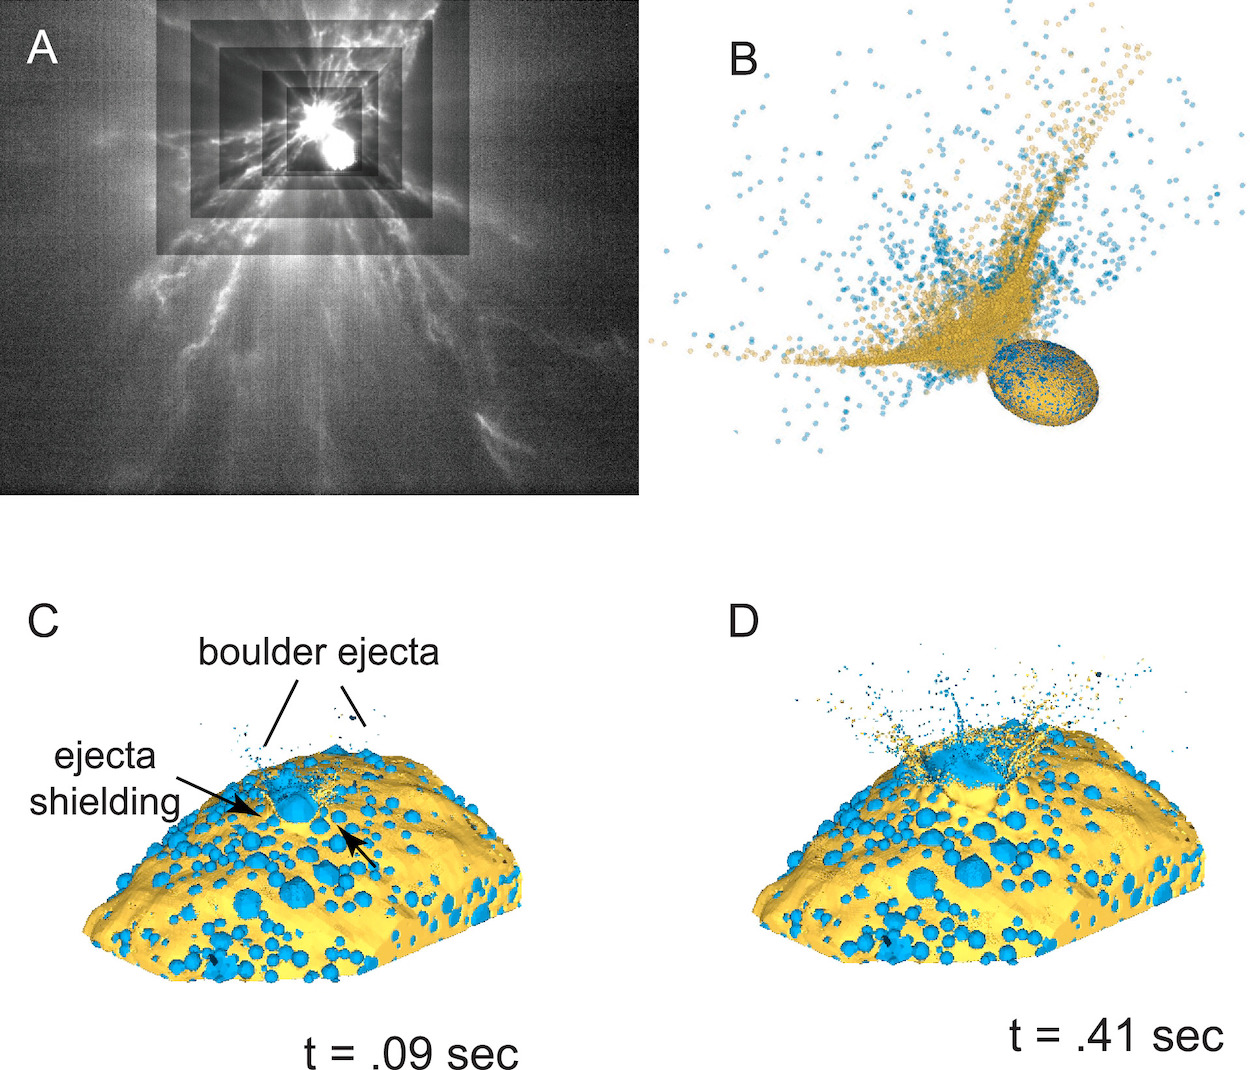
Comparison of LICIACube observations of ejecta rays (panel a) to simulated ejecta (panels b through d). Click to enlarge. [Stickle et al. 2025]
Estimated crater diameters ranged from 15 to 60 meters, with the likeliest size for Dimorphos being in the range of 40–60 meters. The team notes that this calculation is complicated, as crater sizes continue to evolve beyond the end of the simulations in a way that depends on the strength of the material and the gravity of the asteroid.
The upcoming measurements from the Hera mission will provide an important test of these model results, providing further information on the outcome of the DART mission and helping to advance our understanding of humanity’s ability to deflect hazardous asteroids.
Citation
“Impact Momentum Transfer — Insights from Numerical Simulation of Impacts on Large Boulders of Asteroids,” Kaiyi Dai et al 2024 Planet. Sci. J. 5 214. doi:10.3847/PSJ/ad72eb
“Statistical Analysis of Near-Surface Structure and Material Properties on Momentum Transfer in Rubble Pile Targets Impacted by Kinetic Impactors,” Mallory E. DeCoster et al 2024 Planet. Sci. J. 5 244. doi:10.3847/PSJ/ad7cff
“Dimorphos’s Material Properties and Estimates of Crater Size from the DART Impact,” Angela M. Stickle et al 2025 Planet. Sci. J. 6 38. doi:10.3847/PSJ/ad944d
The post Monthly Roundup: Preparing for a Potential Impact appeared first on AAS Nova.
]]>
The heart of the Orion Nebula, near the massive young stars of the Trapezium Cluster, is a dramatic place for a star to grow up. New research examines JWST images of an unusual protoplanetary disk in this exceptional setting.
The post An Icy Disk in the Orion Nebula appeared first on AAS Nova.
]]>Silhouetted against the background glow of the Orion Nebula, the protoplanetary disk 114–426 provides an excellent opportunity to study a site of planet formation. The discovery of water ice in this disk suggests that ice can survive in disks in the dense star cluster environments where most stars form.
Clues to Our Planetary Past
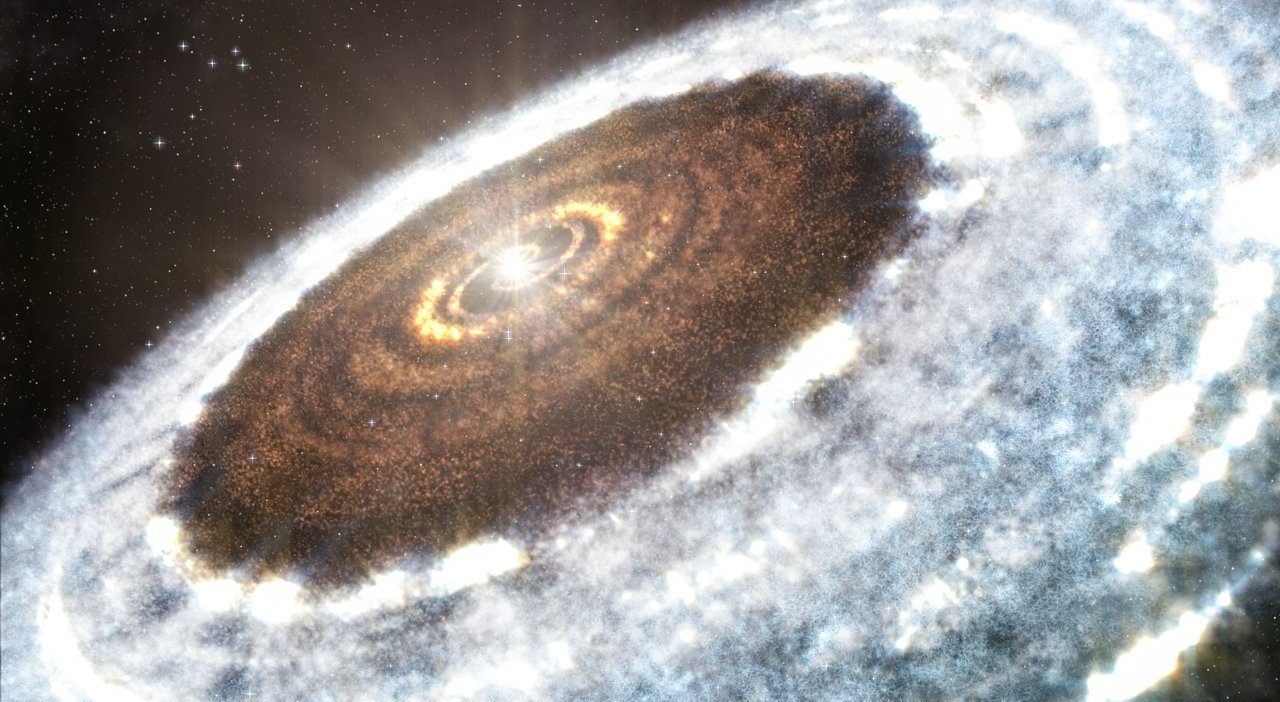
Artist’s impression of a protoplanetary disk around a young star. [A. Angelich (NRAO/AUI/NSF)/ALMA (ESO/NAOJ/NRAO); CC BY 4.0]
Protoplanetary disks — disks of gas and dust that encircle young stars and set the stage for planet formation — provide an opportunity to understand how our solar system may have formed. In today’s article, JWST provides a new perspective on an unusual protoplanetary disk.
A Disk’s Silhouette
The Orion Nebula is a prolific star-forming region that’s home to hundreds of young stars. At the nebula’s center is the Trapezium Cluster, a tight-knit grouping of massive stars that illuminates the surrounding nebula. Located near the Trapezium Cluster, the protoplanetary disk 114–426 (named according to its coordinates) is notable for both its size and its location. At more than 1,000 au across — about 25 times the distance from the Sun to Pluto — it’s one of the largest disks in the region. It’s also oriented edge-on from our perspective, showing off a narrow disk of gas and dust that is illuminated from behind by the bright glow of the Orion Nebula.
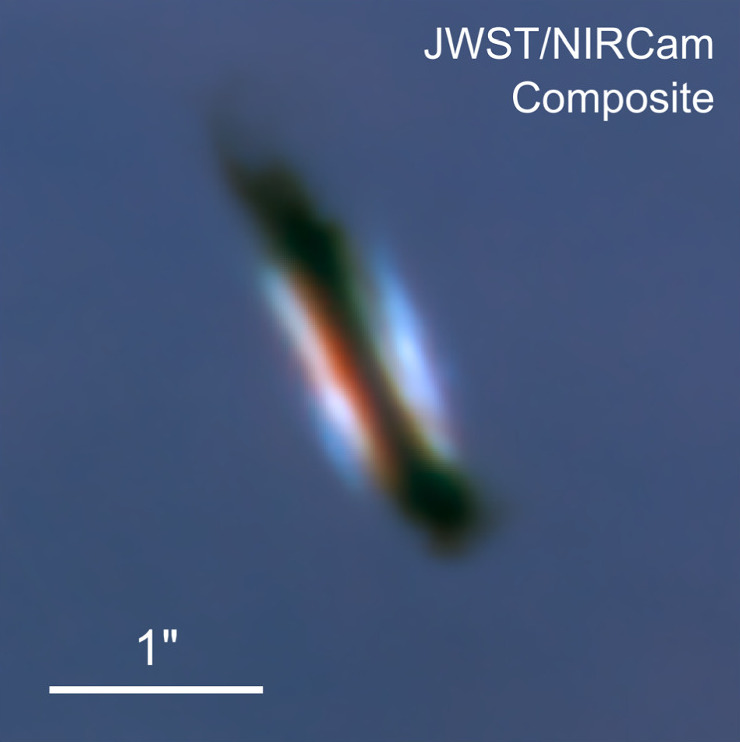
JWST image of the protoplanetary disk 114–426 in Orion. In this image, 1.15- and 1.40-micron light is blue, 1.62-micron light is green, 1.82-micron light is yellow-green, and 2.77-micron light is red. [Adapted from Ballering et al. 2025]
The JWST observations showcase 114–426’s edge-on, dusty disk and two bright lobes of scattered light from the hidden star at the disk’s center. The two lobes are asymmetrical, which previous research suggests means that the inner part of the disk is tilted. A tilted disk could mean that the hidden central star is actually a binary system, or that the star is orbited by a massive planet.
Icy Interpretation
Spectra from several locations in the disk. Each spectrum shows a dip at 3 microns, indicative of water ice. Click to enlarge. [Ballering et al. 2025]
The team estimated that about half an Earth mass of ice and dust is present in the areas of the disk that are backlit by the Orion Nebula. Given that this disk is subjected to intense ultraviolet radiation from the nearby Trapezium Cluster, it may seem surprising that water ice can survive there. However, the team’s calculations showed that the disk is far too cold for ice to sublimate, and the ultraviolet radiation from nearby stars isn’t sufficient to remove the ice from the surface of dust grains.
This finding suggests that water ice is likely to survive in disks around stars in cluster environments like this one. The fact that ice persists is important for planet formation, as ice helps dust grains clump together into pebbles and eventually planets. Ice may also play a role in the transport of water from the cold outer regions of disks to the temperate inner regions where habitable planets may reside.
Citation
“Water Ice in the Edge-On Orion Silhouette Disk 114–426 from JWST NIRCam Images,” Nicholas P. Ballering et al 2025 ApJ 979 110. doi:10.3847/1538-4357/ad9b7a
The post An Icy Disk in the Orion Nebula appeared first on AAS Nova.
]]>
Astrobites reports on how habitable exoplanets resembling Earth in its younger years might appear to the Habitable Worlds Observatory.
The post Life Is Like a Box of Potential Biosignatures appeared first on AAS Nova.
]]>Editor’s Note: Astrobites is a graduate-student-run organization that digests astrophysical literature for undergraduate students. As part of the partnership between the AAS and astrobites, we occasionally repost astrobites content here at AAS Nova. We hope you enjoy this post from astrobites; the original can be viewed at astrobites.org.
Title: The Detectability of CH4/CO2/CO and N2O Biosignatures Through Reflection Spectroscopy of Terrestrial Exoplanets
Authors: Armen Tokadjian, Renyu Hu, and Mario Damiano
First Author’s Institution: NASA’s Jet Propulsion Laboratory
Status: Published in AJ
Are we alone in the universe? This is one of the longest-standing questions ever asked by humankind. Though extraterrestrial life is discussed as a philosophical thought exercise, the NASA Astrophysics flagship mission of the 2040s, the Habitable Worlds Observatory (HWO), will get us closer than ever to the answer. This mission aims to detect signs of life on exoplanets. When active, the HWO will observe the atmospheres of Earth-like worlds to see if there are any particular molecules that could reveal past or present life. On Earth today, oxygen gas (O2) is a large component of our atmosphere and is considered a biosignature, since it is primarily produced as a byproduct of photosynthesis by living organisms. However, Earth’s atmosphere looked very different billions of years ago, when life had just begun to form. The authors of today’s article put forth theoretical models of how habitable exoplanets might appear to HWO using the molecules present in the Earth’s atmosphere from earlier eons, and test if HWO will be able to detect these molecules in simulated observations.
It’s Not Just a “Phase,” Mom, It’s an Eon
We all look different from the pictures from our youth, and Earth is no exception. And since life has been flourishing on Earth for billions of years, we can expect that any potentially life-harboring exoplanet may look like Earth from a different stage of its life. The authors of today’s article take two snapshots of Earth from two different phases, or eons, of its youth — but instead of revealing awkward braces and self-cut bangs, they are looking for the different molecules present in its early atmosphere. The first signs of life — microbes such as bacteria and archaea — emerged about 4 billion years ago during the Archean Eon. At this time, Earth’s atmospheric makeup was mostly nitrogen (N), carbon dioxide (CO2), and methane (CH4). Of these, CH4 is particularly interesting to astrobiologists because the primary source of CH4 during the Archean Eon was methanogenesis, a process that produces methane as a byproduct during microbial respiration, making CH4 a strong biosignature. However, abiotic processes like volcanism can produce CH4 as well. Therefore, the co-presence of CO has been suggested to distinguish the production mechanism of CH4, as volcanic activity typically produces more CO than CH4. A detection of CH4 in an atmosphere with a high CO to CH4 ratio should be considered a false positive of the CH4 biosignature as it is likely to have been produced abiotically.
In the following eon, the Proterozoic (2.5 billion to 541 million years ago), the atmospheric oxygen level began to rise, and the first eukaryotic organisms evolved. Microbes using the nitrogen cycle became the predominant producers of dinitrogen oxide (N2O), a compelling biosignature. Even more enticing is that N2O has few abiotic sources, unlike CH4. The authors of today’s article produced atmospheric models based on the biosignatures present in both the Archean and Proterozoic eons, and from those models tried to infer the presence of CH4/CO2/CO and N2O, respectively.
Earth as a Model
For both cases, the authors generated spectra using radiative transfer models, inputting parameters such as the cloud coverage, surface albedo (i.e., the fraction of light that a surface reflects), and the amount of the molecules of interest (specifically the number of a specific gas molecule divided by total number of molecules in a given volume). To model the Archean Earth atmosphere, the authors fix the amount of CH4 to be the upper limit of CH4 that could have been present in the Archean atmosphere, and they consider three different amounts of CO, corresponding to CO/CH4 ratios of 1, 5, and 10, respectively.
To model the Proterozoic Earth atmosphere, the authors consider two examples with different amounts of N2O. The first model corresponds to the upper limit of N2O for a Proterozoic Earth-like planet around a G-type star, and the second model corresponds to the same kind of planet, but around a K-type star instead. The K-type host star allows for much higher amounts of N2O in the planet’s atmosphere. This is because G-type stars are hotter and therefore have a higher ultraviolet flux, which causes the N2O in the atmosphere to photodissociate. These parameters are used in their radiative transfer model, which will produce a synthetic reflected light spectrum — i.e., the spectrum of light that is reflected off a cool exoplanet, which resembles what the HWO aims to observe.
Show Me the Biosignatures
To see if the authors can detect these molecules from these synthetic spectra, they employ an atmospheric retrieval code. In short, the synthetic reflection spectra generated by their radiative transfer model is sampled many, many times to see which one best fits the parameters of interest (most importantly, the presence of potential biosignatures). The planet-to-star flux ratio as a function of wavelength for the forward model with CO/CH4 = 10 along with the retrieval result for the Archean Earth atmosphere is shown in Figure 1. The authors find that they are able to detect CH4 and CO2 in the atmosphere, but they fail to constrain the CO abundance for any of the three cases. This is illustrated in Figure 1, where the CO features are relatively weak or located within a stronger CO2 feature. Because of this, it will be challenging to know if a potential detection is a false positive for the CH4/CO2 biosignature pair with similar observations.
Figure 1: Planet-to-star flux ratio versus wavelength for Archean Earth-like planets with CO/CH4 = 10. The model is shown by the red circles and the retrieval result is overlaid. Each molecule of interest is labeled in a separate color to show the individual molecular contributions. While CH4 and CO2 are well constrained by the retrieval, CO is not. [Tokadjian et al. 2024]
Figure 2: Same as Figure 1, but for the Proterozoic Earth-like planet around a K-type star. N2O is well constrained by the retrieval result. [Tokadjian et al. 2024]
Original astrobite edited by Kylee Carden.
About the author, Tori Bonidie:
I am a 4th-year PhD candidate studying exoplanets at the University of Pittsburgh. Prior to this, I earned my BA in astrophysics at Franklin and Marshall College, where I worked on pulsar detection as a member of NANOGrav. In my free time you can find me cooking, napping with my cat, or reading STEMinist romcoms!
The post Life Is Like a Box of Potential Biosignatures appeared first on AAS Nova.
]]>
A ring of bright "hotspots" adorns the remnant of the supernova SN 1987A. Now, researchers have analyzed two decades of Hubble Space Telescope observations to track the evolution of this ring.
The post Featured Image: Evolution of a Supernova Ring appeared first on AAS Nova.
]]>
The full series of Hubble images of SN 1987A. The logarithmic color scale shows the brightness relative to the brightest hot spot in the December 2009 image. The bright spot that stands out at the lower right in early images is a star unrelated to the supernova remnant. [Tegkelidis et al. 2024]
Citation
“Tracing the Propagation of Shocks in the Equatorial Ring of SN 1987A over Decades with the Hubble Space Telescope,” Christos Tegkelidis et al 2024 ApJ 976 164. doi:10.3847/1538-4357/ad812e
The post Featured Image: Evolution of a Supernova Ring appeared first on AAS Nova.
]]>
Across cosmic time, galaxies interact and merge with each other, causing disruptions in their behavior. Recent simulations explore the impacts interactions have on the star formation activity in interacting galaxies.
The post Interaction Reactions: How Galaxy Encounters Influence Star Formation appeared first on AAS Nova.
]]>Over the course of its lifetime, the Milky Way has encountered many other galaxies — from quick flybys to full on collisions, each interaction is important to our galaxy’s evolution. A series of simulations has predicted how galaxy interactions have contributed to star formation across the lifetimes of Milky Way–mass galaxies.
Merging Galaxies
As galaxies move through the universe, they interact and merge with other galaxies. Sometimes these interactions are quick flybys, leaving behind little evidence of the encounter. Other times, galaxies smash into each other, creating extended tails and messy morphologies. From observations and simulations, scientists have suggested that the merging of galaxies can also trigger increased star formation. However, it is unclear if this behavior is consistent for galaxies across cosmic time.
In the local universe, observations have shown increased star formation rates for galaxies with nearby neighbors and lower star formation rates for galaxies that are more isolated, likely experiencing very few interactions and mergers. Earlier in the universe, mergers were more common as galaxies were closer together; however, directly observing evidence of galaxy mergers from the distant past is difficult, leading to an incomplete understanding of how ancient mergers impacted star formation rates. Fortunately, simulations can explore where our telescopes can’t quite reach, allowing scientists to track galaxy interactions over time.
Galaxy Interaction Simulations
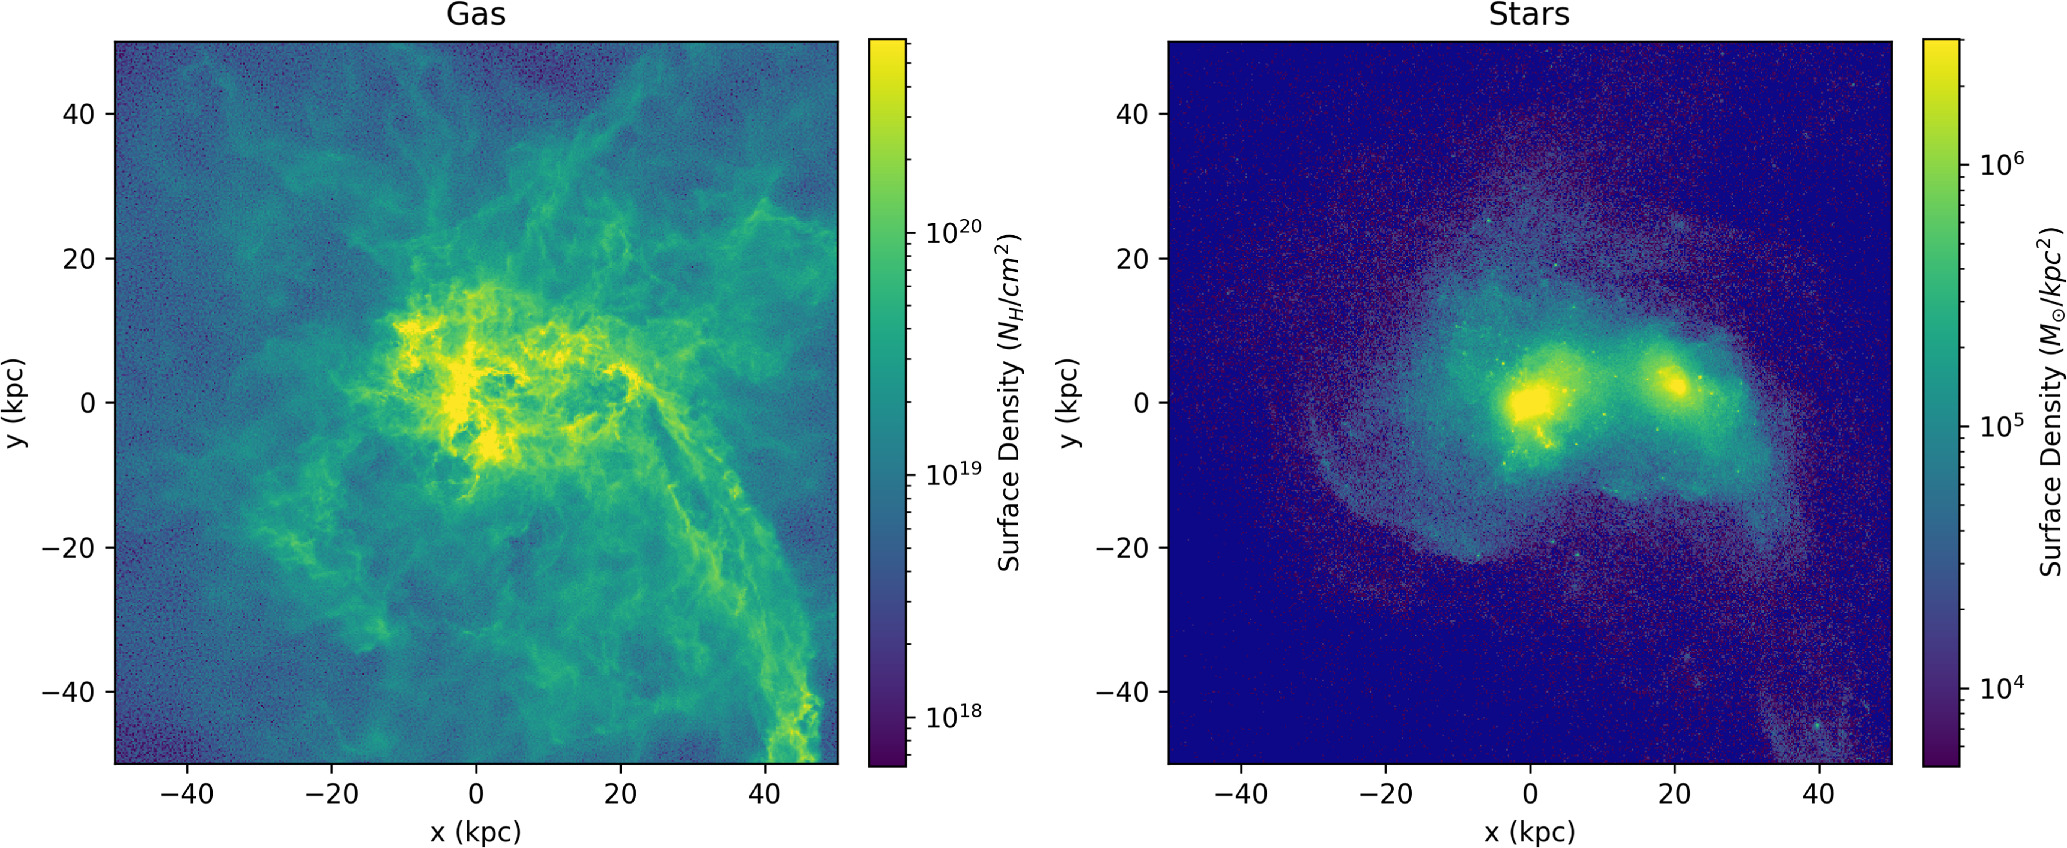
Simulation snapshot showing the gas (left) and stellar (right) surface density maps of a major merger event. Click to enlarge. [Li et al 2025]
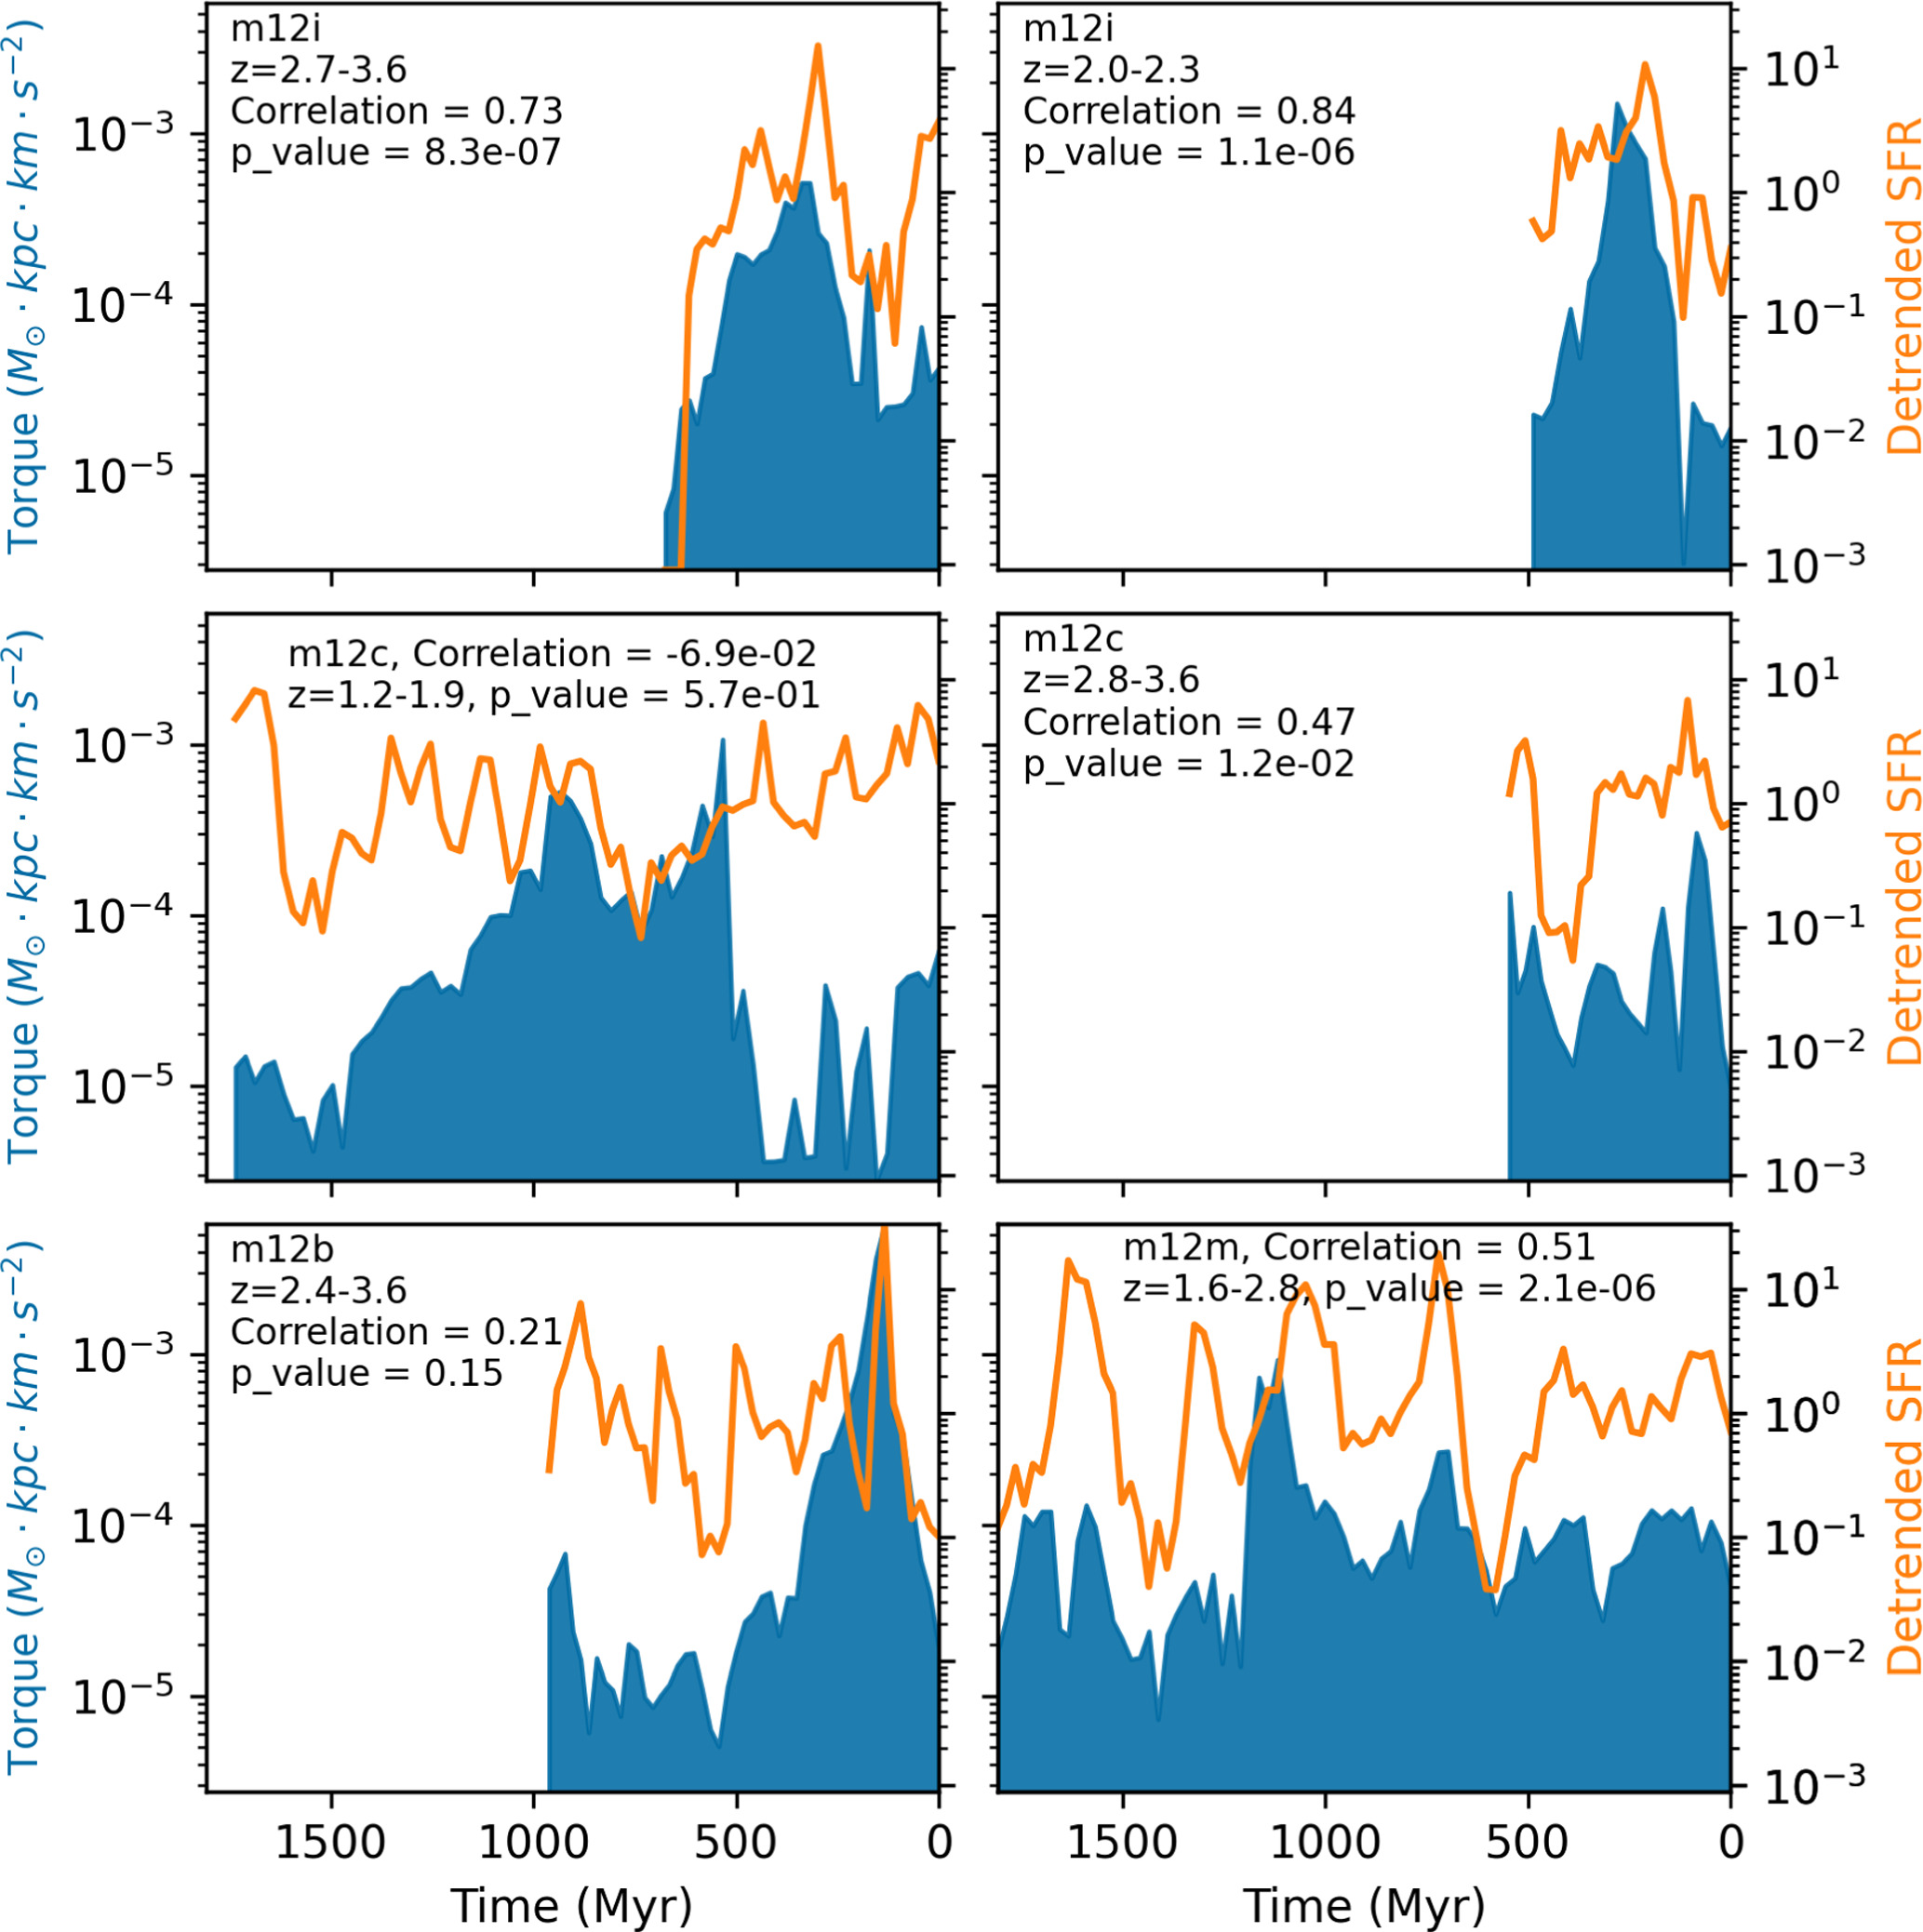
Torque (blue) and star formation rate (orange) measurements during major merger interaction snapshots from the simulations ran in this study. Not all peaks in star formation rate correspond to peaks in torque, and not all peaks in torque cause a peak in star formation rate. Click to enlarge. [Li et al 2025]
Observation and Simulation Comparison
How do the authors’ results compare to other simulations and observations that explore interaction impacts? Observations that compare the star formation activity of merging and non-merging galaxies find no significant difference between the star formation activity in these two groups of galaxies across the last ~12 billion years, which is consistent with the results of this simulation. Other simulations predict that massive galaxies like the Milky Way go from bursty to steady star formation across cosmic time, and that mergers and interactions do not leave a significant mark on this overall trend of star formation activity.
This study finds that Milky Way-mass galaxies experience most major interactions during their early years, experience only a few major mergers, and their star formation activity across cosmic time is predominantly driven by internal dynamics within the galaxy itself. These findings provide predictions for what we may observe as advanced telescopes continue to peer into the distant past.
Citation
“The Effect of Galaxy Interactions on Starbursts in Milky Way–Mass Galaxies in FIRE Simulations,” Fei Li et al 2025 ApJ 979 7. doi:10.3847/1538-4357/ad94ef
The post Interaction Reactions: How Galaxy Encounters Influence Star Formation appeared first on AAS Nova.
]]>
What's the status of the brown dwarf discovered 12.6 light-years from Regulus: group member or unrelated neighbor? New research provides clues.
The post A New Groupie in Regulus’s Entourage? appeared first on AAS Nova.
]]>Regulus, the brightest star in the constellation Leo, is known to float through space with three companion stars. New research shows that it may have yet another member in its stellar entourage.
The Growing Regulus Family

The constellation Leo, showing the location of Regulus. Click to enlarge. [IAU/Sky & Telescope; CC BY 4.0]
Using these techniques, astronomers have discovered that Regulus, the nearest B-type star to Earth, has three companions. First to be identified was Regulus B, a 0.8-solar-mass K-type star. Regulus B itself was discovered to have a companion, a 0.32-solar-mass M-type star named Regulus C, in 1873.
In 2008, technological advances allowed for the discovery of an even smaller companion: a 0.31-solar-mass stellar core that sweeps around Regulus every 40 days. Although this companion has yet to be imaged directly, it was detected spectroscopically only a few years ago.
Now, researchers may have tracked down Regulus’s smallest companion yet.
A Potential Companion
SDSS J100711.74 +193056.2, or SDSS J1007+1930 for short, is a brown dwarf in Regulus’s vicinity. Brown dwarfs lie in between stars and planets, massive enough to temporarily experience fusion of deuterium and sometimes lithium, but not massive enough to initiate hydrogen fusion. SDSS J1007+1930’s mass is estimated to be just 0.06 solar mass. The brown dwarf sits 12.6 light-years from Regulus, and its proper motion across the sky is similar to that of Regulus, suggesting that the two objects might be associated.
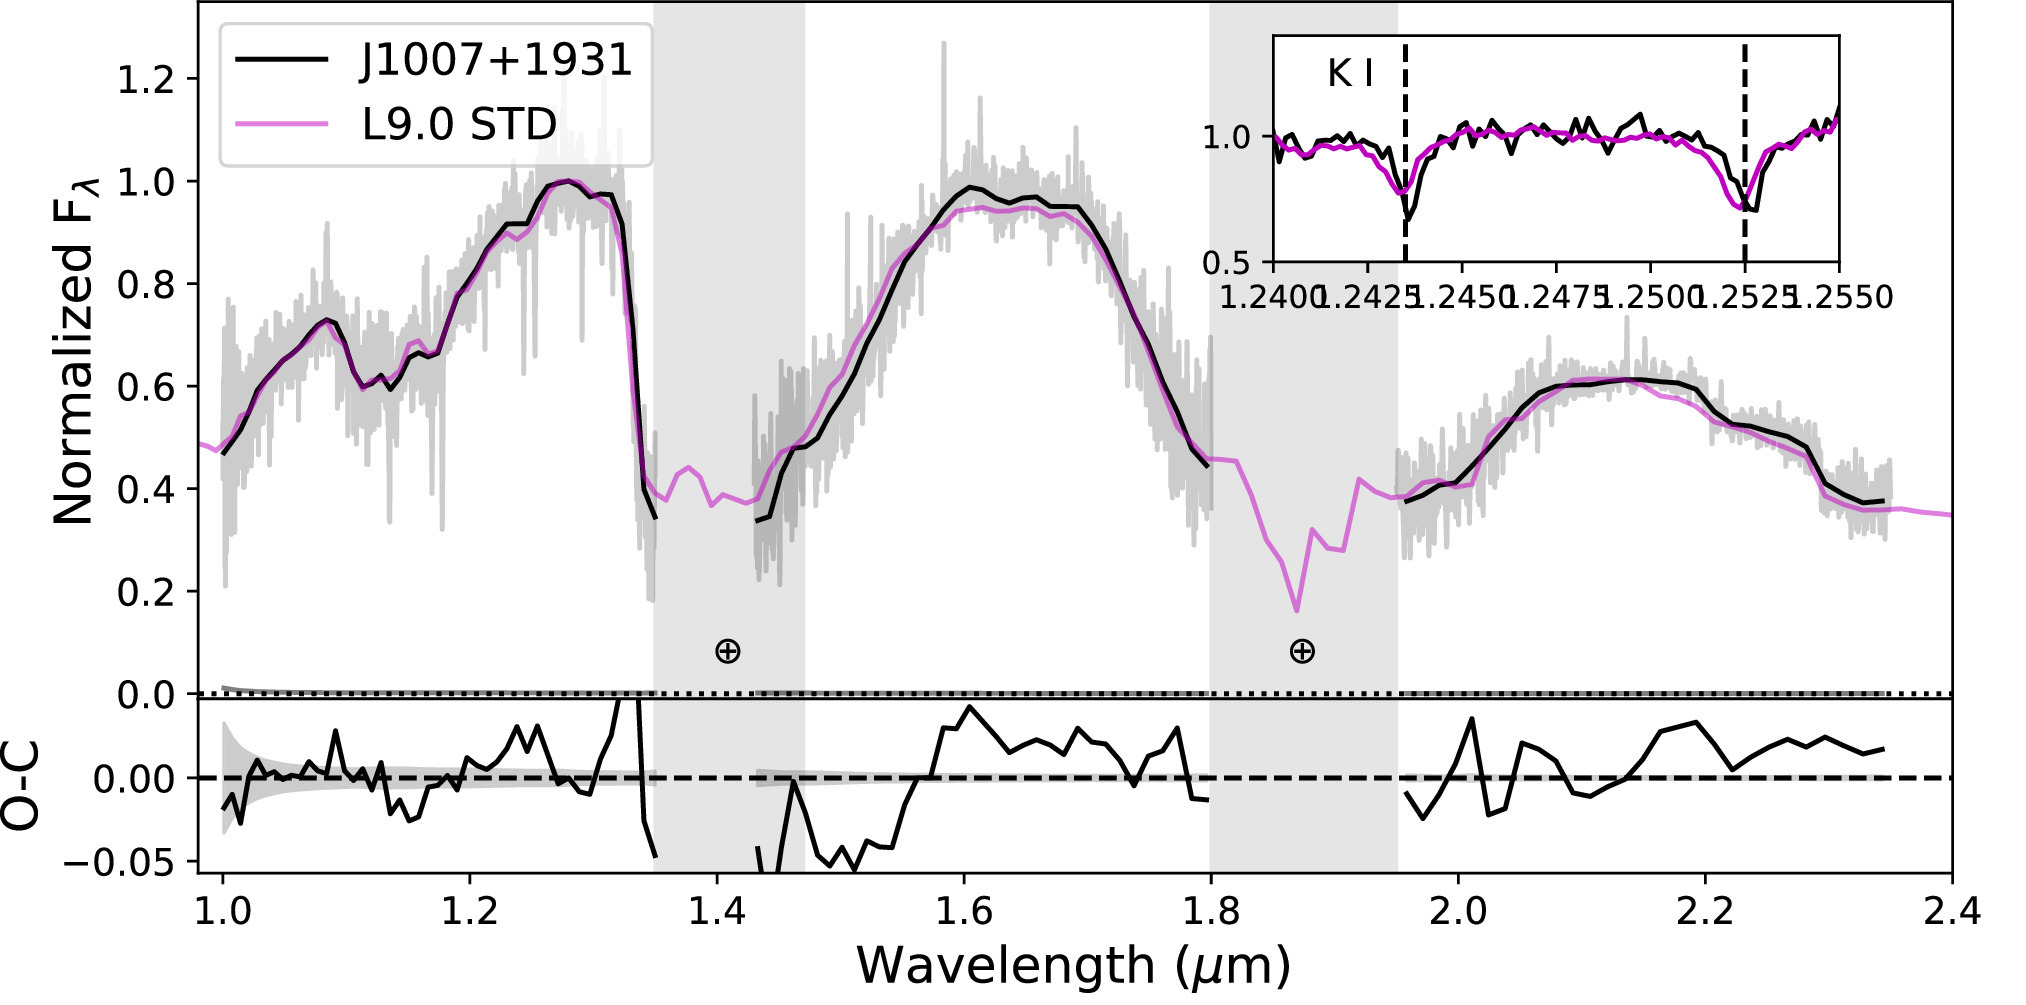
A near-infrared spectrum of SDSS J1007+1930 (gray is the high-resolution spectrum, black is the smoothed spectrum) along with the spectrum of an L9-type brown dwarf standard (purple). Click to enlarge. [Adapted from Mamajek & Burgasser 2025]
Assembling the Clues
Mamajek and Burgasser found that SDSS J1007+1930 bears a close resemblance to members of the Regulus system in several ways. The brown dwarf is less metal-rich than the Sun, with a metallicity similar to that of Regulus B. Its radial velocity is also similar to that of Regulus B and Regulus itself. Finally, spectral analysis suggests that SDSS J1007+1930 is unlikely to be young, and its age may instead be similar to the 1–2 billion year age of the system.
These clues leave open the possibility that SDSS J1007+1930 is associated with Regulus — but is it? So far, the available evidence isn’t conclusive, but it does suggest that SDSS J1007+1930 formed either within the Regulus system or in the same natal star cluster. Even if SDSS J1007+1930 is currently linked to the Regulus system, the association might be short lived. Given the brown dwarf’s distance from Regulus, it’s possible that the object is no longer gravitationally bound to the system, and a future interaction with a passing star or even a massive gas cloud could steal the brown dwarf away.
Citation
“SDSS J100711.74+193056.2: A Candidate Common Motion Substellar Companion to the Nearest B-Type Star Regulus,” Eric E. Mamajek and Adam J. Burgasser 2025 AJ 169 77. doi:10.3847/1538-3881/ad991b
The post A New Groupie in Regulus’s Entourage? appeared first on AAS Nova.
]]>
Astrobites reports on how spectroscopic observations of an exoplanet can help us understand its composition and formation history.
The post Roasted Marshmallows Setting Fire to Our Understanding of Planet Formation? appeared first on AAS Nova.
]]>Editor’s Note: Astrobites is a graduate-student-run organization that digests astrophysical literature for undergraduate students. As part of the partnership between the AAS and astrobites, we occasionally repost astrobites content here at AAS Nova. We hope you enjoy this post from astrobites; the original can be viewed at astrobites.org.
Title: The Roasting Marshmallows Program with IGRINS on Gemini South. II. WASP-121 b has Superstellar C/O and Refractory-to-Volatile Ratios
Authors: Peter C. B. Smith et al.
First Author’s Institution: Arizona State University
Status: Published in AJ
Our solar system has a very nice, ordered structure to it. Close to the Sun are the rocky, terrestrial planets, and then once you cross the asteroid belt you find the big, surface-less gas giants. But over the past 30 years, astronomers have learned that this is not a universal setup. A majority of the exoplanets we have discovered to date fall in the gas giant category, but not all of these gas giant planets lie at the outer edges of their systems. In fact, we’ve found so many gas giants that are close to their host star that they’re given their own name: hot Jupiters. These are large, gaseous planets that orbit closer to their star than Mercury does to the Sun, and how they came to be there is a bit of a mystery.
Divvying Up the Protoplanetary Disk
Planets form out of a swirling ring of gas and dust called a protoplanetary disk. But this disk isn’t the same at all radii. As you move away from the star and the temperature drops, certain compounds change from gas to solid phase, which can have a big impact on the types of planets that form there. One way of dividing up the disk is via “snow lines.” Interior to a snow line, volatile materials (like water) are in gas form, but once you cross this line it is cold enough for them to freeze, forming small solid particles that provide seeds for planet growth. To highlight the role this could play in the types of planets that form, it’s thought that the snow line for water for our solar system was around 3 au, which places it right in between Mars and Jupiter. With the presence of solid particles, it’s easier for planetary cores to grow quickly and thus reach a point where they can hold on to the large gas envelopes that make a planet a gas giant. Another line that’s grown in interest recently is the soot line, which similarly marks the transition into gas specifically for carbon molecules. The properties of planets, including their potential for habitability, can depend greatly on where they formed relative to these lines.
So this is great and all, but when we go and observe exoplanets, we aren’t able to see a nice highlight reel of their formation history. We don’t know where they formed, and we can’t tell how they might have migrated through the disk. But if we can measure their compositions, we can start to get some clues as to where they might have formed and how they came to be where they are.
WASP-121b: An “Ultra-Hot” Planet
That’s where today’s article comes in. This work looks at an exoplanet with the beautifully poetic name of WASP-121b, which is a bit bigger than Jupiter but orbits so close to its host star that it’s actually classified as an “ultra-hot Jupiter.” (Side note: the title of the article is “The Roasting Marshmallows Program” because the planets studied in the program are all hot and puffy.) Ultra-hot Jupiters are, as you may have guessed, hotter than hot Jupiters, and thus they have fewer clouds in their atmospheres. This allows for a better understanding of their composition as you don’t have to deal with pesky and still relatively poorly constrained cloud models. Today’s work used observations from the Immersion Grating Infrared Spectrometer (IGRINS) instrument on the Gemini South telescope, observing the planet before and after its secondary eclipse — when the planet moves behind the host star. Figure 1 gives details about the system and shows the phases of the two observations.
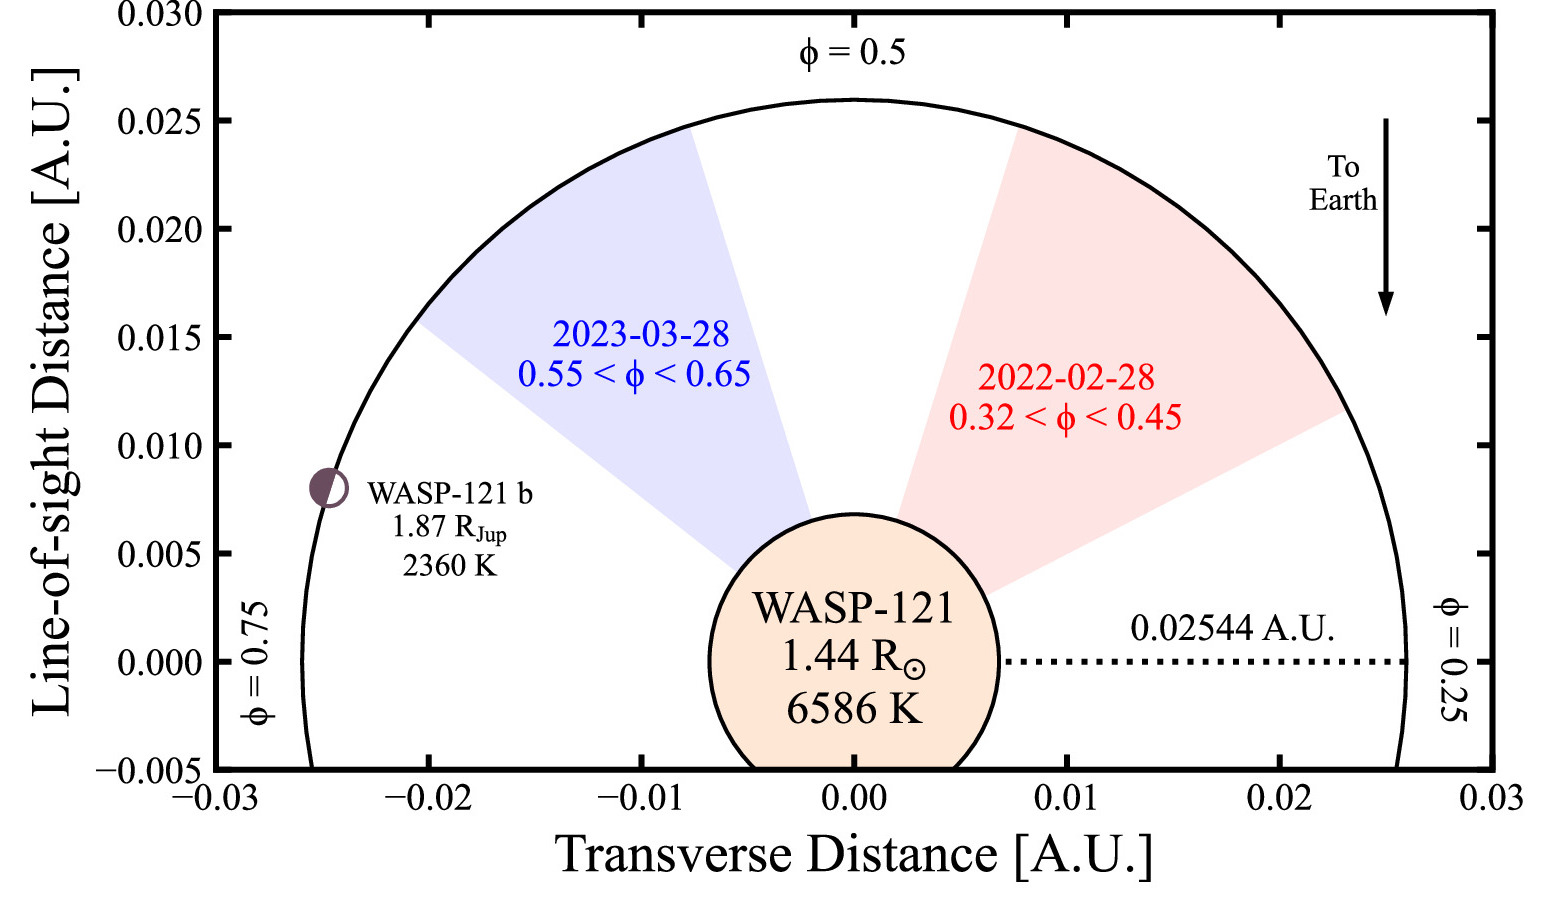
Figure 1: Schematic of the system studied in this article. The blue and red highlighted regions show the phases of the planet’s orbit during the observations. Something fun about this diagram: it’s fully to scale, which really demonstrates just how close the planet is to its host star. [Adapted from Smith et al. 2024]
Ratios to the Rescue
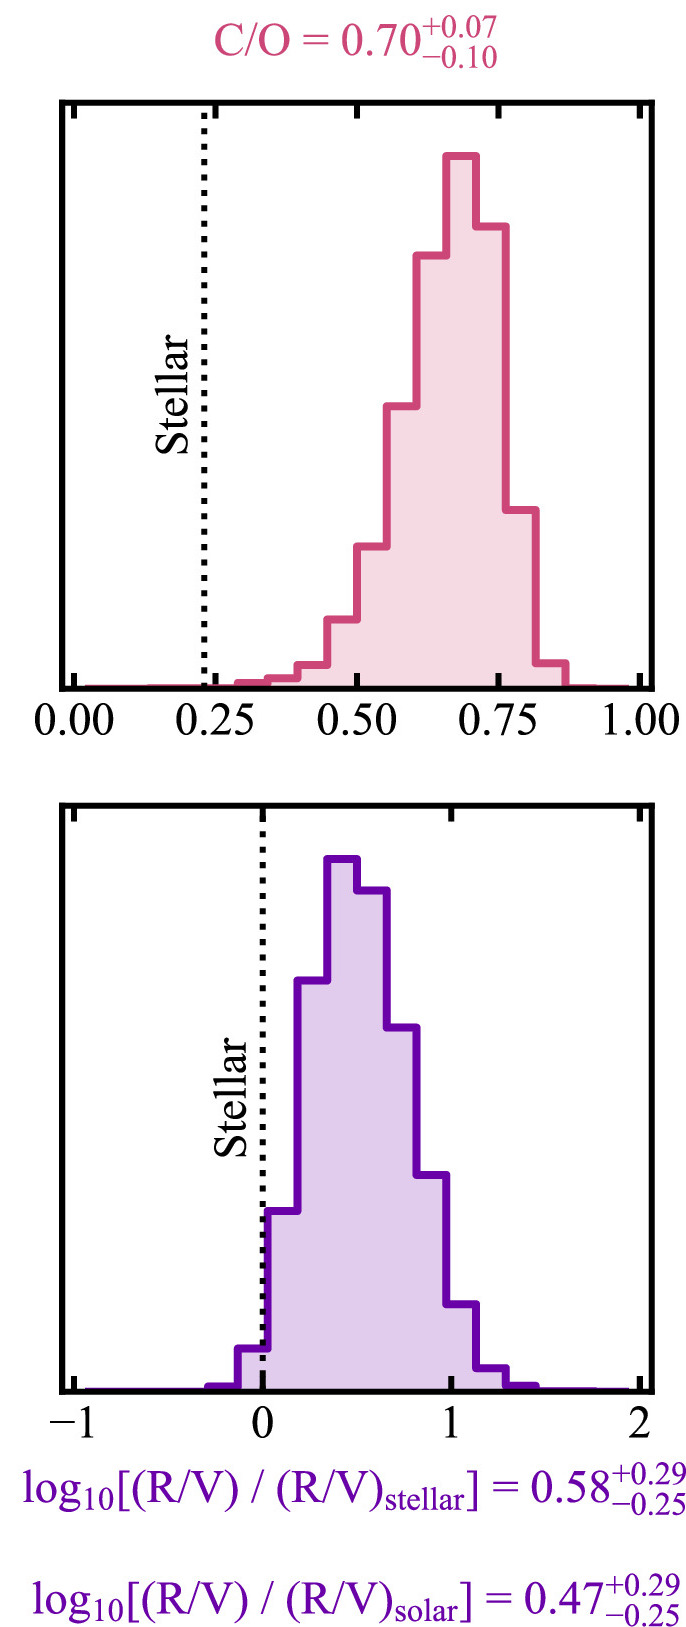
Figure 2: Posterior distributions (which can be understood as the probability for each value) of the C/O and R/V ratios in the atmosphere of WASP-121b. By comparing the values to the stellar abundance we can constrain where in the protoplanetary disk the ultra-hot Jupiter formed. [Adapted from Smith et al. 2024]
Overall, WASP-121b has high values for both the C/O and R/V ratios. This suggests that the planet was formed exterior to the soot line but interior to the water snow line, which is kind of an unexpected result. As discussed above, it’s thought that massive gas giants form exterior to the snow line, as they need the ices to build a big enough core. Though surprising, it’s not impossible for this ultra-hot Jupiter to have formed interior to the snow line. One interpretation is that the planet actually started as a super-Earth (exoplanet categories are so silly sounding — this means a planet between the sizes of Earth and Neptune) that could form interior to the snow line but still be big enough to sustain the runaway gas accretion that got it up to Jupiter size. And then over time, it would have migrated in towards the host star, heating up until it became the roasted marshmallow we know and love. While this is one explanation, there’s still a lot to understand about this formation pathway and more study is definitely needed. Overall, these results provide an interesting challenge to our understanding of planet formation. They also demonstrate the usefulness of near-infrared spectroscopy when it comes to constraining the atmospheres of ultra-hot Jupiters.
Original astrobite edited by Lucas Brown.
About the author, Skylar Grayson:
Skylar Grayson is an Astrophysics PhD Candidate and NSF Graduate Research Fellow at Arizona State University. Her primary research focuses on active galactic nucleus feedback processes in cosmological simulations. She also works in astronomy education research, studying online learners in both undergraduate and free-choice environments. In her free time, Skylar keeps herself busy doing science communication on social media, playing drums and guitar, and crocheting!
The post Roasted Marshmallows Setting Fire to Our Understanding of Planet Formation? appeared first on AAS Nova.
]]>
Neutron stars seem to rotate at only half their maximum rate. Can the splitting of a neutron star's crust explain why?
The post Cracking Crusts Might Set a Neutron Star Speed Limit appeared first on AAS Nova.
]]>Neutron star crust is the strongest material in the universe, but it’s not infinitely strong. New research explores how the cracking of a neutron star’s crust might determine how fast these extreme stellar remnants can spin.
Stellar Speed Limit
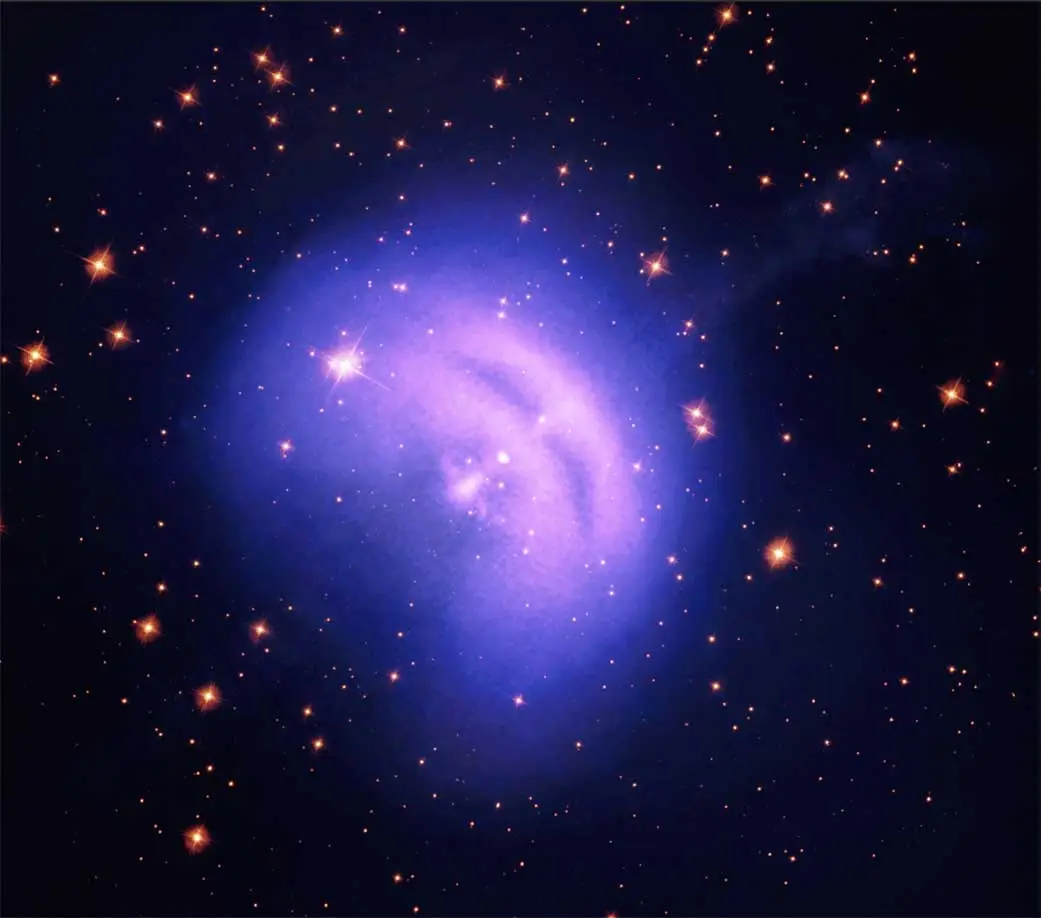
This image shows the Vela pulsar wind nebula. Pulsar wind nebulae are powered by pulsars, which are a type of neutron star. [X-ray: (IXPE) NASA/MSFC/Fei Xie & (Chandra) NASA/CXC/SAO; Optical: NASA/STScI Hubble/Chandra processing by Judy Schmidt; Hubble/Chandra/IXPE processing & compositing by NASA/CXC/SAO/Kimberly Arcand & Nancy Wolk]
Neutron stars also rotate extremely quickly, with the fastest-spinning neutron stars zipping around hundreds of times each second. That’s fast — but it turns out to be only about half as fast as a neutron star could hypothetically spin before being ripped apart by its rotation, a speed known as the breakup rate. What’s stopping neutron stars from spinning even faster?
Crust-Covered Pasta
Jorge Morales and Charles Horowitz (Indiana University) have explored one possibility: that the cracking of a neutron star’s crust occurs at roughly half the star’s breakup rate, and that once the crust cracks, the star can spin no faster.
Neutron stars are composed of a strange substance called nuclear pasta, which is enclosed by a shell of atomic nuclei and electrons. Both of these layers are reportedly billions of times stronger than steel.
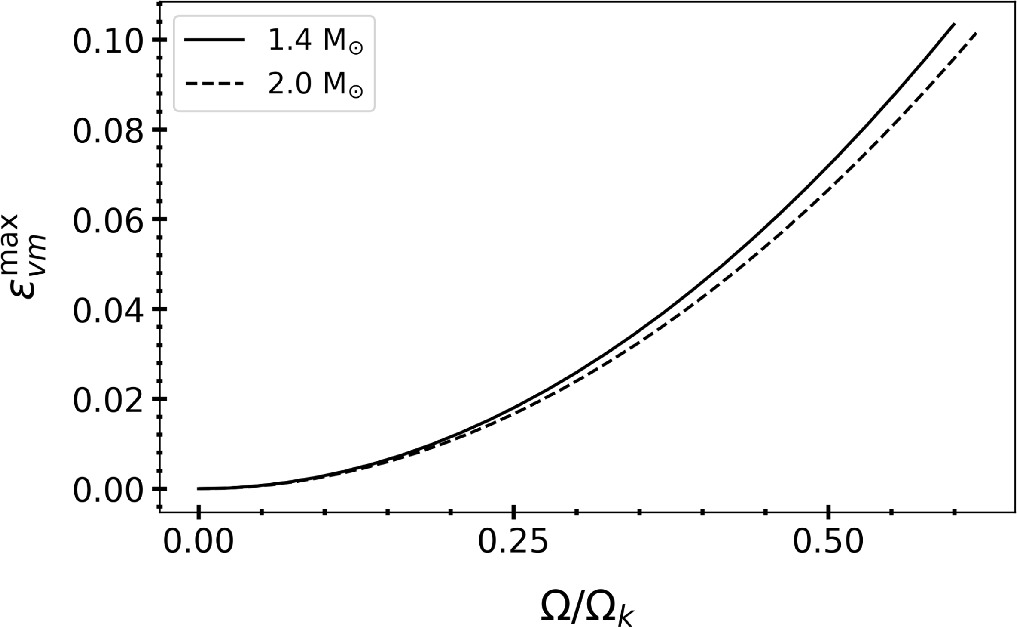
The strain experienced by a neutron star’s crust as a function of the rotation rate divided by the breakup rate. [Morales & Horowitz 2025]
Continuous Gravitational Waves
Why does the breaking of a neutron star’s crust inhibit faster rotation? This is especially relevant for neutron stars that are expected to “spin up” to faster speeds over time as they accrete matter from their companions; even these appear to obey the spin speed limit.
After the crust breaks, the pieces of the crust can shift around. This may transform the neutron star from one that is symmetric around its spin axis to one that is asymmetric. These objects might produce a continuous gravitational wave signal, and Morales and Horowitz proposed that any angular momentum added to the star — through accretion, for example — is carried away in the form of gravitational waves, preventing the star from spinning faster.
Morales and Horowitz noted that there are more aspects of this scenario to be explored, such as the impact of crustal magnetic fields, the importance of relativistic effects, and the prospects of detecting gravitational waves from these sources.
Citation
“Limiting Rotation Rate of Neutron Stars from Crust Breaking and Gravitational Waves,” J. A. Morales and C. J. Horowitz 2025 ApJL 978 L8. doi:10.3847/2041-8213/ad9ea7
The post Cracking Crusts Might Set a Neutron Star Speed Limit appeared first on AAS Nova.
]]>
A Thorne–Żytkow object is a star with a neutron star at its core. New work examines whether these theoretical objects could be made, as proposed, in X-ray binary systems.
The post Testing a Recipe for a Star Within a Star appeared first on AAS Nova.
]]>A Thorne–Żytkow object is a star within a star — a star with a neutron star at its core. These objects are theorized to form in close binary systems, but new research reveals complications in this proposed formation pathway.
A Star Within a Star
The term “star” encompasses a wide variety of objects, from our familiar Sun to roiling supergiants dozens of times as massive and hundreds of times as wide. Certain types of stars are only theorized, like those containing huge amounts of dark matter or with cores composed of strange quarks. One such theorized star — and the subject of today’s article — is a Thorne–Żytkow object, also known as a hybrid star.
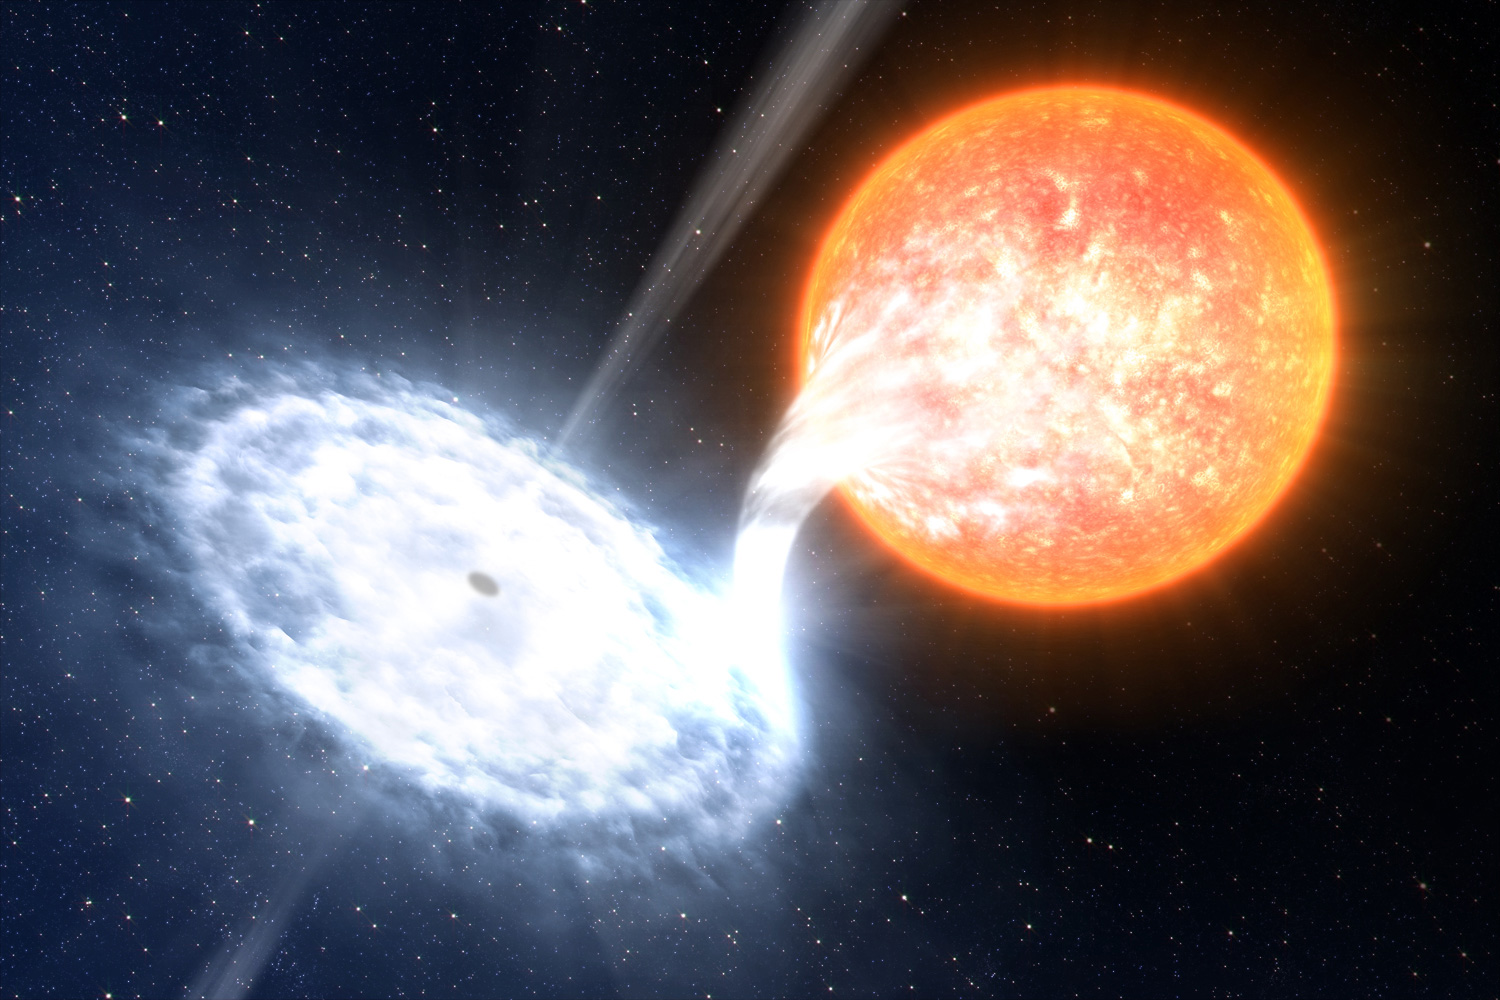
An artist’s impression of an X-ray binary, in which a compact object accretes material from a companion star and emits X-rays during intermittent outbursts. [ESO/L. Calçada; CC BY 4.0]
After being engulfed by its companion, the neutron star is thought to sink to the star’s core. There, it is hypothesized to energize the surrounding star through accretion and nuclear fusion, creating a curious mix of elements that distinguishes a Thorne–Żytkow object from an ordinary star.
Diverging Paths
At least, that’s the theory. But as a recent research article led by Tenley Hutchinson-Smith (University of California, Santa Cruz; University of Copenhagen) shows, more work is needed to understand whether X-ray binary systems could truly evolve into Thorne–Żytkow objects. At the core of this question is how the inspiraling neutron star affects the companion that has engulfed it. Does the engulfing star hold on to its extended gaseous envelope, or does it lose its atmosphere and diverge from the Thorne–Żytkow object path? And how long would the Thorne–Żytkow phase last — could the neutron star remain at the center of its companion indefinitely, or does the neutron star eventually gain mass and collapse into a black hole?
The team used as the basis of their exploration the X-ray binary system LMC X-4, which contains a 1.57-solar-mass neutron star and an 18-solar-mass primary star. The stars are locked in a tight gravitational embrace, separated by only 14 solar radii and orbiting one another every 1.4 days.
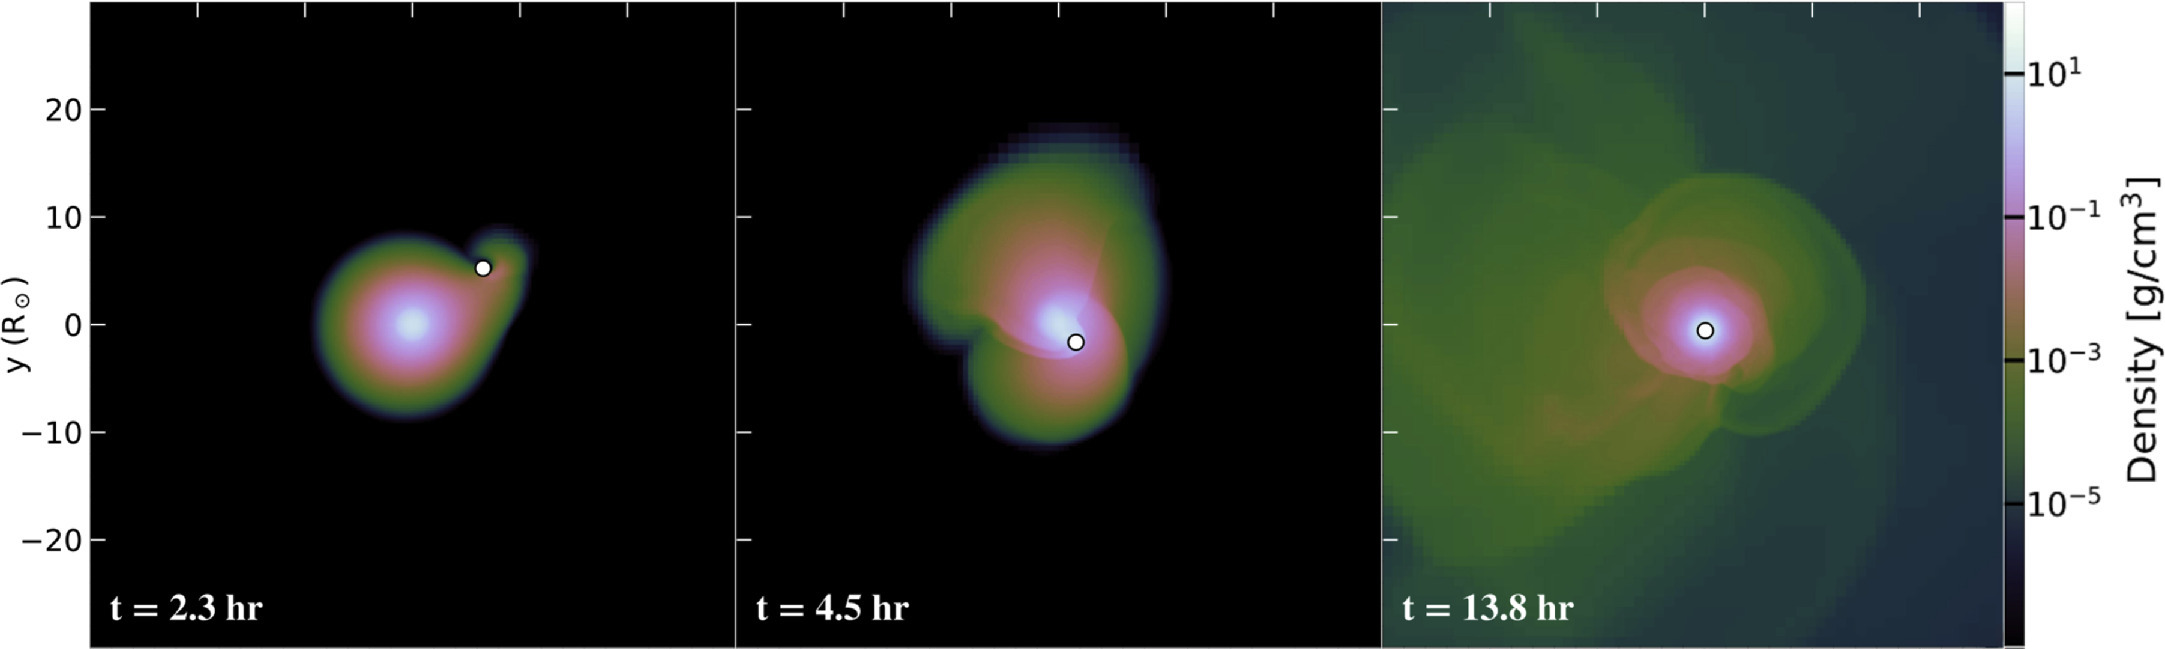
Simulation screenshots showing the density of gas as the neutron star (white circle) spirals in toward the core of its companion star. Click to enlarge. [Adapted from Hutchinson-Smith et al. 2024]
Total Collapse of the Heart
Using a three-dimensional fluid dynamics simulation, Hutchinson-Smith and collaborators followed the evolution of LMC X-4 as the primary star engulfed the neutron star. As the neutron star spiraled inward, the energy released ejected only a small amount of gas, and the neutron star accreted only a small amount of matter from the companion star. At that point, the formation of a Thorne–Żytkow object seemed inevitable, but the merger of the neutron star with the companion star’s core set the system on a different course.
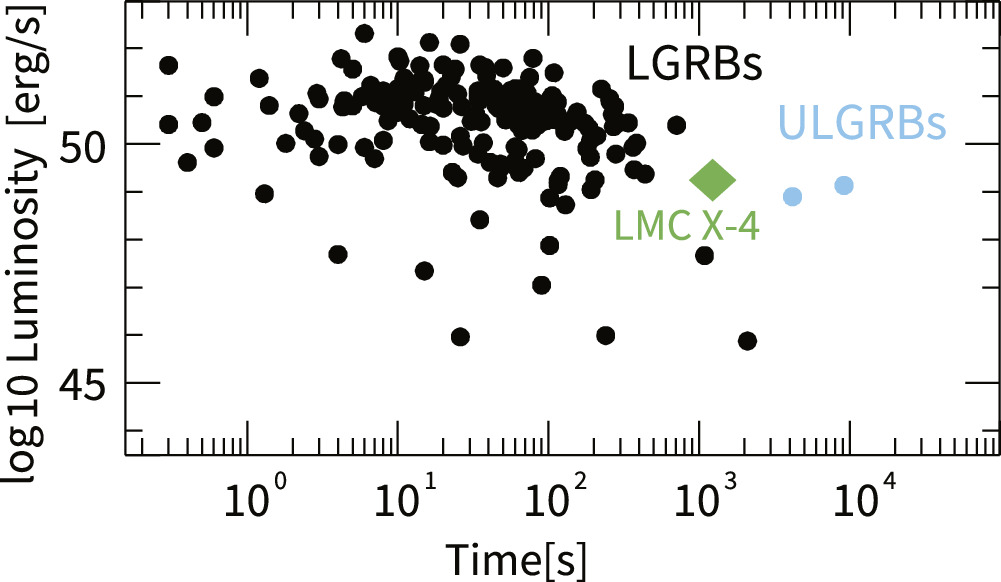
Comparison of the luminosity and duration of the gamma-ray burst produced by the collapse of the neutron star in LMC X-4 with the properties of long gamma-ray bursts (LGRBs) and ultra-long gamma-ray bursts (ULGRBs). Click to enlarge. [Hutchinson-Smith et al. 2024]
Thus, Hutchinson-Smith’s team has demonstrated that a Thorne–Żytkow object is unlikely to result from the evolution of an X-ray binary system like LMC X-4 — though this evolution may provide a path to powering ultra-long gamma-ray bursts. This suggests that accretion and feedback leading to the collapse of the neutron star and the ejection of the stellar envelope must be taken into consideration when exploring the formation of Thorne–Żytkow objects.
Citation
“Rethinking Thorne–Żytkow Object Formation: The Fate of X-Ray Binary LMC X-4 and Implications for Ultra-Long Gamma-Ray Bursts,” Tenley Hutchinson-Smith et al 2024 ApJ 977 196. doi:10.3847/1538-4357/ad88f3
The post Testing a Recipe for a Star Within a Star appeared first on AAS Nova.
]]>
The discovery of nearly 6,000 exoplanets has made it clear that not all planets in our galaxy resemble those in our solar system. Today's Monthly Roundup introduces three studies involving planets entirely unlike our own.
The post Monthly Roundup: Exo-Neptunes and Sub-Neptunes appeared first on AAS Nova.
]]>With nearly 6,000 exoplanets discovered to date, it’s clear that not all of the planets in our galaxy resemble the planets in our solar system. Today’s Monthly Roundup explores three types of planets with no analogs in our solar system: a warm Neptune orbiting its tiny host star in less than 4 days; a polar Neptune orbiting perpendicular to its host star; and a famous sub-Neptune whose structure is a matter of debate.
Close-In Neptune, Breaker of Chains
LHS 3154b is a typical Neptune-mass exoplanet in an atypical place. This planet has a mass of at least 13.2 Earth masses, but it orbits an M-dwarf star just 11% the mass of the Sun, swinging around its tiny host star every 3.7 days. It’s not clear how such a setup came to be, as conventional theories of planet formation provide few avenues for such massive planets to form around low-mass stars.
Donald Liveoak and Sarah Millholland (Massachusetts Institute of Technology) have proposed an explanation for LHS 3154b: it’s several planets in a trench coat. In other words, rather than having formed as the single planet observed today, LHS 3154b is the product of a series of collisions between multiple planets that once existed in the system.
To test this theory, Liveoak and Millholland simulated the evolution of a system containing 11 small planets with an average mass of 2 Earth masses. The planets in this system are arrayed in what’s known as a resonant chain, in which the orbital periods of the planets are integer multiples of one another. This configuration is thought to arise naturally when young planets migrate within a protoplanetary disk. Liveoak and Millholland nudged the planets out of this stable configuration by having the planets begin to lose their atmospheres. With their orbital stability disrupted, the planets abandoned their carefully balanced orbits and collided.
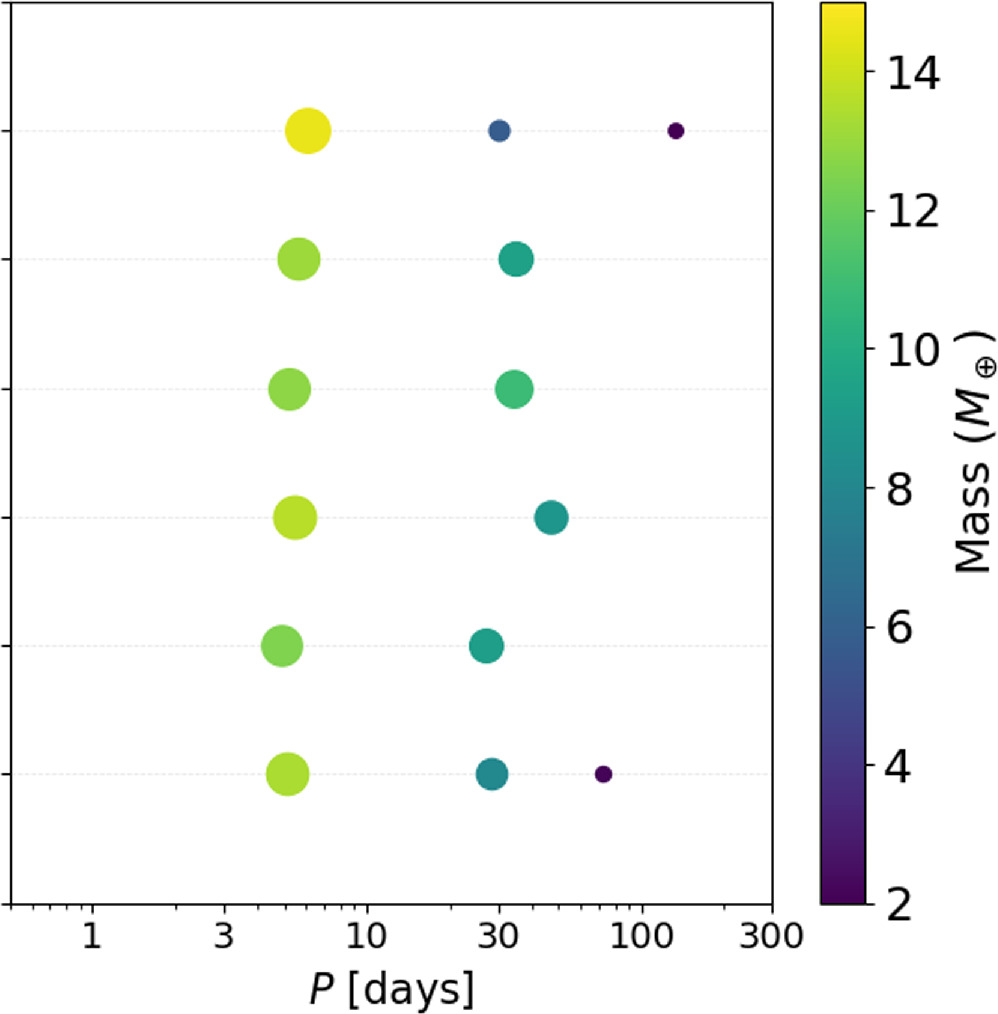
Masses and orbital periods of the planets remaining in the six simulated systems that generated a close-in Neptune-mass planet. The planetary system architectures are remarkably similar. [Liveoak & Millholland 2024]
Stability of Polar Neptunes
The planets in our solar system orbit in nearly the same plane as the one defined by the Sun’s spin, but it’s clear that not all planetary systems in our galaxy are so orderly. A sizeable chunk of the exoplanet population orbits nearly perpendicular to their stars’ spins. Curiously, roughly half of this population are planets with masses similar to that of Neptune. These highly inclined exo-Neptunes share several characteristics, including slightly elongated orbits, puffy atmospheres with the possibility of past mass loss, and, in some cases, a massive planet in the same system, orbiting farther from the host star.
Emma Louden (Yale University) and Sarah Millholland (Massachusetts Institute of Technology) investigated whether disk-driven resonance could torque exo-Neptunes into their perpendicular orbits while also explaining the other properties of this exoplanet population. In this framework, a young exo-Neptune’s orbit would evolve under the gravitational influence of an outer giant planet and a dissipating planetary disk. Over time, the dissipation of the disk combines with a nodal resonance between the inner Neptune and the outer giant planet, eventually launching the inner Neptune into a highly inclined orbit. This mechanism clearly links polar-orbiting Neptunes with outer giant planets.

A diagram that describes the disk-driven resonance for creating polar-orbiting planets. [Louden & Millholland 2024]
Louden and Millholland then considered two known polar Neptunes, WASP-107b and HAT-P-11b. Both of these planets have an outer giant planet in their system, and both planets show signs of mass loss due to tidal heating. Louden and Millholland showed that these planets’ orbital configurations are incredibly stable, on par with the orbital stability of Uranus and Neptune in our own solar system. While this study doesn’t provide proof of the disk-driven resonance hypothesis, it does demonstrate the feasibility of the concept, and further observational evidence can strengthen the hypothesis.
Is K2-18b Covered in a Supercritical Ocean?
Of the many sub-Neptune exoplanets — those with masses between the mass of Earth and the mass of Neptune — K2-18b is perhaps the most famous. Discovered in 2015 in data from the Kepler Space Telescope, K2-18b has a mass of 8.63 Earth masses and a radius of 2.6 Earth radii. The structure of planets of this size is a matter of debate: do sub-Neptunes have solid surfaces, like Earth, or are they primarily gaseous, like Neptune? Or are they somewhere in between, unlike any of the planets in our solar system?

Possible structures for K2-18b that have been explored in previous work and will be tested in this work (far right). Click to enlarge. [Luu et al. 2024]
Now, Cindy Luu (University of Texas at San Antonio) and collaborators have explored yet another possibility: that K2-18b is covered with an ocean of hot, supercritical water. A supercritical fluid is hot enough to become gaseous but is under enough pressure that it is left in a strange in-between state that shares properties with both its liquid and gaseous forms. Pure water goes supercritical at 647.15K (705℉/374℃).
Luu’s team used geochemical modeling to test the hypothesis that a global supercritical water ocean could explain the observed chemical abundances of K2-18b’s atmosphere. In this scenario, the boundary between the ocean and the atmosphere would be fuzzy, with a greater degree of mixing than would be found at a typical ocean–atmosphere boundary. The team found that an ocean with a temperature between 710K and 1050K could reproduce the observed chemical abundance ratios in K2-18b’s atmosphere. What’s more, this scenario naturally reproduces the non-detection of carbon monoxide.
While the current investigation shows that a supercritical water ocean is consistent with the existing atmospheric abundances measured with JWST, more work is needed to explore this exotic possibility further. More data on carbon monoxide and ammonia, in particular, will be critical to future research.
Citation
“Formation of Close-In Neptunes around Low-Mass Stars through Breaking Resonant Chains,” Donald Liveoak and Sarah C. Millholland 2024 ApJ 974 207. doi:10.3847/1538-4357/ad7383
“Polar Neptunes Are Stable to Tides,” Emma M. Louden and Sarah C. Millholland 2024 ApJ 974 304. doi:10.3847/1538-4357/ad74ff
“Volatile-Rich Sub-Neptunes as Hydrothermal Worlds: The Case of K2-18b,” Cindy N. Luu et al 2024 ApJL 977 L51. doi:10.3847/2041-8213/ad9eb1
The post Monthly Roundup: Exo-Neptunes and Sub-Neptunes appeared first on AAS Nova.
]]>
Astrobites reports on how a star flying by the early solar system could have delivered irregular moons to the giant planets.
The post Stellar Express: Irregular Moon Delivery appeared first on AAS Nova.
]]>Editor’s Note: Astrobites is a graduate-student-run organization that digests astrophysical literature for undergraduate students. As part of the partnership between the AAS and astrobites, we occasionally repost astrobites content here at AAS Nova. We hope you enjoy this post from astrobites; the original can be viewed at astrobites.org.
Title: Irregular Moons Possibly Injected from the Outer Solar System by a Stellar Flyby
Authors: Susanne Pfalzner, Amith Govind, and Frank W. Wagner
First Author’s Institution: Jülich Supercomputing Center; Max Planck Institute for Radio Astronomy
Status: Published in ApJL
Irregular Moons
Our solar system has many moons that are “regular.” They have circular, prograde orbits with low inclination, meaning they orbit their host planet in the same direction and plane as the planet orbits the Sun. These regular moons formed, along with their planets, from the protoplanetary disk. But there are some moons in the solar system with strange orbits, and we’re not sure yet why. These “irregular moons” orbit the outer, giant planets (Jupiter, Saturn, Uranus, and Neptune) on eccentric, inclined, and often retrograde (backwards) orbits.
Luckily, we have a clue. Irregular moons resemble a class of objects that have similarly strange orbits around the Sun out beyond Neptune, called trans-Neptunian objects (TNOs), so they may share a common origin. (When Pluto was demoted from planet status, it was reclassified as a dwarf planet, which is a type of TNO.) One origin theory is that TNOs and irregular moons are a result of the giant planet migration; as the giant planets drifted away from the Sun, they could have kicked TNOs into skewed orbits and captured some in their path as irregular moons. However, this theory cannot explain TNOs that are too distant to have been gravitationally influenced. Another theory is that a star passed through the outer solar system shortly after the solar system’s formation, gravitationally jumbling TNOs, some of which were captured by giant planets. This theory seemed too far-fetched, and it was mostly dismissed until recently, when the Atacama Large Millimeter/submillimeter Array showed that such stellar flybys are actually more common than we thought. Today’s article explores the stellar flyby theory using simulations to demonstrate that such a scenario could create the irregular moons we see today.
The Stellar Flyby Simulation
In a previous article, the authors ran a range of stellar flyby simulations to find the specific scenario that best reproduces the population of TNOs we find beyond Neptune. The best model was a parabolic flyby of a 0.8-solar-mass star at an inclination of 70° and a closest approach of 110 au from the Sun. In today’s article, the authors studied the effect this flyby has on the region near the giant planets, within Neptune’s orbit.
The simulation begins with a disk of undisturbed TNOs on circular orbits. For comparison, the authors modeled two disk sizes, 150 au and 300 au. As is commonly done in simulations for computational simplicity, the TNOs are represented by test particles. The flyby star is flung through the disk, and test particles are moved according to their gravitational interactions with the flyby star and the Sun. As the star passes through the disk, it pulls particles out of their orbits, creating the complex structure shown in Figure 1. The authors then let the simulation run for a billion years to see where the test particles ended up and how they interacted with the giant planets.
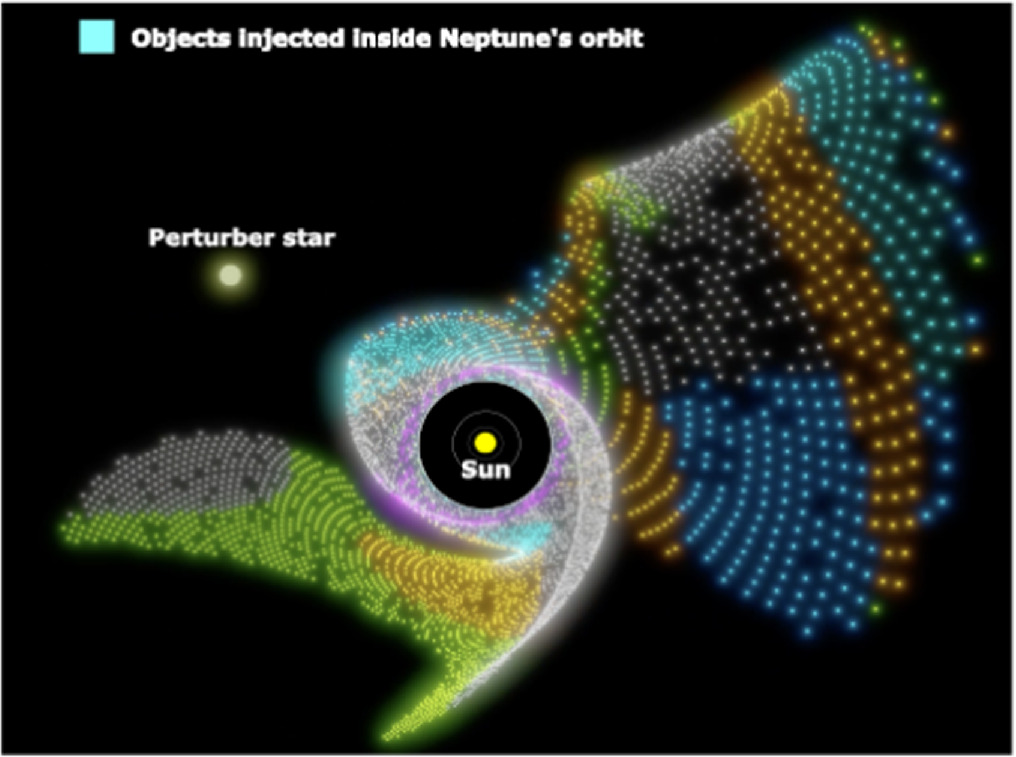
Figure 1: Snapshot of the simulation 200 years after the flyby star’s closest passage, to the right of the Sun. The turquoise particles are those that will end up within Neptune’s orbit after the interaction has settled. [Pfalzner et al. 2024]
Comparing the Simulation to Observations

Figure 2: Distribution of injected TNO perihelions for the 300 au disk (solid line) and the 150 au disk (dotted line). Click to enlarge. [Adapted from Pfalzner et al. 2024]
Most of the injected TNOs after the flyby had prograde orbits, and a significant fraction were at high inclinations. But interestingly, retrograde orbits dominated in the region inside 10 au. Around Jupiter’s orbit at 5.2 au, TNOs were 30% more likely to be retrograde than prograde, while around Saturn’s orbit at 9.5 au, it was 20% more likely.
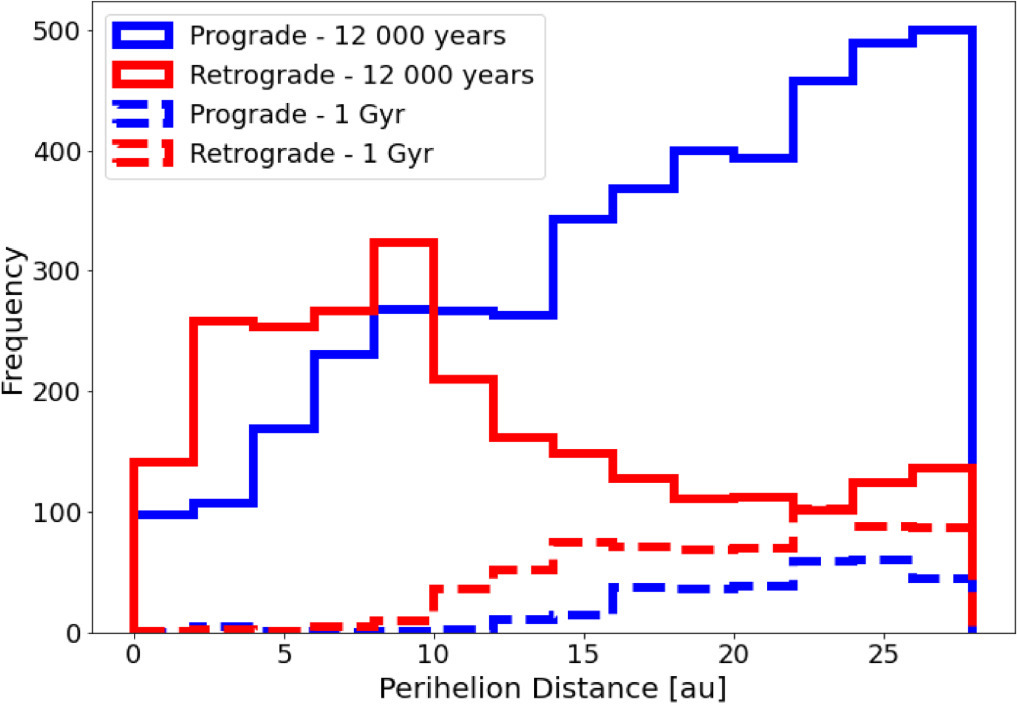
Figure 3: Distribution of injected TNO perihelions for prograde (blue) and retrograde (red) orbits, at 12,000 years (solid line) and a billion years (dashed line) after the stellar flyby. After a billion years, more TNOs with retrograde orbits remain. Click to enlarge. [Adapted from Pfalzner et al. 2024]
Finally, observed irregular moons are similar to observed TNOs in color, ranging from gray to red, except they lack very red objects. The original pre-flyby disk had a color gradient from red near the center to gray on the edges. Figure 4 shows the regions of the original disk that ended up near the giant planets, none of which cover the extremely red region.
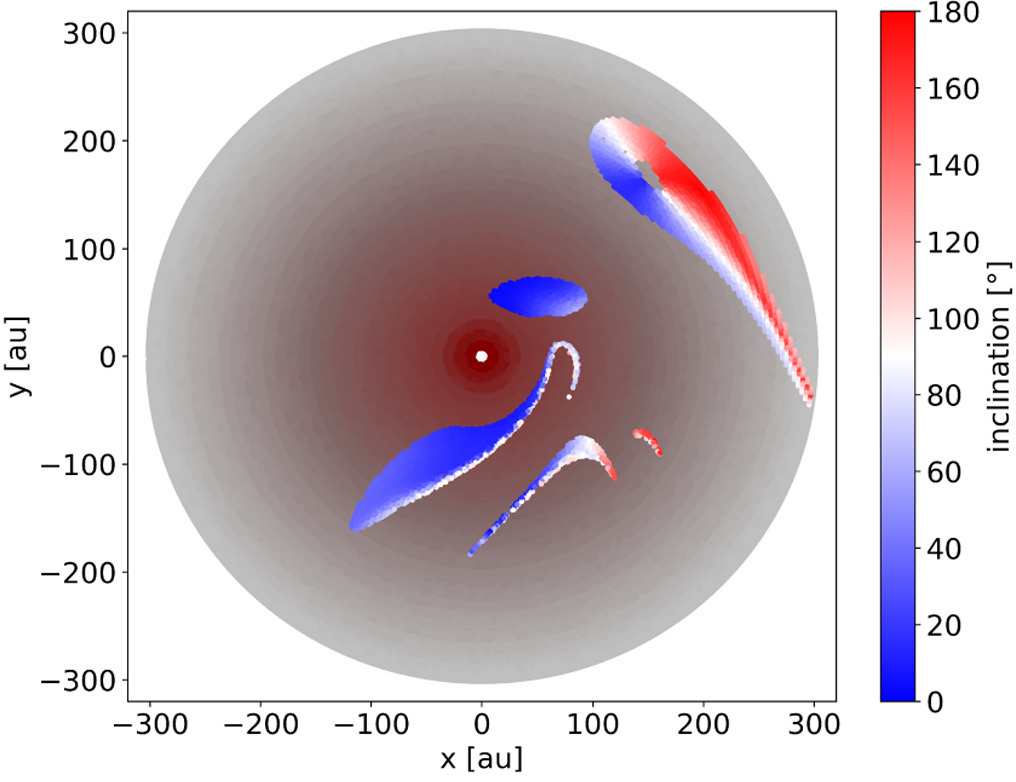
Figure 4: The original TNO disk. The colored regions show the position of TNOs from the original disk that were injected inside Neptune’s orbit, none of which were extremely red. The colorbar represents the inclination of those resulting orbits. [Adapted from Pfalzner et al. 2024]
Original astrobite edited by Kylee Carden.
About the author, Annelia Anderson:
I’m an Astrophysics PhD candidate at the University of Alabama, using simulations to study the circumgalactic medium. Beyond research, I’m interested in historical astronomy, and hope to someday write astronomy children’s books. Beyond astronomy, I enjoy making music, cooking, and my cat.
The post Stellar Express: Irregular Moon Delivery appeared first on AAS Nova.
]]>
In advance of T Coronae Borealis's much-anticipated outburst, astronomers went searching for a super-remnant surrounding the system.
The post Featured Image: Not a Supernova Remnant, But a Nova Super-Remnant appeared first on AAS Nova.
]]>Recurrent novae are repeated outbursts that happen in binary star systems containing a white dwarf and a red dwarf, subdwarf, or giant star. Locked in close quarters, the tiny, dense white dwarf collects material from its companion until the material ignites on the white dwarf’s surface and explodes into space. These systems outburst every century or so and are hypothesized to leave behind “super-remnants” that stretch to cover dozens of light-years. Though all recurrent novae are thought to create super-remnants, only two have been discovered. In advance of the highly anticipated outburst of T Coronae Borealis, Michael Shara (American Museum of Natural History) and collaborators used the Condor Array Telescope to search for a super-remnant. The team discovered a faint but distinct nebula with a hint of bilobed structure surrounding the star. In the image above, green shows Hα emission, red shows emission from singly ionized sulfur, and blue shows emission from singly ionized nitrogen. Based on the team’s calculations, the gaseous nebula is too tenuous to visibly light up when struck by photons from the next outburst, but they recommend post-outburst observations with Hubble and JWST to survey the aftermath. To learn more about the discovery of T Coronae Borealis’s super-remnant, be sure to check out the full research article linked below.
Citation
“The Newly Discovered Nova Super-Remnant Surrounding Recurrent Nova T Coronae Borealis: Will It Light Up During the Coming Eruption?” Michael M. Shara et al 2024 ApJL 977 L48. doi:10.3847/2041-8213/ad991e
The post Featured Image: Not a Supernova Remnant, But a Nova Super-Remnant appeared first on AAS Nova.
]]>
What happens right before a massive star explodes violently in a supernova explosion? A recent study predicts an influx of pre-explosion observations will arise after the Vera C. Rubin Observatory turns on this summer, unlocking the mysteries surrounding massive stars' ends.
The post Catching Core-Collapse Supernovae Before They Happen appeared first on AAS Nova.
]]>As scientists excitedly await the first light of the Vera C. Rubin Observatory, a recent study has projected that this facility will aid in identifying hundreds of massive stars on the cusp of death.
Before Detonation
Throughout their lifetimes, stars burn through hydrogen in their cores — million-degree furnaces smashing atoms together to form new ones. Massive stars, many times the mass of our Sun, have very high temperatures and pressures in their cores, causing them to live fast and die young. When all the fuel is burned, the star no longer produces enough thermal pressure to balance gravity, and the star dies in a rapid and massive explosion known as a Type II (or core-collapse) supernova.
But the final stages of a massive star’s life are not yet fully understood. Observations of Type II supernovae show narrow emission lines that indicate that their progenitor stars were surrounded by circumstellar material — material that was shed from the star as it evolved. However, the exact mechanism through which these stars lose mass is unclear, but if we can catch a star nearing its end but before its deadly detonation, we can better understand these massive stars’ elusive final days.

Artist’s illustration of the Rubin Observatory observing the sky searching for supernovae. The large field of view of the telescope captures large areas of sky in a single image. Click to enlarge. [NOIRLab/NSF/AURA/P. Marenfeld; CC BY 4.0]
Rubin’s Remedy
Looking to explore many facets of the universe, the Vera C. Rubin Observatory’s Legacy Survey of Space and Time (LSST), first light anticipated July 2025, will scan the Southern Hemisphere sky searching for transient events like supernovae. Recognizing the power of LSST, Alexander Gagliano (The NSF AI Institute for Artificial Intelligence and Fundamental Interactions) and collaborators run simulated observations to predict how many stars LSST will catch in their final days, before they explode as supernovae.
Previous observations of Type II supernovae reveal enhanced emission in the months to years prior to explosion, and as LSST monitors the sky, it will be able to capture this pre-explosion emission. The authors carefully model the expected light curves for various types of core-collapse supernova precursors based on the handful of pre-explosion emission events observed thus far. With these models, the authors simulate LSST observations, applying two methods that would allow for the detection of stars gearing up to explode. The first being single-visit observations in which the enhanced emission is detected using differential photometry prior to the star’s explosion, independent of detecting the subsequent supernova. The second method involves going back after a supernova has been detected. By performing binned photometry of the star with observations taken of it prior to its explosion, the preceding emission can be recovered. From here, the authors can predict how many events LSST will recover after it goes online.
Power in Numbers

All core-collapse supernova precursors for both detection methods from one year of synthetic LSST observations. Each color corresponds to each model light curve used. Click to enlarge. [Gagliano et al 2025]
Citation
“Finding the Fuse: Prospects for the Detection and Characterization of Hydrogen-Rich Core-Collapse Supernova Precursor Emission with the LSST,” A. Gagliano et al 2025 ApJ 978 110. doi:10.3847/1538-4357/ad9748
The post Catching Core-Collapse Supernovae Before They Happen appeared first on AAS Nova.
]]>
The Ingenuity helicopter made history as the first aircraft to carry out a controlled, powered flight on another planet. Now, just over a year after its final flight, Ingenuity is still enabling more firsts.
The post Now That’s Ingenuity: First Aircraft Measurement of Winds on Another Planet appeared first on AAS Nova.
]]>Researchers have used an aircraft to measure the wind speed on Mars, marking the first time this method has been used on another planet. This groundbreaking measurement was made possible by the Ingenuity helicopter, which was active for nearly three years and spent, cumulatively, more than two hours in flight on the Red Planet.
A New Era of Aviation

Ingenuity’s navigation camera snapped this photo of the Martian surface during the helicopter’s first flight. [NASA/JPL-Caltech]
The mission showed that flight is possible in the rarefied Martian air — more than 100 times thinner than Earth’s — and covered roughly 18 kilometers (11 miles) in total. Ingenuity, carrying no scientific instruments and weighing about as much as a Chihuahua, paved the way for future aircraft missions to other worlds, such as the highly scientifically capable, half-ton Dragonfly mission to Saturn’s moon Titan.

Diagram showing the directions of roll, pitch, and yaw — the three dimensions used to describe the orientation of an aircraft. [Jackson et al. 2025]
Which Way the Martian Wind Blows
Now, almost exactly one year since its final flight, Ingenuity is still enabling more firsts. In a research article published today, a team led by Brian Jackson (Boise State University) described how they used information from Ingenuity to measure the speed and direction of Mars’s winds. Though Ingenuity did not carry any instruments capable of directly measuring the wind, the helicopter recorded its attitude, or orientation, as it flew.
Previously, Jackson had carried out field experiments on Earth with a small drone to show that wind parameters could be extracted from an aircraft’s attitude data. Building on that proof-of-concept study, Jackson’s team used models to understand how Ingenuity’s attitude would change in response to winds of varying speed and direction. From this modeling, the team reconstructed the winds that battered the tiny helicopter as it flew at altitudes spanning 3 to 24 meters (10 to 79 feet).
Comparing Conditions
The team calculated wind speeds ranging from 4.1 to 24.3 meters per second (9 to 54 miles per hour; that’s anywhere from a “gentle breeze” to a “strong gale,” to use the earthly terms). Compared to meteorological models, the measured speeds tended to be higher than expected and the wind directions did not always match. These differences might reflect the influence of localized geological features, like craters and scarps that whip the wind in highly variable directions, that the models do not fully capture.

The wind speed calculated from Ingenuity’s motion (red circles) compared to the speed measured by the Perseverance rover’s instruments (blue line). Click to enlarge. [Jackson et al. 2025]
This study highlights both the challenge and potential of measuring winds with an aircraft, and Jackson’s team plans for future work to refine the method. Accurate measurements of wind speeds on Mars can help scientists investigate our neighboring planet’s surface processes and dust transport, as well as help to plan safe entry, descent, and landing for future missions.
Citation
“Profiling Near-Surface Winds on Mars Using Attitude Data from Mars 2020 Ingenuity,” Brian Jackson et al 2025 Planet. Sci. J. 6 21. doi:10.3847/PSJ/ad8b41
The post Now That’s Ingenuity: First Aircraft Measurement of Winds on Another Planet appeared first on AAS Nova.
]]>
Astrobites reports on a deep dive into the nature of "little red dot" galaxies seen by JWST. Do they harbor active galactic nuclei, or are stars solely responsible for the extreme properties of these galaxies?
The post Unmasking the Little Red Dots: Active Galactic Nuclei or Not? appeared first on AAS Nova.
]]>Editor’s Note: Astrobites is a graduate-student-run organization that digests astrophysical literature for undergraduate students. As part of the partnership between the AAS and astrobites, we occasionally repost astrobites content here at AAS Nova. We hope you enjoy this post from astrobites; the original can be viewed at astrobites.org.
Title: The Small Sizes and High Implied Densities of “Little Red Dots” with Balmer Breaks Could Explain Their Broad Emission Lines Without an Active Galactic Nucleus
Authors: Josephine F. W. Baggen et al.
First Author’s Institution: Yale University
Status: Published in ApJL
Since its launch, JWST has been on a roll with observations that continue to shape our understanding of the universe. Recently, JWST saw a bunch of galaxies in the early universe that could each host a massive black hole. These galaxies are rightfully called “little red dots” as they are compact (i.e., have small radii) and appear red in the infrared as observed by JWST. However, we are not entirely sure about the identity of the little red dots. The spectra of these galaxies seem to contain features that suggest the presence of an accreting supermassive black hole or AGN. AGNs are known to produce X-ray emission, and we have not detected X-rays from the little red dots. So, what exactly are the little red dots? Do they have an AGN, or are they simply a collection of very massive and compact galaxies?
A recent finding showed that three little red dots have a relatively old and evolved stellar population. We know this because of the presence of a Balmer break — a jump in the galaxy spectrum at the Balmer line — which is predominantly seen in older stars. Does this mean that these galaxies are dominated by older, evolved stars, and does that rule out the presence of AGNs? The authors of today’s article argue that the three little red dots with a Balmer break have no AGNs and are just massive, compact galaxies. Have they truly unmasked the little red dots? Let’s find out.
These Are Some Extremely Dense Galaxies
The authors find that the galaxies are extremely compact, with small half-light radii around 100 parsecs (326 light-years), similar to ultra-compact dwarf galaxies in the local universe. While the galaxy spectra can give us an estimate of the stellar mass, the contribution from the AGN alone can be a significant fraction of a galaxy’s mass and must be accounted for. The authors fit three models to the galaxy spectra: 1) assuming most of the galaxy’s light comes from an old, evolved stellar population with no contribution from an AGN, 2) assuming maximum contribution from an AGN and minimal from the stars, and 3) a model that lies somewhere in between. The three models yield very different galaxy mass estimates, with the first model estimating 100 billion solar masses in stars, and the second model estimating just a billion solar masses.
The detection of the Balmer break points toward a source that has light mostly dominated by stars. Assuming the AGN contribution to the mass is minimal, the stellar mass density would be quite high. The authors show this in Figure 1, where the model with no AGN component is shown in purple and exhibits a very high stellar mass density near the galaxy’s center compared to other galaxies. This could be taken as evidence against the no-AGN model, but there is another observation we should consider.
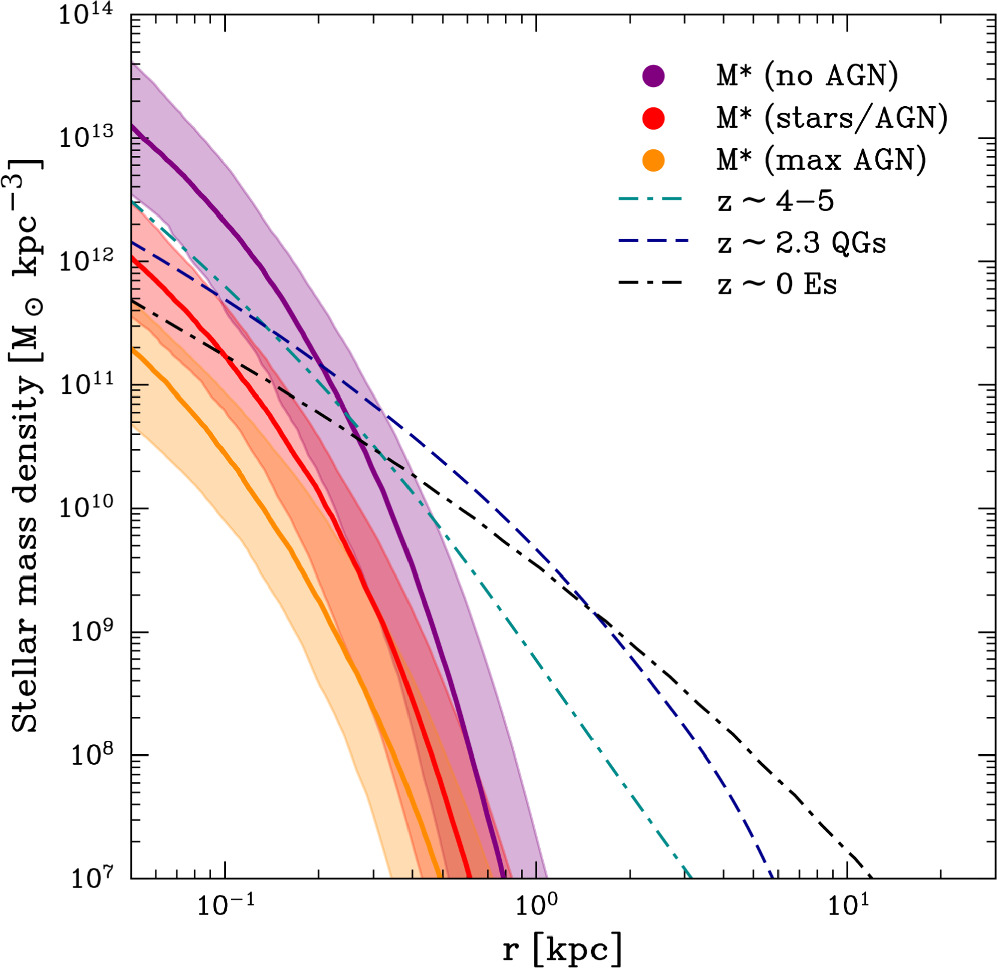
Figure 1: The stellar mass density profile — stellar mass density versus the distance from the center — for the three different models. The purple profile is for the no-AGN model. The black dotted line shows the profiles of galaxies from the local universe. The cyan and purple dotted lines show the profiles at higher redshifts. The no-AGN model’s stellar mass profile indicates a higher central density than other models. [Baggen et al. 2024]
What About the Broad Emission Line?
One of the clearest signatures of an AGN in the galaxy spectra comes from broad emission lines, which result from fast-moving gas near the supermassive black hole moving both toward and away from us. This causes a Doppler broadening of the emission lines. This associated velocity dispersion was measured in the three little red dot galaxies in today’s article.
The authors argue that the calculated velocity dispersion can be explained by the dynamics of gas and stars in the galaxy itself, without the need for an AGN. This is because of the galaxy’s extreme density, which can produce a spectral line width that is similar to that of an AGN’s broad emission line. In Figure 2, the authors show a plot of the observed velocity dispersion versus the predicted velocity dispersion, assuming it is the gas and stars present in the galaxy that are contributing to the Doppler broadening. The predicted and observed velocity dispersions seem to match very well for the model with no AGN contribution. This also provides a natural explanation for the lack of X-ray signatures in these galaxies, since we would expect to see X-ray emission if AGNs were present but no such emission from an ordinary stellar population.

Figure 2: Left: A plot of the observed versus predicted stellar velocity dispersion assuming the kinematics of the gas and stars in the dense galaxy contributing to the broad line emission. In the no-AGN model, the three little red dots (indicated by the purple square, rectangle, and pentagon) can explain the observed stellar velocity dispersion. Right: A schematic figure showing that the observed H-beta line widths can be accounted for by the velocity dispersion calculated from the kinematics. [Baggen et al. 2024]
Verdict: We Need More Evidence
However, further investigation is needed to determine if this scenario can explain every aspect of the little red dots. Additionally, the origins of such extremely dense galaxies are uncertain, and we need to understand how they evolve into the “normal” galaxies with lower central densities and larger sizes that we see today. The authors stress that the explanation of the little red dot spectra being dominated by AGNs rather than stars is still likely, and further observations are needed to uncover the truth.
Original astrobite edited by William Smith.
About the author, Pranav Satheesh:
I am a second-year graduate student in physics at the University of Florida. My research focuses on studying supermassive binary and triple black hole dynamics using cosmological simulations. In my free time, I love drawing, watching movies, cooking, and playing board games with my friends.
The post Unmasking the Little Red Dots: Active Galactic Nuclei or Not? appeared first on AAS Nova.
]]>
On the final day of AAS 245, presenters showcased unusual dwarf galaxies, the story behind Astropy, and the highly anticipated science of the NSF–DOE Vera C. Rubin Observatory.
The post AAS 245: Day 4 appeared first on AAS Nova.
]]>Editor’s Note: This week we’re at the 245th AAS meeting in National Harbor, MD, and online. Along with a team of authors from Astrobites, we will be writing updates on selected events at the meeting and posting each day. Follow along here or at astrobites.com for daily summaries, or follow @astrobites.bsky.social on Bluesky for more coverage. The usual posting schedule for AAS Nova will resume on January 21st.
Table of Contents:
- Plenary Lecture: The Star Formation Engine, Stella Offner (University of Texas, Austin)
- Splinter Session: The Habitable Worlds Observatory: Current Status and Opportunities for Engagement
- Splinter Session: A Conversation About the Gemini Observatory Strategic Plan for the 2030s
- Press Conference: Exoplanets: From Formation to Disintegration
- Dannie Heineman Prize for Astrophysics Lecture: Past, Present, and Future Cosmic Microwave Background Surveys, John E. Carlstrom (University of Chicago)
- Seminar for Science Writers: Bringing the Night Sky to Life: NSF–DOE Vera C. Rubin Observatory Will Revolutionize the Way We Explore the Cosmos
- Press Conference: Galactic Histories and Policy Futures
- RAS Gold Medal Lecture: From the Cradle: Applying Basic Physics to Astrophysical Fundamental Questions, Gilles Chabrier (ENS-Lyon)
- Plenary Lecture: Lancelot M. Berkeley − New York Community Trust Prize for Meritorious Work in Astronomy Lecture: Erik Tollerud (Space Telescope Science Institute), Clara Brasseur (University of St Andrews), and Kelle Cruz (CUNY Hunter College and American Museum of Natural History)
Plenary Lecture: The Star Formation Engine, Stella Offner (University of Texas, Austin) (by Jessie Thwaites)
“The story of a star’s life is written at birth,” says Dr. Offner, whose plenary lecture describes the details of numerical simulations to understand the birth and evolution of stars in our Universe. She and her team in the STARFORGE project have created some beautiful animations of their simulation output, which made for riveting visuals in her talk (they also publish them on their website, so check their movies out here!).
She begins with the stellar initial mass function (IMF), which is known from observations but that they want to describe with their simulation from first principles. It’s a difficult problem to solve — there are multiple scales and many processes at play, and although we have incredible observations from JWST for star forming regions like the Carina Nebula, which is actively forming thousands of stars, this is only a single snapshot in time.
The star formation engine is a process with many scales, starting from a molecular cloud in a galaxy, which has a dense core region with an accretion disk. A forming star may have a protostellar outflow or a wind bubble, depending on its size, and when it eventually goes supernova it launches material back into the galaxy, beginning the process over again. Dr. Offner’s simulations need to cover 10 orders of magnitude in space and 20 orders of magnitude in density (that means that if the smallest region is of order 1 in both space and density, making simulations that consistently model regions that are 10,000,000,000 larger and 100,000,000,000,000,000,000 times more dense, and everything in between) — a huge feat! To do this, they use Frontera supercomputers and hydrodynamic codes to attack this challenge.
Their codes include a variety of processes, from physics models for self-gravity (which tell them how the gas interacts with itself), magnetic fields, and turbulence, to stellar feedback mechanisms such as protostellar outflows, stellar winds, radiation, and supernovae. They combine these with important microphysics considerations, including heating and cooling mechanisms and cosmic rays.
In one animation, they begin with a cloud of gas 10 parsecs across and initial turbulence conditions. As the simulation evolves, complex structures begin to emerge, and the first protostars form. The protostars begin to have outflows reaching hundreds of kilometers per second, and as more stars form, they begin to form and interact with each other in clusters. The first high-mass stars begin to interact, and eventually slow down due to feedback and supernovae from these massive stars, until the center of the cloud can be revealed in optical light. Through this process they are able to reproduce the IMF conditions, and even with 15 more simulations they find a very similar IMF, reproducing the observed IMF.
One of the elements that is new in these simulations but is incredibly important, Dr. Offner says, is cosmic ray ionization in the clouds. These charged particles are responsible for heating the dense gas and eventually the formation of molecules, which make them especially important to astrochemistry. They find the cosmic ray energy has an impact on the IMF, which leads them to ask if regions with high cosmic ray densities (like the centers of galaxies) might have a different IMF than other regions. To study star formation in galaxies in addition to their simulations, they team up with the FIRE (Feedback in Realistic Environments) simulation team to produce consistent simulations from the galaxy scale down to an accretion disk around a black hole. They find that the IMF does change in their simulations depending on the distance from the center of the galaxy — an important result for understanding how stars form in galaxies.
There is still more work to be done, Dr. Offner says. The simulations can include still more physics models and astrochemistry, important for understanding how chemical compounds and planets form, which is important to studying habitability over time. Trying to follow all of these chemical considerations is too expensive with traditional simulations, but are excellent problems to approach with machine learning. She and her team at the newly established NSF AI Institute for Cosmic Origins are working to understand these problems using robust machine learning techniques.
Splinter Session: The Habitable Worlds Observatory: Current Status and Opportunities for Engagement (by Lindsey Gordon)
This splinter session discussed NASA’s next flagship mission after Roman launches, the Habitable Worlds Observatory (HWO). This was the main mission recommended by the 2020 decadal survey, and will be a sort of “SuperHubble,” with similar wavelength coverage but a 6–8 meter aperture (Hubble’s aperture is 2.4 meters across). This will be the first instrument capable of directly imaging an Earth-like planet, but any object in the infrared through the ultraviolet can be observed. The mission will have a coronagraph, a high-resolution imager, an ultraviolet multi-object spectrograph, and a not-yet-determined fourth instrument that will be decided on by community demand.
Dr. Makenzie Lystrup, the director of Goddard Space Flight Center, opened the session by thanking everyone who is engaging with HWO. She emphasized the importance of community in the project, both in its development and its long-term usage, and Goddard’s commitment to executing the project on budget and on schedule to produce a mission that will be a major community resource.
We then heard from one of the leads of the Science Community Engagement team. They want to get both the scientific community and the public excited about this mission as it searches for life in the universe. There is an upcoming meeting, HWO25, and they hope to involve the community in the conversations there. The remainder of the session included presentations from the science working groups (Living Worlds, Solar Systems, Evolution of the Elements, and Galaxy Growth), industry partners, “pop” talks from Early Career Researchers, and a mini “Town Hall” with tables from different groups to start discussion.
You can find out more about HWO on their NASA website or by requesting to join their Slack.
Splinter Session: A Conversation About the Gemini Observatory Strategic Plan for the 2030s (by Lindsey Gordon)
The Gemini Observatory ran a splinter session to discuss their 2023–2028 improvement plan and the future of the telescope. Scott Dahm, the interim director, discussed the new instruments. GHOST, IGRINS-2, GPI-2, SCORPIO, and GIRMOS are all going online in that timeframe at both the North and South observatories, and these instruments make up a set of new spectrographs and imagers that will improve Gemini’s capabilities. GNAO is the new adaptive optics system for the North observatory and is scheduled to go online in 2028. Gemini is also getting a new proposal writing and execution platform, the Gemini Program Platform, in coming years to streamline and centralize observing.
Gemini’s critical science areas include exoplanets, time domain (transient) astronomy, galaxy science, and star and planet formation. The observatory will play a key role in selecting exoplanet targets for JWST, performing rapid transient followup, and providing advanced adaptive optics for observations.
The science team & NOIRLAB are highly involved in public outreach and community based astronomy. They’re adding a cultural residency program this year, doing anti-light-pollution work to keep Chile’s skies dark, and just celebrated the 20th anniversary of their Journey Through the Universe program reaching thousands of students in Hawai’i. The team is also supporting the transition of the management of Maunakea’s observatories to the Maunakea Stewardship and Oversight Authority.
Press Conference: Exoplanets: From Formation to Disintegration (by Lexi Gault) (Briefing video)
An ALMA Survey of Circumstellar Disks in Young Binaries
Taylor Kutra (Lowell Observatory)
Stars and their planets are born out of clouds of gas and dust that collapse over time, but frequently stars are not formed alone but rather in binary pairs or larger groups. In order to understand how planets form in binary star systems, it is important to study the environments where they are born — the circumstellar disks of their host stars. Dr. Kutra presented ALMA (the Atacama Large Millimeter/submillimeter Array) imaging of the circumstellar disks of binary star system DF Tau. Prior to ALMA imaging, Dr. Kutra thought that only the primary star in the system had a circumstellar disk and any remnant light was noise; however, with the ALMA images it became clear that both stars in the system are surrounded by a disk of gas and dust. These observations provide the basis for future investigations into binary star systems and their journey to forming planets. | Press release
A New NASA Mission to Characterize Exoplanets and Their Host Stars
Ben Hord (NASA Goddard Space Flight Center)
Dr. Hord shared updates and science goals from the new NASA Pandora SmallSat Mission that plans to observe and characterize exoplanet host stars and exoplanetary atmospheres. This is a space-based mission, employing a 0.44-meter telescope that can observe simultaneously at visible and near-infrared wavelengths. During its 1-year primary mission, Pandora will observe more than 20 known exoplanet systems, collecting data on the host stars’ light profiles as well as spectra to identify the composition of exoplanet atmospheres. These observations will allow astronomers to better understand exoplanet atmospheric conditions and will aid in the search for habitable planets. Pandora will be able to perform follow up observations on exoplanet candidates observed with JWST and will be a critical tool in the exploration of exoplanetary systems. | Press release
X-Rays in the Prime of Life: Irradiating Vulnerable Planets
Scott Wolk (Smithsonian Astrophysical Observatory)
When searching for habitable planets in the galaxy, astronomers often target low-mass main sequence stars (M stars) as they are the most common star type in the galaxy. Dr. Wolk presented observations of M star Wolf 359 that is very bright in the X-ray. This star is about 10% the mass of our Sun and its habitable zone is very close to the star. However, this star is pumping out tons of X-ray radiation that can evaporate an exoplanet’s atmosphere over the course of a couple million years. This is very detrimental to any potentially habitable planet, but Dr. Wolk explained the conditions required for a planet to still be habitable under these conditions. Earth, for example, has a very massive reservoir of liquid water in our oceans, which under these X-ray conditions, could replenish the atmosphere for an extra 600 million years. However, this is still not a very long time for life to develop or persist, and Wolf 359 has emitted multiple flares, which would expose the planet to even more damaging radiation. Is there any hope left? If a planet had a water reservoir equivalent to 11 times the amount of water in Earth’s oceans, it would continue to have an atmosphere, so while not all hope is lost, X-ray emission from M-type stars poses a significant threat to their planetary systems’ habitability. | Press release
Bright Star, Fading World: Dusty Debris of a Dying Planet
Marc Hon (Massachusetts Institute of Technology)
In exoplanet systems, if a planet orbits too closely to its host star, the star will heat the planet into an extremely hot ball of lava. A small enough planet, smaller than Earth, is not able to hang onto its atmosphere, and as it orbits its star, the material evaporated from the planet will form a comet-like tail of material trailing behind the planet. Dr. Hon announced the Transiting Exoplanet Survey Satellite discovery of one such disintegrating exoplanet BD+05 4868 Ab. Through their observations, they have found that the planet has a long trailing tail of material and a smaller leading tail. From their measurements, this planet is losing one Moon’s worth of mass every million years, which would destroy a small planet completely. This discovery opens up the realm of dying planets, and we can continue to learn about them with further observations. | Press release (PDF)
JWST Exposes Hot Rock Entrails from a Planet’s Demise
Nick Tusay (Penn State University)
In the theme of dying planets, JWST observations have revealed the disintegrating entrails of planet K2-22b. As Tusay explained, when planets are disintegrating, you can study the composition of their layers as they shed. Using the JWST data, they modeled the compounds in the dust cloud coming from the planet. These models show that the compounds are not consistent with iron-dominated material, suggesting that this planet has not yet been stripped down to its core, and the compounds are not consistent with rock vapor. Looking for other plausible materials, they find their data is most consistent with CO2 and NO, which are “ice” vapors. But how could this planet so close to its star have ice? Tusay suggests that this planet may have formed further out but was thrown inward by a binary star companion. Further observations of similar systems will aid in understanding dying planets and their origins. | Press release (PDF)
Dannie Heineman Prize for Astrophysics Lecture: Past, Present, and Future Cosmic Microwave Background Surveys, John E. Carlstrom (University of Chicago) (by Bill Smith)
The cosmic microwave background (CMB) is one of the most important pieces of evidence for our modern understanding of the cosmos, and Dr. John Carlstrom has played a key role in the development of the interferometry techniques and telescopes that led to the precise measurements of the microwave sky we have today. He was awarded the Dannie Heineman Prize for Astrophysics, awarded jointly by the American Institute of Physics and the American Astronomical Society and funded by the Heineman Foundation, for his “pioneering work on microwave interferometry and his leading role in the development of the South Pole Telescope.”
He shared how his own interest in microwave astronomy was born out of studying the Sunyaev-Zeldovich (SZ) effect, in which microwaves from the CMB are distorted when passing through galaxy clusters en route to Earth. As Dr. Carlstrom said, the SZ effect leaves a “shadow” of sorts in the sky in the microwave spectrum in the vicinity of the most massive objects. Because this “shadow” measures thermal energy, it can be used as a proxy for the mass of the cluster. He recounts building the “SZ Array” with Marshall Joy to take low-brightness images over an extended period of time to successfully measure the SZ effect and use it to calculate cosmological parameters like Omega matter and the Hubble constant.
The next project he focused on was DASI, the Degree Angular Scale Interferometer at the South Pole. From DASI data, Dr. Carlstrom and his team were able to measure the matter power spectrum to a high enough precision to conclude for the first time that dark matter was needed in the very early universe and were able to measure the polarization of the CMB for the first time.
Following this, Dr. Carlstrom discussed the South Pole Telescope (SPT), and the many ways it is groundbreaking. He showed preliminary work of a galaxy cluster catalog developed with SPT data showing the relationship between redshift and cluster mass. He then highlighted multiple results from younger scientists in the collaboration observing transient phenomena, like stellar flares, blazars, and asteroids. Dr. Carlstrom continued by highlighting the importance of polarization and CMB lensing, and how measuring the E modes and B modes would allow insight into the gravitational waves generated by inflation, and thus insight into inflation itself. To measure the B modes, though, would require measuring fluctuations in the CMB on order of 10 nanoKelvin, which is still out of reach, but a new SPT camera being built could lead to a future measurement. He concluded with a quick look to the future, noting that the SPT has multiple datasets over multiple years at this point, and that a new telescope called CMB-S4 is also in the works.
Seminar for Science Writers: Bringing the Night Sky to Life: NSF–DOE Vera C. Rubin Observatory Will Revolutionize the Way We Explore the Cosmos (by Kerry Hensley) (Briefing video)
Thursday afternoon brought a special session for science writers introducing the Vera C. Rubin Observatory. The observatory is currently under construction on Cerro Pachón, a mountain in the Coquimbo region of Chile north of Santiago. There, it is dry, high, and the nights are dark — critical factors for the exceptionally broad and deep science that the observatory will enable. Though the wait for this highly anticipated observatory has been long, the wait is almost over, with the first image to be released this summer and the full science survey to be underway by the end of 2025. The mission of the observatory is to bring the night sky to life, which it will accomplish by scanning the sky for 10 years and creating a time-lapse record of the universe — in other words, the greatest cosmic movie ever made. The observatory is also notable for being the first project of similar scale to incorporate education and public outreach from the project’s inception. “The universe is universal,” and the Rubin team aims for anyone who is interested to be able to get involved through formal education, public outreach, and citizen science.
First up in the seminar was Sandrine Thomas, who got the audience acquainted with the basics of the observatory and its namesake, Vera Rubin. Rubin was an astronomer who provided the first convincing evidence for dark matter and advocated for women in astronomy. Fittingly, the Vera Rubin Observatory is the first major US observatory named for a woman. And don’t forget the name! Though astronomers love acronyms, Thomas emphasized how critical it is not to reduce the observatory’s name to “VRO” (there’s a list of recommended name variations on the observatory’s media page).
Rubin Observatory’s mission is to capture the cosmos, and to do that, it needs a wide field of view, a speedy telescope, and the ability to see faint objects. The 3.5-degree field of view — equivalent to the area of 45 full Moons — and fast-moving 350-ton telescope enable the observatory to take repeated images of the entire southern night sky in 3–4 nights. The observatory boasts a 3,200 megapixel camera — the largest digital camera ever constructed — and six color filters from near-ultraviolet to near-infrared. Looking ahead, the camera installation will take place in March 2025, with first look expected June/July 2025 and the survey expected to start late 2025.
Leanne Guy introduced Rubin’s four key science areas: dark matter and dark energy, Milky Way structure and formation, a census of the solar system, and the changing sky. Designing a survey that can advance our understanding of all four of these areas is challenging, so the team worked collaboratively with the scientific community to set the survey cadence. The result is a survey that will generate 2 million exposures over 10 years, raking in 20 terabytes of data each night. The most frequently surveyed fields, the “deep drilling fields,” will be visited roughly 1,000 times in those 10 years.
The scientific yields are immense: for the Milky Way, the survey will produce a map 1,000 times larger than previous surveys. For our understanding of dark matter and dark energy, the wide field of view and faint object detection will provide an avenue to study these phenomena and explore alternate theories of cosmology. The solar system census will uncover four times more solar system objects than we currently know, changing the game for planetary defense, among other benefits. Finally, Rubin will detect 10 million changes in the night sky every night, uncovering rare events and enabling detailed follow-up observations. Speaking of follow up, Rubin can act as a follow-up facility in its own right, and Guy asserted that the observatory will be ideal for following up on gravitational wave detections.
Tackling the data discussion was Yusra AlSayyad, who demonstrated why an observatory like Rubin couldn’t be built until now: after all, only 20 years ago, we were still getting Netflix via DVDs! The same technology that has allowed streaming and social media to proliferate has also enabled this groundbreaking observatory, which will snap an image every 40 seconds, collecting 60 petabytes (that’s 60 quadrillion bytes) of data in 10 years. In just a single year, the survey will more than double the number of raw optical and infrared images in existence.
This massive dataset requires thoughtful data management and distribution strategies. Minutes after changes in the night sky are detected, alerts will be sent out to enable followup. But the number of alerts — potentially as large as 10 million per night — would be overwhelming, so Rubin will partner with community brokers who will filter these alerts and send out a whittled-down number. The facility will also produce annual data releases, culminating in a 500-petabyte final release. As this is far too large to download onto a laptop, data users will interact with the data through a cloud-based science platform.
Beth Willman from the LSST Discovery Alliance expanded upon the data distribution policies of the observatory. Rubin data will be immediately available to anyone in the US and Chile, as well as scientists from participating institutions. The data will become available to all two years after collection. Willman highlighted the global nature of the endeavor, with 28 countries contributing to the physical construction of the observatory or the creation of its software. “It’s not your mother’s science,” Willman said, emphasizing that the massive amount of data that will be produced represents both a challenge and an opportunity to create a new paradigm in how science is done. Part of that new paradigm will be infrastructure that facilitates the participation of professional and citizen scientists across the globe. And the impact is likely to extend beyond astronomy, as the data management and discovery methods can be applied to other big-data fields.
Finally, Stephanie Deppe closed the session by introducing resources to learn more, including the Rubin media kit, images and videos, an opportunity to visit the observatory site this spring, and opportunities to receive an email digest or press releases.
Press Conference: Galactic Histories and Policy Futures (by Archana Aravindan) (Briefing video)
A Dwarf Galaxy’s Stellar Halo Built by Accretion
Catherine Fielder (University of Arizona)
This study by Dr. Fielder and team offers a rare glimpse into the evolution of a small dwarf galaxy, NGC 300, and its role in building stellar halos. While massive galaxies grow through mergers, forming extensive stellar halos, dwarf galaxies have fewer opportunities for such assimilation. Using deep imaging from the DELVE survey, resolved star maps reveal intricate structures around NGC 300, including a northern stream that extends over 100,000 light-years. The metallicity of these streams suggests they originated from a smaller galaxy that NGC 300 pulled apart, driving the formation of its stellar halo through accretion. This opens exciting opportunities for future exploration of how dwarf galaxies can form and evolve with Rubin and Euclid. | Press release
The Boundary of Galaxy Formation: Constraints from the Ancient Star Formation of the Isolated, Extremely Low-Mass Galaxy Leo P
Kristen McQuinn (Space Telescope Science Institute and Rutgers University)
Satellite galaxies typically follow a pattern of initial bursty star formation that is later followed by a period of star-formation quenching close to the epoch of reionization. However, Dr. McQuinn and collaborators find that one particular low-mass galaxy, Leo P, underwent a slightly different process. This isolated galaxy experienced three distinct phases of evolution: early star formation, a pause post-reionization, and a later reignition of star formation. Unlike satellite galaxies near massive systems, where environmental effects such as tidal stripping may entangle with reionization, Leo P’s isolation could provide crucial insights into the role of reionization in halting star formation. Similar patterns are also observed in other low-mass galaxies. Dr. McQuinn’s findings suggest that reionization may suppress star formation in galaxies larger than ultra-faint dwarfs, with varying effects based on environmental factors. If extended pauses in star formation are common, low-mass galaxies likely contributed minimally to reionization. | Press release
Resolving 90 Million Stars in the Southern Half of Andromeda
Zhuo Chen (University of Washington)
The Local Group of galaxies, particularly Messier 31 (the Andromeda Galaxy or M31), is an ideal laboratory for studying galaxy astrophysics. As the Milky Way’s closest large neighbor, M31 allows for detailed exploration, with the ability to resolve hundreds of millions of stars. The Panchromatic Hubble Andromeda Southern Treasury (PHAST) survey, of which Dr. Chen is a part, has produced the largest and sharpest photomosaic of the southern disk of M31, spanning decades and composed of 600 overlapping Hubble snapshots. The central region hosts older stars, while the southern disk features prominent dust lanes and young star-forming regions like NGC 206, along with numerous young star clusters. Observations also include Messier 32, a satellite galaxy dominated by older stars. Detailed analysis reveals that M31’s star formation history spans four age groups: very young (3–200 Myr), young (30–500 Myr), intermediate (0.8–2 Gyr), and old (> 2 Gyr). Tracking the older stars reveals a typical disk galaxy lacking visible spiral structures. Conversely, younger populations highlight more defined spiral arm structures, with the youngest stars creating the most pronounced features. | Press release
Recent Space Policy Statements Regarding Our Dark and Quiet Skies
John Barentine (Dark Sky Consulting)
The COMPASSE (Committee for the Protection of Astronomy and the Space Environment) empowers the astronomy community to advocate for preserving dark and radio-quiet skies, which face growing threats from satellite constellations, solar power infrastructure in space, and commercial space advertising.
To address these challenges, the AAS has issued key statements:
- Transparency in Spaceflight Activities: Space activities, including cislunar (space around the Moon) and interplanetary missions, should be conducted openly, with publicly reported trajectories.
- Atmospheric Impacts: Satellite launches and reentries contribute to atmospheric pollution. Congress needs to fund research to study and minimize their environmental effects and ensure that companies that launch satellites take them into consideration.
- Space Advertising: Obtrusive space advertising poses a significant threat to ground-based astronomy and should be prohibited. The US and AAS are leading efforts to prevent its proliferation.
COMPASSE has also endorsed the IAU resolution on protecting dark skies and engaged with the US State Departments to promote these goals. Through these actions, COMPASSE aims to safeguard the observational capabilities essential for advancing astronomical research.
RAS Gold Medal Lecture: From the Cradle: Applying Basic Physics to Astrophysical Fundamental Questions, Gilles Chabrier (ENS-Lyon) (by Bill Smith)
In the spirit of collaboration between the United States and United Kingdom, it has become tradition for the winner of the Royal Astronomical Society (RAS) Gold Medal to present a lecture at a meeting of the American Astronomical Society, and the winner of the AAS’s Henry Norris Russell Lectureship to present at a meeting of the RAS. This year’s Gold Medal winner, Dr. Gilles Chabrier, presented on how ideas from statistical mechanics can inform our understanding of star formation and cosmology.
His goal for the first half of the lecture was to explain his theory for the stellar initial mass function, which is a probability density function that describes the initial masses of a stellar population. He began by reviewing random field theory and how it is based on two random fields, a velocity field and a density field, occupying a space. One can think of the giant gas clouds out of which stars form as a turbulent gas. That turbulent gas, however, also self-attracts under the force of gravity. Dr. Chabrier went on to show how these dual influences, turbulence and gravity, will result in overdensities collapsing into masses following a log-normal probability density function with two power-law tails.
After that, Dr. Chabrier focused on irreversible processes in cosmology. He explained how in our standard understanding of the universe’s expansion, the inhomogeneities in the universe are negligible in redshift, but that the question of homogeneity is coordinate dependent. He suggests the introduction of a local expansion rate to fulfill the need for a covariant calculation of the cosmological redshift. He then explains that large-scale structure can also be thought of as a result of this turbulence generating a random field in which overdensities develop due to the influence of gravity. For dark matter, which is collisionless, large-scale structure forms when dark matter particles begin crossing trajectories (called shell-crossing). This leads to turbulent flows with overdensities that collapse into what we know as dark matter halos. As Dr. Chabrier points out, though, this is an irreversible process, which produces entropy. This entropy production plays a crucial role in the expansion of the universe, and Dr. Chabrier concluded by arguing that the cosmological constant appears as a proxy to account for the entropy production of the expansion rate.
Lancelot M. Berkeley − New York Community Trust Prize for Meritorious Work in Astronomy Lecture: Erik Tollerud (Space Telescope Science Institute), Clara Brasseur (University of St Andrews), and Kelle Cruz (CUNY Hunter College and American Museum of Natural History) (by Bill Smith)
Writing the line of code “import astropy” has become a rite of passage for nearly every astronomy researcher, and many people in the astronomy community have long noted the unrecognized and undervalued work that has gone into creating and maintaining software. This year, the AAS recognized this work by awarding the Lancelot M. Berkeley − New York Community Trust Prize for Meritorious Work in Astronomy to the entire Astropy collaboration “for their work developing and maintaining this code base, which provides underlying support for much of astronomy research as it is conducted today.”
Accepting the award on behalf of the entire collaboration were Dr. Erik Tollerud of the Space Telescope Science Institute, Clara Brasseur, a graduate student at University of St. Andrews, and Dr. Kelle Cruz of Hunter College. They began by playing an extensive list of all of the people who contributed to astropy on the big screen and thanking them for their contributions, then divided the talk into three parts that described the past, present, and future of Astropy.
Dr. Tollerud began by recounting Astropy’s origin story to a time in 2011 when he had to transform astrophysical coordinates and found himself struggling to navigate the many packages available. When reaching out to a mailing list about his idea for a more standard package, he was met with skepticism that it would be yet another package to navigate. He then explained how an initial group decided that this package would be developed differently. First, it would utilize Github (which was new at the time) for better collaboration, and adopt a “do-ocracy” philosophy, which Dr. Tollerud explains as “the work that gets done is the work someone will do.” He also credits the organizational structure of the early developers, saying “if you make the right structure, even cats can be herded.”
Dr. Cruz then described the current successes and challenges of the Astropy collaboration. She cites the original Astropy paper as being on track to be one of the most-cited astronomy papers ever as a resounding success. She also cites the thorough testing and stability of the core package as another success. She goes on to explain that the success of Astropy has presented new challenges. First, because Astropy is now such a critical piece of infrastructure for much of the astronomical community, including for most missions, testing and stability of the code are more critical than ever, requiring more resources and making it more challenging for people newer to software engineering to contribute. She then explained Astropy’s package structure, which includes core packages, coordinated packages, and affiliated packages.
Dr. Cruz also explained the governance structure of the collaboration, which included adopting a charter and policies for transparency. She also shared details about the Astropy collaboration’s increasing success in securing funding for the project. She thanked the many institutional contributors and highlighted contributions from the Flatiron Institute and NASA.
Clara Brasseur concluded the plenary by discussing the future of Astropy. They discussed how the core codebase is in a “maintenance phase,” but that maintenance for a software package like Astropy is still a lot of work, including bug reports, documentation, tutorials, and more. They highlighted a huge area for growth, Astropy Learn: a new website that hosts tutorials, mainly in the form of Jupyter notebooks, on many of the astropy modules. Clara concluded with a call to the audience to get involved and noting the possibilities that contributing can bring, saying “I’m a graduate student, and I’m up here giving a plenary talk! We have a place for any type of contribution.”
The post AAS 245: Day 4 appeared first on AAS Nova.
]]>
High-energy astrophysics, massive stars, and the solar neighborhood took center stage on Day 3 of AAS 245.
The post AAS 245: Day 3 appeared first on AAS Nova.
]]>Editor’s Note: This week we’re at the 245th AAS meeting in National Harbor, MD, and online. Along with a team of authors from Astrobites, we will be writing updates on selected events at the meeting and posting each day. Follow along here or at astrobites.com for daily summaries, or follow @astrobites.bsky.social on Bluesky for more coverage. The usual posting schedule for AAS Nova will resume on January 21st.
Table of Contents:
- HEAD Bruno Rossi Prize Lecture: Martin Weisskopf (NASA Marshall Space Flight Center) and Paolo Soffitta (INAF-IAPS)
- Press Conference: Discovering the Universe Beyond Our Galaxy
- Plenary Lecture: Are We Alone? The Search for Life on Habitable Worlds, Giada Arney (NASA Goddard Space Flight Center)
- Press Conference: New Findings About Stars
- Plenary Lecture: Revealing the Solar Neighborhood’s Diversity and the Milky Way’s Substellar Halo, Aaron Meisner (NSF NOIRLab)
- Plenary Lecture: Newton Lacy Pierce Prize Lecture: The Evolution, Influence, and Ultimate Fate of Massive Stars, Maria Drout (University of Toronto)
HEAD Bruno Rossi Prize Lecture: Martin Weisskopf (NASA Marshall Space Flight Center) and Paolo Soffitta (INAF-IAPS) (by Jessie Thwaites)
Dr. Weisskopf says he expected to be surprised with the results from the Imaging X-ray Polarimetry Explorer (IXPE), but both he and Dr. Soffitta knew how important studying the polarization of high-energy objects in our universe would be to advancing X-ray astronomy. They, along with the entire IXPE team, are the recipients of this year’s High Energy Astrophysics Division (HEAD) Bruno Rossi Prize in recognition of the amazing science their instrument enables. (For a review of polarimetry, check out this Astrobites Guide!)
Dr. Weisskopf began the session by giving a brief history of how IXPE came to be. He realized that without considering polarization, the X-ray astronomy community would be missing a key element in their toolbox. They began by including a polarimeter on a rocket to look at Scorpius X-1, known to be a very bright X-ray source. With only 5 minutes to observe, they were able to prove the merit of their instrument on this short flight, which paved the way for new developments in the decades to come.
Next, they launched two types of polarimeter on the orbiting solar observer (OSO-8), and detected the Crab Nebula’s strong polarization, which is consistent with emission from relativistic electrons being bent by a magnetic field (synchrotron radiation). After this success, the team improved the instrument, and together the team proposed the mission to NASA. Although they weren’t initially selected, the mission that was selected ended up being cancelled due to budget issues, so the team re-submitted — and were selected! With one condition: that no data would be proprietary.
After launching the instrument in 2021, the surprises commenced; sources that were expected to have high polarization (from lots of synchrotron radiation) actually were weakly polarized, and vice versa. They observed a wide variety of sources, from magnetars and pulsars to supernova remnants and compact objects, and many more. They observed the bright magnetar 4U 0142+61, which has an energy dependence to its polarization, where both the polarization degree and angle change as a function of energy.
Dr. Soffitta begins his part of the lecture discussing the innovative techniques employed in the IXPE detector. They realized that they could harness the power of the photoelectric effect, where the electron would be emitted preferentially in the direction of polarization. This allowed them to build a broadband detector with sensitivity to many different source classes. Altogether, he says, they submitted the proposal for IXPE 13 times before it was finally selected to be built.
The results they find with this instrument are transformative to understanding these different source classes. They found that around 50% of the sources they studied had a polarization greater than 0, providing new insight into the magnetic field behavior in multiple source classes, and with important implications for particle acceleration happening in that source.
Dr. Soffitta describes a few of the important results so far with IXPE, starting with the polarization of active galactic nuclei. In NGC 4151, which is a Seyfert 1 galaxy, they find a polarization angle parallel to the radio jet, indicating that the corona is in the plane of the disk. On the other hand, in the Circinus Galaxy, which is a Seyfert 2 (meaning that we can’t see the central black hole but instead only see the surrounding torus), they find the polarization is instead perpendicular to the inner jet, which they interpret as the radiation being reflected. They find blazars to have 3–5 times higher polarization in X-rays than in lower wavelengths, which indicates the presence of electrons accelerated in the source emitting synchrotron radiation.
IXPE has enabled many possibilities for X-ray astronomy, including its fascinating results describing the mechanisms at play in many different source classes. Dr. Weisskopf leaves the audience with the directive to “enjoy wrestling with the scientific implications” of these astonishing results from IXPE.
Press Conference: Discovering the Universe Beyond Our Galaxy (by Lexi Gault) (Briefing video)
Introduction: 100 Years Since Hubble Discovered the Universe Beyond Our Galaxy (Press Release)
Jeff Rich (Carnegie Science Observatories)
Though we have marveled at faraway galaxies for quite some time now, just 100 years ago at an AAS meeting in Washington, DC, Edwin Hubble announced his discovery of galaxies beyond the Milky Way. Setting the stage for today’s press conference, Dr. Rich explained that Hubble had detected a Cepheid variable — a star whose brightness changes cyclically over time — in the Andromeda Galaxy. With this detection, Hubble could determine the distance to Andromeda, and for the first time, discovered a celestial object beyond our own galaxy. This discovery, as Dr. Rich reminded us, was made possible by the work of many astronomers, including Henrietta Swan Leavitt’s discovery of the period-luminosity relationship for Cepheid variables, and Harlow Shapley, who measured the size of the Milky Way that made Hubble’s distance calculation possible. With access to great telescopes and technology, astronomers have been able to make leaps and bounds in our understanding of the universe in a very short amount of time. Next generation instruments will continue to allow scientists in this generation and the next to flourish and discover more and more about the universe in which we live.
The Hubble Tension in Our Own Backyard
Daniel Scolnic (Duke University)
One of the most pressing issues in cosmology is the Hubble Tension, which is the discrepancy between the prediction of the current expansion rate of the universe based on the current standard cosmological model and what astronomers observe locally. In order to attempt to reconcile this tension, the Dark Energy Survey Instrument (DESI), as Dr. Scolnic explained, has built its own cosmological distance ladder to attempt to make a very precise measurement of the Hubble constant. Through observing supernovae in the Coma Cluster, DESI has been able to very precisely measure the distance to the Coma Cluster. However, the standard model predicts a distance farther away from us than has been measured by DESI and by many investigations prior. Objects in the universe are closer than our current cosmological standard model predicts, which, as Dr. Scolnic emphasized, has pulled the Hubble Tension taught, creating a crisis.
JWST Reveals the Early Universe in Our Backyard
Nolan Habel (NASA Jet Propulsion Laboratory)
Dr. Habel takes us to cosmic noon, the peak of star formation in the universe, which occurred when the universe was just 2.5 billion years old. At this time, a significantly smaller fraction of the universe’s gas had been processed into stars, meaning this star formation occurred with many fewer metals than exist in the universe today. Metals are a driver of the cooling of the interstellar medium, allowing the gas to collapse and coalesce into stars and planetary systems. But observing star formation under these conditions is difficult. Dr. Habel and collaborators have used JWST observations to study the nearby star-forming region NGC 346 in the Small Magellanic Cloud that has similar metallicity to that of cosmic noon. They are able to take spectra of individual protostars — stars early in their formation — probing the formation processes that shine a light on how stars and planets may have formed at cosmic noon.
Growing in the Wind: Watching a Galaxy Seed Its Environment
David Rupke (Rhodes College)
Galaxies and their surroundings form an ecosystem in which gas travels into and out of galaxies, mixing materials, spreading metals, and enriching the circumgalactic medium. Dr. Rupke presented observations of Makani, the Hawai’ian word for wind, a galaxy actively seeding its environment with cool clouds of oxygen. The galaxy is surrounded by a nebula of gas extending 300,000 light-years that has been ejected by multiple hot winds that push material out of the galactic center. Simulations show that as these clouds travel outward, they cool, but this is difficult to observe directly as it occurs on very small scales. Using the Hubble Space Telescope, Dr. Rupke and collaborators imaged Makani in the far-ultraviolet, tracing the emission from oxygen that is five times ionized, which traces the gas where the cooling rate is at its peak. This imaging has set a benchmark for future observations of galaxies feeding their environments with future, stronger telescopes.
Three Quenched, Faint Dwarf Galaxies: New Probes of Reionization and Stellar Feedback (Press Release)
David Sand (University of Arizona)
Far from other galaxies, stranded out in the field, are three ultra-faint dwarf galaxies that have been discovered by Dr. Sand and his collaborators. Unlike the small faint satellites orbiting the Milky Way that are subject to life-altering interactions, these ultra-faint dwarfs are unperturbed, making them ideal targets for studying how the smallest structures in our universe form and evolve without complicated interactions with larger-scale structures. First discovered in images from the Dark Energy Camera Legacy Survey (DECaLS), the ultra-faint dwarfs were observed in more detail with the Gemini South telescope to really get a good picture of these fuzzy patches. From these observations, Dr. Sand reported, each of these galaxies has a single old, metal-poor stellar population, no recent star formation, and no gaseous components. This suggests that these galaxies either blew out their gas through supernova explosions or the reionization of the universe evaporated the gas from these galaxies. Further studies and discoveries of similar ultra-faint dwarf galaxies will provide more clues into the evolutionary conditions of these galaxies.
Plenary Lecture: Are We Alone? The Search for Life on Habitable Worlds, Giada Arney (NASA Goddard Space Flight Center) (by Lexi Gault)
During this plenary lecture, Dr. Giada Arney presented the science goals and plans for the Habitable Worlds Observatory (HWO). This mission aims to answer one of life’s fundamental questions: are we alone in the universe? This observatory will be a space-based, large-aperture telescope with a diameter between 6 and 8 meters and will observe through ultraviolet, optical, and near-infrared wavelengths (100–2500 nanometers). As Dr. Arney described, HWO will be a “super-Hubble,” capable of detecting Earth-like planets and characterizing their atmospheres, searching for signs of life.
The search for habitable worlds, as Dr. Arney explained, begins with liquid water. Though there is no guarantee that all possible lifeforms in the universe require liquid water to arise, we begin the search with what we know about life, and life on Earth needs liquid water. This requirement limits the search for habitable planets to Sun-like and lower-mass stars that are cool enough to host potential habitable zones. Searching for Earth-like planets around these stars will reveal whether planets like ours are common or rare, furthering our understanding of how common life may be.
Once we identify candidate planets, the search for life requires the identification of biosignatures: molecules that could not be explained without the presence of life. Dr. Arney took us through a tour of a few biosignatures that will be searched for through atmospheric composition analysis. The first biosignature, ozone (O3), is the product of photosynthesis. Though ozone can be produced in small amounts through starlight splitting water vapor apart, the lasting presence of atmospheric ozone is only known to be produced by photosynthetic life over a long duration of time. Another biosignature, methane, is primarily produced by microorganisms and builds up more through biotic (i.e., biological) processes than abiotic (i.e., physical rather than biological) processes.
However, detection of these biosignatures is not 100% indicative of life 100% of the time. There are multiple instances in which we could recover a false positive biosignature. In the case of oxygen, Earth produces very little abiotic oxygen, but this is not true for other planets. For example, Venus has a small amount of ozone, likely produced by oxygen interacting with the planet’s surface materials. In the case of methane, it can form abiotically through chemical interactions between water and iron-rich minerals. This is the case for Saturn’s moon Titan, which has an atmosphere made up of long-lasting methane that replenishes very slowly over time. With the chance of false positive biosignatures, Dr. Arney emphasizes the importance of careful observations of full stellar systems to accurately identify potential habitable worlds.
To wrap up her talk, Dr. Arney highlighted the breadth of the HWO’s science. Though intended to search for life, HWO will be a very powerful facility that will seek to answer questions across a wide range of topics in astronomy including galaxy formation and evolution, evolution of elements over time, and detailed studies of our solar system. Even more, Dr. Arney urged, HWO will answer questions we have not yet thought to ask.
Press Conference: New Findings About Stars Near and Far (by Archana Aravindan) (Briefing video)
A Predicted Great Dimming of T Tauri: Has It Begun? (More information)
Tracy Beck (Space Telescope Science Institute)
Dr. Beck studies “the” T Tauri, which is the prototype for an entire class of Sun-like stars in our galaxy. Originally thought to be a single star, T Tauri consists of two distinct systems: T Tauri North, commonly visible in optical wavelengths, and T Tauri South, a binary system obscured in the optical by a dusty circumbinary disk and located in the foreground of the northern system. In 2017 and again in 2021, T Tauri North experienced an unprecedented dimming of about 2 magnitudes — the first such event observed in over a century. Dr. Beck proposes that this dimming is caused by the T Tauri South binary system, which is moving along its wide circumbinary orbit toward T Tauri North. As it progresses, dust from the circumbinary disk is gradually obscuring the northern star along our line of sight. This process will eventually cause T Tauri North to disappear entirely from view.
A Super Star Cluster Is Born: JWST Reveals Dust and Ice in a Stellar Nursery (Press release)
Omnarayani Nayak (NASA Goddard Space Flight Center)
Recent observations from JWST by Dr. Nayak and team provide new insights into super star clusters, key sites of intense star formation 6–7 billion years ago. In the Large Magellanic Cloud, N79, a young super star cluster less than 100,000 years old, forms stars at twice the rate of the Milky Way, with JWST’s NIRCam instrument identifying more than 1,500 protostars and MIRI revealing younger stars forming centrally. Lower-mass stars form farther from the core, where five massive protostars, including one 40 times the Sun’s mass, dominate. Recently launched outflows (< 100,000 years ago) are detected by the Atacama Large Millimeter/submillimeter Array, while Chandra X-ray Observatory data confirm that the age of the super star cluster is close to 100,000 years. This super star cluster, forming stars 2–4 times more efficiently than 30 Doradus and twice as efficiently as the Milky Way, offers a vital glimpse into the earliest stages of protostar formation.
A Discovery of Ancient Relics in a Distant Galaxy
Kate Whitaker (Umass Amherst)
Globular clusters are ancient relics of the universe, formed between 13 and 11 billion years ago, often found in association with more massive galaxies. Early globular clusters were young and blue, becoming older and redder over time. Observations of galaxies 11 billion years ago provide a unique perspective on both old and young globular clusters, offering a glimpse into their evolution. Using the JWST-UNCOVER treasury program, Dr. Whitaker and team identified a galaxy with a smooth elliptical light profile (indicating a past merger), which they nickname the Relic. This galaxy hosts a mix of young, intermediate-mass, and old associated star clusters with many remaining undetected. The findings suggest old clusters formed in situ, intermediate ones arose from tidal interactions and accretion, and young clusters also likely formed from accretion events. These clusters reveal the formation history of the Relic galaxy, offering a unique laboratory to test and improve theories of globular cluster formation.
Exploring the Sun’s Active Regions in the Moments Before Flares
Emily Mason (Predictive Science Inc.)
Solar flares, which are powerful bursts of energy from the Sun, occur when magnetic energy in the Sun is converted into light and motion. They can cause significant damage to satellites and communication systems around the Earth and their timing remains difficult to predict. Using data from the Solar Dynamics Observatory across four channels (which will allow for a range in temperatures/wavelengths), Dr. Mason and team analyzed coronal loops above active regions in the Sun. Observations focused on the active regions at the solar limb, avoiding overlapping active regions and ensuring no major flares occurred in the six hours prior for clean detection. Comparing light variability over six hours revealed that loops above active regions were more active, with fluctuations peaking 1-2 hours before a flare, particularly in cooler plasma. Rapid, small-scale brightness spikes often preceded confined flares without coronal mass ejections (CMEs). This method shows promise for predicting flares and is now being tested on more complex and blind cases to determine the accuracy of the predictions as well as to investigate the drivers of these small-scale variabilities.
Plenary Lecture: Revealing the Solar Neighborhood’s Diversity and the Milky Way’s Substellar Halo, Aaron Meisner (NSF NOIRLab) (by Lindsey Gordon)
Dr. Meisner works on a census of the local solar neighborhood, with a focus on brown dwarfs. Brown dwarfs fill in the mass range between red dwarfs, the smallest “real” stars, and large planets. They’re sometimes called “substellar objects,” and they most likely formed like stars do. These brown dwarfs are cold, old, and have low metallicities. They can be hard to study because there is a lot of degeneracy between their temperatures, masses, and ages, as they cool very slowly over billions of years. Their spectra have a lot of humps due to molecular absorption in their atmospheres, and they fall into the L, T, and Y spectral classes.
Why study brown dwarfs? There are lots of them and they’re near us. They can be used as an easier-to-study analog of exoplanetary atmospheres and to contextualize our Jovian planets. With long lifespans, they trace early galactic structure and the Milky Way’s initial mass function.
There are no known Jupiter-temperature brown dwarfs, but we think they should exist. WISE 0855 is the coldest known brown dwarf (about 100K hotter than Jupiter) and is only 2 parsecs away from us, so we thought we would’ve found more of them. In the search for Jupiter-temperature brown dwarfs, Dr. Meisner’s team instead found new classes of brown dwarfs in the thick disk and halo of our galaxy.
The primary data these studies used was from the WISE mission, which is an infrared wide-field survey satellite. With more than 60 million exposures to look through, using citizen science / participatory science was necessary to identify the brown dwarfs in the data. Brown dwarfs are identified by their color — red in WISE data — and their rapid motion. The team produced mini movies of the WISE observations that volunteers from around the world classified through the Backyard Worlds Zooniverse program. Since 2017, volunteers have performed 11.5 million classifications and found 4,200 candidate brown dwarfs. The team also launched the Backyard Worlds: Cool Neighbors program, which uses AI and human co-classification. A neural network preselects the most likely candidates to show to the volunteers, and this method has given them a 3x boost in classifications. The incorporation of AI doesn’t take away from the human element of a participatory science project. The team has a big emphasis on community building; the science team meetings are attended by volunteers to give feedback and contribute.
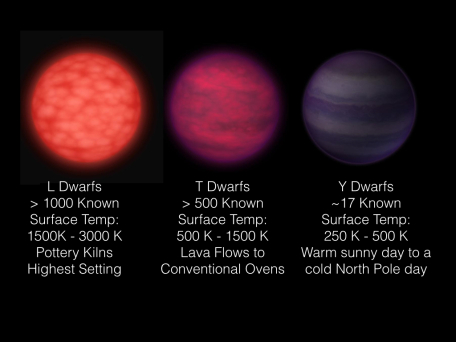
Three types of progressively cooler brown dwarfs and their characteristics (click to enlarge). Y dwarfs are the coldest of substars. [NASA/JPL-Caltech with annotations from the Backyard Worlds project]
Then there is “The Accident.” WISEA 1534-1043 is a very cold (~500K) Y-type brown dwarf that was found purely by accident during Backyard Worlds. It’s a 6–8 magnitude outlier from other known brown dwarfs and has been confirmed by WISE, Gemini, Hubble, Spitzer, and JWST to be a brown dwarf just 16 parsecs away. It has a crazy spectrum compared with other brown dwarfs, which is part of what led them to add metallicity into their classification scheme.
JWST spectra of brown-dwarf atmospheres see molecular atmospheric absorption lines including methane, ammonia, and water. Under review for publication are the first ever detection of phosphine in the atmosphere of Wolf 1130 C, a 620K brown dwarf, and the first ever detection of silane (SiH4) in the atmosphere of The Accident. We’ve been expecting these features and trying to find them in our own solar system, but this might be the first time we’ve actually seen them.
In the new era of Big Data and next-generation surveys, participatory science is going to become ever more important for astronomers. Extremely large telescope programs like Rubin, LSST, and Euclid should increase our count of brown dwarfs by a factor of 15 and help fill out the census of our neighbors.
Newton Lacy Pierce Prize Lecture: The Evolution, Influence, and Ultimate Fate of Massive Stars, Maria Drout (University of Toronto) (by Lindsey Gordon)
Dr. Maria Drout was awarded the 2024 Newton Lacy Pierce Prize for “revealing discoveries of the evolution, influence, and end states of massive stars through the study of explosive transients and resolved stellar populations.”
Massive stars are objects that every field of astronomy, from planetary science to cosmology, could use a better understanding of. Multi-star systems are ubiquitous in astronomy, and massive stars almost always form with at least one companion, with two-thirds of those systems interacting with their companion. There are many possible evolutionary pathways for these binary systems, the steps along which Dr. Drout and her team investigate. With the advent of gravitational wave astronomy, mergers between the possible compact object (neutron star or black hole) remnants of these systems are now observable in multiple messengers.
Dr. Drout discussed a potential scenario where two massive stars in a binary evolve into a binary pair of neutron stars. Over the course of their lifetimes, one star may go off as a supernova, the outer layers of one star may be stripped away by the other, the two may evolve together in a common envelope, and finally the second star must go off in a unique type of supernova.
The first supernova in the system can be found through the rise of wide field time-domain monitoring surveys, which now give us some 20,000 events per year. Recent studies have shown the progenitors of these core-collapse supernovae have properties that we didn’t expect and may in fact be hydrogen-poor core-collapse supernovae. These have low ejecta masses and high rate, which suggest a contribution from a (comparatively) lower-mass binary companion. We expect a lot of these stars to exist, but need to understand just how many of them there are, their metallicities, and their explosion properties. They also need better constraints on the fate of the surviving companion star.
At some point in the system’s lifespan one or both stars becomes a stripped helium star (He stars). The outer hydrogen envelope is removed and the hot helium core is revealed. Theories of binary evolution suggest they should be common, and they’re the favored progenitor for hydrogen-poor core-collapse supernovae. Dr. Drout’s group found the first population of these stars by reprocessing Swift Ultraviolet/Optical Telescope photometry data and looking for hot, ultraviolet-bright sources. Follow-up spectra on some of these systems showed deep He II absorption lines, indicating very hot, low luminosity stars with a lot of helium. From here, they’re looking to form a more complete sample of these stars to do population statistics with. Within the sample they have additional data on, there is at least one system that has an orbital period indicative of a binary between a stripped helium star and a compact object, which could be on its way to becoming a neutron star binary.
The common stellar envelope stage of a system occurs when one star fills its Roche lobe and begins to unstably transfer mass to its companion. The two stars can then either merge or eject the outer envelope and form a tighter binary system. Numeric simulations of these systems are tough, and there are no systems where we have measurements of the system both before and after it entered a common envelope. We mostly think these systems are a white dwarf and a main-sequence star, but knowing for sure if the two evolved together or just got caught by gravity is tricky. Stellar clusters — where all the stars are about the same age — present a viable opportunity for finding systems that co-evolved. The team was able to find 55 candidates for white dwarf–main-sequence binaries in clusters for future study of this phase of evolution.
At some point, a second supernova has to go off in the system to end up with two compact objects for a neutron star binary. This second supernova is also hydrogen-poor and has been through a lot in its evolution. These “ultrastripped” supernovae have very low masses and eject only about one solar mass of material. They are fainter and evolve more rapidly than other core-collapse supernovae, which makes them difficult to observe. However, the new wide-field surveys are finding so many transient events that we now have a small population of candidates for this type of supernova.
These events are just possible landmarks along the way to the compact object binaries lighting up the gravitational wave sky. Dr. Drout’s work represents the exciting new stellar populations that are still very much in the discovery phase of our understanding.
The post AAS 245: Day 3 appeared first on AAS Nova.
]]>
Talks on Day 2 of AAS 245 gave new perspectives on familiar objects, explored the icy origins of planetary systems, and highlighted the power of X-ray astronomy.
The post AAS 245: Day 2 appeared first on AAS Nova.
]]>Editor’s Note: This week we’re at the 245th AAS meeting in National Harbor, MD, and online. Along with a team of authors from Astrobites, we will be writing updates on selected events at the meeting and posting each day. Follow along here or at astrobites.com for daily summaries, or follow @astrobites.bsky.social on Bluesky for more coverage. The usual posting schedule for AAS Nova will resume on January 21st.
Table of Contents:
- Bronze Award for the University of Michigan from the Physics and Astronomy SEA Change Committee
- From the Smallest Things to the Greatest Results — The Incredible Power of the Chandra X-ray Observatory, Dave Pooley (Trinity University and Eureka Scientific, Inc.)
- Press Conference: Black Holes & New Outcomes from the Sloan Digital Sky Survey
- Henry Norris Russell Lectureship: The Cosmic Triangle: Probing the Dark Side of the Universe, Neta A. Bahcall (Princeton University)
- Press Conference: New Information from Milky Way Highlights
- Plenary Lecture: A Detector Backstory: How Silicon Detectors Came to Enable Space Missions, Shouleh Nikzad (Jet Propulsion Laboratory)
- Plenary Lecture: Annie Jump Cannon Prize Lecture: The Icy Origins of Planetary Systems, Jenny Bergner (University of California, Berkeley)
Bronze Award for the University of Michigan from the Physics and Astronomy SEA Change Committee (by Jessie Thwaites)
At the beginning of the morning’s sessions, Dr. Dara Norman (AAS President) announced that the University of Michigan Department of Astronomy has earned a Bronze Award from the Physics and Astronomy SEA Change Committee (read the AAS press release here). The award recognizes the University of Michigan Astronomy Department’s work towards understanding obstacles to diversity, equity, and inclusion in their community, in order to engage all members of their community. They have developed a five-year plan to address any issues identified in their assessment. The University of Michigan Astronomy Department is the first astronomy department to receive this award.
From the Smallest Things to the Greatest Results — The Incredible Power of the Chandra X-ray Observatory, Dave Pooley (Trinity University and Eureka Scientific, Inc.) (by Jessie Thwaites)
X-ray vision has long been considered a superpower — and the Chandra X-ray Observatory has that power! Dr. Pooley begins his talk by saying that summarizing the successes of X-ray astronomy, or even just those enabled by Chandra, is impossible in a mere 40 minutes. So, he set some of the Chandra greatest discovery images to one of his favorite great hits: Kermit the Frog’s Rainbow Connection. From intricate maps of our solar system, images of merging galaxies, and microlensed galaxies, to understanding of cosmic structures, Chandra has enabled incredible discovery over the past 25 years since launch.
But making these images, Dr. Pooley says, is more than detecting — it was designing and focusing an incredible instrument, and in particular, incredibly smooth mirrors. X-rays have to be focused at grazing incidence, otherwise they will pass right through the mirror, and any imperfection on the surface degrades our ability to focus the instrument. So at the time of Chandra design and development, the team designed the smoothest mirrors ever produced. If the mirrors were the size of Earth, Dr. Pooley says, the largest imperfections would be a mountain only a meter tall! This incredible feat of engineering has enabled the incredibly precise images that drive the cutting edge science done with Chandra.
Dr. Pooley goes on to highlight some of the amazing science done with Chandra. With its exemplary resolution, Chandra is able to resolve 100 times more sources in the globular cluster 47 Tucanae than its predecessor, ROSAT, and where ROSAT could not detect any sources in Messier 4, Chandra can detect around 100 of them. These new images allow the team to study the dynamics of the cluster and how binaries are forming inside them.
Chandra has also unlocked our current understanding of how particles are accelerated in supernovae, by resolving their gas structure. In a supernova, a forward-moving shock is propelled by the explosion into the gas surrounding the star, and a reverse shock pushes particles back toward the supernova. Electrons accelerated by the forward shock produce synchrotron radiation that has been imaged by Chandra, providing key evidence to describe how cosmic particles are accelerated in supernovae. It was also the first observatory to detect X-rays from the merger of two neutron stars in the multimessenger discovery of GW170817, showcasing its power as a time domain and multimessenger astronomy instrument.
The science that can be done with Chandra is not just monumental, it’s transformative. Imaging galaxy clusters with Chandra has also furthered our understanding of dark matter. Through Chandra imaging of the Bullet Cluster, which is unique in that it is actually the product of two colliding galaxy clusters, scientists can find proof of the existence of dark matter. While normal matter is subject to drag forces, dark matter is not, so the normal matter that emits in X-rays observed by Chandra is concentrated towards the center, while most of the mass of the cluster is concentrated farther away, as shown in the figure below.

Image of the Bullet cluster by Hubble and Magellan telescopes, with a map of the normal matter (seen by Chandra, pink) and dark matter (blue) shown on top. [X-ray: NASA/CXC/CfA/M.Markevitch, Optical and lensing map: NASA/STScI, Magellan/U.Arizona/D.Clowe, Lensing map: ESO WFI]
Press Conference: Black Holes & New Outcomes from the Sloan Digital Sky Survey (by Lexi Gault) (Briefing video)
A Variable X-Ray Monster at the Epoch of Reionization (Press Release)
Lea Marcotulli (Yale University)
At the center of most galaxies in the universe lies a supermassive black hole. When these black holes are gobbling up galactic material, they become some of the brightest objects in our universe. Dr. Marcotulli announced X-ray observations taken with Chandra and NuSTAR of one such object, J1429+5447, which lies in the epoch of reionization — just 900 million years after the Big Bang. J1429+5447 is the brightest active supermassive black hole observed in X-rays at this distance and is the farthest source ever detected by NuSTAR. These observations reveal extreme X-ray variability, which is indicative of powerful relativistic jets coming from J1429+5447. This discovery provides the opportunity to study the relationship between supermassive black hole growth and jet-powering mechanisms.
JWST’s Little Red Dots and the Rise of Obscured Active Galactic Nuclei in the Early Universe (Press Release)
Dale Kocevski (Colby College)
Recently discovered with JWST, little red dots are red compact objects with unusual colors that have evoked many questions from astronomers. If these objects are galaxies powered by stellar light, they introduce the “over-massive galaxy problem” — these galaxies would be much too massive much too soon after the Big Bang given current cosmological theories and galaxy formation models. A new study, led by Dr. Kocevski, compiled a sample of 341 little red dots to further investigate these perplexing objects. They find that these objects exist primarily between redshifts of z~4 to z~8 and are more numerous than the expected number of quasars and X-ray active galactic nuclei in this range. Spectroscopy of these little red dots reveals broad emission lines, a sign of a fast-moving accretion disk orbiting an active supermassive black hole. Though these galaxies are primarily powered by supermassive black holes — solving the over-massive galaxy problem — further studies of these sources will help to understand how their central black holes formed and how the galaxy catches up to its black hole.
Revealing the Mid-Infrared Properties of the Milky Way’s Supermassive Black Hole (Press Release)
Joseph Michail (Center for Astrophysics | Harvard & Smithsonian)
Using JWST, Dr. Michail and collaborators have detected the first-ever mid-infrared flare from our galaxy’s central supermassive black hole Sagittarius (Sgr) A*. Over the past 30+ years, researchers have observed flares in Sgr A* at other wavelengths, but until this study, have yet to observe a flare in the mid-infrared. This new detection fills the gap between near-infrared and radio observations of flares in Sgr A* and provides a new view in understanding the microphysics responsible for the formation of flares.
Black Hole Archaeology: Mapping the Growth History of Black Holes Across Cosmic Time (Press Release)
Logan Fries (University of Connecticut)
With the Sloan Digital Sky Survey (SDSS) Reverberation Mapping project making mass measurements of hundreds of black holes, Fries and collaborators have been able to use these masses in conjunction with spectroscopic observations to measure the spin of a sample of black holes. The spin of a black hole is important as it encodes the growth history of the black hole. If a black hole builds its mass through accreting material, the black hole will spin up rapidly, and if a black hole builds its mass through mergers, the black hole will spin down. Through this study, they find that many black holes spin up quickly, and that black holes in more distant galaxies tend to spin up more than those in the nearby universe. This challenges the expectation that most black holes gain mass through mergers, and future observations with JWST will help to further understand how black holes have grown over time.
The SDSS-V Local Volume Mapper: Early Data and Science (Press Release)
Dhanesh Krishnarao (Colorado College)
SDSS has employed a set of four robotic telescopes to map the Milky Way’s interstellar medium to further understand how star formation occurs. Dr. Krishnarao presented the first data and science from the SDSS-V Local Volume Mapper (LVM), a survey aimed at taking spectra covering various emission lines for a large section of the Milky Way. These observations will allow scientists to observe individual stars’ impacts on the surrounding gas, which are key to understanding how galaxies form stars and evolve. Another important aspect of SDSS-V is its Faculty and Student Team (FAST) program, which provides support for students and faculty from minority-serving institutions to join the collaboration. The first data from LVM will be publicly available in data release 19 from SDSS.
Henry Norris Russell Lectureship: The Cosmic Triangle: Probing the Dark Side of the Universe, Neta A. Bahcall (Princeton University) (by Archana Aravindan)
For Dr. Neta Bahcall, the Henry Norris Russell Lectureship holds a special significance. Dr. Henry Russell played a significant role in establishing Princeton, where Dr. Bahcall has spent nearly 50 years, as a leading center for theoretical astronomy! Additionally, her husband Dr. John Bahcall was also awarded the lectureship in 1999, making them the first couple to win the award!

Dr. Neta Bahcall receives the Henry Norris Russell lectureship from Dr. Dara Norman, President, AAS.
Dr. Bahcall begins her talk by providing a brief history about how the concept of dark matter came about. In the 1970s, the accepted fraction of matter (Ωm) in the universe was believed to be 1, indicating that all the matter in the universe was accounted for. But several eminent astronomers, including Fritz Zwicky, did not think that was true. The concept of dark matter (or matter we cannot see) was already floating around, but few people believed in it. Dr. Bahcall and her collaborators set out to observationally determine the value of Ωm, helping us understand if there truly is mass that we cannot see! They did this in two ways:
- Cluster correlation function: This function indicates how clusters of galaxies are distributed in space. Dr. Bahcall found that this function was 20 times stronger than the galaxy correlation function (which indicates how galaxies are distributed in space!). This discrepancy indicates that we see a large-scale structure in the universe and implies that the distribution of all the mass is not just tracing the light. There must be some mass that is not accounted for and thus Ωm cannot be 1. Dr. Bahcall and her collaborators determined that the fraction of baryonic matter (matter that interacts with light) should instead be closer to 0.3, and there must be some other form of matter that is not tracing the light. This discovery swung open the door for several models of dark matter.
- Mass-to-light ratios: Additionally, Dr. Bahcall also made use of another method to confirm this new value of Ωm. She calculated the total mass present in a given region of space based on its observed luminosity, essentially providing an indication of how much matter exists relative to the amount of light we can detect. This ratio is called the mass-to-light ratio or M/L. Higher M/L ratios suggest that all the matter is just not contained in stars (which contribute to the luminosity) and a larger proportion of dark matter is present.
This led Dr. Bahcall to set up a figure known as the cosmic triangle, which is a way of representing the past, present, and future status of the universe. The most precise measurements of the three quantities confine the universe to a strip in the plot. The three strips overlap at the ΛCDM model, which is in best agreement with observations.
Dr. Bahcall also touches upon the recent state of the field and all the ongoing questions about where the dark matter is actually located. New results from the Sloan Digital Sky Survey indicate that the M/L ratio increases up to a certain limit and it flattens out as we eventually go to larger and larger scales. This shows that most of the mass in groups comes from dark matter in galaxy halos, and there is no need for any additional dark matter that fills the space between large clusters.
Throughout her lectureship, Dr. Bahcall stresses the beauty of doing science. “It’s about how we don’t understand where we are and go step by step to figure it out!” she says. She wraps up her talk by thanking her mentors, collaborators, and grad students, and by giving a moving tribute to her wonderful family and (late) husband.
Press Conference: New Information from Milky Way Highlights (by Lexi Gault) (Briefing video)
Infrared Echoes of Cassiopeia A Reveal the Dynamic Interstellar Medium (Press Release)
Jacob Jencson (California Institute of Technology/IPAC)

JWST’s near-infrared view of Cassiopeia A’s light echoes. Click to enlarge. [NASA, ESA, CSA, STScI, Jacob Jencson (Caltech/IPAC)]
A Path-Breaking Observation of the Cold Neutral Medium of the Milky Way Through Thermal Light Echoes (Press Release)
Joshua Peek (Space Telescope Science Institute)
The detailed JWST observations of the light echoes surrounding Cassiopeia A illuminate a prototypical piece of the interstellar medium, which has allowed Dr. Peek and collaborators to explore the properties of the cold neutral medium that makes up 40% of the gas in the Milky Way. From the images, the structure of the cold neutral medium appears to have bundles of longer filaments and knots, which are similar to structures seen in simulations of magnetized gas. Magnetized gas resists compression, but stars form out of cooling and compressing gas, so further studying these small structures in the cold neutral medium will aid in understanding how gas collapses to form stars.

Left: Hubble Space Telescope image of the Ring Nebula. Center: Radio emission from carbon monoxide molecules as seen by the Submillimeter Array. Right: Infrared image of JWST showing contours of the carbon monoxide molecules that are moving perpendicular to our line of sight. Click to enlarge. [NASA/ESA/O’Dell/Ferland/Henney/Peimbert/Thompson; SMA image and SMA/JWST image overlay: Joel Kastner/RIT]
Joel Kastner (RIT Center for Imaging Science)
The Ring Nebula is an iconic astronomical object, and despite its frequent stage time, the intrinsic 3D structure of the ring has yet to be fully understood until now. Dr. Kastner presented Submillimeter Array imaging of the Ring Nebula from which a 3D model of the nebula was created. The gas in the nebula appears in a clumpy ellipsoidal shell with holes on both sides, roughly the shape of a barrel. These holes are likely driven by a binary companion that created strong, high velocity outflows through the center of the shell. From this model, they find that the gas was ejected from the central star around 6,000 years ago. Uncovering the 3D structure of planetary nebulae, like the Ring Nebula, allows scientists to better understand the ending stages of intermediate-mass stars.
X-Ray Echoes from Sgr A* Provide Insight on the 3D Structure of Molecular Clouds in the Galactic Center (Press Release)
Danya Alboslani (University of Connecticut)
Similar to infrared echoes from Cassiopeia A, X-ray echoes from the Milky Way’s central black hole Sagittarius A* reveal the 3D structure of molecular clouds near the galactic center. Alboslani presented two decades of X-ray echo observations from the Chandra X-ray Observatory and the resulting 3D maps of two molecular clouds, the Stone and Sticks clouds, in the Milky Way’s central molecular zone. These clouds exist in an extreme environment with temperatures and densities much higher than elsewhere in the galaxy. Through comparing the X-ray observations to submillimeter wavelength observations of the same clouds, the duration of the X-ray flare can be constrained based on the gaps in structure shown in the X-ray imaging. They find the flare to be no longer than ~5 months. These 3D maps provide further insight into the conditions that lead to star formation in the central region of the galaxy.
Plenary Lecture: A Detector Backstory: How Silicon Detectors Came to Enable Space Missions, Shouleh Nikzad (Jet Propulsion Laboratory) (by Bill Smith)
Dr. Shouleh Nikzad began by expressing her belief that the development of any new technology goes through three phases: invention, innovation, and infusion. In her plenary talk, she discussed these three phases as they applied to the development of silicon detectors for the ultraviolet (UV) light spectrum. She began with an overview of why the UV part of the spectrum is critical for astronomy, noting the many electron transitions that can be seen in ultraviolet spectra and applications for understanding planetary atmospheres. However, detecting the UV spectrum presents unique challenges, notably that UV radiation is absorbed within a few nanometers of the surface it hits, which means the designers of UV detectors must have exquisite control over the surfaces they develop.
Dr. Nikzad then shared a few of the reasons why silicon specifically was used to develop UV detectors, including the widespread adoption of silicon technology in industry. This widespread adoption meant that the existing infrastructure for the technology already existed and that it could be scalable for the next generation of flagship telescopes.
To create these silicon detectors, Dr. Nikzad and her group use a technique called atomic layer deposition, which is a technique that can create a very thin film on a surface with a high degree of control over the thickness. By using this technique, they were able to develop silicon detectors that, for the first time, could count single photons in the UV spectrum. She then explained how they were able to develop a bandpass filter for these detectors that would enhance UV detection and reject visible light.
Dr. Nikzad concluded by providing a tour of missions and potential future missions using this technology, including the Zwicky Transient Facility, FIREBall-2 (The Faint Intergalactic Medium Redshifted Emission Balloon Telescope, SPARCS (the Star-Planet Activity Research CubeSat), and UVEX (the Ultraviolet Explorer).
Annie Jump Cannon Prize Lecture: The Icy Origins of Planetary Systems, Jenny Bergner (University of California, Berkeley) (by Lindsey Gordon)
Dr. Jenny Bergner received the 2024 Annie Jump Cannon Award, which is “for outstanding research and promise for future research by a postdoctoral woman researcher.” The award citation is for “…her innovative astrochemical work at the intersection of laboratory experiments, theory, and observations, which has established new pathways to interstellar chemical complexity.”
Dr. Bergner’s work focuses on the chemistry of stars and planets during their formation. Baby stars are surrounded by protoplanetary disks, which are flattened disks of material that have a high enough density to clump together into planetesimals. Planetesimals are solids that are too small to be planets but are large enough to be held together by gravity.
These disks are a window into the chemical building blocks of planets. Three categories of material make them up: dust, ice, and gas. But these materials aren’t like their Earth analogs. Dust is composed of refractory materials: materials that remain solid at high temperatures. Ice is the layer of frozen volatiles — materials that vaporize at high temperatures —that stick to the dust. The ice isn’t all water, and it doesn’t have the crystalline structure that Earth ice does, but rather an “amorphous fluffy structure” with lots of nooks and crannies. The gas is any molecule not frozen out into the ice, and the gas is at the very low temperature of ~10K [−441.67℉ / −263.15℃].
There are lots of questions about these materials that are only now able to be answered. How much of each material is present and the chemical breakdown of each material will affect the kinds, properties, and atmospheres of the resulting planets. Whether or not the planets that form will be hospitable to life is an even harder question that depends on the presence of biogenic elements (C, H, O, N, S, P), which are the building blocks for life on Earth.
The Atacama Large Millimeter/submillimeter Array (ALMA) has allowed astrochemists to measure the substructure of the composition of protoplanetary disks. The ALMA-MAPS program looked at the millimeter-size dust grains’ emissions for different molecular line data. However, ALMA is only good at looking at gas and dust, but not ice. Most volatiles are in the ice, which meant we weren’t able to constrain their properties until JWST came along.
JWST is able to observe edge-on protoplanetary disks, which allows us to measure the central star’s light as it passes through the disk. This allows us to determine the disk composition including the ice. In an early JWST observing program of the HH 48 NE disk, they found evidence for H2O, CO2, and CO, but they needed to produce spectra in the lab for comparison.
Because space ice is so different from Earth ice, Dr. Bergner’s group uses a highly specialized cryogenically cooled vacuum chamber to form analogs of space ice for study. They take spectra of samples to try and match the JWST observations. They also do full radiative transfer modeling of how the photons moved through the disk in order to properly reproduce the observations.
From this work, they were able to differentiate between possible scenarios, and found that there are different regions in the disk where H2O, CO, and CO2 all interact (“polar” regions) and regions where only CO and CO2 interact (“apolar”). They were also able to measure the C/O ratios in the icy solids and found lower values than expected based on previous protostellar ice inventories. This is only one system, of course, but this is exciting for future work. JWST has already observed or is scheduled to observe 12 edge-on disks that will allow the team to explore disks as a population.
Dr. Bergner also highlighted the need for far-infrared observations. Water’s emission line, cool-warm gas phase water lines, and gas tracing for the total disk mass are only possible with far-infrared spectra. The proposed PRobe Far-Infrared Mission for Astrophysics (PRIMA) mission is still conceptual, but if approved, it would fill in this gap.
The JWST spectra also show the presence of more complex molecules, the formation and fate of which was not known. Her group investigated excited-state oxygen atom chemistry, where ionized oxygen can react with hydrocarbons to form organic molecules. This reaction has no activation barrier, but it might not be stable. In a lab setting, Dr. Bergner’s team found that this process can make complex molecules at 10K, and that this process is broadly applicable to form many different molecules.
She then focused on what happens to these molecules once they’re formed. Making a planet is violent, and we don’t expect complex molecules to survive the formation process. It seems likely that complex molecules are delivered later through impacts by icy planetesimals. This is backed up by looking at planetesimals in our own solar system — like comets and asteroids — which also have chemical complexity that dates back to the solar system’s formation. Her group modeled the survival of ice in disks, and found that comets may form further out in the disk before drifting inward to smaller radii, which protects the ice.
2017’s visit from Oumuamua was the first time we had the opportunity to study a planetesimal from another system. It also had a big mystery — it was moving faster than we would expect under purely gravitational conditions. But it wasn’t aliens — it was likely due to outgassing (ejection) of material giving it a boost, similar to what comets are known to do. What gas it was releasing was hard to pin down. There was no evidence for carbon-based gases, and the amount of solar energy it received wasn’t enough to cause it to release water or CO2. This left a small list of possible materials.
Dr. Bergner studied hydrogen as an option. The theory was that Oumuamua was a comet coming towards us, and radiation hitting water molecules created molecular hydrogen that got trapped in the nooks and crannies of the amorphous ice. When our Sun heated the remaining water ice, it crystallized into a lattice structure and the hydrogen escaped and boosted Oumuamua’s velocity. This turns out to be a viable option for the gravitational boost, as there is a large parameter space where it would work and the amount of solar energy it received is enough to have made the ice into a lattice.
Dr. Bergner’s work sits at the intersection of observations, experiments, and theory. The field of protoplanetary disks and planetary system formation has a bright future with JWST and potentially the far-infrared PRIMA mission.
The post AAS 245: Day 2 appeared first on AAS Nova.
]]>
Super star clusters, evolving galaxies, and asteroids that can take a punch were just a few of the subjects introduced on Day 1 of AAS 245.
The post AAS 245: Day 1 appeared first on AAS Nova.
]]>Editor’s Note: This week we’re at the 245th AAS meeting in National Harbor, MD, and online. Along with a team of authors from Astrobites, we will be writing updates on selected events at the meeting and posting each day. Follow along here or at astrobites.com for daily summaries, or follow @astrobites.bsky.social on Bluesky for more coverage. The usual posting schedule for AAS Nova will resume on January 21st.
Table of Contents:
- Workshop: Strategies for Mentoring Undergraduate Researchers (From Sunday, 12 January)
- Welcome Address by AAS President, Dara Norman (NSF NOIRLab)
- Fred Kavli Prize Plenary Lecture: The Terrestrial Worlds of Low-Mass Stars, Dave Charbonneau (Harvard University)
- Congressman Glenn Ivey Visit
- Press Conference: A Feast of Feasting Black Holes
- Plenary Lecture: Galaxy Evolution Eras Tour: The Formative Years of Star Formation and Supermassive Black Hole Growth, Alexandra Pope (University of Massachusetts Amherst)
- Press Conference: Supernovae and Massive Stars
- Plenary Lecture: Punching Back Asteroids: The Deflection of Dimorphos by the DART Mission, Jason Kalirai (Johns Hopkins Applied Physics Laboratory)
- Plenary Lecture: Direct Observational Constraints on Planet Formation and Accretion, Kate Follette (Amherst College)
Workshop: Strategies for Mentoring Undergraduate Researchers (by Lindsey Gordon)
This workshop came out of the Council for Undergraduate Research and Dr. Carol Hood’s work at Cal State Bernardino on programs like CalBridge. It’ll be offered again at future conferences including the American Physical Society conference. The workshop was split into two parts. In the first, small groups discussed mentoring strategies based on experiences. What makes a good mentor? What makes a bad mentor? The important takeaway was student-centered / student-driven mentoring. In the second half, the development of individual development plans was discussed, using real student examples. These plans work backwards from a goal to create a roadmap for the student’s research, and they are broadly applicable to mentorship beyond research.
Welcome Address by AAS President, Dara Norman (NSF NOIRLab) (by Lindsey Gordon)
This year marks the 125th anniversary of AAS, and 50th AAS President Dara Norman gave opening remarks on Monday morning. She honored our colleagues who have lost their homes in the LA fires and couldn’t attend this year. (This article from the LA Times lists ways to help those affected by the fires, and the Federal Trade Commission provides guidance on how to donate safely and avoid scams.) Dr. Norman emphasized the importance of the AAS working groups, who are dealing with the rise in AI, the overwhelming numbers of applicants to astronomy graduate programs, and our carbon footprint. The 2027 summer meeting will be held fully virtually in response to members’ concerns about climate change, equity and access, and the health of our members. “This will not be your grandma’s virtual meeting,” Dr. Norman quipped. The meeting overlaps with the International Astronomical Union general assembly, which the virtual format allows flexibility for. She concluded by emphasizing the diversity of our community and the need to retain that diversity and to maintain our community.
Fred Kavli Prize Plenary Lecture: The Terrestrial Worlds of Low-Mass Stars, Dave Charbonneau (Harvard University) (by Lindsey Gordon)
David Charbonneau is a pioneer in observations of transiting exoplanets, and in the new plenary format of taking the Q&A session two-thirds of the way through your talk when the slides fail. He and Prof. Sara Seager (MIT) won the 2024 Kavli Prize for their work on exoplanets and their atmospheres.
His work focuses on terrestrial planets: how they form their atmospheres, how those atmospheres depend on the planet and the host star, how they might lose their atmospheres, and how we might be able to detect the atmosphere and its chemical contents.
So how do we study planetary atmospheres? It turns out we can only study systems within 15 parsecs of us with stars that are ~30% the radius of the Sun. JWST and the Extremely Large Telescope are expected to be able to detect molecules in the atmospheres of planets in that range. Dr. Charbonneau described his work on the M spectral class, which covers a huge range of stellar sizes. The M-dwarf stars he cares about for this work are the ones that fall into that 30% solar radius category. However, stars at these masses are fully convective with no radiative zone. This has huge implications for the star’s magnetic and emission activity and long-term angular momentum evolution.
There are 413 stars that fit into their observing parameters. For these stars his group studied:
1. The rate of occurrence of terrestrial worlds using the transit method, of which they find 7 in that group. They then studied the sensitivity rate — did we find all the planets that are there? — by injecting fake observations for different planetary sizes and periods. From this they were able to infer the intrinsic rate of occurrence of terrestrial planets. They didn’t see large terrestrial planets or small planets that we would’ve expected to find if they were there. This led them to conclude that there is a high occurrence rate — at least one rocky planet per two low-mass M dwarfs — and the distribution of those planets’ radii peaks at 1 Earth radius.
2. The rate of occurrence of gas giant (Jupiter-like) planets using the radial velocity method. One-third of the stars in the population had no spectra, so they set out to complete the sample. The presence of Jupiter in our solar system was highly influential to the properties of our terrestrial planets; systems without such a planet may have evolved very differently. They found that essentially none (<1.5%) of the low-mass stars had a Jupiter analog, and therefore the terrestrial planets in those systems may be very different than in ours.
At this point, the presentation equipment failed. He took questions at this time, during which he told us about his favorite planet, which is a cold, rocky planet in the habitable zone around a calm star that is a great opportunity for determining if rocky planets can retain their atmospheres.
3. Characterizing the stellar magnetic activity and other properties. They found two populations of very fast and very slowly rotating stars, suggesting a rapid transition between those states. They found the flare rate of the rapid rotators is much higher than slow rotators, which could have serious implications for the survival of an atmosphere. The stellar spindown is also very mass-dependent, with larger stars spinning down faster.
Congressman Glenn Ivey Visit (by Lindsey Gordon)
“Goddard in the house!” Congressman Glenn Ivey has represented Maryland’s 4th congressional district — which includes Goddard Space Flight Center — since 2023. He paid a visit to the exhibit hall floor on Monday morning, where he emphasized the importance of work in the sciences, particularly in the role of climate change in the recent wildfires in CA. He’s working to keep science, NASA, and Goddard moving in the right direction in what is a very exciting time in our industry.
Press Conference: A Feast of Feasting Black Holes (by Lindsey Gordon) (Briefing video)
Witnessing the Birth of a New Plasma Jet from a Supermassive Black Hole
Eileen Meyer (University of Maryland, Baltimore County)
Dr. Meyer discussed 1ES 1927+654, a nearby “changing look” active galactic nucleus (AGN) that brightened by 100x in 2018 over the course of a few months. This is a rare event, and the system has been monitored closely across a range of wavelengths ever since. In 2022 the X-ray emission picked up, and then the radio peaked as well, 60x brighter at the peak. The radio peak suggests that AGN jets were turned on, which had never been observed before, and challenged beliefs about the on/off timescales for jets. Very Long Baseline Array observations saw the emergence of jets going 33% the speed of light. This might be the birth of a compact symmetric object, due to the initial brightness peaking resembling a tidal disruption event. | Press release
Rapidly Evolving X-Ray Oscillations in the Active Galaxy 1ES 1927+654
Megan Masterson (Massachusetts Institute of Technology)
Masterson (an Astrobiter!) discussed the same source as Dr. Meyer and highlighted its X-ray variability. The Neutron star Interior Composition Explorer (NICER) and XMM-Newton observations show a short-term periodicity around the supermassive black hole, which is rare to observe. The period has declined from 18 to 7 minutes over the past ~2 years and is stabilizing around 7 minutes. This could be due to either oscillations of the new jets, or due to an orbiting white dwarf very close to the black hole. The system is observable by the Laser Interferometer Space Antenna (LISA), which could confirm the white dwarf if it is one. | Press release
Uncovering the Dining Habits of Supermassive Black Holes in Our Cosmic Backyard with NuLANDS
Peter Boorman (California Institute of Technology)
Dr. Boorman discussed the work of the NuLANDS project, which used infrared observations to find a population of both obscured and unobscured AGN. The obscuration comes from the donut-shaped accretion disk of material being “eaten” by the black hole. Different levels of obscuration occur depending on the orientation of the donut relative to the observer. AGN are infrared bright regardless of orientation, allowing a complete sample to be found and then categorized. They found a very balanced population of ~35% heavily obscured, ~37% obscured, and ~28% unobscured AGN, which makes a great sample for future studies. | Press release
The Discovery of a Newborn Quasar Jet Triggered by a Cosmic Dance
Olivia Achenbach (United States Naval Academy)
We’ve been navigating by the stars for millennia now, but modern methods also use radio signals for calibration. Radio systems that switch from an “off” state to an “on” state could affect these methods. Achenbach studied a system of a recently turned-on radio-bright AGN to study trigger mechanisms for new jet formation. She found a system with evidence of previous jet activity that had been recently reignited by galaxy–galaxy interactions with a tidal tail connecting the two. | Press release
Plenary Lecture: Galaxy Evolution Eras Tour: The Formative Years of Star Formation and Supermassive Black Hole Growth, Alexandra Pope (University of Massachusetts Amherst) (by Archana Aravindan)
The AAS 245 is just another stop in Dr. Pope’s Galaxy Evolution Eras Tour! Galaxies, just like Taylor Swift, go through different eras. In this plenary talk, Dr. Pope, Professor of Astronomy at the University of Massachusetts Amherst and the chair of the Five College Astronomy Department, focuses on the formative years of galaxy growth. This period is commonly known as cosmic noon, occurring between 10 and 11 billion years ago. During this time, galaxies formed stars at a rapid rate and black holes in galaxies grew quickly.
There appears to be some correlation between the rapidly growing supermassive black holes (active galactic nuclei (AGN)) and the star formation in galaxies. This manifests itself in several scaling relations that are observed between the mass of the black hole and the mass of stars in the galaxy in which it resides. However, we still do not know how exactly the two processes correlate with each other. Dust plays an important role in our (limited) understanding of the correlations between black holes and star formation in galaxies at cosmic noon. The majority of cosmic star formation is hidden behind the dust, with observations indicating that 50–75% of AGN are in obscured dust-filled galaxies. Luckily, with JWST, we can finally pierce through the dust and look at dusty galaxies to understand the correlations!
It’s me, hi, I’m the problem!
The biggest problem (other than dust!) in understanding the correlation between star formation and black hole growth is that measurements of the black hole accretion rates and star formation rates are often not taken from the same sample of galaxies. Using the MIRI instrument on JWST, Dr. Pope and her collaborators simultaneously study the black hole accretion rate and star formation rate in the same sample of dusty galaxies at cosmic noon. AGN and star formation activity have unique spectral signatures that can be disentangled from one another, allowing measurements of both the black hole accretion rate and star formation rate in the same galaxy. Their ultimate goal is to track the galaxies as they land on the scaling relations between the mass of the black hole and the mass of the stars.
End Game?
JWST covers the mid-infrared part of the electromagnetic spectrum, and the Atacama Large Millimeter/submillimeter Array helps us understand the submillimeter wavelengths in these cosmic noon galaxies. However, the far-infrared wavelengths are not well observed and are likely holding a wealth of information about the interplay of AGN and star formation activity. Enter the Probe far-Infrared Mission for Astrophysics (PRIMA), which is one of the two missions selected for a concept study by NASA. This far-infrared observatory will be able to measure scaling relations, redshifts, black hole accretion rates and star formation rates for nearly 60,000 galaxies. After a detailed evaluation, NASA will select one concept in 2026 to proceed with construction, for a launch in 2032. With PRIMA, Dr. Pope is hopeful that we might finally understand how black holes and stars in a galaxy co-evolve!
Press Conference: Supernovae and Massive Stars (by Jessie Thwaites) (Briefing video)
JWST Discovery of a Distant Supernova Linked to a Massive Progenitor in the Early Universe
Dave Coulter (Space Telescope Science Institute)
Supernovae are responsible for a huge variety of astrophysical phenomena, including star formation and heavy element production. At the beginning of our universe (right after the Big Bang), the first stars began to form. These stars were “considerably different than stars today,” and their supernovae featured “gargantuan explosions,” says Dr. Coulter. Using the JADES transient survey with JWST, some of the earliest supernovae can be studied, including the case of AT 2023adsv which is at redshift 3.61when the universe was less than 2 billion years old. This study marks a major first step towards finding the earliest supernovae and studying the evolution of some of the earliest stars. | Press release (PDF)
Core-Collapse Supernovae as Key Dust Producers: New Insights from JWST
Melissa Shahbandeh (Space Telescope Science Institute)
Dust is incredibly important in astronomy; it provides the building blocks for stars and planets that eventually create our universe as we know it today. Massive dust reservoirs have recently been detected in high-redshift galaxies, leading astronomers to re-think how dust is formed in these systems. Dr. Shahbandeh describes how core-collapse supernovae, specifically Type IIN supernovae, could be the answer. By studying supernova 2005ip with Spitzer and JWST, they can study the life cycle of dust, from the supernova that spreads material throughout the system, to the new star that forms, to the formation of solar systems and planets (and maybe life!), to the cycle’s repeat when the new star goes supernova. Dr. Shahbandeh finds that supernovae are rapid dust factories, and continue to create dust, even years after explosion! | Press release (PDF)
JWST Tracks the Expanding Dusty Fingerprints of a Massive Binary
Emma Lieb (University of Denver)
Lieb discusses an interesting binary system, known as WR140, which is enriching its local environment with dust. It consists of a massive, evolved star with strong stellar winds (called a Wolf-Rayet star) and an O-star companion. They are in a highly eccentric orbit around each other, and when they pass at their nearest point (called periastron), their stellar winds collide and produce dust, “kind of like a big belch.” By taking two images of this system nearly a year apart with JWST, Lieb can study the expanding shells of dust produced by these near passes. They find that the shells are moving at nearly 1% of the speed of light, and are non-uniform, which provides clues to the dust’s formation. | Press release
Stellar Pyrotechnics on Display in Super Star Cluster
Kristina Monsch (Center for Astrophysics | Harvard & Smithsonian)
The super star clusters (SSC) are being studied by EWOCS! Not the cute fluffy characters from Star Wars, but by the EWOCS Project, which is an international team studying the star formation processes in the Westerlund 1 and 2 clusters. These clusters consist of young, massive stars (more than 100 times the mass of our Sun), and are able to ionize their surroundings. Westerlund 1 (Wd1) is nearby (4.2 kpc away), and includes massive stars at many different phases of stellar evolution. By observing this cluster in the near- and mid-infrared with JWST’s NIRCam and MIRI instruments, Dr. Monsch can pierce through the dust in these clusters to observe the stars near the center of the cluster. They can study the powerful winds from these massive stars to gain insight into how these stars form, impact their environment, and die. | Press release
A Blue Lurker Emerges from a Triple-System Merger
Emily Leiner (Illinois Institute of Technology)
While studying the cluster Messier 67, Dr. Leiner noticed something strange. Most stars in this cluster are the same age and have similar rotations, but there are a few peculiar “blue lurker” stars that rotate suspiciously fast for their age. Hubble observations of one of these stars revealed a white dwarf with a larger mass than expected for the cluster’s population orbiting the blue lurker star.
Dr. Leiner discovered that this was the remnant of a triple system, where two closely orbiting stars merged and blew their outer envelope away, leaving behind the white dwarf. This caused accretion onto the third star — the blue lurker — which sped up its rotation. Triple star systems are fairly common (around 10% of Sun-like stars are in a triple system), they are only beginning to be understood. | Press release
Plenary Lecture: Punching Back Asteroids: The Deflection of Dimorphos by the DART Mission, Jason Kalirai (Johns Hopkins Applied Physics Laboratory) (by Bill Smith)
Everyone who takes an introductory astronomy class learns about calculating orbits of celestial bodies, but Dr. Kalirai’s talk focused on humanity’s first successful attempt to change one. He gave an overview of the DART (Double Asteroid Redirection Test) mission, a mission designed to test our capabilities to defend Earth from an asteroid that might be heading towards impact by sending a spacecraft to smash into the asteroid to see if the impact could alter an asteroid’s trajectory to miss impact.
He began with a charge for humanity: “Let’s not be like the dinosaurs!” He followed this up with an overview of the potential threat, noting that we still haven’t found many of the asteroids that could hit Earth that are big enough to result in planetary-scale catastrophic consequences, noting examples like the Chelyabinsk impact in Russia.
He began his explanation of the mission by explaining why the “D” in DART stands for “Double.” Because asteroids orbit the Sun, it would be impossible with current technology to measure the change in an orbit of one due to the impact of a spacecraft. To get around this, the DART team identified two asteroids in a binary orbit around each other. By crashing the craft into one of them, they are able to measure the impact’s effect by studying the change to the binary orbit of the asteroids, so they ultimately decided on the Didymos–Dimorphos asteroid binary system as their target.
Next, Dr. Kalirai discussed some of the unique technical challenges of the mission, including installing a CubeSat called LICIA that would deploy before impact to collect data about the impact, and the automated guiding system that was necessary for the spacecraft to the smaller of the two asteroids in the system, because it was not identifiable until the spacecraft was essentially almost there.
Dr. Kalirai then reviewed what the DART mission team learned from the impact itself. First, it slowed the orbital period of the asteroid by about a half hour, when the original goal of the mission was about 7 minutes. They measured the momentum enhancement (called a beta), which was a factor of 3.6. A beta factor of 1 indicates the amount of momentum transfer if the craft simply hit the asteroid with no ejected material, and a beta factor higher than this indicates that the ejected material from the impact further affected the asteroid’s orbit. A measurement of 3.6 was higher than anticipated, and provided an optimistic result for this technique’s ability to potentially defend Earth in the future.

A slide from Dr. Kalirai’s talk. On the left is a simulation snapshot of a DART-like spacecraft impacting a dense rocky object of similar size to the target asteroid, and on the right is an image soon after the impact of the spacecraft and asteroid.
Dr. Kalirai concluded with two main points. First, although the DART mission itself was successful, he stressed the need to find the asteroids we still don’t know about and highlighted the future Near-Earth Object Surveyor Mission. Second, he described a “table top exercise” between multiple national, state, and local agencies to simulate a potential asteroid impact on Earth. He noted that the outcome of the exercise was that, even if the technology might exist, it must still be deployed by collaboration of governments and agencies working together to do it for it to be effective.
Plenary Lecture: Direct Observational Constraints on Planet Formation and Accretion, Kate Follette (Amherst College) (by Jessie Thwaites)
Dr. Follette’s talk focused on two of her favorite topics: direct imaging techniques for detecting exoplanets, and effectively teaching students both inside and beyond the field of astronomy. She brought those techniques to life in her talk, requiring audience participation throughout and highlighting the importance of understanding other worlds through high-contrast detections.
Dr. Follette outlined four main methods of exoplanet detection (three of which are described in this Astrobite): transit photometry, where a planet eclipses its star and causes a dip in brightness; radial velocity, where the wobble of the star indicates the presence of a planet; microlensing, where a planet passing in front of a star causes a brief increase in brightness; and direct imaging — Dr. Follette’s speciality.
As she describes, there are many reasons to love direct imaging, from the visceral satisfaction of being able to identify planets by eye in the data to the amount of information one can obtain from the technique. Direct imaging can help characterize orbits of these planets and enable detailed modeling of an exoplanet’s atmosphere through analysis of its spectrum. The planets imaged with this technique tend to be young, as young planets tend to be brighter than older planets.
This field is also rapidly developing both technology and methodology to hopefully detect exo-Earths (smaller, Earth-sized exoplanets) in the future, and to identify biosignatures in their atmospheres. Direct imaging is built on sophisticated and rapidly evolving hardware and software techniques, including adaptive optics, coronagraphy, differential imaging techniques, and post-processing algorithms. Dr. Follette has also written a tutorial for anyone interested in learning more about the field.

A slide from Dr. Follette’s talk, highlighting their method for identifying protoplanets in a disk.
To search for exoplanets, the team considered circumstellar disks, which can have a variety of substructure — some of which is likely due to the presence of exoplanets! The challenge is identifying the planet itself in the data. They optimize their selection methods on injected signals; that way, they avoid confirmation bias. They search for the planets in the wavelength range where the planets are brightest, specifically in the H-alpha line, and subtract these measurements from the main emission of the disk (shown in the above figure). With this method they are able to identify several planets in their sample! From there, they aim to translate the detected light into a physical parameter by inferring the properties of planet populations.
In the final part of the talk, Dr. Follette focused on physics education and mentorship. There are several courses in the undergraduate curriculum at Amherst College aimed at developing students’ soft skills for research, including setting goals, time management, presentation skills, and becoming more comfortable asking questions. These are important skills to help close the opportunity gaps that some students may face. Dr. Follette also emphasized the importance of normalizing struggling (which happens to everyone!) and celebrating non-linear career paths, as well as non-astronomy or non-academic paths for students.
The post AAS 245: Day 1 appeared first on AAS Nova.
]]>
This week we’ll be bringing you updates from the 245th AAS meeting happening in National Harbor, MD.
The post AAS 245: Welcome! appeared first on AAS Nova.
]]>This week, AAS Nova and Astrobites are attending the American Astronomical Society (AAS) winter meeting in National Harbor, MD.
AAS Nova Editors Kerry Hensley and Susanna Kohler and AAS Media Fellow Lexi Gault will join Astrobites Media Intern Lindsey Gordon and Astrobiters Archana Aravindan, Bill Smith, and Jessie Thwaites to live-blog the meeting for all those who aren’t attending or can’t make it to all the sessions they’d like. We plan to cover all of the plenaries and press conferences, so follow along here on aasnova.org or on astrobites.org! You can also follow Astrobites on Bluesky at astrobites.bsky.social for more meeting content.
Where can you find us during the meeting? We’ll be at the Astrobites booth in the Exhibit Hall all week — stop by and say hello! You can also find Kerry, Susanna, and Lexi at the press conferences Monday through Thursday. AAS press conferences are open to all, and they can also be viewed on the AAS Press Office YouTube channel for anyone not attending the meeting.
Sessions Organized by and Recommended by Astrobiters
The Astrobites crew recommends the National Osterbrock Leadership Program splinter session. This session, titled “Deepening Broader Impacts: Mentorship, DEI, and Career Advancement” (link takes you to the listing in the meeting program; must be logged in for the link to take you to the right place), will be held Tuesday, 14 January, from 10:30 am to 12:00 pm in room Chesapeake 7-8. This splinter session will feature several presentations as well as an interactive workshop, with a focus on deepening broader impacts, strengthening NSF proposals, and acquainting attendees with the National Osterbrock Leadership Program.
We are excited to share that the League of Underrepresented Minoritized Astronomers (LUMA) will be celebrating its 10-year anniversary in 2025 through an AAS Splinter Session titled “IlLUMAnating Conversations” on Wednesday, 15 January 2025, from 9:30 am to 5:00 pm ET. This splinter session will be open to ALL people of color of ALL career stages, not only to LUMA members, so please share with your networks! However, we do ask you kindly fill out this form to confirm your attendance and RSVP as this is a private event by invitation only.
LUMA is a peer mentoring community for Black, Indigenous, and Latinx women across all career stages in the space sciences. Our goal is to provide a safe, supportive virtual community where you can belong and shine. The IlLUMAnating Conversations session marks our 10th anniversary as an organization, and we are celebrating by coming together at AAS 245 for a series of workshops, talks, and community bonding activities for both current members and others in the AAS community interested in attending.
Our morning session will focus on learning how to identify, leverage, and grow your unique skills to benefit your career. We will reconvene after lunch for an afternoon session to explore ways to build deeper relationships within your community and advocate effectively for yourself and others. If you’re looking to make new friends, find a conference buddy, or learn new skills, please join us! You also can attend either the morning or afternoon session, or attend both sessions if you’d like to get more out of it! We will be having a day full of inspiring talks and meaningful workshops to equip you to succeed in your careers and effect change in your communities!

Finally, you can read the currently published AAS 245 keynote speaker interviews here. Be sure to check back all week as the remainder are released!
The post AAS 245: Welcome! appeared first on AAS Nova.
]]>
The AAS publishing team is excited to engage with the community at the upcoming AAS meeting. Check out what they'll be up to at the meeting!
The post AAS Publishing at AAS 245 in National Harbor appeared first on AAS Nova.
]]>AAS 245 is nearly here! The AAS Publishing team looks forward to connecting with meeting attendees at the upcoming winter AAS meeting in National Harbor, MD, and we’re excited to share a preview of upcoming publishing-related events. Attending the meeting will be Kerry Kroffe (AAS Director of Scholarly Publishing), Ethan Vishniac (AAS Journals Editor in Chief), Gus Muench (AAS Journals Data Editor), and Greg Schwarz (AAS Journals Data Editor). Several of the scientific editors of the AAS journals, including Frank Timmes (Associate Editor in Chief and Lead Editor of the High Energy Phenomena and Fundamental Physics research corridor) and Mubdi Rahman (Scientific Editor for the Laboratory Astrophysics, Instrumentation, Software, and Data research corridor), will be in attendance as well. Be sure to stop by the AAS booth in the Exhibit Hall to say hello, chat about the journals, have your data questions answered, and pick up some swag!
AAS Nova Editors Kerry Hensley and Susanna Kohler, AAS Media Fellow Lexi Gault, Astrobites Media Intern Lindsey Gordon, and the rest of the Astrobites team will also be available periodically at the Astrobites booth in the Exhibit Hall. We look forward to seeing you there!
Data Editors Help Desk
AAS Journals Data Editors Gus Muench and Greg Schwarz will be staffing a data help desk during AAS 245. Please drop by the AAS Publications stand in the main AAS booth to hear more about upcoming changes to AASTeX (v7!), or to discuss best practices for data and software publication in the AAS journals. Gus and Greg are looking forward to your tough data questions!
Open Science at AAS 245
Note: The links in this section take you to the corresponding entries in the AAS 245 block schedule. You must be logged in for the links to work correctly; otherwise, they will take you to the main block schedule page.
On Monday, there is an exciting splinter session from 10:00 am to 12:00 pm titled “ExoCore: An Open Science Curriculum for Enhanced Reproducibility and Equity in Exoplanet Research.” The intended audience ranges from students and postdocs working on exoplanet research to those interested in the ethos and methods of open science in general. The session will include presentations, a guided discussion, and a hands-on tutorial. This session takes place in National Harbor 8.
On Wednesday from 2:00 to 3:30 pm, NASA is hosting a special session (#347) on “Open Science: NASA Astrophysics in the Roman Era.” This session focuses on new initiatives to facilitate the sharing of data and computational resources across NASA as new missions like Roman move data storage and analysis on to cloud-based science platforms. This session will be held in Chesapeake 4-5.
We also want to draw your attention to a special session (#425) on Thursday morning from 10:00 to 11:30 am. “The Power of Collaborative Networks in the Era of Big Data” will use presentations and a moderated discussion to explore the importance of collaborative networks to doing science in the current era of big data. Collaborative networks, which can be anything from citizen science teams to international science communities, will be critical to making best use of incoming massive datasets, such as the one that will be generated by the Vera C. Rubin Legacy Survey of Space and Time. This session will be held in Chesapeake 4-5.
The post AAS Publishing at AAS 245 in National Harbor appeared first on AAS Nova.
]]>
Shining bright from billions of light-years away, the universe's first galaxies provide a wealth of information regarding galaxy formation and evolution across cosmic time. What have new observations of one such galaxy contributed to our understanding?
The post Faraway Fossils: Clues from a High-Redshift Galaxy appeared first on AAS Nova.
]]>A new study explores the conditions in an extremely distant galaxy to understand how early galaxies may evolve to form the objects we see now in the local universe.
Early Universe Galaxies
Over the past few years since JWST went online, astronomers have discovered some of the most distant galaxies in the universe. To be visible from over 13 billion light-years away, these galaxies must be extremely bright and thus powered by an intense energy source — typically either active massive central black holes known as active galactic nuclei (AGN) or very strong star formation that causes a burst in stellar light.
The universe’s earliest galaxies are astronomical fossils, providing clues to how nearby galaxies and objects have evolved to their current state. These high-redshift galaxies may be progenitors of globular clusters or beginnings of growing galaxies — objects whose origins are not well understood. Further characterizing the newly discovered galaxies may reveal how objects in the local universe came to be.

ALMA detection of the 88-micron emission line from doubly ionized oxygen. The left-hand panel plots the intensity map of GHZ2 as seen on the sky, where the yellow in the center corresponds to the galaxy. The right-hand panel shows the ALMA spectrum with the 88-micron emission line highlighted in yellow. Click to enlarge. [Zavala et al. 2024]
Star Formation or AGN?
One such high-redshift galaxy is GHZ2, which was recently discovered with JWST and lies at a redshift corresponding to ~400 million years after the Big Bang. To complement the JWST spectroscopic observations, Jorge A. Zavala (National Astronomical Observatory of Japan) and collaborators observed the galaxy using the Atacama Large Millimeter/submillimeter Array (ALMA). These observations aimed to measure far-infrared emission lines that are critical in determining if a galaxy is powered by star formation or an AGN. The authors targeted and successfully recovered the 88-micron (1 micron = 10-6 meter) emission line from doubly ionized oxygen — an emission line known to correlate with a galaxy’s star formation activity. From the detection, the authors derived a redshift that agrees with the redshift determined from JWST.
With the ALMA observations and prior measurements from JWST, the authors compare GHZ2 to other galaxies. They find that GHZ2 exhibits characteristics similar to other galaxies that are dominated by star formation. Additionally, this very high-redshift galaxy appears to share characteristics with giant star-forming regions, which further suggests that GHZ2 is likely driven by extreme star formation. The authors find that, though some AGN contribution fraction cannot be definitively ruled out, GHZ2 is most likely dominated by metal-poor and young stellar populations.
How Will GHZ2 Evolve?

The stellar mass–velocity dispersion relationship with data points plotted for different object types including globular clusters (light-purple circles), ultra-compact dwarf galaxies (solid purple circles), dwarf ellipticals (down-pointing triangles), compact ellipticals (blue solid circles), and elliptical and S0 galaxies (green squares). The target galaxy GHZ2 is shown with a yellow star, which falls in closest agreement with compact ellipticals and ultra-compact dwarf galaxies in this relationship. Click to enlarge.
[Zavala et al. 2024]
Though the exact evolution of GHZ2 is unclear, this study underscores the significance of ALMA and JWST as a powerful pair of instruments capable of characterizing the most distant galaxies in the universe. Future observations with both instruments will continue to clarify what the early universe looked like and how it has evolved over time.
Citation
“ALMA Detection of [O III] 88 μm at z = 12.33: Exploring the Nature and Evolution of GHZ2 as a Massive Compact Stellar System,” Jorge A. Zavala et al 2024 ApJL 977 L9. doi:10.3847/2041-8213/ad8f38
The post Faraway Fossils: Clues from a High-Redshift Galaxy appeared first on AAS Nova.
]]>
Astrobites reports on the first observations of an active galactic nucleus by the X-ray Imaging and Spectroscopy Mission.
The post Seeing an Active Galactic Nucleus with 20/20 X-Ray Vision with XRISM appeared first on AAS Nova.
]]>Editor’s Note: Astrobites is a graduate-student-run organization that digests astrophysical literature for undergraduate students. As part of the partnership between the AAS and astrobites, we occasionally repost astrobites content here at AAS Nova. We hope you enjoy this post from astrobites; the original can be viewed at astrobites.org.
Title: XRISM Spectroscopy of the Fe Kα Emission Line in the Seyfert Active Galactic Nucleus NGC 4151 Reveals the Disk, Broad-line Region, and Torus
Authors: XRISM Collaboration
Status: Published in ApJL
Today we’re going to be taking a high-resolution look at X-rays from close to a supermassive black hole! But before we get into the astrophysics of today’s article, we first need to discuss the instruments that were built to do this science. More than 50 years ago now, charge-coupled devices (CCDs) began revolutionizing astronomy, and they continue to be one of the most commonly used detectors on telescopes. CCDs rely on the photoelectric effect, through which an incoming photon can liberate electrons in some material (semiconductors in the case of CCDs). These electrons are trapped by strong potential wells and electric charge can be applied to move the charge along and read this signal (check out this Astrobite for more details). CCDs are particularly powerful in the X-ray band, where the number of electrons trapped in each pixel scales roughly with the photon energy. This means that you get energy information (i.e., a spectrum) for free with CCDs! However, CCDs have limited spectral resolution, meaning they can’t determine this energy very precisely and therefore cannot resolve and unlock the power of narrow emission and absorption lines.
X-Ray Microcalorimetry and 20/20 Vision
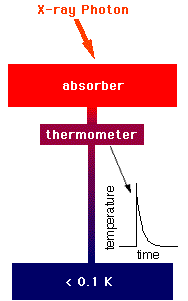
Figure 1: Schematic showing how a microcalorimeter works. An X-ray photon with energy E will produce a spike in the temperature of the absorber of E/C, where C is the heat capacity of the absorber. The thermometer is extremely sensitive to small changes in temperature, which means that we can get very accurate energies for each of the incoming X-ray photons. Therefore, a microcalorimeter can produce an X-ray spectrum with the best energy resolution of any current instrumentation. [NASA]
Now, XRISM isn’t actually the first X-ray microcalorimeter to fly, but it’s the first to live through its commissioning phase! Although the X-ray microcalorimeter has been in the works since the 1990s, previous X-ray microcalorimeters have been cut from missions, lost to launch failures, and left unable to operate due to loss of coolant for the detector. In 2016, JAXA successfully launched and operated the first X-ray microcalorimeter on the Hitomi Satellite. However, unfortunately, shortly after taking a beautiful spectrum of the Perseus Cluster, one of the best-studied galaxy clusters in the local universe, communication was lost with the satellite and never recovered. XRISM’s Resolve instrument has been the most successful X-ray microcalorimeter so far, and it has allowed us to start looking at the universe with 20/20 X-ray vision!
Supermassive Science with XRISM
Today we’re going to put on our high-resolution X-ray spectroscopy glasses to look at one of the first XRISM targets: NGC 4151, one of the most well-known active galactic nuclei in the local universe. An active galactic nucleus consists of a supermassive black hole that is gobbling down gas from its surroundings through a process known as accretion. While we’ve known about active galactic nuclei for more than 50 years now, we still don’t really understand how they are fueled and what the structure is around them. XRISM can unlock this information indirectly by resolving some of the key X-ray emission and absorption lines. In particular, the most prominent emission line in the X-ray spectrum of an active galactic nucleus is a neutral iron Kα line at 6.4 kiloelectronvolts (keV), which arises from material around the supermassive black hole being illuminated by the light from the accretion process. This line holds the keys to probing the structure of the surrounding gas, as its dynamics can tell us about the structure of the accretion disk and trace gas in the torus that is thought to connect the local host galaxy to the accretion flow.
Figure 2 shows the XRISM Resolve spectrum of NGC 4151 from two separate observations. The spectrum shows a prominent 6.4 keV line that is resolved, meaning that the measured width of the line is greater than the instrument’s resolution limit. Additionally, the line cannot be fit with a single emission line and instead requires multiple lines, signaling multiple physical scales contributing to this emission line. The right panels of this figure highlight that there are three distinct components to this emission line with broad (magenta), intermediate (dark blue), and narrow (cyan) widths. Since gas that is closer to the black hole will be moving faster than more distant gas, the authors can use these line widths to estimate where this gas is located. They find that these three lines range from about 100 gravitational radii (about 100 times the size of the black hole) to about 10,000 gravitational radii. Determining the multi-scale nature of this line has been extraordinarily difficult to detect with other instruments due to their limited energy resolution!
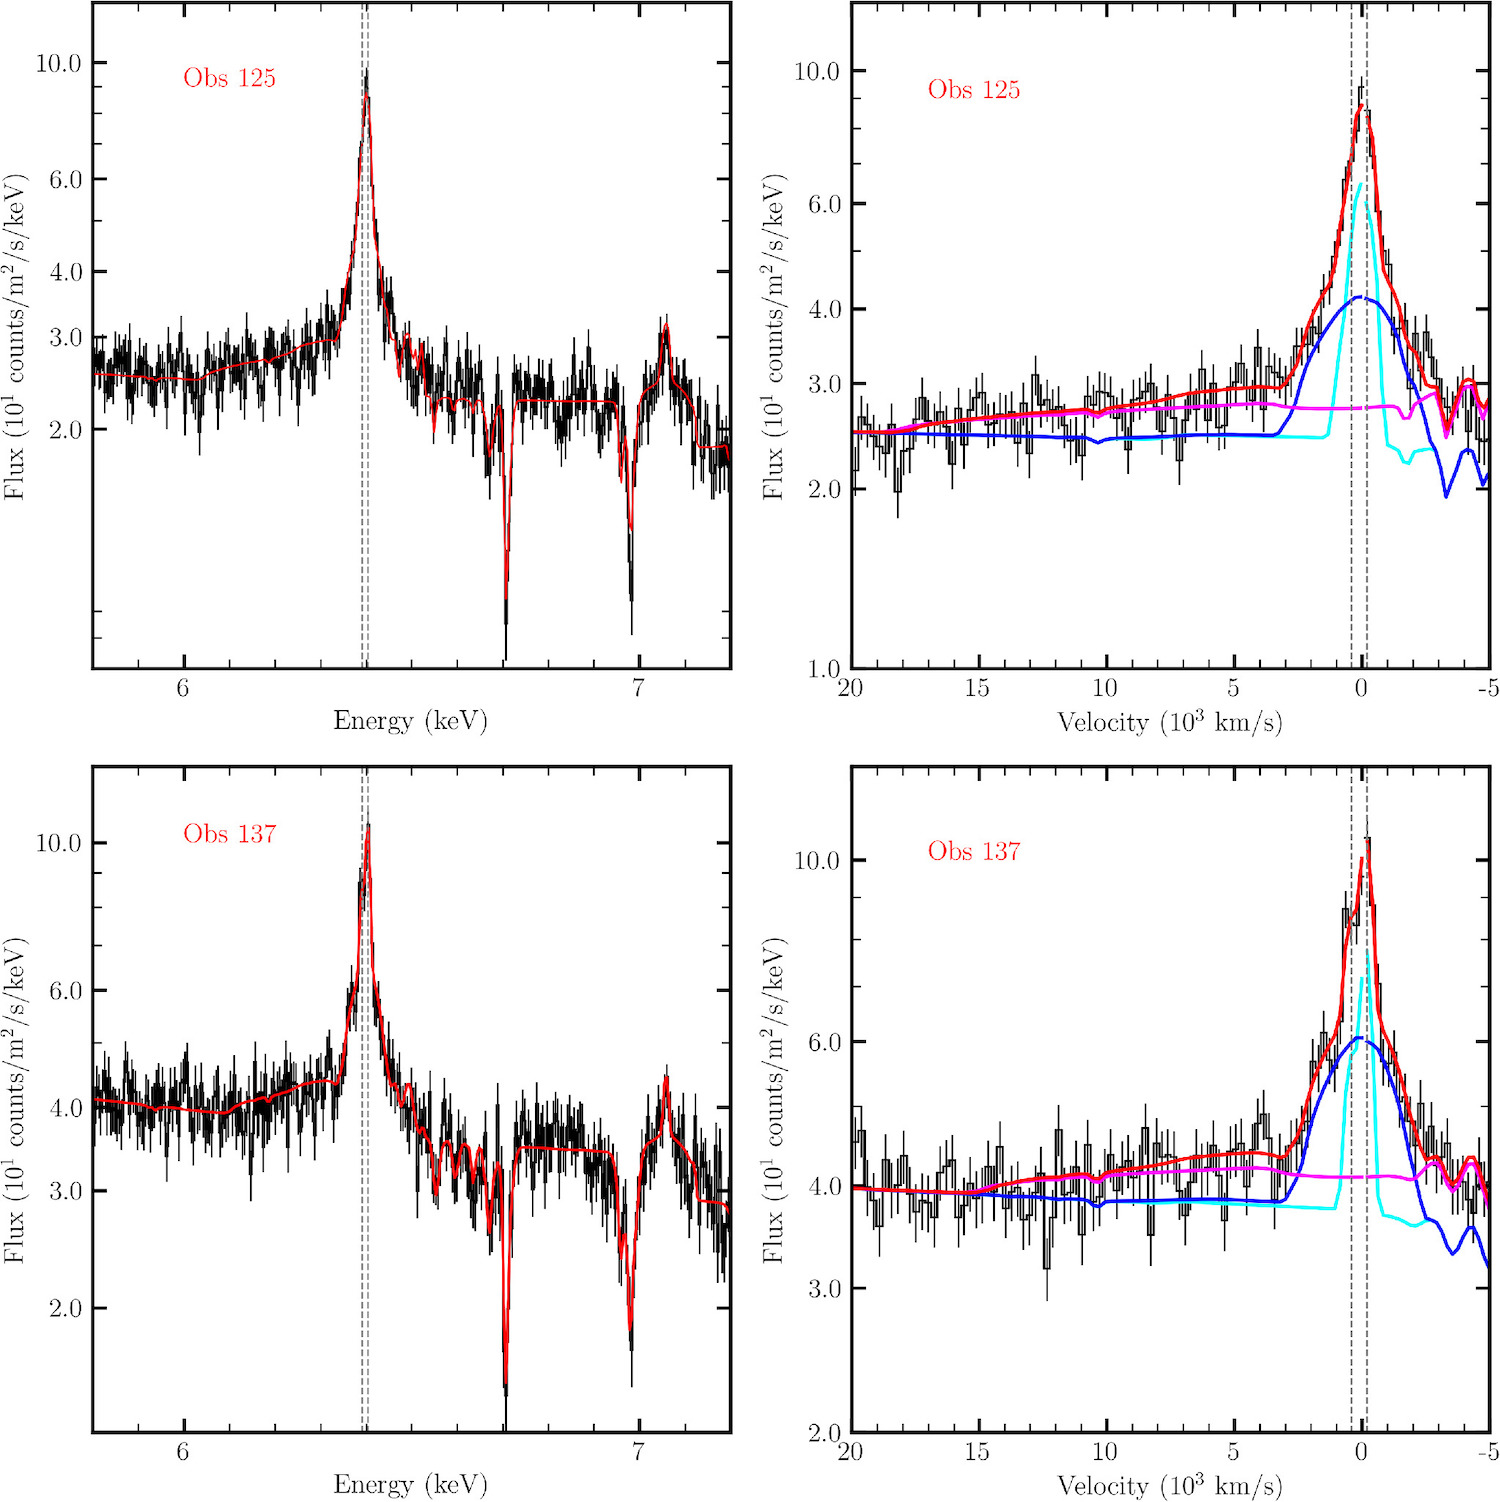
Figure 2: XRISM Resolve spectra of NGC 4151. The left panels show the spectrum in the 5.8-7.2 keV range from two separate observations, with the data in black and the best fit total model in red. The right panels show a zoom in on the iron Kα 6.4 keV line with the three different components for the line also shown. The magenta model corresponds to the widest line, arising potentially from a warped disk, the dark blue model corresponds to the intermediate width line coming from the inner edge of the broad line region (BLR), and the cyan model corresponds to the most narrow line that arises from the inner edge of the dusty torus. [XRISM Collaboration et al. 2024]
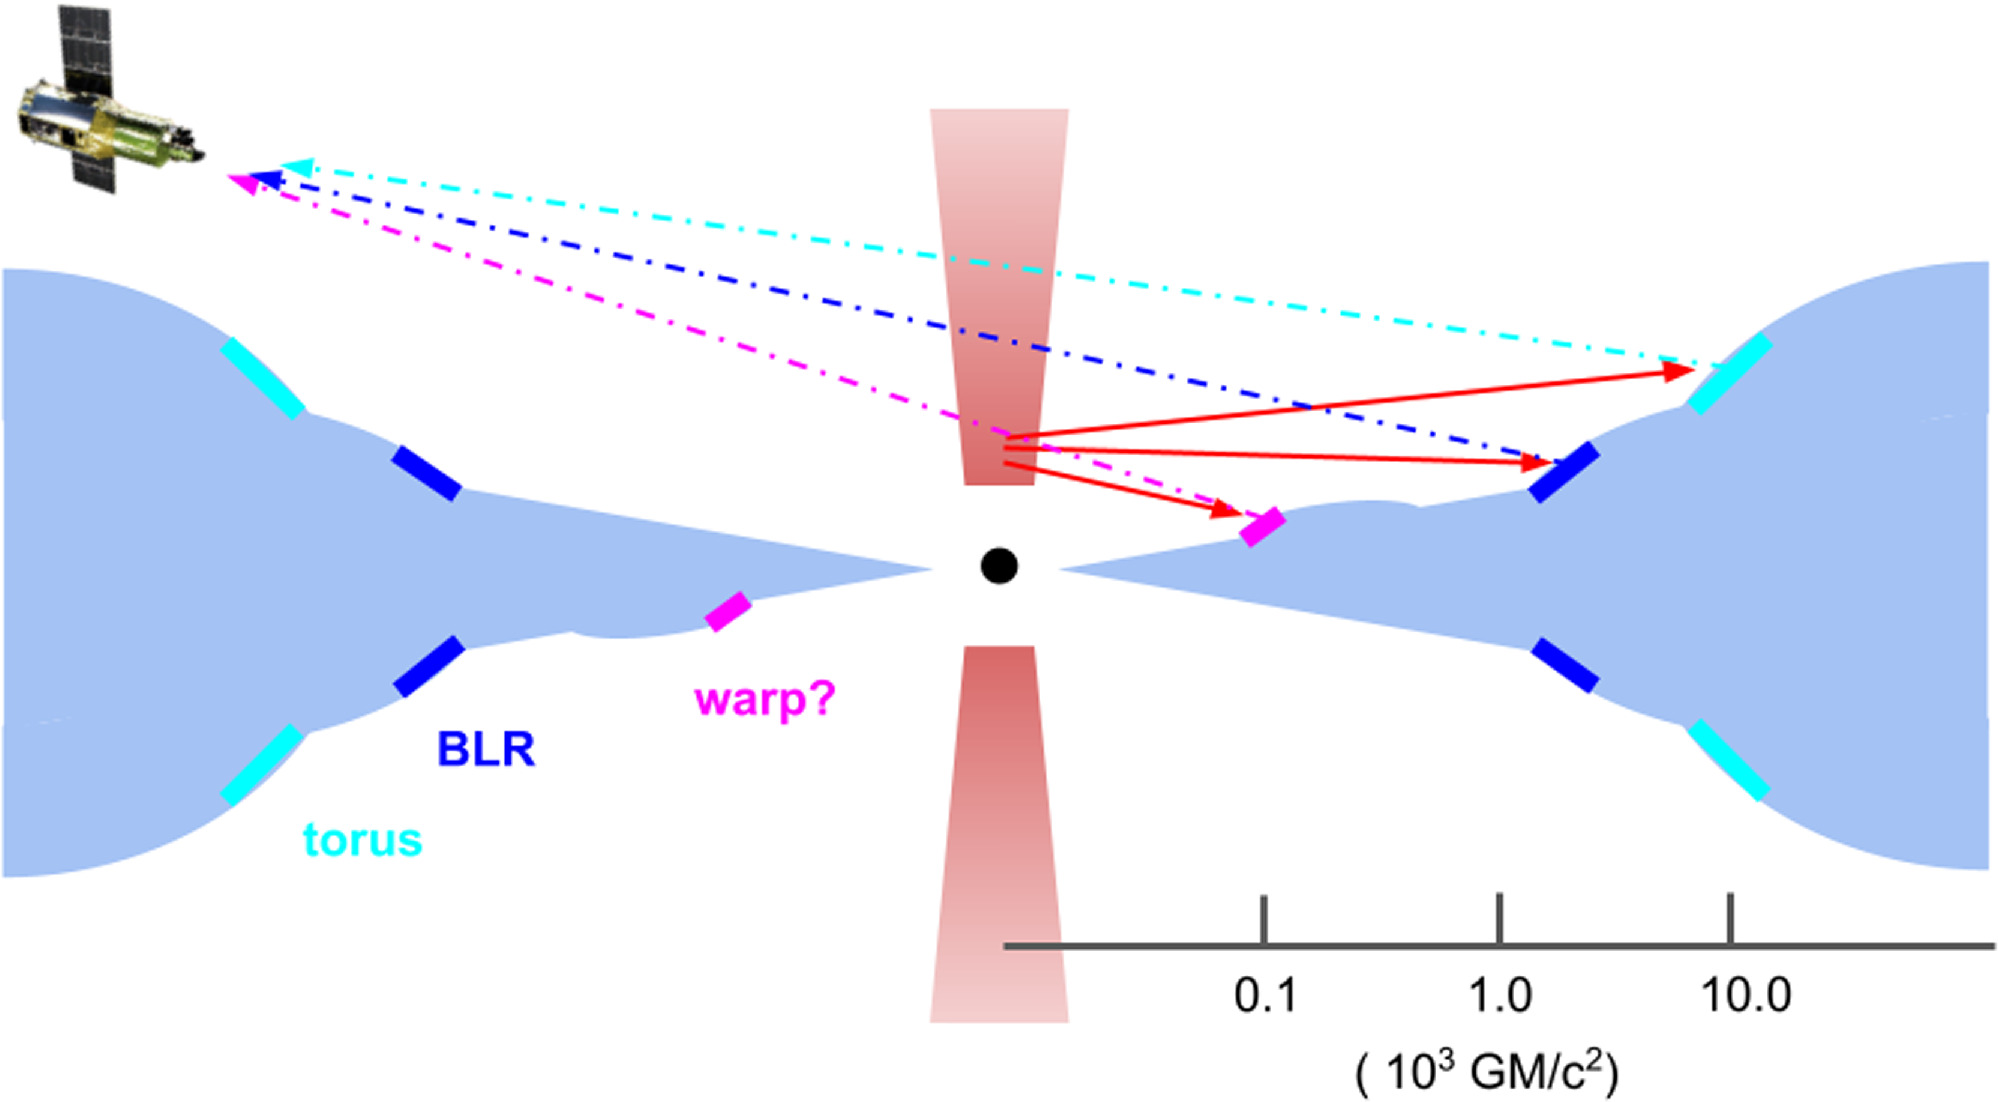
Figure 3: Schematic highlighting where each of the iron Kα emission lines arise from. The magenta component corresponds to the broadest line, potentially from a warp in the disk. The dark blue component corresponds to the intermediate-width line and arises from the inner edge of the broad line region (BLR). The cyan component corresponds to the narrowest line and arises from the inner edge of the active galactic nucleus torus. [XRISM Collaboration et al. 2024]
What’s Next?
These XRISM observations are rich with information, and today’s article focused only on the 6.4 keV emission line. The authors are planning a series of further articles, including on the active galactic nucleus winds traced by the absorption lines (i.e., the major dips seen at ~6.7 and ~7 keV in the left panels of Figure 2), comparisons of the emission lines with optical emission lines, and looking for faint evidence of broader emission from even closer to the supermassive black hole. The next obvious steps are also to observe more active galactic nuclei to test whether this multi-zone emission is a common occurrence in active galactic nuclei. One thing’s for sure, this 20/20 vision is sure to reveal new secrets about the lives and environments of supermassive black holes!
Original astrobite edited by Roel Lefever.
About the author, Megan Masterson:
I’m a 4th-year PhD student at MIT studying transient accretion events around supermassive black holes, including tidal disruption events and changing-look active galactic nuclei. I primarily use multi-wavelength observations to study from the inner accretion flow to the obscuring material in these transients. In my free time, you’ll find me hiking, reading, and watching women’s soccer.
The post Seeing an Active Galactic Nucleus with 20/20 X-Ray Vision with XRISM appeared first on AAS Nova.
]]>
Wide-angle outflows and narrow, structured jets dominate this view of two protostars and give a glimpse into the process of star and planet formation.
The post Featured Image: Jets and Outflows from Protostars appeared first on AAS Nova.
]]>The formation of stars and planets is a messy, multilayered, and energetic process. As part of the Early Planet Formation in Embedded Disks observing program, Sacha Gavino (Niels Bohr Institute, University of Copenhagen) and collaborators used the Atacama Large Millimeter/submillimeter Array (ALMA) to get a glimpse of this process. The images above show ALMA observations of two protostars, IRS1 and IRS2. In these images, green shows emission from fast-moving (<25 kilometers per second) carbon monoxide molecules, red shows emission from even faster-moving (>40 kilometers per second) carbon monoxide, and blue marks emission from silicon monoxide molecules. Each of these protostars is ringed by a dusty circumstellar disk, but what dominates the view are wide-angle outflows and narrow jets. Gavino’s team showed that the two protostars’ jets have different structures, with IRS1’s jet tracing out a complex double helix and IRS2’s jet emerging from the system in clumps. The helical structure of IRS1’s jet provides evidence for the rotation of outflowing material — a process that carries away angular momentum from the system. The clumps in IRS2’s jet, on the other hand, give insight into past periods of accretion onto the protostar. For more information about these two protostars, including details on their potentially planet-forming disks, be sure to check out the full research article linked below.
Citation
“Early Planet Formation in Embedded Disks. XI. A High-Resolution View Toward the BHR 71 Class 0 Protostellar Wide Binary,” Sacha Gavino et al 2024 ApJ 974 21. doi:10.3847/1538-4357/ad655e
The post Featured Image: Jets and Outflows from Protostars appeared first on AAS Nova.
]]>
The star SOS1 is not like its neighbors — what do high-precision chemical abundances tell us about where this star might have come from?
The post Reading a Chapter of Galactic History from a Single Star appeared first on AAS Nova.
]]>The star SOS1 is not like its neighbors. Using chemical and dynamical data, stellar sleuths have tracked this star from its current home in the Milky Way’s central bar back to its likely origin in one of the most massive globular clusters in our galaxy.
A Star in a Bar

The Milky Way, like the galaxy NGC 1300 shown here in an image from the Hubble Space Telescope, has a central bar of stars. [NASA, ESA, and The Hubble Heritage Team (STScI/AURA); Acknowledgment: P. Knezek (WIYN)]
One piece of the puzzle might be provided by the star 2M17454705-2639109, also known as SOS1. This star is located in the busy galactic downtown of the Milky Way’s center, orbiting within the central bar of stars. Data from the Apache Point Observatory Galactic Evolution Experiment (APOGEE) show that SOS1 has a curious chemical composition that sets it apart from its neighbors. Now, researchers have shown that these chemical differences may be evidence that SOS1 originated far from its current location — and that many other stars in the galactic bar might have completed similar journeys.

The reddish stars of the globular cluster Liller 1 glow behind bright blue stars in the foreground. [ESA/Hubble & NASA, F. Ferraro; CC BY 4.0]
SOS1: Far from Home?
A team led by Stefano Souza (Leibniz Institute for Astrophysics Potsdam; University of São Paolo; Max Planck Institute for Astronomy) investigated SOS1’s origins by first comparing its chemical abundance pattern to those of different populations of stars in the Milky Way. The observed pattern of low carbon, high nitrogen, and high aluminum matches expectations for second-generation stars in globular clusters: densely packed, roughly spherical collections of thousands to millions of stars.
But how would a star born in a globular cluster end up in the Milky Way’s central bar? Souza’s team highlighted two possible scenarios: SOS1 might have been ejected from its home cluster by a gravitational interaction with a binary star system, or — deemed more likely — it could have been stolen from its home cluster by the tidal forces of the Milky Way.
Candidate Clusters
Souza’s team used N-body simulations to determine if SOS1 once called one of the existing globular clusters home. (The team notes that it’s possible that SOS1’s parent star cluster no longer exists, having been pulled apart by the Milky Way’s powerful tidal forces.) The likeliest candidate is Terzan 5, which is among the most massive and most ancient globular clusters in the Milky Way. The simulations suggest that SOS1 might have been bound to this cluster 353 million years ago.

Chemical (left) and age (right) comparison between SOS1 and stars in the globular cluster Terzan 5. Click to enlarge. [Souza et al. 2024]
The chemical similarities and dynamical properties make it likely that SOS1 once resided in a globular cluster, possibly Terzan 5. Its current residence in the Milky Way’s central bar supports the idea that ancient globular clusters contributed stars to the bar through tidal stripping.
Citation
“Tracing Back a Second-Generation Star Stripped from Terzan 5 by the Galactic Bar,” Stefano O. Souza et al 2024 ApJL 977 L33. doi:10.3847/2041-8213/ad91af
The post Reading a Chapter of Galactic History from a Single Star appeared first on AAS Nova.
]]>
2024 has been another wonderful year for astronomy! Check out our year-end top 10 post to see what readers were most fascinated by this year.
The post Looking Back on Astronomy in 2024 with AAS Nova appeared first on AAS Nova.
]]>Another year is drawing to a close, and we’re looking back on all the discoveries that we’ve covered on AAS Nova this year. The top stories offer an astronomical smorgasbord and an in-depth look at some of the most recognizable objects in our galaxy. Without further ado, here are the top 10 most-read posts of 2024:

The first image of the Milky Way’s central supermassive black hole in polarized light. [EHT Collaboration; CC BY 4.0]
10. A New Way of Looking at the Milky Way’s Supermassive Black Hole
In 2022, the Event Horizon Telescope collaboration released the first image of the Milky Way’s supermassive black hole, Sagittarius A*. But the collaboration’s work didn’t stop there, and two years later they released an image of our hometown black hole in an entirely new light: polarized light, to be exact. The polarization of light — the orientation of the light waves as they travel through space — informs researchers as to the magnetic field conditions close to the black hole as well as in between the black hole and Earth. These results revealed a high degree of linear polarization as well as a lesser amount of circular polarization, suggesting a strong, orderly magnetic field.

An illustration of an exoplanet being engulfed by its home star. The planet 8 Ursae Minoris b has somehow escaped this fate. [International Gemini Observatory/NOIRLab/NSF/AURA/M. Garlick/M. Zamani; CC BY 4.0]
9. Astronomers Reopen the Mystery of a Planet That Shouldn’t Exist
Researchers thought they had solved the mystery of the exoplanet 8 Ursae Minoris b: unsure how the planet had survived its host star ballooning into a red giant, they proposed that the star had swallowed its one-time stellar companion, changing its evolution in a way that saved its planet from certain doom. But new data analyzed by Huiling Chen and collaborators upended this tale of a planet saved by a stellar merger: Ursae Minoris b is simply too young to have merged with a companion star. Luckily, the team’s research brought to light another possible resolution to the mystery.

The supernova SN 1994D illuminates the outskirts of its host galaxy, NGC 4526. [NASA, ESA, The Hubble Key Project Team, and The High-Z Supernova Search Team]
8. The Quest to Watch a Supernova in Real Time
The sooner researchers spot a supernova explosion, the more they can learn from it — but is there a way to know when a supernova is coming? The ejecta from a supernova explosion is so dense that light from the explosion is delayed on its way to our telescopes, but nearly massless particles called neutrinos can escape the blast and, in theory, announce the explosion before the light reaches us. Yuri Kashiwagi and collaborators examined how the upgraded Super-Kamiokande detector can be used to alert astronomers of an impending supernova, enhancing our ability to learn from these explosions.
7. How Common Are Solar Systems Like Our Own?

Illustration (orbits not to scale) of the planets in our solar system. [NASA/JPL]

An artist’s impression of light shining through the ocean of a “water world,” possibly like LHS 1140b. [NASA]
6. What Kind of World is LHS 1140b?
LHS 1140b is a bright, nearby star that is known to host two planets. The nature of the inner of the two planets, LHS 1140b, is unclear, despite the bevy of telescopes that have observed this world. As Charles Cadieux and collaborators have shown, LHS 1140b might be the smallest known mini-Neptune exoplanet, or it might be a water world with a surface of ice and oceans.

Artist’s impression of the red supergiant star Betelgeuse. Though depicted solo, new research suggests that Betelgeuse might have a tiny companion. [Adapted from ESO/L. Calçada; CC BY 4.0]
5. Hiding in Plain Sight: Betelgeuse’s Binary Buddy
Betelgeuse is a highly recognizable red supergiant in the constellation Orion. Astrobites’s Alexandra Masegian reports on two AAS journal articles that independently arrived at the same conclusion: that Betelgeuse is not a single star, but rather a member of a binary system. While the two articles find slightly different masses and orbital separations for the proposed companion star, they both point to Betelgeuse’s long secondary pulsation period as evidence of the companion.

Cartoon showing a variety of exoplanet types. Figuring out whether a planet is rocky or gaseous can be a challenge, as is the case for K2-18b. [NASA/JPL-Caltech/Lizbeth B. De La Torre]
4. K2-18b May Not Be Habitable After All
The 8.6-Earth-mass exoplanet K2-18b made headlines when researchers reported that the planet might be a rocky world covered in oceans. Even more eyebrow raising was the potential detection of a faint signal from dimethyl sulfide, a compound that on Earth is only associated with the presence of life. Nicholas Wogan and coauthors used models to interpret JWST data of K2-18b, finding that the planet is instead most likely an uninhabitable gas-rich world — though they didn’t entirely rule out the inhabited ocean world scenario.

The Cassiopeia A supernova remnant as seen by JWST. [Rho et al. 2024]
3. Featured Image: A New Portrait of Cassiopeia A
The Cassiopeia A supernova remnant has sat for countless astronomical portraits, each of which reveals new details about this remnant of an exploded star. This portrait from JWST’s Mid-Infrared Instrument and Near-Infrared Camera highlighted electrons spiraling around magnetic field lines as well as light from argon and carbon monoxide, allowing a team led by Jeonghee Rho to study the connections between the formation of molecules like carbon monoxide and the creation of cosmic dust.
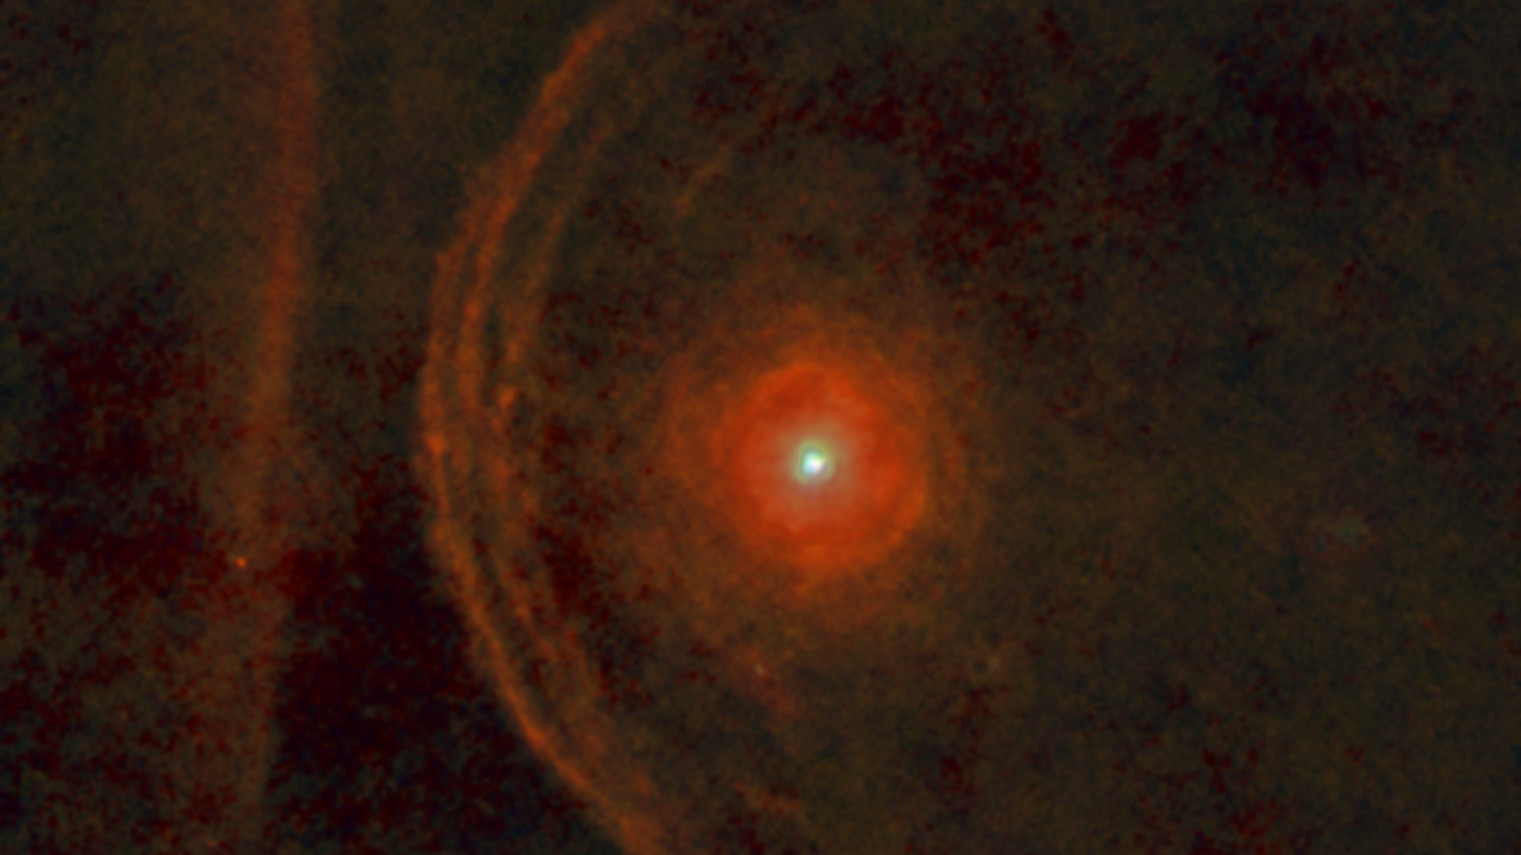
Red supergiant star Betelgeuse, pictured here in an infrared image from the Herschel Space Observatory, has ejected a considerable amount of material. [ESA/Herschel/PACS/L. Decin et al.]
2. Monthly Roundup: Betelgeuse, Betelgeuse, Betelgeuse
Everyone’s favorite red supergiant makes two appearances in this list! This article summoned three perspectives on Betelgeuse, which has made frequent news appearances over the past few years because of its pronounced, prolonged dimming episode in 2019–2021. Though the star has returned to its normal brightness, questions linger about the star’s future behavior and its uncertain past — including whether Betelgeuse is the product of a stellar merger.
1. The Odds of the Unthinkable

Radar images of the near-Earth object Apophis. [NASA/JPL-Caltech and NSF/AUI/GBO]
Thank you for joining us for another year of astronomy news — we hope to see you in 2025 for more discoveries. Happy New Year!
The post Looking Back on Astronomy in 2024 with AAS Nova appeared first on AAS Nova.
]]>
Using the Parker Solar Probe, researchers have collected images of turbulent eddies in the Sun's outer corona. This likely marks the first time this instability has been directly imaged so far out in the Sun's atmosphere.
The post Selections from 2024: First Images of Turbulent Eddies in the Outer Corona appeared first on AAS Nova.
]]>Editor’s Note: For the remainder of 2024, we’ll be looking at a few selections that we haven’t yet discussed on AAS Nova from among the most-downloaded articles published in AAS journals this year. The usual posting schedule will resume January 3rd.
First Direct Imaging of a Kelvin–Helmholtz Instability by PSP/WISPR
Published March 2024
Main takeaway:
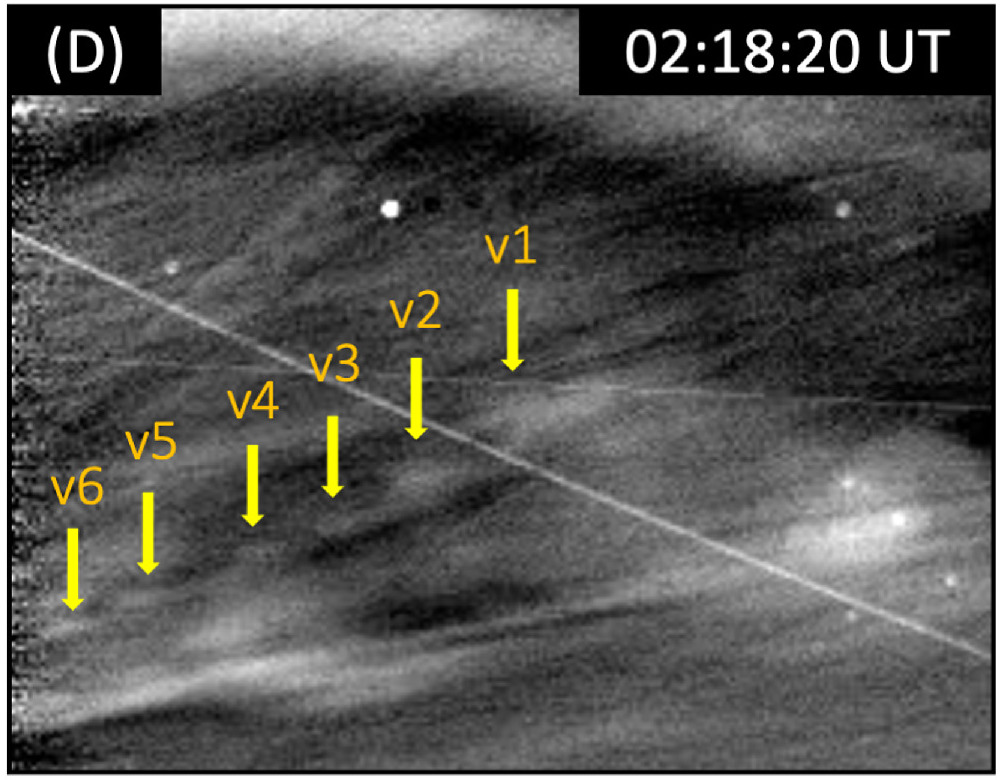
One of several frames in which the turbulent eddies are clearly visible in images from the Wide-field Imager for Parker Solar Probe (WISPR). Each vortex-like feature is labeled. Click to enlarge. [Adapted from Paouris et al. 2024]
Why it’s interesting:
The Kelvin–Helmholtz instability arises at the interface between two fluids, or between fluid regions that are moving at different velocities. While that might sound obscure, Kelvin–Helmholtz instabilities are thought to be common throughout planetary and stellar atmospheres, and you may have seen images of the wave-like clouds (pictured above) that form through the instability. Although researchers knew that the Kelvin–Helmholtz instability happens in the Sun’s atmosphere, they didn’t expect to see evidence of it in the Sun’s middle and outer corona — the hot and tenuous upper atmosphere. They believed that the wave-like pattern of the instability would simply be too small to pick out, even from a nearby spacecraft like the Parker Solar Probe.
More about the discovery and what it might enable:
Paouris and collaborators spotted the instability at the boundary between the solar corona and a coronal mass ejection: a massive outburst of solar plasma and magnetic fields. The team applied multiple tests to the data to confirm that the observed pattern of eddies was consistent with expectations for the Kelvin–Helmholtz instability. This discovery opens up the possibility of using these observations to study the rarefied plasma of the solar corona, as well as the movement of coronal mass ejections through the corona and the outflowing solar wind. Understanding the motions of coronal mass ejections is important for forecasting whether these destructive events might strike Earth, which has practical value: the energetic particles of a coronal mass ejection threaten spacecraft electronics, power grids, and astronauts floating beyond the protective shield of Earth’s magnetic field.
Citation
Evangelos Paouris et al 2024 ApJ 964 139. doi:10.3847/1538-4357/ad2208
The post Selections from 2024: First Images of Turbulent Eddies in the Outer Corona appeared first on AAS Nova.
]]>
Dust might be responsible for hiding many tidally disrupted stars from view — but a new search at infrared wavelengths has revealed them at last.
The post Selections from 2024: Sampling Shredded Stars in the Infrared appeared first on AAS Nova.
]]>Editor’s Note: For the remainder of 2024, we’ll be looking at a few selections that we haven’t yet discussed on AAS Nova from among the most-downloaded articles published in AAS journals this year. The usual posting schedule will resume January 3rd.
A New Population of Mid-Infrared-Selected Tidal Disruption Events: Implications for Tidal Disruption Event Rates and Host Galaxy Properties
Published January 2024
Main takeaway:
A team led by Megan Masterson (Massachusetts Institute of Technology) has scoured data from the Near-Earth Object Wide-Field Infrared Survey Explorer (NEOWISE) to find tidal disruption events (TDEs): stars that are torn apart by the tidal forces of a supermassive black hole. The search turned up a dozen TDEs that represent a new population of mid-infrared-detected TDEs. This new population helps to relieve some of the tension between the expected and observed numbers of TDEs.
Why it’s interesting:
The existence of TDEs was first theorized in the 1970s, and the first event in this class was identified in the 1990s. Since then, the number of known TDEs has skyrocketed thanks to sensitive, high-cadence surveys. Most TDEs are identified by their rapid brightening at optical or X-ray wavelengths. Based on existing detections, TDEs appear to be more common in galaxies that fall in between star forming and quiescent, or in galaxies that were highly star forming in the past but are now quiescent. It’s not yet known if TDEs are truly less common in star-forming galaxies, or if dust in the centers of these galaxies simply hides TDEs from view.
How the team collected their sample:

Host galaxies for each of the selected TDE candidates. The 12 galaxies in the clean “gold” sample are marked with stars; the remaining six TDE candidates may instead be weak active galactic nuclei. Click to enlarge. [Masterson et al. 2024]
Citation
Megan Masterson et al 2024 ApJ 961 211. doi:10.3847/1538-4357/ad18bb
The post Selections from 2024: Sampling Shredded Stars in the Infrared appeared first on AAS Nova.
]]>
Researchers have proposed a new solution to a cosmic chicken-and-egg problem, suggesting a new role for supermassive black holes in the formation of stars in young galaxies.
The post Selections from 2024: Which Came First, Supermassive Black Holes or Galaxies? appeared first on AAS Nova.
]]>Editor’s Note: For the remainder of 2024, we’ll be looking at a few selections that we haven’t yet discussed on AAS Nova from among the most-downloaded articles published in AAS journals this year. The usual posting schedule will resume January 3rd.
Which Came First: Supermassive Black Holes or Galaxies? Insights from JWST
Published January 2024
Main takeaway:
Joseph Silk (Sorbonne University; The Johns Hopkins University; University of Oxford) and collaborators have theorized that supermassive black holes are responsible for the high rate of star formation seen in many young galaxies. The proposed framework flips the conventional narrative of black hole and galaxy formation, suggesting that supermassive black hole growth spurred the formation of new stars rather than lagging behind the formation of stars.
Why it’s interesting:
How and when supermassive black holes formed in the early universe is one of the key unanswered questions in astronomy. The conventional theory of supermassive black hole formation suggests that galaxies formed first: gas clouds collapsed to form the first stars, which left behind stellar-mass black holes when the stars expired. A series of collisions between these stellar-mass black holes slowly built the first supermassive black holes while star formation continued busily in the background. The team’s new theory suggests that black holes and galaxies grew in tandem instead, with black hole growth playing an important role in the formation of new stars.
Solving a cosmic chicken-and-egg problem:
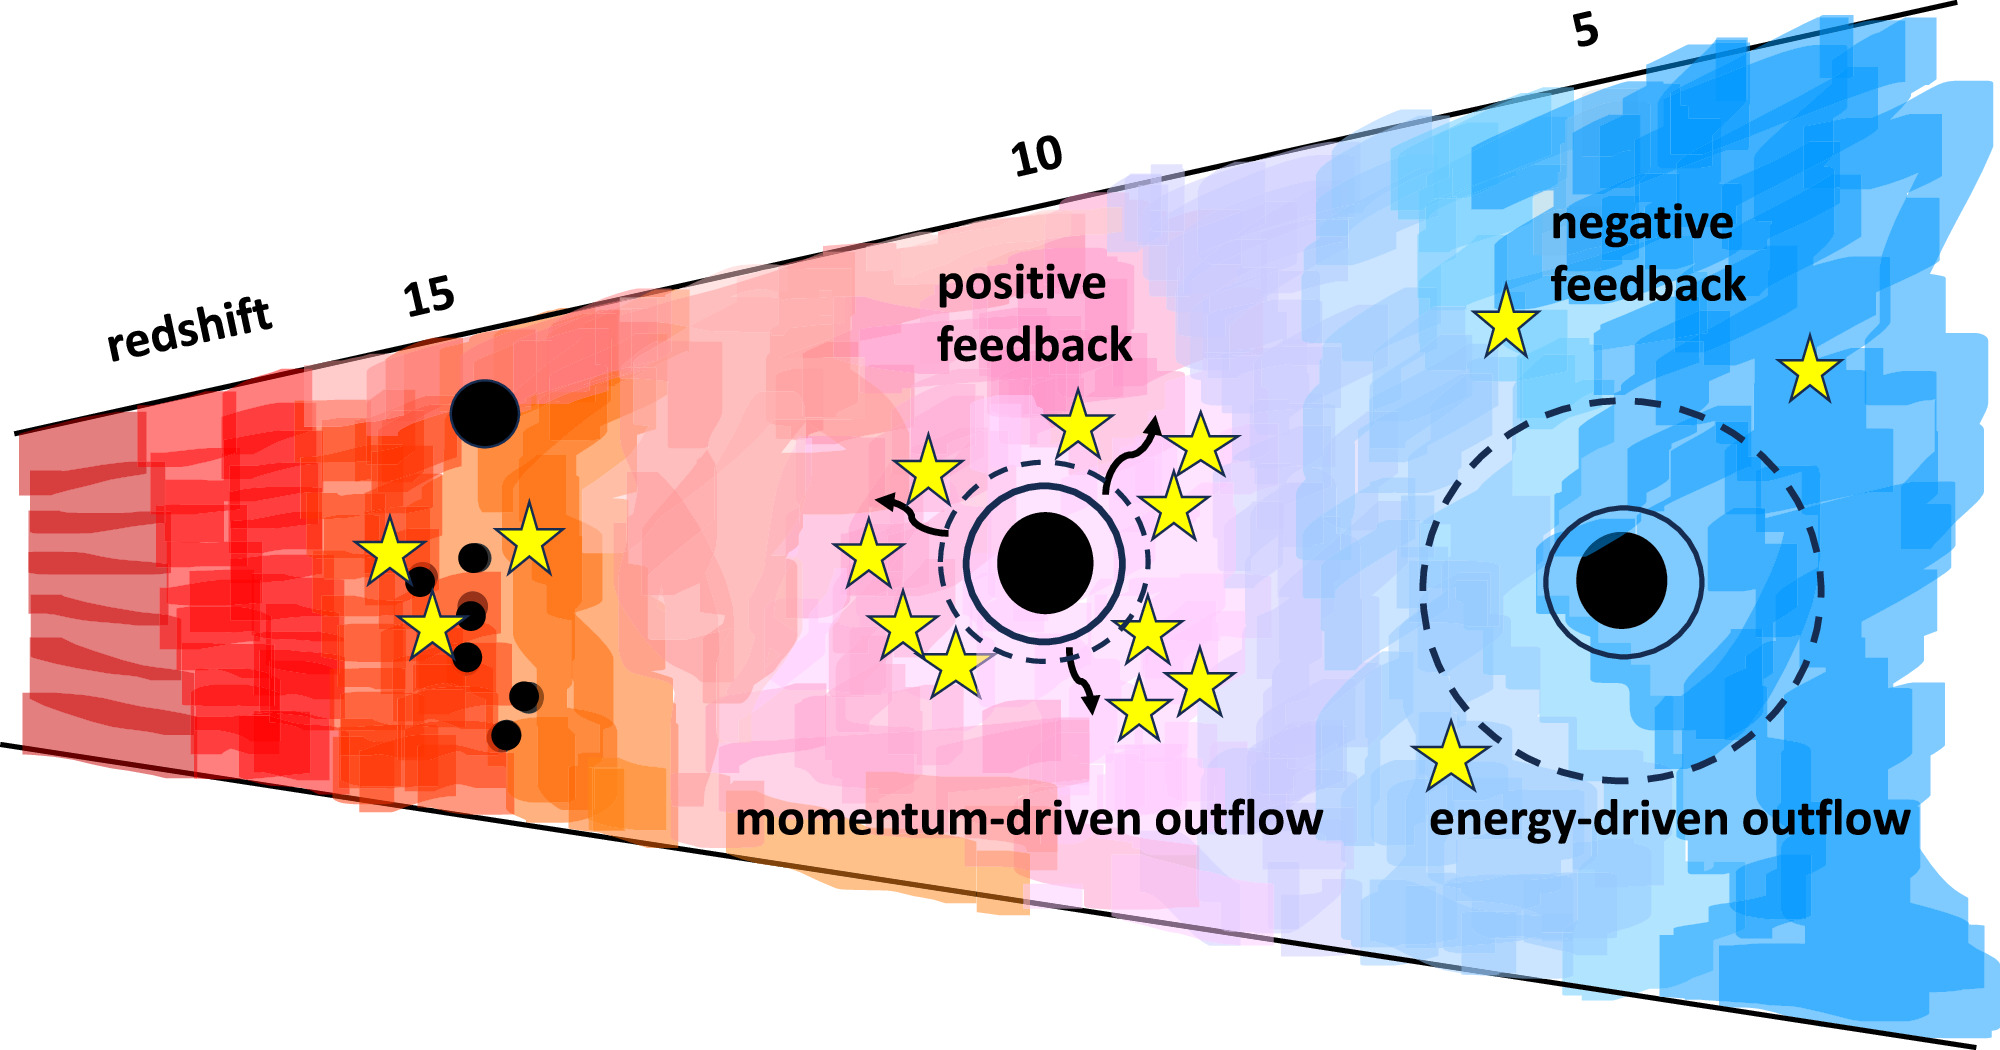
Diagram showing the redshifts at which supermassive black holes spur and quench star formation in their host galaxies, in the proposed framework. Click to enlarge. [Silk et al. 2024]
Citation
Joseph Silk et al 2024 ApJL 961 L39. doi:10.3847/2041-8213/ad1bf0
The post Selections from 2024: Which Came First, Supermassive Black Holes or Galaxies? appeared first on AAS Nova.
]]>
Two stellar structures discovered in the Milky Way this year may be fragments of proto-galaxies that formed before our galaxy was assembled.
The post Selections from 2024: Possible Proto-Galactic Fragments in the Milky Way appeared first on AAS Nova.
]]>Editor’s Note: For the remainder of 2024, we’ll be looking at a few selections that we haven’t yet discussed on AAS Nova from among the most-downloaded articles published in AAS journals this year. The usual posting schedule will resume January 3rd.
Shiva and Shakti: Presumed Proto-Galactic Fragments in the Inner Milky Way
Published March 2024
Main takeaway:

Illustration of the structure of the Milky Way. Click to enlarge. [Left: NASA/JPL-Caltech; right: ESA; layout: ESA/ATG medialab]
Why it’s interesting:
The Gaia spacecraft makes precise measurements of the positions, distances, velocities, and chemical compositions of stars in our galaxy. Using these data, researchers have discovered many new structures and stellar populations in and around our galaxy, such as stellar streams and satellite galaxies. These structures hold important clues to the formation and evolution of our galaxy, revealing a complex history of accretion, assimilation, and migration of gas and stars.
Potential origins of the newfound structures:
Stellar structures within our galaxy can develop in one of two ways: in situ, meaning forming out of gas and stars already present in the Milky Way, or through accretion from outside the galaxy. The orbits and chemical abundances of the stars in Shiva and Shakti tell a conflicting story about the origins of these two structures. The orbits point to an accretion origin, while the chemical abundances suggest in situ formation; this combination of features has never been seen before. Malhan and Rix suggest that these opposing conclusions can be reconciled in one of two ways: 1) the stars of the Shiva and Shakti structures belonged to the Milky Way’s diffuse, extended halo and became trapped in a resonance with the Milky Way’s central bar of stars before migrating to their current positions, or 2) the Shiva and Shakti structures are truly ancient, representing fragments of proto-galaxies that formed before the Milky Way was constructed. While each of these hypotheses has its strengths and neither is fully compatible with the data, Malhan and Rix favor the proto-galactic fragment idea. Luckily, upcoming surveys and instruments will give an even deeper look into the structure of the Milky Way, helping to clarify how our galaxy was assembled.
Citation
Khyati Malhan and Hans-Walter Rix 2024 ApJ 964 104. doi:10.3847/1538-4357/ad1885
The post Selections from 2024: Possible Proto-Galactic Fragments in the Milky Way appeared first on AAS Nova.
]]>
Researchers have spotted what might be water on asteroids before, but 2024 brought the first definitive detection.
The post Selections from 2024: First Unambiguous Detection of Water on an Asteroid appeared first on AAS Nova.
]]>Editor’s Note: For the remainder of 2024, we’ll be looking at a few selections that we haven’t yet discussed on AAS Nova from among the most-downloaded articles published in AAS journals this year. The usual posting schedule will resume January 3rd.
Detection of Molecular H2O on Nominally Anhydrous Asteroids
Published February 2024
Main takeaway:
Using the Stratospheric Observatory for Infrared Astronomy (SOFIA) — a now-decommissioned Boeing 747 that toted an infrared telescope to 40,000 feet for more than a decade — Anicia Arredondo (Southwest Research Institute) and collaborators investigated the surface compositions of four asteroids. The spectra of two asteroids in the sample contained a feature unambiguously attributed to water, marking the first time water has been detected on the surface of an asteroid.
Why it’s interesting:
Asteroids represent material left over from the formation of the solar system. By studying asteroids, researchers hope to learn about the solar nebula from which the planets coalesced. Of particular interest is the distribution of water in the early solar system, which can tell us about how Earth got its water, as well as how planets in other star systems might develop. The four asteroids examined in this study are S-type asteroids, which are thought to form in the inner solar system, where volatile materials like water are scarce. The discovery of water molecules on these supposedly dry asteroids provides an important constraint on theories of solar system and planet formation.

Spectra of the four asteroids examined in this work. Two of the asteroids, (7) Iris and (20) Massalia, clearly show the 6-micron water feature, while the other two asteroids do not. Click to enlarge. [Arredondo et al. 2024]
On the definitive spectral feature:
Detecting a particular molecule in space can be difficult because the spectral features from different molecules often overlap. Many asteroids exhibit a spectral feature at 3 microns (1 micron = 10-6 meter) that arises from stretching of the chemical bond between an oxygen atom and a hydrogen atom. This bond is present in a water molecule — meaning that this feature could be due to water — but it’s also present in many other molecules. To make their definitive detection of water, Arredondo’s team searched instead for a spectral feature at 6 microns, which is solely due to water and has been detected previously on the Moon. The water molecules discovered in this study might be trapped in glass beads on the asteroids’ surfaces, adsorbed onto silicon, or bound up in minerals. The team plans to use JWST to continue their search for water on asteroid surfaces.
Citation
Anicia Arredondo et al 2024 Planet. Sci. J. 5 37. doi:10.3847/PSJ/ad18b8
The post Selections from 2024: First Unambiguous Detection of Water on an Asteroid appeared first on AAS Nova.
]]>
The Milky Way's faintest known satellite contains just 57 stars and has a total mass of 16 solar masses: meet Ursa Major III/UNIONS 1.
The post Selections from 2024: Faintest Known Milky Way Satellite Discovered appeared first on AAS Nova.
]]>Editor’s Note: For the remainder of 2024, we’ll be looking at a few selections that we haven’t yet discussed on AAS Nova from among the most-downloaded articles published in AAS journals this year. The usual posting schedule will resume January 3rd.
The Discovery of the Faintest Known Milky Way Satellite Using UNIONS
Published January 2024
Main takeaway:
A team led by Simon Smith (University of Victoria) discovered a collection of stars orbiting the Milky Way in data from the Ultraviolet Near Infrared Optical Northern Survey (UNIONS), which is carried out by three telescopes in Hawaiʻi. The newly discovered Milky Way satellite, named Ursa Major III/UNIONS 1, contains about 57 stars and has a total mass of 16 solar masses. Ursa Major III/UNIONS 1 is the faintest known Milky Way satellite.
Why it’s interesting:
The advent of sensitive surveys has revealed much about the Milky Way’s neighborhood, including a steadily growing population of satellites. These surveys are discovering fainter and fainter satellites that blur the line between the largest star clusters and the smallest dwarf galaxies. Dwarf galaxies and star clusters have significant overlap in their masses and are distinguished by the presence or absence of dark matter: dwarf galaxies are thought to form in individual dark matter halos, while star clusters are not.

The brightness and size of Ursa Major III/UNIONS 1 (orange square) relative to dwarf galaxies (blue circles), globular clusters (red circles), and ambiguous satellites (black diamonds). Click to enlarge. [Smith et al. 2024]
On the nature of this faint satellite:
It’s not yet clear whether Ursa Major III/UNIONS 1 is a dwarf galaxy or a star cluster. This fact is reflected in the system’s name: newfound dwarf galaxies are named for the constellation in which they appear, while star clusters are named for the survey in which they were discovered. This satellite currently bears both kinds of names. Smith’s team found evidence that the velocities of stars in Ursa Major III/UNIONS 1 are spread fairly widely around the mean velocity of the system, suggesting that the system sits in its own dark matter halo and thus could be an astoundingly small dwarf galaxy. However, this finding is highly sensitive to the number of stars included in the analysis, highlighting the need for careful follow-up observations of this faint Milky Way satellite — and many others.
Citation
Simon E. T. Smith et al 2024 ApJ 961 92. doi:10.3847/1538-4357/ad0d9f
The post Selections from 2024: Faintest Known Milky Way Satellite Discovered appeared first on AAS Nova.
]]>
Need more than a million quasars for your study of large-scale structure, accretion, or black hole growth? The Quaia catalog has you covered.
The post Selections from 2024: Mapping Quasars Across the Universe appeared first on AAS Nova.
]]>Editor’s Note: For the remainder of 2024, we’ll be looking at a few selections that we haven’t yet discussed on AAS Nova from among the most-downloaded articles published in AAS journals this year. The usual posting schedule will resume January 3rd.
Quaia, the Gaia-unWISE Quasar Catalog: An All-Sky Spectroscopic Quasar Sample
Published March 2024
Main takeaway:
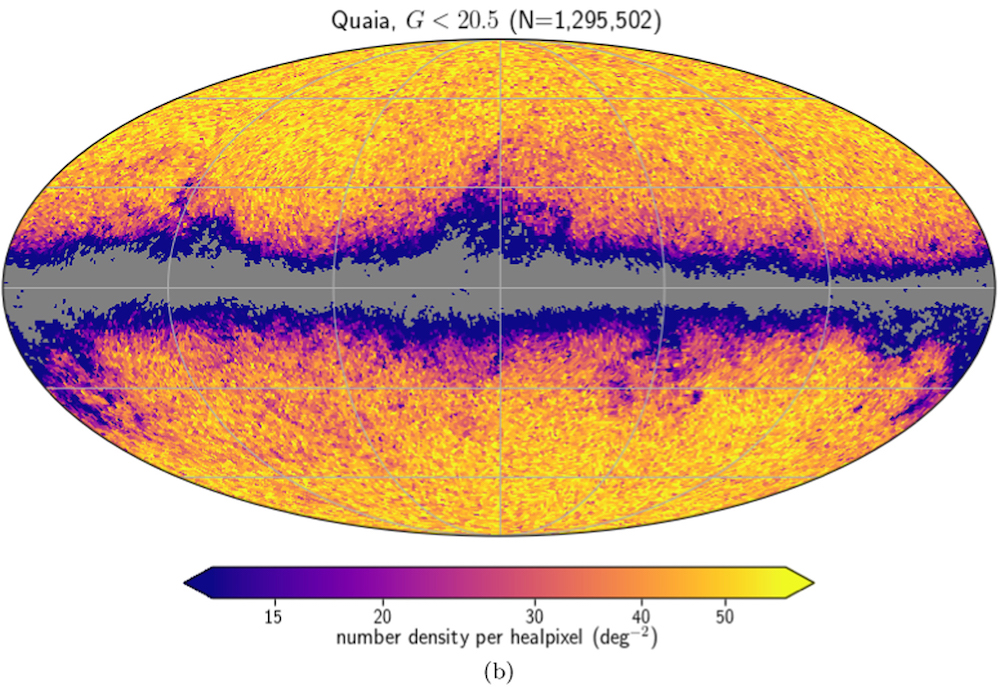
The on-sky distribution of quasars in the Quaia catalog. The dearth of objects across the center of the image is due to the Milky Way’s disk. The team also developed a more refined sample of 755,850 quasars with especially reliable distance estimates. Click to enlarge. [Adapted from Storey-Fisher et al. 2024]
Why it’s interesting:
Quasars — short for “quasi-stellar radio sources” — are extremely luminous galactic centers powered by accreting supermassive black holes. Quasars are thought to reside in regions of dense dark matter, making them important probes of the unseen dark-matter structures that suffuse the universe. In addition to their cosmological importance, studying quasars can also clue us in to the physics of accretion, the growth of supermassive black holes, and the evolution of massive galaxies.
More details about the data:
The Gaia satellite, which began its mission in 2013, was designed to obtain precise positions, distances, and velocities for stars in the Milky Way. Fortuitously, Gaia also studiously documented its observations of objects that are far brighter and more distant than stars in our galaxy, like quasars. The initial 6.6-million-object sample of quasar candidates, however, was riddled with objects mistaken for quasars, and many of the distances to the objects — critical for cosmological studies — were wildly inaccurate. Storey-Fisher’s team incorporated data from other sources, like the Wide-field Infrared Survey Explorer and the Sloan Digital Sky Survey, to boost the purity of the sample and provide better distance estimates. You can explore the final sample for yourself at this link.
Citation
Kate Storey-Fisher et al 2024 ApJ 964 69. doi:10.3847/1538-4357/ad1328
The post Selections from 2024: Mapping Quasars Across the Universe appeared first on AAS Nova.
]]>
In September 2024, researchers predicted that the asteroid 2024 PT5 would soon join Earth as a short-lived "mini-moon." Today, we're giving a brief recap of how the prediction played out.
The post Selections from 2024: Earth Predicted to Gain (and Lose) a Mini-Moon appeared first on AAS Nova.
]]>Editor’s Note: For the remainder of 2024, we’ll be looking at a few selections that we haven’t yet discussed on AAS Nova from among the most-downloaded articles published in AAS journals this year. The usual posting schedule will resume January 3rd.
A Two-Month Mini-Moon: 2024 PT5 Captured by Earth from September to November
Published September 2024
Main takeaway:
Carlos de la Fuente Marcos and Raúl de la Fuente Marcos (Complutense University of Madrid) used N-body calculations to explore the orbit of the near-Earth object 2024 PT5. They found that 2024 PT5 would accompany Earth as a “mini-moon” from 29 September 2024 to 25 November 2024. Their predictions suggested that the object, which is thought to be about 33 feet (10 meters) wide, would linger for these two months at a distance several times larger than the distance between Earth and the Moon.
Why it’s interesting:
2024 PT5 would not be the first object to be classified as a mini-moon. Earth snags an asteroid from the swarm of near-Earth objects every 10 or 20 years; some of these objects complete one or more orbits around Earth (“temporarily captured orbiters”) while others fail to circle Earth even once (“temporarily captured flybys”). Eventually, the Sun’s persuasive gravitational pull steals these objects away from Earth. The asteroid 2006 RH120 spent almost exactly a year as a mini-moon in 2006–2007, and 2020 CD3 spent several years as Earth’s companion before departing in 2020. Some asteroids make repeated appearances, like 2022 NX1, which was last seen near Earth in 2022 and will return in 2051. So, while mini-moons are not uncommon, 2024 PT5 stands out as being one of the largest known objects in this class.
What researchers learned from 2024 PT5’s close approach:
As predicted, 2024 PT5 spent two months as a close companion to Earth, though NASA reported that the object was never fully captured by Earth’s gravity. While 2024 PT5 floated near Earth, researchers took the opportunity to study the object more closely. These observations suggested that the asteroid may have once been a part of the Moon — the actual Moon, not a miniature version — that was ejected when an object slammed into the Moon. Alternatively, the asteroid may be a fragment of a larger object that was disrupted. Though 2024 PT5 departed in late November, it’s not gone for long: its next close pass to Earth will take place in January 2025.
Citation
Carlos de la Fuente Marcos and Raúl de la Fuente Marcos 2024 Res. Notes AAS 8 224. doi:10.3847/2515-5172/ad781f
The post Selections from 2024: Earth Predicted to Gain (and Lose) a Mini-Moon appeared first on AAS Nova.
]]>
Though the North Star appears to be an unwavering single star, it's actually a variable star belonging to a triple star system. This year, researchers reported a new mass estimate for the North Star and discovered spots on its surface.
The post Selections from 2024: Weighing the North Star appeared first on AAS Nova.
]]>Editor’s Note: For the remainder of 2024, we’ll be looking at a few selections that we haven’t yet discussed on AAS Nova from among the most-downloaded articles published in AAS journals this year. The usual posting schedule will resume January 3rd.
The Orbit and Dynamical Mass of Polaris: Observations with the CHARA Array
Published August 2024
Main takeaway:
A research team led by Nancy Remage Evans (Smithsonian Astrophysical Observatory) used observations from the Center for High Angular Resolution Astronomy (CHARA) Array to deduce the mass of the North Star, Polaris. The team found the mass to be 5.13 ± 0.28 solar masses, which is about 50% more massive than previous estimates. The new data also show starspots on Polaris’s surface, which may explain some of the star’s properties.
Why it’s interesting:
Though a seemingly unwavering fixture in the northern night sky, Polaris is actually the nearest example of an important class of variable stars called Cepheids. The intrinsic luminosity of a Cepheid variable scales with the rate at which the star’s brightness varies. Thus, charting a Cepheid’s brightness over time provides a precise measure of the star’s luminosity. Comparing the intrinsic luminosity of the star to how bright the star appears then provides a way to measure the distance to the star. Cepheid variables are an important rung on the cosmic distance ladder, helping to measure the distances to far-off galaxies and even measure the rate of the universe’s expansion.
On amassing masses and spotting starspots:

Two reconstructions of Polaris’s surface, suggesting the presence of dark starspots. [Evans et al. 2024]
Citation
Nancy Remage Evans et al 2024 ApJ 971 190. doi:10.3847/1538-4357/ad5e7a
The post Selections from 2024: Weighing the North Star appeared first on AAS Nova.
]]>
As the solstice nears, we're taking a look at four recent articles that share new findings from our home star.
The post Monthly Roundup: Fun in the Sun appeared first on AAS Nova.
]]>For those of us in the Northern Hemisphere, the winter solstice is rapidly approaching — so today, let’s make up for the lack of sunshine by basking in the warmth of some solar physics research! This instance of the Monthly Roundup gives a quick overview of four recent research articles that share new findings from our home star.
Tracing Threads in a Solar Prominence
Prominences are massive arcs of cool, dense plasma that appear high above the solar surface along the edge of the Sun’s disk. (These same features, when seen on the Sun’s disk rather than silhouetted against space, are called filaments.) Occasionally, prominences erupt in massive explosions that eject solar plasma into the solar system. Other times, they gently dissipate after weeks or months.
The advent of high-resolution solar imaging has revealed new features in solar prominences, including threads that are 3,500–28,000 kilometers long and just 210 kilometers wide. These threads are thought to form when magnetic flux tubes become filled with cool and dense plasma. Recently, Yuxiang Song (Chinese Academy of Sciences; University of Science and Technology of China) and collaborators used the New Vacuum Solar Telescope to examine the behavior of 35 threads in a solar prominence.
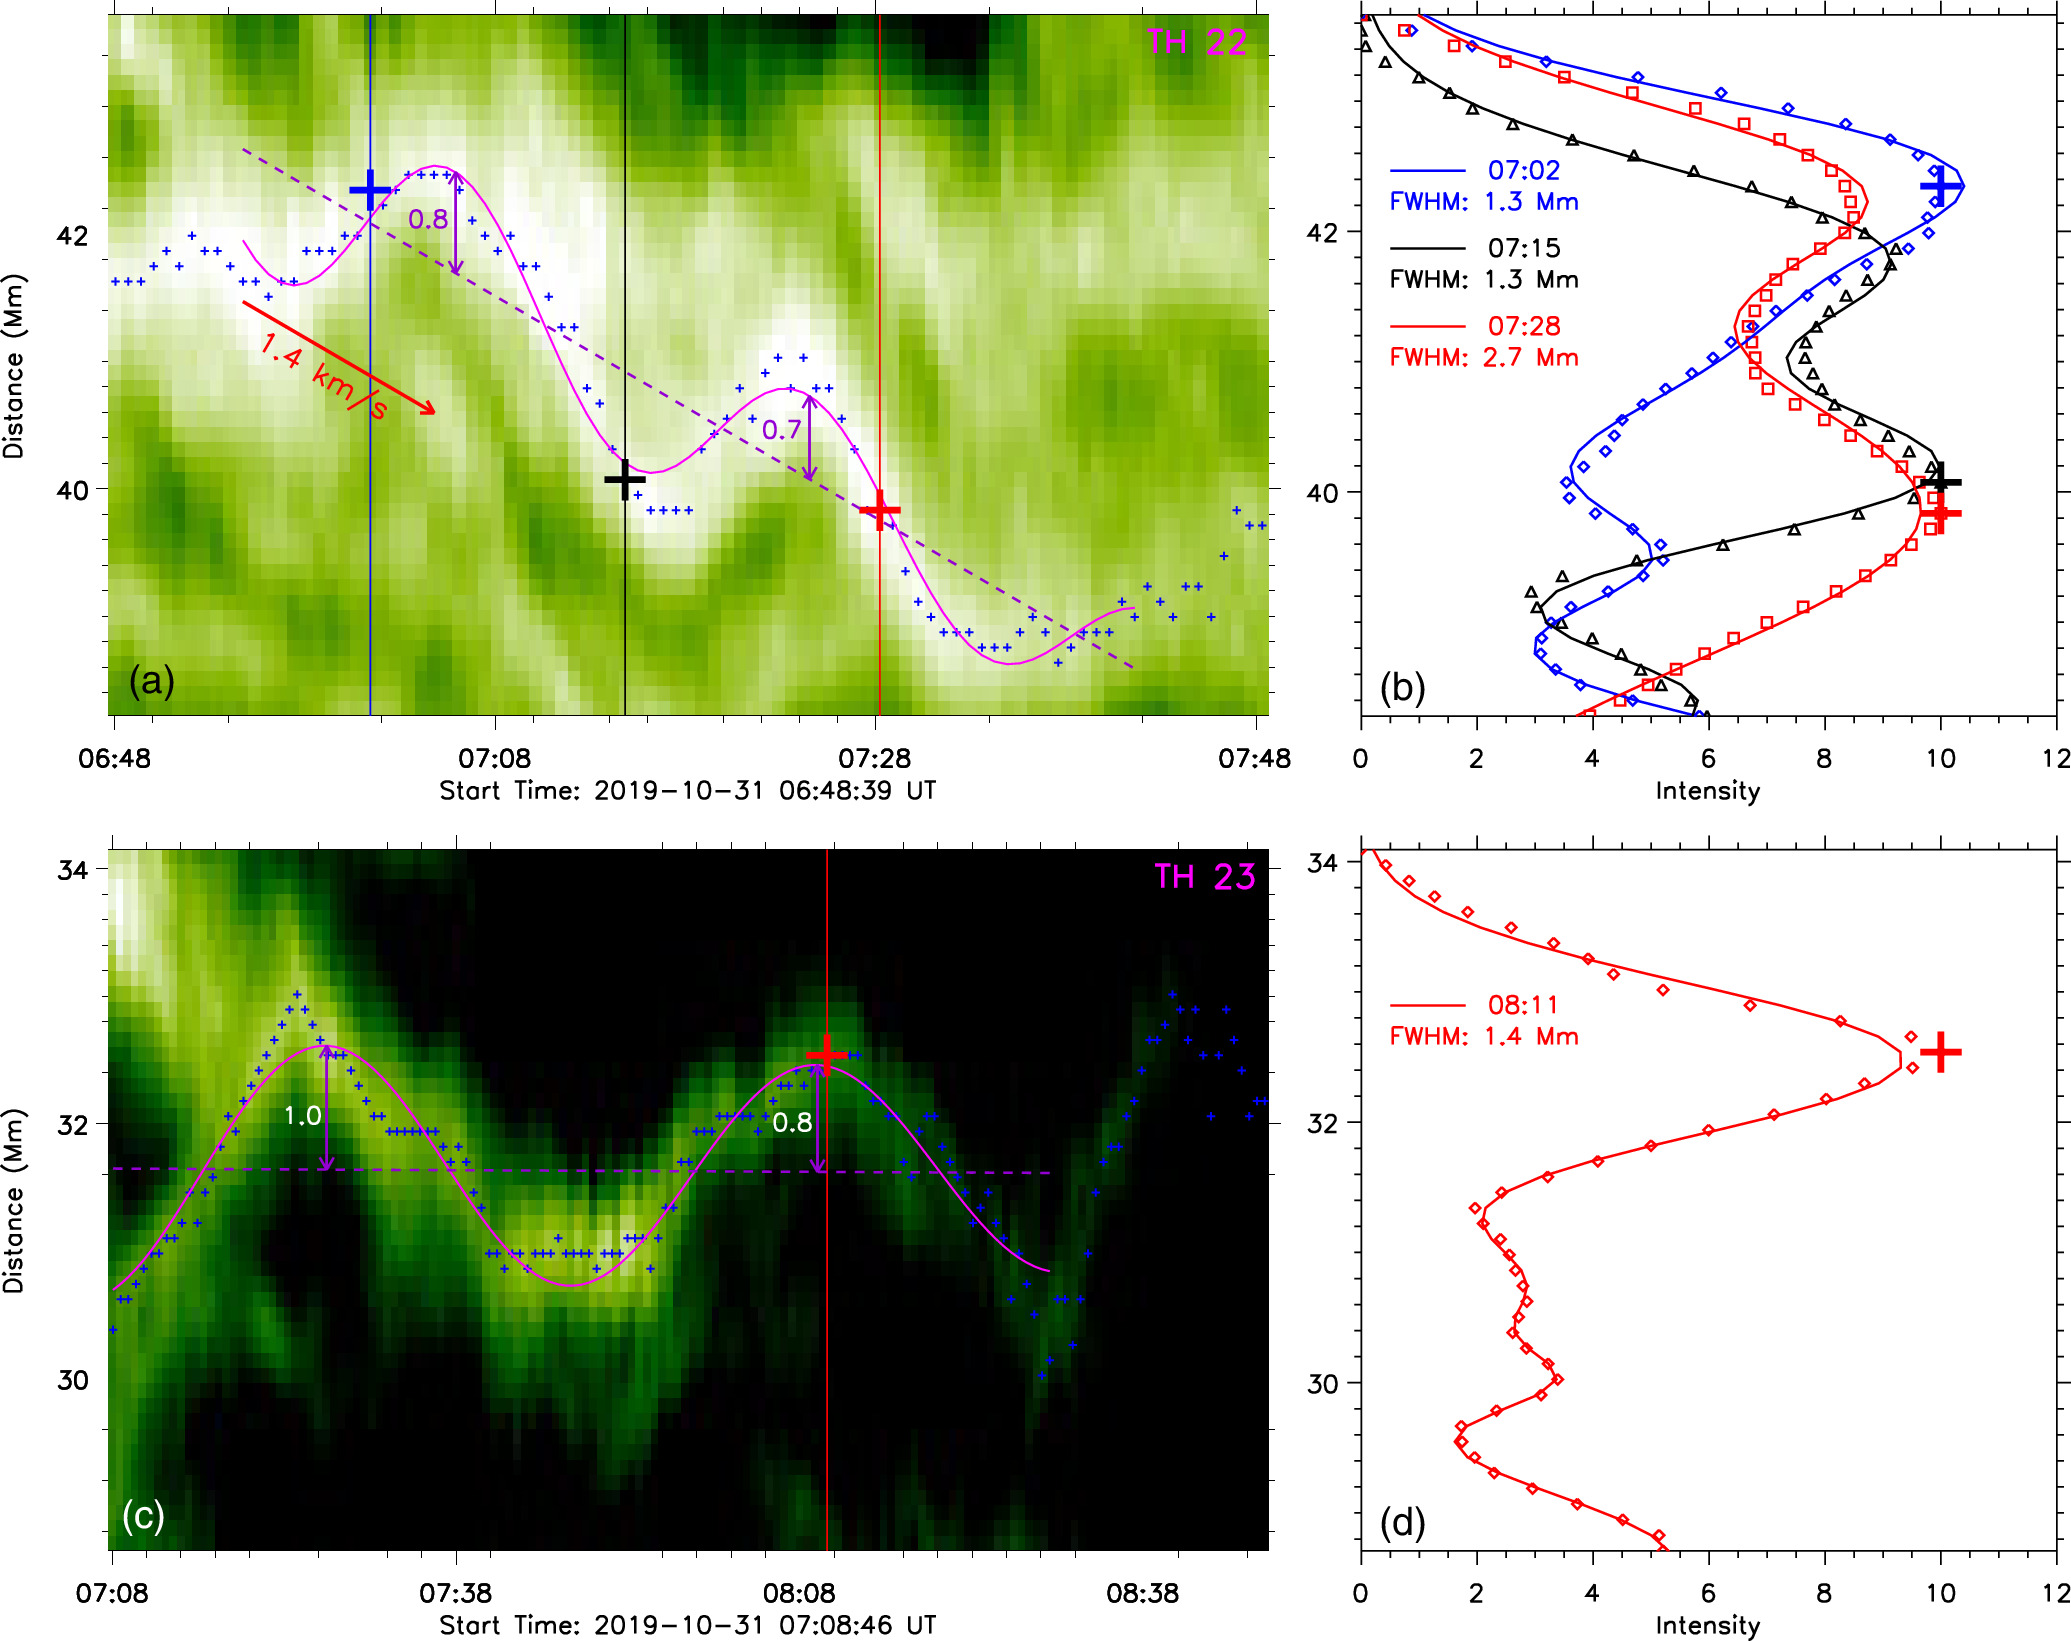
Example of a displacement oscillation (top row) and an intensity oscillation (bottom row) in a solar prominence thread. Click to enlarge. [Song et al. 2024]
What causes the displacement and intensity oscillations in the threads? The thread oscillations appear to originate with oscillations deeper in the Sun’s atmosphere, which propagate outward and excite waves in the solar magnetic field. The waves, in turn, generate the oscillations in the threads. However, the authors raised the possibility that the two types of oscillations examined in this work have different causes. Future work is needed to disentangle the question of solar threads.
Studying the Sun from the Moon
Gone are the days when astronomers could observe the Sun only from Earth’s surface. Now, a spacecraft fleet scrutinizes the Sun from almost every angle. Among the spacecraft with an eye on the Sun is Chang’E-2: a lunar orbiter that carries an instrument called the Solar X-ray Monitor
A team led by Man-Hei Ng and Chi-Long Tang (Macau University of Science and Technology and China National Space Administration) used data from the Solar X-ray Monitor to study conditions in solar flares emerging from two active regions on the Sun. Solar flares are brief, brilliant flashes of light that are powered by the rearrangement of solar magnetic fields. Ng and Tang’s team aimed to determine which elements and ions were present in these solar flares. These data give clues as to how matter and energy are transported from the lower, denser regions of the Sun’s atmosphere to the superheated solar corona and beyond.
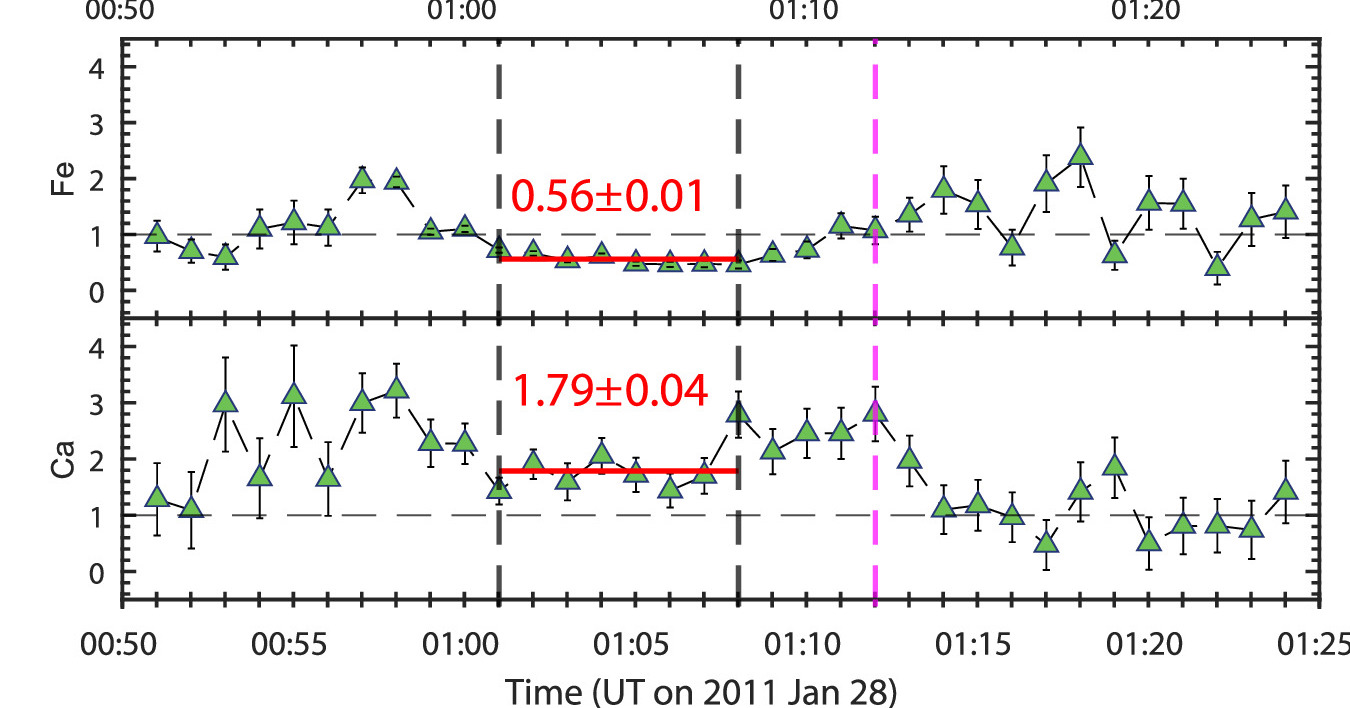
Examples of elements experiencing the inverse first ionization potential effect (iron; top) and the first ionization potential effect (calcium; bottom). The plots show the ratio of the measured elemental abundance with respect to the abundance of that element within the solar photosphere. Click to enlarge. [Adapted from Ng et al. 2024]
In this study, Ng and Tang’s team observed the inverse first ionization potential effect in iron for the first time, and they confirmed the existence of this effect for silicon. They also noted another curious effect for the first time: heavy elements like iron took longer to return to their pre-flare levels than lighter elements did, showing that inertia plays an important role. Intriguingly, one of the solar flares showed yet another rare effect: a post-flare change in the elemental abundances from values typical of the solar corona to those more similar to deeper layers of the Sun’s atmosphere, suggesting that this plasma was sourced from below, in the chromosphere or photosphere.
High-Resolution Imaging of a Solar Current Sheet
Many of the explosive events that take place in the Sun’s atmosphere owe their existence to magnetic reconnection: the process of rearranging magnetic fields in a way that releases pent-up magnetic energy, providing a way to accelerate particles to high speeds. Pankaj Kumar (American University; NASA Goddard Space Flight Center) and coauthors recently reported on high-resolution solar images that reveal this process in great detail.
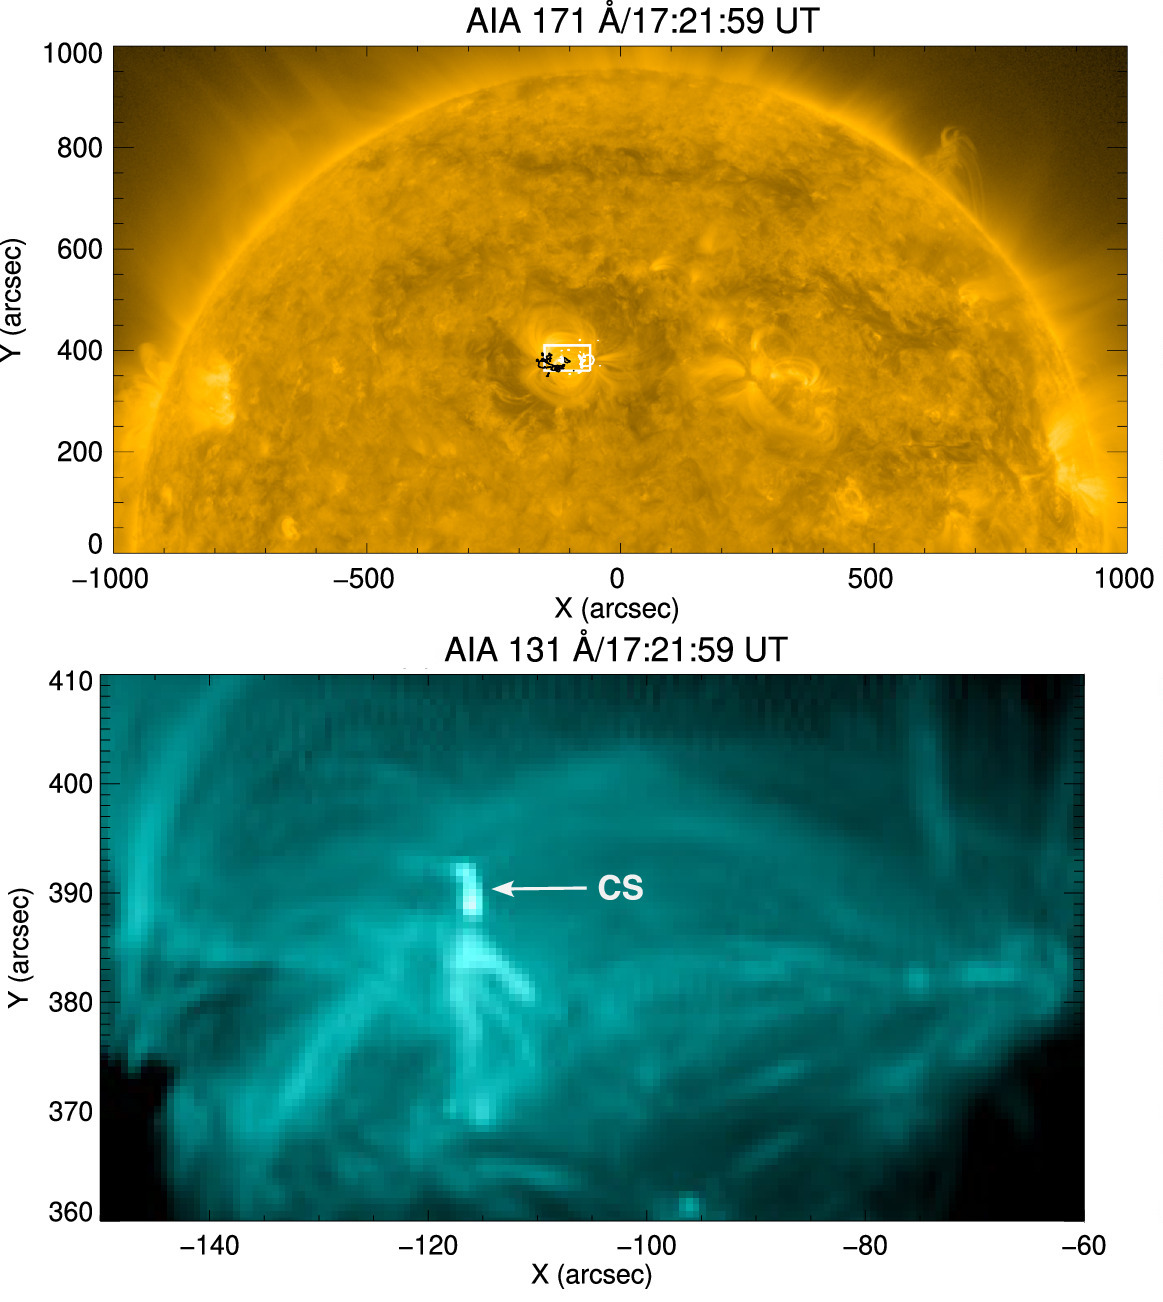
Top: A broad view of the Sun, including the active region studied in this work, indicated in white. Bottom: A zoomed-in view of the active region, showing the location of the current sheet (CS). [Adapted from Kumar et al. 2024]
Kumar’s team observed plasma flowing out from and in toward the current sheet at semi-regular intervals. These quasi-periodic flows provide evidence of particle acceleration via magnetic reconnection and show that reconnection helps to heat the active region plasma. Overall, the observations presented in this work provide evidence for the magnetic breakout model, a widely used model of solar eruptive events like flares and coronal mass ejections. The breakout model describes how magnetic field lines enclosing the dense plasma of a solar filament/prominence reconfigure and release the filament into space.
In addition to providing support for the breakout model, the new observations can serve as a jumping-off point for modeling and laboratory studies of magnetic reconnection. The results of this study even have implications for stars other than the Sun, helping to explain the quasi-periodic pulsations seen at X-ray wavelengths on other stars.
The Sun as a Particle Accelerator
Solar flares and coronal mass ejections — immense eruptions of solar plasma and magnetic fields — are the sites of particle acceleration and X-ray production. Understanding how much of the energy produced in the events goes toward accelerating electrons to breakneck speeds is critical to understanding the Sun’s role as a particle accelerator.

A 17.1-nanometer image of the Sun from the Solar Dynamics Observatory. The annotations indicate the locations of the acceleration region, the hard (i.e., high-energy) X-ray sources, and the radio emission at various frequencies. Click to enlarge. [Adapted from James & Reid 2024]
Using multi-wavelength observations of the flare, coronal mass ejection, and solar radio burst, James and Reid estimated the speeds of the electron beams they observed escaping from the acceleration site. This analysis showed extremely high speeds for electrons in the beams, ranging from 44% to 59% of the speed of light. The team then used simulations to learn about the properties of the region in which these beams were accelerated, finding that the acceleration occurred in a region that stretched some 15,000–100,000 kilometers in the direction tangent to the Sun’s surface, but just 1,000 kilometers vertically.
This work marks the first time researchers have estimated the properties of escaping electron beams from remote-sensing observations. A comparison of the results from remote-sensing data and those from the Solar Orbiter spacecraft, which ventures close to the Sun every 6 months, will provide further insight into the particle-accelerating abilities of our home star.
Citation
“Thread Displacement and Intensity Oscillations in a Quiescent Prominence,” Yuxiang Song et al 2024 ApJ 975 280. doi:10.3847/1538-4357/ad813c
“Unveiling Mass Transfer in Solar Flares: Insights from Elemental Abundance Evolutions Observed by Chang’E-2 Solar X-Ray Monitor,” Man-Hei Ng et al 2024 ApJ 972 123. doi:10.3847/1538-4357/ad5da3
“Direct Imaging of a Prolonged Plasma/Current Sheet and Quasiperiodic Magnetic Reconnection on the Sun,” Pankaj Kumar et al 2024 ApJ 973 74. doi:10.3847/1538-4357/ad63a2
“Estimating the Total Energy Content in Escaping Accelerated Solar Electron Beams,” Alexander W. James and Hamish A. S. Reid 2024 ApJ 976 128. doi:10.3847/1538-4357/ad7b38
The post Monthly Roundup: Fun in the Sun appeared first on AAS Nova.
]]>
What's the origin of the dusty crescents in the disk around the young star MWC 758? Researchers have tracked the movements of two crescents to find out.
The post Dusty Crescents Around a Baby Star appeared first on AAS Nova.
]]>Did vortices sculpt the crescent-shaped clumps of dust around the young star MWC 758? Using data from the Atacama Large Millimeter/submillimeter Array (ALMA), researchers have mapped the motions of the dust clumps and weighed in on the vortex hypothesis.
Complicated Disks

Spiral arms in the disk of MWC 758, as seen by the Very Large Telescope. [NASA, ESA, and Z. Levay (STScI); Acknowlegment: NASA, ESA, ESO, M. Benisty et al. (University of Grenoble), R. Dong (Lawrence Berkeley National Laboratory), and Z. Zhu (Princeton University)]
Among the intriguing features seen in protoplanetary disks are crescents: asymmetric regions where the density of dust is enhanced. These regions are readily visible in observations by ALMA and have been found in several protoplanetary disks.
Researchers suspect that crescents are caused by swirling regions called vortices. Like debris caught in an eddy in a stream, dust could theoretically become trapped in a vortex, forming the clumps seen in images — and potentially creating a perfect dusty ecosystem for planets to form.
The Causes of Crescents
Recently, a team led by I-Hsuan Genevieve Kuo (Academia Sinica Institute of Astronomy and Astrophysics, Taiwan; University of Arizona) investigated the causes of crescents in the protoplanetary disk around the star MWC 758, also called HD 36112. MWC 758 is a 1.5–2-solar-mass star that is about 3.5 million years old and less than 500 light-years away. Its disk sports several intriguing features, including two crescents and a spiral. Previous research has attributed these features to the presence of one or more planets.

Images of the MWC 758 disk taken at a wavelength of 1.3 mm in 2017 (left) and 2021 (right). Click to enlarge. [Kuo et al. 2024]
Spiral vs. Vortex

Observed azimuthal (i.e., around the disk) velocity of the dust clumps (green and dark blue triangles) and expected velocity for Keplerian rotation (aqua circles). Click to enlarge. [Kuo et al. 2024]
Instead, the non-Keplerian rotation of the dust clumps might be caused by the interaction of vortices and spirals. In this case, the vortices themselves, which are invisible to us, are moving in the way predicted by theory, but the spiral knocks the (visible) dust off course.
Luckily, this prediction is testable. If vortices and spirals are vying for control of the dust crescents in MWC 758’s disk, their power struggle would be less effective on large dust grains than on small dust grains. In other words, large dust grains should adhere more closely to the expected Keplerian velocity than small dust grains do. Future high-resolution observations at different wavelengths, which probe grains of different sizes, may provide an answer.
Citation
“ALMA Observations of Proper Motions of the Dust Clumps in the Protoplanetary Disk MWC 758,” I-Hsuan Genevieve Kuo et al 2024 ApJL 975 L33. doi:10.3847/2041-8213/ad86c1
The post Dusty Crescents Around a Baby Star appeared first on AAS Nova.
]]>
Astrobites reports on two research articles that find evidence for one of the most well-studied stars in the night sky having a binary companion.
The post Hiding in Plain Sight: Betelgeuse’s Binary Buddy appeared first on AAS Nova.
]]>Editor’s Note: Astrobites is a graduate-student-run organization that digests astrophysical literature for undergraduate students. As part of the partnership between the AAS and astrobites, we occasionally repost astrobites content here at AAS Nova. We hope you enjoy this post from astrobites; the original can be viewed at astrobites.org.

Figure 1: A schematic of the Orion constellation, with a small pink arrow indicating the location of Betelgeuse in Orion’s left shoulder. Click to enlarge. [Wikipedia]

Red supergiants like Betelgeuse are known to experience radial pulsations: repeated expansion and contraction of the star’s outer layers that cause periodic fluctuations in brightness. Like standing waves on a string, these pulsations include both fundamental and higher-order modes, with the fundamental mode dictating the longest possible pulsation period. For Betelgeuse, astronomers have measured a fundamental-mode period of about 420 days. However, they have also observed a long secondary period of 2,100 days, the origin of which is a mystery. Or is it?
Today’s bite covers two articles that independently reach the same conclusion: Betelgeuse’s long secondary period is caused by the presence of a low-mass binary companion! Such a small star would be drowned out by Betelgeuse’s intrinsic brightness and variability, explaining why we haven’t detected it before. But as today’s articles show, careful analysis of radial velocity and astrometry data can tease out signatures of Betelgeuse’s hidden buddy.
Article 1: One Long-Secondary-Period Mechanism to Rule Them All
Title: A Buddy for Betelgeuse: Binarity as the Origin of the Long Secondary Period in α Orionis
Authors: Jared A. Goldberg, Meridith Joyce, and László Molnár
First Author’s Institution: Flatiron Institute
Status: Published in ApJ
In Article 1, the authors use light curves from the American Association of Variable Star Observers (AAVSO) and radial velocities from STELLA to test the plausibility of eight different explanations for Betelgeuse’s long secondary period. Light curves are a record of how a star’s brightness (or magnitude) changes over time, and radial velocities record how quickly a star is moving towards or away from us. For Betelgeuse, both datasets show the ~2,100-day long secondary period. The authors measure a phase offset between the datasets of about −2 radians, meaning that the radial velocity curve lags behind the light curve by about half an orbit. With these data in hand, they are able to rule out all proposed long-secondary-period mechanisms that don’t involve a binary companion. For example:
- Is the long secondary period really the fundamental mode? No! If this were the case, Betelgeuse would need to have a much larger radius than what we’ve measured. The ~420-day fundamental mode aligns much more closely with our observations.
- Is the long secondary period caused by the motion of convective cells on Betelgeuse’s surface? No! Convection would introduce random variability that we don’t observe. Plus, we expect convective motions on the surfaces of all luminous giant stars, but we know that not all of these stars show long secondary periods like Betelgeuse does.
- Is the long secondary period caused by starspots coming in and out of view? No! Betelgeuse’s long-secondary-period variations are stronger at bluer wavelengths than redder wavelengths, which starspots can’t replicate. We’d also expect Betelgeuse’s magnetic activity cycle to have a longer period than the long secondary period.
The authors conclude the long secondary period is most likely caused by binarity. However, a small companion passing in front of Betelgeuse would not cause noticeable dimming compared to the variability from pulsations. Since red supergiants like Betelgeuse have dusty circumstellar environments, previous work suggested that a hypothetical companion could drag a cloud of dust along with it to produce more significant dimming. This theory would also explain why long-secondary-period variations are stronger at bluer wavelengths, where dust scatters more light than at redder wavelengths.
There’s just one problem: the measured phase offset of −2 radians suggests that the companion would be in front of Betelgeuse when the system reaches maximum brightness, not behind it as the above theory suggests. To address this, the authors propose that rather than dragging dust along, the companion somehow destroys or modifies dust to cause an increase in Betelgeuse’s brightness as it passes in front of the larger star (see Figure 2). However, they note that future work is necessary to determine exactly how this could occur.

Figure 2: A sketch showing how Betelgeuse’s light curve variability (top graph) and radial velocity variability (bottom graph) can be explained by the presence of a binary companion. The light curve is noticeably out of phase with the radial velocity curve, as found in both articles. The middle row of drawings shows what an observer on Earth would see at each of the four points labeled on the two graphs. Betelgeuse is shown as a red circle, its hypothetical companion is shown as a black circle, and its circumstellar dust is shown as curly orange and red lines. Note that at maximum brightness (Point C), the companion is in front of Betelgeuse instead of behind it. [Goldberg et al. 2024]
Article 2: Finding Binarity in a Century’s Worth of Data
Title: Radial Velocity and Astrometric Evidence for a Close Companion to Betelgeuse
Authors: Morgan MacLeod et al.
First Author’s Institution: Center for Astrophysics | Harvard & Smithsonian; Institute for Theory and Computation
Status: Published in ApJ
In Article 2, the authors leverage more than 100 years of radial velocity data — including the radial velocities from Article 1 and several other, independent datasets — to search for a binary companion to Betelgeuse. First, they construct a model including the unseen companion, a flexible Gaussian process kernel to represent variability from other sources, and a noise term. Then, they fit their radial velocities with this model to retrieve the period, phase, and amplitude of the long-secondary-period signal (see Figure 3).

Figure 3: Results of fitting a model (blue lines) to 100 years of radial velocity data (black points). The top panel shows the full model, including the flexible kernel used to fit all variability sources other than the long secondary period (labeled “GP” here for “Gaussian process”). The middle panel shows just the sinusoidal component of the fit that represents the long secondary period, which remains a good fit over the whole baseline. The bottom panel shows the residuals after the full model (from the top panel) is subtracted from the data. [MacLeod et al., in press]
Using their fitted parameters, the authors derive a mass of 0.60 ± 0.17 M☉ and an orbital separation of 1,818 ± 6 R☉ for Betelgeuse’s hidden companion. This mass is significantly smaller than the estimate from Article 1, which the authors attribute to differences in the fitted long-secondary-period amplitudes between the articles. Betelgeuse’s radial velocity curve includes multiple sources of variability from radial pulsations, the signature from the binary companion, and other random changes. As a result, the true amplitude of the long-secondary-period variations is highly uncertain, even when the period is well constrained.
In addition to radial velocities, the authors also investigate Betelgeuse’s long secondary period with astrometry. Astrometric data record the relative positions and motions of the stars, which are expected to follow predictable patterns. An unseen binary companion will introduce an extra “wobble” in this pattern by tugging the visible star back and forth as it moves through space. These wobbles can be modeled to determine the orbital parameters of the binary, which should agree with the parameters derived from radial velocity data.
The authors fit a model to their astrometry and find two prominent periods: 1) the long secondary period at ~2,100 days and 2) an unexpected periodicity at ~1,650 days (about four times the fundamental mode). They also find a variability amplitude that is higher than their fitted radial velocity amplitude, implying a companion mass of 2.1 ± 0.5 M☉. However, their data are fit equally well by a binary model or a single-star model that includes a significant noise term. This is likely due to the fact that Betelgeuse’s radial extent is larger than its expected astrometric wobble, making precise astrometric measurements difficult. The authors conclude that additional observations are needed to constrain the binarity of Betelgeuse with astrometry, noting that their radial velocity results are more trustworthy given the longer baseline, higher cadence, and higher precision of the radial velocity data.
Using their measured parameters of the Betelgeuse system, the authors calculate the evolution of the hypothetical binary due to tides. Just like the Moon’s gravitational pull creates tides on Earth, the stars in a binary system pull on each other as well, dissipating angular momentum from the system and moving closer together in a process called “orbital decay.” In the case of Betelgeuse, the authors find that tides will cause runaway orbital decay over the next 10,000 years, where the system will be unable to stabilize as the orbital separation shrinks. This means Betelgeuse will interact with and eventually swallow its tiny companion!
Staying Hidden… for Now
Despite using different datasets and fitting methods, both of today’s articles find evidence that the ~2,100-day long secondary period in Betelgeuse’s light curve is likely due to the presence of a previously undetected, low-mass binary companion. Direct detection of such a companion is nearly impossible with current instruments, but further study of the dust around Betelgeuse could help constrain the companion’s properties. If confirmed, Betelgeuse’s binarity would have significant implications for both its evolution and for other evolved stars with long secondary periods, which may also host hidden binary buddies!
Original astrobite edited by Lindsey Gordon.
About the author, Alexandra Masegian:
Alexandra is a second-year PhD student in astronomy at Columbia University and the American Museum of Natural History. She is broadly interested in stellar astrophysics, especially evolved stars and binaries. Outside of work, she enjoys cooking, reading and writing science fiction, and visiting national parks.
The post Hiding in Plain Sight: Betelgeuse’s Binary Buddy appeared first on AAS Nova.
]]>
An investigation of the Milky Way's youngest super star cluster tests whether the winds of massive stars could be a source of cosmic rays.
The post Featured Image: Gamma Rays from Massive Stars appeared first on AAS Nova.
]]>This image shows the star-forming region RCW 38, which is located 5,500 light-years from Earth. At less than a million years old — and possibly as young as 100,000 years — RCW 38 is the youngest super star cluster in the Milky Way. In the image above, infrared light from the Spitzer Space Telescope is shown in red, X-rays from the Chandra X-ray Observatory are in green, and gamma rays from the Fermi Gamma-ray Space Telescope are in blue. Paarmita Pandey (The Ohio State University) and coauthors recently observed this cluster in order to test the hypothesis that the outflowing winds of massive stars are a source of cosmic rays: charged particles traveling near the speed of light. Cosmic rays might be generated when winds from several stars crash into one another or into the gas of the interstellar medium. Pandey’s team hoped to find evidence for this process in the form of gamma rays, which are produced when cosmic rays collide with other particles. Using data from Fermi, the team found clear evidence of gamma rays coming from the region, adding to the small but growing number of young star clusters that are known to be associated with gamma-ray production. To learn more about this work, be sure to check out the full study linked below.
Citation
“Constraining the Diffusion Coefficient and Cosmic-Ray Acceleration Efficiency Using Gamma-Ray Emission from the Star-Forming Region RCW 38,” Paarmita Pandey et al 2024 ApJ 976 98. doi:10.3847/1538-4357/ad83bc
The post Featured Image: Gamma Rays from Massive Stars appeared first on AAS Nova.
]]>
Bombarded by powerful radiation or visited by comets carrying life's ingredients, the Sun's migration through the Milky Way likely contributed to the solar system's ability to harbor life.
The post Mapping the Sun’s Migration: How Galactic Environments Impact Habitability appeared first on AAS Nova.
]]>Are there places in the galaxy that are better suited for habitability? A new study suggests that the Sun’s trek through the Milky Way may contribute additional complexity to the search for life in the galaxy.
Galactic Habitable Zones

Illustration of a star system’s habitable zone. Too close to the star, shown in red, the planet will be too hot to support life, and farther away, the planet is too cold. The zone in the middle, shown in green, is the distance from the star that is just the right temperature for a planet to host liquid water, a crucial ingredient of life. Click to enlarge. [NASA]
In crowded areas and active star-forming regions, energetic events like supernovae can subject their neighboring star systems to harmful radiation. In the galaxy’s outskirts, there has not been enough chemical enrichment to provide the materials necessary for life. This implies that our solar system resides in a galactic habitable zone, and this region may host other life-harboring systems.
But in the search for habitable planetary systems, it is not sufficient to only consider a star’s current position in the galaxy. As evidenced by its chemical makeup, the Sun likely formed closer to the galactic center and migrated outwards to its current orbital radius, experiencing a wide variety of conditions as it moved through the galaxy. While the Sun’s current orbit is suitable for life, could its migration history have influenced the solar system’s habitability?

Simulation results showing how different models of galactic central bars and spiral arms transport stars over time. The top panel shows that for a steady model, stars are not significantly transported away from their birth location. The bottom panel shows that for models with dynamic changes in both the central bar and the spiral arms, this causes sufficient migration to explain the Sun’s migration pathway from an inner radius to its current location. Click to enlarge. [Baba et al 2024]
Migration Through the Milky Way
To understand the drivers and conditions of the Sun’s migration, Junichi Baba (Kagoshima University; National Astronomical Observatory of Japan) and collaborators perform simulations of various models of the galaxy. The authors find that dynamic changes in the Milky Way’s central bar and its spiral arms are sufficient to transport the Sun from its origin to its current position in the galaxy.
Though the Milky Way’s bar and arms drive the Sun’s migration through the galaxy, the specific path the Sun takes depends on whether or not it becomes trapped in corotation resonance with the central bar — orbiting the galactic center at the same speed as the bar’s rotation. The authors test a trapped and untrapped migration path and find that these scenarios produce significantly different migration pathways. In the trapped scenario, the Sun’s orbital radius oscillates more drastically, while in the untrapped case the Sun more gradually shifts to its current position. These pathways subsequently expose the solar system to different environments within the galaxy.
Sustaining Life

Histories of environmental changes surrounding the Sun along its potential orbits. The orange line shows the path of a trapped orbit, where the Sun experiences more dramatic environmental changes than an untrapped orbit (shown in green). Click to enlarge. [Baba et al 2024]
This study highlights the importance of considering how star systems have migrated through the galaxy over their histories. Their current galactic environment is not the only influence on their ability to harbor life. Thus, as the search for life continues in exoplanet systems, tracing the orbital paths these systems have trudged is crucial for understanding their habitability.
Citation
“Solar System Migration Points to a Renewed Concept: Galactic Habitable Orbits,” Junichi Baba et al 2024 ApJL 976 L29. doi:10.3847/2041-8213/ad9260
The post Mapping the Sun’s Migration: How Galactic Environments Impact Habitability appeared first on AAS Nova.
]]>
Is the high-energy radiation of a solar flare only rarely accompanied by a flash at visible wavelengths, or are visible-light flares more common than expected?
The post Finding Missing Flares appeared first on AAS Nova.
]]>Solar flares are one of the most common solar phenomena, but there’s still much to learn about them. Until now, researchers suspected that the high-energy radiation of a solar flare is only occasionally accompanied by a flare at visible wavelengths, but new work suggests that white-light flares aren’t so uncommon after all.
Classes of Solar Flares

Why study the causes of solar flares? Flares are just one example of how the Sun’s complex magnetic field interacts with its dynamic plasma environment. [NASA/GSFC/Solar Dynamics Observatory]
In addition to strong X-ray and ultraviolet emission, some flares also brighten across the visible portion of the spectrum. These white-light flares make up just a small fraction of all solar flares, though they appear to be more common on other stars. (The flare associated with the 1859 Carrington event — arguably the most famous solar flare — was the first white-light flare to be recorded.) To understand the origins of white-light flares, it’s critical to determine whether these events are truly as scarce as they seem.

An example of the spatial and temporal distribution of white light during a solar flare. This particular flare is class X9.3, making it a very powerful flare. Click to enlarge. [Adapted from Cai et al. 2024]
New Search Methods
Recently, Yingjie Cai (Chinese Academy of Sciences; University of Chinese Academy of Sciences) and collaborators demonstrated a new way to find white-light solar flares. First, the team considered where current search methods might be failing. Typically, white-light flares are identified by searching for differences between optical images of the Sun taken at different times. The team’s new method, which was developed by analyzing the properties of previously discovered white-light flares, improves upon the existing method in two key ways: 1) searching for spatial and temporal clusters of brightening at visible wavelengths, which are characteristic of white-light flares, and 2) searching for increased emission relative to the local background level of emission, rather than an arbitrary threshold brightness. This second tactic may enable the discovery of faint white-light flares, which seem to be especially rare.
Cai and coauthors applied their method to a sample of 90 solar flares evenly split between C, M, and X-class flares. Ultimately, they found that 9 of 30 C-class flares, 18 of 30 M-class flares, and 28 of 30 X-class flares could be classified as white-light flares. For a given flare energy class, white-light flares are more common among confined flares — those that are not accompanied by an explosion of plasma into space — than eruptive flares. The team also found that the duration of a white-light flare is related to its energy, with less energetic flares being more fleeting than more energetic flares.
Promising Proportions

Proportion of flares that are white-light flares (WLF) versus non-white-light flares (NWLF) as a function of flare energy class and whether the flare is eruptive or confined. Click to enlarge. [Adapted from Cai et al. 2024]
Looking forward, the authors plan to refine their identification model, helping to amass a sample of white-light flares that can be used for statistical studies and comparisons with flares on other stars. This should also help to disambiguate the origins of white-light flares; its not yet clear what powers the visible-light emission of a solar flare, nor is it clear if the visible-light emission always arises from the same source.
Citation
“Statistics of Solar White-Light Flares. I. Optimization and Application of Identification Methods,” Yingjie Cai et al 2024 ApJ 975 69. doi:10.3847/1538-4357/ad793b
The post Finding Missing Flares appeared first on AAS Nova.
]]>
Astrobites reports on three neutron-star bow shocks photographed in unprecedented detail, revealing new insights into the hidden physics behind these cosmic collisions.
The post Exploring the Slower Side of Neutron-Star Bow Shocks appeared first on AAS Nova.
]]>Editor’s Note: Astrobites is a graduate-student-run organization that digests astrophysical literature for undergraduate students. As part of the partnership between the AAS and astrobites, we occasionally repost astrobites content here at AAS Nova. We hope you enjoy this post from astrobites; the original can be viewed at astrobites.org.
Title: Probing the Low-Velocity Regime of Nonradiative Shocks with Neutron Star Bow Shocks
Authors: Stella Koch Ocker and Maren Cosens
First Author’s Institution: California Institute of Technology and Observatories of the Carnegie Institution for Science
Status: Published in ApJL
Neutron stars are fascinating remnants of massive stars that have undergone a supernova explosion. These stellar remnants often move at incredible speeds through space, producing bow shocks, the regions where the fast-moving neutron star collides with interstellar gas. Imagine a cosmic wind so powerful that it creates a shock wave in space, much like a speedboat cutting through water. These powerful shock waves hold clues to study non-radiative shocks, which play an important role in heating plasma and accelerating particles, such as cosmic rays. Today’s article took a closer look at the properties of three neutron-star bow shocks in unprecedented detail, revealing new insights into the hidden physics behind these cosmic collisions.
What Are Bow Shocks?

Figure 1: Image of the LL Orionis bow shock taken with the Hubble Space Telescope. [NASA and The Hubble Heritage Team (STScI/AURA); Acknowledgment: C. R. O’Dell (Vanderbilt University)]
In the context of neutron stars, the bow shock is non-radiative, meaning it does not emit much in the form of light or heat. However, the shock does produce a particular type of emission called Hα (hydrogen alpha), which occurs when neutral hydrogen atoms in the interstellar medium are excited and emit light at a specific wavelength in the optical wavelength range. Observing this Hα emission is one of the main ways astronomers can study neutron-star bow shocks.
Understanding the Shock’s Velocity and Structure
Today’s authors focused on three known neutron-star bow shocks (see Figure 2): J0742−2822, J1741−2054, and J2225+6535 (also known as the “Guitar Nebula”). Using integral field spectroscopy, a technique that captures both the spatial and spectral information of an object, they were able to observe these bow shocks in detail. For their observations, they used the Keck Cosmic Web Imager (KCWI) on the Keck II Telescope in Hawaii. Unlike traditional spectroscopy, which provides a one-dimensional spectrum of light from a single region, integral field spectroscopy collects spectra across a two-dimensional field, allowing the astronomers to map the shock properties. This allows astronomers to study the shock shape, velocity structure, and Hα emission intensity in exquisite detail, giving a more complete picture of how these shocks behave.

Figure 2: KCWI data of the three neutron-star bow shocks, showing the morphologies of each bow shock at different velocity slices. [Ocker & Cosens 2024]
The study revealed that the Ib/In values for all three neutron-star bow shocks indicated low shock velocities, all below 200 kilometers per second. This is notably different from the much higher velocities seen in supernova remnants, where shocks can exceed 1,000 kilometers per second. These results suggest that neutron-star bow shocks operate in a distinct low-velocity regime, and current models, which are designed for higher-velocity shocks, may not fully capture the behavior of these slower shocks. To better understand the temperature ratios between electrons and ions, as well as how particles are accelerated in this regime, new models are needed.
Why Is the Low-Velocity Regime Important?
Understanding the low-velocity regime of non-radiative shocks is important for several reasons:
- Cosmic-Ray Acceleration: Non-radiative shocks are believed to accelerate particles to very high speeds, contributing to the population of cosmic rays — high-energy charged particles that travel through space. Studying how these shocks operate at different velocities helps scientists understand how cosmic rays are produced and what role neutron stars might play in this process.
- Energy Transfer in Shocks: Non-radiative shocks are also key to understanding how energy is transferred between different types of particles, such as electrons and protons. In faster shocks, the temperature of electrons and protons can differ significantly, but in slower shocks, like those studied here, the temperatures might be more equal. Understanding this balance provides insight into the physics of shock waves and how they heat and accelerate particles.
- Astrophysical Modeling: Most models of non-radiative shocks are based on high-velocity shocks in supernova remnants. However, the findings from this study suggest that these models need to be expanded to include slower shocks, which behave differently and require new theoretical approaches.
This study provides critical new insights into the enigmatic nature of neutron-star bow shocks, particularly in the unexplored low-velocity regime. By probing these slow shocks, we unlock a deeper understanding of how astrophysical plasmas are heated and how particles are accelerated to cosmic-ray speeds — shedding light on some of the most powerful processes in the universe. The findings challenge existing models of non-radiative shocks, emphasizing the need for new theory to capture the unique behavior of these slower shocks. As a result, this research not only reshapes our understanding of cosmic rays but also paves the way for exciting new directions in astrophysics, with potential breakthroughs on the horizon.
Original astrobite edited by Megan Masterson.
About the author, Janette Suherli:
Janette is a PhD student at University of Manitoba in Winnipeg, Canada. Her research focuses on the utilization of integral field spectroscopy for the studies of supernova remnants and their compact objects in the optical. She is also the current chair of Graduate Student Committee for the Canadian Astronomical Society (CASCA). She grew up in Indonesia where it is summer all year round! Before pursuing her PhD in astrophysics, Janette worked as a data analyst for a big Indonesian tech company, combating credit card fraud.
The post Exploring the Slower Side of Neutron-Star Bow Shocks appeared first on AAS Nova.
]]>
What has poked holes in the filamentary green structure in front of Cassiopeia A? A new research article offers answers.
The post New Details Revealed in the “Green Monster” appeared first on AAS Nova.
]]>JWST images of the supernova remnant Cassiopeia A (Cas A) revealed for the first time a perforated, filamentary structure named the “Green Monster” for its resemblance to the home-run-thwarting wall at Fenway Park. Recently, researchers reported on this feature and the cause of its curious spots.
Studying a Star’s Life from Its Remains

This perspective on Cas A comes from the Hubble Space Telescope. Each of the tiny blobs of gas near the top of the shell is tens of times wider than the solar system. [NASA and The Hubble Heritage Team (STScI/AURA); Acknowledgment: R. Fesen (Dartmouth) and J. Morse (Univ. of Colorado)]
Among the most famous and well-studied remnants of a core-collapse supernova is Cas A, which has posed for countless astronomical portraits since its discovery in 1948. Recently, JWST data revealed a never-before-seen feature stretching across Cas A. Because of its green appearance in representative-color images from JWST, this feature was dubbed the Green Monster.
How the Green Monster Got Its Spots
In a recent article, Ilse De Looze (Ghent University) and collaborators focused on one particularly intriguing aspect of the Green Monster: multiple complete and partial circles that appear to be torn in the fabric of the structure. The team measured more than two dozen of these circles, each with diameters of about 1–3 arcseconds. If the Sun were placed at the center of one of these circles, the boundary of the circle would lie close to the inner edge of the Oort Cloud.

A closeup of the Green Monster, showing the small holes investigated in this study. The orange arrows indicate the location of an ejecta filament that might be associated with the hole labeled “P2.” Click to enlarge. [De Looze et al. 2024]
In the scenario deemed most likely, the Green Monster is made up of circumstellar material that was lost before the star exploded as a supernova. This material now sits in front of the supernova remnant, from our perspective, and was impacted by a shock wave. The holes are created where ejected material has poked through the Green Monster.
What’s not yet clear is the timeline: did the collision between the outward-moving ejecta and the Green Monster happen before or after the Green Monster was struck by the shock wave? As De Looze’s team showed, either order is possible, and more data and simulations are needed to explore the sequence of events and the timescales involved.
Mapping Mass Loss

Locations of quasi-stationary flocculi, outlined in cyan, relative to the position of the Green Monster. Click to enlarge. [Adapted from De Looze et al. 2024]
JWST has already given astronomers an entirely new view of Cas A, but there are surely more discoveries yet to come: future observations will sample the spectra of multiple regions of the Green Monster and several quasi-stationary flocculi, helping to reconstruct the final years of Cas A’s progenitor star’s life.
Citation
“The Green Monster Hiding in Front of Cas A: JWST Reveals a Dense and Dusty Circumstellar Structure Pockmarked by Ejecta Interactions,” Ilse De Looze et al 2024 ApJL 976 L4. doi:10.3847/2041-8213/ad855d
The post New Details Revealed in the “Green Monster” appeared first on AAS Nova.
]]>
Gravitational waves from collapsars, mass-gap black holes, and local supermassive black holes are the subject of this Monthly Roundup.
The post Monthly Roundup: Gravitational Wave Predictions and Comparisons appeared first on AAS Nova.
]]>In 2015, the first detection of gravitational waves changed astronomy forever, opening an entirely new window onto the physics of extreme objects like black holes and neutron stars. Today, we’ll take a look at three research articles that predict new gravitational wave sources, probe the prospects of detecting gravitational waves from ultra-light black holes, and compare measurements of the low-frequency gravitational wave background with predictions from the population of supermassive black holes in the local universe.
Disks of Collapsing Stars
So far, the LIGO, Virgo, and Kagra (LVK) detectors have spotted gravitational waves from a bevy of inspiraling objects: pairs of black holes, pairs of neutron stars, and black hole–neutron star duos. Using vast collections of quickly spinning neutron stars called pulsars, researchers have even found evidence for the muddled hum of distant supermassive black hole binaries.
Recently, Ore Gottlieb (Flatiron Institute and Columbia University) and collaborators explored the possibility of detecting gravitational waves from an entirely different type of source: the accretion disk surrounding a black hole born from the collapse of a rapidly spinning massive star (i.e., a collapsar).

The accretion disk at early times, showing prominent spiral arms (panel a), and at later times when the disk has homogenized (panel b). The remaining panels show the predicted gravitational wave amplitude at different times and at different disk angles. Click to enlarge. [Gottlieb et al. 2024]
Gottlieb’s team estimates that the gravitational waves from the accretion disk of a collapsing star 33 million light-years (10 megaparsecs) away could be detected with a signal-to-noise ratio of dozens by current instruments. Potential future instruments like Cosmic Explorer would see the event more clearly, with a signal-to-noise ratio of hundreds. What these estimates translate to is a potential detection of dozens to hundreds of collapsars each year by future observatories — and the possibility that several of these events are already hidden somewhere in the existing LVK data, awaiting the analysis that would extract their convoluted signals from the noise.
Overall, Gottlieb and coauthors show that collapsars are a promising but as-yet-undetected source of gravitational waves. Be on the lookout for future research from these authors examining the specifics of gravitational wave emission from collapsar disks.
Black Holes in the Mass Gap
Until recently, observations suggested that black holes could be no lighter than 5 solar masses. In addition, neutron stars are expected to top out out somewhere between 2 and 3 solar masses. This leaves a void between 2–3 and 5 solar masses called the mass gap. The reasons for this gap are unclear, and new observations have begun to populate the gap with candidate objects, suggesting that the “gap” may not be a gap at all. If these detections are confirmed, researchers must figure out how these mass-gap objects came to be.
In a recent article, Claire Ye (University of Toronto) and collaborators explored how black holes in the mass gap might form, leading to a prediction of how often we should expect to detect these black holes in gravitational wave observations. The team considered three main formation pathways, all of which involve a neutron star that is too massive to support itself, causing it to collapse into a black hole:
- a neutron star forms via the collapse of a massive star’s core and accretes stellar material that falls back on to the neutron star
- a neutron star forms through the collision of two white dwarfs or the accretion of material onto a white dwarf
- a neutron star gains mass through collisions or tidal interactions with another star
The densely packed globular cluster NGC 1851, as seen by the Hubble Space Telescope. [NASA, ESA, and G. Piotto (Università degli Studi di Padova); Processing: Gladys Kober (NASA/Catholic University of America)]
The simulations show that mass-gap black holes can be produced in dense star clusters, with different simulation runs producing anywhere from 4 to 465 mass-gap black holes. The main formation pathway also varied between simulations, with merging neutron stars or white dwarfs generally being the most common, except in more massive clusters, where core-collapse supernovae produced nearly as many mass-gap black holes as mergers did.

Neutron stars (left) and black holes (right) produced in globular clusters. The dividing line between neutron stars and black holes was set to be 2.5 solar masses. “Rapid” and “delayed” refer to the timescales over which supernova explosions play out. This factor has a large impact on the formation of mass-gap black holes. Click to enlarge. [Ye et al. 2024]
Bringing the Background to the Foreground
The last of today’s research articles concerns supermassive black holes in the nearby universe. The slow rumblings of countless supermassive black hole binaries are thought to generate a subtle background hum of gravitational waves at nanohertz frequencies. In 2023, research collaborations across the globe announced the discovery of significant evidence for the presence of the nanohertz gravitational wave background, creating new opportunities to test our understanding of the population of supermassive black holes in the universe.
Cataloging the masses of supermassive black holes at different points in cosmic history is critical for testing models of galaxy formation and black hole growth. The masses and numbers of supermassive black holes can also be used to predict the strength of the nanohertz gravitational wave background; comparing this prediction against observations can help test whether the census of black holes is complete, especially at the high-mass end that is thought to dominate the gravitational wave signal.
To study the highest-mass black holes, Emily Liepold and Chung-Pei Ma (University of California, Berkeley) undertook a study of the most massive galaxies in the nearby universe. The team used the results of the MASSIVE survey, which produced images and spectra of nearby massive galaxies. Leveraging existing dynamical and stellar-population modeling of a subset of these galaxies, they calculated the stellar mass of each galaxy in the MASSIVE sample. Then, using established relations between a galaxy’s stellar mass and the mass of its central black hole — the more massive the galaxy, the more massive the black hole — they assigned a black hole mass to each galaxy in their sample.

Comparison of the characteristic gravitational wave strain, or amplitude, calculated in this work (purple circle) to values calculated by other teams (circles of other colors) and observed using pulsar timing arrays (triangles). [Adapted from Liepold & Ma 2024]
Citation
“In LIGO’s Sight? Vigorous Coherent Gravitational Waves from Cooled Collapsar Disks,” Ore Gottlieb et al 2024 ApJL 972 L4. doi:10.3847/2041-8213/ad697c
“Lower-Mass-Gap Black Holes in Dense Star Clusters,” Claire S. Ye et al 2024 ApJ 975 77. doi:10.3847/1538-4357/ad76a0
“Big Galaxies and Big Black Holes: The Massive Ends of the Local Stellar and Black Hole Mass Functions and the Implications for Nanohertz Gravitational Waves,” Emily R. Liepold and Chung-Pei Ma 2024 ApJL 971 L29. doi:10.3847/2041-8213/ad66b8
The post Monthly Roundup: Gravitational Wave Predictions and Comparisons appeared first on AAS Nova.
]]>
Astrobites reports on how machine learning can help researchers simulate the phase of planet formation in which planetary embryos interact, collide, and combine to form the planets we know and love.
The post Giant Impacts Go Boom (Machine Learning Edition) appeared first on AAS Nova.
]]>Editor’s Note: Astrobites is a graduate-student-run organization that digests astrophysical literature for undergraduate students. As part of the partnership between the AAS and astrobites, we occasionally repost astrobites content here at AAS Nova. We hope you enjoy this post from astrobites; the original can be viewed at astrobites.org.
Title: Accelerating Giant Impact Simulations with Machine Learning
Authors: Caleb Lammers et al.
First Author’s Institution: Princeton University
Status: Published in ApJ
Planet Formation
In the nebular hypothesis view of planet formation, planets form out of a protoplanetary disk, starting out as small dust grains, some of which combine and grow to form planetesimals and eventually planets. Part of this process is the giant-impact phase, in which the planetesimals experience frequent, violent collisions, leading to the growth of what will eventually become fully fledged planets.
Numerically modeling the giant-impact phase is complicated by the computational difficulty of running simulations of many bodies over long timescales. Machine learning has already been adopted to improve and speed up planetary simulations, such as with the Stability of Planetary Orbital Configurations Klassifier (SPOCK) package. SPOCK’s first incarnation (SPOCKI) predicts whether a compact planetary system is stable over 1,000,000,000 orbits based on the results of a shorter 10,000-orbit integration, and an extension (SPOCKII) uses those results to predict when a planetary system will destabilize.
Creating a Machine Learning Framework
Today’s article extends previous work by using machine learning to predict the outcomes of planet–planet collisions in three-planet systems with two subtasks: 1) predicting which planet pair will collide and 2) predicting the orbital configuration of the resulting system. The authors use supervised learning: giving a model a training set with inputs and correct outputs so that the model can learn the mapping from inputs to outputs. Predicting collisions (subtask 1) requires classification, producing an outcome from a set of discrete options or categories (in this case, which planets collide). Predicting resulting orbital configurations (subtask 2) requires regression, producing numerical values describing the orbit of the post-collision system. The authors use a training set of more than 500,000 N-body simulations integrated with the REBOUND package. They initialize tightly packed three-planet systems with randomized initial conditions and integrate the systems for 10,000,000 orbits (of the innermost planet) with mass and momentum conservation. The authors only keep the systems with mergers between 10,000 and 10,000,000 orbits so the machine learning framework does not concern itself with non-merging systems.
The authors use separate multi-layer perceptron models independently trained on 80% of the training set (leaving the rest as a validation set) to complete both subtasks, following the schematic shown in Figure 1. The collision classifier takes as inputs the orbital elements of the three planets after they’ve completed 10,000 orbits, generates the probabilities of planet-pair collisions, and samples the probabilities to determine which pair of planets collide. The orbital outcome regressor takes the orbital elements of the three planets and the choice of which planets collide to predict the new orbital elements (semi-major axis, eccentricity, and inclination) of the resulting system.

Figure 1: A schematic of the machine learning model in which a classifier predicts which pair among three planets collides and a regressor predicts the orbital configuration of the two resulting planets. [Lammers et al. 2024]
Piecing Together the Giant-Impact Emulator
The authors combine their machine learning model with SPOCKII to create an iterative emulator to model the giant-impact phase, with a schematic shown in Figure 2. The emulator takes in overly packed, multi-planet systems with randomly initialized configurations, groups the systems into trios of planets, uses SPOCKII to predict when the systems will destabilize, merges the most unstable trio, and then repeats until stability is achieved. The authors also run N-body simulations for 500 ten-planet systems for comparison with the results of the emulator. As shown in Figure 3, there is close agreement with masses, spacings, inclinations, and most system-level properties.

Figure 2: A schematic of the giant-impact emulator in which a multi-planet system is broken into trios. The machine learning model shown in Figure 1 predicts the results of a collision in the most unstable trio, and the process repeats until a stable system is formed. [Lammers et al. 2024]

Figure 3: A comparison of the properties of the N-body (red) and machine learning–based (blue) planetary systems resulting from giant impacts. The machine learning–based framework produces largely similar results except that machine learning tends to produce systems that are less dynamically excited (bottom right). [Lammers et al. 2024]
Planet formation is a messy, unsolved problem. Until the discovery of exoplanetary systems, we had only the solar system and its single formation outcome to study. It turns out that nature produces a beautiful mosaic of planetary systems, many of which bear little resemblance to our own. The giant-impact phase has long been a bottleneck in simulating planet formation due to computational constraints, and today’s article presents a truly exciting advancement in modeling planet–planet collisions. The model is limited in that it breaks multi-planet systems into trios of adjacent planets and models collisions and scattering only within trios, though the authors expect this is a minor effect. The model is publicly available and will certainly expand the frontier of possible planet formation analyses.
Original astrobite edited by Nathalie Korhonen Cuestas.
About the author, Kylee Carden:
I am a second-year PhD student at The Ohio State University, where I am an observer of planets outside the solar system. I’m involved with the Roman Space Telescope, a small robotic telescope called DEMONEXT, and exoplanet atmospheres. I am a huge fan of my cat Piccadilly, cycling, and visiting underappreciated tourist sites.
The post Giant Impacts Go Boom (Machine Learning Edition) appeared first on AAS Nova.
]]>
Easily recognized by the dense band of dust swirled around its center, the Black Eye Galaxy is the subject of a new study that investigates the connection between galaxy structure and supermassive black hole properties.
The post Featured Image: The Black Eye Galaxy appeared first on AAS Nova.
]]>The striking dust-obscured center of the galaxy NGC 4826, shown in this image from the Hubble Space Telescope, has inspired several inventive monikers including the Black Eye Galaxy and the Evil Eye Galaxy. At just 27 million light-years from Earth, NGC 4826 provides an excellent opportunity to study the connection between the structure of a galaxy and the properties of its central supermassive black hole. Kayhan Gültekin (University of Michigan) and collaborators paired infrared and optical data from multiple sources with dynamical modeling to assess the galaxy’s structure and calculate the mass of its central black hole. The data revealed multiple components to the galaxy’s structure, including a disk, an ellipsoidal bulge of stars protruding from the disk, and a second, slightly flattened bulge called a pseudobulge that is itself composed of multiple components. With a supermassive black hole mass of 8.4 million solar masses — roughly twice the mass of the Milky Way’s central black hole — NGC 4826 possesses the least-massive black hole to be measured via stellar dynamical modeling. To learn more about the intricate structure of this galaxy and what these measurements imply for the study of low-mass supermassive black holes, be sure to check out the full article linked below.
Citation
“The Black Hole Mass and Photometric Components of NGC 4826,” Kayhan Gültekin et al 2024 ApJ 974 16. doi:10.3847/1538-4357/ad67dc
The post Featured Image: The Black Eye Galaxy appeared first on AAS Nova.
]]>
Is dark matter actually ancient black holes the size of planets? New research places a limit on how much of the universe's most mysterious matter could be made up of tiny black holes.
The post How Much of Dark Matter Is Made Up of Tiny Black Holes? appeared first on AAS Nova.
]]>Could dark matter — the mysterious substance that makes up 85% of the mass of the universe — partially be black holes the size of planets? New research looks to the Milky Way’s neighbors for an answer.
Rogue Planets or Tiny Black Holes?

Schematic of a black hole lensing the light from a background star as the black hole passes in front of the star from the vantage point of an observer on Earth. Click to enlarge. [NASA/ESA; CC BY 4.0]
Thanks to surveys like the Optical Gravitational Lensing Experiment (OGLE), researchers have identified thousands of microlensing events. Most of these events are due to stars, brown dwarfs, and stellar remnants, but a small number seem to arise from objects the size of planets. While the majority of astronomers attribute these signals to free-floating exoplanets unmoored from their host stars, others have proposed a more speculative cause: primordial planet-sized black holes. Primordial black holes are theorized to have formed early in the universe when dense regions collapsed directly into black holes without forming stars first.
Previous research has suggested that if the observed microlensing signals are due to primordial planet-mass black holes rather than planets, as much as 10% of the mass attributed to dark matter is made up of tiny, ancient black holes. It’s an enticing theory, but a highly speculative one — how can we tell if the microlensing signals come from planets or planet-sized black holes?
OGLEing Microlensing Events
In their recent research article, Przemek Mróz (University of Warsaw) and collaborators showed that answering this question is all about looking in the right place. In the Milky Way’s disk and bulge, where stars and planets are common, it’s impossible to distinguish between microlensing signals from planets and planet-sized black holes. Away from these heavily populated areas, interference from stellar and planetary signals should be minimal, and microlensing signals could reveal primordial planet-mass black holes — should they exist — floating through the Milky Way’s dark-matter halo.

The survey’s search area overlaid on images of the Large (left) and Small (right) Magellanic Clouds. [Mróz et al. 2024]
The resulting dataset included 17.6 million light curves from stars in the Magellanic Clouds, which the team whittled down using several criteria. First, they required that the light curves show an increase in brightness but be otherwise steady, eliminating variable stars and reducing the dataset to 2,538 light curves. Then, they removed false positives and light curves affected by imaging artifacts, leaving 308 light curves. Finally, they eliminated all light curves that weren’t fit well by a microlensing model — leaving just two possible microlensing events.
And Then There Was One

The two microlensing candidates found in the authors’ survey. The top plot shows what is likely a bona fide microlensing signal, while the bottom plot shows what the authors believe is a stellar flare. [Mróz et al. 2024]
Extrapolating from their observations, Mróz’s team calculated that primordial planet-mass black holes — between roughly half the mass of the Moon up to the dividing line between planets and brown dwarfs — can make up at most just 1% of all dark matter. This in turn suggests that the microlensing signals previously attributed to primordial planet-mass black holes are instead due to the more mundane (though still fascinating) population of exoplanets without host stars.
Citation
“Limits on Planetary-Mass Primordial Black Holes from the OGLE High-Cadence Survey of the Magellanic Clouds,” Przemek Mróz et al 2024 ApJL 976 L19. doi:10.3847/2041-8213/ad8e68
The post How Much of Dark Matter Is Made Up of Tiny Black Holes? appeared first on AAS Nova.
]]>
New observations of the M-dwarf exoplanet Gliese 486b help astronomers map the location of the cosmic shoreline, which separates planets with atmospheres from those without.
The post Charting the Cosmic Shoreline: Which Planets Have Atmospheres? appeared first on AAS Nova.
]]>Which of the nearly 6,000 known exoplanets have atmospheres? With help from JWST, astronomers are inching closer to an answer, and new observations of a super-Earth planet around a low-mass star help to define the dividing line between planets with atmospheres and planets without.
How to Find an Atmosphere
With the number of known exoplanets growing steadily larger, a major challenge for astronomers is deciding how to allocate limited telescope time to study these planets further. Rocky planets with atmospheres make promising targets, but it’s not obvious which exoplanets should have atmospheres. Taking cues from the planets in our solar system and the subset of exoplanets that have been studied in detail, researchers have defined the concept of the cosmic shoreline, which separates planets with atmospheres from planets without on the basis of escape velocity — related to a planet’s mass and size — and the amount of starlight the planet receives.
While simple in concept, charting the cosmic shoreline is difficult, especially for planets circling M dwarfs: the smallest, coolest, and most common type of star. M dwarfs are notorious for their extreme space weather, which can strip away a planet’s atmosphere over billions of years. To learn more about the exact position of the cosmic shoreline and to guide our observations of M-dwarf exoplanets, researchers must search for atmospheres on planets subjected to the fierce conditions of an M-dwarf host star.
A Promising Planet
Discovered by the Transiting Exoplanet Survey Satellite (TESS), Gliese 486b (Gl 486b or GJ 486b) is a super-Earth exoplanet with a radius of 1.29 Earth radii and a mass of 2.77 Earth masses. Its host star is a 6.6-billion-year-old M dwarf that is known to explode with high-energy stellar flares. At just 26 light-years away, Gl 486b is one of the closest transiting terrestrial exoplanets known.
Last year, researchers published an investigation of Gl 486b’s atmosphere, finding that JWST transmission spectra suggested either a water-rich atmosphere or no atmosphere at all. If there is no atmosphere, the observed signal from water vapor must have come from cool regions on the host star rather than from the planet’s atmosphere.

Cartoon showing the geometry of a transit observation and a secondary eclipse observation. Click to enlarge. [AAS Nova/Kerry Hensley]

Best-fitting bare surface (top) and atmosphere (middle) models. The bottom panel shows poorly fitting models. Click to enlarge. [Mansfield et al. 2024]
Atmosphere Likely Lacking
With these constraints in hand, Mansfield’s team used forward modeling to explore the types of atmospheres that could be present. They found that a planet with no atmosphere provided the best fit to the data, but a thin atmosphere was also acceptable, as long as it contained only a small amount of water or carbon dioxide.
Given the realities of 6.6 billion years spent around an active M-dwarf star, the team concluded that Gl 486b is unlikely to have an atmosphere. In addition to weighing in on the likelihood of Gl 486b having a water-rich atmosphere, the team also achieved the most precise measurement yet of a planet’s dayside temperature, constraining the temperature to within just 14K.

Location of Gl 486b relative to the approximate cosmic shoreline. [Mansfield et al. 2024]
Citation
“No Thick Atmosphere on the Terrestrial Exoplanet Gl 486b,” Megan Weiner Mansfield et al 2024 ApJL 975 L22. doi:10.3847/2041-8213/ad8161
The post Charting the Cosmic Shoreline: Which Planets Have Atmospheres? appeared first on AAS Nova.
]]>
Astrobites reports on the potential discovery of a dark-matter-free dwarf galaxy hiding in the tentacle of a jellyfish galaxy.
The post New Species of Dwarf Galaxy in the Galaxy Cluster Ecosystem? appeared first on AAS Nova.
]]>Editor’s Note: Astrobites is a graduate-student-run organization that digests astrophysical literature for undergraduate students. As part of the partnership between the AAS and astrobites, we occasionally repost astrobites content here at AAS Nova. We hope you enjoy this post from astrobites; the original can be viewed at astrobites.org.
Title: Dark-Matter-Free Dwarf Galaxy Formation at the Tips of the Tentacles of Jellyfish Galaxies
Authors: V. Lora et al.
First Author’s Institution: Institute of Nuclear Sciences, Mexico (UNAM)
Status: Published in ApJL
When Jellyfish Fly
Most galaxies are part of a galaxy cluster, which is exactly what it sounds like — a large collection of galaxies that are gravitationally bound to the larger cluster, much like how stars are gravitationally bound to a larger galaxy. In addition to the galaxies themselves, there is also gas between the galaxies in the cluster, referred to as the intracluster medium. When a disk-like galaxy moves through the intracluster medium in a galaxy cluster, some of the gas within the galaxy (the interstellar medium) gets stripped away from the galaxy. This creates long gaseous tails (or, if you will, tentacles), giving the galaxy an uncanny resemblance to a jellyfish!
Jellyfish galaxies, and their tentacles in particular, have been studied for decades. Astronomers have investigated how much of the gas in the tentacles comes from the intracluster medium versus the interstellar medium, as well as where and how star formation occurs within the tentacles. Interestingly, astronomers have found star-forming regions in the tentacles that have similar masses and sizes to ultra-compact dwarf galaxies. Today’s authors look to reproduce those results computationally and better understand how this dwarf galaxy formation channel works.
Hanging On by a Tentacle
The authors use data from the IllustrisTNG50 simulation, a cosmological simulation large enough to form dozens of galaxy clusters with enough resolution to accurately model features such as the arms of spiral galaxies. The authors identify a set of jellyfish galaxies within this simulation, then make additional cuts to
- ensure the galaxies have obvious tentacles;
- find locations of star formation within the tentacles; and
- eliminate galaxies where tentacle-like features could be due to interactions with other galaxies.
These cuts leave only one galaxy with a mass of ~400 billion solar masses; compare this to the mass of the Milky Way, which is typically reported as ~1 trillion solar masses. (However, a 2023 study found that the Milky Way mass was closer to ~200 billion solar masses.)
The authors identify a star-forming site within one of the tentacles of this galaxy, highlighted in Figure 1. This both supports the observational evidence and suggests that this may be a new type of dwarf galaxy (more on this in a moment). Additionally, by tracking the galaxy’s history prior to the infall, they determine that the galaxy loses gas but not stars. This means that the gas in the tentacle came from the galaxy, but the stars are forming in the tentacle rather than being relocated from the galaxy. This is a consequence of ram-pressure stripping, the primary physical phenomenon that creates the tails of jellyfish galaxies. Another important finding about the dwarf galaxy candidate is that it lies well outside the dark-matter halo of the jellyfish galaxy, which has important ramifications for its status as a dwarf galaxy candidate.

Figure 1: Different visualizations of the selected galaxy. The top panel shows neutral gas (green), dark matter (white), and star formation (rainbow). The bottom panel shows the dark matter (white) and stellar mass (rainbow). The dwarf candidate is circled in magenta in both panels. [Lora et al. 2024]
Dark-Matter-Deficient Dwarfs
The authors perform additional analysis on the dwarf galaxy candidate. First, they determine that the gas and stars are gravitationally bound, meaning that they can be thought of as a single system much like how a galaxy is thought of as a single system. They also look at the dark-matter content of the dwarf galaxy candidate and find that none of it is gravitationally bound, making this a dark-matter-free dwarf galaxy. Furthermore, they estimate the mass and size of the dwarf galaxy candidate to be ~200 million solar masses and ~1–1.5 kiloparsecs. Based on these findings, the authors conclude that this system represents a new kind of dwarf galaxy, which they dub a ram-pressure-stripped dwarf galaxy; additionally, ram-pressure-stripped dwarf galaxies are unique among dwarf galaxies because they lack a dark-matter halo due to their creation via ram pressure stripping.

Figure 2: Star formation rate (top panel) and oxygen abundance (proxy for metal concentration, bottom panel) of the ram-pressure-stripped candidate (magenta). [Lora et al. 2024]
Today’s authors have found evidence of a new type of dwarf galaxy, which they call a ram-pressure-stripped dwarf galaxy. These dwarf galaxies form via ram pressure stripping in the tentacles of jellyfish galaxies and are characterized as being gravitationally self-bound, hosting star formation, and lacking a dark-matter halo. The authors hope to continue studies of ram-pressure-stripped dwarf galaxies, noting that other cosmological simulations that can resolve smaller amounts of mass may lead to more discoveries of ram-pressure-stripped dwarfs with lower masses.
Original astrobite edited by Amaya Sinha.
About the author, Brandon Pries:
I am a graduate student in physics at Georgia Institute of Technology (Georgia Tech). I do research in computational astrophysics with John Wise, using machine learning to study the formation and evolution of supermassive black holes in the early universe. I’ve also done extensive research with the IceCube Collaboration as an undergraduate at Michigan State University, studying applications of neural networks to event reconstructions and searching for signals of neutrinos from dark matter annihilation.
The post New Species of Dwarf Galaxy in the Galaxy Cluster Ecosystem? appeared first on AAS Nova.
]]>
The Astronomical Journal turns 175 this month — join us in celebrating the journal's impact and looking back on its history.
The post Celebrating 175 Years of <em>The Astronomical Journal</em> appeared first on AAS Nova.
]]>The first issue of The Astronomical Journal (AJ) was published 175 years ago this month. This remarkable history means that the journal has persisted through the American Civil War and both World Wars, through 35 presidential administrations, and even through the development of “astronomer” as a profession in North America — it wasn’t until 50 years after the AJ’s launch that the continent founded its first professional society of astronomers, the American Astronomical Society.
As the first astronomy-focused academic journal to be published outside of Europe, the AJ has come a long way: its first issue — containing just a single printed article (“Development of the Perturbative Function of Planetary Motion”) — would have had limited circulation among the small but growing community of North Americans interested in astronomy. Now, as a fully open-access electronic journal, the AJ garners more than 100,000 views per year.
Early issues of the journal presented major advances in solar system and stellar science, laying the groundwork for modern discoveries in these fields. In the pages of the AJ, you can find foundational work establishing the ubiquity of black holes in the centers of galaxies, an examination of the iconic Hubble Deep Field, and Nobel-prize-winning evidence for the accelerating expansion of the universe, to name just a few works. Today, impactful observational results can be found alongside major advances in instrumentation, surveys, and software, such as the Wide-Field Infrared Survey Explorer, the Sloan Digital Sky Survey, and the astropy codebase.
To celebrate this remarkable milestone, we invite you to join us in looking back on the journal’s history using this interactive timeline. Here’s to 175 more years!

The post Celebrating 175 Years of <em>The Astronomical Journal</em> appeared first on AAS Nova.
]]>
Often characterized as "failed stars," brown dwarfs are cool, cloudy objects that are not fully understood. Could their poles be home to swirling winds that drive intriguing observational trends?
The post Pointing to the Poles of Brown Dwarfs: Polar Vortex Possibilities appeared first on AAS Nova.
]]>Somewhere between planets and stars is a cool, cloudy class of objects called brown dwarfs. A new study suggests that swirling clouds at the poles of these intriguing objects may provide clarity on their observed characteristics.
Trendy Brown Dwarfs
Not quite big enough to spark hydrogen fusion, but not quite small enough to lump in with gas giant planets, brown dwarfs sit in a perplexing in-between space and are not yet fully understood. As space-based observations of brown dwarfs have evolved, recent studies have revealed long-term variations in the brightness of brown dwarfs as well as unexplained trends in their color and spectral characteristics depending on from which angle we happen to view them.
Previous studies have theorized that these variations are driven by changes in atmospheric properties of brown dwarfs. Changes in the rotation of clouds in a brown dwarf’s atmosphere can explain the observed short-term variability, but the observed long-term variations are not well explained by this same property. Could there be a single contributor driving both the observed short- and long-term variations in brown dwarfs?

Three modeled atmosphere components, which include the evolving polar vortex that changes with time, the ambient atmosphere that is stable, and the bands of active clouds that change and evolve on short timescales. The top panel shows a 30 degree inclination angle where the polar vortex is clearly visible and will impact the observed photometric and spectroscopic properties of the brown dwarf. The bottom panel shows an 80 degree inclination angle where the equatorial bands cover most of the brown dwarf’s disk. Click to enlarge. [Fuda & Apai 2024]
Polar Vortex Potential
Two astronomers at the University of Arizona, Nguyen Fuda and Dániel Apai, posit that the color– and spectral–inclination trends observed in brown dwarfs could be driven by polar vortices — an expanse of swirling air sitting atop the pole of a planet. To test this hypothesis, the authors explore three model atmospheres (no vortex, evolving vortex, and stationary vortex) and compare the simulated observations of each to understand how the presence or absence of a polar vortex may impact brown dwarf observations over time.
Depending on the viewing angle, we may see primarily equatorial cloud bands or we may see a significant portion or all of the brown dwarf’s pole. By making simulated observations across a series of inclinations, the authors find that both the evolving and stationary vortex models produce color–inclination variations that align with previous observations of brown dwarfs — polar vortices tend to have bluer infrared colors compared to the redder equatorial regions.

Resulting variability–inclination (top) and color–inclination (bottom) trends across various inclinations for short-term (left) and long-term (right) simulated observations of each modeled scenario. Click to enlarge. [Fuda & Apai 2024]
Solar System Similarities
Brown dwarfs share similar characteristics to gas giants, like those in our own solar system. Many observations of Jupiter, Saturn, Uranus, and Neptune reveal clear vortex-dominated poles that produce similar color and brightness variability. These planets, though smaller than brown dwarfs, show variations from pole to equator that grant validity to the idea of polar vortices being present in brown dwarf atmospheres.

Jupiter’s bright blue south pole covered in vortices, swirling around like hurricanes. [NASA/JPL-Caltech/SwRI/MSSS/Betsy Asher Hall/Gervasio Robles]
Citation
“The Polar Vortex Hypothesis: Evolving, Spectrally Distinct Polar Regions Explain Short- and Long-Term Light-Curve Evolution and Color–Inclination Trends in Brown Dwarfs and Giant Exoplanets,” Nguyen Fuda and Dániel Apai 2024 ApJL 975 L32. doi: 10.3847/2041-8213/ad87e9
The post Pointing to the Poles of Brown Dwarfs: Polar Vortex Possibilities appeared first on AAS Nova.
]]>
How can we track down colliding neutron stars as quickly as possible? New research shows that the nearly 20-year-old Swift Observatory might be our best bet.
The post Old Telescope, New Tricks: Chasing Gravitational Waves Across the Sky appeared first on AAS Nova.
]]>With the Neil Gehrels Swift Observatory nearing the 20th anniversary of its launch, astronomers have demonstrated a new way to use the seasoned telescope. The technique, which involves rapidly slewing to the location of a gravitational wave signal, could open a window onto the critical first minutes after a neutron-star merger.
When Gravitational Waves and Radiation Meet

The “chirp” signal of the neutron-star merger GW170817, as seen by the Laser Interferometer Gravitational-wave Observatory in Livingston, Louisiana. [Caltech/MIT/LIGO Laboratory]
As fortuitous as this detection was, Fermi and INTEGRAL lacked the localization ability needed to pinpoint the burst’s position. The delay in localization cost astronomers precious time, and it wasn’t until another 12 hours had passed that optical and ultraviolet emission from the collision was identified — wavelengths that are critical to collect as soon as possible to understand the physics of the merger and the cascade of element formation that follows. Is there a way to find a neutron-star merger faster?
Swift Follow-Up
In a recent article, Aaron Tohuvavohu (University of Toronto; California Institute of Technology) and collaborators showed how we can rapidly locate neutron-star mergers on the sky with an existing tool: the 20-year-old Swift Observatory. Gamma rays, which are produced just seconds after a neutron-star collision, are ideal for quickly spotting the radiation from a merger — and Swift has the most sensitive gamma-ray detector currently in operation. Once a gamma-ray source falls within Swift’s field of view, which spans 17% of the sky, the telescope has the ability to localize the source to within 1–3 arcminutes, giving follow-up telescopes sensitive to other wavelengths a small area to search. But unlike all-sky gamma-ray telescopes, Swift can’t look everywhere at once, raising the question of how to get the telescope to point toward the right place at the right time.

Demonstration of how the localization of a gravitational wave signal evolves as the time to merger decreases. Click to enlarge. [Tohuvavohu et al. 2024]
Doubling the Odds
After being alerted to an imminent neutron-star merger, should Swift immediately race to the likeliest location, or should it wait to get a better idea of where the event is happening? Given the time required to wend toward the signal’s origin, curving to avoid forbidden zones too close to Earth or the Sun, Tohuvavohu’s team finds that it’s best for Swift to act on the earliest possible knowledge of where the merger is likely to happen, even though later maps are more accurate.

Fraction of gravitational wave events encompassed by the Swift Burst Alert Telescope field of view as a function of the notice given in advance of the merger. [Adapted from Tohuvavohu et al. 2024]
Future, more sensitive gravitational wave observatories will be able to detect the faint hum of spiraling neutron stars even longer before impact, helping Swift get into position more frequently. In the meantime, Tohuvavohu and coauthors recommend working to improve the speed at which notice of an impending neutron-star merger can be transmitted to Swift.
Citation
“Swiftly Chasing Gravitational Waves Across the Sky in Real Time,” Aaron Tohuvavohu et al 2024 ApJL 975 L19. doi:10.3847/2041-8213/ad87ce
The post Old Telescope, New Tricks: Chasing Gravitational Waves Across the Sky appeared first on AAS Nova.
]]>
Astrobites reports on JWST observations that get up close and personal with the famous supernova remnant Cassiopeia A.
The post The Galactic Golden Child Cassiopeia A Through the Lens of JWST appeared first on AAS Nova.
]]>Editor’s Note: Astrobites is a graduate-student-run organization that digests astrophysical literature for undergraduate students. As part of the partnership between the AAS and astrobites, we occasionally repost astrobites content here at AAS Nova. We hope you enjoy this post from astrobites; the original can be viewed at astrobites.org.
Title: A JWST Survey of the Supernova Remnant Cassiopeia A
Authors: Dan Milisavljevic et al.
First Author’s Institution: Purdue University
Status: Published in ApJL
Cassiopeia A, or Cas A for short, is in many ways the golden child of supernova remnant astronomy, a field that studies the hot clouds of gas and dust produced by the explosive deaths of stars. Beautiful and with a wealth of insights on stellar death to be gleaned from its billowy filaments, Cas A has mesmerised astronomers since its nascent glow first lit up the night sky in the late 17th century.
The hype behind Cas A has been sustained by the launch of new facilities, which provide increasingly detailed views of the dusty, gaseous nebula that was left behind by the cataclysmic explosion of a star 15–20 times the mass of the Sun. Luckily for the die-hard Cas A fans, JWST has obtained incredibly detailed images of the remnant’s near- and mid-infrared emission in the ~1.5 to ~26.7 microns (1 micron = 10-6 meter) range using a variety of filters referred to by their JWST filter name (e.g., F120W). These images are the focus of today’s article that studies Cas A’s structure and searches for evidence of its central neutron star.
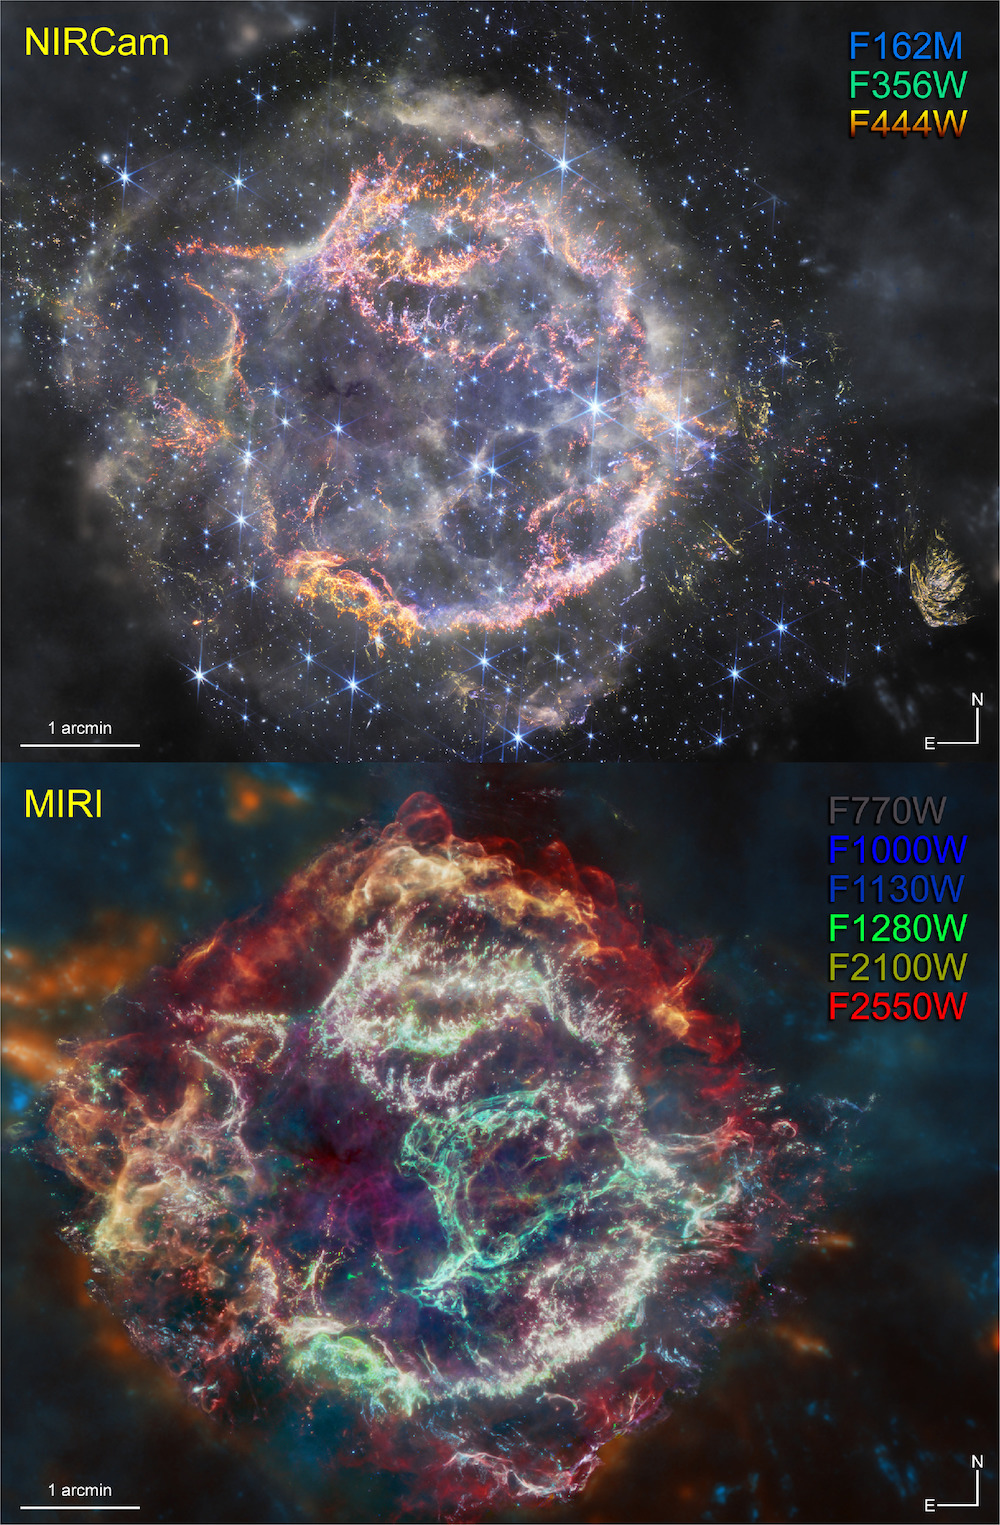
Figure 1: NIRCam (top) and MIRI (bottom) images of Cas A collected using JWST. The filters used to construct each image are listed in the top right corner. [Milisavljevic et al. 2024]
Not only did the authors consider Cas A’s structure in their article, they also searched for evidence of a central compact object such as a neutron star within its nebula. When massive stars die, they are expected to produce a compact object, be it either a black hole or neutron star. Therefore, astronomers are often eager to find evidence of these exotic objects in supernova remnant images. Previously, X-ray images from Chandra had revealed a point source at the centre of Cas A that was presumed to be its neutron star. Unfortunately, more recent visible and near-infrared Hubble and Spitzer images of Cas A did not show evidence of the reported central compact object. However, this result was not entirely unexpected given the expected low magnetic field strength of the neutron star or the high extinction (or dimming) of visible light, disfavouring the detection of the central compact object at wavelengths other than X-rays.
Given the non-detection in Hubble images, the authors of today’s article conducted a search for Cas A’s neutron star in their deeper JWST images. The results of this search are presented in Figure 2, which gives the flux density at the reported location of the neutron star as a function of frequency for the JWST, Hubble, Spitzer, and Chandra images of Cas A. In the figure, the red down arrows represent the JWST upper limits, meaning that no emission from the neutron star was detected using the deep JWST observations, but that emission is still possible at fluxes below these values. Figure 2 also shows the upper limits established from previous Spitzer and Hubble observations in grey, as well as the flux of the neutron star detected in Chandra X-ray observations in black. Additionally, the authors compared their results to three different models that could describe the neutron star emission given these upper limits, including power laws with indices of −2 and −1 in yellow and blue, respectively, and a blackbody with a temperature of 900K in red. While no neutron star was apparent in the JWST observations, the authors calculated a flux density upper limit of 20 nanoJanskys at a wavelength of 3 microns.
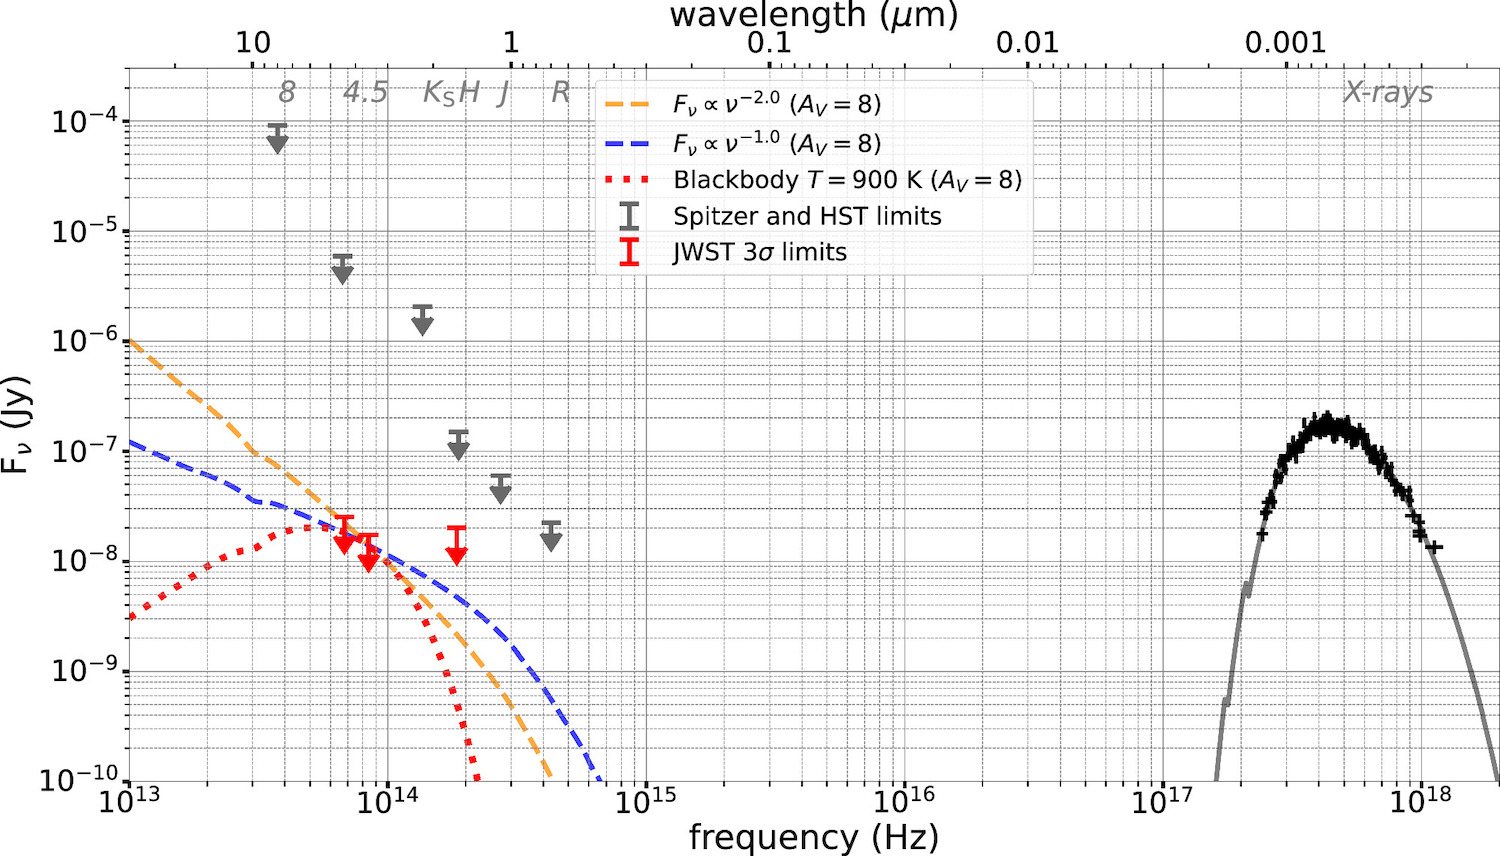
Figure 2: The flux density as a function of frequency for JWST (red), Spitzer (grey), Hubble (grey), and Chandra (black) observations of the location of Cas A’s neutron star. No emission from the neutron star was detected in JWST, Hubble, or Spitzer observations, which is indicated by the down arrows that represent the calculated upper limits on the flux from the neutron star. [Milisavljevic et al. 2024]
Original astrobite edited by Ivey Davis.
About the author, Sonja Panjkov:
I’m a second-year PhD student at the University of Melbourne. My research focuses on the high-energy emission from the supernova remnants in the Magellanic Clouds. In my spare time, I enjoy hanging out with my cats and going to see live music.
The post The Galactic Golden Child Cassiopeia A Through the Lens of JWST appeared first on AAS Nova.
]]>
New simulations show how odd radio circles could form when supermassive black hole jets blow bubbles in intergalactic gas.
The post A Bubbly Origin for Odd Radio Circles appeared first on AAS Nova.
]]>Discovered in 2019, odd radio circles (ORCs) are among the newest and most mysterious astrophysical phenomena. New research examines how bubbles blown by black hole jets could create these striking features.
Stumped by Space ORCs
ORCs are faint extragalactic circles of radio emission that appear to be invisible at other wavelengths. As the number of known ORCs slowly climbs, researchers have begun to test possible formation mechanisms. Among the many possibilities are the jets of active galactic nuclei: luminous galactic centers powered by accreting supermassive black holes.

The active galactic nucleus of the galaxy Hercules A powers the pair of immense jets emanating from the galactic center. [X-ray: NASA/CXC/SAO, Optical: NASA/STScI, Radio: NSF/NRAO/VLA]
Now, Yen-Hsing Lin (National Tsing Hua University) and Hsiang-Yi Karen Yang (National Tsing Hua University and National Center for Theoretical Sciences, Taiwan) have shown how active galactic nuclei can blow ORC-sized bubbles.
Galaxies Blowing Bubbles
Using three-dimensional magnetohydrodynamics simulations, Lin and Yang shot bipolar jets into intracluster gas, tracking the jet evolution and bubble formation across 200 million years of simulation time. The team focused on two of their simulation runs, which created bright-edged circles of radio emission that are roughly the size of known ORCs.

Comparison of simulated radio images (left column) and observations (right column) of ORCs. [Lin & Yang 2024]
A critical factor in determining whether a galaxy’s jets produce an ORC is the ability of the tenuous jets to completely excavate the higher-density intracluster gas that it interacts with. For this reason, low-mass galaxy clusters, which contain less intracluster gas, may be more likely to host ORCs.
Another Way of Looking

Simulated X-ray observations by Chandra (top), AXIS (middle), and Athena (bottom). The planned AXIS and Athena missions could achieve higher signal to noise than Chandra can in far less time. [Lin & Yang 2024]
As for observations outside radio wavelengths, the team found that only certain ORCs would produce enough X-rays to be picked up by the Chandra X-ray Observatory, and even those would require 11.5 days of observing time. Based on these results, it’s unsurprising that ORCs have so far appeared invisible at X-ray wavelengths — but that might change. Two X-ray telescopes slated to launch in the 2030s, NASA’s Advanced X-ray Imaging Satellite (AXIS) and the European Space Agency’s Advanced Telescope for High-ENergy Astrophysics (Athena), could reduce the necessary observing time to just 4 hours.
Going forward, Lin and Yang aim to continue their simulations, investigating the absolute brightness, polarization, and other properties of the radio emission, allowing for better comparisons with observations and a greater understanding of ORC origins.
Citation
“Active Galactic Nucleus Jet-Inflated Bubbles as Possible Origin of Odd Radio Circles,” Yen-Hsing Lin and H.-Y. Karen Yang 2024 ApJ 974 269. doi:10.3847/1538-4357/ad70af
The post A Bubbly Origin for Odd Radio Circles appeared first on AAS Nova.
]]>
The Hedgehog galaxy is one of the most isolated dwarf galaxies known — but despite its serene location, it might not have formed any new stars in the past 100 million years.
The post Discovery of a Lonely Galactic Hedgehog appeared first on AAS Nova.
]]>Researchers have discovered an extremely isolated galaxy. The galaxy, dubbed “Hedgehog” for its small size and isolated nature, lies roughly 5.5 million light-years from the nearest galaxy group and isn’t forming any stars, making it a rarity among dwarf galaxies.

Messier 63’s faint, looping stellar stream, highlighted by the negative image surrounding the main body of the galaxy, is thought to be a disrupted dwarf galaxy. [Adapted from Giuseppe Donatiello / Michele Trungadi; Public Domain]

One Is the Loneliest Number
Small but fascinating, dwarf galaxies are the most common type of galaxy in our universe. At most containing roughly 1% as many stars as the Milky Way, these delicate galaxies are easily disrupted by the gravitational pull of larger galaxies. These interactions can pull dwarf galaxies apart into stellar streams or put a stop to their star formation.
Far from the influence of larger galaxies, though, isolated dwarf galaxies tend to churn out new stars; only 0.06% of isolated dwarf galaxies are quiescent, lacking new stars. When a quiescent dwarf galaxy is found far from other galaxies, astronomers attempt to puzzle out why the galaxy is dormant.
Discovering a Hedgehog
A Princeton University team led by Jiaxuan Li (李嘉轩) was searching for dwarf galaxies orbiting the galaxy NGC 5068 when they spotted a small galaxy cataloged as dw1322m2053. Initially flagged as a possible satellite of NGC 5068, placing it 17 million light-years away, dw1322m2053’s mottled appearance suggested that the galaxy was far closer — close enough for its irregular distribution of stars and star clusters to be faintly visible.

Three views of dw1322m2053 aka Hedgehog. The galaxy is visible at optical and near-infrared wavelengths (left and center images) but has not been detected in the ultraviolet (right image). Click to enlarge. [Li et al. 2024]
An investigation into the galaxy’s neighborhood earned it a new moniker: Hedgehog. Like its adorably prickly namesake, Hedgehog is small and solitary: there are no galaxies within 3.3 million light-years and no galaxy groups within 5.5 million light-years, making it one of the most isolated dwarf galaxies known.
How to Quench an Isolated Galaxy

A view of Hedgehog’s neighborhood. The galaxy’s closest neighbors are shown in orange. The purple circles show the virial radii of the galaxy groups. You can view an interactive version of this figure here. [Adapted from Li et al. 2024]
Li’s team found that Hedgehog is most likely a backsplash galaxy, meaning that it passed close enough to a galaxy group to have its star-forming gas stripped away before being slingshotted into empty space. Given the distance to the closest galaxy group, Centaurus A, and the age of Hedgehog’s stars, this scenario is possible, but a more refined estimate of Hedgehog’s age is necessary to fully assess this possibility.
There could be an even simpler explanation, though: with a stellar mass of just 631,000 solar masses, Hedgehog is on the small side, even for a dwarf galaxy. At such a small size, it’s possible for star formation to be halted in various ways, including by passing through a patch of intergalactic gas or by evaporating away its own star-forming gas. Future observations will help to explain why Hedgehog has been hibernating.
Citation
“Hedgehog: An Isolated Quiescent Dwarf Galaxy at 2.4 Mpc,” Jiaxuan Li et al 2024 ApJL 975 L23. doi:10.3847/2041-8213/ad5b59
The post Discovery of a Lonely Galactic Hedgehog appeared first on AAS Nova.
]]>
Citizen scientists have identified 7,000 swirling vortices on Jupiter, leading to some surprising findings.
The post Featured Image: Finding Swirls on Jupiter appeared first on AAS Nova.
]]>As you gaze upon these images of swirling clouds on Jupiter, do you see vortices? This is the question posed by the Jovian Vortex Hunter citizen science project, which invites participants to examine Juno spacecraft images of Jupiter’s mesmerizing clouds. This project aims to advance our understanding of how Jovian vortices like the famous Great Red Spot form and evolve over time. Recently, Ramanakumar Sankar (University of California, Berkeley) and collaborators presented the project’s first results, which were drawn from more than a million classifications made by roughly 5,000 participants. The volunteers identified, located, and described 7,000 vortices, and their annotations led to some surprising findings, including an apparent correlation between the color of the vortex — related to its chemistry — and its size and location. For example, white or brown vortices seem to be larger than red or cloud-free vortices, and while white and cloud-free vortices tend to linger near the poles and brown vortices span moderate latitudes, red vortices crop up in specific latitude bands. To learn more about the results of this citizen study, and to see what the team plans to do next, be sure to check out the full research article linked below.
Citation
“Jovian Vortex Hunter: A Citizen Science Project to Study Jupiter’s Vortices,” Ramanakumar Sankar et al 2024 Planet. Sci. J. 5 203. doi:10.3847/PSJ/ad6e75
The post Featured Image: Finding Swirls on Jupiter appeared first on AAS Nova.
]]>
Does the standard cold dark matter model of the universe work on small scales? The dark matter distributions of ultra-faint dwarf galaxies seem to deviate from what is expected, implying a need to rethink how dark matter behaves.
The post Down to the Core: Dark Matter Deviations in Ultra-Faint Dwarf Galaxies appeared first on AAS Nova.
]]>Though the majority of the mass in the universe lies in dark matter, many mysteries remain about its nature. A new study suggests that the smallest and faintest galaxies hold the key to unlocking how dark matter interacts within the universe.
Core-Cusp Conundrum
Surrounding the Milky Way are tiny faint galaxies — known as satellite galaxies — millions of times smaller than the massive galaxy they orbit. Despite their small sizes, these satellites are of huge importance in understanding the behavior of dark matter. In the leading cosmological model, called lambda cold dark matter (ΛCDM), dark matter is cold, collisionless, and interacts with normal matter only by way of gravity.

From simulations, the expected shape (cusp) of a galaxy’s dark matter density profile is shown with the red curve, while the observed shape (core) is shown with the blue curve. As we approach the galactic center, a cuspy profile peaks at high density, and the cored profile levels off at a lower density. Click to enlarge. [Lexi Gault]
However, according to ΛCDM, there should exist very low-mass galaxies — like the faintest satellite galaxies that orbit the Milky Way — that do not have enough mass to change an originally cuspy dark matter distribution into a cored one. If observations reveal that even these small galaxies have cored dark matter distributions, that may mean that dark matter may not behave as expected in the ΛCDM paradigm.
Dark Matter Distributions
In order to investigate dark matter distributions at the smallest scales, Jorge Sánchez Almeida (Institute of Astrophysics of the Canary Islands; University of La Laguna) and collaborators analyze the stellar count distribution of six ultra-faint dwarf satellites of the Milky Way and the Large Magellanic Cloud. These galaxies have cored stellar surface density distributions, suggesting that their underlying dark matter distributions may be cored as well.

Histograms showing how each considered dark matter profile compares to the observations, where NFW corresponds to a cuspy distribution, Plummer corresponds to a cored distribution, and the ρ230 is in the middle of the two. The the histograms plot the distributions of the innermost slopes for the fits where a slope close to 0 means the profile flattens, and a more negative slope means a steeper rise in the center. The cored (Plummer) fit aligns best with the observed galaxies. Click to enlarge. [Modified from Sánchez Almeida et al 2024]
Beyond Standard
Given that a cored dark matter distribution seems to fit best for these ultra-faint galaxies, the authors suggest that dark matter may not behave as the standard cold dark matter model anticipates. Instead, dark matter may be warm, self-interacting, or fuzzy. However, could other factors be driving the cored distributions of these galaxies?
The author’s analysis hinges on several assumptions that could blur their results. To address these concerns, they carefully consider properties like stellar feedback contributions, tidal interactions, velocity distributions, and other properties important to their analysis. When changing these assumptions slightly, in ways still physically reasonable for very low-mass galaxies, the ultra-faint dwarfs still appear to reside in cored dark matter distributions.
What does this mean? While the standard ΛCDM model explains large-scale structures of the universe well, it does not adequately characterize what is observed on smaller scales — like the Milky Way’s satellites. Though the exact nature of dark matter is still unknown, cold and collisionless dark matter does not likely produce the ultra-faint galaxies’ cored profiles. Thus, further studying the lowest-mass galaxies in the universe may reveal new characteristics of dark matter beyond the standard model.
Citation
“The Stellar Distribution in Ultrafaint Dwarf Galaxies Suggests Deviations from the Collisionless Cold Dark Matter Paradigm,” Jorge Sánchez Almeida et al 2024 ApJL 973 L15. doi:10.3847/2041-8213/ad66bc
The post Down to the Core: Dark Matter Deviations in Ultra-Faint Dwarf Galaxies appeared first on AAS Nova.
]]>
Researchers have identified dozens of stars tidally disrupted by black holes, and upcoming surveys may discover 1,000 of these rare events each year. Today's Monthly Roundup introduces three studies that have advanced our understanding of shredded stars.
The post Monthly Roundup (Halloween Edition): Graveyards of Shredded Stars appeared first on AAS Nova.
]]>There are many ways for a star to meet its end: suddenly and spectacularly, as a supernova; gradually and gracefully, as a white dwarf wreathed in a planetary nebula; and gruesomely, torn apart by a black hole. Tidal disruption events, in which a star gets too close to a black hole and is ripped apart by tidal forces, play out over the course of months or years in galaxies across the universe.
First predicted by theorists in the 1970s, the first tidal disruption event candidate was discovered in X-ray data collected in 1990–1991 by the ROSAT All Sky Survey. While early candidates were identified by their bright, transient X-ray emission, the majority of candidates today are found by optical surveys. As the number of known tidal disruption events grows, so does the diversity of these events, creating new sub-classes like partial tidal disruption events, in which just a fraction of a star’s atmosphere is torn away, or repeating tidal disruption events, in which a star is progressively peeled apart each time it draws near a black hole.
Researchers have analyzed observations of dozens of tidal disruption events, and the number of known events is growing rapidly thanks to wide-field searches for astrophysical transients. The upcoming Rubin Observatory’s Legacy Survey of Space and Time alone is predicted to discover 1,000 tidal disruption events per year. Today, we’ll explore three research articles that probe various aspects of tidal disruption events, seeking to understand these untimely ends of unsuspecting stars.
Signature of a Tilted Disk
When a supermassive black hole rips a star apart, some of the star’s gas is cast off into the galaxy, and some of it collects in an accretion disk around the black hole. This searingly hot disk is the source of the ultraviolet and X-ray emission we see from afar, and variations in the disk’s emission can tell us about the particular characteristics of a tidal disruption event.

Demonstration of the event’s different behavior at X-ray (top) and ultraviolet (bottom) wavelengths. Click to enlarge. [Adapted from Cao et al. 2024]
To learn more, Cao’s team analyzed and modeled ultraviolet and X-ray observations of AT 2020ocn from Swift Observatory, XMM-Newton, and the Neutron star Interior Composition Explorer (NICER). The team found that AT 2020ocn’s behavior can be explained by a star that was initially traveling at an angle relative to the direction of the black hole’s spin, producing an accretion disk tilted in the same direction as the star’s motion. Over time, the inner part of the disk becomes aligned with the black hole’s spin, making the disk precess over time and changing its orientation from our point of view. The timeframe of these changes match what’s predicted as well: flares lasting 1–10 days, with the flaring behavior persisting for less than 200 days overall.
Cao and coauthors noted that their modeling has limitations. For example, the model handles a change in the disk’s tilt by changing the observer’s position rather than manipulating the actual tilt of the disk, which may not fully capture the dynamic behavior of a tilted, precessing disk. Similarly, it’s possible that the inner disk is also warped, creating a complicated scenario in which the disk periodically partially obscures itself.
In addition to enhancing our understanding of AT 2020ocn’s behavior, the team’s findings may apply to other tidal disruption events with flares that turn off after a few months and ultraviolet emission that doesn’t flare at all.
Modeling a Missing Structure
While the bright ultraviolet and X-ray emission of a tidal disruption event is readily explained by a super-heated accretion disk circling a black hole, the origins of these events’ optical emission is less understood. The optical emission from a tidal disruption event appears to arise from surprisingly cool, slow-moving gas tens to hundreds of astronomical units from the black hole. Where is this emission coming from?

The evolution of the gas column density over the course of a year during a tidal disruption event. You can see an animation of this figure here. [Price et al. 2024]
Over time, the outflow takes the shape of a thin expanding bubble. This structure closely resembles a hypothesized featured called an Eddington envelope, which is thought to capture high-energy emission from the disk and accretion stream, reprocessing it to generate the optical emission researchers observe. This is the first time such a structure has formed self-consistently in simulations, representing a breakthrough in the understanding of tidal disruption event emissions.
A Chemical Conundrum
In addition to illuminating the physics of accretion and outflows in general, tidal disruption events can also clue us in to the properties of individual stars. Tidal disruption events often show prominent spectral lines, allowing researchers to study the chemical compositions of individual stars in the cores of distant galaxies — a population that’s otherwise difficult to examine closely.
The chemical analyses of certain tidal disruption events have revealed surprisingly large ratios of nitrogen to carbon (N/C ratio) in the disrupted stars. As Brenna Mockler (The Observatories of the Carnegie Institution for Science) and collaborators explain, a high N/C ratio seems to suggest that the disrupted star was a relatively massive one (>2 solar masses), bulky enough for the CNO cycle to take place in its interior. The CNO cycle produces energy by fusing hydrogen into helium and shifts the proportions of carbon and nitrogen, gradually increasing the amount of nitrogen relative to carbon. However, recent research suggests that the N/C ratios of certain events are even larger than what’s expected for the disruption of a massive star.

Comparison of the N/C ratios relative to the solar value for stripped stars (red lines; the different line styles represent stars at different stages of their helium-burning lifetimes) and normal stars (blue lines; the different line styles represent results for different metallicities). Click to enlarge. [Mockler et al. 2024]
The team found that the 2-solar-mass main-sequence stars, regardless of metallicity, could not attain the extreme N/C ratios seen in some events. For example, the tidal disruption event ASASSN-14li appears to have an N/C ratio greater than 300 times the Sun’s ratio. This is similar to the predicted N/C ratio for stripped stars but 10 or more times larger than predictions for a 2-solar-mass main-sequence star. The N/C ratios of tidally disrupted stripped stars appear to decrease over time, while the observed N/C ratios of normal main-sequence stars were found to increase over time, providing another avenue to determine the identity of a star after its demise.
Citation
“Tidal Disruption Event AT2020ocn: Early Time X-Ray Flares Caused by a Possible Disk Alignment Process,” Z. Cao et al 2024 ApJ 970 89. doi:10.3847/1538-4357/ad496f
“Eddington Envelopes: The Fate of Stars on Parabolic Orbits Tidally Disrupted by Supermassive Black Holes,” Daniel J. Price et al 2024 ApJL 971 L46. doi:10.3847/2041-8213/ad6862
“Tidal Disruption Events from Stripped Stars,” Brenna Mockler et al 2024 ApJL 973 L9. doi:10.3847/2041-8213/ad6c34
The post Monthly Roundup (Halloween Edition): Graveyards of Shredded Stars appeared first on AAS Nova.
]]>
Astrobites reports on tests of cosmological models using measurements of nearly 2,000 supernovae from the Dark Energy Survey and other sources.
The post Testing Cosmology with the Dark Energy Survey Five-Year Supernova Dataset appeared first on AAS Nova.
]]>Editor’s Note: Astrobites is a graduate-student-run organization that digests astrophysical literature for undergraduate students. As part of the partnership between the AAS and astrobites, we occasionally repost astrobites content here at AAS Nova. We hope you enjoy this post from astrobites; the original can be viewed at astrobites.org.
Title: The Dark Energy Survey: Cosmology Results with ~1500 New High-Redshift Type Ia Supernovae Using the Full 5-Year Dataset
Authors: Dark Energy Survey Collaboration
Status: Published in ApJL
The Dark Energy Survey (DES) Collaboration is an international team of scientists that aims to measure and understand the nature of an elusive energy density component in the universe, dark energy. The DES was conducted using the 4-metre Blanco Telescope at the Cerro Tololo Inter-American Observatory in Chile and took observations from 2013 to 2019. The survey used a special camera called the Dark Energy Camera (DECam). DECam has a wide field of view (about 14 times the size of the full Moon in the sky), allowing for detection of galaxies over a large sky area. It also allows for sensitive measurements of the redshifted light from these galaxies with a 570-megapixel camera with 74 CCDs with minimal readout noise in the measurements. This research article specifically focuses on the results of the DES supernova survey (more about their other survey data can be seen here), which was designed to test cosmology with a large sample of supernova observations.
In 1998, two teams of scientists measuring the brightness of supernovae unexpectedly discovered anomalously faint supernovae at specific times in the earlier universe, indicating that the universe is accelerating in its expansion (they got a Nobel Prize for this discovery). Before 1998, cosmologists believed in three possibilities for future expansion of the universe: it would either stop and reverse (resulting in a collapse), it would come to a halt (resulting in a static universe), or it would reach a constant expansion rate. These scenarios assumed the universe only consisted of matter being influenced by gravity and radiation.
The discovery of an accelerating expansion changed this. Type Ia supernovae have a standard brightness, which allows us to determine their distance based on how faint they look in a telescope. We can also measure the redshift of supernovae from spectra, which can be compared to predictions from cosmological models that relate the redshifting of the light to the universe’s expansion rate over time and how far the light has travelled. Thus, we can plot the observed redshifts of the supernovae against their distance (from the measurements of their brightness). This plot is known as a Hubble diagram and can be used to fit a cosmological model. In today’s article, the DES Collaboration has done exactly this to test cosmological models. This time, however, instead of only the 52 supernovae that the discoverers of dark energy had in 1998, there are 1,635 supernovae in the DES five-year dataset — more than 30 times more!
Lighting the Way with the Universe’s Candles
The 1,635 supernovae found and used by DES (after quality cuts) cover redshifts greater than z ~ 0.1, so 194 Type Ia supernovae from samples external to DES are included in the data analysis to cover low redshifts (see Figure 1). In total, this resulted in an analysis of 1,829 supernovae. Part of the cuts to the data involved removing contaminants — transients that look like Type Ia supernovae but might actually be something else. In order to distinguish between the Type Ia supernovae and the contaminants, two machine-learning classifiers were used; they were trained on simulated Type Ia supernova light curves or Type II (core-collapse) supernova light curves (see more about different supernova classification in this bite and Type Ia light curves here).

Figure 1: The Hubble diagram of the DES supernovae from the five-year sample (blue points) and the external data (orange points) used in the analysis. The lower panel shows the difference from the measured and theoretical distance moduli for the best fit to a time-varying dark energy model. [DES Collaboration 2024]
Hints of Time-Varying Dark Energy?
In the standard model of cosmology, ΛCDM, dark energy is assumed to have a constant energy density — i.e., a cosmological constant. This model has been favoured by DES data previously. Furthermore, the results from measurements of the cosmic microwave background by the Planck space mission have preferred this model, and a ΛCDM model with zero curvature — that is to say, the universe has a flat geometry meaning that two parallel beams of light will stay parallel as they propagate through spacetime. If the universe has a curved geometry, the beams can eventually diverge or cross over (see more description here). However, the DES collaboration tests the data with various models: standard ΛCDM, a “flat” ΛCDM (zero curvature is assumed), and two time-varying dark energy models (also with the flat assumption).
The tests on the DES data alone and with combinations of external data for standard ΛCDM and flat ΛCDM find results consistent with those found previously for the matter density of the universe and the curvature — the fitted values are equal to those found previously by Planck within ~95% confidence bounds.
However, the story changes slightly for the time-varying dark energy models. In the first, wCDM allows dark energy to vary over time, letting the equation-of-state parameter, w, vary as a free parameter instead of being fixed to w = −1. In the second model, w0waCDM, the equation of state is modelled with a redshift dependence. One should find in the first model that w = −1, or in the second model that w0 = −1 and wa = −1, to be consistent with a cosmological constant dark energy. These constraints are not exactly favoured by the DES data and combinations, as shown by Figure 2 below.

Figure 2: Contours (best fit-regions in the parameter space) and likelihoods (conditional probability distributions for the fits to the parameters) for the fits to the matter density, Ωm, and dark energy equation of state parameters, for the w0waCDM model. The different coloured contours and likelihoods represent the different data combinations indicated by the legend. [DES Collaboration 2024]
While we can’t confidently state from these results that dark energy must be time varying, these results here could be a hint at new physics to be discovered by cosmology in the future — but only further analysis and data can tell.
Original astrobite edited by Kylee Carden.
About the author, Abbé Whitford:
I am a third-year PhD student at the University of Queensland, studying large-scale structure cosmology with galaxy clustering and peculiar velocities, and using large-scale structure to measure the properties of neutrinos.
The post Testing Cosmology with the Dark Energy Survey Five-Year Supernova Dataset appeared first on AAS Nova.
]]>
The collapse of a magnetar into a black hole may power the strongest shocks in the universe and produce brief, bright flashes of gamma rays.
The post Monster Shocks from Collapsing Magnetars appeared first on AAS Nova.
]]>The collapse of an extremely dense, highly magnetized stellar remnant into a black hole is an extreme event. New simulations explore what happens when a magnetar collapses into a black hole, providing a potential connection between these events and gamma-ray bursts.
Becoming a Black Hole
A multi-wavelength view of the Crab Nebula, the remnant of a supernova that birthed a neutron star. The neutron star powers a pulsar wind nebula, shown in blue. [X-Ray: NASA/CXC/J.Hester (ASU); Optical: NASA/ESA/J.Hester & A.Loll (ASU); Infrared: NASA/JPL-Caltech/R.Gehrz (Univ. Minn.)]
This process can be nearly instantaneous, the merger remnant shrinking down to a black hole in just milliseconds. Sometimes, though, the merger remnant survives for several hours, coalescing into a rapidly spinning, highly magnetized neutron star called a magnetar. As the magnetar sheds energy through its outflowing magnetized wind, it’s no longer able to support itself, and it collapses into a black hole. What a distant observer might see when this happens is not yet clear.
Waves, Shocks, and Rays
To understand what happens during a magnetar’s collapse, Elias Most (California Institute of Technology) and collaborators turned to complex general relativistic magnetohydrodynamic simulations. Magnetar collapse been modeled before, but this study improves upon previous work by tackling a full magnetohydrodynamic approach to the problem, allowing the team to investigate the role that shocks play during and after the collapse. Because astrophysical shocks provide a way to accelerate particles and generate high-energy radiation, a powerful shock from a collapsing magnetar could be a source of gamma-ray bursts: brief, powerful flashes of gamma rays of unknown origin.

Magnetohydrodynamic waves in the magnetosphere after the magnetar collapses. The newborn black hole is at the center, and its spin axis lies along the z-axis. Green lines show the magnetic field. [Most et al. 2024]
Bundles of Bursts
The team’s simulations showed that a hot, powerful, magnetized electron–positron plasma outflow explodes outward in the wake of the monster shock. As they hurry outward, the electron–positron pairs collide, annihilating one another and releasing gamma rays. This flash of gamma rays likely lasts a few milliseconds, similar to the duration of many gamma-ray bursts.
To make this possibility even more interesting, Most and collaborators showed that the newborn black hole’s ring-down — a fleeting period in which the event horizon of the black hole vibrates — would imprint slight variability on the gamma-ray signal. This could explain the tiny variations seen in some gamma-ray bursts.
Not only does this scenario predict the formation of a powerful gamma-ray burst, it might also produce another type of mysterious astrophysical signal: a fast radio burst. This connection is only tenuous, as Most’s team notes that plasma surrounding the collapsed magnetar would likely swallow the radio signal before it escaped. Only under certain conditions could a fast radio burst or a gamma-ray burst escape the plasma’s grasp and make its way to our telescopes.
Citation
“Monster Shocks, Gamma-Ray Bursts, and Black Hole Quasi-normal Modes from Neutron-Star Collapse,” Elias R. Most et al 2024 ApJL 974 L12. doi:10.3847/2041-8213/ad7e1f
The post Monster Shocks from Collapsing Magnetars appeared first on AAS Nova.
]]>
Space is filled with structures that we can't see directly. How do astronomers trace the underlying dark-matter distribution of the universe?
The post Tracing Huge, Distant Structures in the Universe appeared first on AAS Nova.
]]>Galaxies are arrayed along strands of dark matter. New research uses cosmological simulations to explore which galaxies are the best tracers of these dark-matter filaments.
Seeking the Invisible Trees
Trying to figure out the large-scale structure of the universe is a bit like trying to map a forest from within it — except most of the trees are invisible. The luminous galaxies that populate our universe tend to be arranged along strands of invisible dark matter: a hypothetical form of matter that appears to interact with normal matter only gravitationally. While we can readily spot the galactic beacons, the underlying structure is more difficult to determine.
Mapping out the large-scale dark-matter structure of the universe is critical for being able to test our theories of cosmology. What’s the best way to map the dark-matter distribution in our universe?
Simulating Structure
Sang Hyeok Im (Seoul National University) and collaborators investigated the dark-matter-tracing abilities of two types of galaxies: Lyman-alpha emitters and Lyman-break galaxies. These are high-redshift galaxies that can be identified using photometry rather than spectroscopy, requiring (relatively) little telescope time to map their positions.

Example spectral energy distributions for Lyman-break galaxies at three different redshifts. [Im et al. 2024]
Promising Probes
Using a structure-finding code, Im’s team first extracted the simulated three-dimensional dark-matter structure — the “invisible trees” that astronomers hope to probe through observations. Then, they determined the distributions of Lyman-alpha emitters and Lyman-break galaxies around those dark-matter filaments. As a comparison, they also calculated how concentrated the dark-matter particles themselves were around the dark-matter filaments.

Example of the filaments traced by dark matter (orange), Lyman-alpha emitters (red), Lyman-break galaxies (blue), and massive galaxies (green). The underlying dark-matter distribution is shown in the background of each image. Click to enlarge. [Im et al. 2024]
Critically, Im’s team found that Lyman-alpha-emitting and Lyman-break galaxies mirror the distribution of the general galaxy population, showing that the galaxy types studied here are an appropriate tracer of the underlying dark-matter distribution. Im and collaborators suggest that Lyman-alpha emitters are an especially promising way to trace fine filamentary structures, since the narrow-band observations used to select these galaxies allow for a more refined redshift estimate.
This work has determined that two types of commonly detected high-redshift galaxies trace the three-dimensional structure of the cosmic web. Future work will examine the two-dimensional distributions of the different galaxy types to provide a way to compare the statistical properties of the distributions against observations, such as those from the ODIN survey.
Citation
“Testing Lyα Emitters and Lyman-Break Galaxies as Tracers of Large-Scale Structures at High Redshifts,” Sang Hyeok Im et al 2024 ApJ 972 196. doi:10.3847/1538-4357/ad67d2
The post Tracing Huge, Distant Structures in the Universe appeared first on AAS Nova.
]]>
A data-driven approach identifies stars with interesting infrared emission without relying on computationally expensive modeling.
The post Searching Five Million Stars for Disks, Debris, and Dyson Spheres appeared first on AAS Nova.
]]>Main-sequence stars with brighter than expected mid-infrared emission can signal the presence of a debris disk, rubble from planetary collisions, or even a theorized sign of a technologically advanced civilization. New research demonstrates a data-driven method to identify mid-infrared excesses in main-sequence stars.
An Excess of Emission

This image combines observations from the Hubble Space Telescope and the Atacama Large Millimeter/submillimeter Array to show the dusty debris disk surrounding the star Fomalhaut. [ALMA (ESO/NAOJ/NRAO). Visible light image: the NASA/ESA Hubble Space Telescope A. Fujii/Digitized Sky Survey 2. Acknowledgment: Davide De Martin (ESA/Hubble); CC BY 4.0]
Mid-infrared excesses are hypothesized to signal something even wilder: the presence of a Dyson sphere — a hypothetical artificial structure created by an advanced civilization to harness the power of their home star. Similar to dust and rubble, the components of a Dyson sphere would collect starlight and re-emit it at infrared wavelengths, potentially producing a mid-infrared bump.
Regardless of the cause, excess mid-infrared emission from mature Sun-like stars is something to investigate. But how do we find stars with this feature?
Taking Cues from Data
Gabriella Contardo (International School for Advanced Studies, Italy) and David Hogg (New York University; Flatiron Institute; Max Planck Institute for Astronomy) began their search for mid-infrared excesses with an expansive set of observations from the Gaia spacecraft, the Two Micron All Sky Survey, and the Wide-field Infrared Survey Explorer (WISE). After trimming these data sets down to include only main-sequence Sun-like stars, and to exclude objects that might be contaminated by close neighbors or are too dusty, they reduced the number of stars in their sample from 18,751,187 to 4,898,812.

Difference between observed and predicted magnitude in the WISE W1 and W2 bands (3.4 and 4.6 microns, respectively). Click to enlarge. [Adapted from Contardo & Hogg 2024]
Their data-driven method involves splitting the five million stars into eight sub-samples, each of which is used to train a separate random forest algorithm. Each algorithm “learns” what the mid-infrared emission “should” be from the stars in its sample, then predicts the mid-infrared emission of the stars in the other seven sub-samples. When a star’s actual mid-infrared emission is brighter than predicted, it gets flagged.
To Be Continued

Locations of the 53 stars in the final mid-infrared excess sample. Click to enlarge. [Contardo & Hogg 2024]
What happens now? To identify the stars that are the most promising hosts of extreme debris disks, Contardo and Hogg listed ways to pin down the ages of the stars in their sample, which may rule out stars whose mid-infrared excess is due to their youth. They also proposed to compare the mid-infrared behavior of their stellar sample to Dyson sphere models, exploring whether the observed stellar behavior matches the predictions for these hypothetical structures.
Citation
“A Data-Driven Search for Mid-infrared Excesses Among Five Million Main-Sequence FGK Stars,” Gabriella Contardo and David W. Hogg 2024 AJ 168 157. doi:10.3847/1538-3881/ad6b90
The post Searching Five Million Stars for Disks, Debris, and Dyson Spheres appeared first on AAS Nova.
]]>
Astrobites reports on an analysis of the orbital architecture of JWST’s first directly imaged exoplanet using time-series photometry data from the Transiting Exoplanet Survey Satellite.
The post Star Alignment and a Planet’s Origin: The Case of HIP 65426 appeared first on AAS Nova.
]]>Editor’s Note: Astrobites is a graduate-student-run organization that digests astrophysical literature for undergraduate students. As part of the partnership between the AAS and astrobites, we occasionally repost astrobites content here at AAS Nova. We hope you enjoy this post from astrobites; the original can be viewed at astrobites.org.
Title: HIP 65426 Is a High-Frequency Delta Scuti Pulsator in Plausible Spin–Orbit Alignment with Its Directly Imaged Exoplanet
Authors: Aldo G. Sepulveda et al.
First Author’s Institution: University of Hawaiʻi at Mānoa
Status: Published in AJ
What Is HIP 65426?
HIP 65426 is a star relatively close to Earth, and it has a giant planet called HIP 65426b orbiting around it that has been directly imaged. You might recall HIP 65426b from a JWST early science release, as it was the first exoplanet directly imaged by JWST.
The star itself is part of a group of young stars called the Lower Centaurus–Crux (LCC) moving group, which is around 10–23 million years old, but scientists estimate HIP 65426 to be around 14 million years old using different methods. This star rotates very quickly and shows signs of potential pulsations in its brightness. Confirming these pulsations, known as δ Scuti pulsations, could help determine the star’s age more precisely. Determining ages of stars is actually surprisingly difficult, so any method that can accurately predict ages is very intriguing to astronomers.
Now switching gears briefly, planet HIP 65426b is located relatively far from the star, between 62 and 120 times the distance between Earth and the Sun. Its orbit is tilted at a significant angle relative to our line of sight. This is particularly interesting because the alignment between a star and its orbiting companions, like planets or brown dwarfs, can tell us more about how these systems formed and evolved.
A recent work revealed that misalignments are common with brown dwarfs, but the orbits of giant planets tended to be aligned or nearly aligned with the spins of their host stars. Understanding whether planets like HIP 65426b are aligned with their stars helps us understand planet formation and the history of these systems.
Observing with and Using Data from TESS
Time-series photometry from the Transiting Exoplanet Survey Satellite (TESS) has provided a lot of data about the rotation of stars and any variations in brightness caused by features on their surfaces or by orbiting objects passing in front of them. Time-series photometry also probes for other phenomena, including stellar pulsations and transit events. In this article, the authors use this data, along with some data from direct imaging of the HIP 65426 system, to investigate the orbital inclination of the exoplanet HIP 65426b. They aim to determine whether there is evidence for misalignment between the planet and its host star.
The star was observed by TESS in three different time periods called sectors (Figure 1). These sectors spanned from April 2019 to May 2019, April 2021 to May 2021, and April 2023 to May 2023. Data was collected from the star every 2 minutes during these time periods. The data was analyzed using a software called lightkurve, which helps process and analyze the light curves of stars. To ensure the data are clean and free from contamination, the authors first removed any unusual or outlier data points from the light curves. Then, they examined a region around the star within a radius of 80 arcseconds to see if any nearby objects were affecting the measurements. This is important because contamination from other sources can affect the accuracy of the analysis.

Figure 1: TESS time-series photometry of HIP 65426 for Sectors (a) 11, (b) 38, and (c) 64. [Adapted from Sepulveda et al. 2024]
Identification of the δ Scuti pulsations for Mass and Age Estimations
Several pulsation modes, spanning 28–131 cycles per day, were identified in the star. This is consistent with a high-frequency Scuti pulsator. The presence of these high-frequency Scuti pulsations confirms the young age of HIP 65426 and may even provide an opportunity to estimate its age through detailed asteroseismic modeling, which is beyond the scope of the article.
The authors also investigated the possibility of pulsation timing variations caused by mutual gravitation with an orbital companion. This is typically measurable only for sufficiently massive planets with long enough periods. No such variations were detected, which places an upper limit of 12.8 Jupiter masses on the mass of HIP 65426b.
Stellar Inclination of the Host Star
Using a known relation between the star’s rotation period, its radius, and a measure of its rotational velocity, one can constrain the angle between the star’s rotational axis and our line of sight, also known as stellar inclination. This article uses a Bayesian framework that properly computes the inclination using these parameters. Based on their analysis using values of these parameters from literature (radius from isochrones and rotational velocity from spectroscopy) and TESS measurements (rotation period), the authors place statistical limits on the inclination difference between the star and the planet, the median value being 105 (+7/-9) degrees.

Figure 2: A sample of 100 sky-projected orbits used for fitting the orbit of HIP 65426b. The cyan star represents the position of HIP 65426 and the orange dots represent the relative astrometry of HIP 65426b. [Adapted from Sepulveda et al. 2024]
Orbital Inclination of the Giant Planet
The orbit of the planet was measured out using astrometric measurements from various sources, including high-precision measurements from VLTI/GRAVITY. From MCMC fitting of Keplerian orbits using the Python package orbitize, the median orbital inclination is estimated to be 108 (+6/-3) degrees, consistent with recent studies of the system although different input measurements were used in this work. Orbits drawn from the fitting process are shown in Figure 2.
Is There a Misalignment?
Figure 3 says no! Here the authors compared the inclination of HIP 65426b with the inclination of its host star. As the plot shows, the stellar and planetary orbital inclinations line up within their uncertainties, and hence there’s a lack of evidence for a misalignment, just a small star–planet obliquity as suggested by the roughly 3-degree difference in inclination.

Figure 3: The normalized orbital and stellar inclination posteriors for the HIP 65426 system. The purple histogram corresponds to the orbital inclination of the planet and the gray plot represents the stellar inclination of the host star. [Sepulveda et al. 2024]

Figure 4: Comparison of orbital inclinations and host-star inclinations for six directly imaged exoplanet systems comprising 11 total companions. [Sepulveda et al. 2024]
Now, What Can We Tell About the Formation of HIP 65426b?
There are two key models that explain how planets could form: core accretion and disk instability. Core accretion does not really explain how this planet is born because it is farther away from the host star than the region where core accretion would take place. The lack of evidence for misalignment also disfavors the core-accretion scenario. Given the large orbital eccentricity, planet–planet scattering could be a possible mechanism. This scenario suggests that the planet formed closer to its star via core accretion and was then scattered to its current position by the gravitational interactions with other planets in the system. However, planet–planet scattering typically results in orbits being tilted relative to each other, which isn’t the case here, so the lack of significant misalignment between the HIP 65426b’s orbit and its star’s rotation axis doesn’t strongly support this idea.
It is important to note that these theories are not conclusive. The current data don’t provide complete information about the system’s geometry, so it’s still possible that the star’s actual tilt might be larger than what’s currently estimated. Additionally, the orbital eccentricity is not yet concretely determined, so further astrometric measurements can change our current geometric understanding of the system.
The Big Picture
This article describes yet another work that combined space-based brightness data and direct imaging data to understand other planetary systems well after they have formed and understand the implications of their obliquity. With new missions and exoplanet surveys, new systems will be discovered that will also usher in more similar studies of inclinations and orbital architecture.
Original astrobite edited by Amaya Sinha.
About the author, Maria Vincent:
Maria is a PhD candidate in astronomy at the Institute for Astronomy, University of Hawai’i at Manoa. Her research focuses on adaptive optics and high-contrast imaging science and instrumentation with ground-based telescopes. Driven by a fascination with planet formation and the intricate processes shaping our solar system, she uses the Subaru Coronagraphic Extreme Adaptive Optics suite to observe and study morphological features of protoplanetary disks in near-infrared wavelengths, aiming to understand disk structure and processes governing planet formation. On the instrumentation side, she is working on designing and constructing an optical testbed to test and characterize a new deformable mirror as part of the upcoming High-order Advanced Keck Adaptive Optics upgrade. Outside of work, she enjoys blogging, mystery, historical and science fiction literature and cinemedia, photography, hiking, and travel.
The post Star Alignment and a Planet’s Origin: The Case of HIP 65426 appeared first on AAS Nova.
]]>
Nineteen nearby spiral galaxies surveyed by JWST are presented in one grand ensemble along with a customized image-processing pipeline.
The post Featured Image: Bringing PHANGS Data to Life appeared first on AAS Nova.
]]>You may have seen these images individually, but here they are in one grand ensemble: the 19 nearby spiral galaxies surveyed with JWST by the Physics at High Angular resolution in Nearby GalaxieS (PHANGS) collaboration. These galaxies have also been observed with the Atacama Large Millimeter/submillimeter Array, the Very Large Array, and the Hubble Space Telescope, providing a multi-wavelength view of some of the Milky Way’s neighbors. The JWST images (click the image above for the full view) show filamentary structures of warm gas and reveal young star clusters that were hidden in previous observations. In this article, Thomas Williams (University of Oxford) and collaborators present the full PHANGS–JWST dataset and describe the image-processing pipeline developed for these observations. Though there already exists an official pipeline for processing JWST data, the authors’ method provides an alternative that is particularly well suited to observations of bright, extended objects such as nearby galaxies. This project is open source, meaning that all are welcome to squash bugs and suggest improvements. To learn more about the processing method that led to these fantastic images, be sure to check out the full article linked below.
Citation
“PHANGS-JWST: Data-processing Pipeline and First Full Public Data Release,” Thomas G. Williams et al 2024 ApJS 273 13. doi:10.3847/1538-4365/ad4be5
The post Featured Image: Bringing PHANGS Data to Life appeared first on AAS Nova.
]]>
While Type Ia supernovae have been used to determine cosmological distances and study the expansion of the universe, their origins are still under investigation. Recent simulations point to a double-detonation scenario being the catalyst for some of these extremely energetic events.
The post On the Run: Hypervelocity Stars and Their Links to Type Ia Supernovae appeared first on AAS Nova.
]]>As the Gaia spacecraft has mapped more and more of the Milky Way, astronomers have uncovered some of the fastest-moving stars in the galaxy. Can simulations link these stars to the elusive origins of Type Ia supernovae?
Type Ia Supernova Origins
Occurring in binary star systems with at least one white dwarf, Type Ia supernovae are key cosmological distance indicators and have allowed astronomers to study the expansion of the universe. Despite their importance, the details behind these explosions and the characteristics of their progenitor systems remain unclear.
One proposed mechanism to launch a Type Ia supernova is the double-detonation scenario, in which the white dwarf accretes helium from a helium-rich donor star. Forming a thin shell around the carbon-oxygen core, the siphoned helium eventually detonates, sending shock waves through the core, causing it to also detonate. In the wake of the powerful explosion, the donor star launches across the Milky Way, forever changed.
Recent Gaia discoveries of a runaway helium-burning star and hypervelocity stars — stars that zoom through the galaxy much faster than the general stellar population — suggest that the double-detonation scenario may be responsible for a number of Type Ia supernovae. Can double-detonation simulations predict the observed properties of these fast-moving stars, further uncovering Type Ia supernova origins?
Supernova Ejecta Effects

Simulation snapshots showing fraction of donor material (left) and total density (right) for a helium white dwarf donor model. The bottom panel shows that, though much of the donor’s material has expanded, a large fraction is still bound to the donor star as indicated by the gray lines in the left panel. The impacts of shock waves can be seen as concentric shells in the density distribution on the right. Click to enlarge. [Wong et al. 2024]
The authors’ analysis shows that as the supernova ejecta crashes into the donor star, some of the donor star’s material is swept up and pulled in the direction of the supernova’s propagation. The supernova shock wave passes through the donor star, both compressing and pushing the star away from the explosion center. As the shock front moves on, the donor star attempts to return to equilibrium, contracting and expanding, sending smaller shock waves into its surroundings.
For each progenitor stellar type simulated, the authors find that the donor stars become puffed up with lower densities and larger radii. The donors also lose some of their original mass but acquire a small portion of supernova ejecta material — consistent with the observed metal-polluted atmospheres and larger radii of hypervelocity stars.

Postexplosion evolution for each simulated donor star type (labeled in figure legend) in luminosity-temperature space (Hertzsprung-Russell diagram). Four observed stars of interest are plotted, showing intriguing agreement between the well-studied hypervelocity star D6-2 and the expected evolution for a helium white dwarf donor companion. Click to enlarge. [Wong et al. 2024]
Postexplosion Evolution
Particularly important to the identification of donor stars in the field is how these stars evolve over longer timescales and how we may observe them today. The authors performed further simulations to track the temperature and luminosity changes for each simulated donor star from ~10 years to 100 million years after the supernova event. Intriguingly, some of the observed hypervelocity stars seem to fall near the predicted evolutionary tracks, suggesting that these stars could have been ejected by Type Ia supernovae.
This study provides important evidence for the possible double-detonation scenario of Type Ia supernovae. As simulations continue to improve, the ability to identify the progenitor systems of these energetic events becomes more promising.
Citation
“Shocking and Mass Loss of Compact Donor Stars in Type Ia Supernovae,” Tin Long Sunny Wong et al 2024 ApJ 973 65. doi:10.3847/1538-4357/ad6a11
The post On the Run: Hypervelocity Stars and Their Links to Type Ia Supernovae appeared first on AAS Nova.
]]>
New observations show that Gliese 229 B is two brown dwarfs rather than one, resolving the mismatch between its measured mass and predictions of evolutionary models.
The post Gliese 229 B’s Newfound Companion Solves Brown Dwarf Mystery appeared first on AAS Nova.
]]>Astronomers recently discovered a companion to Gliese 229 B, the first confidently identified brown dwarf. This discovery resolves the conflict between Gliese 229 B’s observed mass and the predictions of evolutionary models, potentially illuminating the nature of other poorly understood brown dwarf systems as well.
First in Its Class

An illustration of a brown dwarf. Brown dwarfs aren’t actually brown, likely spanning a range of colors from reddish-orange to nearly black. [NASA/JPL-Caltech]
While improved telescopes have advanced our understanding of brown dwarfs, there’s still much we don’t know about these objects, and attempts to study and classify brown dwarfs have been confounded by their complex properties. This is the case for the first confirmed T-class brown dwarf, Gliese 229 B, which recently became the subject of an astronomical mystery.
A Mass Mystery
Soon after Gliese 229 B was discovered, researchers used substellar evolution models to interpret the object’s spectrum and luminosity and estimate its mass at 30–50 Jupiter masses. More than two decades later, refined observations of the brown dwarf’s orbit around its red dwarf host star allowed researchers to calculate its mass dynamically. The newly calculated mass — 71 Jupiter masses — was troubling. According to models of how substellar objects cool as they age, it simply wasn’t possible for a 71-Jupiter-mass object of Gliese 229 B’s age to have cooled to its present temperature.

The large relative radial velocity between Gliese 229 A and 229 B and the large difference in Gliese 229 B’s radial velocity between the two time periods provides firm evidence for the existence of an unseen companion. [Whitebook et al. 2024]
Single No More

Likelihood distribution of the orbital period and mass for the companion object. [Whitebook et al. 2024]
In addition to solving the mystery of Gliese 229 B, this discovery may help to explain other seemingly over-massive T dwarfs orbiting main-sequence stars, several of which have been discovered in the past decade. If future work reveals that these too-massive T dwarfs are actually pairs of brown dwarfs, that may suggest that T dwarfs orbiting main-sequence stars are more likely to host companions than T dwarfs in the field, which are usually solo.
Citation
“Discovery of the Binarity of Gliese 229B, and Constraints on the System’s Properties,” Samuel Whitebook et al 2024 ApJL 974 L30. doi:10.3847/2041-8213/ad7714
The post Gliese 229 B’s Newfound Companion Solves Brown Dwarf Mystery appeared first on AAS Nova.
]]>
Astrobites reports on a study that uses JWST to investigate how warm, star-forming molecular gas is blown away by active galactic nuclei.
The post Blowing Away Star Formation with Warm Molecular Gas appeared first on AAS Nova.
]]>Editor’s Note: Astrobites is a graduate-student-run organization that digests astrophysical literature for undergraduate students. As part of the partnership between the AAS and astrobites, we occasionally repost astrobites content here at AAS Nova. We hope you enjoy this post from astrobites; the original can be viewed at astrobites.org.
Title: Blowing Star Formation Away in AGN Hosts (BAH) – I. First Observation of Warm Molecular Outflows with JWST MIRI
Authors: J.H. Costa-Souza et al.
First Author’s Institution: Federal University of Santa Maria
Status: Published in ApJ
One of the key questions in galaxy evolution is why big galaxies are so rare. We see lots of medium-sized galaxies (galaxies about the size of our Milky Way, with about 100 billion stars) but very few truly enormous ones (five or ten times bigger). We believe the answer to this question is feedback. As galaxies get bigger, physical processes occur that shut down further star formation. In the case of big galaxies, the most likely sources of feedback are active galactic nuclei: the supermassive black holes at the centers of galaxies. These objects can produce a truly astonishing amount of energy, and if some of that energy can act on the gas in the galaxy that is trying to form new stars (heating it up, moving it around, or expelling it from the galaxy entirely), it could interrupt star formation enough to explain why we don’t see many big galaxies.
In order to tell if this is happening, we need to study this star-forming gas. Stars are mainly formed from molecular hydrogen gas (H2). This gas comes in different phases: a cold (less than 100K) phase, a warm (100 to 1000K) phase, and a rare hot (more than 1000K) phase. It’s also not just enough to see that the gas is there — we need to see how it’s moving, in all three dimensions, because active galactic nucleus feedback can manifest itself as a large-scale outflow of gas. This is possible with specially designed instruments known as integral field units, which measure a full spectrum of light in each spatial pixel of an image. Provided the gas we’re trying to study emits some sort of spectral line, the integral field unit can measure its velocity towards or away from us using the Doppler shift. This type of analysis is known as galaxy kinematics.
In today’s article, the authors target specifically the warm phase of molecular gas, which thankfully emits a whole series of spectral lines. These lines are mostly rotational lines of the H2 molecule, and they emit in the mid-infrared, which is perfect for targeting with the Mid-Infrared Instrument (MIRI), an integral field unit on JWST. The authors are looking at one specific active galactic nucleus host: UGC 8782. The active galactic nucleus in this galaxy is a low-ionization nuclear emission region, or LINER (astrobites has a full guide on active galactic nucleus classification here), and it’s only about 200 megaparsecs (650 million light-years) away, which, by galaxy standards, is very close. From other optical and radio imaging, the authors figured that UGC 8782 had outflows in at least some phases of gas, which made it likely that it would have a warm molecular gas outflow as well.
What the authors found from their JWST observations was pretty much exactly what they expected: a large-scale outflow in the warm molecular gas of the galaxy. Figure 1 breaks down the emission into components that come from the main disk of the galaxy (which is behaving pretty normally — just doing regular rotation) and components that come from a large-scale outflow from the center of the galaxy. This is mostly apparent in the bulk velocity of the gas (the bottom-center panel), where there are negative velocities where the normal disk rotation has positive velocities, and in the velocity dispersion (the bottom-right panel), which is more than double the typical dispersion of the galaxy in the region where the outflow is occurring. This means that this gas has a lot more energy than the rest of the gas in the galaxy, another sign that it’s interacting with the active galactic nucleus. Not shown is a second outflow that is faster but smaller.

Figure 1: The kinematics of the warm molecular gas in UGC 8782. The gas is broken down into a disk component (top), tracing the regular rotation of the host galaxy, and an outflow component (bottom) of gas being pushed out of the center of the galaxy by the active galactic nucleus. The flux distribution (left), gas velocity (center), and velocity dispersion, or scatter in the velocity (right) are shown for each component. [Adapted from Costa-Souza et al. 2024]

Figure 2: The rate at which mass is being pushed out of the center of the galaxy by the active galactic nucleus (top) and the energy required to push that mass out (bottom), as a function of distance from the active galactic nucleus. Three phases of gas are shown: the warm molecular gas being studied in this article (light blue), the hotter molecular gas (orange), and the ionized gas (dark blue). [Costa-Souza et al. 2024]
An outflow this strong and powerful is fantastic evidence for feedback from an active galactic nucleus acting strongly on the star-forming gas in a galaxy, which means we’re one step closer to understanding the mystery of giant galaxies in the universe — it could be active galactic nucleus feedback causing them not to get made! Still, this is only one galaxy. We’ll have to study many others in the future to see how common this is, but JWST’s MIRI is more than up to the task.
Original astrobite edited by Storm Colloms.
About the author, Delaney Dunne:
I’m a PhD student at Caltech, where I study how galaxies form and evolve by mapping their molecular gas! I do this using COMAP, a radio-frequency line-intensity mapping experiment based in California’s Owens Valley.
The post Blowing Away Star Formation with Warm Molecular Gas appeared first on AAS Nova.
]]>
Widely spaced binary stars may get voted "Least Likely to Interact," but they might surprise you: new research shows that under the right conditions, these distant stellar companions can get catastrophically close.
The post Close Encounters of Distant Stellar Partners appeared first on AAS Nova.
]]>Stars orbiting one another on extremely wide orbits seem destined to remain apart forever — but new research shows that the subtle influence of the Milky Way’s gravitational pull can bring them crashing together.
Loosely Connected Stars
Many stars in our galaxy travel through space with a binary partner, but some binary pairs are closer than others. Surveys suggest that as many as 12% of nearby Sun-like stars are members of wide binary systems with separations of 100 to 100,000 au or more. Unlike close stellar binaries that might influence each other’s evolution through accretion, stellar winds, and radiation, wide binaries are expected to evolve as if their stellar partner didn’t exist.
Though unaffected by their partners, stars in loosely connected binary systems can be swayed by the subtle influence of the Milky Way’s background gravitational pull, or they can be knocked off course by passing stars. How do these factors affect the evolution of wide binary systems?
Unexpectedly Close
A team led by Jakob Stegmann (Max Planck Institute for Astrophysics) used relativistic N-body simulations to study how the background gravitational pull of the Milky Way and nudges from passing stars affect the orbits and evolution of stars in wide binary systems.

Typical outcomes for wide binaries as a function of initial binary separation and distance from the galactic center. Click to enlarge. [Stegmann et al. 2024]
Swept Up in the Galactic Tide
Many of the binaries underwent wild eccentricity oscillations that brought their orbits from nearly circular to narrow and elongated. This means that initially widely separated stars can undergo close encounters, mass-transfer events, and even mergers.

An example of the evolution of a binary’s separation. This particular binary collided after 2.3 billion years, producing gravitational waves. Click to enlarge. [Adapted from Stegmann et al. 2024]
There are more intricacies to the model results than can be covered in this brief highlight, so be sure to check out the full research article for all the details!
Citation
“Close Encounters of Wide Binaries Induced by the Galactic Tide: Implications for Stellar Mergers and Gravitational-Wave Sources,” Jakob Stegmann et al 2024 ApJL 972 L19. doi:10.3847/2041-8213/ad70bb
The post Close Encounters of Distant Stellar Partners appeared first on AAS Nova.
]]>
JWST observations of giant exoplanet atmospheres, investigations of heating on Io and in asteroids, and a primer on open science brought the final day of DPS 56 to a close.
The post DPS 56: Day 4 appeared first on AAS Nova.
]]>Editor’s Note: This week we’ll be writing updates on selected events at the 56th Division for Planetary Sciences (DPS) meeting happening in Boise, Idaho, and online. The usual posting schedule for AAS Nova will resume on October 14th.
Table of Contents:
- The Open-Source Science Initiative at NASA (J.L. Galache)
- Digging Deep: Unveiling Vertical Mixing and the Core Mass of Giant Exoplanets with JWST (David Sing)
- Tracing the Heating of the Solar System Through Geochemical Signatures (Katherine de Kleer)
The Open-Source Science Initiative at NASA (J.L. Galache)
J.L. Galache (Agile Decision Sciences, NASA HQ) opened the session with a brief primer on open-science initiatives at NASA. Essentially, open science is the act of making your data, software, and publications freely accessible to all. Open science benefits the planetary science community by lowering barriers to entry and enhancing reproducibility of research. (Of course, open science also benefits you because your freely accessible data and publications will be cited more often!) NASA approaches open-science implementation through funding (sunpy and astropy have received funding from NASA, among many other recognizable names in science software), training, and policy. Current policy states that data and software should be made available at the time the research is published, and publications should be made available through a pre-print server (e.g., arXiv) if not being published in an open-access journal. Among the existing training options is Open Science 101, an online training module through which 1,900 people have already been accredited.
Digging Deep: Unveiling Vertical Mixing and the Core Mass of Giant Exoplanets with JWST (David Sing)
David Sing (Johns Hopkins University), winner of the 2024 Alexander Prize for outstanding contributions that have significantly advanced our knowledge of planetary systems, described the journey to understanding exoplanet atmospheres and interiors from Hubble to JWST. Sing focused on the transit method, which has enabled the discovery of thousands of planets beyond our solar system and increasingly allows scientists to probe the atmospheres of those worlds.
With Hubble, scientists were able to test their models of photochemical equilibrium in exoplanet atmospheres, which predicted broad compositional trends with planet temperature. Hubble observations confirmed the basic picture of the chemical composition of hot Jupiters while also revealing complexities like clouds and hazes, which make it difficult to extract chemical abundances from spectra, and the presence of disequilibrium chemistry, which required extra attention from modelers.

The mass–metallicity relationship for solar system planets (black points) and exoplanets (colored points). Click to enlarge. [From slide by David Sing]

JWST spectrum of WASP-39b’s atmosphere and best-fitting model. [From slide by David Sing]
Sing also described the important results from JWST observations of two other exoplanets, HAT-P-18b and WASP-107b. These are both cool/warm gas giants that are expected to have methane in their atmospheres. HAT-P-18b showed no sign of methane in its atmosphere — since the molecule is expected to exist, does this mean it’s being destroyed by photochemistry or by mixing into the deep, hot atmosphere of the planet?
Observations of WASP-107b provided more clues: in addition to CO2 and water, JWST observations of WASP-107b showed at last a hint of methane. However, there was about a thousand times less methane than expected given the planet’s temperature. By modeling both vertical mixing and photochemistry, Sing’s team showed that the methane depletion was due to mixing. Going further with these data, they used interior structure modeling to estimate the mass of the core at 11.5 Earth masses — consistent with predictions of the core accretion model.
Up next is the exoplanet grand tour spectroscopic survey, which will observe 25 exoplanets during 125 hours of JWST time. Stay tuned for news from this survey — the first data are being collected roughly 24 hours after this talk!
Tracing the Heating of the Solar System Through Geochemical Signatures (Katherine de Kleer)
Katherine de Kleer (California Institute of Technology), winner of the 2024 Harold C. Urey prize for outstanding achievements in planetary science by an early-career scientist, described recent work on the history of heating in the solar system. De Kleer and collaborators use the Atacama Large Millimeter/submillimeter Array (ALMA) to understand where, when, and how objects in the solar system were heated and how that drives the chemical evolution of and geological activity on those objects today.
Let’s take things all the way back to the early days of the solar system: in the beginning, there was aluminum-26, a once-abundant, radioactive form of aluminum that heated the infant solar system. Heating from aluminum-26 melted early planetesimals and caused them to differentiate, separating into distinct compositional layers. Some of these planetesimals clumped together to form what are today the planets in our solar system, while others collided, leaving their remains scattered through the solar system as asteroids. The fragments of planetesimals in the asteroid belt can tell us about differentiation and, thus, heating in the protoplanetary disk that birthed our solar system.

The thermal glow of asteroid 16 Psyche as seen by ALMA. [From slide by Katherine de Kleer]
While heating is still ongoing in the solar system today, radiogenic heating — heating from the decay of radioactive material — is not as important as it once was. Now, small bodies are largely heated through tidal heating. The most dramatic example of the effects of tidal heating is Jupiter’s moon Io — the most volcanically active body in the solar system. Tidal heating melts Io’s rocky interior, which then gushes through the moon’s 400 active volcanoes to its surface.

Many views of the infrared glow of Io and its many volcanoes. Wavelength increases toward the bottom. Click to enlarge. [Slide by Katherine de Kleer]
Scientists have studied volcanic activity on Io for forty years, but the moon has been active much, much longer. If Io has been trapped in a resonance with fellow moons Europa and Ganymede for billions of years, as research suggests, it must have lost the equivalent of its entire mantle contents many times over, churning through and reprocessing this mantle material repeatedly. Another way of looking at Io’s evolution over time is through its atmosphere. Sulfur — an abundant component of Io — is lost to space from the moon’s upper atmosphere. Because different isotopes of sulfur have different masses, lighter isotopes are held less tightly to the moon and are preferentially removed from the atmosphere. By measuring the ratio of different isotopes of sulfur, de Kleer showed that Io has lost 94–99% of its available sulfur, supporting the picture of a dramatically, dynamically heated and evolving world.
The post DPS 56: Day 4 appeared first on AAS Nova.
]]>
Day 3 of DPS 56 brought a discussion of mental health in the planetary science community and new results regarding Jupiter's Great Red Spot, Uranian moons, and co-orbiting bodies.
The post DPS 56: Day 3 appeared first on AAS Nova.
]]>Editor’s Note: This week we’ll be writing updates on selected events at the 56th Division for Planetary Sciences (DPS) meeting happening in Boise, Idaho, and online. The usual posting schedule for AAS Nova will resume on October 14th.
Table of Contents:
- Plenary Lecture: Addressing Mental Health in Planetary Science: Big and Small Steps to Creating an Environment that Supports Well-Being (David Trang)
- Press Conference: Amy Simon, Richard Cartwright, Mariah Jones
Plenary Lecture: Addressing Mental Health in Planetary Science: Big and Small Steps to Creating an Environment that Supports Well-Being (David Trang)
Planetary scientist and mental health counselor David Trang (Space Science Institute) discussed the results of recent surveys of mental health among planetary scientists and strategies to improve the health of the community. Mental health is a pressing issue for our community: 76% of planetary scientists surveyed reported having anxious or depressive symptoms that made it at least somewhat difficult to perform work duties, take care of things at home, or get along with others. Twenty-nine percent of respondents found these tasks difficult, while 9% of respondents said they found these tasks very difficult.
These issues affect everyone: even if you’re not personally experiencing symptoms, the collaborative nature of planetary science means that someone you work with likely is. Distracting thoughts associated with anxiety, stress, and depression occupy short-term memory, affecting research quality, the ability to develop new ideas, interpret data, and more. Aside from research quality, poor mental health worsens physical and social health as well.

Prevalence of clinically significant anxiety among planetary scientists in 2022 and 2023. Rates are compared against the general population during (red line) and before (green line) the COVID pandemic. Click to enlarge. [Slide by David Trang]
Overall, the results show a statistically significant difference in the prevalence of anxiety, stress, and depression between members of marginalized groups and members of non-marginalized groups. While this difference may reflect larger cultural and societal issues, it also presents an opportunity for planetary science participation to become a protective factor against these larger issues.

Prevalence of clinically significant anxiety and depression among mission participants (purple) and non-participants (blue). The white shapes indicate statistically significant results. Click to enlarge. [Slide by David Trang]
To bring these positive aspects of mission participation to all planetary scientists, Trang suggested creating more teams (not just missions, but research institutes and interest groups as well) and improving mentorship for early career scientists. To achieve the latter goal, institutions could implement mandatory mentorship training for graduate advisors or invest in a mentor advisor to provide career mentorship to a large number of graduate students, reducing the burden on graduate research advisors.

Top contributors to depression. Click to enlarge. [Slide by David Trang]
Trang presented two other strategies that can help people feel appreciated: focusing on strengths and complimenting the process. As scientists — especially scientists in advisor roles — it’s easy to focus on what’s wrong and what needs improvement. For example, when editing a student’s manuscript, it’s natural to point out what needs to be fixed. But don’t forget to focus on what’s been done well (e.g., “You did a great job of reviewing past work in the introduction. Let’s bring that same strategy to the discussion section.”). Similarly, it’s easy to congratulate or compliment someone after a major achievement — say, being awarded a grant — so try to compliment the steps of the process as well. For example, take the time to acknowledge the hard work that went into writing an excellent proposal, even if it wasn’t selected.
Want to implement these changes in your life? Set SMART goals, Trang suggests. Give yourself a Specific, Measurable, Achievable, Relevant, Time-bound goal, such as pointing out two strengths each time you review a paper this year. Through individual efforts and broad policy changes, we can make the planetary science community a healthier place.
Press Conference: Amy Simon, Richard Cartwright, Mariah Jones (Briefing video)

The Great Red Spot is a prominent feature on Jupiter. [NASA, ESA, A. Simon (Goddard Space Flight Center) and M.H. Wong (University of California, Berkeley)]

Regions of Jupiter’s Great Red Spot. [From slide by Amy Simon]

Ariel as seen by Voyager 2 in 1986. [NASA/JPL]

JWST observations of Ariel. The spectra show clear signals from CO2, CO, and H2O, plus a tentative hint of CO3. Click to enlarge. [From slide by Richard Cartwright]
Future work will dive deeper into new JWST observations of Uranian moons Umbriel, Titania, and Oberon. Preliminary analysis of the JWST spectra shows the first evidence of CO ice on these worlds.

Comparison of the results for TRAPPIST-1 (top), a resonant system, and Kepler-90 (bottom), a non-resonant system. More of the synthetic co-orbitals remained in stable configurations in the Kepler-90 system. Click to enlarge. [From slides by Mariah Jones]
Jones and collaborators used dynamical modeling to investigate if the presence of resonance in a planetary system affects the long-term stability of co-orbital populations. They collected initial conditions for several multi-planet systems from the NASA Exoplanet Archive and injected 20 synthetic co-orbitals into each system. They found a variety of behaviors, including stable trojans and horseshoes, no stable solutions, or switching between stable trojan and horseshoe configurations. They found that stable configurations were more likely for systems without resonance. This trend might happen because in a resonant system, bodies that are co-orbital with one planet are also in resonance with another planet, destabilizing the configuration.
Slides from these three presentations are available in the press kit.
The post DPS 56: Day 3 appeared first on AAS Nova.
]]>
Plenary talks during Day 2 of DPS 56 tackled the connection between exoplanet science and solar system science.
The post DPS 56: Day 2 appeared first on AAS Nova.
]]>Editor’s Note: This week we’ll be writing updates on selected events at the 56th Division for Planetary Sciences (DPS) meeting happening in Boise, Idaho, and online. The usual posting schedule for AAS Nova will resume on October 14th.
Table of Contents:
- Plenary Lecture: Planetary Habitability in the Solar System and Beyond (Stephen Kane)
- Plenary Lecture: From Venus to Exoplanets and Back Again (Cedric Gillmann)
- Plenary Lecture: ExoTitans: Connecting Solar System and Exoplanet Studies (Kathleen Mandt)
Plenary Lecture: Planetary Habitability in the Solar System and Beyond (Stephen Kane)
What is planetary habitability? This deceptively simple question posed by Stephen Kane (University of California, Riverside) is surprisingly controversial. Kane defines the answer as an assessment of the energy balance at a planet’s surface and what influences that balance over time. When looking at the vast sample of exoplanets — nearly 6,000 are currently known — Earth-size planets are common, opening up the possibility that the circumstances necessary for habitability are common as well.

Venus as seen by the Mariner 10 spacecraft. [NASA/JPL-Caltech]
Water is a recurring theme in discussions of habitability, since one framework within which to assess a planet’s energy balance is whether a planet is able to sustain liquid water on its surface. This framework is reasonable — and not unreasonably Earth-centric — because water is common throughout the universe, it’s a solvent in which biochemical reactions can take place, and it remains liquid up to (relatively) high temperatures, allowing chemical reactions necessary for life to proceed quickly.

The multitude of factors that could impact planetary habitability. What this graphic doesn’t show — and what’s critical to find out — is the relative importance of these factors and the connections between them. Click to enlarge. [Slide by Stephen Kane; originally from Vicky Meadows and Rory Barnes]
Atmospheric loss is important when considering exoplanets as well. In the TRAPPIST-1 system, which is famous for containing seven terrestrial planets, three or four of which are in their star’s habitable zone, recent JWST observations suggest that the two planets closest to the star have little to no atmosphere. (A hazy or cloudy atmosphere is possible for TRAPPIST-1 c, but TRAPPIST-1 b is extremely unlikely to have any kind of atmosphere.)
Another consideration for exoplanetary systems is the presence or absence of giant planets. Our solar system may be unusual among planetary systems because it contains four giant planets beyond the snow line (the distance from the Sun at which water exists as ice). Many other known exoplanet systems contain giant planets closer to their stars, which may prevent Earth-size planets from attaining stable orbits in the habitable zone. However, a well-placed giant planet may be critical for the habitability of Earth-like planets; giant planets positioned beyond the snow line can transport volatiles (critically, water ice) into the inner solar system. While Jupiter has a nearly circular orbit, researchers see giant planets beyond the snow line with a wide range of orbital eccentricities — and it turns out that giant planets with more elliptical orbits are actually better at scattering volatiles toward would-be Earths.
In the conclusion, Kane added a rather somber comment about the challenge of assessing planetary habitability: modeling suggests that the three biggest factors determining Venus’s current uninhabitability are the incident solar flux, Venus’s slow rotation rate, and its lack of plate tectonics. A distant observer could easily pin down the first of those three factors, but the other two are difficult or impossible to determine from afar.
Plenary Lecture: From Venus to Exoplanets and Back Again (Cedric Gillmann)
Cédric Gillmann (ETH Zurich) brought the discussion back to Venus in the second talk of the session. Seen from afar, it would be very difficult to distinguish Venus from Earth because the two planets have similar basic properties. This fact led Venus to be a prominent target of early solar system exploration, with some observers expecting Venus to be a sort of warm and humid “space Florida.” Instead, images from the surface revealed Venus to be dry and lifeless, though more Earth-like than it seemed at first glance: the images showed basaltic (composed of volcanic rock) plains similar to those found on Earth.
That might be where the similarities between Venus and Earth end. Though Venus and Earth both have volcanoes, the type and distribution of volcanic features is dissimilar, suggesting that something in Venus’s interior is markedly different from Earth’s. Venus also has a staggeringly high surface pressure (more than 90 times Earth’s surface pressure) and temperature (hot enough to melt lead) and an atmosphere rich in carbon dioxide, with some nitrogen and just a trace of water.

Comparison of known Venus zone and habitable zone planets. [Slide by Cédric GIllmann]
This is just one example of how exoplanet studies increasingly benefit from solar system studies. Certain factors, especially those related to planetary interiors, can never be measured directly for exoplanets but can be investigated for solar system planets. Gillmann pointed to the mantle as an especially important factor; as a planet’s mantle evolves, it affects the planet’s core and cools the planet. It also affects volcanism, which in turn affects the planet’s atmosphere, making it central to the planet’s overall evolution.
In summary, Venus represents a planet whose evolutionary history is likely complicated and is still uncertain, though upcoming missions like EnVision and VERITAS should help to illuminate its past. By studying the relatively accessible Venus, astronomers can learn more about planets that we’ll never get to see up close.
Plenary Lecture: ExoTitans: Connecting Solar System and Exoplanet Studies (Kathleen Mandt)
In the final talk of the session, Kathy Mandt (NASA’s Goddard Space Flight Center) took the habitability discussion in a colder direction, whisking the audience to the ocean worlds of the outer solar system. Our solar system contains several moons with liquid oceans beneath their icy surfaces. The Europa Clipper mission, which is scheduled to launch no sooner than 12 October, will explore one of these ocean worlds in detail.
Ocean worlds are an enticing place to look for life beyond Earth, but it’s exceedingly difficult to study the oceans directly. It’s unknown how thick the ice shells may be, and even drilling through antarctic ice on Earth is difficult. This means that studying the subsurface ocean on an exoplanet will be beyond our reach. Is there an easier way to study exoplanet ocean worlds?

Radar image of Titan’s north polar seas. [NASA/JPL-Caltech/ASI]
Titan-like exoplanets are likely to be common, but our current detection capabilities limit the number of candidate exo-Titans — because these planets must be cold, they must be located farther from their stars, making them harder to detect with the transit method.

An artist’s rendition of the seven known planets in the TRAPPIST-1 system, based on data taken through 2018. [NASA/JPL-Caltech/R. Hurt, T. Pyle (IPAC)]
If TRAPPIST-1 h is an exo-Titan, what would JWST enable us to learn about its atmosphere? Mandt’s team performed atmospheric modeling of exo-Titans to estimate what JWST would see when looking at such a planet. They found that it was often difficult to back out the input properties of a planet since there was a lot of degeneracy between temperature and pressure. Some factors, such as eddy diffusion, were impossible to discern at JWST-accessible infrared wavelengths but could be probed by an ultraviolet telescope.
Next, Mandt’s team plans to incorporate more complex photochemistry in their model, which will likely be challenging. TRAPPIST-1 is an M dwarf, which means that the star is variable at the X-ray and ultraviolet wavelengths that drive chemical reactions.
Ultimately, Mandt emphasized the importance of planetary scientists and exoplanet scientists working together, leveraging past knowledge from Cassini and upcoming insights from the Dragonfly mission to interpret observations of exo-Titans and other ocean worlds.
The post DPS 56: Day 2 appeared first on AAS Nova.
]]>
This week we're bringing you updates from the 56th meeting of the AAS Division for Planetary Sciences. Day 1 was all about asteroids and lab experiments!
The post DPS 56: Day 1 appeared first on AAS Nova.
]]>Editor’s Note: This week we’ll be writing updates on selected events at the 56th Division for Planetary Sciences (DPS) meeting happening in Boise, Idaho, and online. The usual posting schedule for AAS Nova will resume on October 14th.
Table of Contents:
- Press Conference: Quanzhi Ye, Elizabeth Silber, and Victor Oyiboka
- Plenary Lecture: Laboratory Investigations Toward Understanding Ocean World Surfaces (Tuan Vu)
- Plenary Lecture: The Next-Generation Laboratory Experiments on Planetary Materials (Xinting Yu)
- Plenary Lecture: Spectroscopy of Fine-Particulate Minerals in the Laboratory and the Field: A TREX Perspective (Melissa Lane)
Press Conference: Quanzhi Ye, Elizabeth Silber, and Victor Oyiboka (Briefing video)

Comet 2P/Encke as seen by the MESSENGER mission to Mercury. [NASA/Johns Hopkins University Applied Physics Laboratory/Carnegie Institution of Washington/Southwest Research Institute]
The Taurids have been known for a century, and a significant year-to-year variation in the activity level has become apparent. This variability happens because some of the Taurid complex is trapped in a resonance with Jupiter (these trapped particles are called the Taurid resonant swarm); when Earth passes close to the center of these trapped particles, the activity level is particularly high. While most of the trapped Taurid particles are tiny, the resonant swarm may also contain asteroids 100 meters wide or larger that have been trapped by Jupiter’s gravity. This means that when Earth passes close to the center of this particle swarm, it could be passing close to potentially hazardous asteroids — but how many hazardous asteroids are actually there?
To answer this question, Ye and collaborators analyzed data from the Zwicky Transient Facility during two recent encounters with the Taurid swarm. They found no trace of potentially hazardous 100-meter-plus asteroids — phew! The non-detection suggests that there are only 9–14 asteroids this large in the Taurid swarm. This is tiny compared to the 3,000 or more known potentially hazardous asteroids. These observations also allowed the team to estimate the size of the comet 2P/Encke parent body at just 10 kilometers, which is smaller than previously thought.
Next, Elizabeth Silber (Sandia National Laboratories) discussed a topic of importance to planetary defense. Earth is constantly being bombarded with debris, and while most of this debris is extremely fine and poses no threat to us, larger objects can be destructive. Large meteoroids (objects up to 1 meter in diameter) and asteroids (objects larger than 1 meter in diameter) can generate shock waves that can be felt on the ground and can damage property and cause injuries. For example, in 2013, the house-sized (18-meter-wide) Chelyabinsk meteor exploded with an energy equivalent to 440 kilotons of TNT and shattered thousands of windows.

Demonstration of how the properties of a meteor are reflected in light curves and infrasound measurements. Click to enlarge. [From slide by Elizabeth Silber]
Silber’s goal was to develop a practical way to estimate an asteroid’s impact energy — and eventually size and velocity — which will help to assess future threats. The team combined a sample of infrasound measurements with other measured asteroid properties and light curves to assess the reliability of the infrasound technique. Ultimately, this work will aid in determining the rate at which asteroids of various sizes impact Earth’s atmosphere and the level of risk associated with asteroids of different sizes.
Finally, Victor Oyiboka (University of Texas at Dallas) introduced new work on the role of radioisotopes on the evolution of Earth-like planets. Radioisotopes are radioactive forms of elements. Essentially, these are unstable atoms that split into more stable forms and release energy. As radioactive isotopes in a planet’s interior decay into more stable forms, the energy released heats the planet, helping to shape its evolution.

Model results for the heat production of Earth-like exoplanets as a function of planet age. [From slide by Victor Oyiboka]
Slides from these three presentations are available in the press kit.
Plenary Lecture: Laboratory Investigations Toward Understanding Ocean World Surfaces (Tuan Vu)
The first of four plenary sessions at this year’s conference introduced laboratory experiments relevant to planetary science. First was Tuan Vu of NASA’s Jet Propulsion Laboratory, who described laboratory work that explores the salts and ices that might be found on some of the ocean worlds in our solar system. Ocean worlds — planetary bodies with surface or subsurface oceans — are potential habitats for life beyond Earth and are therefore of great interest to planetary scientists. Among our solar system’s ocean worlds are Jupiter’s moon Europa, which likely contains twice as much water as Earth, and Saturn’s tiny moon Enceladus, which despite its small size may contain 14–20% as much water as Earth. These moons’ subsurface oceans are thought to be salty and chemically complex, and knowing the composition of these worlds’ oceans is critical to understanding their geochemistry and habitability.
Vu focused on Europa, which is soon to be visited by the Europa Clipper mission. Unlike Enceladus, which frequently broadcasts the contents of its ocean via plumes that erupt from fissures in its surface, Europa only rarely emits plumes. This means that researchers will likely need to glean the composition of Europa’s oceans by studying its surface, which may be spotted with frozen brine from infrequent plumes or ocean material welling up through cracks in the ice shell. The first challenge for this tactic is measuring the composition of the surface. Then, researchers must translate the composition of ices on the surface to the composition of liquids in the moon’s ocean by determining how ocean materials will be altered by deposition on the surface and exposure to the intense radiation environment.
Observations from ground-based telescopes, the Hubble Space Telescope, and the Galileo spacecraft have found evidence for sodium chloride (NaCl), sodium- and magnesium-containing minerals, and sulfates on Europa’s surface. Vu’s team created laboratory brines from sodium, chloride, magnesium, and sulfate ions and observed the minerals that formed under different ion concentrations, ion ratios, and freezing rates. These experiments showed that mirabilite (NaSO4) preferentially forms over epsomite (MgSO4) even when magnesium ions are abundant. However, epsomite has been observed on Europa, with sodium instead latching on to chlorine to form NaCl. This combination cannot be achieved by the simple freezing of ocean materials. Instead, it requires an ocean rich in NaCl and a surface that is bombarded by ionizing radiation, further processing the ocean materials after they reach the surface and freeze.

Colony forming units (CFU) of Pseudoalteromonas haloplanktis bacteria after exposure to ambient conditions, vitreous salt hydrate, and crystalline salt hydrate. [From slide by Tuan Vu]
Plenary Lecture: The Next-Generation Laboratory Experiments on Planetary Materials (Xinting Yu)
Certain worlds in the solar system can appear deceptively Earth-like while being completely alien. Such is the case for Saturn’s largest moon, Titan, which sports familiar-looking seas, clouds, and dunes. Xinting Yu (University of Texas at San Antonio) was introduced to materials science via Titan’s curiously Earth-like dunes. Earth’s dunes are primarily made of quartz, while Titan’s dunes are made of organic material.
Yu and collaborators initially attempted to study Titan-like dunes in a wind tunnel using ground walnut shells and coffee grounds as a stand-in for the dune material. However, these materials were a poor analog, leading the team to explore tholins as an option. Tholins are a class of molecule thought to exist in Titan’s ever-present haze layer. They can be created by adding energy to a mixture of nitrogen and methane. While tholins excel at imitating organic compounds on Titan, they’re also toxic and time-consuming to make. (In three days, the team generated just one gram of the 2–3 kilograms they needed for the wind tunnel.) Instead of going this route, Yu’s team studied the material properties of Titan’s dunes and used these properties to scale the wind tunnel data.
This experience led Yu to bring materials science techniques to planetary science questions. With the Dragonfly mission expected to touch down on Titan (on the dunes, in fact!) in 2034, materials-science-inspired studies of Titan are timely. Recently, Yu’s planetary materials lab has sought to answer two pressing questions: 1) does the fact that lab-made Titan materials are prepared in air that contains oxygen and water vapor — two things absent from Titan’s atmosphere — affect their properties, and 2) are the tholins made in labs really like the tholins on Titan?

Demonstration of how the total surface energy of lab-generated tholins changes with the chemical mixture used to make them (represented by the color of the bar) and the experimental setup (labeled on the horizontal axis). Click to enlarge. [From slide by Xinting Yu]
Yu’s team has put together a database of these materials for anyone wanting to study Titan. Yu closed the talk with a video tour of the Planetary Material CHaractErization Facility (PMCHEF) and a reminder than tholins aren’t just relevant to Titan — hazes are thought to be common in exoplanets, and laboratory studies can help researchers peer into those planets’ atmospheres as well.
Plenary Lecture: Spectroscopy of Fine-particulate Minerals in the Laboratory and the Field: A TREX Perspective (Melissa Lane)
Melissa Lane (Fibernetics) closed out the session with a two-part talk that covered spectral characterization of mineral dust and investigation of rover techniques. In order to interpret spectra of distant planets, researchers need to be able to refer to laboratory spectra of common planetary materials. Lane’s team’s goal was to collect far-ultraviolet to mid-infrared laboratory spectra of 27 types of mineral dust. Why study dust? Dust is ubiquitous in the solar system, coating geological features of interest and interfering with human and robotic exploration.

Example Frankenspectrum of olivine. [Slide by Melissa Lane]
Lab spectra are also important for guiding autonomous robotic exploration of planetary worlds. In the second portion of the talk, Lane’s team used the Zoë rover to explore the outcomes of different rover mission architectures: 1) autonomous rover, 2) traditional remote-team-guided rover, and 3) astronaut and semi-autonomous rover. The team traveled to Yellow Cat, Utah, and to the Hopi Buttes volcanic field in northern Arizona, both of which have a variety of geologic features. They found that while the autonomous rover was the fastest, it missed things that the human-guided scenarios caught.
The post DPS 56: Day 1 appeared first on AAS Nova.
]]>
Kerry Kroffe recently joined the AAS staff as the Director of Scholarly Publishing. Read on to learn about his journey to his current role and his goals for the publishing experience.
The post AAS Publishing News: An Interview with Kerry Kroffe appeared first on AAS Nova.
]]>
AAS Director of Scholarly Publishing Kerry Kroffe [Nick Leoni]
The Path to the AAS
After his first publishing role with a for-profit book publisher, Kerry joined the staff at the University of Chicago Press working as the Assistant Publication Manager for the AAS journals in 2000. Working with former AAS CEO Bob Milkey and current CEO Kevin Marvel, he found that the AAS journals embodied a publishing ethos that spoke to him — rather than a for-profit model that endlessly seeks to maximize profit at the expense of the contributors or the audience, the AAS staff sought to be good stewards of the literature, and to serve the authors and the readers.
“I’ve worked with medical professionals, biopharm, all sorts of groups out there, and I’ve honestly just not found a community that I resonate with as much as the astronomers,” Kerry says.

In addition to thru-hiking, Kerry’s also a fan of national parks — he’s hiked in 27 of them, including Grand Canyon National Park, seen in the background here. [Kerry Kroffe]
“It had always been a dream of mine to work at PLOS,” Kerry says. “I loved what they stood for.” At PLOS, he was responsible for all of the editorial operations — everything on the peer-review side, as well as production for all of the journals. Eventually, the IT and business analytics teams came under his wing as well. Kerry remained at PLOS, eventually overseeing nearly 80 staff, for five years.
In 2019, life had other plans once again, and Kerry stepped away from his successful role at PLOS for personal reasons. While evaluating future moves, fate intervened when Julie Steffen — AAS Chief Publishing Officer at the time and Kerry’s former coworker at University of Chicago Press — emailed to announce her retirement.
Now, as AAS’s Director of Scholarly Publishing, Kerry will lead and support the AAS publishing team and interface with IOP Publishing and eJournal Press, which provides the peer-review software. He’ll also maintain the various AAS publishing imprints as well as monograph publishing.
How Can We Make Your Experience More Delightful?
When you think about the process of publishing research in an academic journal, does the word delightful come to mind? Kerry hopes so, and one of his aims as Director of Scholarly Publishing is to make the publishing process delightfully effortless.
“One of the things that I’m really interested in is how we can change our interaction with our contributors to make it as frictionless as possible,” Kerry says. Part of this goal is ensuring that authors are only asked for materials that are absolutely necessary, rather than making them jump through hoops that take their time away from what really matters: research! (Kerry recalled a time when authors were asked to make print-ready CMYK versions of all their images — a task important for the publication of a physical article, but one that’s well outside a researcher’s purview.)
To succeed in this goal, Kerry welcomes feedback and constructive criticism from the tight-knit AAS community. “These journals are for the community in which we exist,” Kerry says. “I want to hear from our researchers how we can better perform for you. It’s not just about what we offer now, but what you would like to see in the future. I would love to hear if things go swimmingly, but I also do want to hear when things don’t go great. Constructive criticism is some of the most valuable feedback someone can ever give.”
Want to chat with Kerry about the AAS journals and share your feedback? You can find him at the AAS publishing booth throughout the upcoming 245th AAS meeting in National Harbor, Maryland.
The post AAS Publishing News: An Interview with Kerry Kroffe appeared first on AAS Nova.
]]>
What happens when a giant star cluster gets trapped in a dance with the Milky Way's central bar? A new study reveals that bar interactions are likely responsible for where we find globular clusters in our galaxy today.
The post Globular Clusters Experience Bar Resonance Repercussions appeared first on AAS Nova.
]]>Massive star clusters have moved about the Milky Way for billions of years, and a recent study finds that more complicated dynamics must be considered when using these clusters to investigate the evolutionary history of the galaxy.
Globular Cluster and Galaxy Evolution
Born from giant molecular gas clouds, globular clusters are large, dense collections of tens of thousands to millions of stars. These systems are very stable and long-lived, making them some of the oldest residents of the Milky Way and important relics of our galaxy’s ancient structure that has long since evolved.
Within the galaxy, globular clusters tend to fall into two groups — those that formed in the Milky Way (in situ) and those that were accreted during mergers. One clue often used to identify a globular cluster’s origin is its current location in the Milky Way: globular clusters formed in situ are typically found near the galactic center and accreted globular clusters tend to lie more so in the galactic halo. But could the Milky Way’s long-term evolution have also played a role in these globular clusters’ present positions?
Trapped in Resonance

An artist’s rendition of the Milky Way showing a strong central bar. Click to enlarge. [NASA/JPL-Caltech]
Using Gaia Data Release 3 measurements and dynamical simulations, Adam Dillamore and collaborators (University of Cambridge) explore how the Milky Way’s barred center influences its surroundings. The authors find that the globular clusters most significantly impacted are those caught in resonance. As the central bar slows, these clusters are transported farther away from the galactic center, making a cluster’s current location less indicative of its origins.
Understanding Observations
How do the authors’ findings fit in with previous observations? Of note is Messier 22, a globular cluster with a metallicity spread akin to those anticipated in the Milky Way’s first massive star clusters. After becoming entangled in resonance with the central bar, Messier 22 likely migrated from the very center of the Milky Way outward, further indicating an ancient origin.

Simulation snapshots of the globular cluster 47 Tucanae, where the simulated stars are shown in on-sky coordinates. From left to right, the panels show the impacts of no central bar, a steady central bar, and a slowing central bar on the resulting spatial distribution of stars in the cluster. The presence of a central bar creates a diffuse halo, corresponding to the prior observations of the central region of the cluster marked with the black circles. Click to enlarge. [Dillamore et al 2024]
The Milky Way does not rest in a steady state, but instead changes over time, impacting the dynamics of its constituents. When it comes to using globular clusters to characterize the galaxy’s past, taking resonances and other perturbations into account is imperative to accurately determine the Milky Way’s evolutionary history.
Citation
“Trojan Globular Clusters: Radial Migration via Trapping in Bar Resonances,” Adam M. Dillamore et al 2024 ApJL 971 L4. doi:10.3847/2041-8213/ad60c8
The post Globular Clusters Experience Bar Resonance Repercussions appeared first on AAS Nova.
]]>
Hot Jupiters, especially when placed around hot stars, are notorious troublemakers. A new study suggests that their cooler cousins, the warm Jupiters, tend to follow the rules no matter what kind of star they circle.
The post Cool It Down: Warm Jupiters Are Better Aligned Than Hot Jupiters appeared first on AAS Nova.
]]>Although some planets calmly follow the lead of their host stars and always stay more or less aligned with the star’s equator, others are more unruly and are found circling their parent in any direction they choose. A recent study adds evidence to the claim that “warm Jupiters”, or massive planets that are a little farther from their host star than their hot-Jupiter cousins, are almost always well-behaved no matter what else is going on around them.
Disorderly and Dramatic
Hot Jupiters, or massive planets that orbit incredibly close to their host stars, have pretty tough lives. Thanks to a ceaseless stellar blowtorch constantly scorching one hemisphere, their atmospheres can be hot enough to melt steel. Even among this tortured group, some have it worse than others. While some stars, like our sun, are relatively cool, others are more massive and therefore hotter. Hot Jupiters around these hot stars must tolerate even more extreme conditions than their (relatively) cooler counterparts.

An artist’s illustration of a hot Jupiter. [NASA/ESA/G. Bacon and A. Feild (STScI)/H. Wakeford (STScI/Univ. of Exeter)]
This pattern invites some obvious questions: Why the difference? Is there something about a star’s temperature that would determine the geometry of its planets’ orbits?
Cool and Collected
To answer these and others, a team of astronomers have spent the past few years measuring the alignments of “warm Jupiters”, or planets about as massive as hot Jupiters but slightly farther from their host stars. The latest study in this effort, led by Xian-Yu Wang of Indiana University, brings the total sample of measured warm Jupiters up to 23 planets. None of these worlds are misaligned; in other words, warm Jupiters, even when around hot stars, never set off on their own.

A plot showing stellar temperature on the X-axis and angle of misalignment on the Y-axis. Hot Jupiters are shown on the top half, where we see more misaligned systems around hotter stars. Warm Jupiters, which are all aligned, are shown on the bottom. Click to enlarge. [Wang et al. 2024]
Through this combination of new observations and intensive modeling of planetary dynamics, astronomers continue to build a fuller picture of planetary formation, and ultimately, how any planets got to where they are today.
Citation
“Single-star Warm-Jupiter Systems Tend to Be Aligned, Even around Hot Stellar Hosts: No Teff–λ Dependency,” Xian-Yu Wang et al 2024 ApJL 973 L21. doi:10.3847/2041-8213/ad7469
The post Cool It Down: Warm Jupiters Are Better Aligned Than Hot Jupiters appeared first on AAS Nova.
]]>
Astrobites reports on the use of Johannes Kepler’s pre-telescope sunspot drawings to re-examine irregular solar activity in the 17th century.
The post Johannes Kepler and the Case of the Disappearing Sunspots appeared first on AAS Nova.
]]>Editor’s Note: Astrobites is a graduate-student-run organization that digests astrophysical literature for undergraduate students. As part of the partnership between the AAS and astrobites, we occasionally repost astrobites content here at AAS Nova. We hope you enjoy this post from astrobites; the original can be viewed at astrobites.org.
Title: Analyses of Johannes Kepler’s Sunspot Drawings in 1607: A Revised Scenario for the Solar Cycles in the Early 17th Century
Authors: Hisashi Hayakawa et al.
First Author’s Institution: Nagoya University
Status: Published in ApJL
Solar Cycles and the Maunder Minimum
A typical solar cycle lasts around 11 years. Each cycle begins with a solar minimum, characterized by quiet solar activity and few visible sunspots. Around the middle of the cycle, the Sun’s magnetic field flips, causing a solar maximum — a spike in magnetic activity that manifests on the Sun’s surface as an increased number of sunspots and solar flares. Then the magnetic fields settle, ending the cycle with another solar minimum, and the cycle repeats. In general, sunspots appear at high absolute latitudes during the solar maximum and drift towards the Sun’s equator as the cycle winds down, making the latitude of these sunspots an approximate indicator of how far a solar cycle has progressed (see Figure 1).
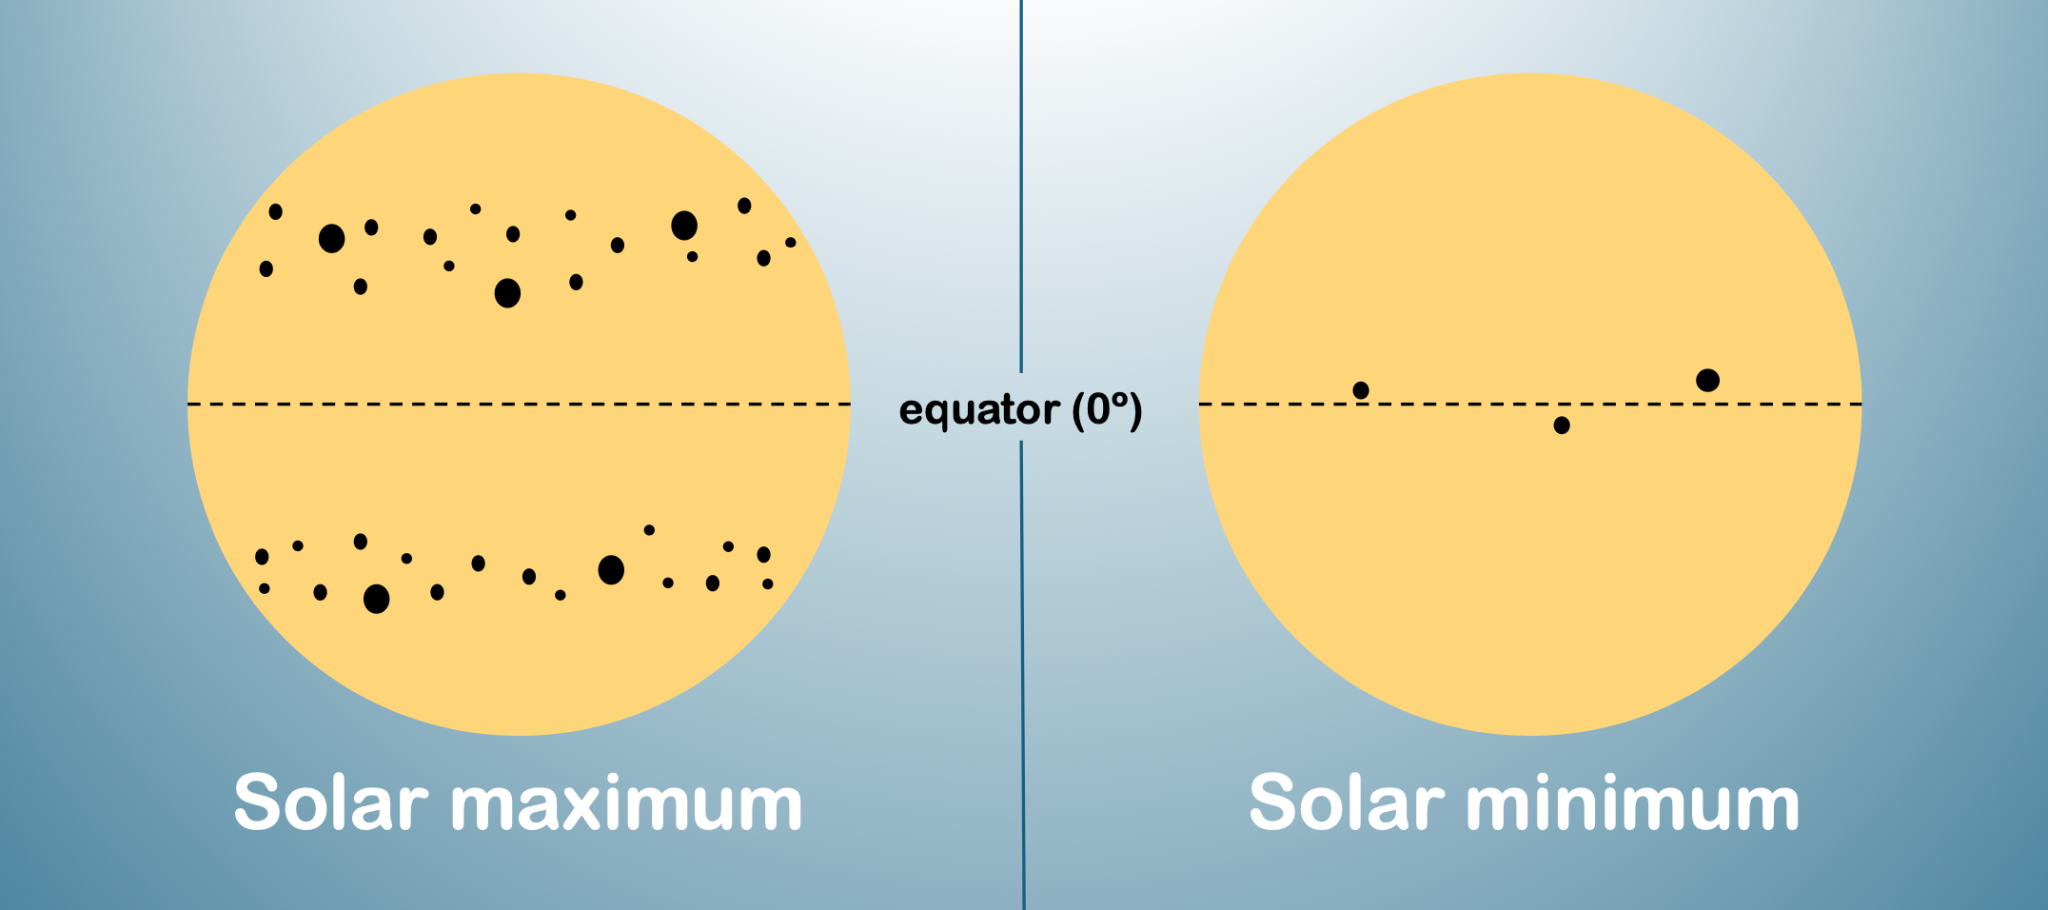
Figure 1: Schematic of sunspot latitude and frequency during a solar maximum and a solar minimum. [Annelia Anderson]
Besides telescopic observations, past solar activity can be estimated from the amount of carbon-14 in tree rings. Some of the carbon-14 in Earth’s atmosphere is created by cosmic rays interacting with atmospheric nitrogen. When the Sun is especially active, its enhanced magnetic field shields Earth from cosmic rays, which results in less carbon-14 in the atmosphere for trees to absorb. Results can be hard to interpret, though, because other factors like weather have a greater effect on carbon-14 production than solar activity does. Some carbon-14 solar cycle reconstructions have suggested extremely short solar cycles before the Maunder Minimum, while others have found solar cycles with regular to slightly long durations.
Understanding the onset of the Maunder Minimum is further complicated by the fact that telescopic sunspot observations only began in 1610 (just after the invention of telescopes). Observations began sometime during Solar Cycle −13, making it difficult to determine exactly when the cycle began — and therefore, difficult to determine whether the duration of Solar Cycle −13 was anomalous. Luckily for the authors of today’s article, a bit of data exists from the time before telescopes — drawings made by Johannes Kepler, the highly influential German astronomer best known for his laws of planetary motion, as he observed sunspots via camera obscura.
Kepler’s 1607 Sunspot Drawings
On 28 May 1607, Kepler made two sunspot drawings and recorded his activities and observations throughout the day. According to his book Phaenomenon singulare seu Mercurius in Sole (Kepler originally interpreted these sunspots as a transit of Mercury), his afternoon went like this:
Around 4:00 PM, Kepler noticed the clouds were clearing. There was a sunspot group large enough to be seen by the naked eye, so he headed home to observe the Sun. His house was on the bank of the Vltava River in Prague, and inside he had converted a room into a camera obscura — by only allowing the Sun’s light to enter through a pinhole, he was able to project an image of the Sun onto a sheet of paper. He traced this image and the large visible sunspot group. Next, he headed to the workshop of his friend Jost Bürgi, a Swiss clockmaker and mathematician. On his way there, he passed the Old City Hall, which had an astronomical clock that measured time since the previous sunset. The clock read 21 ⅓ hours. Once in Bürgi’s workshop, Kepler repeated his camera obscura observation, traced the Sun again, and noted that the Sun was setting when he finished. See Figure 2 for a depiction of his observations.
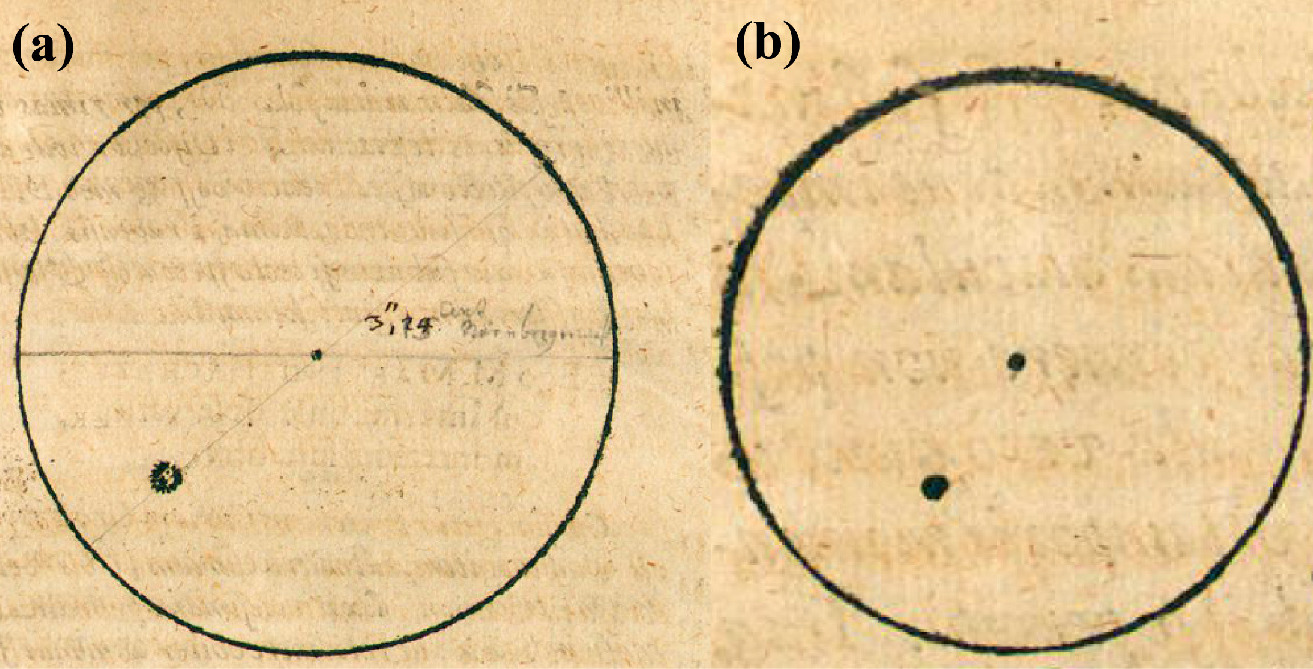
Figure 2: Kepler’s 28 May 1607 sunspot drawings. Left: Observation at Kepler’s house. Right: Observation at Bürgi’s workshop. [Adapted from Hayakawa et al. 2024]
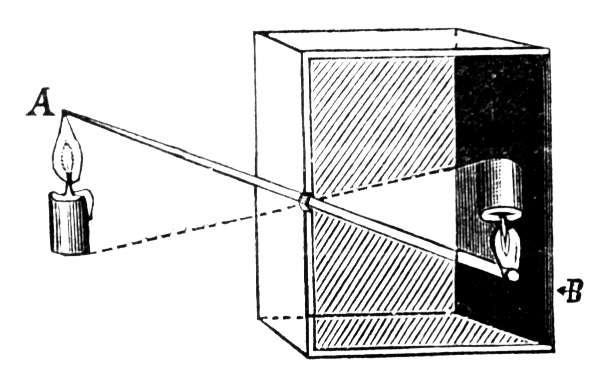
Figure 3: Diagram of a camera obscura. As the light travels through the pinhole, the projected image is inverted. [Fizyka z 1910 via Wikimedia Commons; Public Domain]

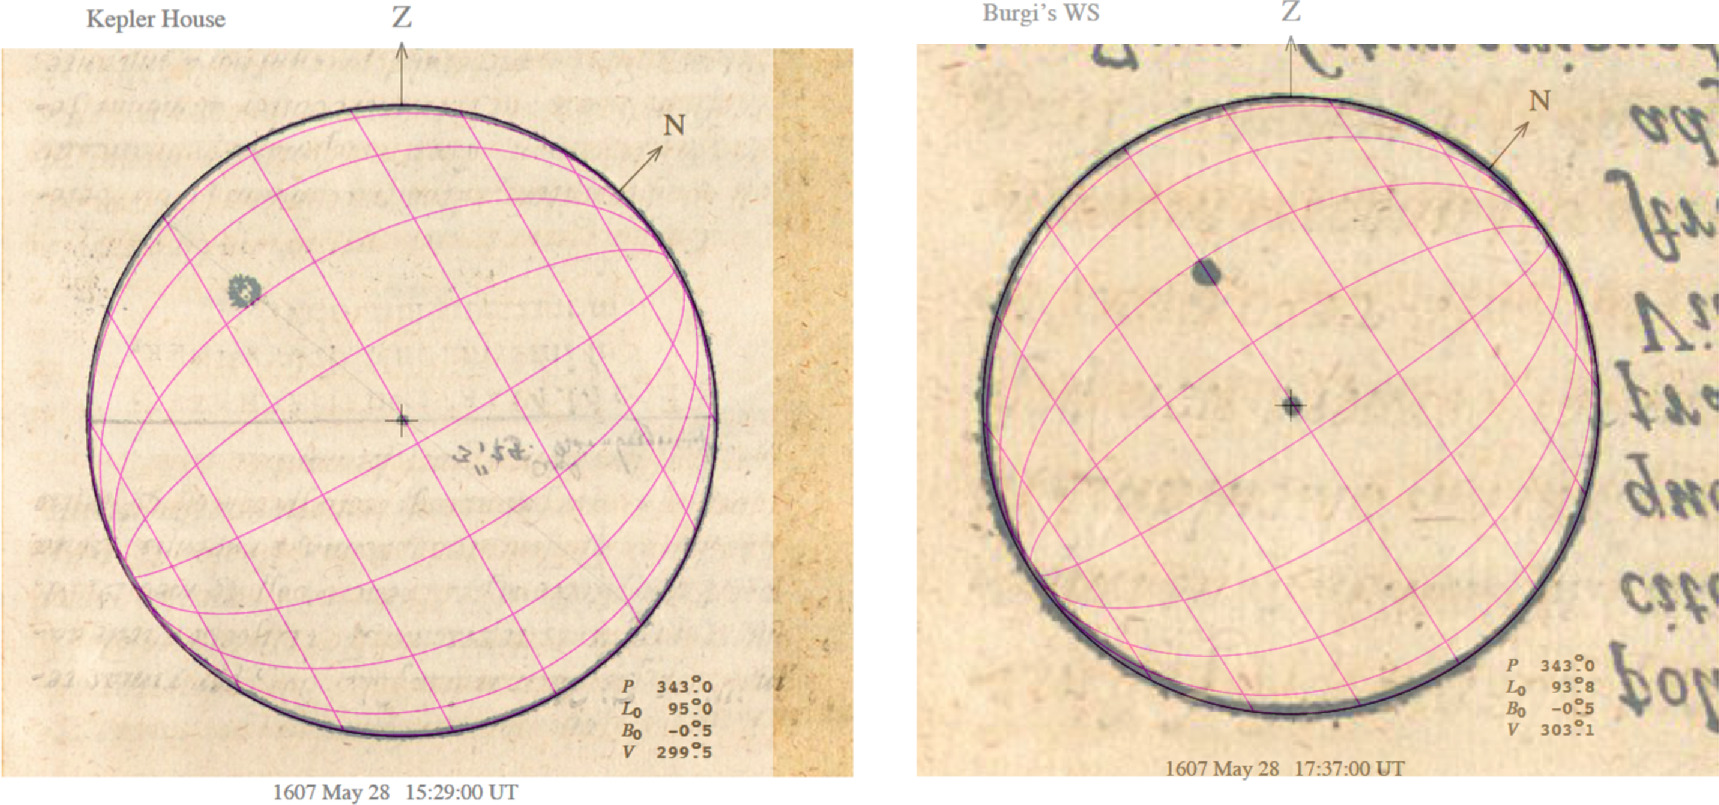
Figure 4: Kepler’s sunspot drawings overlaid with heliographic coordinates after reorientation. The Sun’s equator is the line that passes through the midpoint of each circle. Left: Observation at Kepler’s house. Right: Observation at Bürgi’s workshop. [Hayakawa et al. 2024]
Regular Solar Cycle Durations
Because many sunspots were visible at high latitudes in the years following 1610, the authors were able to place the beginning of Solar Cycle −13 (and end of Solar Cycle −14) somewhere between 1607 and 1610. Solar Cycle −13 ended around 1620, meaning it had a regular duration of 11–14 years. As an end date for Solar Cycle −14, these results also agree with carbon-14 solar cycle models in which Solar Cycle −14 lasts around 14 years.
In recent years, the Sun’s activity appeared to be decreasing and discussion arose around the possibility that we could be approaching another Maunder-like event. Though not a cause for concern, the possibility highlights the importance of studying and predicting changes in the Sun’s activity. Using Kepler’s pre-telescope drawings to show that previously contentious solar cycle durations were typical before the Maunder Minimum adds another piece to this unsolved puzzle.
Original astrobite edited by Caroline von Raesfeld.
About the author, Annelia Anderson:
I’m an astrophysics PhD student at the University of Alabama, using simulations to study the circumgalactic medium. Beyond research, I’m interested in historical astronomy and hope to someday write astronomy children’s books. Beyond astronomy, I enjoy making music, cooking, and my cat.
The post Johannes Kepler and the Case of the Disappearing Sunspots appeared first on AAS Nova.
]]>
Nebulous shells of gas surrounding the symbiotic star RX Puppis hint at outbursts from the system going back thousands of years.
The post Featured Image: The Nova Shells of RX Puppis appeared first on AAS Nova.
]]>RX Puppis, marked with crosshairs in the image above, is a symbiotic star: a binary system containing a puffy red giant and a compact white dwarf or neutron star. As the compact object accretes matter from the red giant, the stolen gas can ignite in a flash of nuclear fusion, powering a nova outburst that brightens the system for anywhere from days to decades. In the 1970s, researchers observed a slowly evolving outburst from RX Puppis. But nova outbursts from symbiotic stars usually recur — is there any evidence of previous outbursts from this sytem? Using the 1-meter Swope telescope in Las Campanas, Chile, and the Southern African Large Telescope, Krystian Iłkiewicz (University of Warsaw, Durham University) and collaborators discovered an arc-like emission feature that appears to be the remnant of a shell of gas ejected during an outburst roughly 1,300 years ago. They also discovered a hint of a second shell that might be from an eruption 7,000 years ago. Given the locations of these two shells and the timing of the 1970s outburst, Iłkiewicz’s team concluded that the rate at which the white dwarf amasses gas from its companion has increased by a factor of three over the past 10,000 years. This is the first time a change in mass transfer rate has been measured in a binary system over such a long timescale. To learn more about this discovery, be sure to check out the full research article linked below.
Citation
“Ancient Nova Shells of RX Pup Indicate Evolution of Mass Transfer Rate,” Krystian Iłkiewicz et al 2024 ApJL 972 L14. doi:10.3847/2041-8213/ad6e5a
The post Featured Image: The Nova Shells of RX Puppis appeared first on AAS Nova.
]]>
What's new in the world of pulsars and magnetars? Four recent research articles seek to characterize these ultra-dense stellar remnants with observations from radio to X-rays.
The post Monthly Roundup: Extreme Objects — Pulsars and Magnetars appeared first on AAS Nova.
]]>The realm of high-energy astrophysics is populated with extreme objects like accreting supermassive black holes and exploding stars. Among the most intriguing objects in the high-energy category are pulsars and magnetars, both of which fall under the umbrella of neutron stars: extremely dense, city-sized remnants of collapsed massive stars.

Infographic describing some of the characteristics of pulsars and magnetars. Click to enlarge. [NASA/JPL-Caltech]

A multiwavelength image of the center of the Crab Nebula supernova remnant, showing the distinct jet and torus of the pulsar wind nebula. [X-ray: NASA/CXC/SAO; Optical: NASA/STScI; Infrared: NASA-JPL-Caltech]
Tracing a Pulsar Wind Nebula
More than a decade ago, X-ray observations revealed the presence of an energetic pulsar, PSR J1849-0001, and its surrounding pulsar wind nebula: a glowing cloud energized by the high-energy charged particles shed by a young pulsar as it spins down. Pulsar wind nebulae are sometimes found at the centers of supernova remnants, as is the case for the famous Crab Nebula.
Seth Gagnon (George Washington University) and coauthors used the Chandra X-ray Observatory to study PSR J1849-0001 and its surrounding pulsar wind nebula. The observations showed that the structure of the nebula isn’t well defined, lacking the distinct jet and torus regions of other pulsar wind nebulae. PSR J1849-0001’s nebula does exhibit a faint jet, making it similar in appearance to the pulsar wind nebula of another young pulsar, J1811-1925. The team concluded that the angle between the pulsar’s spin and magnetic axes is likely small, potentially placing it in the class of “MeV pulsars” that emit pulses of high-energy X-rays.

Comparison of the pulsar wind nebulae of J1849-0001 and J1811-1925. [Gagnon et al. 2024]
Tracking a Magnetar
Roughly 20% of known and candidate magnetars have been observed at radio wavelengths, emitting pulses of radio emission that are distinct from the signals from pulsars. Hao Ding (National Astronomical Observatory of Japan) and collaborators used the Very Long Baseline Array to monitor the radio emissions of Swift J1818.0−1607, the fastest-spinning and youngest magnetar known.
Why monitor a magnetar? The formation mechanism for these extreme objects isn’t yet known, though several of them are thought to be associated with supernova remnants, making core-collapse supernovae their likely origin. One way to test different formation theories is by measuring how quickly magnetars move through space, as different origin stories impart “kicks” of different strengths on a newborn magnetar. Ding’s team used their three-year observing campaign to determine J1818.0−1607’s parallax and proper motion, which together yielded the magnetar’s distance and velocity perpendicular to our line of sight.

Top: Transverse space velocities of eight magnetars. Bottom: Cumulative distribution of transverse velocities of magnetars and young pulsars. Click to enlarge. [Ding et al. 2024]
As for the origins of J1818.0−1607, the team found that a radio-emitting shell of gas that was previously discovered nearby is located at roughly the same distance as the magnetar, strengthening the possibility that this shell is a supernova remnant.
Pulsars: Not Just Radio Sources

The timeline of the IXPE, NICER, and NuSTAR observations along with observations from the Swift Observatory Burst Alert Telescope (BAT) and the Monitor of All-sky X-ray Image (MAXI). NuSTAR and NICER observations are marked by the vertical dashed lines. The IXPE measurements are marked with blue circles. Click to enlarge. [Majumder et al. 2024]
The IXPE observations provided the first measurement of this pulsar’s X-ray polarization, or the orientation of its light waves as they travel through space. Like other X-ray pulsars monitored with IXPE, J0243.6+6124’s X-ray emission is weakly polarized (polarization fraction of ~2–3%) compared to what models predict. Based on the current IXPE, NuSTAR, and NICER data, Majumder’s team suggests that the unexpectedly low polarization fraction of J0243.6+6124 is due to vacuum resonance at the interface between the pulsar’s crust and interior, though other mechanisms are possible.
Millisecond Monitoring
The final study of this Monthly Roundup concerns millisecond pulsars. All pulsars spin incredibly fast, but millisecond pulsars are the fastest of the fast, with spin periods less than about 10 milliseconds. Although pulsars tend to spin more slowly as they age, researchers believe that millisecond pulsars buck this trend. Instead, millisecond pulsars are likely older pulsars that have been “spun up” to high speeds by accreting matter from a close binary companion. While many millisecond pulsars have been found to have binary companions, some of them fly solo, and the formation mechanism of these single millisecond pulsars isn’t yet clear. Regardless of whether they are singletons or in pairs, more observations are needed to characterize these extreme objects.

Hubble Space Telescope image of the globular cluster Messier 3. Messier 3 is home to 500,000 stars and six known millisecond pulsars. It’s also the first Messier object to have been discovered by Charles Messier himself. [ESA/Hubble & NASA, G. Piotto et al.; CC BY 4.0]
For the remaining five pulsars, Li’s team obtained updated or new timing solutions: models of a pulsar’s pulses that can be used to predict future pulse arrival times. Additionally, they showed for the first time that pulsars M3E and M3F have low-mass companion objects and travel on circular orbits of 7.1 and 3.0 days, respectively.
In future work, Li’s team plans to focus on scintillation; while scintillation can be an annoyance to researchers when it disperses pulsar signals, it also provides a way to study the intervening interstellar material.
Citation
“Chandra X-Ray Observations of PSR J1849-0001, Its Pulsar Wind Nebula, and the TeV Source HESS J1849-000,” Seth Gagnon et al 2024 ApJ 968 67. doi:10.3847/1538-4357/ad3e6d
“VLBA Astrometry of the Fastest-Spinning Magnetar Swift J1818.0−1607: A Large Trigonometric Distance and a Small Transverse Velocity,” Hao Ding et al 2024 ApJL 971 L13. doi:10.3847/2041-8213/ad5550
“First Detection of X-Ray Polarization in Galactic Ultraluminous X-Ray Pulsar Swift J0243.6+6124 with IXPE,” Seshadri Majumder et al 2024 ApJL 971 L21. doi:10.3847/2041-8213/ad67e5
“Timing and Scintillation Studies of Pulsars in Globular Cluster M3 (NGC 5272) with FAST,” Baoda Li et al 2024 ApJ 972 43. doi:10.3847/1538-4357/ad5a82
The post Monthly Roundup: Extreme Objects — Pulsars and Magnetars appeared first on AAS Nova.
]]>
JWST has spotted a planet candidate in a whole new way. This discovery paves the way for finding even more white-dwarf exoplanets, helping researchers understand the fate of our solar system after the Sun expires.
The post Discovery of Nearest Candidate Exoplanet Orbiting a White Dwarf appeared first on AAS Nova.
]]>What will happen to Earth and the other planets in our solar system when the Sun dies? Finding exoplanets around white dwarfs can help answer this pressing question, and researchers have discovered a possible giant exoplanet around a nearby white dwarf.
At the End of the Solar System
A white dwarf is faintly visible at the center of this Hubble Space Telescope image, tucked between the two brightest stars. [NASA, ESA and H. Richer (University of British Columbia); CC BY 4.0]
One way to probe the answer to this question is to study planetary systems orbiting white dwarfs. This may reveal the distances at which planets find safe harbor from the red giant, as well as whether any planets change or undergo migration as the result of their host star’s evolution. Historically, detecting planets around white dwarfs has been challenging — but luckily, JWST makes this task much easier.
Discovering Exoplanets with MEOW
The MIRI Exoplanets Orbiting White dwarfs (MEOW) survey is one of several surveys using JWST’s sensitive infrared instruments to search for planets around white dwarfs. In a recently published article, a team led by Mary Anne Limbach (University of Michigan) reported early results from the MEOW survey, focusing on a candidate planet around the nearby white dwarf WD 0310–688.

The measured infrared excess of WD 0310–688 (yellow line) compared to other white dwarfs in the MEOW sample (green and blue lines). [Limbach et al. 2024]
Candidate Considerations
Researchers have discovered a handful of exoplanets around white dwarfs already — what makes this discovery special? WD 0310–688 is only 34 light-years away, making it the closest white dwarf with a planet candidate, and no planet has ever been discovered 0.1–2 au from a white dwarf. Additionally, this marks the first planet around any type of star to be discovered with the infrared-excess method.

Schematic of the best-fitting disk from the team’s modeling. The disk must be very cold, highly inclined, and quite narrow to match the data. Coincidentally, the disk’s emitting area must be roughly the area of a giant planet. [Limbach et al. 2024]
Follow-up spectroscopy is needed to discern between the giant planet and cold disk hypotheses. Spectral features commonly found in the atmospheres of exoplanets would support the giant planet hypothesis, while a silicate feature would point toward the debris disk. Future work should illuminate the nature of this planet candidate as well as bring us new results from the MEOW survey!
Citation
“The MIRI Exoplanets Orbiting White dwarfs (MEOW) Survey: Mid-infrared Excess Reveals a Giant Planet Candidate around a Nearby White Dwarf,” Mary Anne Limbach et al 2024 ApJL 973 L11. doi:10.3847/2041-8213/ad74ed
The post Discovery of Nearest Candidate Exoplanet Orbiting a White Dwarf appeared first on AAS Nova.
]]>
Astrobites reports on how the orbits of Jupiter-like exoplanets affect these planets' ability to send ice into the inner regions of their home systems.
The post Are Solar Systems Eccentric? appeared first on AAS Nova.
]]>Editor’s Note: Astrobites is a graduate-student-run organization that digests astrophysical literature for undergraduate students. As part of the partnership between the AAS and astrobites, we occasionally repost astrobites content here at AAS Nova. We hope you enjoy this post from astrobites; the original can be viewed at astrobites.org.
Title: Eccentricity Distribution Beyond the Snow Line and Implications for Planetary Habitability
Authors: S. Kane and R. Wittenmyer
First Author’s Institution: University of California, Riverside
Status: Published in ApJL
A fundamental question in exoplanet science is to discern how common or rare our solar system is compared to the other planetary systems across the galaxy. While we have found many thousands of exoplanetary systems, so far, none “look” like our own, with small, rocky planets interior to gas giant planets. One reason we haven’t found any lookalikes is an observational bias that effectively prevents us from being sensitive to these systems. For example, small planets comparable to Earth in size are very difficult to detect through planetary transits (which give the planet’s radius) and impossible currently to detect with radial-velocity measurements (which give the planet’s mass). Therefore, we don’t expect to be finding systems like our own solar system, at least not yet (we’re getting closer every day!). So how can we begin to answer this question of solar system–like architecture occurrence rate in the meantime?
Another special feature of our solar system is Jupiter’s low eccentricity. As a quick refresher, eccentricity is the measure of how elliptical a planet’s orbit is. The more elliptical, the more eccentric. The more circular the orbit, the less eccentric. In our solar system, all planets have orbital eccentricities of less than 0.2 (most are near 0.05), which means all orbits are very nearly perfect circles. But we have found exoplanets with very high eccentricities that have interesting implications for planet formation and the dynamical evolution of exoplanetary systems, as explored in this astrobite. Jupiter’s low eccentricity of 0.04 has big implications for how Jupiter likely scattered material into the inner solar system during its formation, potentially seeding the inner solar system with the very material needed for our own planet Earth to form and become habitable to life as we know it — in particular, ices, which in planetary science can be water ice, things like CO2 ice aka “dry ice,” or even things like methane that condense into solids at the very cold temperatures of the outer solar system. Today’s daily article summary looks at a study that attempts to investigate how efficient this scattering of ices to the inner system is for Jupiter-like planets in hypothetical planetary systems.
First, the authors look to quantify how common or rare it is for known Jupiter-like planets to have low eccentricities like our own Jupiter. They took all planets with well-measured masses and cut out all those with masses below 0.3 Jupiter mass, or about the mass of Saturn. They then split this sample of 846 planets into those interior and exterior to the “snow line.” In a planetary system, the snow line is the minimum distance from the host star where it is cold enough that water exists only as ice. For each star, the snow line exists at a different semi-major axis, based entirely on the temperature of the host star. Giant planets beyond the snow line can scatter these ices towards the inner system, but giant planets within the snow line cannot bring this material from beyond the snow line to within the snow line. The authors find that the mean eccentricity for these giant planets within the snow line is 0.18, but the median is only 0.01. The big discrepancy between the mean and median suggests that this sample is heavily skewed by outliers. Additionally, there is a bias toward very short-period planets because orbits that were eccentric can become circular over time through tidal forces (see here). However, the mean and median eccentricity of giant planets beyond the snow line, like our Jupiter, are 0.29 and 0.23; these numbers being similar suggests that we are neither biased nor skewed within this sample.
The authors compared the eccentricities of the planets interior and exterior to the snow line using a Kolmogorov–Smirnov (K–S) test. In short, this statistical test is used to determine if two populations are drawn from the same distribution or from completely different distributions (see this earlier astrobite). For K–S test values near 1.0, it is most likely that the two groups are drawn from the same parent distribution, but for values near 0.0, it is most likely that we are truly seeing two different distributions — in this case, different distributions of eccentricities, which would imply different formation mechanisms. The results of this K–S test on the population of giant planets within and beyond the snow line yields a value very near 0.0, so they are truly different populations. However, when the authors cut out all planets with orbital periods less than 10 days (all within the snow line) and repeat the test, the K–S value is now 0.977, implying that they were from the same distribution. This is in line with earlier works that show that very close-in planets circularize their orbits, so when we exclude these very close-in giants, we recover that generally giant planets at all orbital separations are one population. With it established that giant planets (except for very close-in planets) form out of the same distribution of eccentricities regardless of orbital separation, the authors now ask a new question: does the eccentricity of a giant planet help or hurt the scattering of ices to the inner system?
To answer this, the authors run a suite of dynamical simulations. They initialize each simulation the same way: with a 1-solar-mass star and a 1-Jupiter-mass planet at a separation of 5.2 au (Jupiter’s true separation). Then they initialize the simulation with many thousands of “ice particles” at various locations within the system. Lastly, in one simulation, they give the Jupiter planet a small eccentricity of 0.05 and in another they set the eccentricity at 0.23. They then let the simulations run for 10,000 years and at the end, they count up all the ice particles that were scattered by the planet’s gravity into the inner system, measuring both how many cross within the snow line and how many cross within 1 au, Earth’s orbital separation. The results can be seen in Figure 1. They find that the high-eccentricity planet is much more efficient than the low-eccentricity Jupiter at scattering these ice particles into the inner system, at a rate of double for getting ices within the snow line and at eight times higher for getting ices within 1 au.

Figure 1: The scatter rate of ices that start at a variety of orbital separations due to a low-eccentricity Jupiter (top) vs. a high-eccentricity Jupiter (bottom). At every orbital period, the high-eccentricity Jupiter is better at scattering ices both within the snow line and within 1 au. [Kane & Wittenmyer 2024]
In all, this study sheds light on the population of Jupiter-like planets across the galaxy and shows that higher-eccentricity Jupiters are better at scattering ices to the inner system. This could point the way for further follow-up surveys to target systems with eccentric Jupiter-like planets in our search for small watery planets.
Original astrobite edited by Skylar Grayson.
About the author, Jack Lubin:
Jack received his PhD in astrophysics from UC Irvine and is now a postdoc at UCLA. His research focuses on exoplanet detection and characterization, primarily using the radial velocity method. He enjoys communicating science and encourages everyone to be an observer of the world around them.
The post Are Solar Systems Eccentric? appeared first on AAS Nova.
]]>
Are comets pristine remnants of the formation of our solar system, or have they changed since then? New work compares the chemistry of comets and planet-forming systems to answer this question.
The post Icy Insights from Comets and Planet-Forming Disks appeared first on AAS Nova.
]]>Are the icy objects that inhabit the outer solar system truly pristine remnants of the early solar system, or have they been altered by the chaotic process of planet formation? Recent research that compares the chemistry of solar system comets and planet-forming systems may provide an answer to this key question.
Time Capsules from the Early Solar System(?)

Diagram showing the locations of the Kuiper Belt and Oort Cloud. Click to enlarge. [Adapted from ESA (Acknowledgement: work performed by ATG under contract to ESA); CC BY-SA IGO 3.0]
There’s a good reason that this question poses such a challenge: these far-flung objects are difficult or impossible to observe directly. Luckily, they make occasional journeys into the inner solar system, transformed by warm sunlight into comets sporting twin tails of dust and ions. Now, a team led by Manuela Lippi (National Institute for Astrophysics, Italy) has amassed a sample of these icy interlopers to assess their chemistry and understand whether they’ve changed since their formation.

Abundances of methanol (CH3OH), formaldehyde (H2CO), and ammonia (NH3), expressed as mixing ratios with respect to water. From left to right, the sections separated by dotted lines show the overall abundances; the difference between comets inside and outside 1 au; differences between dynamically new (DN), long-period (LP), and Jupiter-family (JF) comets; pre- and post-perihelion (perihelion is the closest distance to the Sun reached on a comet’s orbit); and pre- and post-perihelion for comet 67P. Click to enlarge. [Lippi et al. 2024]
Comet Calculations
Using infrared and sub-millimeter observations, Lippi and collaborators studied the chemical compositions of 35 solar system comets. They found that the abundances of methanol, formaldehyde, and ammonia didn’t depend on the comet’s dynamical family. (A dynamical family is a group of comets with similar orbital characteristics.) For example, dynamically new comets — those making their first trek into the inner solar system — had similar chemistry to Jupiter-family comets whose orbits remain within the orbit of Jupiter and have visited the inner solar system many times.
The similarity in chemical composition between comets in different dynamical families suggests that comets retain their chemical makeup after they form. If this is the case, comets in the solar system today should be chemically similar to the material surrounding young, planet-forming Sun-like stars.
Throwing Disks into the Mix
As a test of this theory, Lippi’s team compared the typical chemistry of solar system comets to that of 11 planet-forming systems. The systems in the comparison sample ranged in age from 10,000-year-old hot molecular cloud cores to million-year-old protoplanetary disks. Overall, the abundance ratios of solar system comets were similar to those of planet-forming systems. This is the first statistical evidence that planet-forming systems of all ages are chemically similar and that comets are indeed unaltered remnants of the early solar system.

Comet 67P/Churyumov–Gerasimenko as seen by the Rosetta spacecraft. [ESA/Rosetta/NAVCAM, CC BY-SA IGO 3.0]
Citation
“The Ice Chemistry in Comets and Planet-Forming Disks: Statistical Comparison of CH3OH, H2CO, and NH3 Abundance Ratios,” Manuela Lippi et al 2024 ApJL 970 L5. doi:10.3847/2041-8213/ad5a6d
The post Icy Insights from Comets and Planet-Forming Disks appeared first on AAS Nova.
]]>
Observing some of the universe's first galaxies is no easy task, but with the help of JWST, a new study learns a bit more about these distant galaxies and their role in cosmic reionization.
The post Heating Up the Universe: Characterizing Reionization-Era Galaxies appeared first on AAS Nova.
]]>The powerful space telescope JWST is peering far into space, allowing astronomers to observe distant galaxies whose light can shine upon the evolutionary history of the universe. A recent study uses JWST spectroscopy to characterize some of the first galaxies and their role in heating up the universe.
Reionization and Leaky Galaxies
A few million years after the Big Bang, the atoms of the infant universe cooled enough for stars to flicker on and galaxies to coalesce. Many of these early galaxies housed enormous young stars and massive black holes that produced such powerful radiation as to completely ionize the interstellar medium of their hosts, leaving the rest of the high-energy ultraviolet photons nowhere to go but out. Ionizing radiation leaked from these galaxies into the intergalactic medium, stripping the electrons from the previously neutral hydrogen atoms filling up space and setting alight the epoch of reionization.
While we know that massive stars and accreting black holes pump the most energetic photons into the universe, prior to JWST, observations have not been able to narrow down which of these sources primarily fueled cosmic reionization. Each ionizing source impacts the evolution of its host galaxy and the early universe in its own way, so a better understanding of the conditions in reionization-era galaxies is imperative to answer important cosmological questions. Now with JWST’s ability to observe with higher signal-to-noise and spectral resolution than ever before, the characteristics of these galaxies are well on their way to being uncovered.
Clues in Emission-Line Ratios
While reionization-era galaxies are unfortunately much too distant to directly observe their ionizing sources, we can characterize the conditions of their interstellar medium based on the relative strengths of the emission lines observed in their spectra. Especially of interest are the emission-line ratios associated with ultraviolet photons, as those photons have enough energy to ionize the universe. With this in mind, Weida Hu (Texas A&M University) and collaborators leveraged publicly available JWST data from the Cosmic Evolution Early Release Science Survey (CEERS) and the JWST Deep Extragalactic Survey (JADES) to explore the interstellar medium conditions in galaxies at redshifts between 5.6 and 9. This redshift range corresponds to roughly 500 million to 900 million years after the Big Bang — about the time in which the reionization of the universe occurred.

2D and 1D composite spectrum obtained from stacking 63 high-redshift galaxies. Emission lines of interest are labeled in blue. The lower flux UV lines are zoomed in to show their peaks. Click to enlarge. [Hu et al. 2024]
Ionization Origination
What do the measured emission-line ratios tell us about the ionizing source in reionization-era galaxies? Through comparing the ratios with those of other galaxies across a range of redshifts, Hu’s team finds that, on average, the galaxies in this study are ionized by highly energetic sources — mostly star formation with possible weak black hole activity — but the exact ionization driver is still unclear. However, based on ultraviolet diagnostics, the composite spectrum exhibits similar line ratios to local extreme dwarf galaxies, suggesting that observations of the ionization sources of nearby galaxies may provide insightful information about the conditions of galaxies from the distant past.

Plot of emission-line ratios. The composite spectrum’s position is marked with the large red circle, and it falls near local extreme star forming galaxies, green peas and blueberries. Other data points are plotted representing other galaxies across a range of redshifts. The black dashed line shows the separation between star forming galaxies (below the line) and active central black holes (above the line). Click to enlarge. [Hu et al. 2024]
Citation
“Characterizing the Average Interstellar Medium Conditions of Galaxies at z~5.6–9 with Ultraviolet and Optical Nebular Lines,” Weida Hu et al. 2024 ApJ 971 21. doi:10.3847/1538-4357/ad5015
The post Heating Up the Universe: Characterizing Reionization-Era Galaxies appeared first on AAS Nova.
]]>
What happens just as a solar flare gets going? A recent study uses X-ray data to shine a light on an early stage in the life cycle of solar flares.
The post Watching Solar Flares Heat Up appeared first on AAS Nova.
]]>What happens just as a solar flare begins to produce X-rays? New research leverages data from an Earth-orbiting X-ray telescope to examine the early stages of solar flares.

The Solar Dynamics Observatory spacecraft captured this image of a large solar flare in 2014. [SDO/NASA]
A Common Occurrence
With the help of Sun-gazing observatories in space and on Earth, researchers have witnessed thousands of solar flares. Solar flares are powered by the explosive rearrangement of magnetic fields, accelerating charged particles to breakneck speeds and generating a brilliant flash of X-rays.
While the overall picture of flare production is clear, the details are still under scrutiny. To understand how solar flares happen, researchers must study each stage of the process closely. Today’s article examines the onset phase, which happens just before a flare ramps up to maximum brightness.

The counts per second (CPS) measured by DAXSS during several phases of a flare. [Adapted from Telikicherla et al. 2024]
A Three-Phase Process
Solar flares tend to happen in three stages:
- The precursor phase, in which pent-up magnetic energy is released and the first signs of the flare appear in the form of non-thermal particle motions
- The impulsive phase, in which charged particles get accelerated to extremely high energies, triggering the release of radio waves, hard (high-energy) X-rays, and gamma rays
- Finally, the decay phase, in which soft (low-energy) X-rays gradually brighten and then fade
Anant Telikicherla (Laboratory of Atmospheric and Space Physics, University of Colorado Boulder) and coauthors focused on the onset phase, which refers to the moments just before the impulsive phase, when the first soft X-rays are emitted but before the hard X-ray emission begins. Using data from the Dual-zone X-ray Solar Spectrometer (DAXSS), the team analyzed the soft X-ray spectra of six solar flares. The sampled flares took place in 2022 and had a range of characteristics, from average-intensity C-class flares to more powerful M-class flares. Most of the flares in the sample were eruptive, meaning they were accompanied by explosions of plasma into space, while one was confined, lacking a plasma explosion.
Flare and Back Again
The observations revealed that during the onset phase, when the first soft X-rays are produced, the solar plasma is already extremely hot, in the range of 10–15 million kelvin. The temperature then dips before rising again during the impulsive phase. In this way, the onset phase parallels the rising and falling temperatures of the main flare phase, leading Telikicherla’s team to suspect that the onset phase acts as “preconditioning” for the main event.

Example of two coronal loops (indicated with red arrows) forming during the onset phase. [Adapted from Telikicherla et al. 2024]
Remarkably, the observed behavior appears to mimic the evolution of the main phase of a solar flare, suggesting that the onset phase offers a preview of what’s to come. Future work analyzing hard X-ray emission will explore the connection further, helping to understand whether the characteristics of the onset phase can be used to predict the properties of the main flare stage.
Citation
“Investigating the Soft X-Ray Spectra of Solar Flare Onsets,” Anant Telikicherla et al 2024 ApJ 966 198. doi:10.3847/1538-4357/ad37f6
The post Watching Solar Flares Heat Up appeared first on AAS Nova.
]]>
Astrobites reports on whether JWST is capable of achieving one of its main goals: finding the very first stars in the universe.
The post The Search for the First Stars to Light Up the Universe appeared first on AAS Nova.
]]>Editor’s Note: Astrobites is a graduate-student-run organization that digests astrophysical literature for undergraduate students. As part of the partnership between the AAS and astrobites, we occasionally repost astrobites content here at AAS Nova. We hope you enjoy this post from astrobites; the original can be viewed at astrobites.org.
Title: A Hide-and-Seek Game: Looking for Population III Stars During the Epoch of Reionization Through the HeIIλ1640 Line
Authors: Alessandra Venditti et al.
First Author’s Institution: Sapienza University of Rome
Status: Published in ApJL
The Dawn of the Universe
A long time ago, in a galaxy far, far away… the very first stars lit up the universe, ending the cosmic dark ages and ushering in the cosmic dawn. In our current best model of the universe, this happened around 13.4 billion years ago, around 100 million years after the Big Bang. Finding evidence of these very first stars, also called Population III (Pop III) stars, is one of the ultimate treasure hunts in astronomy, and one that JWST was specifically designed for.
These Pop III stars were formed from highly pristine gas, i.e., from clouds that are almost exclusively hydrogen and helium (the lightest elements in the periodic table). It’s these first stars that then began to form and release heavier elements, and after many billions of years of star formation, the universe today is a lot more chemically evolved. However, some pockets of pristine gas reservoirs are predicted to hang around even after cosmic dawn, meaning that Pop III stars could still exist as late as 12.5 billion years ago (which corresponds to a redshift of z = 6).
The authors of today’s article carry out a very interesting experiment to predict just how many Pop III stars we might be able to find at these later times (at redshifts of z = 6–10, which correspond to ~12.5–13 billion years ago). The first important question they address is how we even go about finding these stars.
Oh Look, a Clue!
Formation within a pristine environment is a key characteristic of Pop III stars, and it actually helps us find them. Thanks to their hydrogen-rich composition, Pop III stars are theorised to be much more massive than modern stars and capable of powering very energetic (hard) radiation fields. With this huge amount of energy, they are able to double ionise the helium in the surrounding gas, which then causes emission of the helium-II recombination line at 1640 Angstroms. This emission line is therefore a great clue for finding Pop III stars!
We can even predict how many Pop III systems should exist at each point in time and how strong this emission line should be. To do this, the authors use the dustyGadget cosmological simulations. Essentially, they simulate the evolution of a universe of a certain size (volume) and include as much physics as possible (for example, star formation recipes). These simulations are currently the largest-volume simulations that also include models for Pop III stars. In the top panels of Figure 1, you can see how many Pop III systems exist in the simulations as a function of stellar mass and at different redshifts (different points in cosmic history), indicated by the solid grey line.

Figure 1: Top panels: Number density of Pop III systems expected at a given redshift in haloes within a given range of stellar mass. The total number density is shown as a solid grey line, while the numbers observable by JWST NIRSpec Integral Field Unit (IFU) are shown by the golden lines and those observable through NIRSpec Multi-Object Spectroscopy (MOS) by the brown lines. The solid/dashed line style refers to the best-/worst-case observations. Bottom panels: The fraction of Pop III stars missed in JWST/NIRSpec observations. The authors find that a significant number of Pop III systems can be overlooked by JWST. [Venditti et al. 2024]
Is JWST up to the Task?
JWST hosts a variety of instruments, and for this work we are mainly interested in the NIRSpec Integral Field Unit and the NIRSpec Multi-Object Spectroscopy modes. We can make a pretty good estimate of just how capable these instruments are at detecting helium-II 1640 by calculating their sensitivity limits, i.e., how strong does the emission need to be for us to detect it? The authors calculate the sensitivity limits of these instruments for a variety of observing times and set ups. They then compare the sensitivity limit to the predicted emission line strength of the simulated Pop III systems to work out how many of those systems they would be able to observe (coloured lines in top panels) and what fraction are missed (bottom panels).
These results indicate that only the brightest Pop III systems (within the most massive haloes) can be observed. Very low-luminosity systems might be missed even with ~50-hour exposures. However, there’s still hope! Even with these limitations, the authors predict that more than 400 Pop III systems could be discovered within current JWST surveys — although spectroscopic follow-ups would be necessary to identify them.
Overall, today’s article makes some very exciting predictions about finding Population III stars using JWST, which would help astronomers understand the very first light in the universe.
Original astrobite edited by Nathalie Korhonen Cuestas.
About the author, Lucie Rowland:
I’m a first-year PhD student at Leiden Observatory in the Netherlands, studying massive, star-forming galaxies in the early universe with ALMA and JWST. It’s a really exciting time to be interested in astronomy, so I hope to make groundbreaking new research more accessible!
The post The Search for the First Stars to Light Up the Universe appeared first on AAS Nova.
]]>
A new algorithm inspired by the intricate filaments of slime mold connects galaxies and reveals the structure of the cosmic web.
The post Featured Image: Slime Mold Shows the Way appeared first on AAS Nova.
]]>Astronomers have found a slimy solution to a tricky problem. Simulations show that matter in our universe is arranged along strands of what’s called the cosmic web — an interconnected series of filaments surrounding bubble-like voids — but discerning the structure of this web is challenging; the filaments that connect luminous galaxies are constructed from dark matter and dim, diffuse gas. In a recent research article, Farhanul Hasan (New Mexico State University) and collaborators demonstrated a new way to reconstruct the cosmic web from the positions of galaxies. The team’s algorithm takes cues from Physarum polycephalum, a type of slime mold that forms intricate filamentary structures as it searches for food. Applying this method to galaxies from the IllustrisTNG cosmological simulation, Hasan’s team showed that the slime-mold-inspired method (right-hand panel above) outperforms the method previously used by the authors (left-hand panel). The blue pattern in the background of the images above shows the dark matter density, gray circles represent galaxies, and the red and yellow lines show cosmic web filaments traced by the algorithm. To learn more about how slime mold informs studies of the cosmic web, be sure to check out the full article linked below.
Citation
“Filaments of the Slime Mold Cosmic Web and How They Affect Galaxy Evolution,” Farhanul Hasan et al 2024 ApJ 970 177. doi:10.3847/1538-4357/ad4ee2
The post Featured Image: Slime Mold Shows the Way appeared first on AAS Nova.
]]>
New Horizons’ next target beyond Pluto was discovered mid-flight in a search that forged a path for present-day planetary science. A recent publication reviews this hunt and tells the story of this remarkable discovery.
The post Hunting for a Target on the Fly appeared first on AAS Nova.
]]>A little over nine years ago, a plucky robot with a huge radio dish for a head and a heart made of radioactive plutonium completed one of the most daring space missions conceived of to date. After hibernating through nearly a decade of interplanetary travel, the probe, earnestly dubbed New Horizons by its dedicated creators, woke up as it neared the dwarf planet Pluto. By design it was then beelining towards its destinations at over 50,000 miles per hour, far too fast to slow down using its limited remaining propellant. And so, it didn’t. In barely a blink of an eye, New Horizons snapped as many pictures as it could, furiously recorded data from its other instruments, and served as humanity’s first ambassador to the king of the Kuiper Belt before continuing zipping onward into our outer solar system.

The north pole of Pluto, as seen by New Horizons during its 2015 flyby. [NASA/Johns Hopkins University Applied Physics Laboratory/Southwest Research Institute]
But the probe still had some fuel in its tanks — in a very literal sense. Though New Horizons was traveling on a safe path that wouldn’t take it near any known objects, its controllers could potentially use the onboard thrusters to steer the probe closer to another Kuiper Belt object for a first-of-its-kind investigation. The only flaw in this plan was that when New Horizons left Earth in 2006, astronomers didn’t know of any objects near enough to Pluto to be reachable once the primary flyby was complete. The very first Kuiper Belt objects (besides Pluto) had only been discovered a few years earlier in 1992, and although scientists were beginning to suspect that millions of small planetesimals could inhabit the backwoods of our solar system beyond our planets, they hadn’t found many of them yet.
Unable to let the opportunity to study one of these likely ancient, preserved relics from the formation of our solar system slip away, an international team of astronomers took it upon themselves to search for a second target for New Horizons. Incredibly, the bulk of this work took place while the spacecraft was actively flying towards its eventual destination. The New Horizons team had thrown their hats over the wall, and with limited time before their robot drifted into interstellar space or succumbed to any one of the large number of hazards of the void, they needed to discover a new object quickly.

Arrokoth, as seen by New Horizons on Jan 1, 2019. [NASA/Johns Hopkins University Applied Physics Laboratory/Southwest Research Institute/Roman Tkachenko]
Early Days
The astronomers’ work began in 2004, in the heady early days of Kuiper Belt research when all of the models were constantly being revised as new discoveries poured in. How many Kuiper Belt objects were out there? How big were they? What orbits did they travel on? These were all uncertain foundational questions, but armed with the Subaru Telescope on Mauna Kea and optimism for quick discoveries, the team set out to answer them.

The Subaru Telescope, a major component of the search efforts. [NAOJ]
Painstaking manual inspection of all of the images did eventually yield 24 new objects, but none were close enough to New Horizons’ path to be feasible destinations. After dabbling with some citizen science efforts and a handful of new software routines to automate a portion of their workflow, the team regrouped and devised a new strategy for their search.
Heating Up
Between 2011 and 2015, the astronomers began a more intensive observing campaign. Several factors had emerged in the intervening years that tipped the odds of a suitable detection in their favor. For one, new instruments had been designed and installed on several large telescopes, which accelerated the search. For another, the area of the sky they had to sweep was shrinking thanks to the shifting arrangement of the Earth, Pluto, and New Horizons.
Adding to their advantages, this time around the researchers incorporated complex software tools into their analysis from the very start. The enormous quantity of data anticipated from this new search would place immense pressures on the old method of carefully comparing two images by eye to look for the moving objects; it was now time for computers to take the lead.
These new instruments and analysis techniques, along with yet more manual vetting, produced more than 50 additional discoveries. Again though, further analysis on all of these objects confirmed that they were just out of New Horizons’ reach. The probe could wave as it sailed by, but it wouldn’t get close enough to take any useful images of the surfaces. By now, as the mission team approached the actual Pluto flyby and an impending deadline for any final course corrections, time was running short.
Big Guns, Big Future

The first images of Arrokoth, taken with the Hubble Space Telescope. Click to enlarge. [Buie et al. 2024]
This decade of surveying, searching, waiting, and re-scheming ultimately left the planetary science community with another flyby and 80 new Kuiper Belt Objects, yes, but also with techniques less tangible than these discoveries. As astronomers push ever deeper into the night sky and search more and more crowded regions of stars, they often use the observing plans, algorithms, and sometimes the actual code developed as a part of this search. It was a tremendous effort that paid off handsomely, and as we near the 10-year anniversary of our robotic arrival at the Kuiper Belt, a reflection and celebration of how we have learned to study this strange place is in order.
Citation
“The New Horizons Extended Mission Target: Arrokoth Search and Discovery,” Marc W. Buie et al 2024 Planet. Sci. J. 5 196. doi:10.3847/PSJ/ad676d
The post Hunting for a Target on the Fly appeared first on AAS Nova.
]]>
Some supernovae have bumps in their light curves. New research shows that unusual binary systems containing a magnetar and an unlucky companion star can explain some of these bumps.
The post Evaporating Stars, Magnetars, and Bumpy Supernova Light Curves appeared first on AAS Nova.
]]>Instead of fading smoothly, some supernova light curves take a bumpy road from brilliance to obscurity. Can unusual binary systems containing a rapidly spinning, wind-emitting magnetar and a stellar companion explain these light curves?
Light Curve Wiggles

Artist’s impression of a highly magnetized stellar remnant called a magnetar. [ESO/L.Calçada; CC BY 4.0]
In a recent research article, Jin-Ping Zhu (Monash University) and collaborators expanded on the latter possibility, pairing a powerful magnetar with an unlucky companion star to explain bumpy features in the light curves of certain supernovae.

A diagram illustrating the stages of the magnetar–star binary engine model. Click to enlarge. [Zhu et al. 2024]
What Goes Bump in a Supernova Light Curve
The proposed theory starts with an ordinary star and a massive star in a close binary system. As the massive star evolves, it sheds its outer layers through rapid rotation and fierce winds, exposing its super-hot core and becoming a rare Wolf–Rayet star. As the Wolf–Rayet star continues to evolve, tidal interactions between the stars in the binary system spin the Wolf–Rayet star up to high speeds. It eventually explodes in a core-collapse supernova, leaving behind a rapidly spinning magnetar.
Other models have invoked magnetars to explain bumpy supernova light curves, but this theory goes a step further, giving the companion an important role to play. As the newborn magnetar and the companion star swing around each other on their tight orbits, the magnetar’s powerful particle wind collides with the other star, evaporating some of the unlucky companion. The evaporated stellar material is then heated and accelerated by the magnetar wind, producing a bump in the light curve.
A Fitting Theory

Example of multi-band light curves for a supernova that is well fit by the authors’ model. [Adapted from Zhu et al. 2024]
Zhu and collaborators suspect that their model may apply to light curves with multiple bumps, as well. If the companion star remains bound to the magnetar after the supernova explosion but is kicked into a new, highly eccentric orbit, a bump could be created each time the stars draw close to one another on their orbits.
The team notes that there isn’t yet firm observational or theoretical evidence that rapidly rotating massive stars leave behind magnetars, and it’s not clear whether a magnetar embedded within a supernova remnant can sustain a magnetar wind, as is required here. Future work may shore up the needed evidence, and in the meantime, this work provides a new way to interpret bumpy light curves.
Citation
“Bumpy Superluminous Supernovae Powered by a Magnetar–Star Binary Engine,” Jin-Ping Zhu et al 2024 ApJL 970 L42. doi:10.3847/2041-8213/ad63a8
The post Evaporating Stars, Magnetars, and Bumpy Supernova Light Curves appeared first on AAS Nova.
]]>
Astrobites reports on the climates of planets orbiting stars that are smaller, cooler, and more common than Sun-like stars.
The post It’s An Eyeball Summer, and Other Weird K/M-Dwarf Habitable Climate Tales appeared first on AAS Nova.
]]>Editor’s Note: Astrobites is a graduate-student-run organization that digests astrophysical literature for undergraduate students. As part of the partnership between the AAS and astrobites, we occasionally repost astrobites content here at AAS Nova. We hope you enjoy this post from astrobites; the original can be viewed at astrobites.org.
Title: Climate Regimes Across the Habitable Zone: A Comparison of Synchronous Rocky M and K Dwarf Planets
Authors: Ana H. Lobo and Aomawa L. Shields
First Author’s Institution: University of California, Irvine
Status: Published in ApJ
When it comes to planet hunting, the hot star on the block is the humble M dwarf: the coolest and dimmest type of star in the universe. They’re also the most abundant type of star, which combined with their small size makes them pretty good targets for rocky Earth-like planet hunting.
However, the jury’s still out on whether M dwarfs are likely to host habitable rocky Earth-like planets, as habitability — as we know it — requires a vast set of conditions on top of those needed to form a planet that simply resembles Earth in size and composition. What we do know is that one requirement for Earth-like life is the maintained and continued presence of water.
We have the luxury of living within our Sun’s “Goldilocks zone,” i.e., a “just right” distance from the Sun where it isn’t too hot or too cold for water to either boil off or freeze up permanently. An exoplanet’s atmosphere must also survive the onslaught of stellar storms brought on by its host star, which, in the case of an M-dwarf host, can be extreme from the very beginning.
This, unfortunately, considerably pares down the chances of finding a habitable planet orbiting an M dwarf, although there are scenarios in which it could be possible.
Today’s authors propose an alternate target: K dwarfs.
Choose Your Host Star!
K dwarfs are essentially M dwarfs’ slightly more massive and more stable siblings, albeit overshadowed. The gentler stellar activity that K dwarfs offer gives them an edge over M dwarfs, as fewer violent storms enhance volatile delivery and biosignature detection, and overall provide more of a fighting chance for life. However, we’re uncertain how common small rocky planets are around K dwarfs, and there hasn’t been much study on the kinds of climates K-dwarf planets could have. The authors thus set out to simulate two potentially habitable scenarios on both K-dwarf and M-dwarf planets with the goal of understanding how dayside climate and water availability vary between host stellar types.
For both scenarios, they assume tidally locked planets with Earth-like radii and surface gravities, and simplified atmospheres and orbits. They model the M-dwarf host star after AD Leonis and the K-dwarf host star after Epsilon Eridani. For both stellar classes, today’s authors play with water worlds and sand worlds (planets with surfaces made entirely of sand) by varying their orbital periods and instellation fluxes — the amount of stellar flux received by a planetary surface. An overview of how these planets’ temperatures vary across their surfaces can be seen in Figure 1.

Figure 1: A diagram of the surfaces of different K-dwarf and M-dwarf hosted planets simulated by the authors projected onto a 2D map, and how their temperature varies across the surface. The center of each projection corresponds to a latitude of 0 degrees and a longitude of 0 degrees. The top two rows correspond to planets hosted by an M dwarf, where the top row contains water worlds, and the bottom row contains sand worlds. The bottom two rows contain planets hosted by a K dwarf, where the top contains water worlds and the bottom contains sand worlds. Instellation flux values increase from left to right. [Lobo & Shields 2024]
It’s an Eyeball Summer
The K-dwarf water world planets today’s authors simulate are home to an “eyeball” regime, where the dayside contains a habitable region with moderate temperatures on surface areas where the star is nearly directly overhead, somewhat resembling an eyeball, and the nightside is dominated by freezing cold temperatures. These make up the third row in Figure 1.
The authors find that with increasing instellation, these planets inch closer to the moist greenhouse limit, the point at which surface temperatures become too high to support liquid water, leading to the evaporation of a planet’s atmosphere. We might expect this to happen with increased instellation flux or decreased orbital distance. One simulated K-dwarf planet surpasses this limit once instellation flux is ramped up over 50%. But surprisingly, the nightside is still frozen! Meanwhile, a similar M-dwarf planet with 50% increased instellation flux enters a runaway greenhouse state, where evaporating oceans become trapped in the atmosphere, preventing heat escape. This leads to an uninhabitable rise in temperature, much like a pressure cooker.
The K-dwarf planets’ resistance to increased instellation seems to support the notion of them being more stable than their M-dwarf-hosted cousins, but there’s more to the tale than this.
Life in The Terminator Zone
The second scenario is characterized by a “terminator band.” This is a world of extremes where the dayside is home to hellish temperatures and the nightside is uninhabitably cold, yet a temperate band persists at the boundary where day and night meet. As seen in Figure 1, temperate terminator zones can exist even on “eyeball” planets. It turns out that, depending on whether a planet has reached the moist greenhouse limit, the terminator might be easier to analyze on actual observed planets, as it tends to be cloud-free at lower instellations.
Unfortunately, the terminator zone never reaches habitable temperatures on water worlds around K dwarfs or M dwarfs. Terminator habitability does occur for some M-dwarf and K-dwarf sand worlds, and one K-dwarf planet even becomes a borderline case, where the eyeball center is uninhabitably hot but most of the dayside is habitable.
Simulated M-dwarf and K-dwarf sand planets have been found to fall into terminator habitability zones in the inner habitable zone, and one might be tempted to conclude that cooler dayside temperatures make K-dwarf planets less likely to contain habitable terminators when placed in the outer habitable zone. However, the authors state this may vary on planetary surface composition and orbital distance, as darker materials such as basalt could absorb more stellar energy, keeping the terminator warmer for longer at greater orbital distances.
Which is Better for Habitability?
While planets hosted by M dwarf and K dwarfs experience similar climate trends, it takes different instellations to incur different states, which in themselves can look different depending on the host stellar type. While it took much more instellation flux for a K-dwarf planet to reach the moist greenhouse limit, its nightside was still frozen. This might seem like straightforward evidence for planets around K dwarfs being more stable in general, but the authors state that dayside water retention might be more difficult than expected, as much of the water would be packed into the nightside.
While K-dwarf systems might be more stable for habitability, water worlds may be easier to find in the mid to outer Goldilocks zone. Rocky worlds might be better found in the inner zone, although we don’t know how common they are around K dwarfs yet.
Where Would You Live?
With future expected advances in telescope power, such as the upcoming Large UV/Optical/IR Surveyor (LUVOIR) mission, it should eventually become easier to observe K-dwarf-hosted planets and learn more about their compositions and atmospheres. Then we can find out more about their ability to retain water.
With this in mind, where would you want to live? A planet hosted by an M dwarf or a K dwarf?
Original astrobite edited by Kat Lee.
About the author, Diana Solano-Oropeza:
I’m a first-year astronomy PhD student at Cornell University, where I study exoplanets, stars, and habitability using Gaia data. I earned my BS in physics at Drexel University before entering the Bridge to the PhD in STEM program at Columbia University. There, I researched TESS-detected exoplanets for two years. My hobbies include practicing Muay Thai, fictionwriting, and playing video games. You can check out my website at https://dianasolano-oropeza.com/.
The post It’s An Eyeball Summer, and Other Weird K/M-Dwarf Habitable Climate Tales appeared first on AAS Nova.
]]>
Researchers have detected about a thousand powerful yet fleeting radio signals called fast radio bursts. What do the home galaxies of these bursts tell us about where they come from?
The post Homing In on Host Galaxies of Fast Radio Bursts appeared first on AAS Nova.
]]>
Example of a signal from a nearby fast radio burst. The top panel shows the overall intensity over time, while the bottom panel shows the frequency of the burst over time. [Adapted from Bhardwaj et al. 2024]
Mysterious Bursts
Fast radio bursts are powerful, milliseconds-long flashes of radio waves of unknown origin. Since the first fast radio burst was discovered in 2007, astronomers have detected roughly a thousand of these mysterious signals. The source of these bursts is still up for debate, with supernovae, magnetars, colliding objects, and other energetic phenomena tapped as candidates.
To understand the origin of these bursts, it helps to know what kind of galaxies they happen in. If fast radio bursts emerge from spiral galaxies with active star formation, it could mean that the bursts are linked to “prompt” formation channels such as the deaths of short-lived massive stars. If instead bursts come from elliptical galaxies with little or no star formation, that could imply that bursts come from “delayed” channels like the slowly progressing mergers of stellar remnants. So, what kind of galaxies do fast radio bursts tend to come from?
In the Neighborhood
Mohit Bhardwaj (Carnegie Mellon University and McGill University) and collaborators turned to data from the Canadian Hydrogen Intensity Mapping Experiment (CHIME) to answer this question. Their aim was to study fast radio bursts in the local universe since a sample of nearby bursts is less likely to be affected by observational biases. To find nearby bursts, Bhardwaj’s team searched the first CHIME fast radio burst catalog for signals with low dispersion measure. On average, the farther the source, the larger the dispersion measure — essentially, because there’s more stuff in between the source and Earth to disperse the radio signal.

Visible-light images of the localization regions of the four fast radio bursts in this study. The red boxes indicate the most likely host galaxy for each burst. Note that FRB 20181223C has four potential host galaxies (red and cyan boxes in the upper-left image), but only one that satisfied the source’s maximum redshift limit. Click to enlarge. [Bhardwaj et al. 2024]
A Spiral Sample
Including the four bursts with newly identified host galaxies from this work, researchers have now localized the positions of 18 nearby fast radio bursts. What ties these burst-hosting galaxies together, if anything? As it turns out, they’re all spiral galaxies. That’s an intriguing result, but does it necessarily mean that fast radio bursts are more likely to come from spiral galaxies, or is it just easier to detect fast radio bursts from spiral galaxies?

The host galaxies of all 18 local universe fast radio bursts used in this study. Click to enlarge. [Bhardwaj et al. 2024]
Bhardwaj’s team noted that this doesn’t mean all fast radio bursts must come from supernovae; because a small number of known bursts have arisen in unusual locations like globular clusters and non-star-forming spiral galaxies, delayed pathways like mergers of stellar remnants may be responsible for certain bursts.
Citation
“Host Galaxies for Four Nearby CHIME/FRB Sources and the Local Universe FRB Host Galaxy Population,” Mohit Bhardwaj et al 2024 ApJL 971 L51. doi:10.3847/2041-8213/ad64d1
The post Homing In on Host Galaxies of Fast Radio Bursts appeared first on AAS Nova.
]]>
Stars hundreds of times the mass of the Sun likely formed during the universe's debut into star formation. Could the star J1010+2358 be a direct descendant of one of these elusive first-generation massive stars?
The post Complex Composition: The Origins of J1010+2358 appeared first on AAS Nova.
]]>Editor’s Note: Lexi Gault is a fourth-year graduate student at Indiana University who was recently selected as the 2024–2025 AAS Media Fellow. We’re excited to welcome Lexi to the team and look forward to featuring her writing on AAS Nova regularly!
Once thought to be a pure descendant of one the universe’s first stars, new research on star J1010+2358 uncovers a more complex history.
The First Stars and Their Violent Ends
During the universe’s debut into star formation, only hydrogen, helium, and some lithium existed. Without metals (i.e., elements heavier than helium) to efficiently cool the gas, the first generation of stars, called Population III stars, likely formed with much higher masses than any subsequent generation. Based on theoretical modeling, Pop III stars may have had masses hundreds of times the mass of the Sun; however, their true mass distribution is still under investigation.
Some of the most massive Pop III stars likely ended their lives in pair-instability supernovae (PISNe), a type of supernova so energetic and violent it completely rips the star apart, leaving behind no stellar remnant. Metals that formed inside these stars and within their explosions are released into the interstellar medium, creating a newly enriched cosmic soup that fuels the next generation of star formation. Finding stars born out of PISN material, and particularly descendants whose chemical signatures trace back to a single Pop III star, is no simple task, but this detection would provide powerful information about the first stars in the universe.
Measuring Chemical Abundances
With a low metallicity and unique chemical abundance pattern, the star J1010+2358 was initially suggested to have been formed from the gaseous remains of a single 260-solar-mass Pop III star. However, more recent analysis suggests that the star’s origins are more ambiguous, perhaps obtaining only 10% of its metals from such a PISN.

Measured chemical abundance pattern of J1010+2358 (red stars). Multiple model predictions are overlaid; the dashed gray line shows a 100% 260-solar-mass PISN contribution, indicating an ill fit to the data. Click to enlarge.
[Skúladóttir et al. 2024]
Likely Origins of J1010+2358
How, then, did J1010+2358 obtain its interesting chemical composition? Through applying theoretical models for various progenitor combinations, Skúladóttir’s team found a best fit where the star’s metals come from a combination of a 13-solar-mass second-generation star that underwent a core-collapse supernova and a 39-solar-mass Pop III core-collapse supernova. They considered multiple scenarios with the star obtaining some of its metals from a 260-solar-mass PISN, but all plausible fits have PISN contributions too low to further characterize the mass distribution of first-generation stars.

Quality of fit results for J1010+2358 containing two progenitors, with one being a PISN of a given mass and fraction of metal contribution and the other being a 13-solar-mass second-generation star that underwent a core-collapse supernova. Values 2 and below are best quality fits and most plausible progenitor scenarios. Click to enlarge. [Skúladóttir et al. 2024]
Citation
“On the Pair-instability Supernova Origin of J1010+2358,” Ása Skúladóttir et al 2024 ApJL 968 L23. doi:10.3847/2041-8213/ad4b1a
The post Complex Composition: The Origins of J1010+2358 appeared first on AAS Nova.
]]>
Please join us in saying farewell to our 2022–2024 AAS Media Fellow and welcoming our new Fellow to the team!
The post Welcome to AAS Media Fellow Lexi Gault and Farewell to Ben Cassese appeared first on AAS Nova.
]]>In 2017 we announced a new AAS-sponsored program for graduate students: the AAS Media Fellowship. This quarter-time opportunity is intended for current graduate students in the astronomical sciences who wish to cultivate their science-communication skills.

Lexi Gault (Indiana University) has been selected as the 2024–2025 AAS Media Fellow.
We are pleased to announce that Lexi Gault, an astronomy PhD candidate at Indiana University, has been selected as our AAS Media Fellow for 2024–2025.
Lexi majored in astronomy and mathematics at Valparaiso University, with minors in French and studio art. Now a fourth-year graduate student at Indiana University, Lexi works with Betsey Adams (ASTRON) and John Salzer to study the impacts of stellar feedback-driven outflows on the interstellar medium in nearby low-mass galaxies.
Outside of research, Lexi participates in a number of community outreach activities and serves as a research mentor. She’s also been to the top of the Green Bank Telescope a few times, most recently as a participant in the Green Bank Observatory Single Dish Summer School in 2023!

Lexi (front row, just right of center) with the participants of the 2023 Single Dish Summer School. [Green Bank Observatory; CC BY-NC-ND 2.0]
As we welcome Lexi to the team, we’ll also soon bid farewell to Ben Cassese, our 2022–2024 AAS Media Fellow. Ben will be continuing his PhD studies at Columbia in the Cool Worlds Lab under David Kipping, where he is searching for moons around extrasolar planets. Following his enjoyable and enriching time as the Media Fellow, he hopes to pursue some freelance science writing and will be sure to say hi to the press team at future AAS meetings.
Please join us in welcoming Lexi as our new Media Fellow and wishing Ben the best in all his future endeavors!
The post Welcome to AAS Media Fellow Lexi Gault and Farewell to Ben Cassese appeared first on AAS Nova.
]]>
Astrobites reports on a hunt for intermediate-mass black holes and what this search tells us about how black holes formed in the early universe.
The post Can We Please Have the Black Hole Origin Story? appeared first on AAS Nova.
]]>Editor’s Note: Astrobites is a graduate-student-run organization that digests astrophysical literature for undergraduate students. As part of the partnership between the AAS and astrobites, we occasionally repost astrobites content here at AAS Nova. We hope you enjoy this post from astrobites; the original can be viewed at astrobites.org.
Title: Merger-Driven Growth of Intermediate-mass Black Holes: Constraints from Hubble Space Telescope Imaging of Hyper-luminous X-Ray Sources
Authors: R. Scott Barrows et al.
First Author’s Institution: University of Colorado Boulder
Status: Published in ApJ
Who doesn’t love a good origin story? How did your favorite superheroes and supervillains become one in the first place? Sometimes, it may boil down to a single instant, like that fateful night when Bruce Wayne and his parents took a turn down a dark alley. Occasionally, they evolve slowly, through several internal battles, to emerge as the greatest supervillain in the Galactic Empire. Regardless of how they became some of the most powerful characters in the fictional (or real) universe, there is no question that origin stories help us understand them better.
Our very universe has (super) entities whose origin story is shrouded in mystery. These are the supermassive black holes, which are powerful objects that occupy the centers of nearly every galaxy in the universe. These black holes are believed to have been around for billions of years (some were even formed when the universe was very young) and are some of the most massive and luminous objects in the universe. However, we still don’t understand how the first black holes formed. The enthusiastic astronomy community has been hard at work trying to come up with an origin story. Some astronomers believe that the first black holes formed when the first stars in the universe died, while others believe they formed when dense gas in the early universe directly collapsed into black holes without forming stars first.
So, how can we determine the true origin story of the black hole? We look for clues in the universe that we see through our telescopes. One way is by looking at the masses of certain black holes called intermediate-mass black holes. These are believed to be relics of early black holes that have survived relatively unscathed to our present universe. If most of these black holes have low masses (102 – 104 solar masses), they were likely to have formed from the collapse of early stars. If they instead have masses around 104– 105 solar masses, then they were formed from the collapse of dense gas. This difference in mass is a likely consequence of the conditions involved in the collapse scenario.
It is challenging to detect intermediate-mass black holes in the first place, let alone measure their masses. The authors of today’s article set out to achieve this mighty task! They first identify a sample of hyper-luminous X-ray sources. As the name suggests, these are highly luminous X-ray sources, and they are detected at off-center locations in a galaxy. This characteristic makes it likely that they are linked to intermediate-mass black holes. Intermediate-mass black holes are more likely to wander and can be found in different parts of a galaxy, as opposed to supermassive black holes, which are always found at the centers of galaxies. The authors then use the Hubble Space Telescope to look at these hyper-luminous X-ray sources and their surroundings to understand them better. Let’s see the clues the authors gather to formulate their theory of the formation mechanism of black holes.
Clue No. 1: Violent Disruptions Found at the Scene of the Crime!
The authors find that the strongest X-ray sources are associated with systems showing signs of mergers between galaxies. The hyper-luminous X-ray sources do not reside in a definite galaxy (Figure 1) but rather in a compact source that more closely resembles the core or center of a galaxy. The authors also measure the masses of the objects that host the X-ray sources using spectral energy distributions and the flux measured by Hubble. They find that nearly all the masses of the objects are larger than typical globular clusters and, thus, they are more likely to be the leftovers of dwarf galaxies that have merged or are merging with the more massive galaxy.
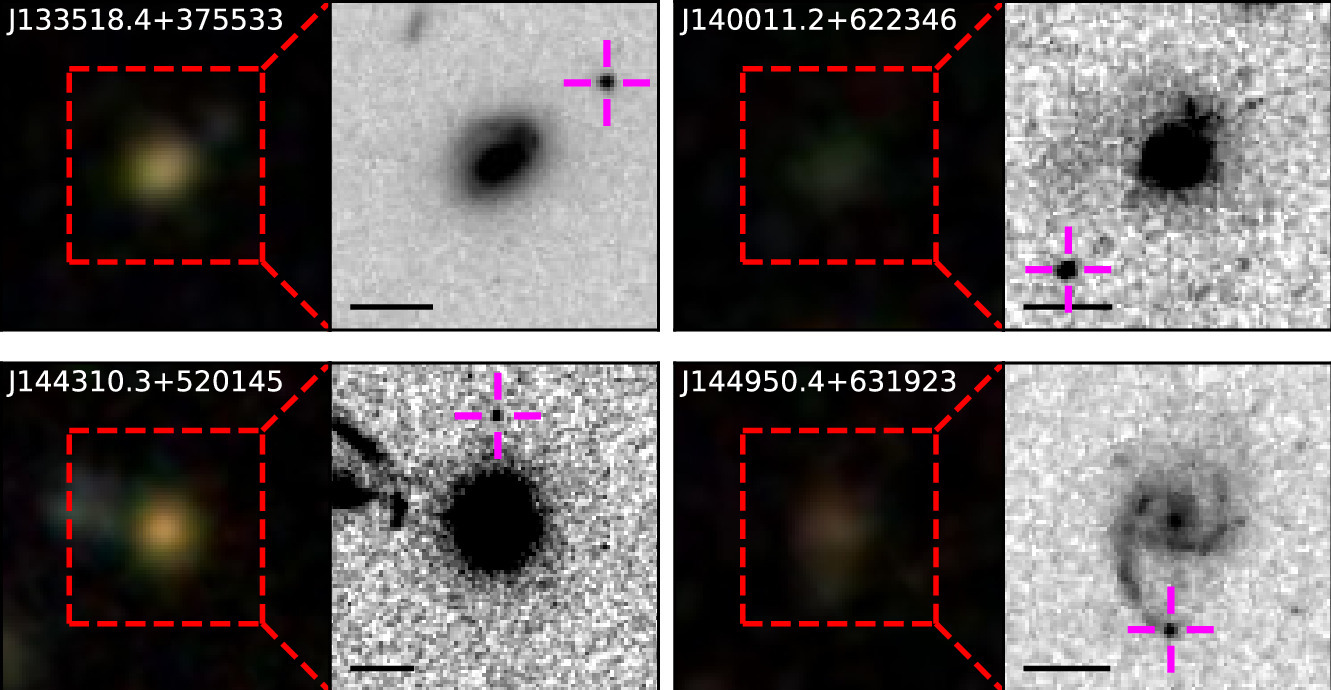
Figure 1: The Sloan Digital Sky Survey images (left) and Hubble images of the hyper-luminous X-ray source candidates (highlighted by the magenta pointers). Each candidate lies outside/on the edge of a larger galaxy in the center of each Hubble image. [Adapted from Barrows et al. 2024]
Clue No. 2: What Are the Masses of Those Black Holes?
The authors then use several scaling relations and different Eddington ratios (which give a sense of how quickly the black hole is accreting based on its luminosity) to determine the mass of the black hole. Looking at the lowest-mass black holes (as they are more similar to the early seed black holes) (Figure 2), they conclude that 28% of their samples agree with the direct collapse scenario (which forms more-massive black holes) and 21% with the formation in dense stellar clusters (which forms less-massive black holes).

Figure 2: The total fraction of black hole masses (determined from scaling relations) in hyper-luminous X-ray sources, added over the sum of each contribution from black holes at different mass ranges. The data has been corrected to be mass-complete, which determines how many sources are present in a field based on the number of sources detected. [Barrows et al. 2024]
The Plot Thickens!
Looking at the larger masses of the intermediate-mass black holes, it is tempting to conclude that we have narrowed the origin story of black holes to the direct collapse scenario. However, since most of the hyper-luminous X-ray sources are found in galaxies closely associated with merger events, the authors argue that the gas falling into the black hole during the galaxy merger could have triggered the increase in the size of the black hole seeds from their original mass. They determine that the low-mass X-ray sources all have larger X-ray luminosities than expected from their host stellar masses. This could hint that accretion likely increases the size of the black hole, which leads to enhanced luminosity. The original black hole seeds were thus likely much smaller, suggesting they were formed from stars.
Well, that was full of twists and turns! This article has added some evidence favoring the stellar collapse formation mechanism. With more data and further analysis, we will one day end up with convincing numbers to help us determine how the first black holes in the universe formed. And hey! If I could sit through all of those 7 hours and 1 minute to find out how Anakin Skywalker became Darth Vader, I think I would be fine waiting a couple more years (hopefully!) to uncover the origin story of these mighty black holes!
Original astrobite edited by Storm Colloms.
About the author, Archana Aravindan:
I am a PhD candidate at the University of California, Riverside, where I study black hole activity in small galaxies. When I am not looking through some incredible telescopes, you can usually find me reading, thinking about policy, or learning a cool language!
The post Can We Please Have the Black Hole Origin Story? appeared first on AAS Nova.
]]>
An asteroid named Apophis is almost definitely going to miss Earth during a close flyby in 2029. But could it be diverted onto a more dangerous path through a collision with a smaller asteroid before then?
The post The Odds of the Unthinkable appeared first on AAS Nova.
]]>As you read this, an asteroid named 99942 Apophis is spiraling along a trajectory that will bring it uncomfortably close to Earth in about five years’ time. Thankfully, astronomers are very confident that this 340-meter ball of rock will miss us and instead will squeak between Earth and the Moon on 13 April 2029 before continuing on its way through the solar system. But such a close brush with disaster inspires reflections on worst-case scenarios. Even though everything we know about the laws of physics tells us that Apophis won’t collide with Earth on its current trajectory, could anything happen between now and the flyby that would change that?
Unlikely Odds

Illustration of different hypothetical trajectories Apophis could be on as it approaches Earth. An animated version can be seen here. [Wiegert 2024]
Luckily, almost definitely not. But, unsurprisingly given a situation as complicated as orbital dynamics and city-destroying impacts, there are caveats. While Wiegert estimates that the odds of Apophis stumbling into an asteroid larger than 3.6 meters across — large enough to divert Apophis into Earth — are about two in a billion, the odds of it encountering a smaller asteroid are higher. He estimates there’s about a one in a million chance that Apophis could strike an asteroid bigger than 60 centimeters, which in theory would be large enough to nudge Apophis onto an orbit that would still miss us in 2029, but would then lead to an impact later (in 2036, for example). We’d have to be doubly unlucky for this to happen, since even in this unlikely event, most small impacts leave Apophis on paths that take it farther from Earth in the future, not towards it. So, there’s certainly no need for alarm, but it will be worth monitoring Apophis in the coming years to make sure it hasn’t strayed from its safe path.
Sneaky Asteroid
There lies an unfortunate twist to this story, however: we can’t actually observe Apophis until early 2027, at best, so we have no way to know if it’s been jostled onto a dangerous trajectory until then. The asteroid has been lurking too close to the Sun for telescopes to safely see it since 2021, so our next look at it will come after a significant gap in time.

Illustration of the angle between Apophis and the Sun, as seen from Earth. The yellow band denotes geometries where telescopes cannot observe the asteroid. [Wiegert 2024]
When it comes to something as serious as asteroid impacts, it’s good to double-check every assumption and to investigate even the most unlikely scenarios. Thankfully Earth is almost certainly safe from an asteroid impact in 2029, though up until then and beyond, astronomers will be sure to keep checking for signs of danger.
Citation
“On the Sensitivity of Apophis’s 2029 Earth Approach to Small Asteroid Impacts,” Paul Wiegert 2024 Planet. Sci. J. 5 184. doi:10.3847/PSJ/ad644d
The post The Odds of the Unthinkable appeared first on AAS Nova.
]]>
Hot Jupiter TOI-1480 b just got a new companion. What does this mean for how hot Jupiters form?
The post Finding a Friend for a Hot Jupiter appeared first on AAS Nova.
]]>Are hot Jupiters lonely, or do they have nearby planetary companions? The answer may depend on how these close-in planets form. A recent discovery adds to the small number of known systems containing a hot Jupiter and an inner planet companion and provides clues to hot Jupiter formation.

Planets form in protoplanetary disks, like the one pictured here around the star TW Hydrae. Interactions between young planets and the gas of the disk can cause planetary migration. [S. Andrews (Harvard-Smithsonian CfA); B. Saxton (NRAO/AUI/NSF); ALMA (ESO/NAOJ/NRAO)]
The Origins of Hot Jupiters
Hot Jupiters are among the strangest creatures in the exoplanet zoo. These worlds, which are roughly the mass of Jupiter, orbit extremely close to their host stars, achieving temperatures far hotter than the giant worlds in our solar system.
It’s not yet clear how hot Jupiters come to be. Do they form in place, vacuuming up massive amounts of gas in the blazing heat of their host stars? Do they get their start in cooler regions and then migrate to warmer pastures as they form? Or do they form far from their stars, then get kicked closer by gravitational interactions that dramatically change their orbits? To learn more, researchers are collecting all the information on hot Jupiters that they can — and they’re especially interested in the company that hot Jupiters keep.
Close Companions
So far, astronomers know of only a handful of hot Jupiters that have planetary companions whose orbits lie between the hot Jupiter and the host star. Certain theories of hot Jupiter formation, like high-eccentricity migration, predict that inner planets will be ejected or destroyed when a giant planet migrates from a distant orbit to a close-in one, becoming a hot Jupiter. To understand whether high-eccentricity migration is the main way that hot Jupiters form, as current observations suggest, researchers must understand how common these close-in companions are.

Normalized transit signals from the newly discovered inner planet TOI-1408 c (top) and the previously known hot Jupiter TOI-1408 b (bottom). [Adapted from Korth et al. 2024]
Searching through the TESS light curves, the team found evidence for a planet with that orbital period. They suspect that the automated TESS transit search pipeline missed the planet because of its large transit timing variations. Modeling suggests a mass of 7.6 Earth masses and a radius of 2.22 Earth radii, making TOI-1408 c a mini-Neptune planet.
Far-Out Findings
TOI-1408 b has joined the small but growing ranks of hot Jupiters with low-mass inner planet companions. This finding suggests that TOI-1408 b couldn’t have formed through high-eccentricity migration. Instead, in-situ formation or disk migration must be responsible.
The data analyzed in this work held another surprise: TOI-1408 c might not be the only new member of the TOI-1408 family! Korth’s team used radial velocity modeling to search for other planets and found clear evidence for another object in the system with a period of thousands of days. While more follow-up observations are needed to narrow in on the precise properties of this object, Korth’s team suggests it has a mass of roughly 14.6 Jupiter masses and an orbit lasting nearly 7 years.
Citation
“TOI-1408: Discovery and Photodynamical Modeling of a Small Inner Companion to a Hot Jupiter Revealed by Transit Timing Variations,” Judith Korth et al 2024 ApJL 971 L28. doi:10.3847/2041-8213/ad65fd
The post Finding a Friend for a Hot Jupiter appeared first on AAS Nova.
]]>
Astrobites reports on the radio signals from stars being ripped apart by supermassive black holes.
The post Black Hole Fireworks: Tidal Disruption Events Light Up Supermassive Black Holes appeared first on AAS Nova.
]]>Editor’s Note: Astrobites is a graduate-student-run organization that digests astrophysical literature for undergraduate students. As part of the partnership between the AAS and astrobites, we occasionally repost astrobites content here at AAS Nova. We hope you enjoy this post from astrobites; the original can be viewed at astrobites.org.
Title: Late-Time Radio Flares in Tidal Disruption Events
Authors: Tatsuya Matsumoto and Tsvi Piran
First Author’s Institution: Kyoto University
Status: Published in ApJ
Hungry (and Loud) Black Holes
Tidal disruption events arise when a star wanders too close to a supermassive black hole that then exerts a tidal force across the star, shredding it. These events are relatively rare: we have only discovered a few hundred. When the star is disrupted, about two-thirds of the material remains bound. The remaining material is ejected from the supermassive black hole into the “circumnuclear medium,” or the region immediately surrounding the supermassive black hole. We typically discover tidal disruption events from the optical emission resulting from the initial disruption, which lasts several weeks. However, tidal disruption events are known to be multi-wavelength events visible across the electromagnetic spectrum. Before optical tidal disruption events were discovered, almost all of the tidal disruption events were found in the X-ray, where the formation of an accretion disk around the supermassive black hole may be powering some high-energy activity. On the other end of the spectrum, the radio properties of tidal disruption events have proven to be unique. Today’s article aims to explain the radio light curves of tidal disruption events.
The radio emission from tidal disruption events is caused by the material that survives the disruption of the star and is ejected away from the supermassive black hole. This stellar material runs into the ambient density surrounding the supermassive black hole, causing shocks inside the material. These shocks give rise to synchrotron radiation, an emission caused by free electrons in a plasma spiraling around magnetic field lines. Directly related to the density and energy of the material, the synchrotron radiation is emitted across the radio spectrum, typically at frequencies lower than 10 GHz, making it an excellent choice for instruments like the Very Large Array.
Second Peak, Second Life?
Although we know about a third of the material from the star is ejected away from the supermassive black hole after the disruption, we do not understand how the black hole launches this material. For example, supermassive black holes in active galactic nuclei can launch powerful relativistic jets as they accrete massive amounts of material. Or, in a less energetic scenario, a jet does not have to be launched, and the outflows could be in all directions and essentially non-relativistic. In yet another situation, the delayed formation of an accretion disk may induce a relativistic jet to be launched much later than the initial disruption. To complicate matters further, it is almost certain that tidal disruption events do not originate from an underlying homogeneous population and that a spectrum of disruption scenarios results in many different ejecta geometries.
Today’s article uses the non-relativistic approach to model the tidal disruption event scenario. The authors model a shock quasi-spherically propagating first through a circumnuclear medium with a radially decreasing density and then through an interstellar medium with constant density. Using a standard set of code and modeling packages for synchrotron emission, they produce light curves for what this model should look like. In this model, there are two peaks caused by differing effects. The radio emission is “self-absorbed” in the first peak and transitions to optically thin, eventually peaking. By measuring the peak frequency and luminosity, we can estimate the radius of the outflow and local circumnuclear medium density. Then, depending on the spectral index of the circumnuclear medium’s radial density profile, the light curve will fall and eventually reach a minimum at the Bondi radius of the supermassive black hole. At this point, the radial density profile becomes flat (i.e., constant density interstellar medium), and the radio light curve will rise again as the shock wave sweeps up material. The brightness will continue to increase until the swept-up mass is comparable to the mass from the original ejected outflow. After the second peak, the radio brightness decreases indefinitely.
How does this model compare to some real scenarios? The authors of today’s article select two well-known events from the literature and gather radio observations to compare with their modeled light curves. When comparing AT2019dsg and AT2020vwl, the double-peaked feature is evident in both light curves, as seen in Figure 1. The authors note that while the rapid t3 initial rise is well explained for both sources, other radio-loud tidal disruption events, such as AT2018hyz, rise even faster like t5 and thus are better candidates for relativistic models. The authors state that further observations at even later times will enable improvements to this model and constrain their parameters.
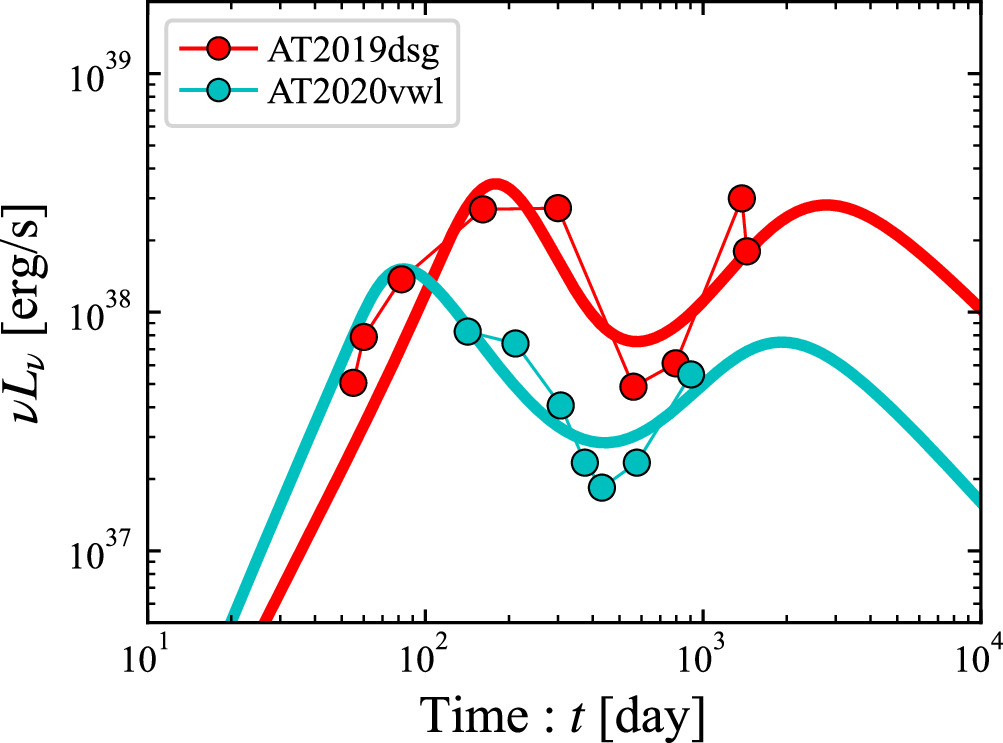
Figure 1: The late-time C-band (6 GHz) radio light curves of AT2019dsg and AT2020vwl. These sources have some of the best data quality and quantity in the literature. The double-peaked feature of our authors’ model is evident in the light curves of both events. [Matsumoto & Piran 2024]
About the author, Will Golay:
I am a graduate student in the Department of Astronomy at Harvard University and the Center for Astrophysics | Harvard & Smithsonian, advised by Edo Berger. I study radio emission from transient astrophysical objects like tidal disruption events.
The post Black Hole Fireworks: Tidal Disruption Events Light Up Supermassive Black Holes appeared first on AAS Nova.
]]>
Recent upgrades to a powerful neutrino detector may help us spot future nearby supernovae before they burst onto the scene in visible light.
The post The Quest to Watch a Supernova in Real Time appeared first on AAS Nova.
]]>A kilometer below Japanese ground lies a massive cylindrical tank, its steel walls lined with more than 10,000 photomultiplier tubes that await the arrival of neutrinos. Could recent upgrades to the Super-Kamiokande neutrino detector improve our ability to spot and assess supernova explosions in real time?

JWST image of SN 1987A. The optical signal of this explosion was preceded by the arrival of a burst of neutrinos, a handful of which were observed by detectors on Earth. [NASA, ESA, CSA, Mikako Matsuura (Cardiff University), Richard Arendt (NASA-GSFC, UMBC), Claes Fransson (Stockholm University), Josefin Larsson (KTH)]
Memo from a Dying Star
In 1987, 25 tiny messengers arrived at Earth following a tremendous explosion 168,000 light-years away. This signal marked the first time that these near-massless messengers — neutrinos — had ever been directly observed from a Type II supernova, the core collapse of a massive star.
The benefit of observing these particles is clear: because neutrinos so rarely interact with matter, they arrive at Earth carrying untouched information about the death of the star that produced them. And because neutrinos escape the collapsing star more readily than photons do, they arrive before the visible light from the supernova. This means that if scientists can detect and localize a supernova neutrino burst, they can notify observatories about the imminent optical signal from the supernova. Combining the neutrino and electromagnetic observations could then provide valuable insight into long-standing questions, like the mechanism of the star’s explosion.
The catch? We only expect a handful of nearby (i.e., in our galaxy) supernova explosions every century — and what’s more, observing neutrinos is no easy feat! In the nearly four decades since those 25 messengers heralded the supernova SN 1987A, we haven’t detected any other neutrinos linked to supernovae. But that doesn’t mean we haven’t been preparing.
A Salty Upgrade for Super-K

A scale model showing the (empty) tank of the underground Super-K neutrino detector. A recent upgrade saw a gadolinium salt added to the water that fills the tank. [Adapted from Wikipedia user Motokoka; CC BY-SA 4.0]

In a recent article led by Yuri Kashiwagi (Kamioka Observatory, Institute for Cosmic Ray Research, University of Tokyo), Super-K scientists have analyzed how this upgraded observatory — and a corresponding real-time alert system developed to notify optical astronomers of the explosion and tell them where to point their telescopes — will respond to a hypothetical supernova within our galaxy.
Passing the Message On
Using multiple different supernova models, Kashiwagi and collaborators simulated the neutrino burst that would be produced by a supernova exploding roughly 33,000 light-years away. Through further simulations, the team then explored how successfully Super-K would detect neutrinos from the burst, how well the supernova’s location could be identified from Super-K’s detections, and how quickly this information could be broadcast to astronomical observatories via the alerting system.
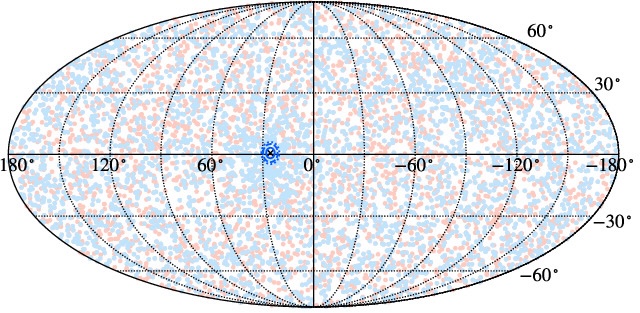
The blue contours on this sky map show an example of the reconstructed supernova position that Super-K neutrino observations should provide for a supernova that occurs 33,000 light-years away. In this example, the supernova’s location can be identified to within 3°. [Adapted from Kashiwagi et al. 2024]
While there’s still more to learn, it seems likely that Super-K is well prepared for future nearby supernova detections. Now all that’s left is to wait for the next explosion!
Citation
“Performance of SK-Gd’s Upgraded Real-time Supernova Monitoring System,” Y. Kashiwagi et al 2024 ApJ 970 93. doi:10.3847/1538-4357/ad4d8e
The post The Quest to Watch a Supernova in Real Time appeared first on AAS Nova.
]]>
From planetary systems to colliding galaxies, the universe is full of intricate structures. This month's roundup examines where three vastly different types of structures come from.
The post Monthly Roundup: Rings, Chains, and Bubbles appeared first on AAS Nova.
]]>Today’s Monthly Roundup is a bit of an astrophysical mishmash, highlighting some of the structures that exist in our universe. From galaxies to planets, we’ll explore where these structures come from and the tools researchers use to study them.
A Ring Galaxy
When gamma-ray telescopes like Fermi survey the sky, they see discrete sources of gamma rays as well as a diffuse background glow. Discerning exactly where these gamma rays come from is no easy task, and roughly 30% of known gamma-ray sources haven’t been identified. Many of these unassociated sources are likely active galactic nuclei (AGN) — accreting supermassive black holes that can launch powerful jets — but some may have more unusual origins.

An ultraviolet image (background color) of the Kathryn’s Wheel system with contours showing the Hα emission. Annotations have been added to show the various components of this system. Click to enlarge. [Adapted from Paliya & Saikia 2024]
Multiwavelength images of Kathryn’s Wheel show bright Hα and ultraviolet emission, both of which signal the presence of hot, massive young stars. Intense star-forming regions are known to emit gamma rays, in part because of the frequent core-collapse supernovae that shock interstellar gas and accelerate cosmic rays. A closer look at the galaxy revealed that its gamma-ray emission is stronger than expected, suggesting either a population of rapidly spinning stellar remnants called pulsars or — as a more mundane explanation — interference from a foreground Milky Way star.
In addition to triggering star formation, galaxy collisions can also activate AGN. While the current data show no signs of gamma-ray variability or relativistic jets — both of which would indicate an AGN — more observations are needed to look into the possibility further.
High-Energy Bubbles
In 2010, scientists discovered that the Milky Way has been blowing bubbles. Observations with the Fermi Gamma-ray Space Telescope revealed bubbles of gamma-ray emission extending 50 degrees above and below the plane of our galaxy. Ten years later, the eROSITA instrument on the Spectrum-Roentgen-Gamma spacecraft spotted a similar but even more extensive structure in X-rays. The origin of these structures, called the Fermi and eROSITA bubbles, is not yet known. Many researchers have suggested that a past period of AGN activity, in which the Milky Way’s central supermassive black hole accreted matter and shot out powerful jets, could be responsible.
Recently, Po-Hsun Tseng (National Taiwan University) and collaborators approached the AGN activity hypothesis from a new angle. Previous work has tested this theory under the assumption that the AGN jets emerged vertically from the plane of the galaxy, matching the orientation of the bubbles. However, this doesn’t have to be the case — the direction of an AGN’s jets is related to the spin of the black hole, which doesn’t have to be parallel to the galactic disk.

Simulated gamma-ray bubbles from jets emerging perpendicular to the disk (top), at a 45-degree angle to the disk (middle), and parallel to the disk (bottom). [Adapted from Tseng et al. 2024]
Ultimately, the team found that under certain conditions, the jets transfer their kinetic energy to the dense layer of gas without plowing through it, and the once-narrow jets instead emerge vertically from the disk as bubbles. While more modeling is needed to understand the origin of the Fermi and eROSITA bubbles, this work shows that the assumption of vertical jets need not apply.
A Chain of Planets
When planets form in the dusty recesses of a protoplanetary disk, their motions within the disk are thought to align the planets in a resonant chain: a setup in which the orbital periods of the planets are integer multiples of one another. For example, a three-planet system with 8-, 16-, and 32-day orbits would be in a resonant chain. If planets do link up in resonant chains when they first form, something — gravitational nudges from passing stars, for example — must break those chains, as only 1% of known planetary systems are in this configuration. It’s critical to identify the small percentage of systems with intact resonant chains since they show the initial state of a planetary system before it’s disrupted.

Cumulative fraction of simulated six-planet systems becoming unstable as a function of time. Nearly all non-resonant systems are unstable by 25 million years, while only a small fraction of six-planet resonant chains go unstable in that same stretch of time. Click to enlarge. [Lammers & Winn 2024]
Lammers and Winn performed N-body simulations to assess the likelihood that the system is arranged in a resonant chain. They found that in order for HD 110067’s six planets to be dynamically stable, the planets almost certainly must be in a chain. Simulated non-resonant systems become unstable within 25 million years — just 0.3% of the current age of HD 110067’s planetary system — and even systems with as many as five planets linked in a chain are unlikely to survive in that configuration to the present day.
Citation
“A γ-Ray-Emitting Collisional Ring Galaxy System in Our Galactic Neighborhood,” Vaidehi S. Paliya and D. J. Saikia 2024 ApJL 967 L26. doi:10.3847/2041-8213/ad4999
“Can the Symmetric Fermi and eROSITA Bubbles Be Produced by Tilted Jets?” Po-Hsun Tseng et al 2024 ApJ 970 146. doi:10.3847/1538-4357/ad50c5
“The Six-Planet Resonant Chain of HD 110067,” Caleb Lammers and Joshua N. Winn 2024 ApJL 968 L12. doi:10.3847/2041-8213/ad50d2
The post Monthly Roundup: Rings, Chains, and Bubbles appeared first on AAS Nova.
]]>
Researchers find even more evidence for planets forming in the disk around TW Hydrae, the nearest protoplanetary disk to Earth.
The post A Baby Planet Reveals Its Hiding Place appeared first on AAS Nova.
]]>A new analysis of archival data reveals shocked gas in the protoplanetary disk surrounding the young star TW Hydrae. This discovery hints at the presence of a 4-Earth-mass planet and gives researchers a rare opportunity to study the earliest stages of planet formation.
Outflows from Planetary Offspring

Hubble Space Telescope image (left) and illustration (right) of the TW Hydrae protoplanetary disk. [NASA, ESA, J. Debes (STScI), H. Jang-Condell (University of Wyoming), A. Weinberger (Carnegie Institution of Washington), A. Roberge (Goddard Space Flight Center), G. Schneider (University of Arizona/Steward Observatory) and A. Feild (STScI/AURA)]
How can we tell if accretion is happening in a protoplanetary disk? As growing planets collect gas and dust, they also launch material into their surroundings in the form of outflows. As outflowing gas pummels its surroundings, shocks form, triggering the formation of molecules like sulfur monoxide (SO). That gives researchers an in — the planet might be hidden, but emission from these shock-formed molecules can announce its position.

Integrated intensity of SO emission (orange and green contours) overlaid on a continuum image of the disk. [Adapted from Yoshida et al. 2024]
An Archival Search
This tells us how to potentially find baby planets, but where to look? One of the best places to search for signs of planet formation is around TW Hydrae, an 8-million-year-old star less than 200 light-years away. TW Hydrae possesses the nearest known protoplanetary disk, which from our vantage point appears nearly face on, with concentric light and dark rings like a bullseye. Researchers previously found two gaps in this disk, at 26 and 42 au, that could be explained by two roughly 4-Earth-mass planets. In addition, a clump of emission at 52 au hinted at the presence of a circumplanetary disk feeding gas to a growing planet.
Tomohiro Yoshida (National Astronomical Observatory of Japan) and collaborators analyzed archival data from the Atacama Large Millimeter/submillimeter Array (ALMA) to search for signs of outflows from a baby planet in the TW Hydrae disk. The team spotted an arc of emission from SO molecules originating from a gap 42 au from the star — exactly where a planet is purported to be.
Shocking Evidence

Best-fitting outflow trajectory (orange line) from the ballistic outflow modeling. [Adapted from Yoshida et al. 2024]
With evidence for outflows already in hand, Yoshida’s team plans to continue the search, conducting further observations to look for evidence of the outflow in emission from other promising molecules, like silicon monosulfide. Overall, this work solidifies another line of evidence for the presence of a planet in the 42-au gap of TW Hydrae, and we can expect future observations to illuminate this growing planetary family further!
Citation
“Outflow Driven by a Protoplanet Embedded in the TW Hya Disk,” Tomohiro C. Yoshida et al 2024 ApJL 971 L15. doi:10.3847/2041-8213/ad654c
The post A Baby Planet Reveals Its Hiding Place appeared first on AAS Nova.
]]>
Astrobites reports on research that brings together data from multiple wavelengths to make a detection of distant 21-cm radiation.
The post Teamwork Makes the Intensity-Mapping Dream Work appeared first on AAS Nova.
]]>Editor’s Note: Astrobites is a graduate-student-run organization that digests astrophysical literature for undergraduate students. As part of the partnership between the AAS and astrobites, we occasionally repost astrobites content here at AAS Nova. We hope you enjoy this post from astrobites; the original can be viewed at astrobites.org.
Title: A Detection of Cosmological 21-cm Emission from CHIME in Cross-Correlation with eBOSS Measurements of the Lyα Forest
Authors: CHIME Collaboration
Status: Published in ApJ
A Map of the Universe
Throughout the history of astronomy, we’ve been able to map the universe in a couple of different ways. Large surveys of galaxies, such as the Sloan Digital Sky Survey (SDSS) or the Dark Energy Spectroscopic Instrument survey, are extremely useful — they give astronomers a huge sample of galaxies to characterize, and the positions of those galaxies tell us about how the universe as a whole is set up. At extremely high redshifts, the cosmic microwave background shows us the structure of the universe right as it began. More recently, a totally separate technique has been developing: (spectral) line-intensity mapping. In this technique, you essentially take a very blurry picture of a large region of the universe at a wavelength that corresponds to a specific spectral line. Instead of targeting specific galaxies, you get all of the emission from that spectral line in that region of the universe. This way, you can get light from things that are much fainter than a traditional galaxy survey can see.
The fact that you’re targeting a specific spectral line is also important: because of the expansion of the universe, emission from different distances is redshifted to different observed wavelengths, and so the end product of a line-intensity mapping experiment is a 3D map of the universe instead of just a 2D picture. Because of the expansion of the universe, this also means you map the universe through time. Figure 1 shows a (very idealized) picture of what a single-wavelength slice of this could look like.

Figure 1: A simulated line-intensity map from a single slice. [NASA / LAMBDA Archive Team]
Neutral About Hydrogen
The line-intensity mapping technique was originally developed for studies of the 21-cm hydrogen line, which is a spin-flip transition of neutral hydrogen mainly emitted by diffuse gas. This is a very powerful technique: it’s extremely difficult to observe neutral hydrogen gas in any other way, and a lot of the universe is made up of this gas, especially at high redshift!
Today’s article is also looking for this 21-cm emission, specifically by using the Canadian Hydrogen Intensity-Mapping Experiment (CHIME; shown in Figure 2). This experiment has been discussed in several astrobites over the past few years, both for its 21-cm work (x) and for its work with fast radio bursts (x, x, x).

Figure 2: The CHIME instrument. [Wikipedia user Z22; CC BY-SA 4.0]
Fighting Foregrounds with Friends
Detecting 21-cm emission is significantly complicated by the fact that there are lots of things in the way! Between Earth and the distant galaxies astronomers are actually after, there are many other sources that emit around a wavelength of 21 cm, including Earth’s ionosphere and synchrotron emission from the Milky Way. These are “foregrounds,” and they’re far brighter than the 21-cm emission astronomers are looking for! Although you can work around foregrounds using 21-cm data alone, combining your 21-cm measurement with other measurements of the structure you’re trying to see (taken using other wavelengths of light) makes for a much more robust approach. Because the two measurements are taken using different wavelengths, it’s very unlikely that they’ll show the same foreground structure. When you use a statistical technique such as cross-correlation to combine the two, the foregrounds (more or less) disappear! This has already been done for the CHIME 21-cm data at low redshifts, but not at redshifts above z = 1.5 (9 billion years ago).
In this research article, the authors combine their 21-cm data with Lyα forest measurements from the extended Baryonic Oscillation Spectroscopic Survey (eBOSS), which is a part of SDSS. Importantly, the Lyα forest traces absorbing hydrogen gas, and the 21-cm data trace emitting hydrogen gas. Density determines whether gas absorbs or emits: denser gas tends to absorb radiation, and more diffuse gas tends to emit radiation. This means that on small scales, the two signals are actually expected to be anti-correlated (because the measurements are coming from different kinds of gas), and the cross-correlation signal will be negative.
A Negative Detection!
Indeed, after reducing the CHIME 21-cm data, the authors do detect anti-correlation! Figure 3 shows the cross-correlation signal. This is measured by introducing an artificial offset in the x-axis (in this case, the frequency axis) between the 21-cm measurement and the Lyα forest measurement, and then measuring how much these two signals correlate or anti-correlate at that offset. The amount of correlation is then shown as a function of this frequency offset. You can see a large negative spike right at zero offset, where the two signals should anti-correlate the most. The dotted black line shows a model the authors came up with for this cross-correlation, and the two agree quite well (the bottom panel shows the residuals between the signal and the model).

Figure 3: Top: The cross-correlation signal shown as a function of offset between the two datasets in the frequency axis. The blue line is the actual CHIME x eBOSS data, and the dotted black line is a model of what the signal should look like, fit to the data in amplitude but nothing else. Bottom: The residuals between the data and the model, expressed in terms of their significance. [Adapted from CHIME Collaboration 2024]
Original astrobite edited by Nathalie Korhonen Cuestas.
About the author, Delaney Dunne:
I’m a PhD student at Caltech, where I study how galaxies form and evolve by mapping their molecular gas! I do this using COMAP, a radio-frequency line-intensity mapping experiment based in California’s Owens Valley.
The post Teamwork Makes the Intensity-Mapping Dream Work appeared first on AAS Nova.
]]>
Data made mesmerizing: check out this swirling visualization of 170 million stars in the Milky Way.
The post Featured Image: A 5D Map of the Milky Way appeared first on AAS Nova.
]]>Ready to be mesmerized by an elegant data visualization? You can now watch the endless, swirling trajectories of 170 million stars in our galaxy using a simple interactive tool. A team led by Joshua Speagle (沈佳士) from the University of Toronto used data from five surveys — the Panoramic Survey Telescope and Rapid Response System (Pan-STARRS), the Two Micron All Sky Survey (2MASS), the United Kingdom Infrared Telescope Infrared Deep Sky Survey (UKIDSS), the “unofficial” Wide-field Infrared Survey Explorer (unWISE), and the Gaia survey — to craft this visualization. In the image above, the color scale shows the tangential speed of stars within a certain distance bin, while the white streamlines show the stars’ tangential velocity. You can play around with the full visualization, which allows you to filter by distance and switch the color overlay between velocity, density, metallicity, and age. To learn more about the data selection process and the construction of the final star catalog, be sure to check out the full research article linked below.
Citation
“Mapping the Milky Way in 5D with 170 Million Stars,” Joshua S. Speagle et al 2024 ApJ 970 121. doi:10.3847/1538-4357/ad2b62
The post Featured Image: A 5D Map of the Milky Way appeared first on AAS Nova.
]]>
NASA is going to send a robot to Uranus someday. When it gets there, how close should it fly to the surface?
The post Plotting the Course, a Billion Miles Away appeared first on AAS Nova.
]]>When the next flagship planetary science mission arrives at Uranus after years of interplanetary travel, it’s going to need to know exactly where it should fly near this poorly mapped, distant world. In a recent study, astronomers attempt to strike a balance between risk and reward and present several possible trajectories.
Visiting a Lonely Planet
Setting our home planet Earth aside for obvious reasons, you might be forgiven for assuming that we’re equally familiar with the remaining seven planets in our solar system. But, even after decades of robotic exploration, this is not the case: though we’ve mapped every inch of Mars and spent years circling Saturn, humanity has only visited Uranus and Neptune once apiece. These visits, which happened more than 30 years ago and lasted only a few hours each, answered some questions about the structure and formation of these planets but left many more unresolved.

An image of Uranus and its rings taken recently by JWST. [NASA, ESA, CSA, STScI]
Before such a mission can begin its investigation in ~2050, however, scientists and engineers need to painstakingly plan out exactly where the spacecraft needs to go and what it needs to carry if it’s going to answer the questions we create it to resolve. A recent study led by Marzia Parisi, Jet Propulsion Laboratory, adds to this effort by considering which orbital trajectory would yield the most useful scientific measurements.
Planning Ahead
Scientists can measure things like the density structure of a planet by tracking how a probe’s speed changes as it travels along its orbit. The closer the spacecraft can get to the planet, the better, since that’s where the subtle effects will be most pronounced.
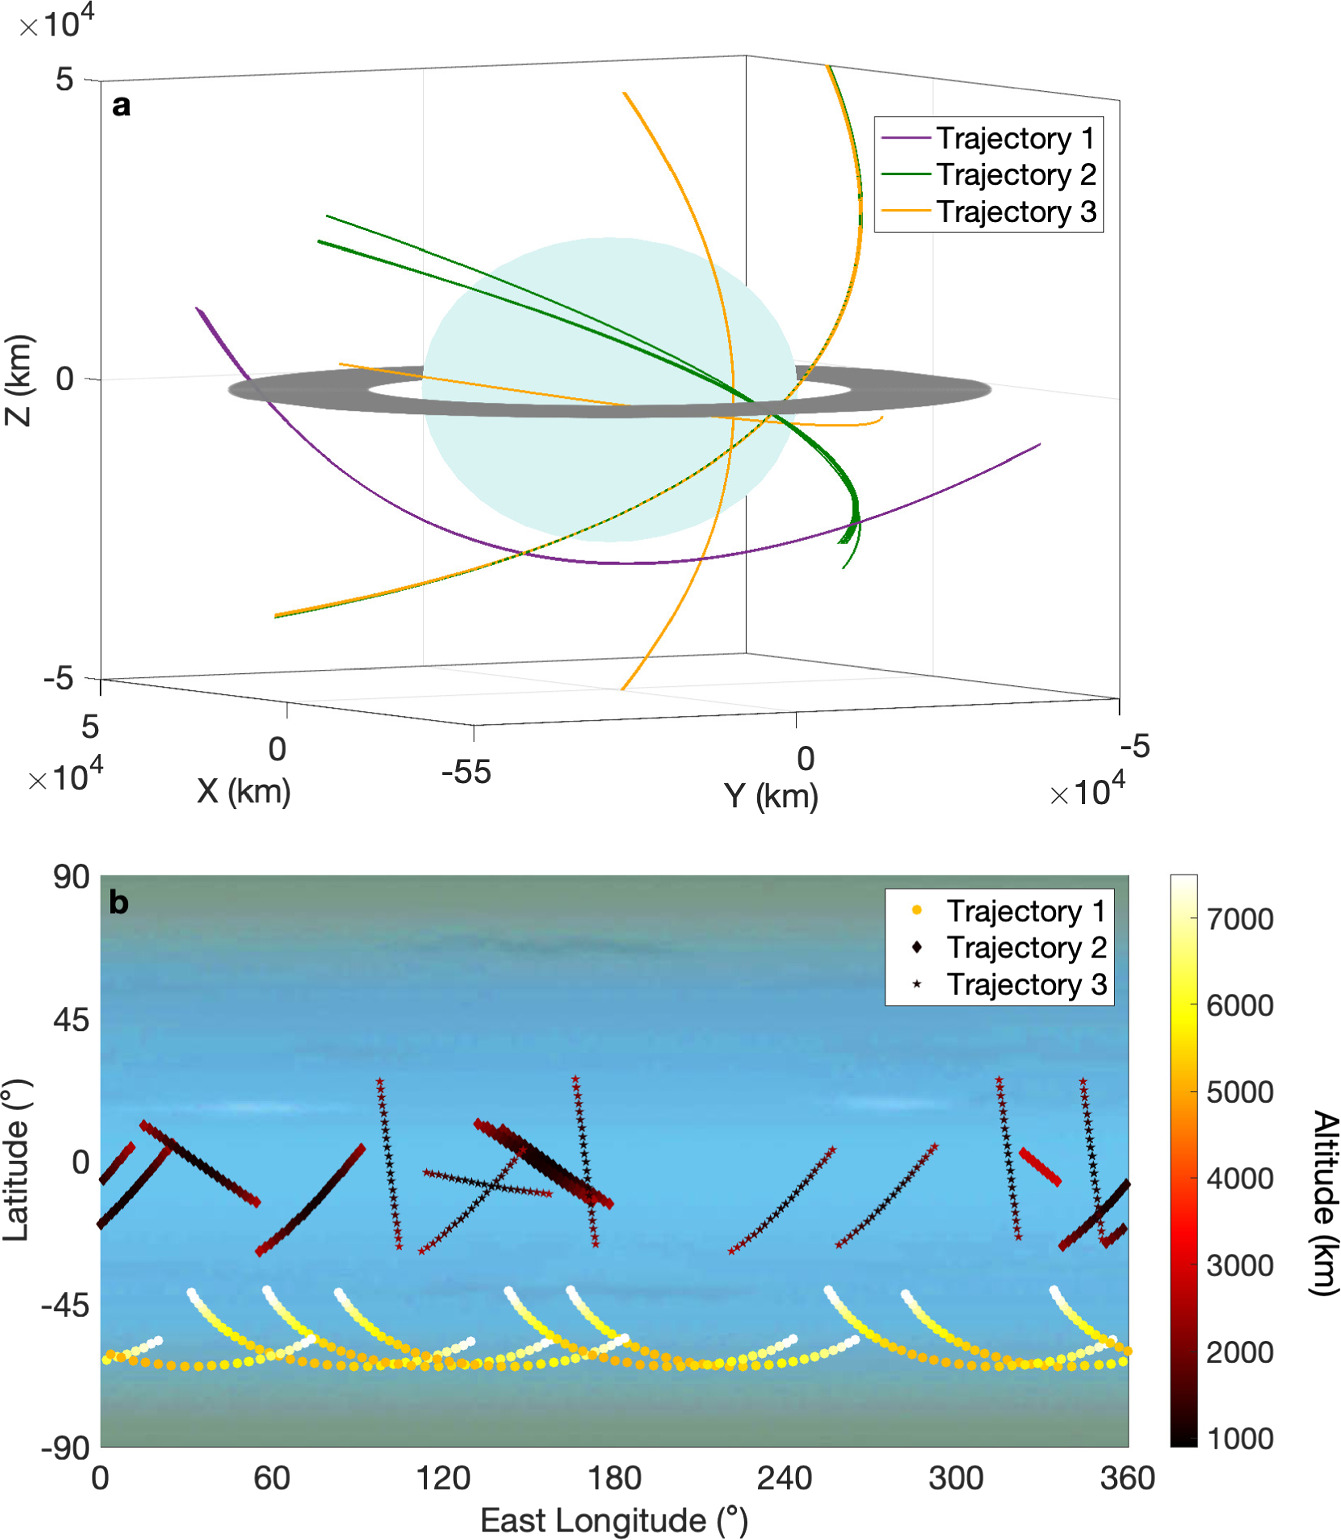
Top: Uranus and three potential types of trajectories. The safest, in purple, was ultimately disfavored over the more risky, but more rewarding, yellow and green trajectories. Bottom: a 2D map projection of the same tracks. [Parisi et al. 2024]
It would be ideal if mission designers could avoid the dangerous inner region altogether and always remain outside the rings. As Parisi and collaborators demonstrate, however, if the probe stays in this safe region throughout the planned 90-day mission, it won’t be able to conclusively differentiate between solid and liquid core models. If they instead accept the risk and “plunge” between the rings and the surface once per orbit, they’d be able to achieve the mission objectives with only eight laps around the planet.
While we’re still years away from deals with contractors to actually build the mission, studies like this are essential to design the future flagship. The final trajectory decisions won’t be made for a while, but if we ever see photos taken by a robot streaking between Uranus’s cloud tops and rings, we’ll be able to trace its journey to that moment to articles like this.
Citation
“Uranus Orbiter and Probe: A Radio Science Investigation to Determine the Planet’s Gravity Field, Depth of the Winds, and Tidal Deformations,” Marzia Parisi et al 2024 Planet Sci. J. 5 116. doi:10.3847/PSJ/ad4034
The post Plotting the Course, a Billion Miles Away appeared first on AAS Nova.
]]>
The venerable Hubble Space Telescope recently revisited the famous Ultra-Deep Field. How has this patch of sky changed since it was first photographed?
The post The Hubble Ultra-Deep Field, 15 Years Later appeared first on AAS Nova.
]]>Fifteen years ago, the Hubble Space Telescope gazed intently at the infrared glow of galaxies in a tiny fraction of the sky. New research shows how this patch of space has changed since then.
Ultra-Deep and Ultra-Famous
The Hubble Ultra-Deep Field at visible wavelengths. [NASA, ESA, S. Beckwith (STScI), and the HUDF Team]
In 2008–2009 and 2012, Hubble revisited the region, this time piecing together infrared portraits that revealed even more distant galaxies that were absent from the visible-light view. The most distant galaxies in the infrared images appear as they were when the universe was just 2–5% of its current age. What can we learn from comparing these archival images to new images of the same patch of sky?
Paying Another Visit
With Hubble happily still operational (knock on wood!), Matthew Hayes (Stockholm University) and collaborators turned the telescope’s infrared camera toward the Ultra-Deep Field once again in 2023, aiming to find differences between the new images and the original infrared deep-field images from 2008–2009 and 2012.
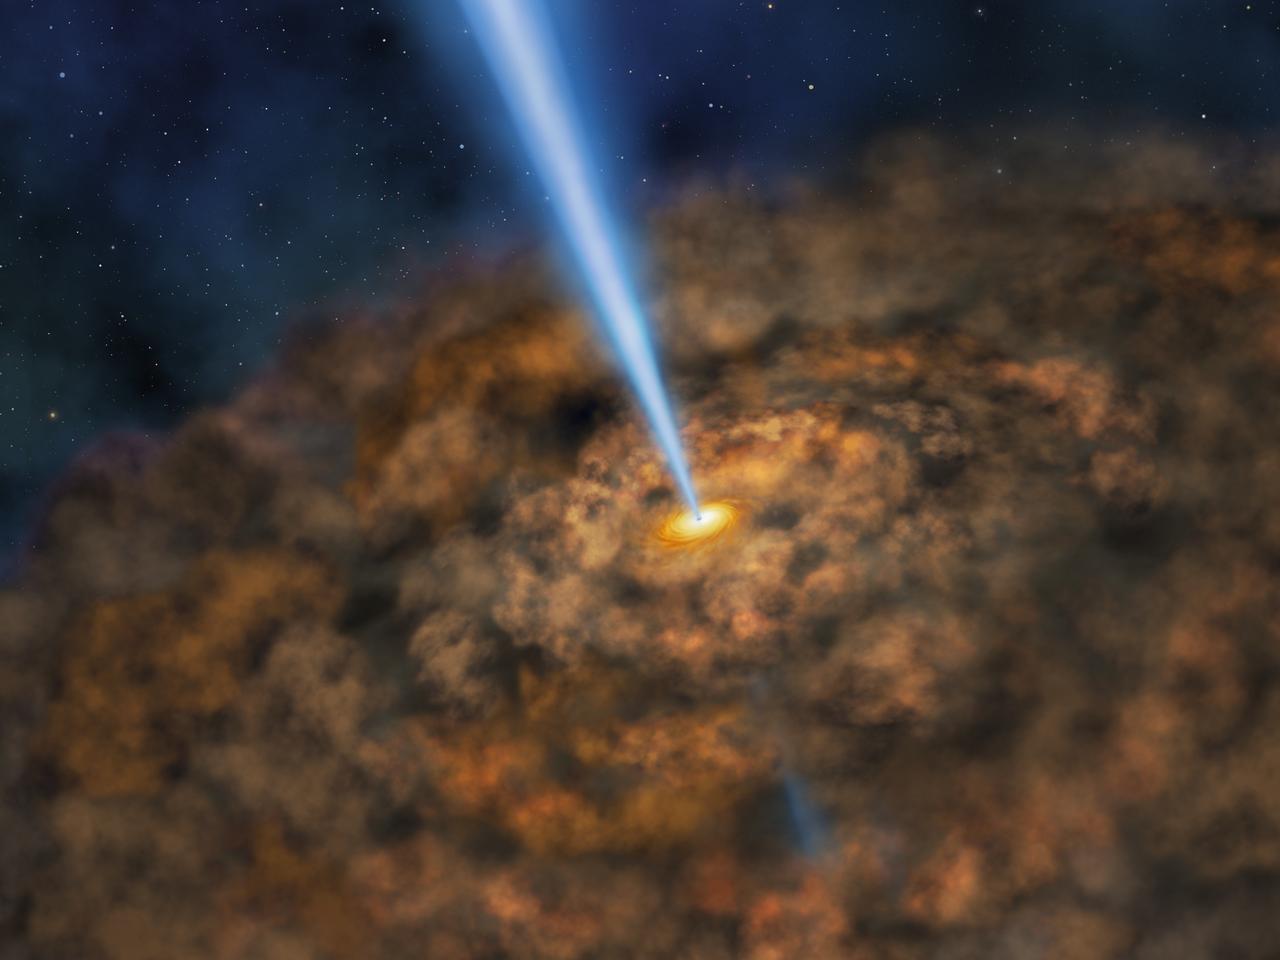
Illustration of an active galactic nucleus. [NASA/SOFIA/Lynette Cook]
Spotted: Black Holes
Hayes’s team used two methods to search for sources with varying brightness — potential active galactic nuclei — in the new and archival Hubble images:
- Subtracting one image from another to identify objects that appear in only one image
- Comparing the brightness of the centers of galaxies between images
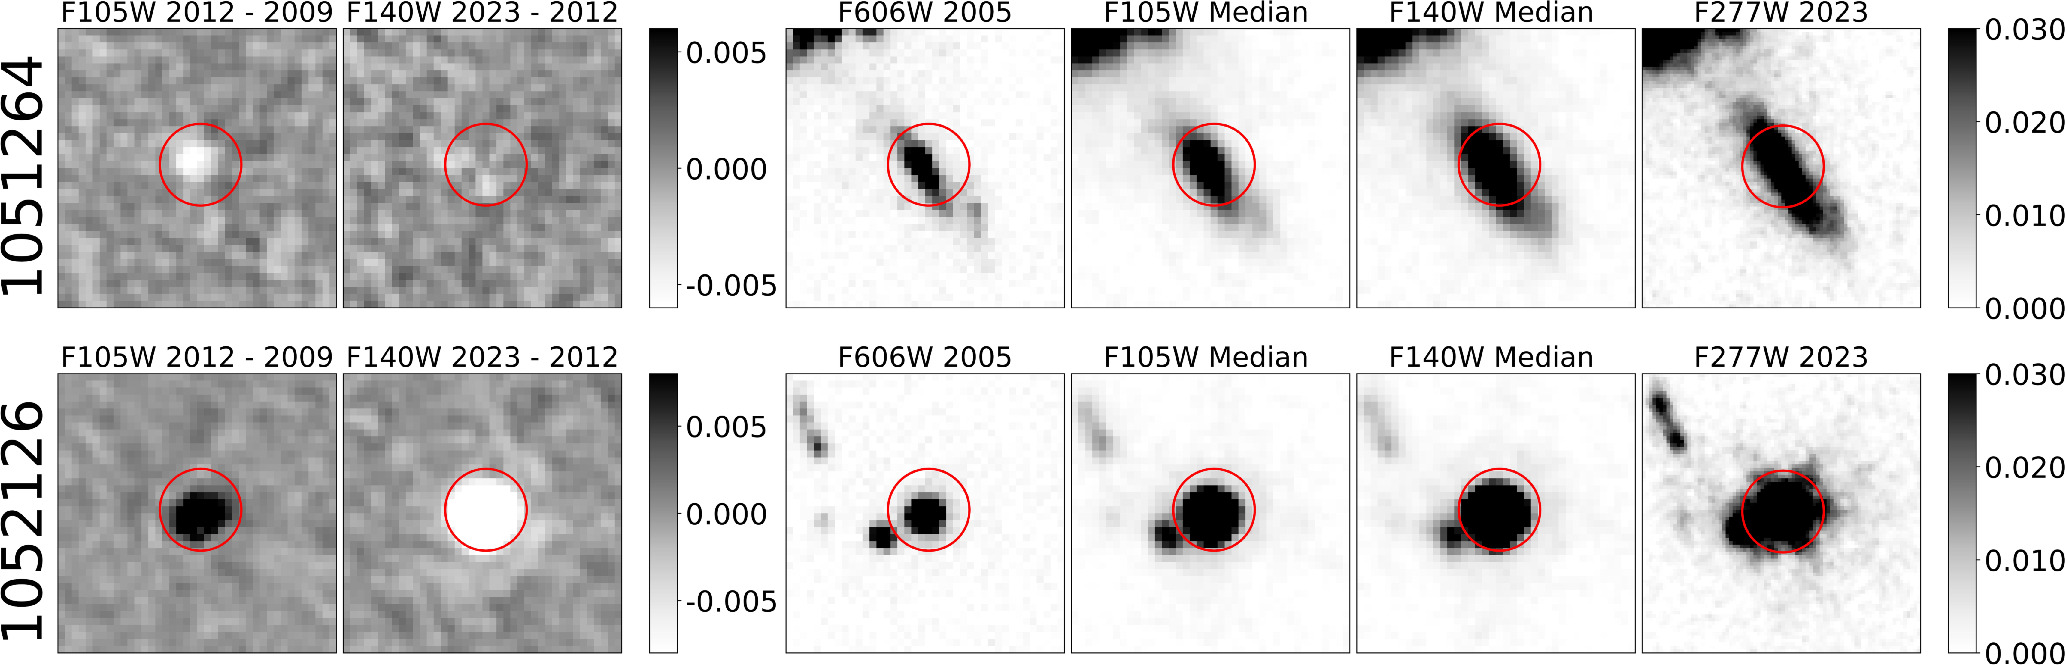
Demonstration of the photometric variability of the two active galactic nuclei. The source at z = 2.0 is shown in the top row, and the source at z = 3.2 is shown in the bottom row. Click to enlarge. [Hayes et al. 2024]
Hayes’s team used these results to place a lower limit on the number density of black holes during the epoch of reionization, when radiation from the first stars and galaxies transformed the universe from opaque to transparent. They found that the number density of black holes in this time period is similar to the present day value, providing a critical test of black hole formation models. These are just the first results from this campaign, so you can look forward to more ultra-deep-field findings in the future!
Citation
“Glimmers in the Cosmic Dawn: A Census of the Youngest Supermassive Black Holes by Photometric Variability,” Matthew J. Hayes et al 2024 ApJL 971 L16. doi:10.3847/2041-8213/ad63a7
The post The Hubble Ultra-Deep Field, 15 Years Later appeared first on AAS Nova.
]]>
Astrobites reports on the aftermath of a massive active galactic nucleus outburst that left behind a string of star formation.
The post 200 Millionth Anniversary Gift: A Necklace Made of Stars appeared first on AAS Nova.
]]>Editor’s Note: Astrobites is a graduate-student-run organization that digests astrophysical literature for undergraduate students. As part of the partnership between the AAS and astrobites, we occasionally repost astrobites content here at AAS Nova. We hope you enjoy this post from astrobites; the original can be viewed at astrobites.org.
Title: “Beads-on-a-string” Star Formation Tied to One of the Most Powerful Active Galactic Nucleus Outbursts Observed in a Cool-Core Galaxy Cluster
Authors: Osase Omoruyi et al.
First Author’s Institution: Center for Astrophysics ∣ Harvard & Smithsonian
Status: Published in ApJ
Billions of years ago, around 3.8 billion light-years away, there was a black hole outburst so explosive that we can still see remnants of it today — and it may be the most powerful event of its kind we have ever observed. The authors identified this outburst when they noticed a remarkable structure that formed from the wreckage, a 28 kiloparsec (91,000 light-year) arc of star formation that resembles beads on a string, as shown in Figure 1.
Figure 1: SDSS 1531 image from Hubble’s Wide Field Camera 3, emission in the V-band (bottom left), and near-ultraviolet (bottom right). [Omoruyi et al. 2024]
Multiwavelength studies are especially illuminating, because each wavelength range can provide unique information about the underlying physical processes in a system. The Chandra X-ray Observatory was used to observe the hot intracluster medium. Radio observations from the Low Frequency Array (LOFAR) and the Very Large Array (VLA) were used to search for activity associated with the black hole outburst. The Gemini Multi-Object Spectrograph (GMOS) observed the warm ionized gas and searched for ionization sources. Finally, the Atacama Large Millimeter/submillimeter Array (ALMA) observed the cold molecular gas from which stars form.
From these observations, the authors were able to piece together a picture of the outburst, the lasting effect it had on its environment, and specifically how it created the string of star formation. Some 200 million years before SDSS 1531 was as it appears today (in reality, billions of years ago when light travel time is accounted for), a supermassive black hole at the center of one of the large merging galaxies was actively accreting material and emitting two extremely powerful jets in opposite directions, making it an active galactic nucleus. The jets blasted hot material away, forming massive cavities. One cavity was identified by Chandra and LOFAR observations because it lacks hot X-ray emission and is filled with radio emission. The symmetric cavity created by the other jet was not observed, but the authors proposed it may have since faded away if the jet blew into a less dense region of gas, or the motion of the surrounding gas pushed the cavity away from its original location.
This active galactic nucleus was not observed, so the authors know that it has since “turned off” and is no longer active. However, the major disruption caused by the active galactic nucleus outburst and the complex dynamics of the ongoing galaxy merger are likely the cause of the “beads on a string” star formation. The GMOS and ALMA observations revealed warm ionized gas and cold molecular gas along the edge of the star formation arc. The authors believe that hot gas pushed away by the outburst’s jets eventually cooled and is now falling back on to the merging galaxies. This cold gas then began to collapse to form stars, initiated by a cooling wake, strong ram pressure forces, or tidal interactions from the galaxy merger. See Figure 2 for an overview of these findings.
Figure 2: An overview of this article’s interpretation of SDSS 1531. The light blue “avocado” shapes represent the cavities formed by the active galactic nucleus jets. The light green dots show regions of star formation along the edge of the dark blue region of cold molecular gas. [Omoruyi et al. 2024]
Original astrobite edited by Abbe Whitford.
About the author, Annelia Anderson:
I’m a 4th-year Astrophysics PhD student at the University of Alabama. My current research uses simulations to study the circumgalactic medium and inform interpretations of observations. Beyond research, I enjoy playing piano and guitar, cooking, spending time with my cat, and I hope to someday write astronomy children’s books.
The post 200 Millionth Anniversary Gift: A Necklace Made of Stars appeared first on AAS Nova.
]]>
Cygnus X-1 recently made the long-awaited switch between hard and soft spectral states. What can IXPE observations tell us about this transition?
The post A Hard Look at a Soft-State X-ray Binary appeared first on AAS Nova.
]]>Astronomers recently tracked a famous X-ray binary system through a change in its accretion state. What does this transition tell us about how black holes accrete gas?
Accretion Questions
An artist’s impression of an X-ray binary, in which a compact object accretes material from a companion star and emits X-rays during intermittent outbursts [ESO/L. Calçada; CC BY 4.0]
Astronomers have discovered hundreds of X-ray binaries in the Milky Way, but there are still many open questions about the accretion process: What’s the origin of the corona, and how is it structured? Does it sit high above the compact object, or does it hover just above the surface of the disk? What’s the connection between the disk, the corona, and the jets?
One way to potentially answer these questions is to track an X-ray binary as it undergoes a state transition, shifting from producing more low-energy X-rays (“soft state”) to more high-energy X-rays (“hard state”). State transitions are thought to occur when a binary changes how it’s accreting gas, so observing a binary across state transitions can reveal whether the binary’s geometry changes in different accretion modes. Luckily, one of the best-studied X-ray binaries in our galaxy recently gave researchers a chance to study a state transition with a powerful observatory.
From Hard to Soft
Cygnus X-1 is an X-ray binary containing a 41-solar-mass supergiant star and a 21-solar-mass black hole. Over decades of monitoring, scientists have witnessed Cygnus X-1 repeatedly transition between soft and hard states. Phase switches happen randomly, and a phase can last weeks or years.
Side view of the favored coronal geometry; a wedge-shaped corona (blue) lies parallel to the accretion disk (yellow). The arrows show the direction of the black hole’s spin. [AAS Nova/Kerry Hensley]
Soft-State Insights
Left: Polarization degree and polarization angle for the hard (blue) and soft (red) states. Right: Polarization degree and angle as a function of energy for the soft state. Click to enlarge. [Steiner et al. 2024]
Using a fully relativistic spectral model, Steiner’s team found that the corona likely lies parallel to the accretion disk, just as in the hard state. While there are many similarities between the hard and soft states of this system, the team suggested that the majority of the polarized light in each state comes from a different source.
In the hard state, X-ray photons become polarized when they scatter off the corona. In the soft state, a substantial fraction of the X-ray photons from the accretion disk are bent back toward the disk by the black hole’s immense gravity, and they become polarized when they are reflected off the surface of the disk. In other words, X-rays from the accretion disk undergo gravitational lensing — showing that the same process that bends the light from distant galaxies is at work in a system billions of times less massive!
Citation
“An IXPE-led X-Ray Spectropolarimetric Campaign on the Soft State of Cygnus X-1: X-Ray Polarimetric Evidence for Strong Gravitational Lensing,” James F. Steiner et al 2024 ApJL 969 L30. doi:10.3847/2041-8213/ad58e4
The post A Hard Look at a Soft-State X-ray Binary appeared first on AAS Nova.
]]>
New surveys with the world's largest filled-aperture radio dish are turning up more and more millisecond pulsars. What do these surveys tell us about the best places to look for these extreme objects?
The post Seeking Solo Super-Fast Pulsars appeared first on AAS Nova.
]]>Millisecond pulsars are some of the most extreme objects in the universe. Surveys of pulsars in globular clusters aim to find these fast-spinning stars and understand why some of them fly solo when they’re expected to be paired up.
Dynamic Duos and Solo Acts
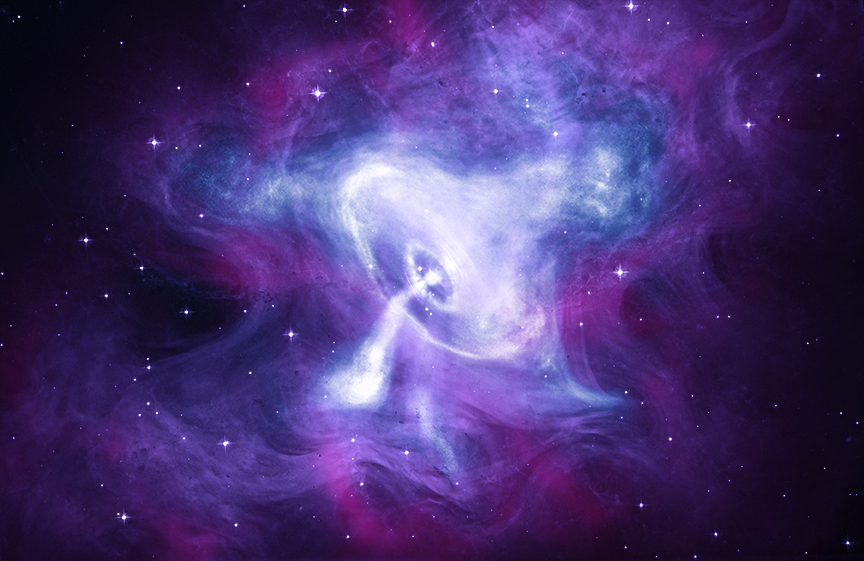
A composite X-ray, optical, and infrared image of the Crab Nebula, which is energized by the pulsar at its center. [X-ray: NASA/CXC/SAO; Optical: NASA/STScI; Infrared: NASA-JPL-Caltech]
The most extreme pulsars are those that complete each rotation in less than 10 milliseconds. Millisecond pulsars are thought to reach their record-setting speeds with the help of a friend, starting out as slower rotators that are “spun up” by accreting material from a binary companion. While that theory explains the origins of millisecond pulsars that inhabit binary systems, it can’t account for those that drift through space alone. To find out where these solo rotators come from, we’ll need to find them first — and researchers are homing in on the best places to look.

Comparison of the sizes and designs of FAST (center), Arecibo (top), and RATAN-600 (bottom; the world’s largest-diameter single radio dish). [Cmglee; CC BY-SA 4.0]

Seeking Single Pulsars
Of the thousands of known pulsars in the Milky Way, a small but significant fraction can be found in globular clusters: spherical groupings of tens of thousands to millions of stars on the outskirts of the galaxy. Recent observations suggest that globular clusters might be among the best places to find isolated millisecond pulsars.
Using the Five-hundred-meter Aperture Spherical radio Telescope — FAST, the largest filled-aperture radio dish in the world — Dejiang Yin (Guizhou University) and collaborators went pulsar hunting in the globular cluster NGC 6517. Previous searches spotted nine pulsars in NGC 6517, only one of which was in a binary system, suggesting that this cluster may be home to other isolated pulsars.
Best Place to Look
From the new observations, Yin’s team picked out the characteristic pulsed signals from eight millisecond pulsars, all of which appear to lack binary companions. With these new additions, NGC 6517 is now the most pulsar-rich globular cluster accessible to FAST and and the third most of all Milky Way globular clusters. (After this research article was submitted, the team found three more pulsars in their data, so expect to hear more about NGC 6517’s pulsar population soon!)
Why is NGC 6517 home to so many isolated millisecond pulsars? Its density may be responsible: NGC 6517 is one of the most densely packed globular clusters in the Milky Way, which could mean that binary systems containing a millisecond pulsar are more likely to be split apart by close encounters with other stars. Other proposed isolated millisecond pulsar formation mechanisms like neutron star mergers might also be common in dense clusters.
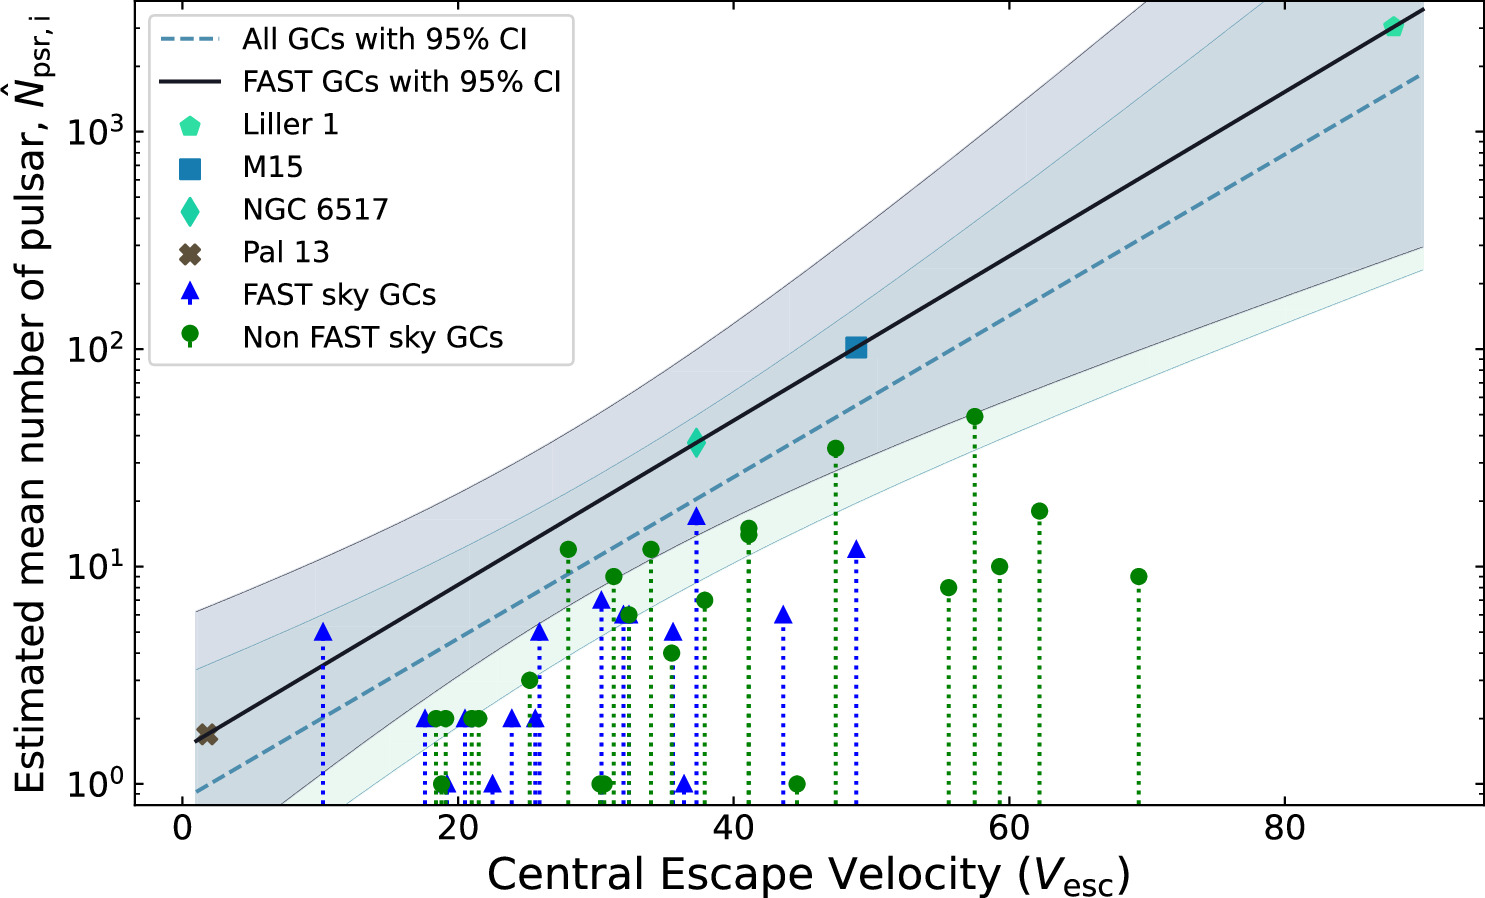
The estimated number of pulsars in a globular cluster is correlated with the escape velocity of the cluster. Click to enlarge. [Yin et al. 2024]
Citation
“FAST Discovery of Eight Isolated Millisecond Pulsars in NGC 6517,” Dejiang Yin et al 2024 ApJL 969 L7. doi:10.3847/2041-8213/ad534e
The post Seeking Solo Super-Fast Pulsars appeared first on AAS Nova.
]]>
The Hubble tension is one of the most pressing problems in cosmology. Today, we're looking at five articles that address the Hubble tension — either suggesting ways to alleviate it or staunchly reinforcing its existence.
The post Monthly Roundup: Perspectives on the Hubble Tension appeared first on AAS Nova.
]]>In the early 20th century, astronomer Vesto Slipher made the first radial velocity measurements of what were then called spiral nebulae. Nearly all of Slipher’s spiral nebulae — what we now know to be galaxies beyond our own Milky Way — were receding. This simple observation laid the foundation of what is today a complex undertaking: the measurement of the expansion rate of our universe.
Expanding Our Understanding
How can we even measure the universe’s expansion? The rate of expansion can be expressed as a value called the Hubble constant, which bears the unusual units of kilometers per second per megaparsec (km/s/Mpc). (The Hubble constant gets its name from Edwin Hubble, who made one of the first measurements of its value in the local universe; Georges Lemaître beat him to the punch by two years.)
Researchers have different approaches for measuring this constant in the nearby universe and in the more distant, early universe. The expansion rate in the nearby universe can be estimated by combining two measurements: 1) the distance to other local galaxies, and 2) how quickly those galaxies are moving away from us. The most precise measurement of the expansion of the early universe, on the other hand, comes from the Planck spacecraft: researchers extracted a value of the Hubble constant from measurements of the oldest light in the universe, known as the cosmic microwave background.
A Cosmic Conundrum
Here’s the catch: the expansion rate measured from the cosmic microwave background can’t be compared directly to the rate measured in the local universe. That’s because the expansion of the universe is accelerating — the expansion rate today is considerably larger than when the universe was young. To compare the early-universe rate to the present-day rate, researchers use the leading cosmological model, ΛCDM, to extrapolate the early-universe value to the present day.
Researchers have produced more than a thousand estimates of the Hubble constant over the past 60 years, and today the local-universe and early-universe expansion rates have both been measured precisely — but the rates do not agree. The extrapolated early-universe expansion rate is around 67 km/s/Mpc, while the present-day value is pinned at around 74 km/s/Mpc. This mismatch is called the Hubble tension, and the solution is unknown. Are our measurement methods at fault? Or are we due for an overhaul of our leading theory of cosmology? In today’s post, we’ll take a look at five recent research articles that tackle the Hubble tension from different angles — proposing ways to alleviate it or staunchly reinforcing its existence.
What If Our Measurements Weren’t Good Enough?
The most precise measurement to date of the local-universe expansion rate hinges upon Hubble Space Telescope observations of Cepheid variable stars. Astronomer Henrietta Swan Leavitt identified the importance of Cepheids in 1912, when she showed that a Cepheid’s pulsation period is directly tied to its intrinsic luminosity. By comparing the apparent brightness of a Cepheid to its intrinsic luminosity, astronomers can measure the distance to Cepheids — and the galaxies they call home — out to about 100 million light-years.
Picking out individual Cepheids in distant galaxies, even within the local universe, is a challenge — the light from multiple stars in crowded stellar neighborhoods can overlap, stymieing measurements of single stars. This could mean that Hubble’s measurements of Cepheid variables are less reliable for more distant stars, skewing estimates of the Hubble constant. Because JWST has better resolution than Hubble, especially at the near-infrared wavelengths necessary for studying stars in far-off, dusty environments, it can provide a valuable test of the conclusions drawn from Hubble data.
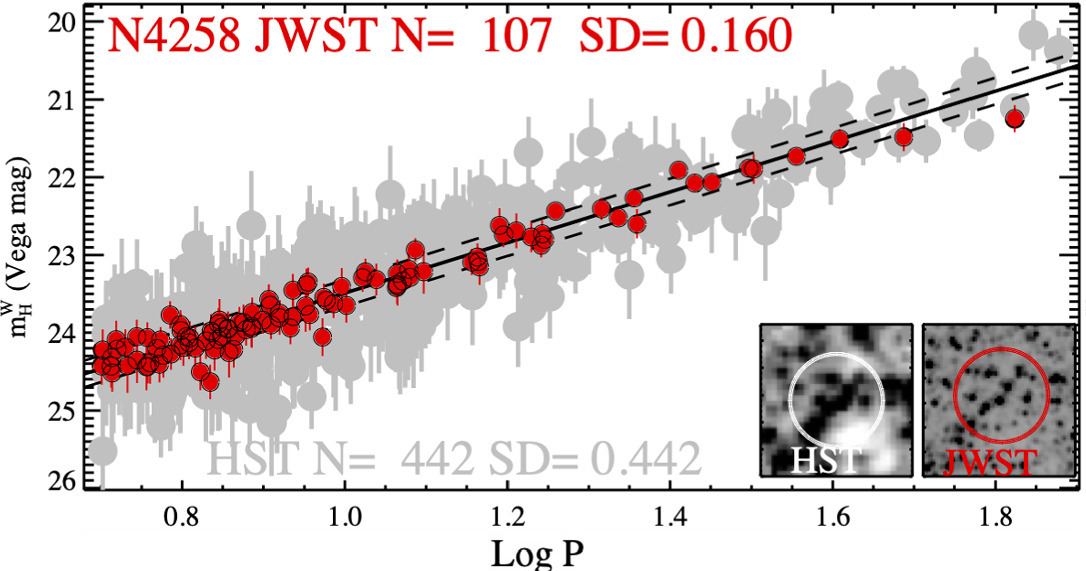
Comparison of the Hubble and JWST period and magnitude data for Cepheid variable stars in the galaxy NGC 4258. The JWST data are visibly less noisy. The inset images at the lower right show the degree of stellar crowding in the Hubble data. [Adapted from Riess et al. 2024]
What If Our Assumptions Are Incorrect?
In addition to using Cepheid variable stars, many estimates of the Hubble constant rely on measurements of Type Ia supernovae, which occur when the remnant core of a low- to intermediate-mass star — a white dwarf — attains a mass of roughly 1.4 solar masses and explodes. The peak brightness of a Type Ia supernova greatly outshines a Cepheid variable, extending the cosmic distance scale out to more than a billion light-years.
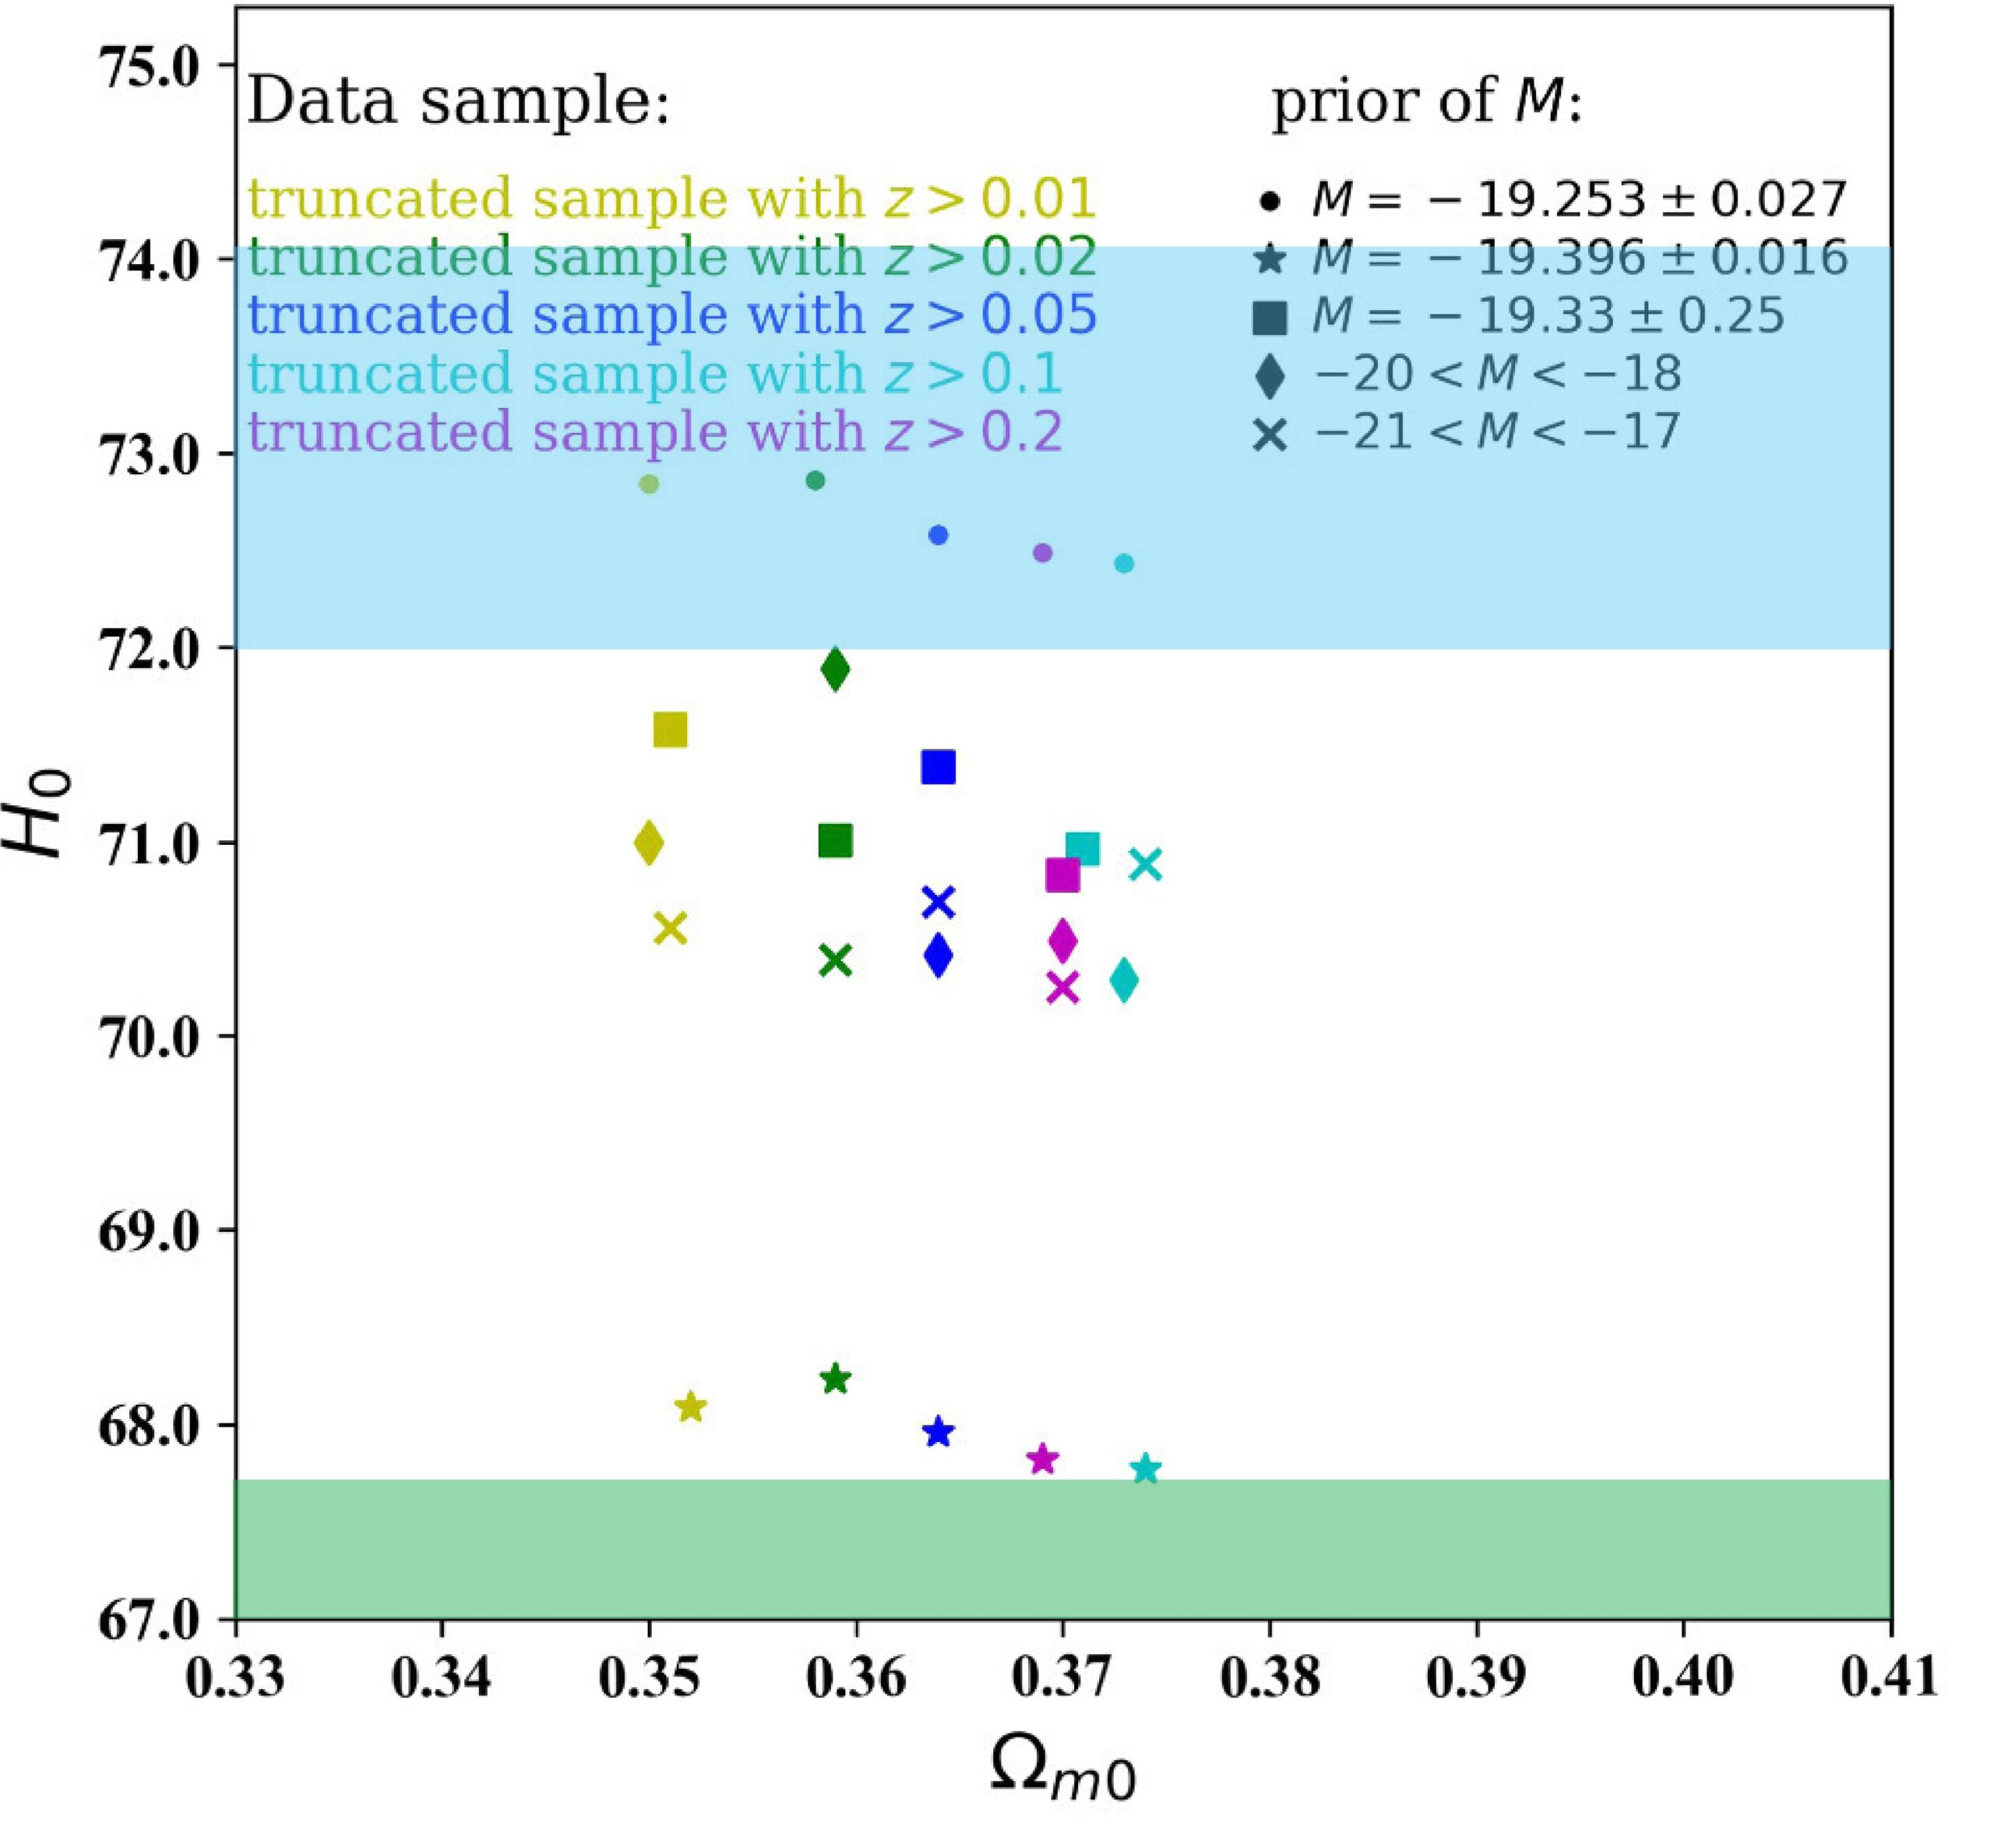
Derived values of the local-universe Hubble constant, H0, for different Type Ia supernova magnitude priors and redshift cutoffs. The blue and green shaded areas show the approximate values of the expansion measured in the local universe and extrapolated from Planck data, respectively. While the choice of supernova luminosity distribution affects the derived Hubble constant, it has little effect on Ωm0, which relates to the density of matter in the universe. See original figure set for error bars. [Adapted from Chen et al. 2024]
This means that instead of being limited to a single value, the maximum luminosities of Type Ia supernovae follow a distribution that is not yet well known. Yun Chen (Chinese Academy of Sciences) and collaborators examined the impact of different Type Ia supernova luminosity distributions on estimates of the Hubble constant. The team tested five luminosity distributions, three of which are Gaussians and two of which are “top hats”: equal likelihood within a certain range of luminosities and zero chance outside that range. The result? Wide-ranging values of the Hubble constant, some of which agree with the early-universe value and others of which agree with the present-day value. Given the huge impact of the underlying luminosity distribution, Chen’s team calls for a better understanding of the intrinsic properties of Type Ia supernovae.
What If We Use Another Measurement Technique?
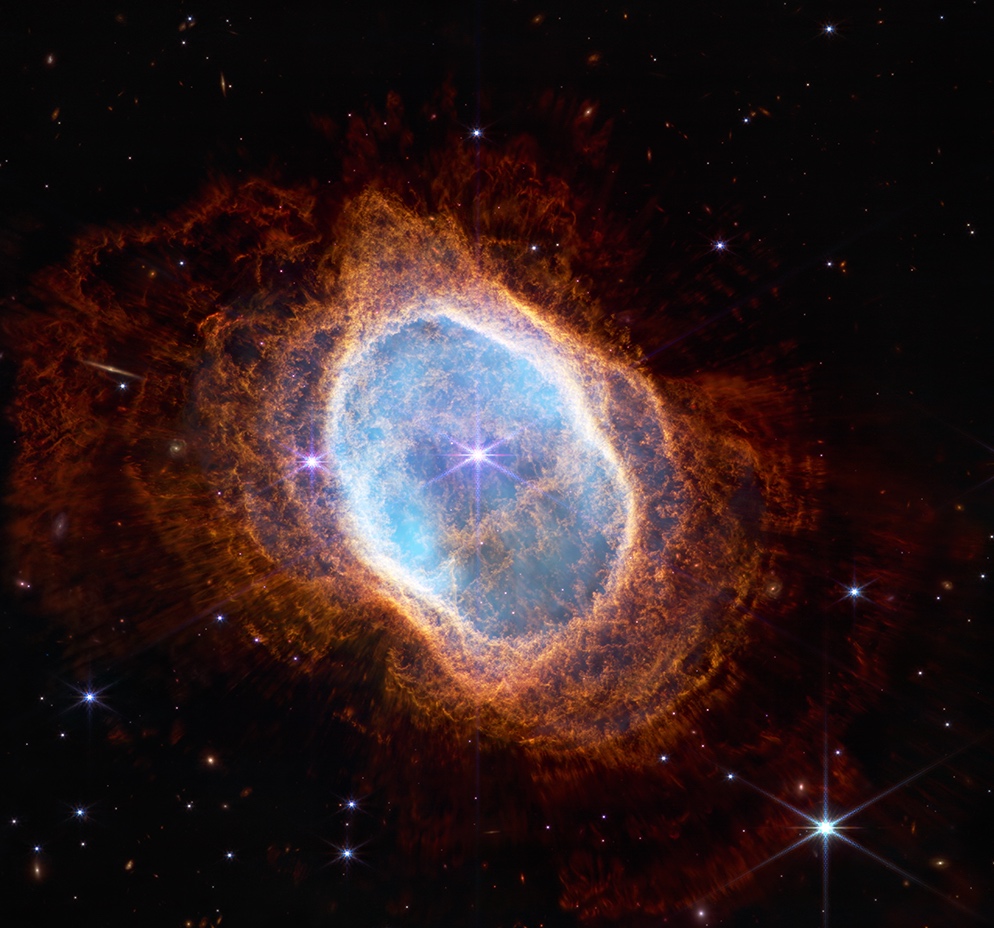
A view of the Southern Ring Nebula from JWST. [NASA, ESA, CSA, STScI]
Individual planetary nebulae can have a wide range of luminosities; we can’t use single planetary nebulae to measure the distance to another galaxy as we can with Cepheid variable stars or Type Ia supernovae. However, when looking at all of the planetary nebulae in a galaxy, a remarkably consistent pattern emerges: for the brightest planetary nebulae, the number of nebulae as a function of luminosity has the same shape regardless of the properties of the galaxy in question. Using this method, researchers can measure the distances to galaxies out to about 130 million light-years.
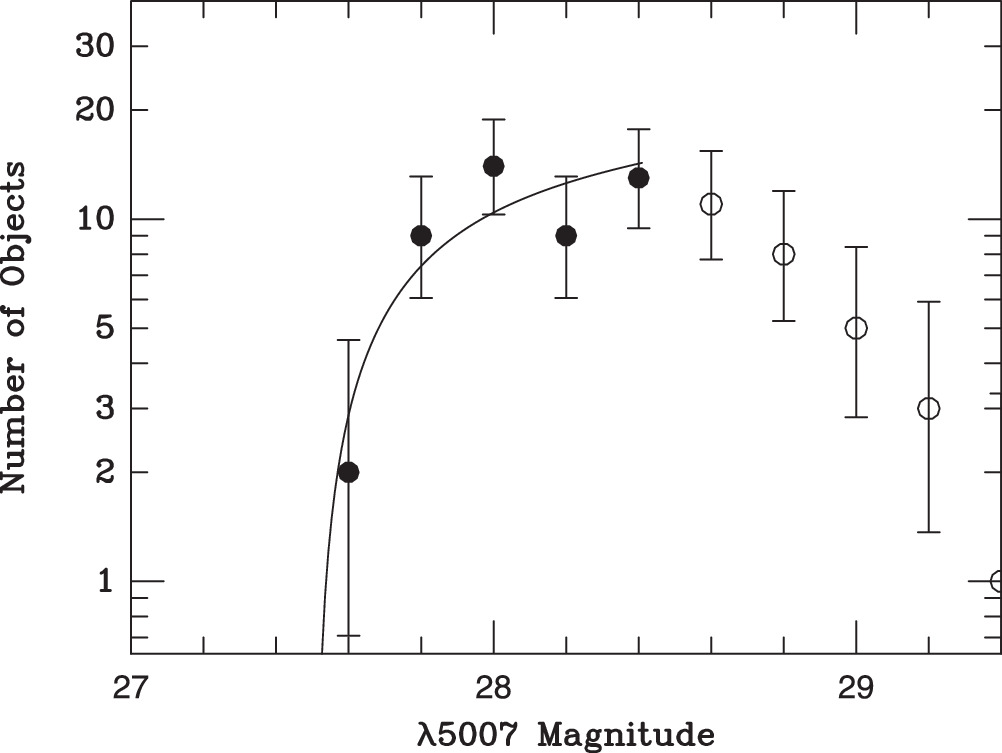
The planetary nebula luminosity function for NGC 1385. [Jacoby et al. 2024]
What If We Could Measure the Hubble Constant from Gravitational Waves?
All of the Hubble-constant measurement techniques discussed so far have relied on electromagnetic radiation from one source or another. When the Laser Interferometer Gravitational-wave Observatory (LIGO) and Virgo detectors made the first direct measurement of gravitational waves in 2015, it opened a whole new window into the workings of the universe — and an entirely new way to measure its expansion rate.
Tonghua Liu (Yangtze University) and coauthors demonstrated how gravitational wave observations could enable measurements of the expansion rate out to a redshift of z = 5, or a little more than a billion years after the Big Bang. That time period is currently inaccessible to other measurement methods. Here’s how that would work: first, imagine a binary pair of neutron stars. As these objects circle one another, they expend energy in the form of gravitational waves and sink closer together, hastening their inevitable collision. As the universe expands, the expansion imprints a phase shift in the gravitational waves from the neutron star pair. This effect is tiny, amounting to just a one-second phase shift over 10 years of monitoring a neutron star binary at a redshift of z = 1. Tiny — but not impossible for future gravitational wave observatories to measure!
The phase shift and redshift of a single neutron star binary provide a direct measurement of the expansion rate of the universe at the binary system’s redshift. By measuring phase shifts for a large sample of neutron star systems across a wide range of redshifts, astronomers could measure how the expansion rate of the universe changes across cosmic time — without invoking any assumptions from a particular cosmological model.
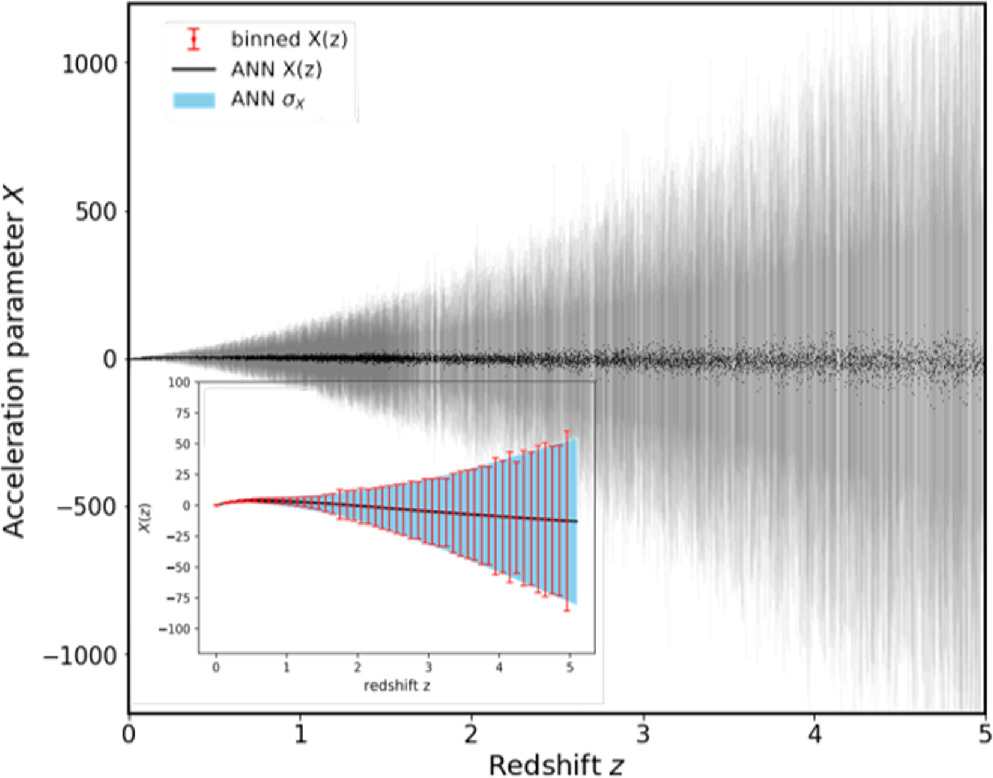
Acceleration parameters from simulated DECIGO data. After collecting a large sample of individual acceleration parameter measurements, a machine-learning algorithm can piece together the underlying trend that best fits the observations. [Liu et al. 2024]
What If Dark Energy Is Responsible?
The universe is a mysterious place: according to the leading theory of cosmology, the matter that we see and interact with every day makes up just a tiny fraction — about 5% — of the contents of the universe. Dark matter, a hypothetical form of matter that interacts with everyday matter only through gravity, makes up another 27%. The majority of the matter–energy density of our universe comes from the most mysterious quantity of all: dark energy. Dark energy is thought to provide the outward pressure responsible for the accelerating expansion of the universe, but the exact cause of this pressure remains unknown.
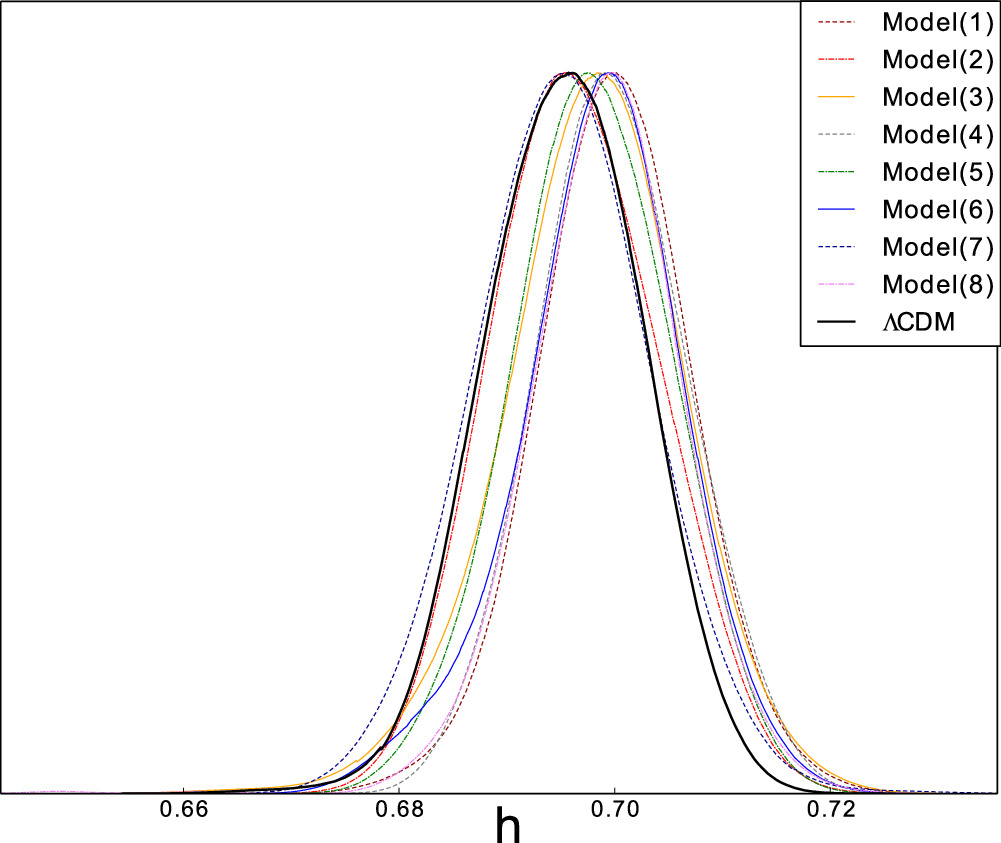
Probability distribution of the expansion rate (shown here as the rate divided by 100) for different descriptions of oscillating dark matter. The black line shows the result from ΛCDM for comparison. [Rezaei 2024]
In addition to making progress on the Hubble tension, oscillating dark matter could solve another problem of cosmological importance called the coincidence problem. Essentially, the coincidence problem boils down to the fact that in the present-day universe the energy densities of dark matter and dark energy are of the same order of magnitude — but in the distant past and distant future these quantities were/will be way out of balance. In the oscillating dark energy scenario, the energy densities of dark matter and dark energy ebb and flow, and they would have been equal at several points in the universe’s history. While oscillating dark energy alleviates the Hubble tension and the coincidence problem, it doesn’t fit certain observations as well as ΛCDM does — and the search for a definitive solution to the Hubble tension goes on!
Citation
“JWST Observations Reject Unrecognized Crowding of Cepheid Photometry as an Explanation for the Hubble Tension at 8σ Confidence,” Adam G. Riess et al 2024 ApJL 962 L17. doi:10.3847/2041-8213/ad1ddd
“Effects of Type Ia Supernovae Absolute Magnitude Priors on the Hubble Constant Value,” Yun Chen et al 2024 ApJL 964 L4. doi:10.3847/2041-8213/ad2e97
“Toward Precision Cosmology with Improved Planetary Nebula Luminosity Function Distances Using VLT-MUSE. II. A Test Sample from Archival Data,” George H. Jacoby et al 2024 ApJS 271 40. doi:10.3847/1538-4365/ad2166
“Model-Independent Way to Determine the Hubble Constant and the Curvature from the Phase Shift of Gravitational Waves with DECIGO,” Tonghua Liu et al 2024 ApJL 965 L11. doi:10.3847/2041-8213/ad3553
“Oscillating Dark Energy in Light of the Latest Observations and Its Impact on the Hubble Tension,” Mehdi Rezaei 2024 ApJ 967 2. doi:10.3847/1538-4357/ad3963
The post Monthly Roundup: Perspectives on the Hubble Tension appeared first on AAS Nova.
]]>
Astrobites reports on the fast blue optical transient AT2018cow, which has remained a mystery to astronomers since it was discovered.
The post Mooing Magnetars: Modeling the Enigmatic FBOT AT2018cow “The Cow” appeared first on AAS Nova.
]]>Editor’s Note: Astrobites is a graduate-student-run organization that digests astrophysical literature for undergraduate students. As part of the partnership between the AAS and astrobites, we occasionally repost astrobites content here at AAS Nova. We hope you enjoy this post from astrobites; the original can be viewed at astrobites.org.
Title: Magnetar as the Central Engine of AT2018cow: Optical, Soft X-Ray, and Hard X-Ray Emission
Authors: Long Li et al.
First Author’s Institution: University of Science and Technology of China
Status: Published in ApJL
Over the past decade, several efforts to rapidly image the entire night sky on an approximately nightly basis have resulted in many unexpected discoveries. Several surveys, such as those of the Palomar Transient Factory, the Intermediate Palomar Transient Factory, the Zwicky Transient Facility, and the Asteroid Terrestrial-impact Last Alert System (ATLAS), have contributed to the ever-expanding and diverse transient zoo. Given this cadence and relatively shallow depth, these surveys have identified several classes of bright and fast transients. One class of transients that remain unexplained are luminous fast blue optical transients (FBOTs).
Although several FBOTs have been identified over the last decade, such as CSS161010 in 2016, this class of optical transient was largely overlooked due to their rarity until AT2018cow (i.e., “The Cow”) was discovered by the ATLAS facility in 2018. You can read about its discovery in this Astrobite! “The Cow” occurred in a relatively nearby galaxy at only 66 megaparsecs (~200 million light-years) away, and it was extremely bright, evolved quickly, and had a largely featureless, blue optical spectrum. The X-ray and optical spectra and light curves of AT2018cow did not align well with any models for known transients, leading to a slew of multi-wavelength observations in an attempt to uncover its origin. Since then, numerous theories have been proposed about the origin of FBOTs. However, there are some challenges since observations of a more recent FBOT, AT2023fhn (i.e., “The Finch”), has indicated that all FBOTs might not come from the same underlying astrophysical object, as discussed in this Astrobite! Despite this, the authors of today’s article have tackled this challenge and proposed a new explanation for “The Cow.”
Meet the Central Engine
The authors of today’s article are interested in creating a model that can explain the optical and X-ray properties of AT2018cow. Although there are many explanations currently in the literature, the authors are specifically interested in investigating the newborn magnetar scenario using a “two-zone” model. A magnetar is a highly magnetized pulsar, a type of neutron star born from the deaths of massive stars in supernovae.
In the first zone of the two-zone model, the magnetar has a Poynting-flux-dominated wind. This means the wind is highly magnetized and carries magnetic energy away from the magnetar. As the wind expands, magnetic dissipation converts magnetic energy into kinetic energy of the wind’s particles by reconnecting magnetic field lines. The particles in the wind gain so much kinetic energy that they become relativistic (travel near the speed of light). The electrons in the magnetar’s wind are charged, so they accelerate. They also interact with the magnetic field via the Lorentz force, which causes them to spiral around magnetic field lines and radiate away energy. This emission process is called synchrotron radiation.
The second zone the model considers is bulk material ejected external to the magnetar’s wind. The critical distinction between previous methods and today’s article is the inclusion of interaction between the emission from the magnetar’s wind and this ejecta. The authors assume that the ejected material is made of 20% hydrogen, 10% helium, and 70% oxygen to compute the opacity of the ejecta, which is vital to determining the resulting visible emission from the interaction of the wind’s radiation with the ejecta.
The authors of today’s article also calculate the emission from the ejecta heated by the wind’s radiation under the assumption that the radioactive decay of cobalt-56 and nickel-56 isotopes add energy to the ejecta. These isotopes are thought to contribute power to the optical emission from Type Ia supernovae. Initially, the core of the collapsing star is composed chiefly of nickel-56 that is ejected in the supernova, which goes on to decay to cobalt-56 and then finally to iron-56, radiating away energy that is absorbed and re-radiated by the ejecta as optical emission that we observe.
When adding all these contributions, the authors can predict the time evolution of the optical and X-ray emission that one might observe from such a system. The authors show an example of the spectrum from this system in Figure 1.
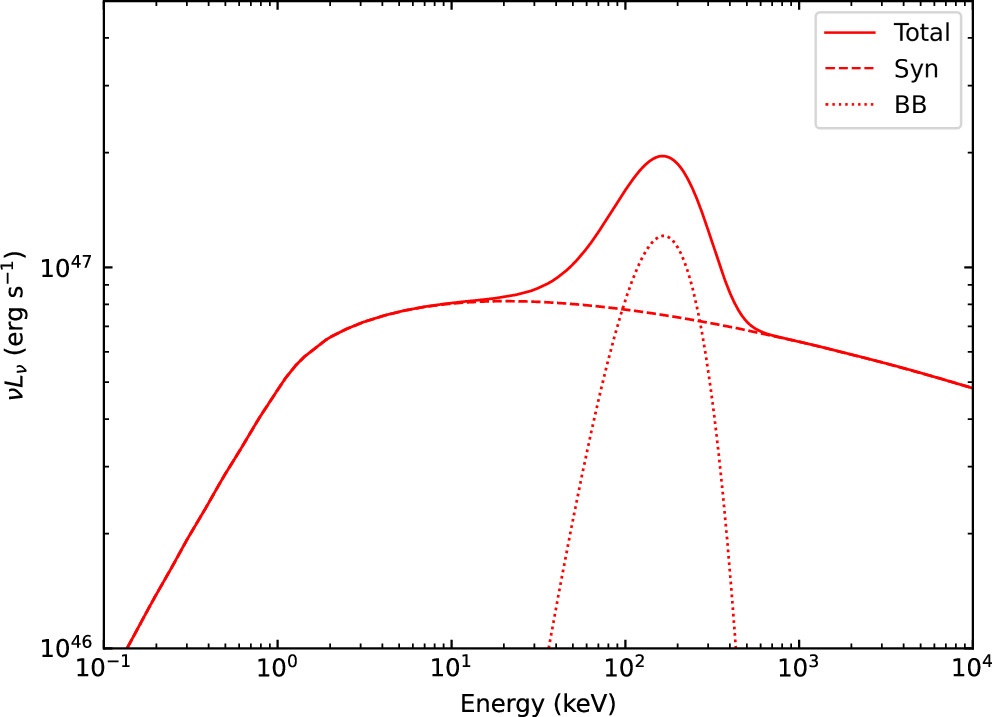
Figure 1: The spectrum in units of kiloelectronvolts (keV) versus luminous intensity from the magnetar model for a particular magnetic field strength, magnetar spin period, etc. The synchrotron component is the dashed line from the magnetar’s wind. The thermal “BB” (blackbody) component, shown as a dotted line, comes from the energy injected into the ejecta by the magnetar wind and radioactive decay. The sum of the two components is the solid line, representing the observed spectrum. [Li et al. 2024]
How Does a “Young, Windy Magnetar Cow” Look?
Using their model, the authors compiled the optical and X-ray observations of AT2018cow and compared them with their predictions. The optical and X-ray light curves are shown in Figure 2, and the X-ray spectra are shown in Figure 3. The optical data align quite nicely until about 50 days, and the X-ray spectra at early (7 days) and late (46 days) fit well.
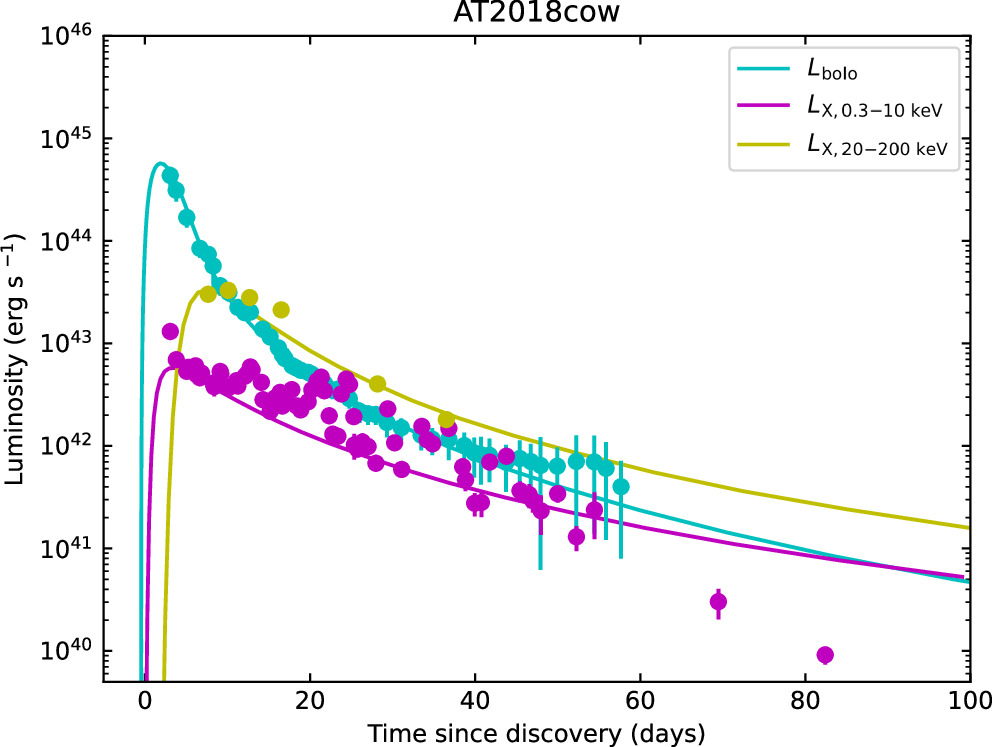
Figure 2: The optical (bolometric) and X-ray light curves in the soft and hard bands. The model explains the optical and X-ray properties well until about 50 days after the event when it over-predicts the X-ray flux and under-predicts the bolometric optical luminosity. [Li et al. 2024]
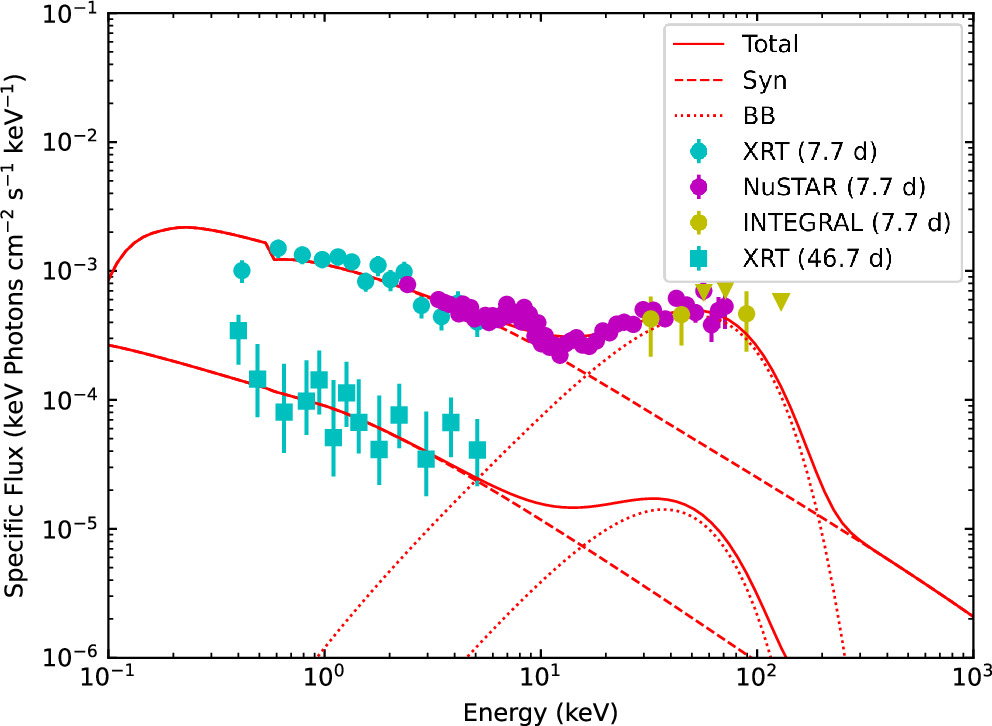
Figure 3: The observed X-ray spectrum of AT2018cow at 7.7 days (circles) and 46.7 days (squares). The model explains well the rising X-ray emission at the highest energies in the first epoch. Unfortunately, the second epoch does not constrain the thermal component of the emission very well. [Li et al. 2024]
Original astrobite edited by Sonja Panjkov.
About the author, Will Golay:
I am a graduate student in the Department of Astronomy at Harvard University and the Center for Astrophysics | Harvard & Smithsonian, advised by Edo Berger. I study radio emission from transient astrophysical objects like tidal disruption events.
The post Mooing Magnetars: Modeling the Enigmatic FBOT AT2018cow “The Cow” appeared first on AAS Nova.
]]>
New JWST images reveal the dusty, windswept envelopes surrounding five young protostars.
The post Featured Image: Outflows from Baby Stars appeared first on AAS Nova.
]]>In stellar nurseries throughout the Milky Way, baby stars swaddled in dusty blankets are growing rapidly and shaping their birth environments. Recently, a research team led by Samuel Federman (University of Toledo) used JWST to investigate the behavior of five young protostars, two of which are shown in the image above. The new JWST images capture the squalls of protostars in their earliest stages, about which relatively little is known. During these early stages, protostars are swathed in dense, dusty envelopes of gas that fall onto the star, spurring rapid growth through accretion. The accretion, in turn, powers narrow outflowing jets and wide outflowing winds that carve out a cavity in the surrounding envelope, creating the characteristic hourglass shapes in the images above. For more information and a closer look at all of the protostars in the sample, be sure to check out the full research article linked below.
Citation
“Investigating Protostellar Accretion-driven Outflows across the Mass Spectrum: JWST NIRSpec Integral Field Unit 3–5 μm Spectral Mapping of Five Young Protostars,” Samuel A. Federman et al 2024 ApJ 966 41. doi:10.3847/1538-4357/ad2fa0
The post Featured Image: Outflows from Baby Stars appeared first on AAS Nova.
]]>
Models suggest that black holes that weigh less than 5x the mass of the Sun shouldn't exist. Those models will have to be revisited now that scientists have discovered a featherweight black hole that collided with a neutron star.
The post The Featherweight Champion of Black Holes appeared first on AAS Nova.
]]>In May of last year, an international collaboration of astronomers and physicists switched on a set of detectors and began the most intensive search for gravitational waves ever attempted. They did not have to wait long for a new discovery that challenges our understanding of the extreme universe: just days into their campaign, the scientists caught the signal from the smallest black hole ever detected by their observatories, one that is so light it couldn’t have formed according to our typical models. After a year of analysis, the scores of scientists involved in this remarkable find have just published their work in The Astrophysical Journal Letters.
How To Warp Spacetime
Although gravitational waves, or ripples in spacetime caused by collisions between massive objects, have permeated the universe since its very beginning, scientists have only been able to directly measure them since 2015. Since then, we’ve learned much about these waves and the objects that source them, and we’ve built up a pretty clear picture of what it takes to wrinkle space itself.
A gravitational wave detector. Ripples in spacetime cause the two arms to change lengths by tiny amounts, and scientists detect passing waves by carefully measuring these distortions. [Caltech/MIT/LIGO Lab]
Neutron stars, as best we understand from theoretical models and observations taken with radio and X-ray telescopes, can weigh up to about 3 times the mass of the Sun and are formed when a large star explodes. Black holes, on the other hand, are typically heavier. They weigh more than 5 times the mass of the Sun, and they’re thought to form when a large star collapses in on itself.
Putting these two facts together, it’d be very strange to identify an object that’s between 3 and 5 solar masses: anything in that gap would be too heavy to be a neutron star, but too light to be a black hole. And yet, that’s exactly what the international collaboration found: the collision between a 1.4-solar-mass neutron star and a 3.6-solar-mass black hole, making the latter an inhabitant of the so-called “mass gap.”
A Rule-Breaking Merger
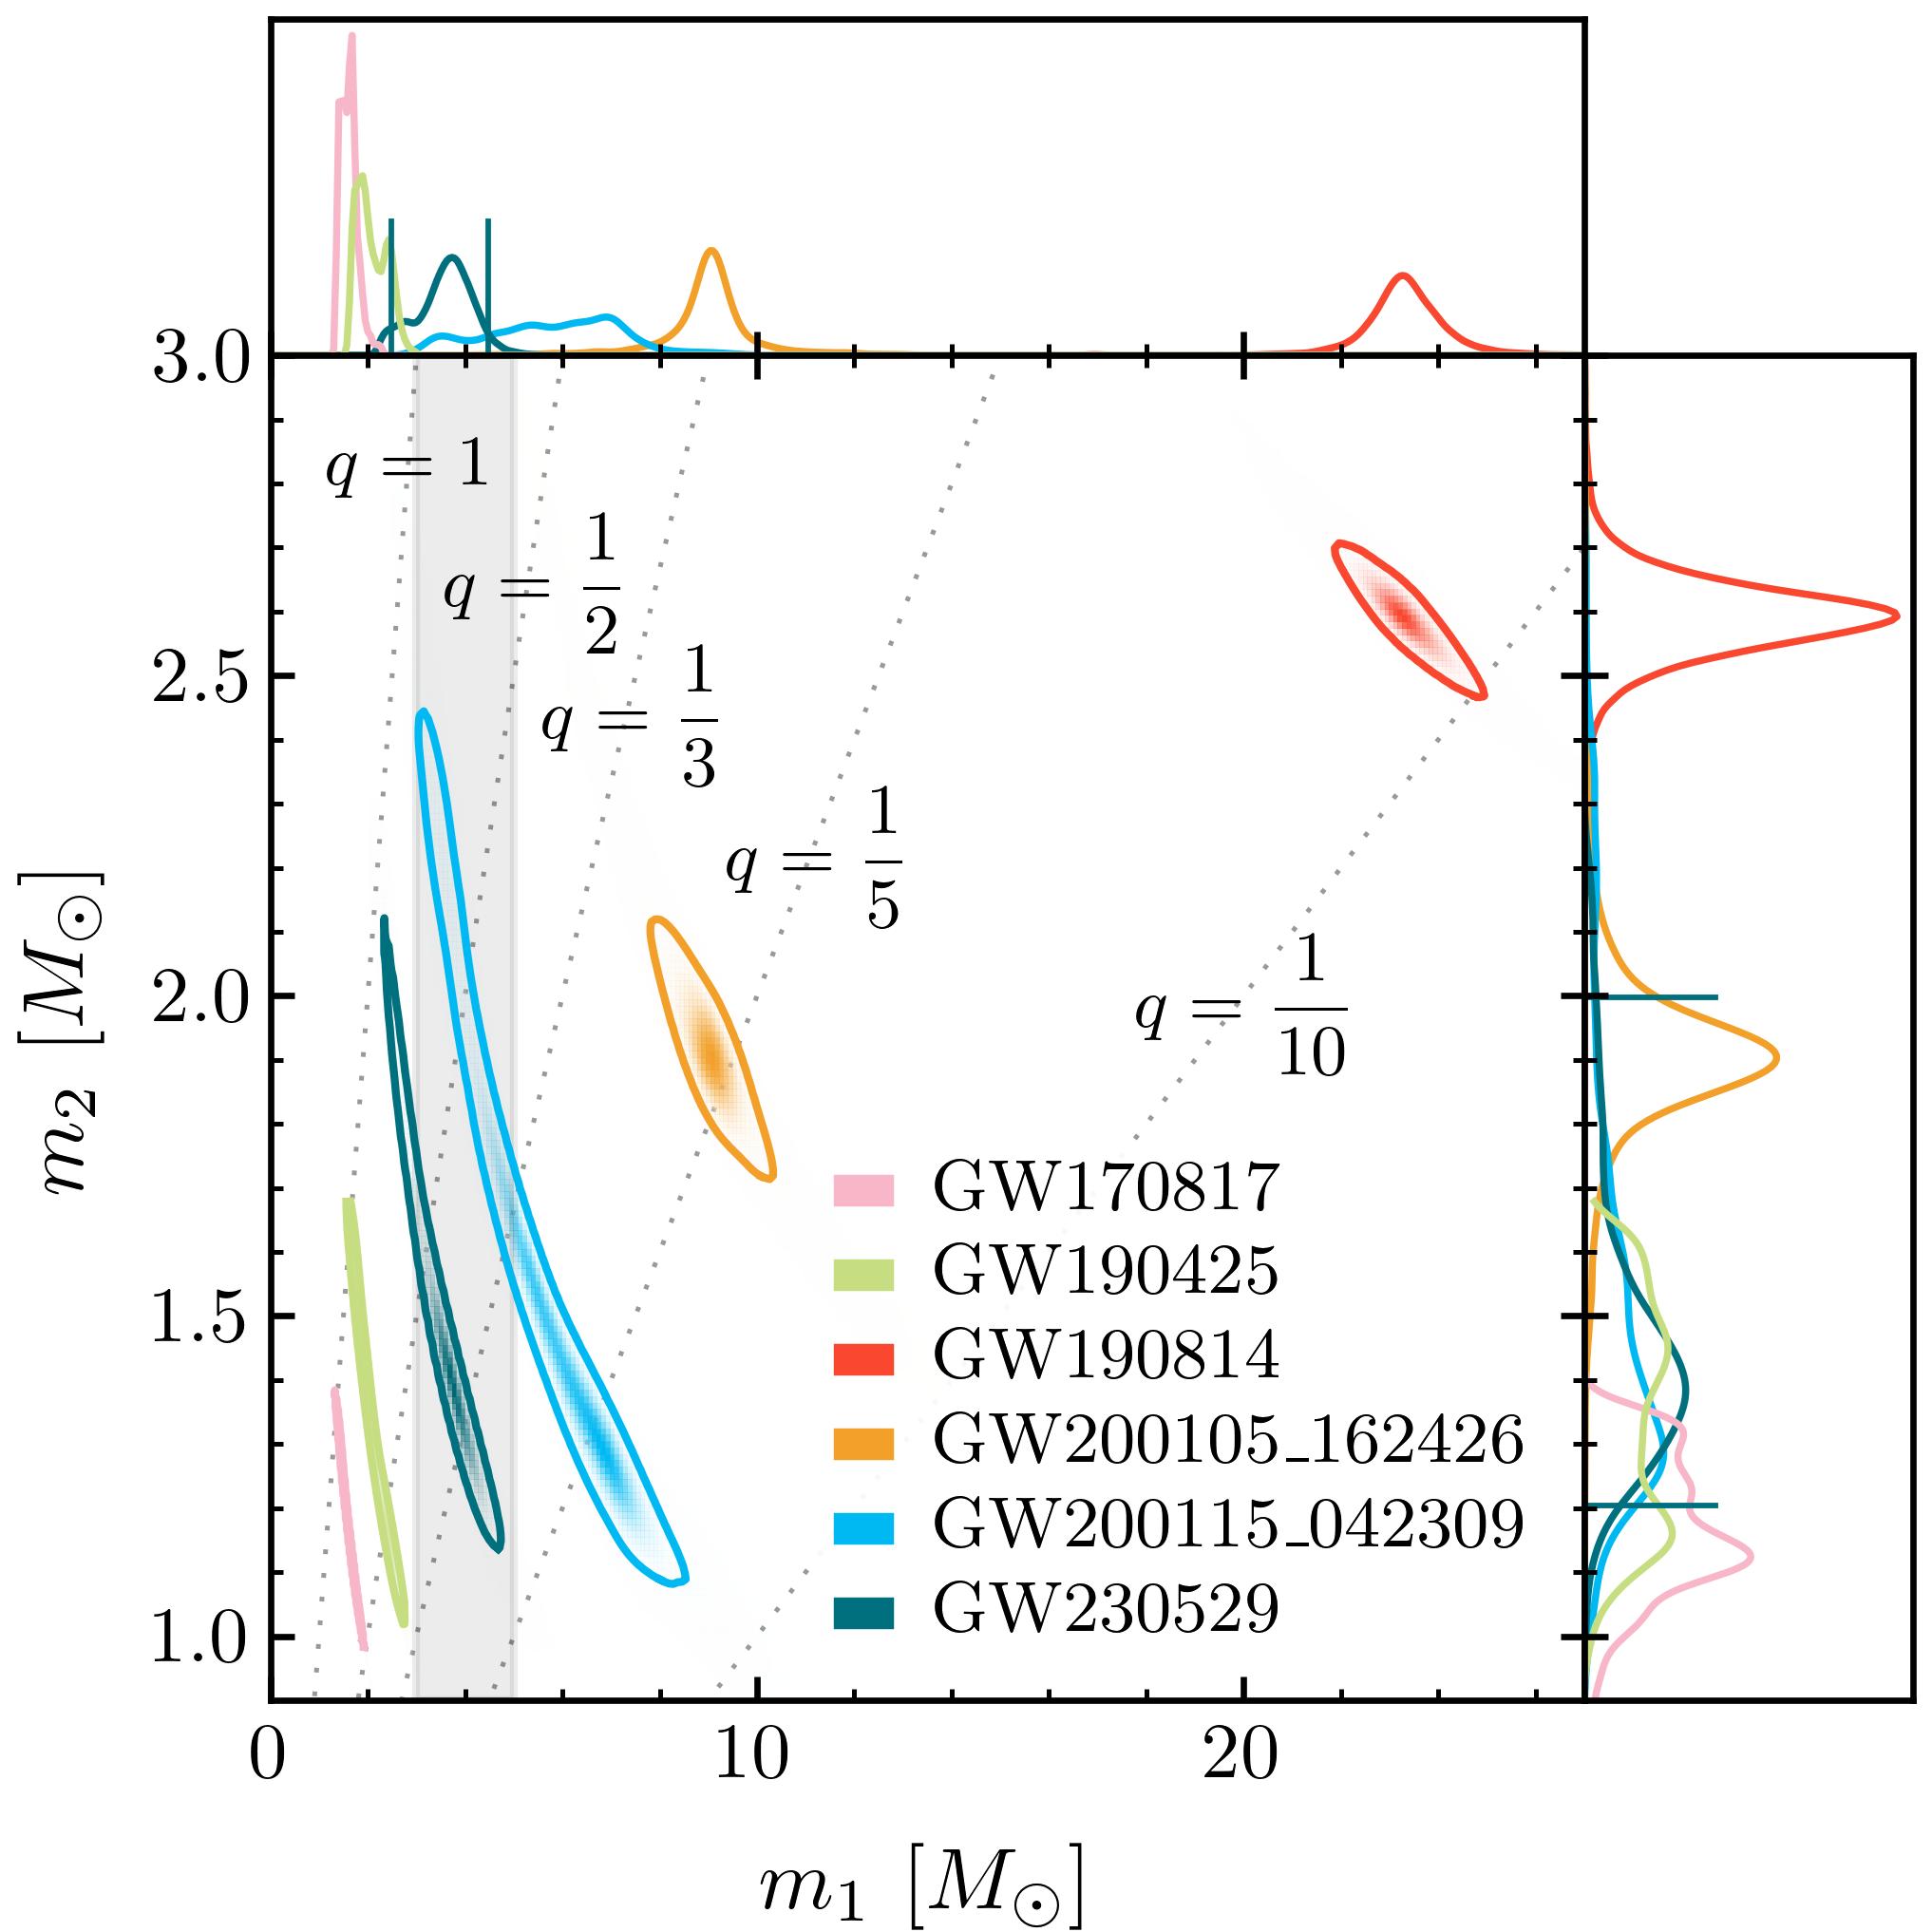
The inferred masses of each component of a handful of gravitational wave mergers. The “mass gap” is marked in light grey, and the likely mass of the primary component of this event, GW230529, lies nearly entirely within it. [A. G. Abac et al 2024]
In the end, the event passed all of their tests. The wave was detected by three independent analysis pipelines, and although the choices that go into modeling the collision can affect the inferred mass, most reasonable options all point to the same conclusion: the observed gravitational wave really does seem to have come from an impossibly light black hole and its merger with a typical neutron star. This proof-by-contradiction that small black holes exist implies that there are probably plenty of them, which happily means we can look forward to additional head-scratching detections of similar pairs in the future.
Citation
“Observation of Gravitational Waves from the Coalescence of a 2.5–4.5 M⊙ Compact Object and a Neutron Star,” A. G. Abac et al 2024 ApJL 970 L34. doi:10.3847/2041-8213/ad5beb
The post The Featherweight Champion of Black Holes appeared first on AAS Nova.
]]>
A new method for modeling turbulent magnetic fields — important for everything from accretion disks to the solar wind — yields realistic fields while also keeping computational costs low.
The post Tailor-Made Turbulence for All Your Modeling Needs appeared first on AAS Nova.
]]>
Visualization of the plume from a candle transitioning from a smooth flow near the wick to a turbulent flow higher up. [Gary Settles; CC BY-SA 3.0]

A Chaotic Challenge
In the accretion disks around supermassive black holes, the clouds of molecular gas where stars are born, and even the atmosphere of the Sun, turbulence plays an important role in transferring energy and mixing plasmas. Because turbulent plasmas are so common, researchers across astronomical fields must wrestle with the challenge of modeling these chaotic systems.
The traditional way to model a turbulent system is to do so numerically: churning through sets of equations to track the behavior of a plasma across tiny time increments. But as models become more complex, this comes at a higher computational cost, requiring an increasingly large number of hours for computers to handle the math.
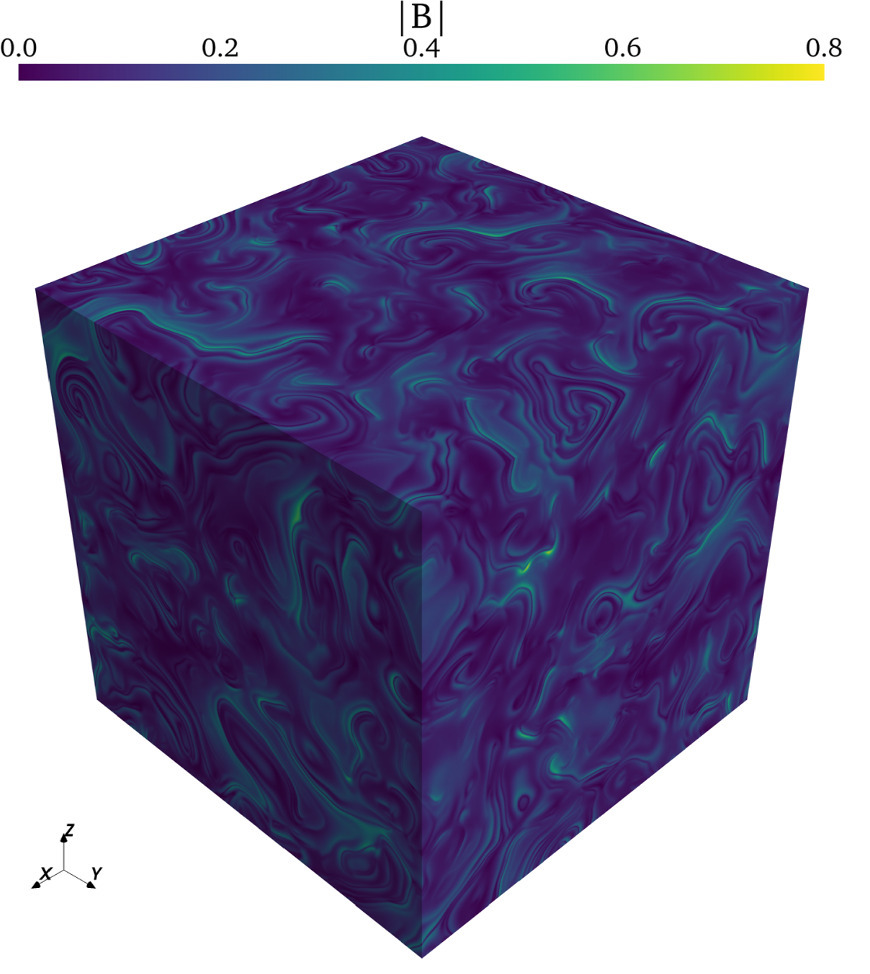
A representation of a typical three-dimensional turbulent magnetic field generated by BxC. [Adapted from Maci et al. 2024]
Synthetic Magnetic Fields
Synthetic models that use relatively simple algorithms to generate realistic plasmas provide an alternative. Recently, Daniela Maci (KU Leuven) and collaborators introduced a new synthetic model of turbulent magnetic fields. The team’s model builds on an existing synthetic model called BxC, a Python-based code that speedily produces three-dimensional turbulent magnetic fields.
To generate realistic turbulence, BxC starts with a random field of vectors based on white noise. From there, this vector field is tweaked and transformed to adjust its statistical properties. In practice, this means that not only do BxC’s synthetic fields look turbulent, they also reproduce the expected statistical properties of a turbulent field, setting BxC apart from other models. This makes BxC an excellent jumping-off platform for creating realistic turbulent magnetic fields, and Maci’s team showed how the statistical properties of the modeled field depend on the model’s inputs.
Paths Forward
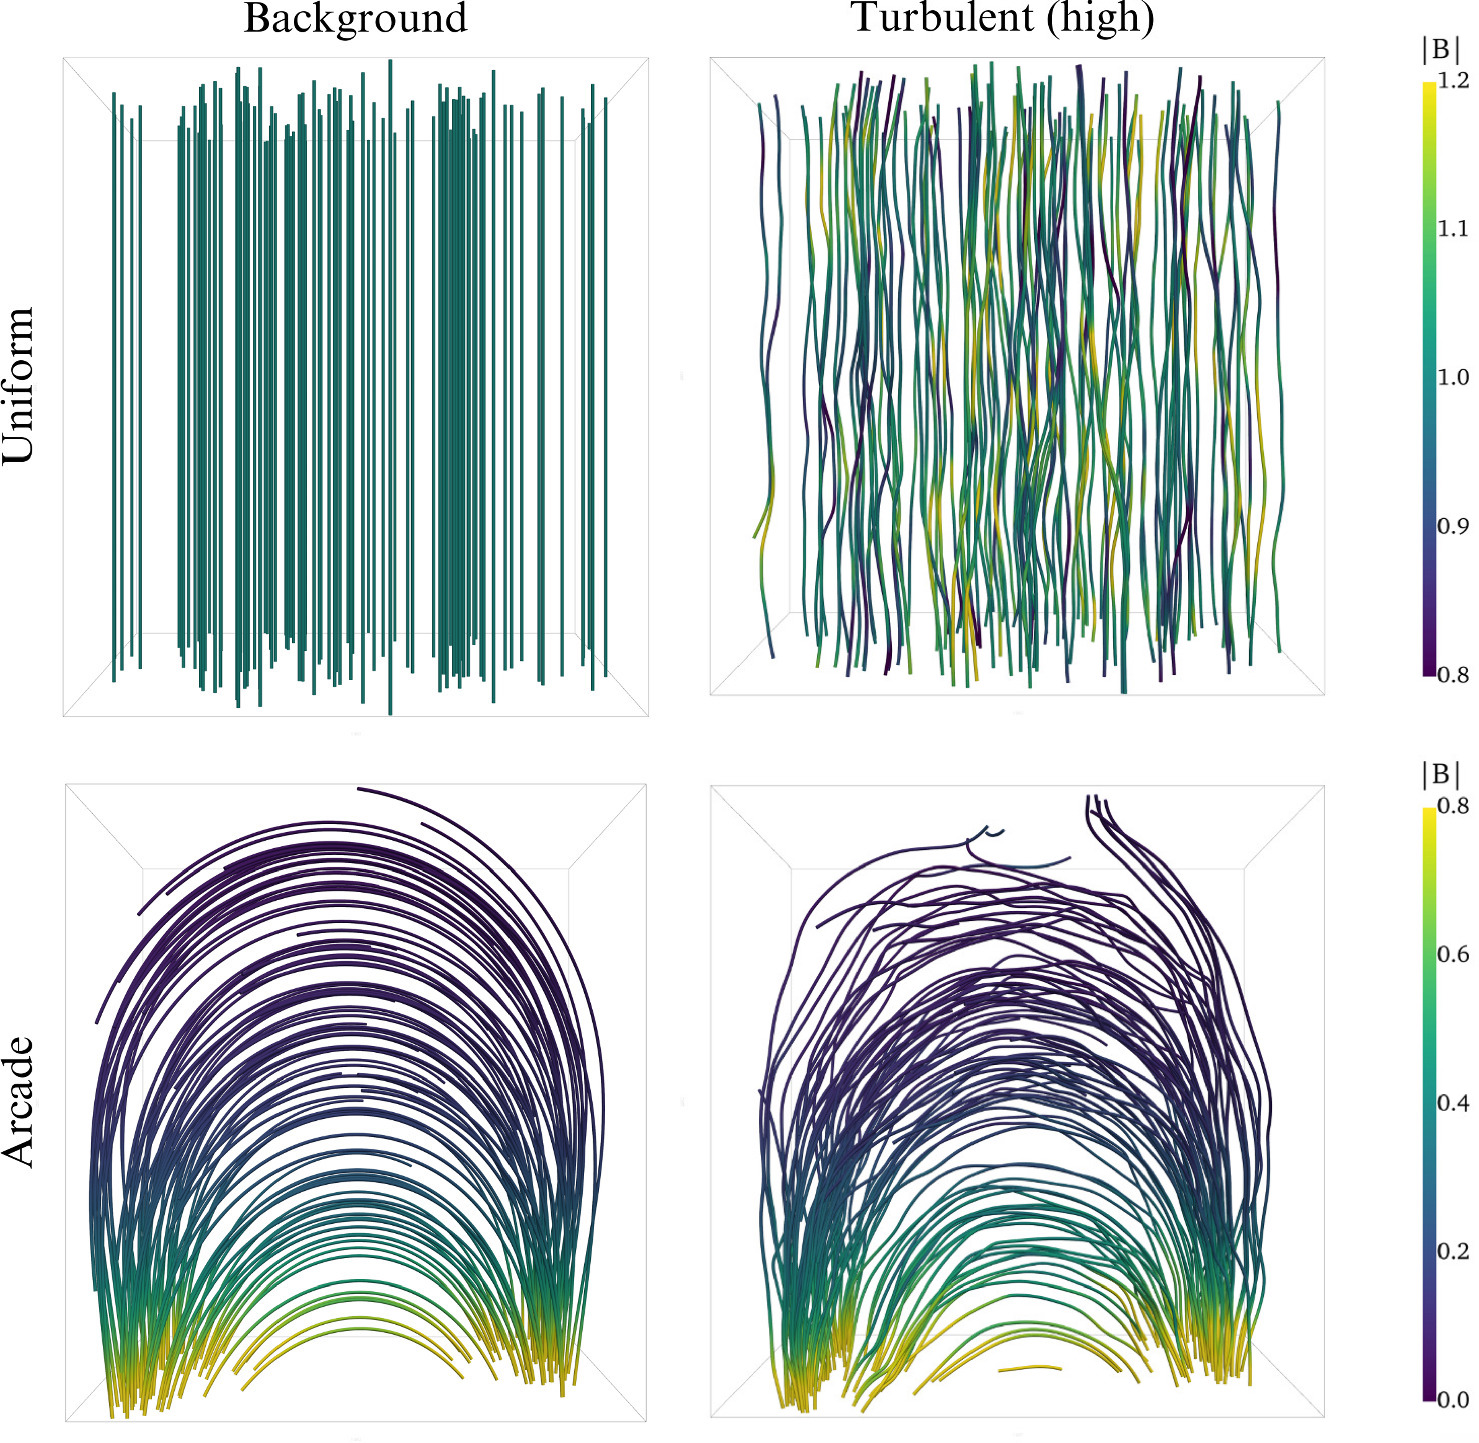
Examples of simulated turbulence that develops on top of a background magnetic field. Click to enlarge. [Adapted from Maci et al. 2024]
This work demonstrates the power and flexibility of synthetic models for representing turbulent magnetic fields — and all of these features are available orders of magnitude faster than they would be from a traditional numerical model. The team anticipates making future additions to their model, all of which would give the user more customization options and make the model applicable to more astrophysical scenarios.
Citation
“BxC Toolkit: Generating Tailored Turbulent 3D Magnetic Fields,” Daniela Maci et al 2024 ApJS 273 11. doi:10.3847/1538-4365/ad4bdf
The post Tailor-Made Turbulence for All Your Modeling Needs appeared first on AAS Nova.
]]>
Astrobites reports on the likelihood of exoplanetary systems having both small, close-in planets and large, far-out gas giant planets.
The post How Common Are Solar Systems Like Our Own? appeared first on AAS Nova.
]]>Editor’s Note: Astrobites is a graduate-student-run organization that digests astrophysical literature for undergraduate students. As part of the partnership between the AAS and astrobites, we occasionally repost astrobites content here at AAS Nova. We hope you enjoy this post from astrobites; the original can be viewed at astrobites.org.
Title: Friends Not Foes: Strong Correlation Between Inner Super-Earths and Outer Gas Giants
Authors: Marta L. Bryan and Eve J. Lee
Authors’ Institutions: University of Toronto and McGill University
Status: Published in ApJL
We have found exoplanet systems with small, close-in planets, like super-Earths, and we have also found exoplanet systems with distant gas giants like Jupiter. However, it is not clear how often these two kinds of planets form in the same planetary system. A system with a small, close-in planet and a distant giant planet would begin to resemble our own solar system, in that we have multiple rocky planets interior to multiple gas giant planets. We have found a few of these systems, and when astronomers find a few of something, they naturally want to compute an occurrence rate (see this bite).
Today’s article looks at the occurrence rates of small and large planets in the same system. Occurrence rates attempt to quantify how often a particular outcome is expected to be observed. In exoplanet science, this represents how often a particular kind of planet will be found if one randomly surveys stars to search for planets. In particular, today’s article looks to settle a debate. In the past, multiple teams have attempted to measure the occurrence rate of systems with a distant gas giant planet, given that the system has an inner small planet. We call this the conditional occurrence rate, because we want to know how often Planet Type A will be found in a chosen system if we already know (i.e., “on the condition”) that Planet Type B occurs in that chosen system.
Three past studies found a positive correlation between the conditional occurrence of these kinds of planets. In other words, if you find an inner small planet, you are more likely to find a distant giant than you would be if you randomly looked at a system with no inner small planet. However, other studies found no correlation (see this astrobite) or an anti-correlation — that is, you are less likely to find a distant gas giant in a system with an inner small planet than in a system with no inner small planet. It was recently found that accounting for the metallicity of the host stars results in a positive correlation instead of no correlation or a negative correlation. Metallicity is the measurement of how much of the star is composed of elements heavier than helium. Higher metallicity means a higher percentage of the star is made up of heavy elements, or “metals.”
Today’s article builds on the finding that host-star metallicity is an important metric for properly understanding the conditional occurrence rate of small, close-in planets and distant gas giant planets. The authors take all stars that have large publicly available radial velocity data sets and at least one confirmed small, close-in planet. They also purposefully cut out any host stars that are M dwarfs, since it has been demonstrated that M-dwarf stars have almost no distant gas giants (see this astrobite). Ultimately, they compile a sample of 184 systems.
To calculate the conditional occurrence rate, the authors have to take into account the completeness of the radial velocity data sets for finding distant giants. Completeness quantifies how sensitive the data are to finding a certain kind of planet (see this astrobite). For example, the radial velocities may have been sampled at times that are inopportune to finding a certain mass and period planet. To measure completeness for each of their 184 systems, the authors perform an injection/recovery test. They generate a planet with a given set of orbital parameters (period, eccentricity, inclination) and mass, then generate (inject) the expected radial velocity curve for that simulated planet at the same timestamps as the real observations. They then attempt to detect the simulated planet in the simulated data (recover).
They do this thousands of times for different simulated planets and repeat this for each of the 184 data sets. From this test, they can quantify how many distant giant planets these data sets might have missed and how many they almost definitely did not miss. Using these completeness maps, they generate an average completion map (see Figure 1), which they use to compute the conditional occurrence rate.

Figure 1: The color bar shows the average completeness map for this sample (bright colors are more complete, dark colors are less complete) with the detected distant gas giant planets overlaid as blue dots. [Adapted from Bryan & Lee 2024]
But this is not quite enough — we also need to compare the conditional occurrence rate to the occurrence rate of distant gas giant planets, regardless of having an inner planet or not. If the rates are different, that tells us there is a relationship between the inner and outer system planets. Indeed the authors do find different rates! For metal-rich stars, they find that regardless of the inner system, distant giant planets occur for 12–13% of stars. (The authors used two data sets for this analysis.) Distant giant planets occur for 4–6% of metal-poor stars. Therefore, because the conditional occurrence is enhanced (28% vs. 12–13%, see Figure 2), this points to a positive correlation: if you find an inner small planet, you are more likely to find a distant gas giant than if you randomly searched for only distant gas giants!

Figure 2: The probability distribution of the conditional occurrence rates for systems with inner small planets (red) versus without considering any inner planets (black and gray). The red curve peaks at a higher occurrence rate than the black and gray curves, so having an inner small planet enhances the occurrence of having a distant gas giant. [Adapted from Bryan & Lee 2024]
Original astrobite edited by Samantha Wong.
About the author, Jack Lubin:
Jack received his PhD in astrophysics from UC Irvine and is now a postdoc at UCLA. His research focuses on exoplanet detection and characterization, primarily using the radial velocity method. He enjoys communicating science and encourages everyone to be an observer of the world around them.
The post How Common Are Solar Systems Like Our Own? appeared first on AAS Nova.
]]>
Supernova hunters have been busy: SN 2024ggi is the second nearby supernova in less than a year. What do archival observations tell us about this supernova's progenitor star?
The post Meet the Progenitor of the Latest Nearby Supernova appeared first on AAS Nova.
]]>Less than a year after SN 2023ixf captivated astronomers worldwide, another nearby supernova burst onto the scene. At a distance of just 22 million light-years, SN 2024ggi provides another excellent opportunity to study the behavior of red supergiant stars in their final years.
Live Fast, Die Spectacularly
The discovery of a new nearby supernova marks the beginning of a cosmic chase. After astronomers pinpoint a rapidly brightening point of light in a distant galaxy — a new supernova! — they hunt through archival data to learn more about the star that exploded. Using this method, researchers have tracked down dozens of supernova progenitor stars and have learned that core-collapse supernovae usually arise from red supergiant stars with masses in the range of 8 to 18 solar masses.
Supernova hunters have been busy recently: while the dust was still settling from SN 2023ixf — the nearest bright supernova in nearly a decade — the Asteroid Terrestrial-impact Last Alert System discovered the supernova SN 2024ggi on 11 April 2024 in the galaxy NGC 3621. This marks the first time a supernova has been recorded in this galaxy, which is just barely more distant than SN 2023ixf’s host galaxy. What can archival observations tell us about this supernova’s progenitor star?
Archival Analysis
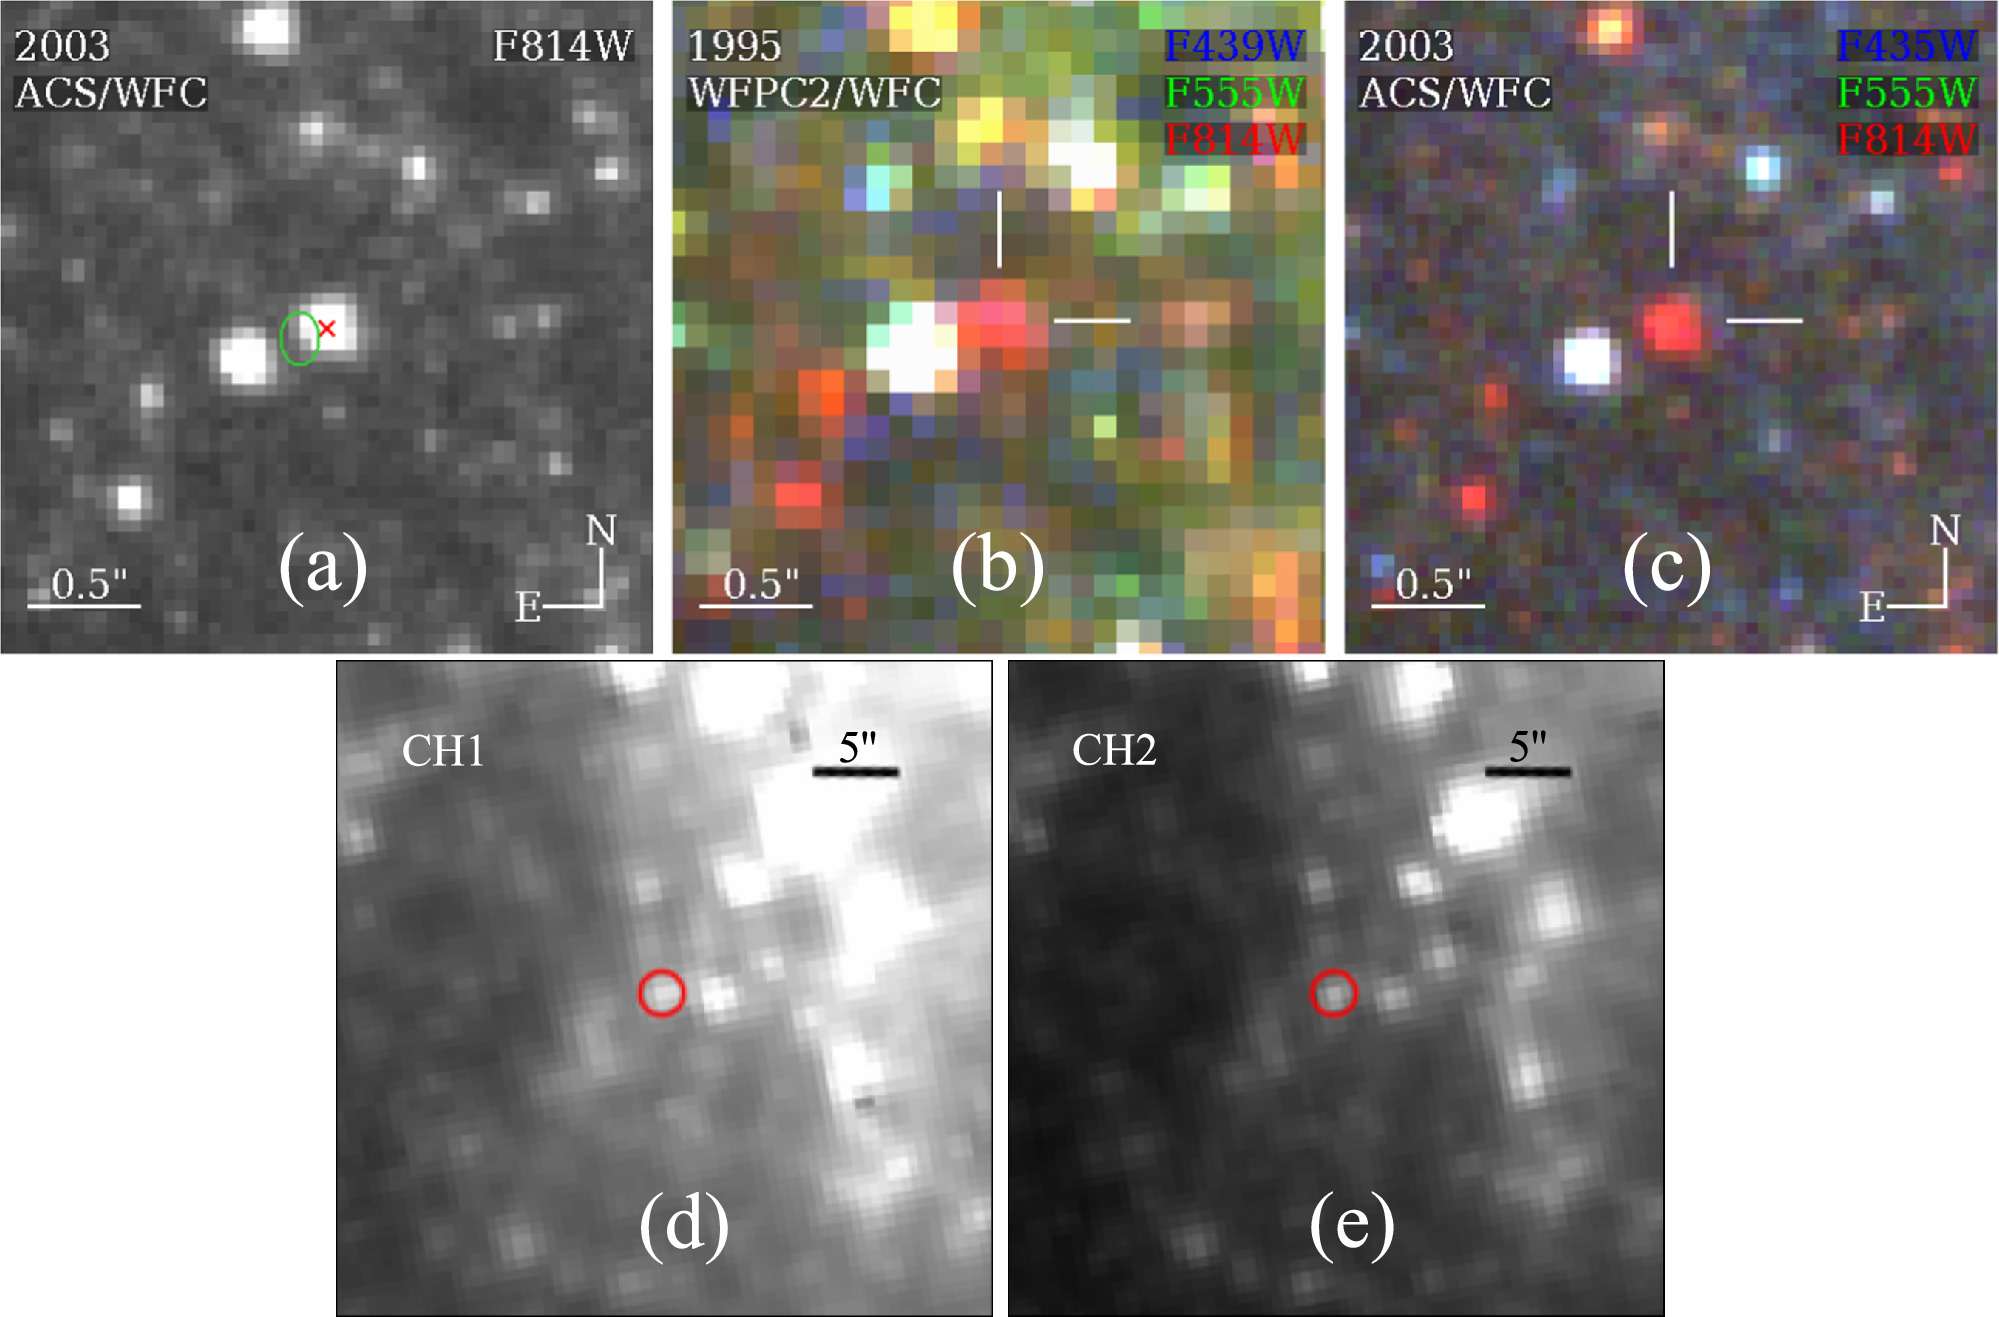
Images of SN 2024ggi’s progenitor from Hubble (top row) and Spitzer (bottom row). [Xiang et al. 2024]
In Spitzer images of NGC 3621 from 2004 to 2019, the same star is faintly visible but crowded by other stars. By carefully removing the light from the star’s close neighbors, the team was able to monitor the star’s brightness over many years. They found that its brightness varied at both infrared and optical wavelengths with a period of about 378 days. This type of variability is common in red supergiant stars and is likely due to radial pulsations.
Surprisingly Dust Free
Xiang and Mo’s team also plotted the star’s spectral energy distribution, or how its energy output is spread across different wavelengths of light. They used two classes of models to interpret the spectral energy distribution: one model that included a veil of dust around the star and one that was dust free.
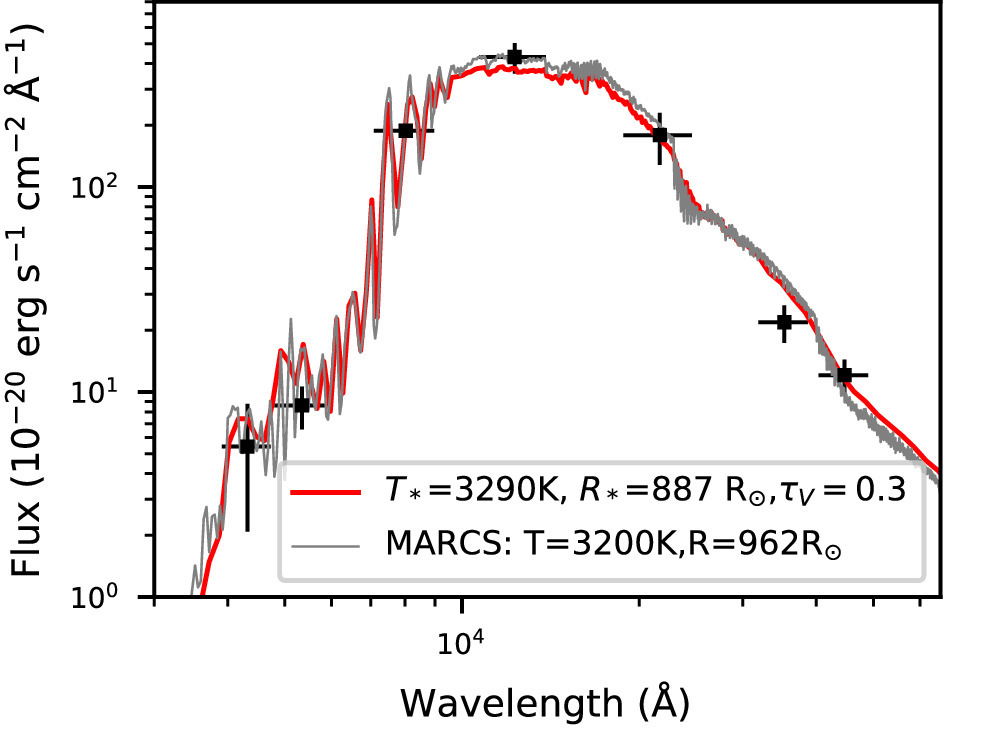
Observed spectral energy distribution of SN 2024ggi’s progenitor star (black squares). The lines show the best-fit spectral energy distributions for the model with dust (red) and without dust (gray). [Adapted from Xiang et al. 2024]
The thinness of the dust shell implies a low mass-loss rate for the star in the decades before its explosion, but researchers studying the subsequent supernova found the star’s mass-loss rate just before its demise to be much higher. This might mean that while SN 2024ggi’s progenitor shed mass at a modest rate during most of its life, it shed far more mass in its final years. This finding adds to the growing body of evidence that red supergiants undergo stellar tantrums before their ultimate explosions.
Citation
“The Red Supergiant Progenitor of Type II Supernova 2024ggi,” Danfeng Xiang et al 2024 ApJL 969 L15. doi:10.3847/2041-8213/ad54b3
The post Meet the Progenitor of the Latest Nearby Supernova appeared first on AAS Nova.
]]>
Simulations suggest that black holes could have grown to supermassive size with the help of young star clusters in the early universe.
The post A New Way to Grow a Supermassive Black Hole appeared first on AAS Nova.
]]>How do supermassive black holes get so massive? New simulations show how black holes might have grown rapidly in the early universe.
A deep-sky image from JWST. The inset shows the galaxy JADES-GS-z14-0, which is currently the most distant known galaxy. This image shows how the galaxy looked less than 300 million years after the Big Bang. [NASA, ESA, CSA, STScI, B. Robertson (UC Santa Cruz), B. Johnson (CfA), S. Tacchella (Cambridge), P. Cargile (CfA)]
Black Holes as Far as Our Telescopes Can See
When JWST first examined galaxies in the early universe, it discovered something extraordinary: galaxies just a few hundred million years after the Big Bang are home to black holes, and these black holes are massive.
How these black holes grew to millions or billions of times the mass of the Sun so quickly is an open question, but most theories fall into two general categories: these early black holes either sprouted from stellar-mass pips that bulked up at a prodigious rate, or they got their start as more massive black holes that grew at a more modest rate. Other, more speculative origin stories invoke exotic forms of dark matter or supermassive stars. All options face serious challenges, and many researchers turn to simulations to find a way forward.
Captured by Clusters
Yanlong Shi (California Institute of Technology and University of Toronto) and collaborators used simulations to test a way for young black holes to become supermassive in short order. The simulations began with 100 million solar masses of gas collected in a cloud about 330 light-years across, representative of a dense star-forming clump in an early galaxy.
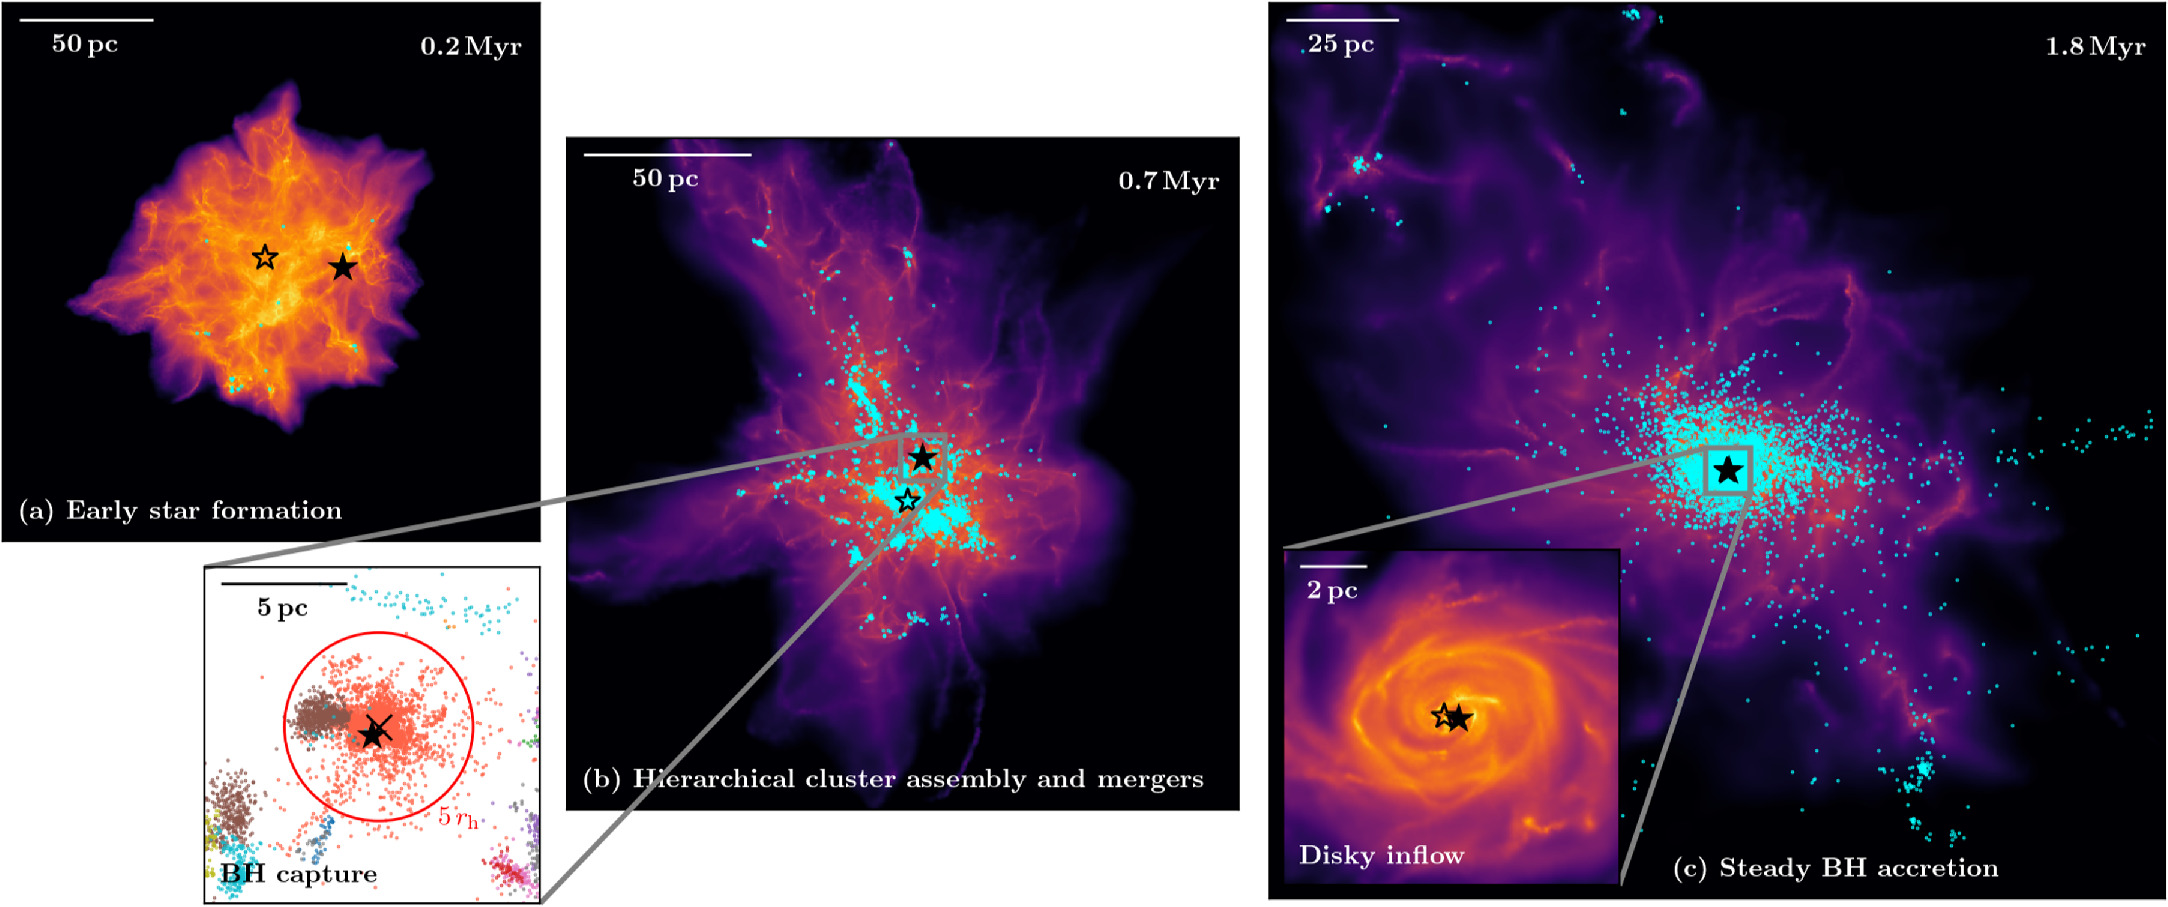
Gas density (colored areas), star locations (cyan dots), and selected black hole locations (black stars) during three stages of the simulated evolution. These images show how the growing black holes are captured by tight star clusters and transported to the center of the cloud. From there, an accretion disk forms and channels gas to the black holes. Click to enlarge. [Shi et al. 2024]
Once the black holes reached the center of the cloud, their growth kicked into a whole new gear. Now attracted by a deep gravitational potential well, gas from throughout the cloud sank toward the central black holes and swirled together in an accretion disk. The magnetic field threaded throughout the disk prevented the disk from fragmenting and forming new stars. In about a million years, the two fastest-growing black holes had grown to more than 2 million solar masses.
Connecting the Little Red Dots
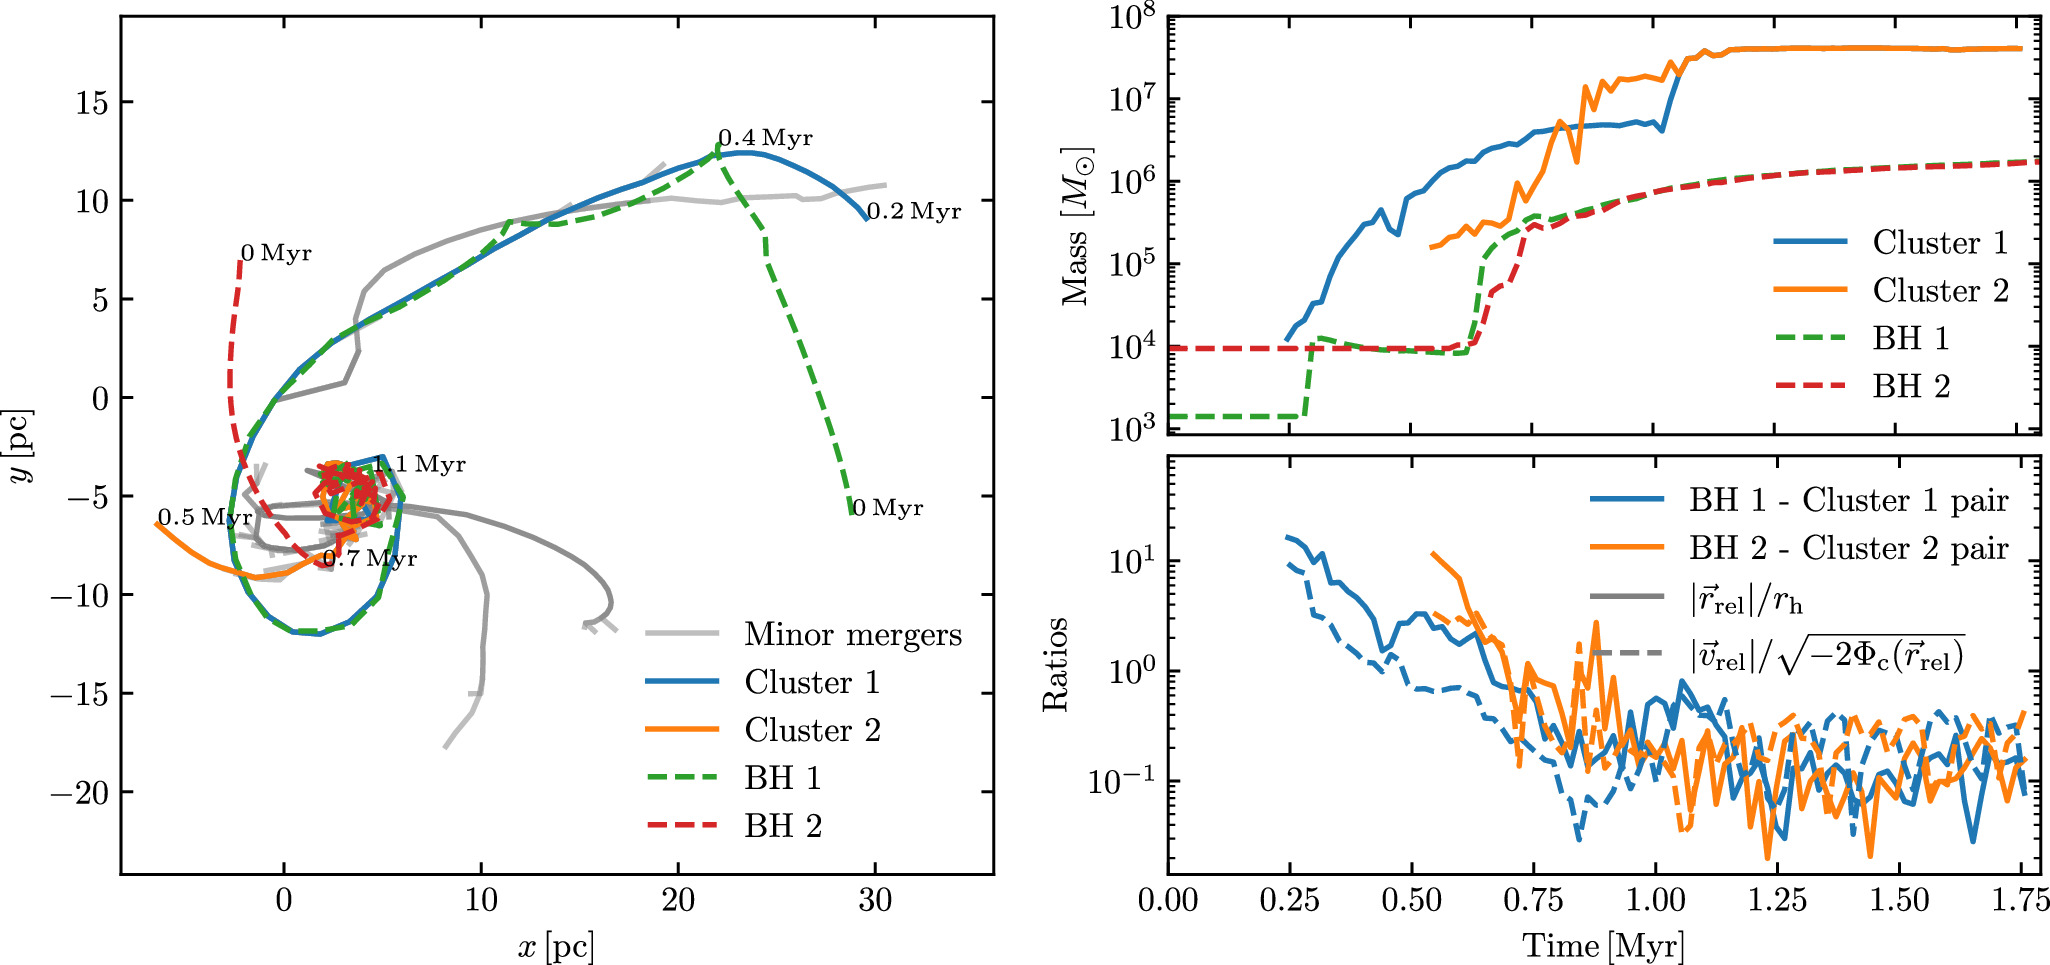
Another illustration of the movement and growth of the black holes. The leftmost image shows the capture of the black holes by the star clusters and the motion of these captured black holes to the center of the cloud. The images on the right show the masses and mass ratios of selected star clusters and black holes over time. Click to enlarge. [Shi et al. 2024]
The team’s simulations may yield a clue to the solution of another cosmic mystery. Near the end of the simulation, the assemblage of young stars and massive black holes has similar properties to the unusual “little red dot” galaxies spotted by JWST just 700 million years after the Big Bang.
While Shi’s team hopes to explore the observational implications of their model results further, the predictions will likely be difficult to test, requiring telescopes to pierce the dense, dusty gas that obscures the inner galactic regions where black holes grow.
Citation
“From Seeds to Supermassive Black Holes: Capture, Growth, Migration, and Pairing in Dense Protobulge Environments,” Yanlong Shi et al 2024 ApJL 969 L31. doi:10.3847/2041-8213/ad5a95
The post A New Way to Grow a Supermassive Black Hole appeared first on AAS Nova.
]]>
A pair of nearly identical fast radio bursts from different sources gives a hint to the cause of these powerful radio flashes.
The post The Curious Case of Twin Fast Radio Bursts appeared first on AAS Nova.
]]>Astronomers have discovered two fast radio bursts with eerily similar signals. What’s the likeliest cause of these twin bursts?
Mysterious Bursts
Artist’s impression of a neutron star, the core of a massive star that has exploded as a supernova. [ESO/L. Calçada; CC BY 4.0]
As researchers attempt to parse the similarities and differences among the growing sample of radio bursts into a coherent theory of their origins, a curious pair of bursts has arrived on the scene. What can we learn from a nearly identical pair of bursts?
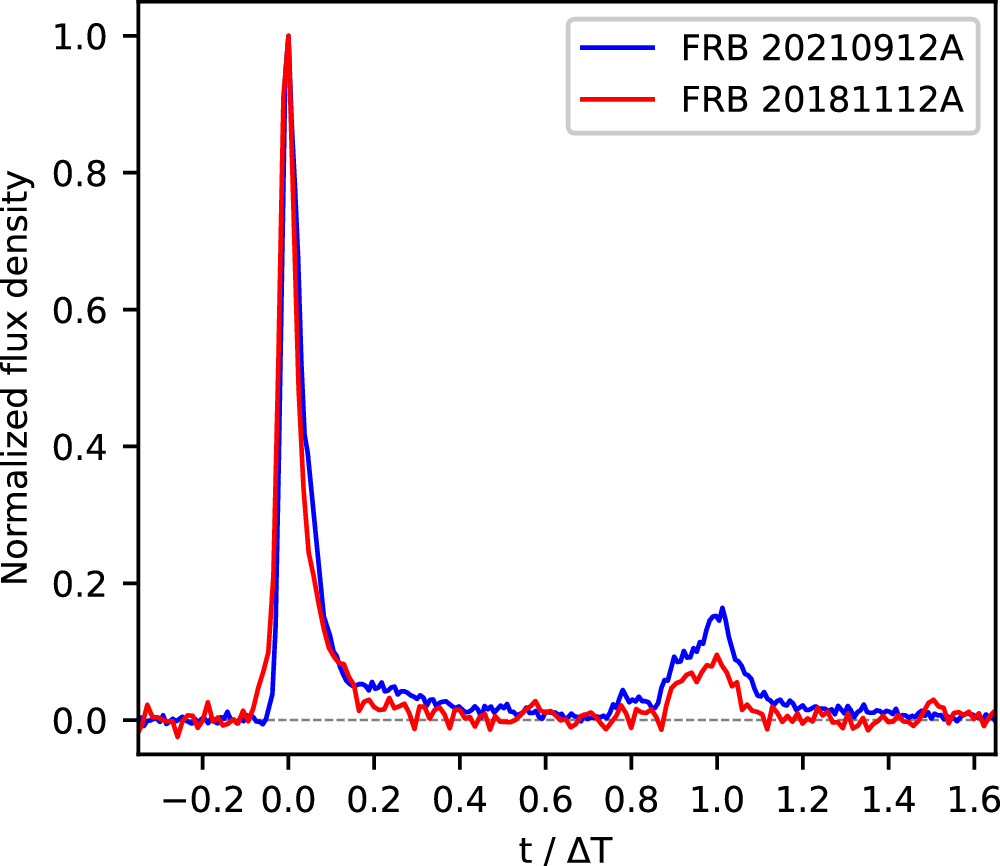
The flux profiles of the 2018 (red) and 2021 (blue) bursts. The flux has been normalized to the peak intensity of each burst. Note that the times on the horizontal axis have been normalized to the time between the burst components. [Bera et al. 2024]
Twins from Extragalactic Space
In 2018, the fast radio burst FRB 20181112A arrived at Earth after a journey of billions of light-years, announcing itself with a prominent 0.2-millisecond flash of radio waves and a second, subtler signal just one millisecond later. In 2021, FRB 20210912A was discovered, looking oddly familiar: it too was marked by an initial bright component and a later faint component.
Apurba Bera (Curtin University) and collaborators examined this pair of bursts to understand how deep their similarities go. Using data from the Australian Square Kilometre Array Pathfinder, Bera’s team showed that the relative emission timescales — for example, the ratio of the width of the bright signal to the width of the faint signal — are remarkably similar.
The absolute timescales of the bursts are slightly different, which the team suggests could be due to their different travel times. The 2018 burst arrived from a redshift of z = 0.4755, but the 2021 burst’s redshift is unknown. If the 2021 burst occurred at a redshift of z = 1.35 — possible, given a previous estimate of z = 1.18 ± 0.24 — the absolute timescales would be identical as well.
Possible Origins
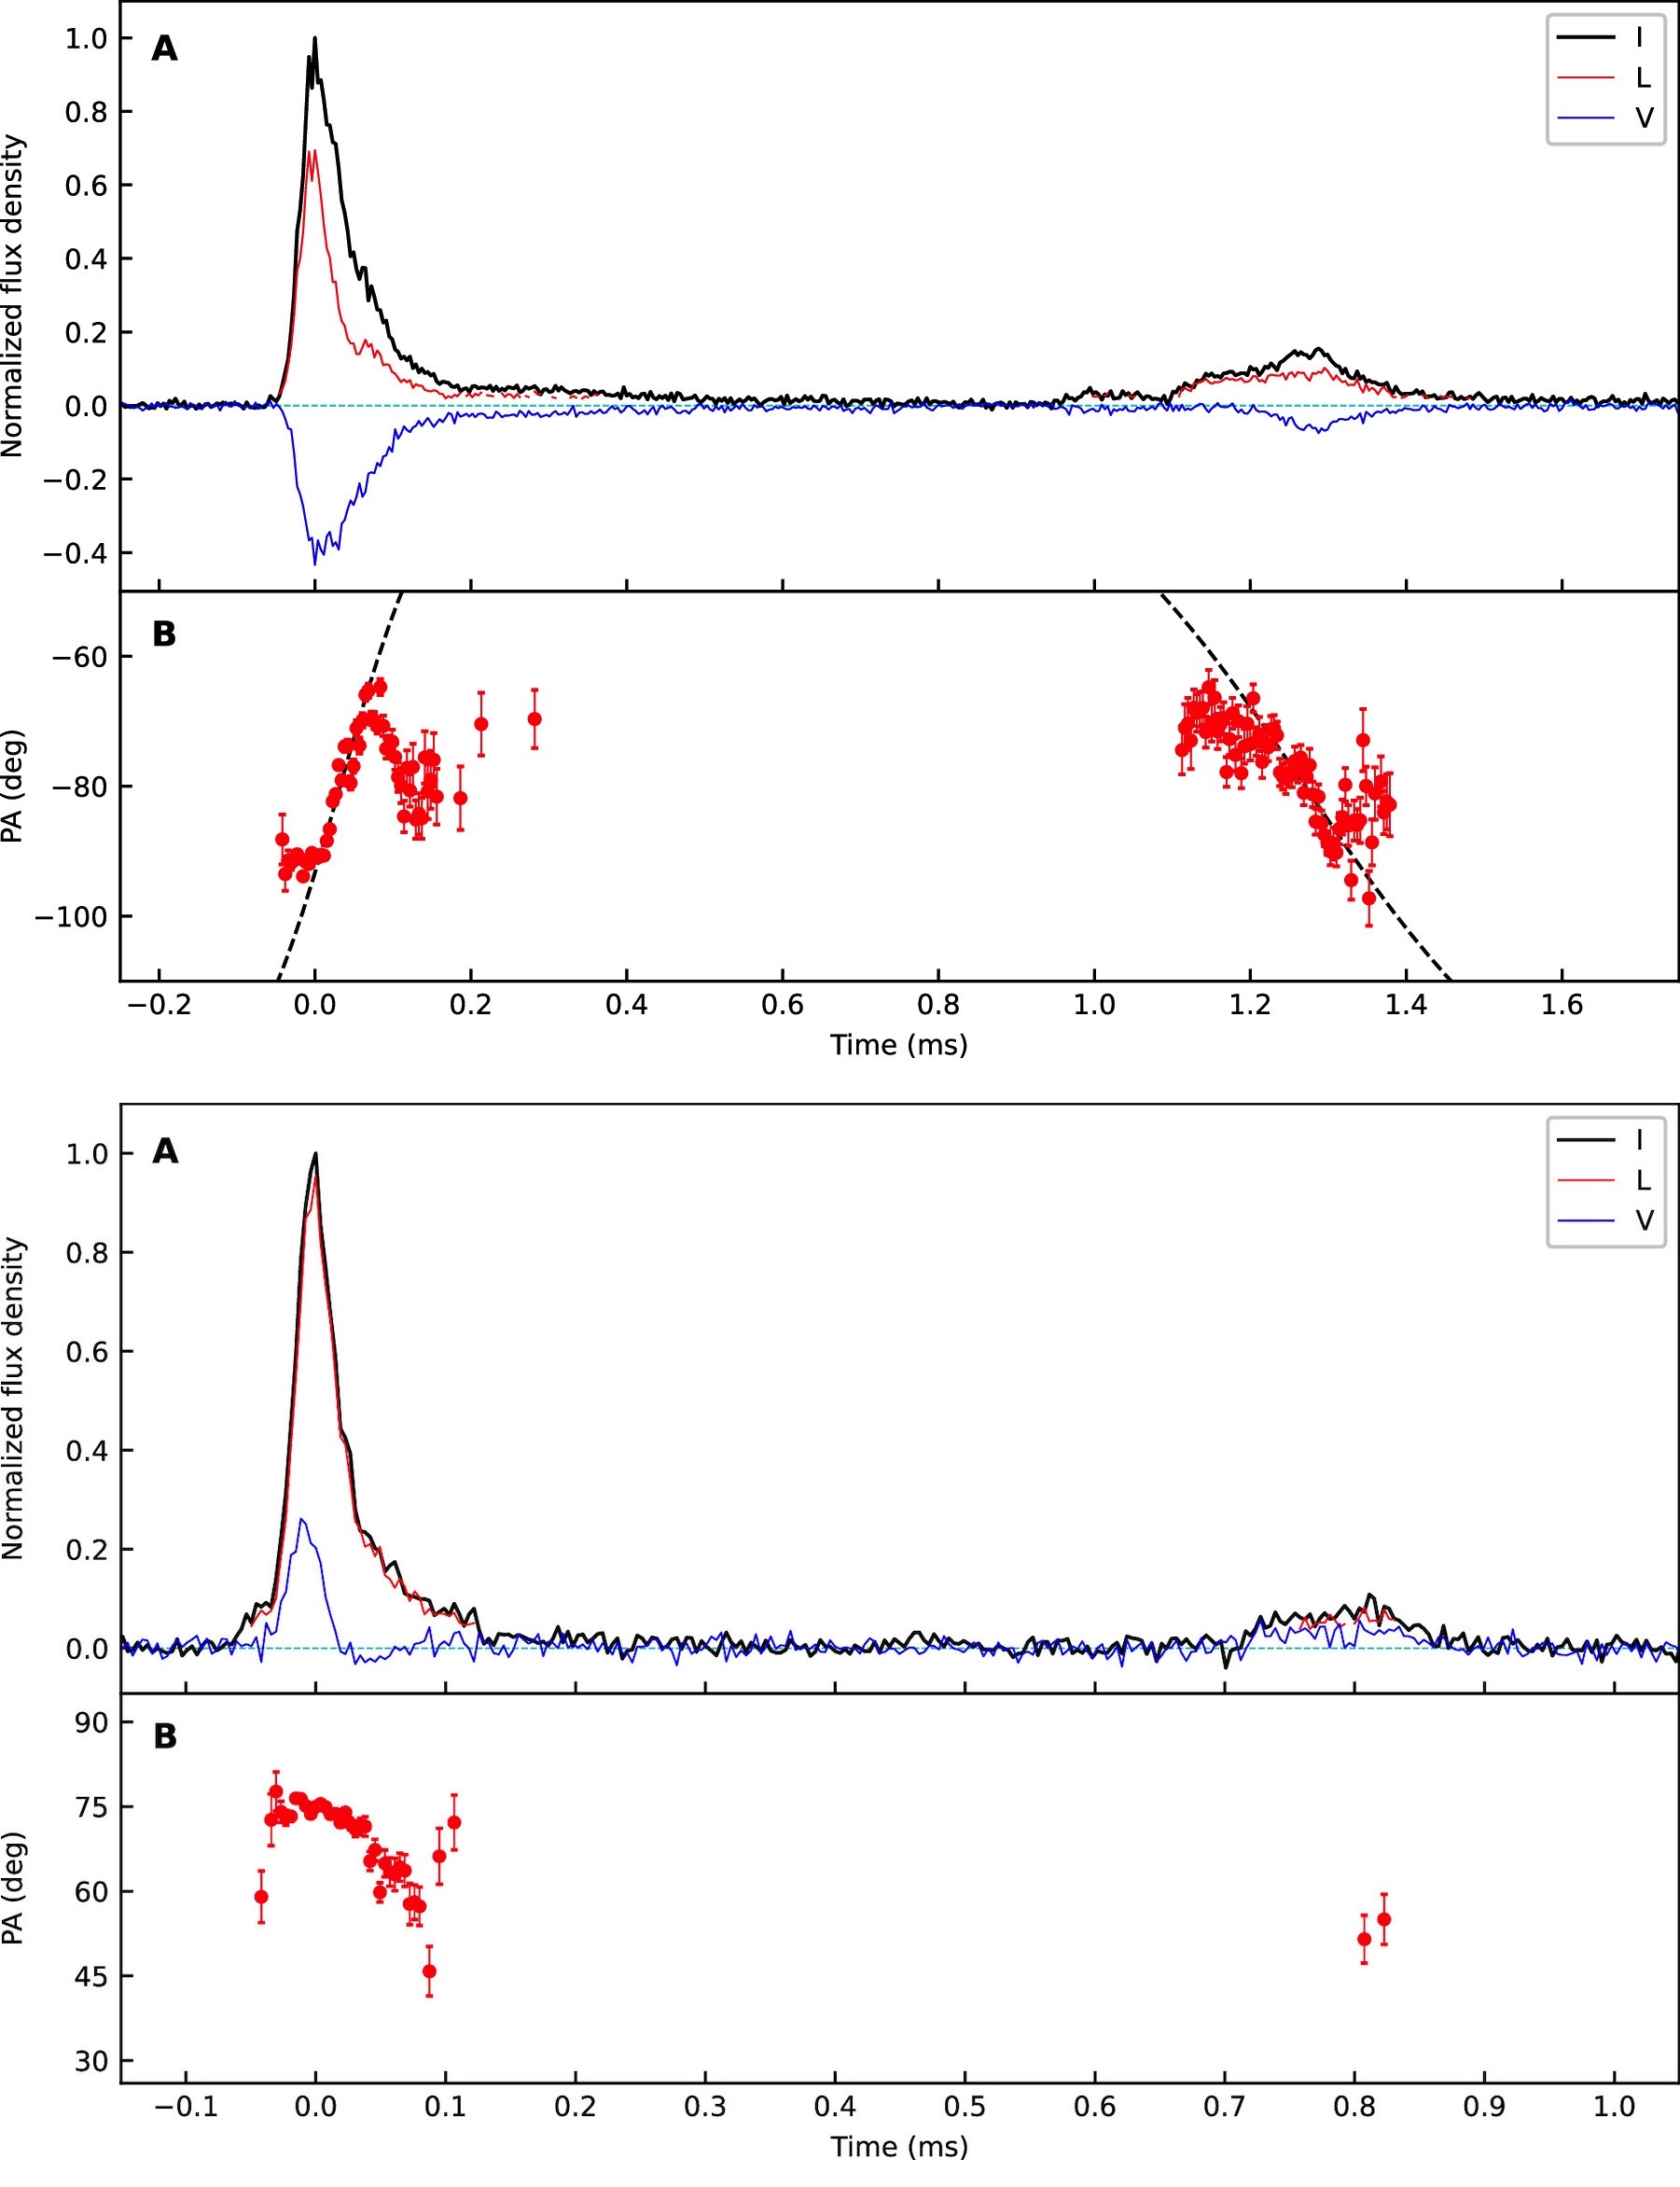
Normalized flux density and polarization position angle (PA) for the 2021 (top) and 2018 (bottom) bursts. The “A” panels show the total intensity (I), the intensity of linearly polarized light (L), and the intensity of circularly polarized light (V). Click to enlarge. [Adapted from Bera et al. 2024]
Bera and coauthors note that the properties of the twin burst pair match what they’d expect for a magnetized neutron star rotating with a period of 1.1 milliseconds. This is faster than the most rapidly rotating neutron star known, and it’s just below the hypothetical limit on neutron star rotation. This may point to the existence of a sub-class of fast radio bursts arising from neutron stars spinning near the maximum rate.
The majority of fast radio bursts appear just once, but a few dozen are known to repeat. If the 2018 and 2021 bursts studied here fall into the latter category, it could help solve the mystery of their origin: the slow but steady spin-down of a rapidly rotating neutron star would leave a detectable mark on the radio signal.
Citation
“The Curious Case of Twin Fast Radio Bursts: Evidence for Neutron Star Origin?” Apurba Bera et al 2024 ApJL 969 L29. doi:10.3847/2041-8213/ad5966
The post The Curious Case of Twin Fast Radio Bursts appeared first on AAS Nova.
]]>
Astrobites reports on new evidence that suggests the density of dark matter spikes near a supermassive black hole.
The post Spiky Dark Matter Around Supermassive Black Holes appeared first on AAS Nova.
]]>Editor’s Note: Astrobites is a graduate-student-run organization that digests astrophysical literature for undergraduate students. As part of the partnership between the AAS and astrobites, we occasionally repost astrobites content here at AAS Nova. We hope you enjoy this post from astrobites; the original can be viewed at astrobites.org.
Title: The First Robust Evidence Showing a Dark Matter Density Spike Around the Supermassive Black Hole in OJ 287
Authors: Man Ho Chan and Chak Man Lee
First Author’s Institution: The Education University of Hong Kong
Status: Published in ApJL
The nature of dark matter is still a big mystery to astronomers and physicists. Most of the evidence for dark matter comes from studying its gravitational effects on visible matter. We now know that dark matter makes up about 85 percent of the total matter in the universe and that it forms dark matter halos in which galaxies are embedded.
It is predicted that the supermassive black hole residing in the center of a galaxy can affect the shape of the dark matter density near the center of the galaxy. The dark matter gets redistributed to form a “spike” in the density distribution, causing the rate of dark matter annihilation to rise and resulting in strong emission of gamma rays. However, we have not detected any strong gamma-ray emission near a supermassive black hole, including the one in our galaxy — Sagittarius A* (Sgr A*).
In today’s article, the authors propose an alternative method to confirm the existence of a dark matter density spike at the center of a galaxy. They use data from a supermassive black hole binary called OJ 287. A binary consists of two black holes in orbit around each other. The binary will lose energy through gravitational waves, causing the orbit to decay and the orbital period to decrease. The authors use orbital data of OJ 287 to show the effects of a dark matter spike on the orbital period of the binary, providing strong evidence for the existence of a dark matter density spike around a supermassive black hole.
How Is the Supermassive Black Hole Binary Losing Its Energy?
Assuming the energy loss in the binary OJ 287 is dominated by gravitational waves, the measured orbital period decay rate suggests the two supermassive black holes will merge in about 12,000 years. The calculated total energy loss rate, however, turns out to be lower than the energy loss rate calculated due to gravitational wave emission. This suggests that there is some other mechanism causing the binary to lose energy.
The authors propose that the dark matter density spike can cause a drag force on the primary supermassive black hole. This drag force, called dynamical friction, can account for the additional energy loss rate. To test this, the authors compute the energy loss rate due to dynamical friction for a dark matter density distribution with a “spike-index” parameter to account for the density spike.
How “Spiky” Is the Dark Matter?
After accounting for the energy loss due to dynamical friction, the authors constrain the spike-index parameter by matching the calculated total energy loss rate to the observed value. This yields a narrow range of spike-index values that agree with the predicted value from a theoretical supermassive black hole growth model (see Figure 1).

Figure 1: The energy loss rate (dE/dt) of the binary with only gravitational radiation accounted for (green; GW only). The red curve shows the total energy loss rate with both gravitational waves and dynamical friction (GW + DF). The shaded region is the constrained total rate from observations. The blue dotted line indicates the spike index as predicted by an adiabatic supermassive black hole growth model. The dynamical friction from a dark matter density spike can account for the large orbital decay period observed. [Chan & Lee 2024]
Future low-frequency gravitational wave observations like those from the Laser Interferometer Space Antenna (LISA) can further examine supermassive black holes similar to OJ 287 to verify this result and help us understand the interactions between dark matter and supermassive black holes better. Also, studying the dynamical orbits of stars around a supermassive black hole like Sgr A* in our own galaxy can be another way of verifying the existence of a dark matter density spike. Future accurate observations of stellar orbits around Sgr A* should help us constrain the dark matter density spike model and shed more light on the properties of dark matter.
Original astrobite edited by Megan Masterson.
About the author, Pranav Satheesh:
I am a second-year graduate student in physics at the University of Florida. My research focuses on studying supermassive binary and triple black hole dynamics using cosmological simulations. In my free time, I love drawing, watching movies, cooking, and playing board games with my friends.
The post Spiky Dark Matter Around Supermassive Black Holes appeared first on AAS Nova.
]]>
New high-resolution images show that when it comes to supernova remnants, scientific value and beauty go hand in hand.
The post Featured Image: One of a Dozen appeared first on AAS Nova.
]]>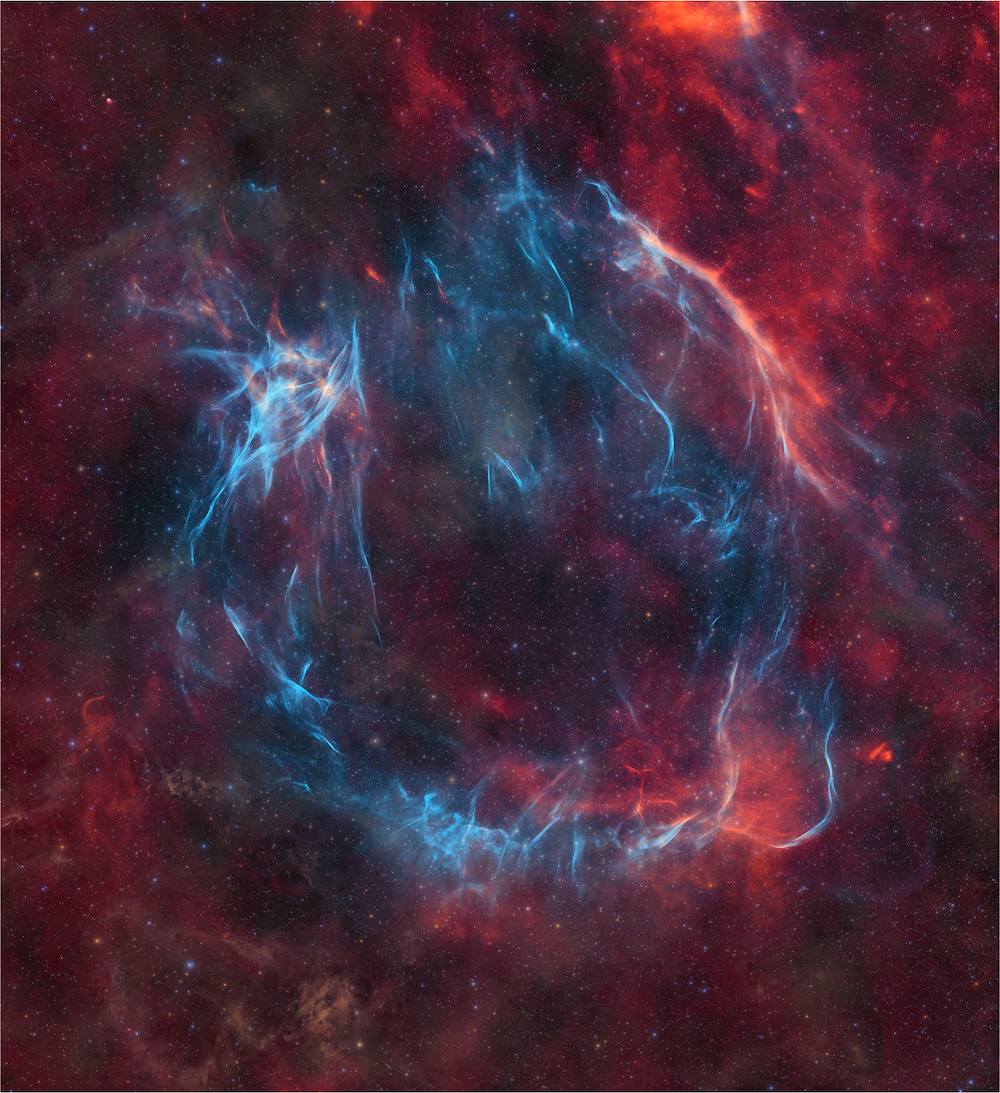
Full view of the newly discovered Nereides supernova remnant G107.7-5.1. [Fesen et al. 2024]
Citation
“Deep Optical Emission-Line Images of Nine Known and Three New Galactic Supernova Remnants,” Robert A. Fesen et al 2024 ApJS 272 36. doi:10.3847/1538-4365/ad410a
The post Featured Image: One of a Dozen appeared first on AAS Nova.
]]>
Most cool stars spin nicely aligned with their planets. So why do their hot counterparts tumble in nearly random directions?
The post Hot Stars Spin Sideways appeared first on AAS Nova.
]]>It seems natural that stars would spin in the same direction as, and nicely aligned with, their planets. Recent work, however, shows that might not be the case if the star in question is particularly hot.
Toppled-Over Stars
When we picture planets moving around their host stars, we usually imagine them as perfect spheres traveling along perfect circles aligned within a perfect plane. Reality, unsurprisingly, is messier than this ideal image. Some objects, like Mars, maneuver on orbits that look more like ovals than circles, while others, most famously Pluto, drift above and below everyone else on orbits that are tipped over relative to the bulk of the solar system. The closer you look, the more jumbled everything appears: while that’s maybe disappointing from an aesthetic point of view, astronomers thrive in this chaos and latch onto every irregularity they can in order to explain how a given system came to be.
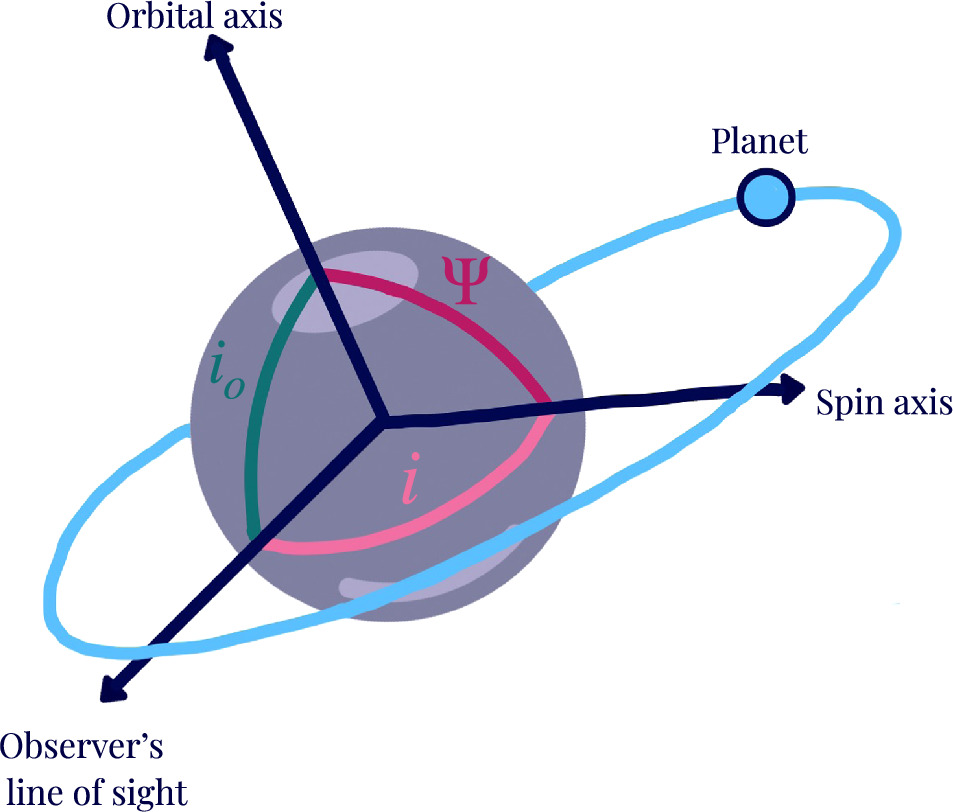
An illustration of the many angles used to describe a star’s orientation. The star’s true obliquity is marked by Ψ. [Louden et al. 2024]
This was an intriguing but difficult to confirm finding, since the traditional ways of measuring obliquity required a tricky procedure and lots of telescope time. Researchers came up with an alternative, faster way to approximate the measurement, but progress was still slow and it was difficult to assemble an unbiased sample of stars. Since it was easier to measure the obliquities of cool stars with large planets, astronomers simply hadn’t attempted to analyze many hot stars with small companions.
New Observations
That’s where Emma Louden (Yale University) and collaborators came in. Over the course of several months, Louden and the team periodically commandeered the High Resolution Echelle Spectrometer (HIRES) instrument on the Keck I telescope to collect spectra of nearly 500 stars. for the analysis. Since the team was aiming to fill in gaps of previous catalogs, they went after numerous hot stars and stars with planets smaller than Jupiter. After vetting their candidates and cleaning up their data, they were left with a sample that had 500% more hot stars than any previous attempt, and 50% more cool stars for good measure too.
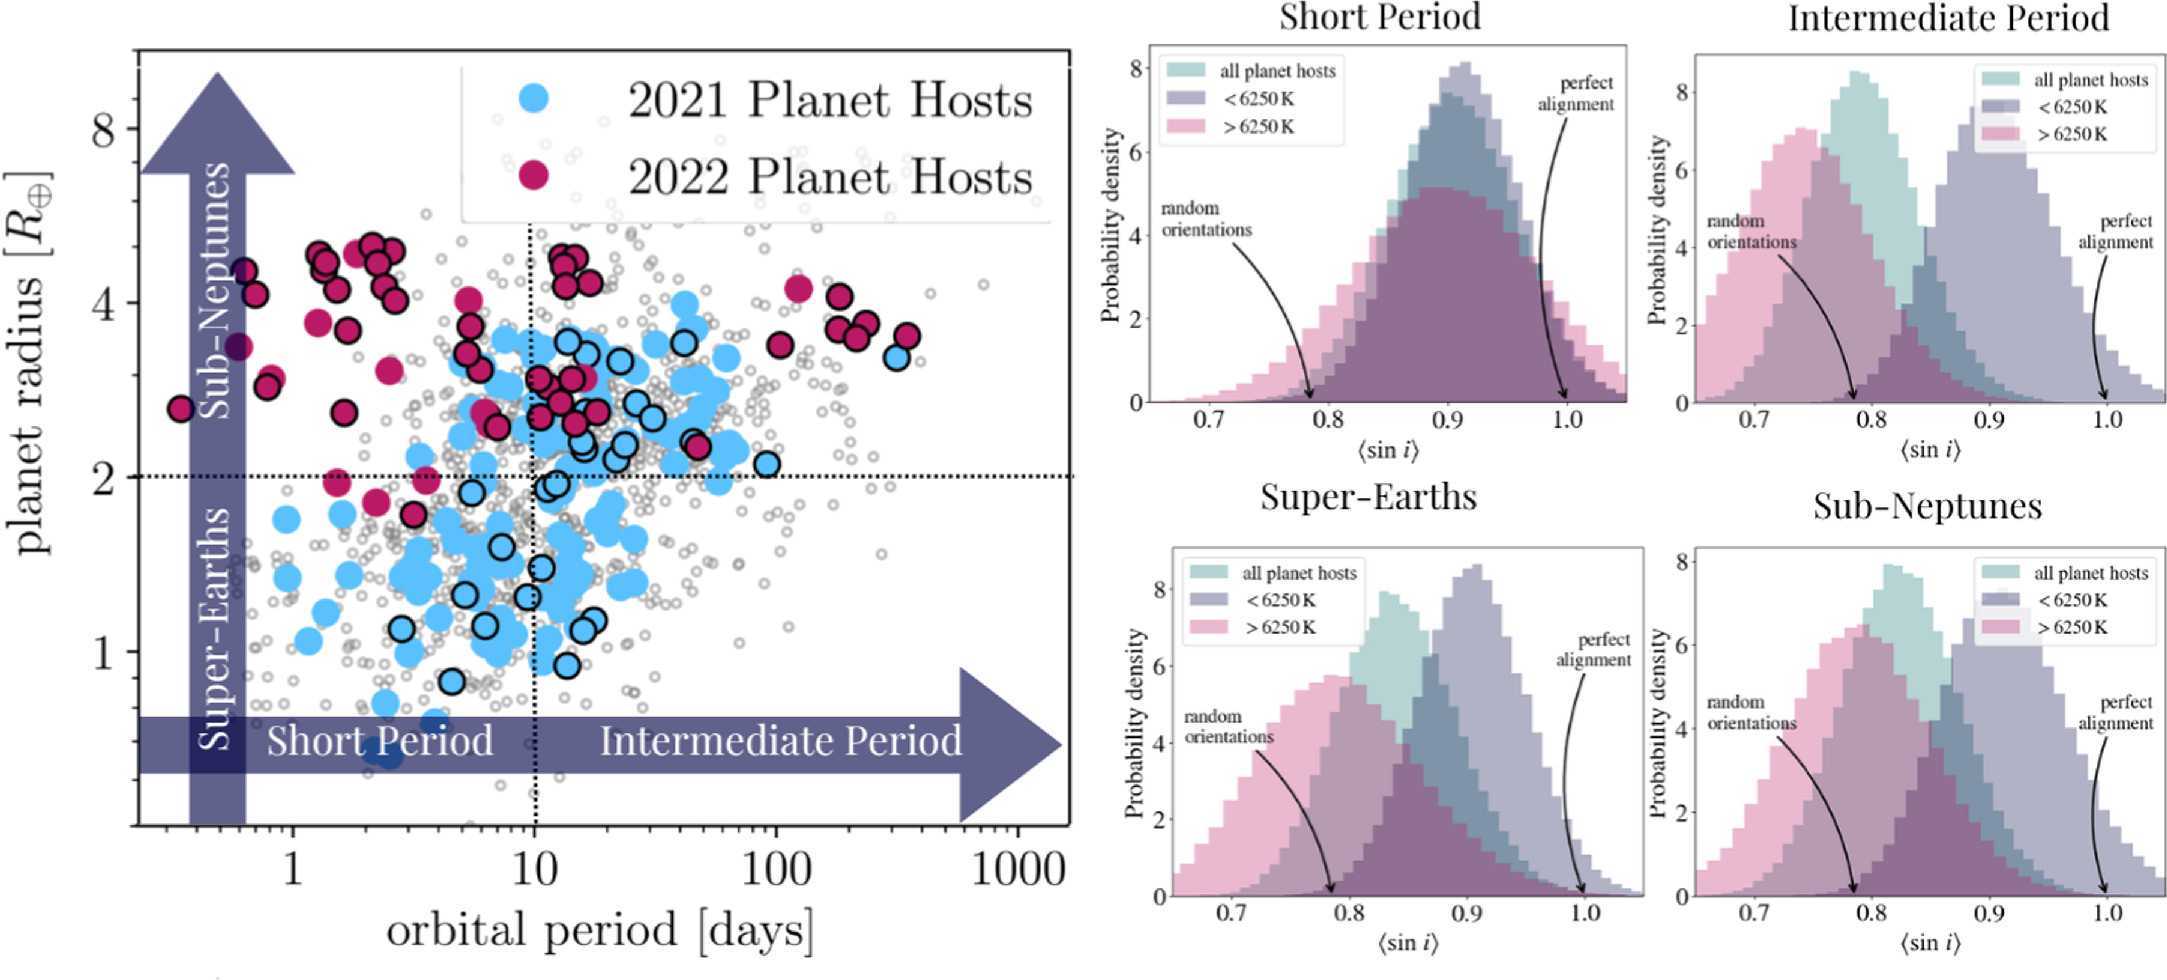
A summary plot of the findings. Histograms on the right show the projected inclinations of different subsets of the sample, while the scatterplot on the left shows the full sample. Circles outlined in black denote planets around hot stars. Click to enlarge. [Louden et al. 2024]
Still, knowing that hot stars seem to misbehave in almost all circumstances does put some pressure on our theories of planetary formation and evolution. While there is still no clear-cut winner, and as the authors note, likely more than one mechanism is at play, we’re beginning to understand what’s more and what’s less likely to have happened to these tipsy, boiling stars and their planets.
Citation
“A Larger Sample Confirms Small Planets around Hot Stars Are Misaligned,” Emma M. Louden et al 2024 ApJL 968 L2. doi:10.3847/2041-8213/ad4b1b
The post Hot Stars Spin Sideways appeared first on AAS Nova.
]]>
The supernova SN 2019ein may have originated near a globular cluster — an unusual environment that hints to the nature of the supernova progenitor system.
The post A Type Ia Supernova in an Unusual Place appeared first on AAS Nova.
]]>Observations of Type Ia supernovae underpin our measurements of distances to other galaxies and even our understanding of the expansion of our universe. There’s just one problem: researchers still don’t know exactly how Type Ia supernovae happen. New research explores what a Type Ia supernova in an unusual environment could tell us about the source of these explosions.
Studying Supernovae
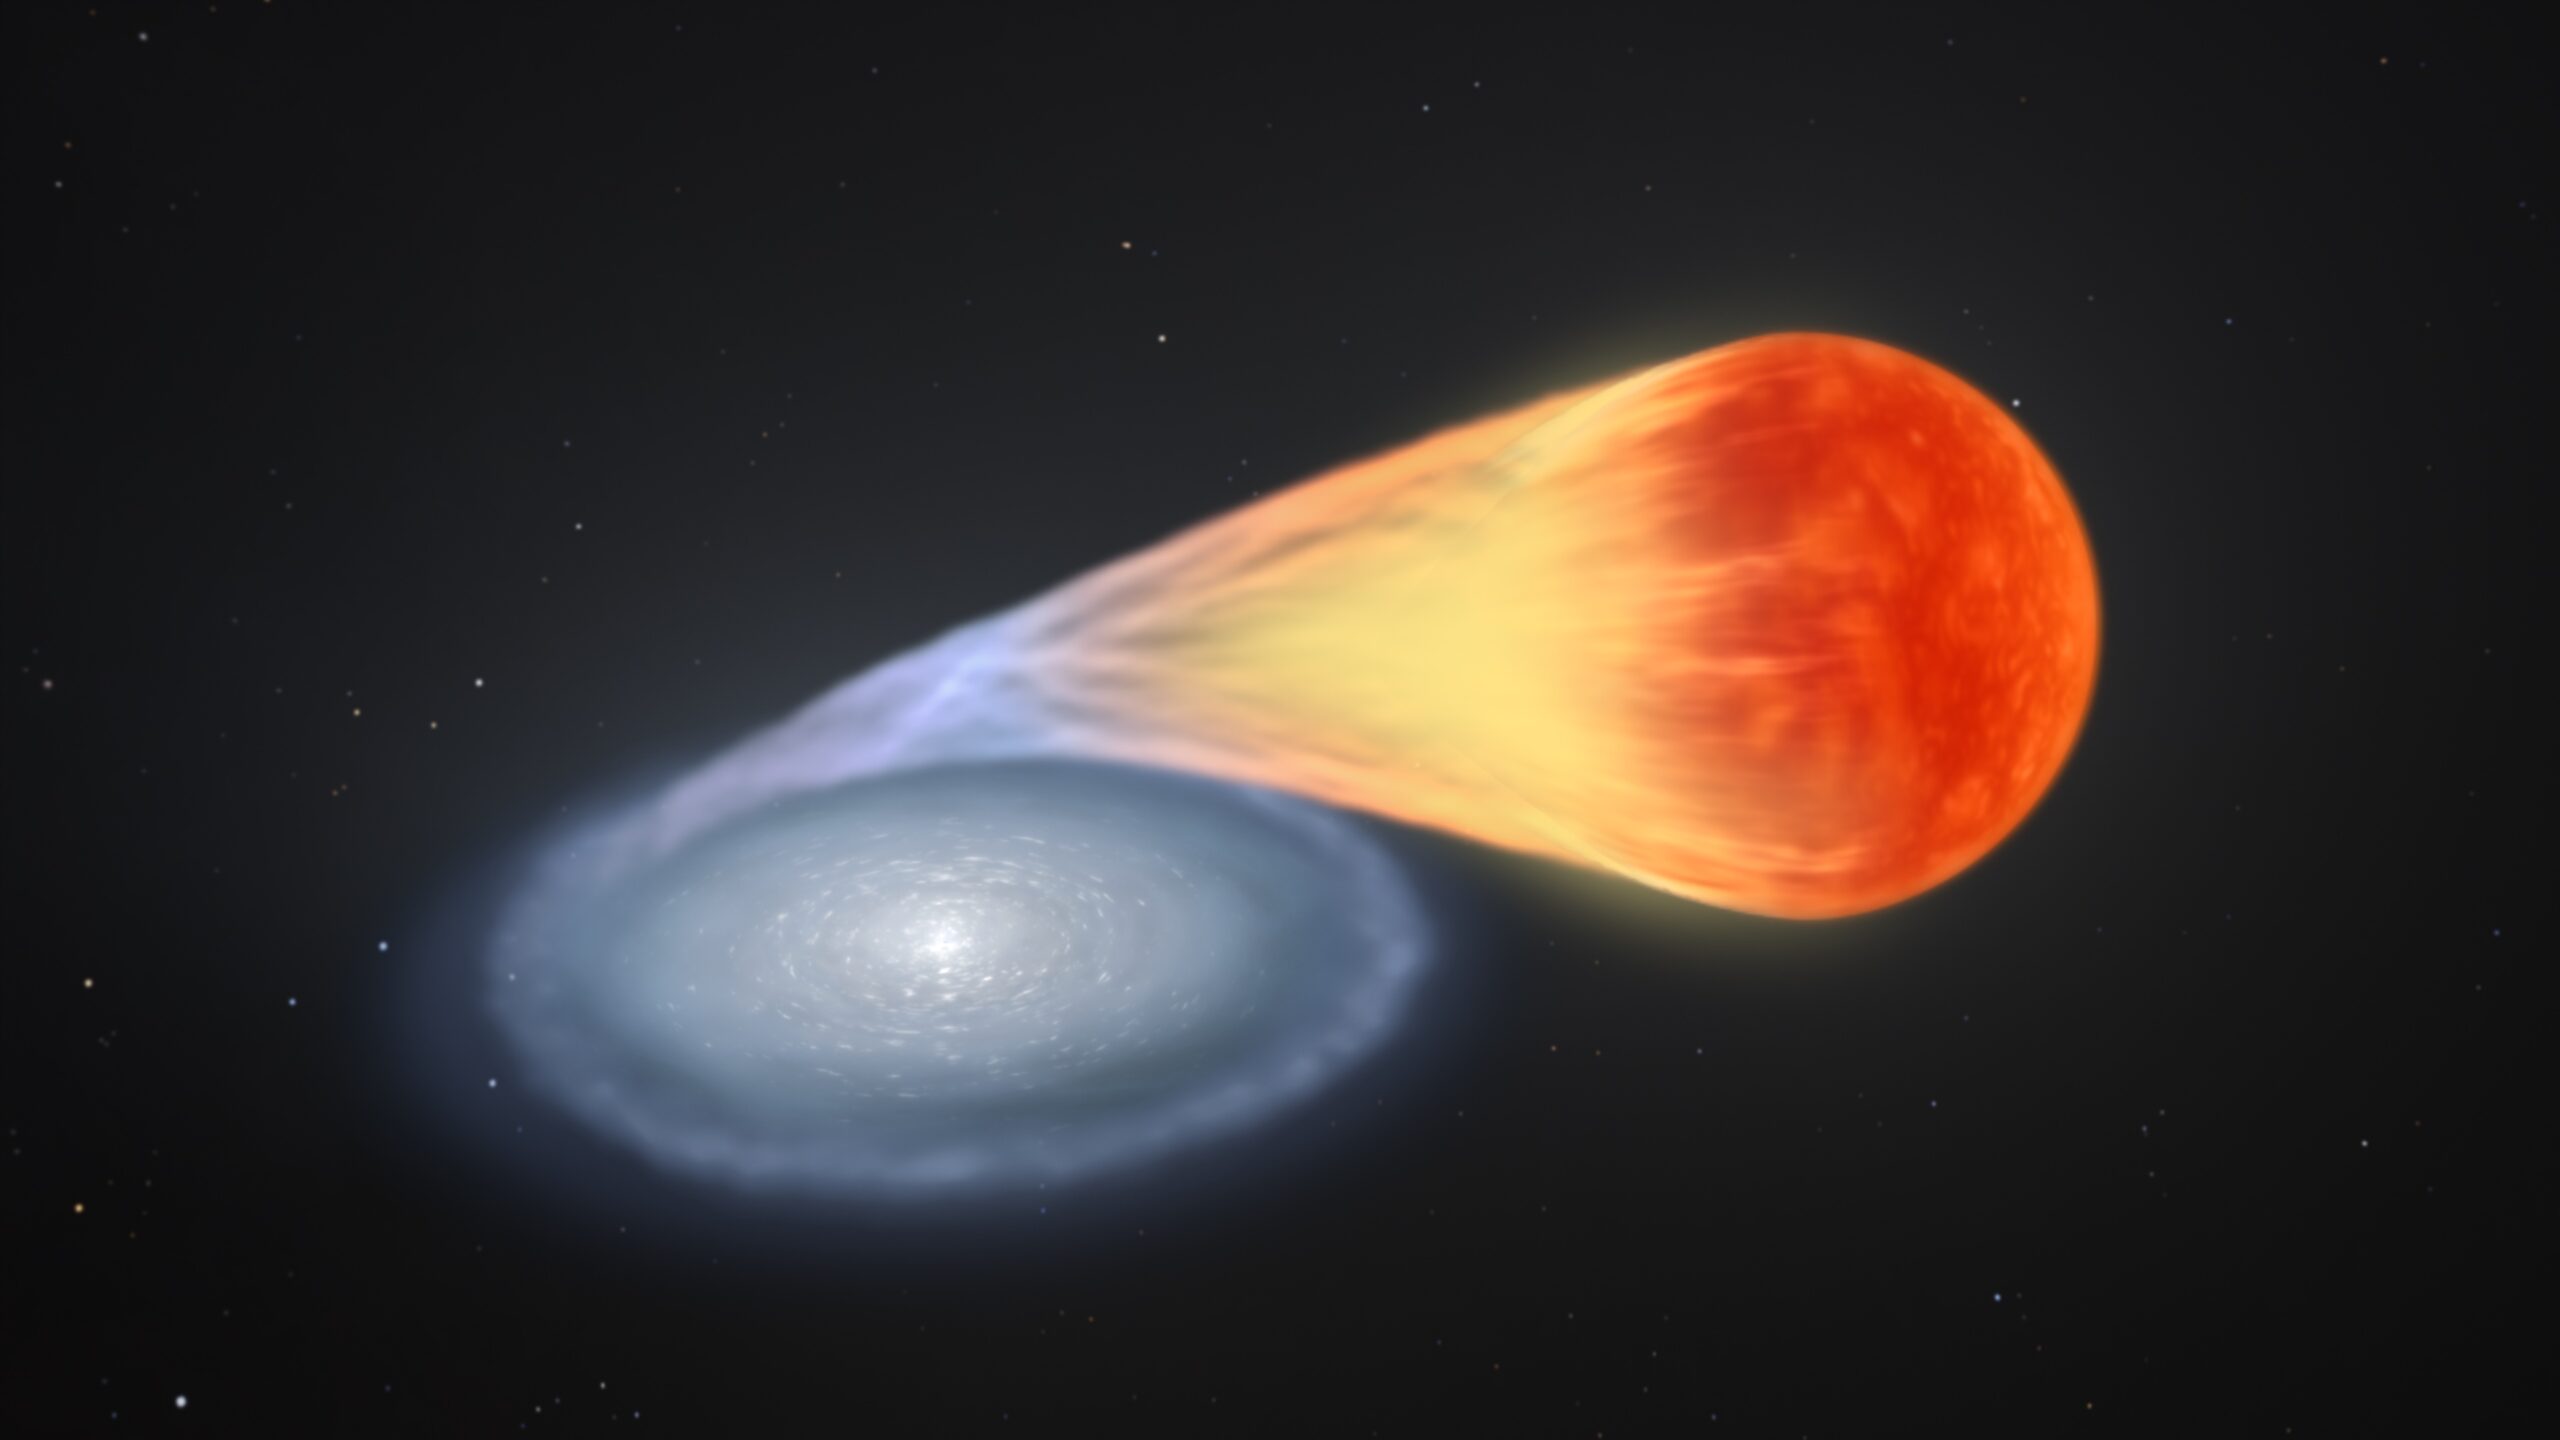
Accretion from a companion star onto a white dwarf is one way to trigger a supernova. [Still image from an animation by NASA’s Goddard Space Flight Center Conceptual Image Lab]
But research increasingly points to more than one way for white dwarfs to reach this limiting mass — two white dwarfs in a binary system could collide, or a white dwarf could bulk up by accreting matter from a stellar companion. The exploding white dwarf may not even need to reach 1.4 solar masses: if a thin shell of helium siphoned from a companion star ignites on the surface of a white dwarf, it could trigger a second, catastrophic detonation in the white dwarf’s core, regardless of the white dwarf’s mass. Pinpointing these different scenarios is critical to interpreting Type Ia supernova observations.
How can we examine the progenitor of a Type Ia supernova explosion? Researchers can’t just sift through archival observations after a Type Ia supernova to see what caused it, since white dwarfs in other galaxies are too faint to see — and we haven’t spotted a Type Ia supernova in our own galaxy since 1604. We need a different approach to uncover the origins of these explosions.
Cluster Candidate
In a recent article, Joel Bregman (University of Michigan) and collaborators proposed a path forward: find a Type Ia supernova in a globular cluster. Globular clusters are roughly spherical collections of tens of thousands to millions of stars that orbit within a galaxy’s halo. Because all stars in a globular cluster have roughly the same age and composition, the age and composition of the stars involved in the explosion could also be known — even if we can’t observe the stars directly.
The location of the supernova SN 2019ein relative to the globular cluster candidate. Click to enlarge. [Bregman et al. 2024]
Detonation Scenarios
Hubble observations show that the supernova happened about 192 light-years from the globular cluster candidate. Statistical tests suggested that the supernova is likely associated with the cluster — the authors put the odds of a chance alignment at 3% — allowing researchers to use the age and composition of the cluster to constrain the properties of the supernova progenitor system.
There’s another interesting wrinkle that could further constrain the identity of the progenitor: given the large separation between the supernova and the candidate cluster, the star going supernova may not have been bound to the cluster when the explosion happened. In this scenario, dynamical interactions between binary systems could have kicked the supernova progenitor system out of the cluster, which is more likely if both stars in the binary were white dwarfs. Then, after careening through space for 3–10 million years, 1) the white dwarfs collided or 2) one white dwarf stole a thin layer of helium from the other, leading to a two-stage detonation on its surface and in its core.
The proposed scenario is rare but not impossible, but there’s not yet enough data to draw firm conclusions. This study highlights the challenge of studying the origins of Type Ia supernovae and shows what can be gained by seeking supernovae in unusual places.
Citation
“A Type Ia Supernova near a Globular Cluster in the Early-Type Galaxy NGC 5353,” Joel N. Bregman et al 2024 ApJL 968 L6. doi:10.3847/2041-8213/ad498f
The post A Type Ia Supernova in an Unusual Place appeared first on AAS Nova.
]]>
Astrobites reports on "little red dots" in the early universe and how to use X-rays to determine if these galaxies host massive black holes.
The post Unsure If It’s a Really Massive Black Hole? Take an X-ray Scan! appeared first on AAS Nova.
]]>Editor’s Note: Astrobites is a graduate-student-run organization that digests astrophysical literature for undergraduate students. As part of the partnership between the AAS and astrobites, we occasionally repost astrobites content here at AAS Nova. We hope you enjoy this post from astrobites; the original can be viewed at astrobites.org.
Title: X-ray View of Little Red Dots: Do They Host Supermassive Black Holes?
Authors: Tonima Tasnim Ananna (তনিমা তাসনিমঅনন্যা) et al.
First Author’s Institution: Wayne State University
Status: Published in ApJL
Among the fascinating objects observed by JWST are galaxies in the early universe known as little red dots (read more about them here and here!). These galaxies are believed to be rich in dust, which contributes to their distinct red hue. The infrared spectra of little red dots from JWST reveal the presence of strong emission lines. This emission can be a potential indicator of either 1) an active black hole or 2) vigorous star formation. That leaves us with a tantalizing question: which one is it!?
If the little red dots indeed host black holes, research suggests that the masses of these black holes must be between 10 million and 1 billion times the mass of the Sun. This poses a significant challenge — how can these black holes accumulate such large masses in such a short time from their births? This question has left astronomers puzzled, highlighting the need to understand if these little red dots do, in fact, hold such massive black holes.
In astronomy, akin to life, sometimes it helps to take a step back and observe something from a different perspective. Looking at the little red dots at a different wavelength of light can help understand what exactly is happening in these galaxies. Today’s authors set out to harness the power of multiwavelength astronomy and to look at these little red dots at X-ray wavelengths to see if they emit any X-ray signals. Even though both accreting black holes and star formation activity can lead to emission in the X-ray, the difference between the strength of the X-ray emission between the two is greater in the X-ray than in the infrared. So, obtaining the strength of X-ray emission from the little red dots should give us a good idea of whether the X-rays are caused by a black hole or by stellar processes.
The authors select a bunch of little red dots that are hidden behind a big galaxy. Since X-rays can be challenging to detect, a massive galaxy in front can act as a gravitational lens and magnify any X-ray signals from the little red dots. If little red dots indeed host really massive black holes, it is not unreasonable to expect X-ray signals from them.
Lo and Behold! There Are None!

Figure 1: All 21 little red dots that were stacked to see if they emitted any X-ray signals. There does not appear to be a spike in the X-ray counts anywhere, indicating that there is no strong X-ray emission from the little red dots. [Adapted from Ananna et al. 2024]
Although the authors do not detect any X-rays from the little red dots, they can still use the fact that they did not detect any X-rays to obtain conservative limits on the maximum mass of the black hole, if any, that might be present in the little red dots. The authors assume accretion at the Eddington limit, a theoretical maximum rate at which a black hole can grow by accretion of mass, and obtain black hole masses less than 1.5 x 10⁶ M☉ (Figure 2). This is a couple of orders of magnitude lower than the black hole masses in little red dots determined by other works.

Figure 2: The derived upper limits to the black hole masses of the little red dots, plotted against their stellar masses. The bottom-most thick dashed green line gives the average value (assuming Eddington limit) of the black hole mass. The black hole masses are not extremely over-massive unless the accretion is a fraction of the Eddington limit. [Ananna et al. 2024]
The Mystery of Little Red Dots Continues!
This work suggests that little red dots will not likely host extremely massive black holes. More data coming from JWST, including a detailed study of the spectra of these little red dots, can help us understand them better. This work primarily uses data from the Chandra X-ray Observatory, which has now unfortunately been defunded despite continuing to produce very significant scientific results. (Read here to learn how you can save Chandra!) The mysteries of the universe will ultimately be solved only by looking at it from every possible wavelength, and we need such multiwavelength telescopes to achieve this lofty goal!
Original astrobite edited by Janette Suherli.
About the author, Archana Aravindan:
I am a PhD candidate at the University of California, Riverside, where I study black hole activity in small galaxies. When I am not looking through some incredible telescopes, you can usually find me reading, thinking about policy, or learning a cool language!
The post Unsure If It’s a Really Massive Black Hole? Take an X-ray Scan! appeared first on AAS Nova.
]]>
Meet RX J2129–z8He II: a remarkable high-redshift galaxy that might be home to some of the first generation of stars.
The post Signs of the First Stars in a Distant Galaxy appeared first on AAS Nova.
]]>The galaxy RX J2129–z8He II is remarkable for its high redshift, sloped spectrum, and strong emission lines. New research suggests that the elusive first stars could be responsible for the galaxy’s properties.
The Hunt for the First Stars
Long ago, the universe was substantially less picturesque than it is today; neutral hydrogen gas absorbed all visible light and rendered the universe opaque. When the first stars glimmered into existence and assembled into the first galaxies, they began to chip away at the opaque universe, carving out increasingly large bubbles of transparent gas.
The nature of the first stars, also called Population III stars, is of great interest to astronomers, but tracking them down is easier said than done. While galaxies composed only of the first generation of stars may be out of reach, shielded from view by clouds of neutral gas, galaxies in which Population III stars mingle with later stellar generations might be easier to spot.
Thirteen Billion Years Ago in a Galaxy Far, Far Away
JWST image of the galaxy RX J2129–z8He II, which is gravitationally lensed by the foreground galaxy cluster RX J2129. [Wang et al. 2024]
RX J2129–z8He II’s spectrum is tilted sharply toward short wavelengths, more so than any other known galaxy beyond a redshift of z = 7, and it’s marked by several prominent emission lines, including one from singly ionized helium atoms. These factors suggest that the galaxy contains a powerful source of ultraviolet radiation. In the local universe, emission from singly ionized helium is somewhat rare, arising from massive stars that have lost their atmospheres, binary systems containing a star and either a black hole or a neutron star, and galaxies with accreting supermassive black holes. None of these sources are likely to be the cause of the galaxy’s helium emission line. Instead, Wang’s team posits, massive Population III stars could be the source of the ionizing ultraviolet photons.
JWST spectrum of RX J2129–z8He II, with an inset image showing the He II line. The flux increases toward shorter wavelengths before being attenuated by the intergalactic medium (IGM). Click to enlarge. [Wang et al. 2024]
Are Population III Stars Responsible?
To test this theory, Wang’s team used photoionization models to simulate the properties of a galaxy containing Population III stars as well as stars from later generations. They found that a collection of Population III stars with a total mass of 780,000 solar masses could reproduce the observed emission lines in the galaxy’s spectrum. Previous modeling suggests that this quantity of Population III stars is reasonable for a galaxy at that time period.
As for how a galaxy could host Population III stars alongside their stellar descendants, Wang’s team suggests that new Population III stars could form belatedly in pockets of pristine gas that weren’t swept up into stars in the first round of star formation, or in gas that spilled into the galaxy from the surrounding circumgalactic medium.
This study marks a promising advance in the search for the first generation of stars. In addition to identifying RX J2129–z8He II as a possible home for Population III stars, Wang’s team gained a better sense for the spectral signatures of these stars, which can be used to identify other galaxies that may host them.
Citation
“A Strong He II λ1640 Emitter with an Extremely Blue UV Spectral Slope at z = 8.16: Presence of Population III Stars?” Xin Wang et al 2024 ApJL 967 L42. doi:10.3847/2041-8213/ad4ced
The post Signs of the First Stars in a Distant Galaxy appeared first on AAS Nova.
]]>
Billions of years ago, small galaxies may have had cores packed with dark matter. What would these galaxies look like today?
The post It’s Just a Phase: Dark Matter–Dominated Galaxies in the Early Universe appeared first on AAS Nova.
]]>Small galaxies in the early universe might have had centers dominated by dark matter. New research dives into cosmological simulations to explore what these galaxies would look like in the universe today and what this might mean for the Milky Way’s dark matter past.
Dark Matter History of Small Galaxies
Recently, a research team led by Anna de Graaff (Max Planck Institute for Astronomy) used JWST to examine six small, low-mass galaxies in the early universe. They discovered something surprising: the centers of these galaxies appeared to be dominated by dark matter, a hypothetical form of matter that neither emits nor absorbs light, among other strange qualities. Though dark matter is thought to make up roughly 85% of the matter in our universe, research shows that the cores of massive galaxies in the universe today contain mostly normal matter.
To check whether the intriguing new JWST observations match our theoretical understanding of the universe’s evolution, and to explore how these dark matter–dominated galaxies might evolve to the present day, de Graaff and collaborators turned to TNG50: a massive cosmological simulation that tracks the universe from its infancy to today.
Enter the Simulation

Comparison of the fraction of normal matter (fbaryon) in the cores of galaxies in the TNG50 simulation (small circles) to the galaxies observed with JWST (large hexagons). Click to enlarge. [de Graaff et al. 2024]
This result agrees well with what de Graaff’s team observed in real galaxies with JWST, though the team pointed out that it’s possible that the galaxies they studied with JWST only appear to have dark matter–dominated cores. For example, if the gas in these galaxies’ centers is disrupted by outflows from newly forming stars, it could skew the estimate of the amount of dark matter present. Because the simulated galaxies do have dark matter–dominated cores, this finding suggests that this may be a real phase in galaxy evolution.
Redshift evolution of the core dark matter fraction. The colored line and shaded areas show the results from the TNG50 simulation, while the colored symbols show the results from observational studies. Click to enlarge. [de Graaff et al. 2024]
Following Evolving Galaxies
What would these early dark matter–dominated galaxies look like later in the universe’s history? Going forward in time in the simulation, the galaxies merged and grew, dwindling from 381 galaxies to just 213 due to mergers. At a redshift of z = 3 — during a period called cosmic noon, when star formation was at its peak — the low-mass dark matter–dominated galaxies had grown to contain 10 billion solar masses of stars, similar in size to other galaxies spotted in that time period.
By the present day, these same galaxies had packed on additional stellar mass, reaching about 30 billion solar masses of stars — roughly equal to the mass of stars in the Milky Way — and their centers no longer contained mostly dark matter. While more work is needed to explore this scenario, this suggests that the Milky Way and galaxies like it in the universe today were once small, low-mass galaxies with dark matter cores.
Citation
“An Early Dark Matter–Dominated Phase in the Assembly History of Milky Way–Mass Galaxies Suggested by the TNG50 Simulation and JWST Observations,” Anna de Graaff et al 2024 ApJL 967 L40. doi:10.3847/2041-8213/ad4c65
The post It’s Just a Phase: Dark Matter–Dominated Galaxies in the Early Universe appeared first on AAS Nova.
]]>
Astrobites reports on simulations of the circumgalactic medium, a reservoir of gas that helps regulate a galaxy's ability to form stars.
The post Modeling the Structure of the Circumgalactic Bathtub appeared first on AAS Nova.
]]>Editor’s Note: Astrobites is a graduate-student-run organization that digests astrophysical literature for undergraduate students. As part of the partnership between the AAS and astrobites, we occasionally repost astrobites content here at AAS Nova. We hope you enjoy this post from astrobites; the original can be viewed at astrobites.org.
Title: CloudFlex: A Flexible Parametric Model for the Small-Scale Structure of the Circumgalactic Medium
Authors: Cameron B. Hummels et al.
First Author’s Institution: California Institute of Technology
Status: Published in ApJ
If you or I spent a long time sitting in a bathtub, we’d probably shrivel up and quickly become indistinguishable from a raisin. Galaxies, on the other hand, spend their lives bathed in a reservoir of gas known as the circumgalactic medium. In fact, the presence of the circumgalactic medium is necessary for the long-term growth and survival of the galaxy. More precisely, the circumgalactic medium provides the gas that regulates a galaxy’s ability to form stars — for example, as star formation depletes gas from the interstellar medium, inflows from the circumgalactic medium replenish that supply.
Our understanding of this diffuse gas reservoir has largely been driven by observing its effect on background light (i.e., along so-called quasar sight lines) through absorption features. These measurements have indicated the presence of gas in both hot (T ~ 106 K) and cool (T < 104K) phases. However, the presence of such a stark temperature difference between the various components of this intergalactic gas would produce fluid instabilities that could quickly drive the cold component to fragment into a collection of small “cloudlets.” Self-consistently modeling these structures in large numerical simulations is challenging because they require significant dynamic range — one must be able to resolve clouds on scales smaller than a few light-years while also modeling the large scale motions of gas on galactic (thousands of light-years) scales.
Inspired by this challenge, today’s authors set out to construct a simple model to efficiently describe the distribution and properties of these cool gas cloudlets embedded in broader cloud complexes (larger clouds composed of many cloudlets) within the circumgalactic medium. Leveraging such a model to predict observed line shapes will allow us to begin to constrain the detailed substructure of this galactic bathtub.
Constructing the Model
To construct their model, today’s authors populate these so-called cloud “complexes” with a collection of randomly sampled cloudlets and observe the resulting configuration. In detail, they statistically sample cloudlet properties based on a series of predetermined distributions. For example, the total mass of their cloud is set to be a million times the mass of our Sun. Then, based on their chosen parameters for the minimum mass of an individual cloudlet and the shape of their mass probability distribution (i.e., the function that tells you how likely it is for a cloudlet with a given mass to exist), they randomly generate cloudlets until the total mass of these objects equals the pre-set total mass. They combine this with probability distributions for the distance of the cloudlets from the center of the complex and the turbulent velocity of the cloudlets to produce a mock cloud complex structure, such as the three examples shown in Figure 1.

Figure 1: Three examples of cloudlet distributions generated using the model with the minimum cloudlet mass varied from 10-3 solar masses at left to 105 solar masses at right. Because these are 3D distributions in reality, what is shown here is the cumulative distribution along one direction, with the colors representing the density of the gas along the line of sight at any given point. [Hummels et al. 2024]
Observing the Circumgalactic Medium
In this manner the structure of the cloud complexes is determined by a choice of 11 parameters that can be flexibly varied to explore the effects of cloud structure on the resulting observations. The key observational probe that has been historically used to study the circumgalactic medium is the shape of absorption features in the spectra of distant, luminous quasars. Because the shape of these features is a direct result of the interaction of background light with the circumgalactic medium gas and the circumgalactic medium is thought to be a highly disordered, turbulent medium, observed features will in principle be sensitive to where in the medium the light passes and how dense the absorbing objects are. For example, light passing through the center of the cloud in the left panel of Figure 1 will likely interact with more cloudlets than light passing near the edge and thus the observed spectra should reflect this.

Figure 2: Top: A predicted magnesium-II absorption profile (black) generated from the cumulative effect of absorption in the 17 cloudlets intersected along the chosen sight line. The absorption profiles are shifted left and right based on the velocity of the cloudlets. Bottom: A depiction of the chosen sight line along the z axis with the observer at the left. The velocity vectors of the intersected cloudlets are shown with colored arrows. [Hummels et al. 2024]
Turning the Knobs
To understand the utility of such a framework, the authors then demonstrate how observed profiles respond to variations in the chosen parameters, such as minimum cloudlet mass. To this end, they generate 10,000 random sight lines through a given cloud complex (i.e., they do the procedure shown in Figure 2 10,000 times) and analyze the properties of the absorption in aggregate (such as by counting the number of intersected absorbers). One key metric to quantify these effects is the observed equivalent width, which basically measures the strength/depth of an absorption feature — a sight line that passes through a high density of absorbers will have a larger equivalent width than one that intersects only a few. For example, from Figure 3, they show that decreasing the minimum cloudlet mass, which should increase the total number of cloudlets (as we saw in the leftmost panel of Figure 1), increases the number of intersected cloudlets, as you might expect. Because these cloudlets are much more common, there are more sight lines that will pass through a lower density column of gas, yielding a broader distribution of column densities. Despite these effects, the overall distribution of observed equivalent widths is roughly independent of minimum cloudlet mass, but the fraction of sight lines that yield a given equivalent width is significantly different between the different minimum masses.

Figure 3: Left three panels: The distribution of the number of intersected cloudlets, column density along the line of sight, and equivalent width for different choices of the minimum cloudlet mass (different colors). Rightmost panel: The fraction of sight lines yielding equivalent widths greater than the value on the horizontal axis. [Adapted from Hummels et al. 2024]
Comparing the observed and predicted distributions and the sensitivity of these distributions to underlying parameters will shed light on the detailed structure of this complex medium.
Original astrobite edited by Jessie Thwaites
About the author, Sahil Hegde:
I am an astrophysics PhD student at UCLA working on using semi-analytic models to study the formation of the first stars and galaxies in the universe. I completed my undergraduate at Columbia University, and am originally from the San Francisco Bay Area. Outside of astronomy you’ll find me playing tennis, surfing (read: wiping out), and playing board games/TTRPGs!
The post Modeling the Structure of the Circumgalactic Bathtub appeared first on AAS Nova.
]]>
Thanks to JWST, the supernova remnant Cassiopeia A has a beautiful new portrait that has allowed astronomers to study the connection between molecules, dust, and supernovae.
The post Featured Image: A New Portrait of Cassiopeia A appeared first on AAS Nova.
]]>Cassiopeia A is a much-photographed supernova remnant in the northern celestial hemisphere, and now, thanks to JWST, it has a stunning new portrait. Using data from JWST’s Near-Infrared Camera and Mid-Infrared Instrument, Jeonghee Rho (SETI Institute and Seoul National University) and collaborators crafted the three-color image shown above. The diffuse blue areas show the light emitted by electrons spiraling around magnetic field lines, while the more finely detailed red and green areas trace light from argon and carbon monoxide, respectively. Coupled with spectra of two dense knots of gas within the shell of the supernova remnant, these observations allowed Rho’s team to study the connections between the formation of molecules like carbon monoxide and the creation of cosmic dust. For more new images of Cassiopeia A, including some incredible closeups of filamentary gas, be sure to check out the full research article linked below!
Citation
“Shockingly Bright Warm Carbon Monoxide Molecular Features in the Supernova Remnant Cassiopeia A Revealed by JWST,” J. Rho et al 2024 ApJL 969 L9. doi:10.3847/2041-8213/ad5186
The post Featured Image: A New Portrait of Cassiopeia A appeared first on AAS Nova.
]]>
A recent study merges different datasets to build a richer picture of Dimorphos, humanity's first asteroid redirection target.
The post Dimorphos, from Up Close and Far Away appeared first on AAS Nova.
]]>The Double Asteroid Redirection Test (DART) mission marked humanity’s first attempt to alter the course of an asteroid, a technique that could one day avert a catastrophic impact and save countless lives. But to fully understand the outcome of the experiment and to determine the impact of the human-caused impact, astronomers need a detailed characterization of their target. A recent study aims to bridge observations taken by DART moments before its demise and those taken from back on Earth in order to measure surface properties that neither dataset could constrain alone.
Intentional Collision and In-Situ Measurements
In September 2022, NASA’s DART spacecraft approached a near-Earth asteroid named Didymos and its moon, Dimorphos. With cameras trained on Dimorphos specifically, DART took pictures with ever-increasing resolution as the distance to the moon’s surface steadily shrank. Unfortunately for both DART and Dimorphos, though, this was not a flyby mission. Instead of changing course, DART plowed straight into the moon with enough momentum to dig a fresh crater and to change the satellite’s orbital period by more than 30 minutes.
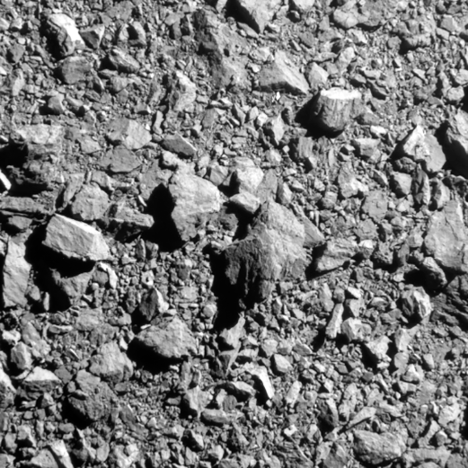
The surface of Dimorphos, as seen by the DART spacecraft 2 seconds before impact. [NASA/Johns Hopkins APL]
Some of these properties are best measured from up close to the asteroid, and the images beamed back by DART moments before its abrupt end contain much useful information. Others, though, such as how the surface scatters light, are better constrained by observing the asteroid from many different angles, which one can do by taking observations from Earth over many months. By combining these different types of measurements, a fuller picture emerges than could be built by either dataset alone.
Adding in Ground-Based Observations
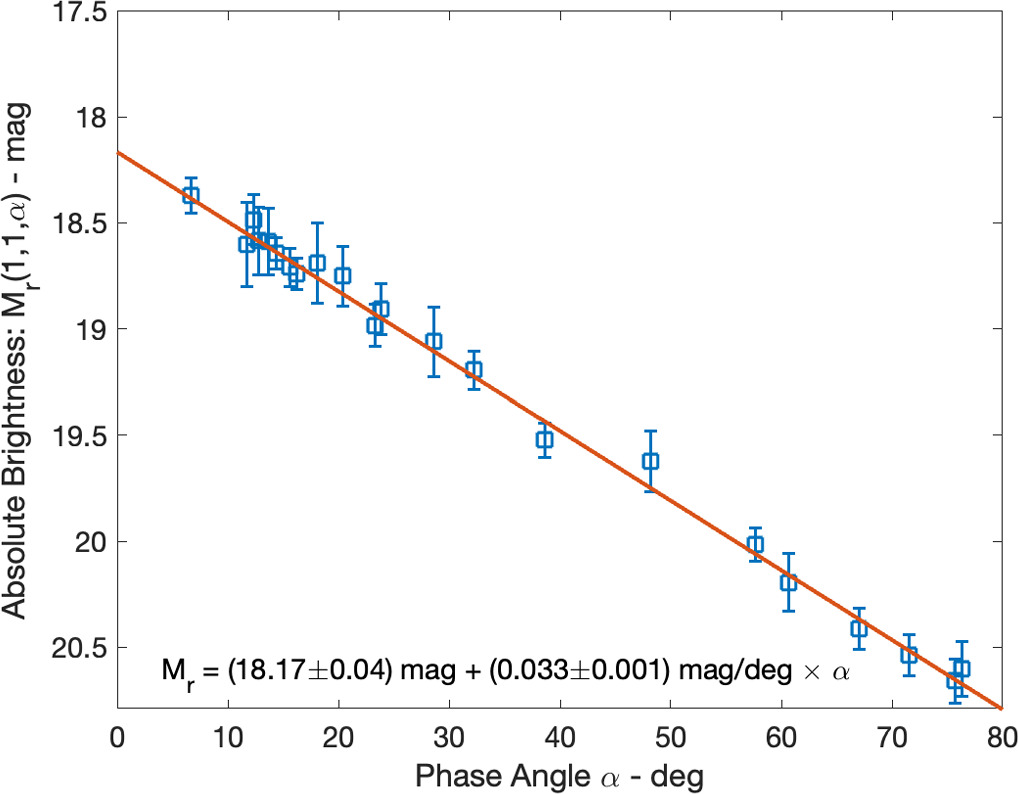
The solar phase curve of Dimorphos as measured from Table Mountain Observatory. [Buratti et al. 2024]
This synthesis demonstrates that although the missions we send up to gather exquisite in-situ data, sometimes important, fundamental properties require patient observations from back home as well. In 2026, the European Space Agency’s Hera spacecraft will arrive at Didymos to survey the damage, and analysis of its data will rely heavily on context learned through studies like these in the intervening years.
Citation
“Pre-impact Albedo Map and Photometric Properties of the (65803) Didymos Asteroid Binary System from DART and Ground-Based Data,” B. J. Buratti et al 2024 Planet. Sci. J. 5 83. doi:10.3847/PSJ/ad2b60
The post Dimorphos, from Up Close and Far Away appeared first on AAS Nova.
]]>
This month, we're exploring temperate exoplanets: how to find them, how to model them, and how to figure out if they host life.
The post Monthly Roundup: The Allure of Temperate Exoplanets appeared first on AAS Nova.
]]>Choosing a favorite planet has never been more challenging: researchers have discovered more than 5,600 exoplanets that range from super-heated super-puffs skimming the surfaces of their host stars to Mercurian worlds of pure iron. As telescopes dedicate even more time to the search for distant worlds, the exoplanets discovered are getting smaller, cooler, and more like Earth. The allure of temperate, Earth-like exoplanets is undeniable, but so are the roadblocks to finding and characterizing these planets. In today’s Monthly Roundup, we’ll give an overview of four recent studies of temperate exoplanets, ranging from ways to detect technological civilizations on these worlds to the importance of fine-tuning model inputs.
Temperate Earth-Sized Planet Discovered
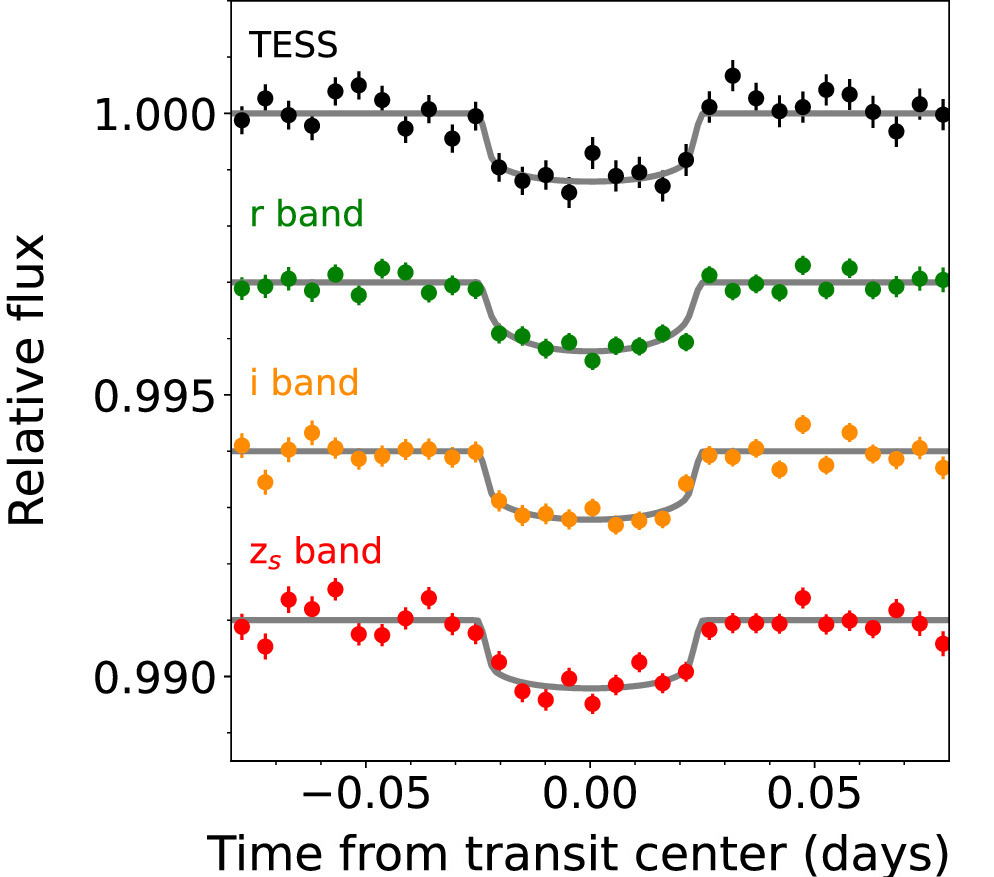
TESS light curves for transits of Gliese 12 b. [Adapted from Kuzuhara et al. 2024]
The team found that Gliese 12 b swings around its host star every 12.76 days and is just a hair smaller than Earth. Its mass might be far greater, though, with a tentative upper limit of 3.9 Earth masses. The large mass range means the planet could be extraordinarily dense — nearly as dense as pure iron — or it could be rocky with a lightweight hydrogen atmosphere. The planet’s equilibrium temperature is a relatively cool 315K (107℉/42℃), but if this planet is blanketed by a thick, Venus-like atmosphere, its true surface temperature could be far hotter.
This discovery is significant because most of the exoplanets known to orbit M-dwarf stars are fried by high-energy radiation, making them inhospitable to life. Unlike many M dwarfs, Gliese 12 appears to be inactive and unlikely to unleash planet-searing flares. Thus, Gliese 12 b joins the short list of nearby temperate exoplanets whose atmospheres could be scrutinized with JWST, and future observations should reveal more about this world.
Inputs Under Investigation
Let’s say you’ve discovered a temperate exoplanet and collected a spectrum of its atmosphere. What happens next? Researchers rely on complex models to interpret their observations of planetary atmospheres. Models of exoplanet atmospheres take in myriad inputs, and tweaking any one of these inputs can have significant impact on the output, as recent research led by Wynter Broussard (University of California, Riverside) shows.
Broussard’s team tested the impact of varying the water photolysis cross section on models of temperate planets without oxygen and without life. Photolysis is the splitting apart of a molecule by a photon; the photolysis cross section describes how readily a molecule is broken apart by a photon of a given wavelength. When a photon cleaves apart a water molecule, the interaction leaves behind a hydrogen atom and a radical, OH. OH is highly reactive and can destroy trace atmospheric gases. Because of this, the photolysis cross section of water molecules has a potentially large impact on the predicted composition of a planet’s atmosphere.
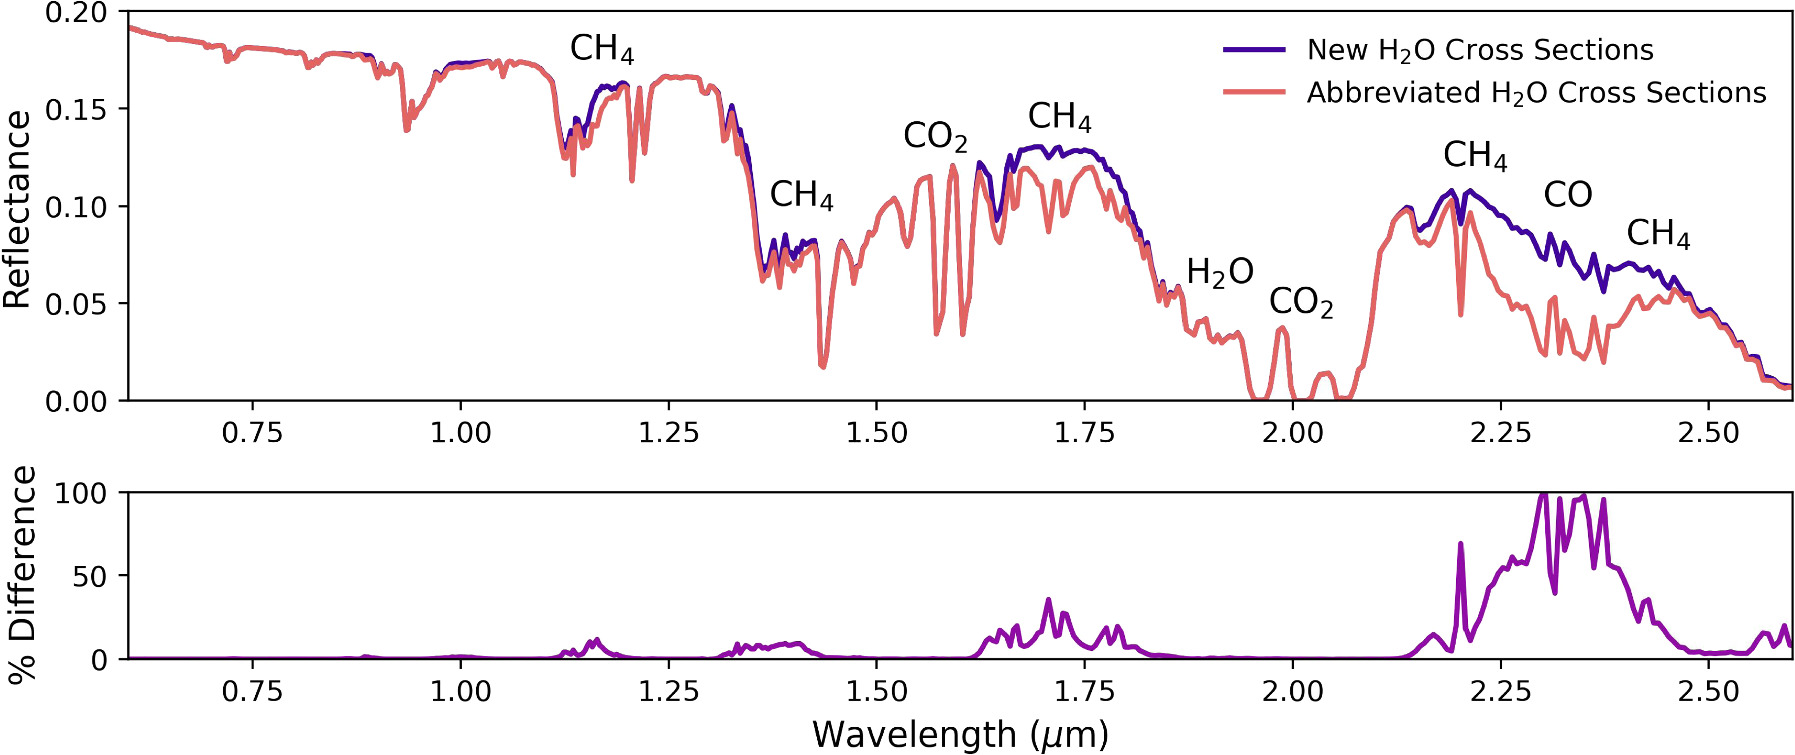
Modeled spectra of an exoplanet orbiting a Sun-like star with the new water cross section (purple) and the old water cross section (coral). Click to enlarge. [Broussard et al. 2024]
Signals from Sulfur on Water-World Exoplanets
Our ability to interpret atmospheric spectra is critical: it might be our best hope of detecting life from light-years away. In September 2023, the temperate sub-Neptune planet K2-18b made a splash when researchers announced that it’s likely an ocean-covered world whose atmosphere contains methane, carbon dioxide, and maybe, tentatively dimethyl sulfide, which on Earth is only produced by life. Subsequent research suggested K2-18b fits the model of a lifeless, gas-rich planet equally well, highlighting the difficulty of this type of research.
Now, a team led by Shang-Min Tsai (University of California, Riverside) has examined the chemistry and detectability of sulfur-containing gases — like dimethyl sulfide — that are produced by life. Tsai and collaborators simulated the atmospheres of sub-Neptune-sized water-world exoplanets to understand how sulfur compounds might circulate within a planet’s atmosphere and be detectable through transmission spectroscopy.
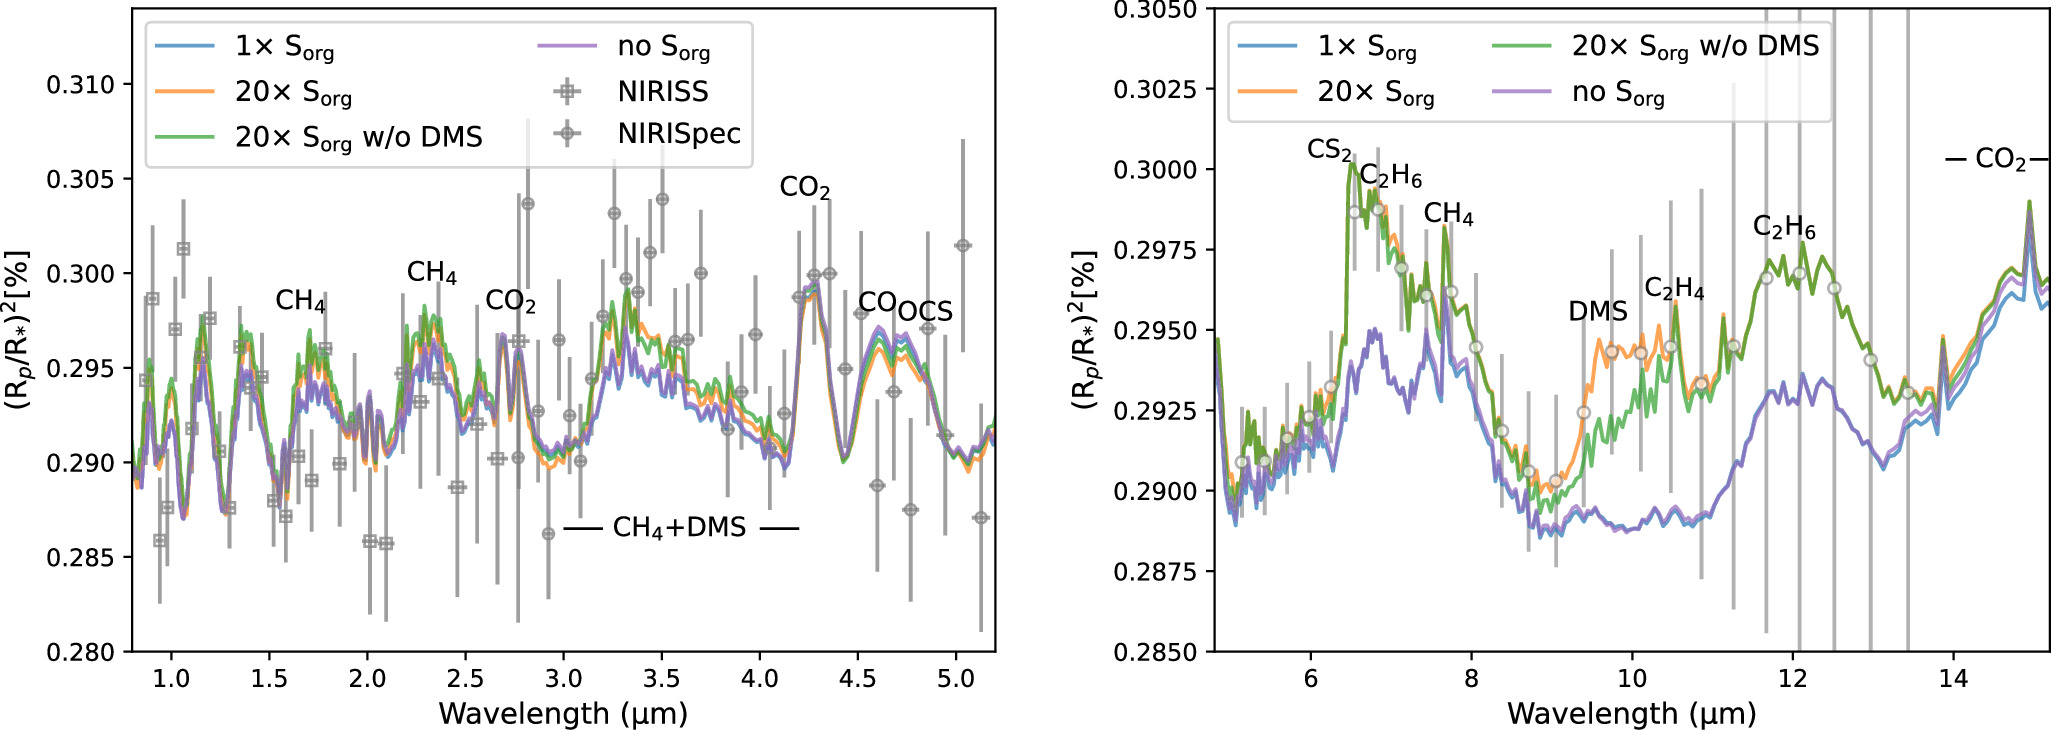
Modeled transmission spectra of K2-18b containing the same flux of sulfur produced by life as Earth (blue), 20 times the biogenic sulfur of Earth (orange), and 20 times the biogenic sulfur of Earth but with the signal from dimethyl sulfide removed (green). The purple line shows the spectrum of a planet with no biogenic sulfur. Click to enlarge. [Tsai et al. 2024]
From Biosignatures to Technosignatures
The final article of this Roundup examines a way to find intelligent life. Searches for intelligent life beyond Earth focus on technosignatures, or signs of technology, like radio signals, enormous structures created to capture starlight, or atmospheric gases from industrial processes.
Edward Schwieterman (University of California, Riverside, and Blue Marble Space Institute of Science) and collaborators considered the possibility of detecting artificial greenhouse gases injected into a planet’s atmosphere to alter its climate, such as to stave off an oncoming ice age or to make a chilly neighboring world more hospitable. The gases studied in this work — hexafluoroethane (C2F6), octafluoropropane (C3F8), sulfur hexafluoride (SF6), nitrogen trifluoride (NF3), and carbon tetrafluoride (CF4) — are unlikely to be produced by non-technologically advanced life and may linger in planetary atmospheres for millennia, increasing the odds that we could detect these gases.
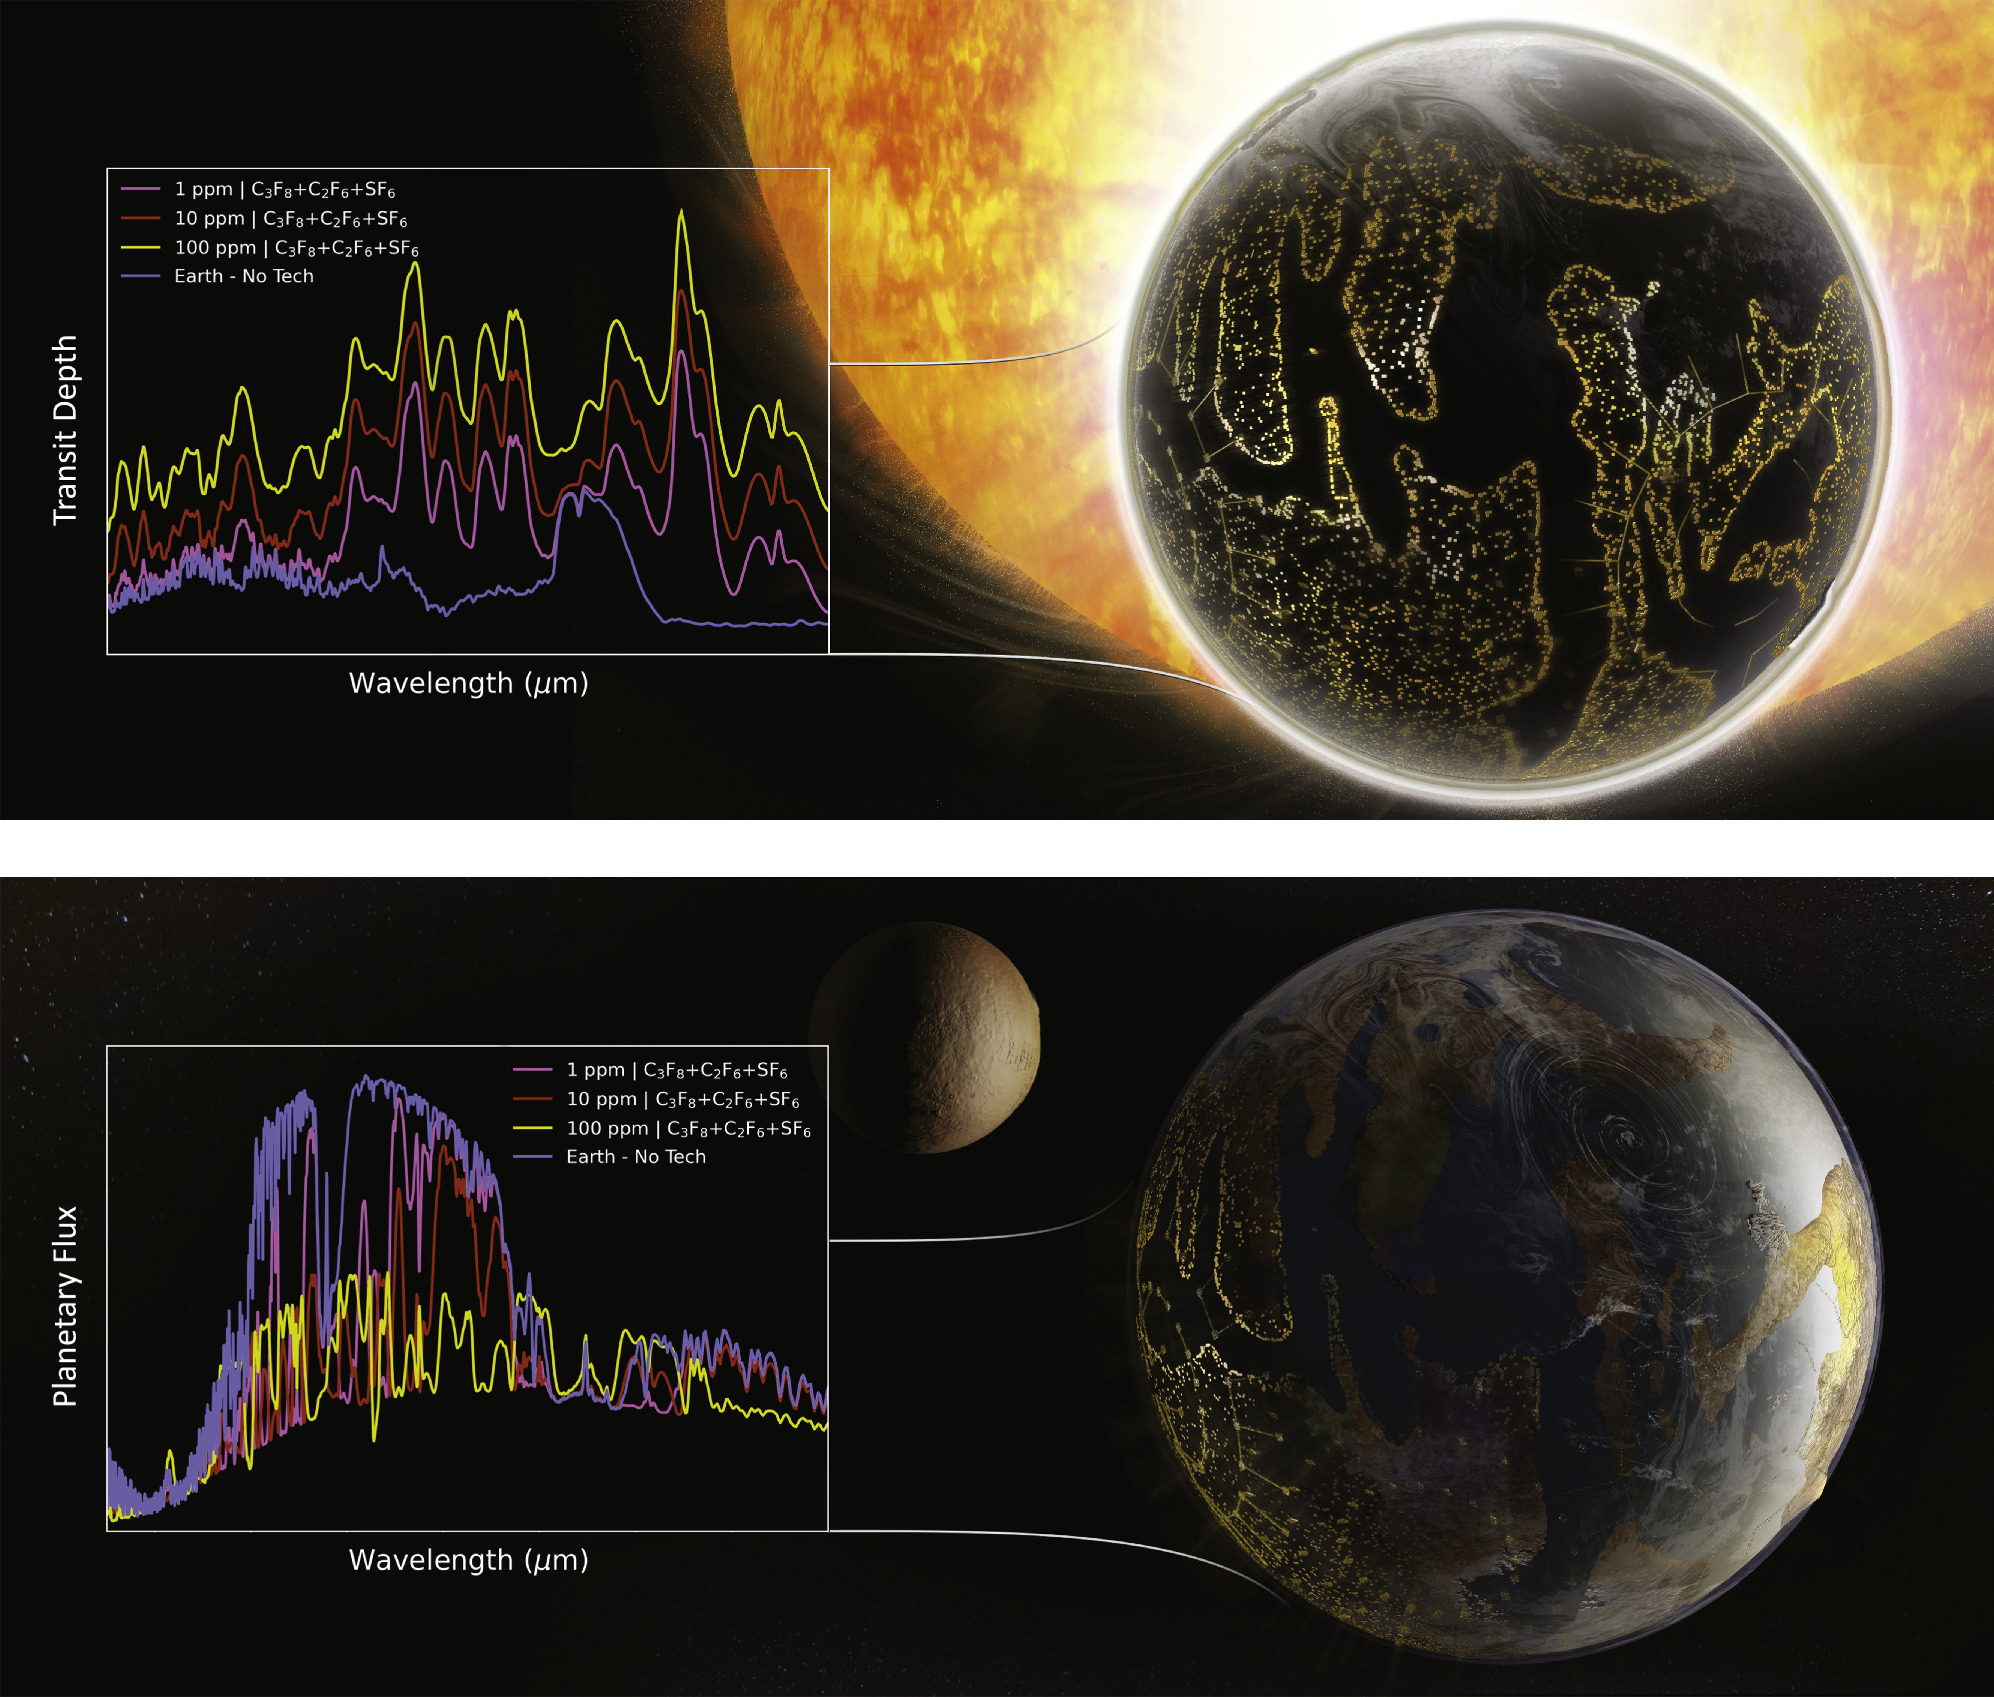
Illustration of modeled transmission (top) and emission (bottom) spectra from a hypothetical Earth-like exoplanet whose atmosphere contains a combination of three technosignature gases: C3F8, C2F6, and SF6. Click to enlarge. [Schwieterman et al. 2024]
Citation
“Gliese 12 b: A Temperate Earth-Sized Planet at 12 pc Ideal for Atmospheric Transmission Spectroscopy,” Masayuki Kuzuhara et al 2024 ApJL 967 L21. doi:10.3847/2041-8213/ad3642
“The Impact of Extended H2O Cross Sections on Temperate Anoxic Planet Atmospheres: Implications for Spectral Characterization of Habitable Worlds,” Wynter Broussard et al 2024 ApJ 967 114. doi:10.3847/1538-4357/ad3a65
“Biogenic Sulfur Gases as Biosignatures on Temperate Sub-Neptune Waterworlds,” Shang-Min Tsai et al 2024 ApJL 966 L24. doi:10.3847/2041-8213/ad3801
“Artificial Greenhouse Gases as Exoplanet Technosignatures,” Edward W. Schwieterman et al 2024 ApJ 969 20. doi:10.3847/1538-4357/ad4ce8
The post Monthly Roundup: The Allure of Temperate Exoplanets appeared first on AAS Nova.
]]>
Astrobites reports on galaxies that may be forming a remarkable number of stars in the first few hundred million years of the universe.
The post Too Many Stars, Too Fast? appeared first on AAS Nova.
]]>Editor’s Note: Astrobites is a graduate-student-run organization that digests astrophysical literature for undergraduate students. As part of the partnership between the AAS and astrobites, we occasionally repost astrobites content here at AAS Nova. We hope you enjoy this post from astrobites; the original can be viewed at astrobites.org.
Title: RUBIES: Evolved Stellar Populations with Extended Formation Histories at z ∼ 7 − 8 in Candidate Massive Galaxies Identified with JWST/NIRSpec
Authors: Bingjie Wang et al.
First Author’s Institution: Pennsylvania State University
Status: Published in ApJL
When JWST was launched, scientists were hopeful that the telescope would be able to answer hundreds of questions about the early universe. Luckily, it has been able to answer many of these questions. And even more luckily, observations of the early universe with JWST have been able to generate even more questions we don’t know the answers to!
One new conundrum scientists are running into is that it looks like some galaxies in the early universe have what we call evolved stellar populations. This means that even though these galaxies are only a couple hundred million years old (super young, right?), they already have ~100-million-year-old stars, meaning that these galaxies had to make a large amount of stars in only a short span of time. We’re not used to seeing this many stars form this fast — in fact, we expect that star formation should be slow this early in the universe. So how do we reconcile this?
The authors of today’s article look in more depth at the spectra of three such galaxies to figure out if these galaxies have really been forming stars for millions of years already. These three galaxies are located at redshifts of z = 6.7–8.4, which places them just 600 million years after the Big Bang.

Figure 1: Balmer break at rest wavelength 3645 Angstroms (Å) observed in the galaxy spectra. The strength of the break (the relative flux difference before and after the break) is 1.71. [Wang et al. 2024]
Balmer Breaks Create Questions
First, the authors looked to confirm that evolved stellar populations do in fact exist in these galaxies. One foolproof way to do this is to look for a Balmer break in the galaxies’ spectra. The Balmer break comes from the atmospheres of older stars, indicating that the galaxy contains a population of older stars and has had little star formation for at least the past 100 million years. Excitingly, the authors confirm that there is in fact a Balmer break in the spectra of these three galaxies, as shown in Figure 1. Unfortunately, the Balmer break only tells you that there are older stars, not necessarily how old they are or how many of them there are.
Stellar Populations or Active Galactic Nuclei?
The authors then turn to understanding the finer details of the stellar population, specifically its formation history. The authors found evidence of broad lines in their emission-line spectra, signaling that there might be active galactic nucleus activity in at least two of these galaxies. Broad lines come from Doppler broadening, where photons emitted by an active galactic nucleus have a wide distribution of velocities, resulting in a broad emission line. However, the authors aren’t entirely ready to say conclusively that there are active galactic nuclei in the spectra.
In the local, low-redshift universe, we’re pretty good at understanding how these broad lines relate to active galactic nuclei because we have hundreds of spectra to test. But at high redshift, we don’t have a lot of data. We aren’t sure why supermassive black holes act the way they do early in the universe, and we don’t want to assume they act the same as the ones we observe in the local universe. So researchers have to rely on testing theoretical models against high-redshift galaxy observations.
To test how much of the light in these galaxies is coming from active galactic nuclei or evolved stellar populations, the authors test three different models: 1) The light is mostly from stars. 2) It’s from a mixture of stars and active galactic nuclei. 3) It’s mostly from active galactic nuclei. The authors create the model spectra using Prospector and compare the modeled spectra to the observed spectra to see how well they match.
Model Comparisons
The results of the modeling are shown in Figure 2. The most important thing the authors are testing here is what these different levels of contribution from the active galactic nucleus mean for the formation history of the stellar population. For instance, the model with the maximal stellar contribution means that the stellar population had to form earlier, because there need to be enough stars to create all the light seen. The minimal stellar model can form stars a bit later because the active galactic nucleus contributes more to the light seen, so you don’t need as many stars producing a lot of light. However, there is no way to verify which model is more accurate at this stage, so the authors turn to theorizing how each model could fit into the evolutionary stages of later galaxies.

Figure 2: Left: Each model compared to the spectrum for one of the observed galaxies. Right: Predicted star formation rate as a function of time since Big Bang for each model. As seen, models with higher active galactic nucleus contribution predict later star formation. [Wang et al. 2024]
Progenitors of Massive Quiescent Galaxies?
To find out how their models fit into the evolution of galaxies, the authors then compare the different suggested star formation histories of the medium and maximal stellar contribution models with the projected histories of massive quiescent galaxies that exist at z ~ 3-5. These massive quiescent galaxies lack an explanation for how they got so massive yet have such slow star formation now. As can be seen in Figure 3, the star formation rate traced across the age of the universe for the massive galaxies (black, blue, green, and yellow distributions) matches much better in the maximal stellar contribution model. The authors posit that these galaxies could create a lot of stellar mass in a short time, then have their star formation slowed greatly to become these massive quiescent galaxies. With this explanation, the authors note that these galaxies would be a relatively small fraction of all the galaxies in the early universe.

Figure 3: Comparison of medium (purple) and maximal (red) stellar models with the projected formation histories of a sample of massive quiescent galaxies at z ~ 3-5. [Wang et al. 2024]
Original astrobite edited by Amaya Sinha.
About the author, Caroline von Raesfeld:
I’m a second-year PhD student at Northwestern University. My research explores how we can better understand high-redshift galaxy spectra using observations and modeling. In my free time, I love to read, write, and learn about history.
The post Too Many Stars, Too Fast? appeared first on AAS Nova.
]]>
A new survey revealed for the first time that Deneb, the 19th brightest star in the night sky, is not just a variable star but a polarimetric variable as well.
The post A Surprise in Cygnus appeared first on AAS Nova.
]]>Deneb, the brightest star in the constellation Cygnus and the 19th brightest star in the night sky, has surprised astronomers: it’s not just a variable star — its polarization changes, too!
Full of Surprises
Location of Deneb, in the constellation Cygnus. Click to enlarge. [International Astronomical Union/Sky & Telescope, CC BY 4.0]
Recently, researchers started a new survey of bright stars in the northern celestial hemisphere to learn more about these stars’ polarization. Polarization refers to the orientation of light waves as they travel through space. If the light waves are oriented in a particular direction, the light is polarized. If instead the waves are oriented randomly, the light is unpolarized. A star’s polarization can reveal critical information about its winds, pulsations, and surroundings.
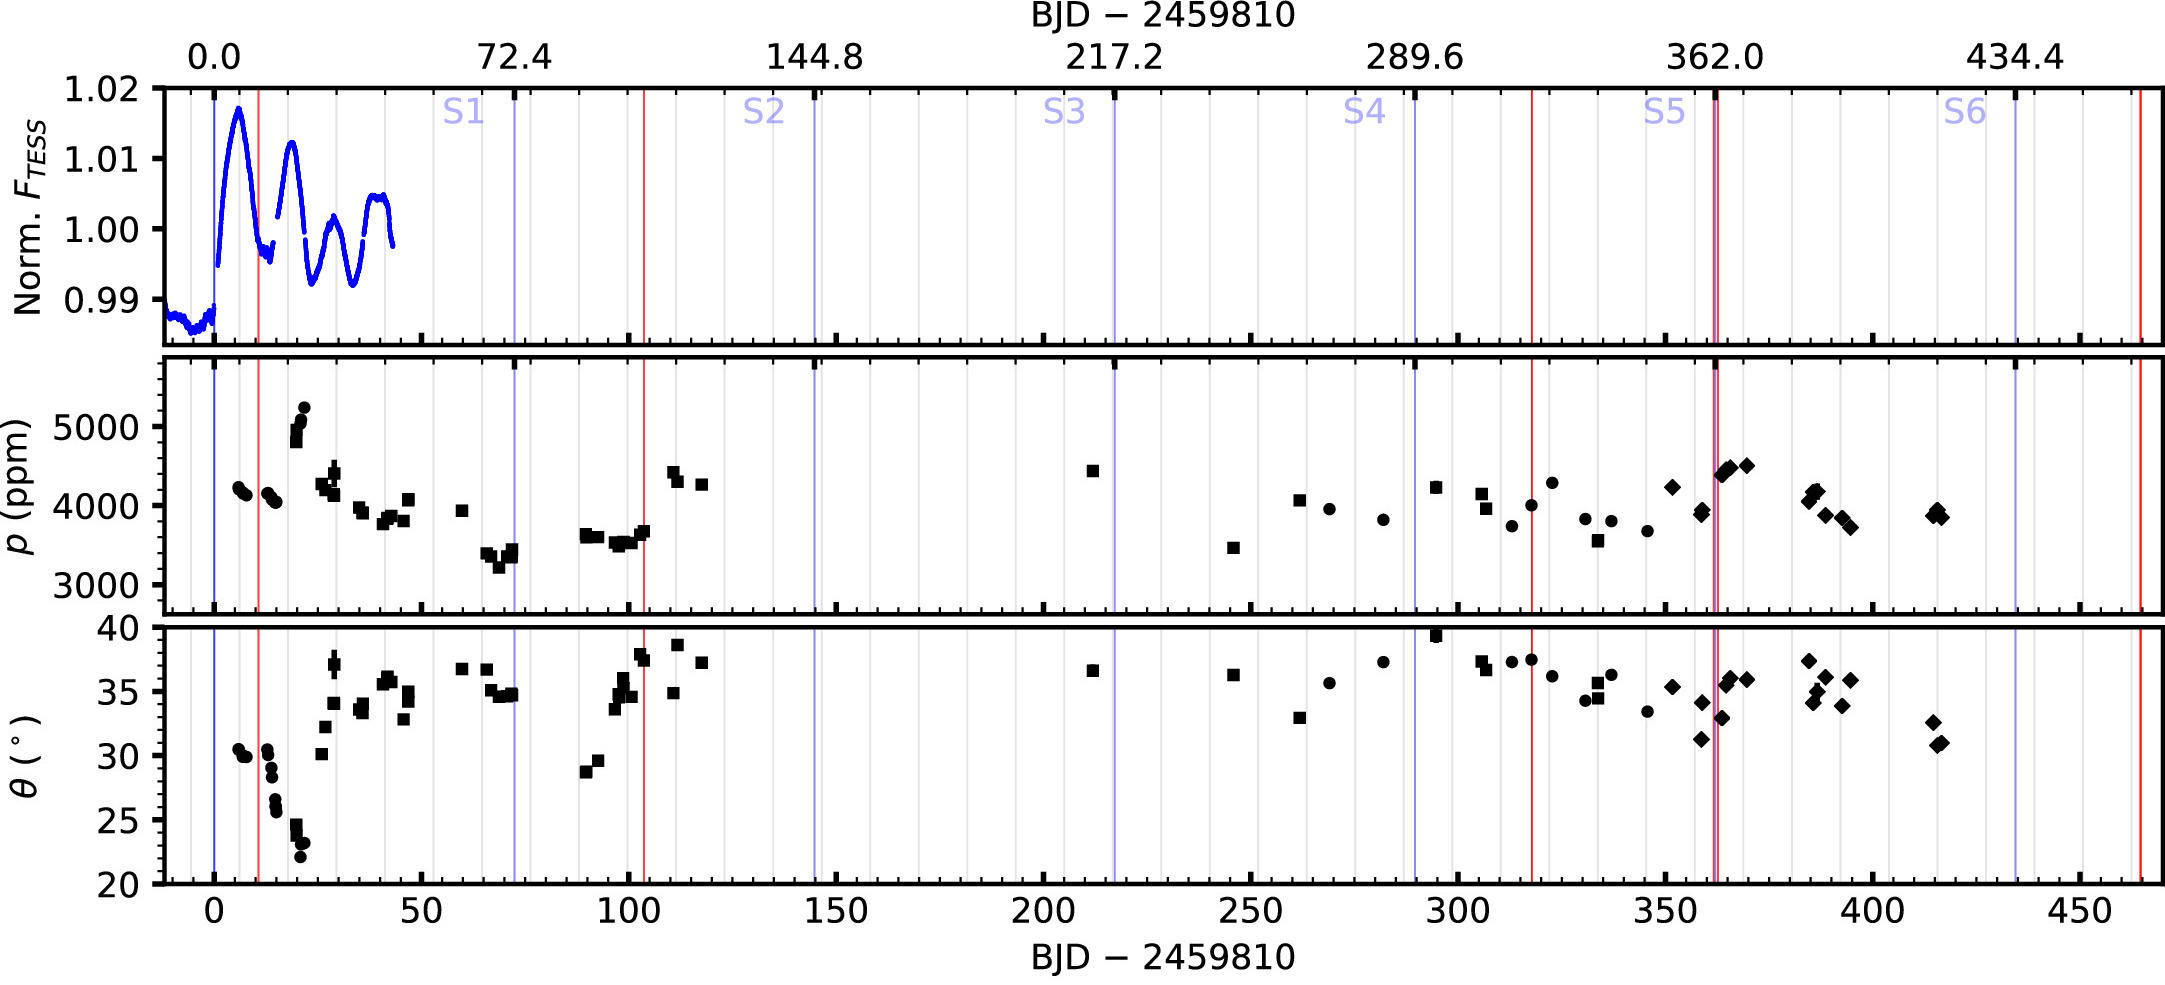
Deneb’s normalized brightness (top panel), degree of polarization (middle panel), and angle of polarization (bottom panel). Click to enlarge. [Adapted from Cotton et al. 2024]
Polarization Patrol
Daniel Cotton (Monterey Institute for Research in Astronomy and Western Sydney University) and collaborators presented more than a year of polarization data for Deneb, revealing for the first time that the star’s polarization varies. Deneb’s degree of polarization — how much of its starlight is oriented in an orderly way rather than every which way — is considerable, about 3,000–5,000 parts per million. The variability is large as well, bouncing around by hundreds of parts per million.
Deneb is a prominent star in the northern celestial hemisphere: how did this variability go unnoticed for so long? Like its brightness changes, Deneb’s polarization changes are irregular, changing significantly but unpredictably over the course of several weeks. Because few measurements of the star’s polarization were made until 2022, these changes escaped notice until now.
Reasons for Change
Cotton’s team identified two possible causes for the polarization changes: variable winds and non-radial pulsations. Other supergiant stars are known to have clumpy winds that can scatter and polarize starlight in a way that varies over time. This is likely the most straightforward explanation for Deneb’s polarization variations. In this case, the star’s polarization variations and its brightness variations would not be strongly correlated.
Another possibility is that Deneb’s non-radial pulsations could distort the surface of the star, causing polarization changes that are correlated with the star’s brightness and radial velocity changes. After examining the available data, Cotton’s team concluded that winds are the most likely cause of Deneb’s variable polarization, but non-radial pulsations might play a small role as well.
This marks just the beginning of our understanding of Deneb’s polarization properties — future photometric, polarimetric, and spectral observations of the star are planned, helping to illuminate the star’s behavior further.
Citation
“Deneb Is a Large-Amplitude Polarimetric Variable,” Daniel V. Cotton et al 2024 ApJL 967 L43. doi:10.3847/2041-8213/ad4b0f
The post A Surprise in Cygnus appeared first on AAS Nova.
]]>
Was an amino acid found in the interstellar medium at last, as reported last year? New research suggests that the search isn't over yet.
The post New Analysis Finds No Evidence for Tryptophan in Interstellar Cloud appeared first on AAS Nova.
]]>Last year, a researcher claimed the first detection of an amino acid, tryptophan, in an interstellar cloud. New research that leverages laboratory experiments and data from JWST refutes this finding, suggesting that the hunt for the first amino acid in the interstellar medium isn’t over yet.
A Hunt for Amino Acids
Researchers have long sought evidence for amino acids, the building blocks of all life on Earth, in the dusty clouds of the interstellar medium. Several amino acids have turned up in meteorites and the gaseous envelopes of protostars, but claimed detections of these critical molecules in cold, star-forming clouds have been refuted. Now, another potential detection awaits confirmation.
The structure of a tryptophan molecule. [Dhariwal et al. 2024]
Comparison of the Spitzer spectrum used in the claimed detection of tryptophan (orange) to the new laboratory spectrum (blue) and the previously used laboratory spectrum (red). The panels at the bottom show individual spectral features. Click to enlarge. [Dhariwal et al. 2024]
A Three-Pronged Investigation
Aditya Dhariwal (University of British Columbia) and collaborators used several methods to evaluate the claimed detection, beginning with a laboratory spectrum of the molecule. It’s no easy task to simulate the conditions of the interstellar medium in a lab: the density of interstellar gas can be far lower than the best lab vacuum, and temperatures in cold clouds hover just above absolute zero. This makes it challenging to generate spectra that match what would be seen from molecules in interstellar space.
The previous study used a lab spectrum of tryptophan in the form of a solid pellet. Dhariwal’s team pointed out that unlike in the interstellar medium, tryptophan in a solid state likely takes the form of a zwitterion: a molecule that has no electric charge overall but is composed of parts that carry electric charge.
The team used a new method to prepare a sample of tryptophan in non-zwitterionic form and compared the collected infrared spectrum to the Spitzer observations. Crucially, the spectral lines seen by Spitzer and assigned to tryptophan have no matches in the new spectrum.
Paths Forward

Spectrum of IC 348 from JWST (top) and individual spectral lines from that spectrum (bottom). The blue dotted lines mark the locations of the reported tryptophan lines. Click to enlarge. [Dhariwal et al. 2024]
Finally, Dhariwal’s team revisited the Spitzer observations used in the previous analysis. Their examination of the spectrum led them to suspect that the purported emission lines of tryptophan were instrumental artifacts rather than true spectral lines.
This study demonstrates the fascinating back and forth of science at work. Although the latest investigation finds no compelling evidence for tryptophan in the interstellar medium, the authors identified paths forward. Laboratory spectra of tryptophan gas at radio wavelengths allow for searches of the sky at longer wavelengths, and though challenging to collect, spectra of tryptophan gas at infrared wavelengths could open yet another window. The search goes on!
Citation
“On the Origin of Infrared Bands Attributed to Tryptophan in Spitzer Observations of IC 348,” Aditya Dhariwal et al 2024 ApJL 968 L9. doi:10.3847/2041-8213/ad4d9a
The post New Analysis Finds No Evidence for Tryptophan in Interstellar Cloud appeared first on AAS Nova.
]]>
Astrobites reports on efforts to study black holes across cosmic time via the observational limits on the gravitational wave background.
The post Timing Black Holes’ Race to Merge Using Waves on the Stochastic Sea appeared first on AAS Nova.
]]>Editor’s Note: Astrobites is a graduate-student-run organization that digests astrophysical literature for undergraduate students. As part of the partnership between the AAS and astrobites, we occasionally repost astrobites content here at AAS Nova. We hope you enjoy this post from astrobites; the original can be viewed at astrobites.org.
Title: The Metallicity Dependence and Evolutionary Times of Merging Binary Black Holes: Combined Constraints from Individual Gravitational-Wave Detections and the Stochastic Background
Authors: Kevin Turbang et al.
First Author’s Institution: Free University of Brussels and University of Antwerp
Status: Published in ApJ
The Gravitational Wave Ocean
Before the final few seconds of the gravitational wave signal from a merger washes up on LIGO–Virgo–KAGRA detectors on Earth, the black holes or neutron stars that caused the powerful waves were actually orbiting around each other for much, much longer — possibly for hundreds of millions of years. The gravitational waves emitted prior to the pair’s final hurrah are too quiet to be picked up via ground-based interferometry with current detectors, and they instead wash together in a background hum like waves out at sea.
The length of time between two black holes forming and their eventual merging — otherwise known as delay time — is a useful signature for telling us where the black holes came from and the lives of the stars from which they were born. Fortunately, we don’t have to sit around for a billion years watching the cosmos play at spinning black holes around each other (though it would be fun to help if you were an interstellar cat). The distribution of time delays can be calculated using the number of merging black holes per given time at a certain redshift (called the merger rate), something that we can measure with current detections of merging black holes with ground-based detectors; as long as we know the rate of star formation and how this varies with the metallicity of the forming stars.
Instead of waiting for one binary system to merge somewhere in the cosmos, we can understand the time-delay distribution by detecting many black holes that have formed and merged at different points in time. The different information that multiple detections give us allows us to paint a picture of this time-delay distribution without waiting the lifetime of a black hole binary. There’s one crux, however: with the limited sensitivity of current ground-based gravitational wave detectors, we only really resolve merging black holes out to a redshift of around 1, about 8 billion years ago, when the universe had already started slowing its pace of forming stars. The black holes merging closer than this distance make loud enough gravitational waves that they stand out from the noise, making them resolvable, while beyond this distance gravitational waves that are quieter and harder to detect are lost in detector noise, and hence are unresolved. This means we can only understand the merger rate at small redshifts with resolved detections, while minimising the information we can get about the time-delay distribution.
Heading for Choppy Waters
Fortunately, today’s authors have a trick up their sleeve. By combining the information from the current detections loud enough to individually identify and the information from the background hum of merging black holes too weak to detect, the so-called stochastic background, they can help bypass this problem. The stochastic background is made up of unresolved signals from many more inspiralling black holes — a random sea of gravitational waves — and provides vastly more information about the black hole population at higher redshifts. The authors show that by using information about the stochastic background, we can extract information about the shape of the time-delay distribution (i.e., whether most black holes take a long time to merge or whether most merge relatively quickly after forming), the minimum time a black hole binary takes to merge, and the maximum metallicity environment that can create merging black holes. However, this background has so far been too quiet to detect. Today’s authors show that predicting these parameters using only resolved signals doesn’t tell us much about the time-delay distribution, but things change significantly when including different models of the stochastic background.
Even though we haven’t detected this stochastic background, we can still make predictions about the time-delay distribution because we know that the stochastic signal needs to be quieter than we can currently hear in the detectors. Therefore, there should be fewer merging binaries making up the background, making it not loud enough to meet the detection threshold. This means we have an estimate of the energy per unit frequency of the stochastic background, without having even detected it.
The authors’ model assumes the time-delay probability distribution is a power law with slope κ. A steeply positively sloped time-delay distribution would mean that there is very little probability of any objects merging quickly after they have formed and it’s very likely that black holes take a long time to merge. A steeply negative slope would mean that it’s very likely that black holes merge quickly after forming. Using the resolved detections and this stochastic background estimate, the authors find κ is strongly constrained to be negative. Whether the slope would be positive or negative is determined by the low-redshift black hole population — a positive slope would mean that since every greater time delay is more probable than the smaller time delay before, every day there would be more and more black holes merging. Fortunately, we don’t need to explain an ever-increasing number of merging black holes, as measurements at low redshifts show that there are fewer merging black holes closer to us as far as our resolved detections reach. Meanwhile, they can’t place any constraints on the minimum delay time or the maximum sensitivity. This is a consequence of the estimated stochastic background being much weaker than what we can detect with the current observations.
Our Next Great Voyages
With the next big set of improvements to the LIGO detectors currently being implemented comes two possibilities: either this stochastic background is detected, or it remains too quiet to be picked up. The authors show that either of these cases will be more informative about the time-delay distribution than what the current observations can say. By simulating a stochastic background for each of these future cases and adding it to the current resolved detections, they can say more about the astrophysics of the time delay and metallicities of the black hole mergers in the universe.
For the case of a future detection of the stochastic background, the slope of the time-delay distribution is likely to be highly negative, while the metallicity parameter and the minimum time delay are both constrained to smaller values, as seen in Figure 1. This means that a universe with a loud stochastic background has shorter delay times with lots of black holes merging in the early universe and at low metallicities.

Figure 1: A corner plot of the three astrophysical parameters of the time-delay distribution (from left to right: the time delay power-law slope κ, log of the maximum metallicity in solar metallicities, and log of the minimum time delay in billions of years) measured with current resolved gravitational wave observations, and a stochastic background detected with future LIGO–Virgo–KAGRA detectors. The three panels at the top of each column show the 1D probability distributions of the three parameters, where the dotted line is the current constraints on these parameters. The three panels in the bottom left represent the joint probability distributions between pairs of parameters, showing the correlations between the parameters. [Turbang et al. 2024]

Figure 2: The same as Figure 1 but considering a non-detected stochastic background at future detector sensitivity. In this case the value of κ is still negative but closer to zero, meaning a less steep distribution of black hole time delays. There is a wider range of possible maximum metallicities and minimum time delays. [Turbang et al. 2024]
Original astrobite edited by Evan Lewis.
About the author, Storm Colloms:
Storm is a postgraduate researcher at the University of Glasgow, Scotland. They work on understanding populations of binary black holes and neutron stars from the gravitational wave signals emitted when they merge, and what that tells us about the lives and deaths of massive stars. Outwith astrophysics they spend their time taking digital and film photos and making fun doodles of their research.
The post Timing Black Holes’ Race to Merge Using Waves on the Stochastic Sea appeared first on AAS Nova.
]]>
Multiple images of a single supernova gravitationally lensed by a massive galaxy cluster will allow researchers to calculate the expansion rate of the universe.
The post Featured Image: Seeing Triple appeared first on AAS Nova.
]]>What at first appears to be a glowing strand of molten iron in the image above is something far wilder: a distant galaxy whose light has been stretched into galactic taffy by the immense gravity of an intervening galaxy cluster. This phenomenon, known as strong gravitational lensing, multiplies and magnifies images of faraway sources, allowing astronomers to use massive objects like galaxy clusters as natural telescopes. Look closely at the zoomed-in version of the image: three points of light stand out against the glow of the lensed galaxy. These three dots are multiple images of a single supernova cataloged as SN H0pe. Researchers plan to use this rare multiply imaged supernova to calculate the Hubble constant, which quantifies the universe’s expansion rate. Using observations from JWST, a team led by Justin Pierel (Space Telescope Science Institute) calculated the time delay of the light from the images, finding arrival times offset by 49 and 117 days. The value of the Hubble constant derived from these observations will be reported in a future publication. In the meantime, be sure to check out the details of these initial calculations in the article linked below.
Citation
“JWST Photometric Time-Delay and Magnification Measurements for the Triply Imaged Type Ia “SN H0pe” at z = 1.78,” J. D. R. Pierel et al 2024 ApJ 967 50. doi:10.3847/1538-4357/ad3c43
The post Featured Image: Seeing Triple appeared first on AAS Nova.
]]>
One last plenary session brought AAS 244 to a close on Thursday. Read on for a discussion of how to detect X-rays from dark matter particles!
The post AAS 244: Day 4 appeared first on AAS Nova.
]]>Editor’s Note: This week we’re at the 244th AAS meeting in Madison, WI, and online. Along with a team of authors from Astrobites, we will be writing updates on selected events at the meeting and posting each day. Follow along here or at astrobites.com for daily summaries, or follow @astrobites.bsky.social on Bluesky for more coverage. The usual posting schedule for AAS Nova will resume on June 17th.
Plenary Lecture: Scanning the X-ray Sky for Dark Matter, Kerstin Perez (Columbia University) (by Nathalie Korhonen Cuestas)
Throughout the universe, we’ve detected the indirect signatures of dark matter: a hypothetical form of matter that does not interact with normal matter through electromagnetism and makes up most of the matter in the universe. It’s seen in the rotation curves of galaxies, through gravitational lensing in the Bullet Cluster, and in the anisotropies of the cosmic microwave background. Dr. Kerstin Perez (Columbia University), the conference’s last plenary speaker, works to characterize the properties of dark matter through observations of X-ray photons, bringing us closer to understanding the matter that makes up so much of the universe.
It’s possible that dark matter particles interact through forces that we can’t currently understand using the standard model, producing photons with X-ray wavelengths. Perez leverages these interactions to look for “extra” photons as a signature of dark matter. However, it can be difficult to pinpoint which photons are coming from dark matter particles, and which photons are produced by normal, baryonic matter. Ideally, you’d observe a region with a high dark matter density and a low (or very well understood) background of photons from baryonic sources. Even though this technique can be tricky, Perez noted that even when a photon excess doesn’t end up being due to dark matter, it can still tell us something new about the background source.
To make her observations, Perez uses the NuSTAR instrument in a novel way. Normally, astronomers use photons that have traveled through the optics of the NuSTAR telescope, resulting in a small field of view. But one astronomer’s trash is another astronomer’s treasure; Perez uses photons that have come in from very large angles and hit the detector directly, rather than going through the optics system. This results in a larger pacman-shaped field of view, which can be cleverly aligned with a dark matter halo or a star, allowing Perez to search for photons produced by dark matter.
Dark matter particle theories come in lots of different flavors, and in her talk, Perez focused on two: sterile neutrinos and axions. Both types of particles only interact with gravity, and they could address other open questions in particle physics, not just that of dark matter. Perez showed observations of dark matter halos and Betelguese (a well-observed red supergiant) from NuSTAR, and while neither yielded a clear cut detection of dark matter, they do put strong constraints on the properties of dark matter. As these constraints get more stringent, we can get closer to either ruling out a theory or homing in on the true value. Perez ended by highlighting three proposed X-ray missions (HEX-P, GRAMS, and IAXO) that could apply this method with more precision, hopefully bringing us closer to understanding the nature of dark matter.
You can read Astrobites’s interview with Kerstin Perez here.
The post AAS 244: Day 4 appeared first on AAS Nova.
]]>
Day 3 of AAS 244! Read on to learn about a rare star system with twin jets and twin disks, challenges to the leading cosmological model, and even a way to measure awe from brain waves during a solar eclipse!
The post AAS 244: Day 3 appeared first on AAS Nova.
]]>Editor’s Note: This week we’re at the 244th AAS meeting in Madison, WI, and online. Along with a team of authors from Astrobites, we will be writing updates on selected events at the meeting and posting each day. Follow along here or at astrobites.com for daily summaries, or follow @astrobites.bsky.social on Bluesky for more coverage. The usual posting schedule for AAS Nova will resume on June 17th.
Table of Contents:
- Helen B. Warner Prize Lecture: The Lives and Deaths of Star Clusters, and the Black Holes they Make along the Way (Carl Rodriguez, University of North Carolina at Chapel Hill)
- Press Conference: More Stars and Distant Worlds
- Plenary Lecture: When Data is Not Enough: Illustrating Astrophysics for the Public (Robert Hurt, Caltech/IPAC)
- Press Conference: Citizen Science from the 2023/2024 Solar Eclipses
- Royal Astronomical Society Gold Plenary Lecture: Challenges to the Cosmological Model (John Peacock, University of Edinburgh)
- Solar Physics Division Harvey Prize Plenary Lecture: Dissipation and Excitation: The Role of Kinetic-Scale Waves and Instabilities in the Evolution of the Solar Wind (Kristopher G. Klein)
Helen B. Warner Prize Lecture: The Lives and Deaths of Star Clusters, and the Black Holes They Make Along the Way, Carl Rodriguez (University of North Carolina at Chapel Hill) (by Catherine Slaughter)
The Wednesday morning plenary lecture was given by this year’s Warner Prize recipient, Carl Rodriguez (UNC Chapel Hill). Rodriguez is a theoretical and computational astrophysicist, whose recent research focuses on the gravitational waves that could be produced by black holes in globular clusters. He opens the lecture emphasizing how our population of observed black holes has changed dramatically since 2015, when LIGO first came online. While gravitational waves have been used to observe a huge number of new black holes, Rodriguez highlighted a smaller set has been identified using radial velocity and (using Gaia) astrometry.
Rodriguez highlighted that newly identified populations often include black holes in the known upper mass gap; there are few black holes found with masses ranging from 65 to 135 times the mass of the Sun. The mass gap is a predicted result of late-stage stellar evolution, when stellar remnants of these masses are torn apart in highly energetic pulsational pair instability supernovae. We simply don’t expect to see isolated black holes of this size. Additionally, the observed astrometric binaries have masses and separations that are largely inconsistent with the expected parameters of common-envelope evolution of isolated binary stars. Rodriguez explained, however, that both of these oddities may be explained by the unique conditions inside globular clusters.
Rodriguez goes on to describe how black holes move throughout a globular cluster. Generally, dynamical friction causes very massive, dense objects to preferentially move toward the center of the cluster over relatively long timescales (~100 million years). Once they’re in generally the same space, black hole binaries can form through three-body system mechanics. In classical Newtonian mechanics, it is not possible for two unbound point particles to enter a bound orbit via standard gravitational interactions — there is simply too much energy in the system. It is possible, however, with the introduction of a third “interloper” star, which experiences a recoil effect, carrying the extra energy away with it. This phenomenon can explain the seemingly strange orbital parameters of the astrometric binaries. The remaining binary is either kicked from the cluster, merges while in the cluster, or gets disrupted by the cluster.
Of course, this all relies on a strong understanding of how globular clusters form in the first place. In order to better understand this, Rodriguez and his research group make use of their Great Balls of FIRE simulations. This project focuses on “daisy-chaining” three types of models. First, a high-resolution cosmological simulation shows how individual molecular clouds form in galaxies. Then, a cloud-collapse simulation takes in that output and models the creation of stars from the material. Finally, an N-body simulation shows how those stars interact and dynamically evolve over time. Their final result is a simulated galaxy, with mass similar to the Milky Way, containing a similar number of globular clusters to the Milky Way. These clusters are shown to have a similar age-alignment relationship to those in the Milky Way, and — most notably — a distribution of black hole masses that includes the upper mass gap. The question then becomes how the simulated mass-gap black holes formed. Rodriguez speaks primarily about two possible mechanisms: black hole mergers and progenitor star mergers.

An image of one of Rodriguez’s slides, outlining the structure of the Great Balls of FIRE simulation. [Slide by Carl Rodriguez]

An image of one of Rodriguez’s slides, showing the output of the Great Balls of FIRE simulation. [Slide by Carl Rodriguez]
You can read Astrobites’s interview with Carl Rodriguez here.
Press Conference: More Stars and Distant Worlds (by Ben Cassese)
Wednesday morning, Madison, Wisconsin. As some clouds gathered over Lake Monona just outside the convention center, a comparatively friendly crowd of attendees of the 244th meeting of the AAS assembled to hear the final research-focused press briefing of the conference. Titled “More Stars and Distant Worlds,” this session had presentations split between individual interesting objects and looks towards future observations.
First up was Mary Barsony, who along with collaborators discovered an unusual and striking pair of young stars using the combined powers of ALMA and JWST. The researchers came upon this rare find after noticing something strange in archival images of a triple star system. Although two of the three members appeared about two million years old, measurements indicated that the third was somehow much younger. A closer look at this outlier revealed that what had previously appeared to be one strange star was actually a tightly bound pair, both of which are spewing out long jets of material. Intrigued, they observed the system again, this time using ALMA. This second look revealed nearly edge-on, skirt-like disks of gas around each star. This unique arrangement is an interesting laboratory to test theories of stellar formation and outflows, and a powerful demonstration of the benefits of combining multiple cutting-edge datasets. [Press release]
Next was Breanna Binder, California State Polytechnic University, Pomona, who jumped beyond the cutting-edge facilities of today and instead spoke about the work required to build the next generation of Great Observatories. The Habitable Worlds Observatory (HWO) currently exists only on paper, but by the 2040s, it should hopefully be a real, gigantic space telescope hard at work discovering and characterizing Earth-like planets. Before engineers and technicians can begin bolting together the observatory, however, astronomers need to figure out exactly where they want to aim the thing and what performance specs they need to achieve their ambitious goals. As part of that effort, Binder and collaborators went through a list of about 200 promising target stars to check which of these were amenable to hosting a habitable planet. They found that about a third of them had previously been observed by X-ray telescopes, and in many cases, these archival observations revealed a disappointing but important reality. Although many of their potential target stars appeared docile in the visible wavelengths, a good portion of them are furiously emitting X-rays that are strong enough to (likely) doom any chance of life emerging on the surfaces of their planets. Her presentation emphasized that while the road to HWO will be long, by the time the telescope reaches the launchpad, it’ll be powered on its journey to space both by not only its rocket but also by decades of planning. [Press release]
Next was Roman Gerasimov, University of Notre Dame, who quickly informed the audience that he is “Paid to figure out where the periodic table came from.” He goes about this substantial task by trying to find ancient brown dwarfs and measure their compositions. Brown dwarfs are too small to sustain nuclear fusion in their cores, which means that after being born bright and hot, they fade and cool over time. If one can find a collection of brown dwarfs that all should be around the same age, say a collection that lives in the same globular cluster, then measure their temperatures, the scientist could use them as “galactic chronometers” to estimate the age of the system. That’s exactly what Gerasimov and collaborators did: using images from JWST, they identified three ancient brown dwarfs in a globular cluster named NGC 6397. These puny, sub-Jupiter-sized worlds are likely among the oldest objects in our galaxy, and also likely are just the first of hundreds of similar discoveries. Gerasimov estimates that just one more set of JWST observations taken about three years from now would reveal hundreds more, since the longer baseline would allow the team to distinguish between members of the cluster and faint objects that happen to lie in front of or behind it.
Finally was Juliette Becker, University of Wisconsin-Madison, who described recent modeling of the “perilous” journey a planet with an ocean must embark on as its star grows old. This journey has elements of a good action movie: in order to reach a happy ending where the planet retains its ocean and travels on a stable orbit around its aging white dwarf, it must survive two distinct challenges. First, as its host expands from a typical main-sequence star into a red giant, the planet must avoid getting engulfed by the suddenly enormous central body (for those curious, when our own Sun becomes a red giant, Mercury and Venus will almost certainly fall prey to the ballooning star, though the jury is still out on whether Earth will similarly suffer). Should it successfully avoid getting eaten, then patiently wait out the star’s inevitable shrinkage from a red giant into a puny white dwarf, the planet will now find itself far too far away and cold for anything liquid to remain on its surface. In order to save its ocean, the planet must be kicked inwards towards the white dwarf by some other object in the system, then survive the resulting high-eccentricity migration and tidal dissipation required to land on a close-in, stable, warm orbit.
Becker has practical motivations for fleshing out the odds of each step in this string of hypotheticals, since planets around white dwarfs are significantly easier to characterize than planets around more generic solar-type stars. That’s because the primary technique astronomers use to measure the atmospheres of close-in planets, the transit technique, returns stronger signals as the radii of the star and planet become more similar. So, Becker and collaborators wanted to assess whether it would be worth our time to put the time into surveying these stars in the first place. Their conclusion? Although an ocean could technically survive the journey laid out above, “it’s not an easy process,” and it’s unlikely that a large portion of white dwarf planets have oceans.
You can view a video recording of this press conference or take a look at the presenters’ slides.
Plenary Lecture: When Data is Not Enough: Illustrating Astrophysics for the Public, Robert Hurt (Caltech/IPAC) (by Will Golay)
Robert Hurt is a researcher at IPAC, an institution based at Caltech that supports four central data archives and 12 different NASA missions. Hurt is a self-described “AstroVizicist,” an expert in visualizing astronomical data for researchers and the public. In his talk, he aimed to motivate the importance of artistic visualization and its role in science communication.
Hurt shows one of the first pieces of acrylic artwork he made early on in his life, an image of a galaxy with several key features aiming to communicate how they are structured. However, Hurt points out that his galaxy painting from 1979 was missing a central bulge region. He noted that this was likely a product of the time: the images of galaxies at the time were being collected on photographic film plates, which would highly overexpose the galaxy’s central regions to have enough sensitivity to capture the lower surface brightness components near the edge. Hurt’s message is that scientific illustration is a sort of hypothesis representing our current understanding of the universe.
To determine if a scientific illustration is successful, we can ask if it is accurate, clear, and, most importantly, amazing. These three components — representing the science, communications, and art “Essential AstroViz Tensions” — can shape how we approach creating a new illustration. In any new science result, there are known facts, known falsehoods, and possibilities consistent with the data but not wholly affirmed. As a scientific illustrator, Hurt aims to capture the most important new known facts of the result, but he also mentions that we can’t possibly know everything. Sometimes, an illustrator must fill in the gaps left behind to paint a complete picture. They might even choose to specifically modify and include some “falsehoods,” such as synthetic colors or rescaling an object so it is visible in the image, to clarify the illustration (trading off accuracy for the value of communication).
Hurt then discusses several case studies of his work and how the scientific illustration process works. In one example, he shows an early image of the Milky Way that resulted in a few inaccuracies as new research emerged. So, he aimed to create a new, better illustration of what our own galaxy might look like to an external observer. Illustrating our galaxy in this way can provide insights that are otherwise challenging to understand with our “inside-out” view of the galaxy. This new image was informed by several scientific results, such as gas simulations, spiral arm models, observations along specific sightlines, and even some unpublished results. The new image ended up being so well-constructed that a feature on the far side of the galaxy, the Scutum-Centaurus Arm of the Milky Way, was so accurate that a different researcher ended up confirming some key details and contacted Hurt because he was concerned he had access to his unpublished data! The artist had simply used some basic symmetries.

The updated illustration of the galaxy incorporates updates to the original image informed by accurate science results. This image is our best guess of the Milky Way’s structure. [Slide by Robert Hurt]
You can read Astrobites’s interview with Robert Hurt here.
Press Conference: Citizen Science from the 2023/2024 Solar Eclipses (by Catherine Slaughter)
Wednesday afternoon brought with it a press conference highlighting citizen science from the 2023 (annular) and 2024 (total) eclipses. Speaking at the conference were Amir Caspi (Southwest Research institute), Angela Des Jardins (Montana State University), Dawn Davies (Hill Country Alliance) and Kate Russo (Being in the Shadow).

Composite image of the solar corona taken by his citizen science teams. The colors indicate the angle of polarization. [Slide by Amir Caspi, photo by Catherine Slaughter]
Next up to the podium was Angela Des Jardins, speaking about her eclipse ballooning project, which aimed to measure the atmospheric response to the eclipse leading up to and after totality. Stratospheric ballooning is a multi-disciplinary endeavor, and is useful because it creates space-like conditions without the need for a rocket. For the eclipse project, two teams of researchers — an atmospheric science team and an engineering team — spent the 24 hours preceding the eclipse and 6 hours proceeding, launching stratospheric weather balloons with weather sensors, accelerometers, cameras, and other student-designed experiments. Her primary goal was to observe atmospheric gravity waves (which, she highlights, are not the same as gravitational waves). The experiment was successful, with the first confirmed observations of eclipse-driven gravity waves. [Press release]
Then Dawn Davies stepped up to speak about her project, LightSound. LightSound is a solar eclipse sonification device, made for those in the blind and low-vision community to better experience eclipses. Leading up to the 2023 and 2024 eclipses, LightSound received more than 2,400 requests for devices internationally. Over the course of eight workshops, 420+ volunteers of a broad range of ages and previous building experience created more than 900 devices for libraries, museums, community task forces, blind and low vision services, national parks, senior centers, and more. The team also set up a live-streamed webinar in conjunction with the American Council for the Blind, which reached an audience of more than 2,500 people. As of now, the LightSound team is looking ahead to the 2026 and 2027 eclipses, and are hoping to implement a haptic feedback feature to the device. [Press release (PDF)]
Finally, Kate Russo took the stage to describe her project, Being in the Shadow. A clinical psychologist by trade and eclipse chaser by hobby, Russo and her collaborators work to observe the feeling of awe inspired by viewing a solar eclipse through brain wave signatures. She defines awe by two specific experiences. The first is vastness, an understanding of something greater than ourselves, and the second is accommodation, the way we re-align our perspectives accordingly. In previous phenomenological research, Russo identifies six experiences that people most often report experiencing during a total eclipse: a sense of wrongness, a primal fear, awe, connected insignificance, euphoria, and a desire to repeat (yielding the appropriately themed acronym “SPACED”). In a pilot project conducted during the 2023 annular eclipse, their primary goal was to simply test the efficacy of the brain-wave mapping technology. What Russo found, however, was that even in a non-total eclipse, they were able to observe awe in every single participant’s data. Looking forward, they are hoping to repeat the experience at the 2028 eclipse in Australia (where Russo primarily works), and possibly extend the project to other astronomical events. [Press release (PDF)]

An image of the panel at the eclipse outreach press conference. Shown (left to right) are Susanna Kohler (at the podium), Angela De Jardins, Dawn Davies, and Kate Russo. Amir Caspi presented from zoom and is not shown. [Photo by Catherine Slaughter]
Royal Astronomical Society Gold Plenary Lecture: Challenges to the Cosmological Model, John Peacock (University of Edinburgh) (by Nathalie Korhonen Cuestas)
Over the course of 67 years, modern cosmology was born and matured into the current standard model, known as Λ cold dark matter (ΛCDM). In his plenary lecture, Dr. John Peacock laid out the history of cosmology, highlighting the measurements that got us to where we are now, explained some of the possible problems with ΛCDM, and outlined how recent results address these challenges.
There’s a plethora of evidence supporting ΛCDM. From redshift measurements of Type Ia supernovae, to the large-scale structure of the universe, to the anisotropies of the cosmic microwave background (CMB), many signs point towards ΛCDM. However, there are some areas of the model that we don’t fully understand — including but not limited to the nature of dark energy and dark matter — and some areas of the model that appear to be in conflict with observations. Peacock touched on four major sources of tension — large-scale streaming velocities, the CMB dipole, Hubble tension, and lensing of the CMB — and focused primarily on the last two.
You may know that the universe is expanding at an ever increasing rate, and the Hubble constant describes the speed of this expansion. There are a number of different ways you can estimate the Hubble constant, but they generally fall into two categories. One method involves measuring the distance to and velocity of distant galaxies. These two quantities are linearly related and the slope of the line can give you the Hubble constant. Alternatively, you can calculate the Hubble constant from the temperature of the CMB, which is very precisely measured. But there’s a problem: these two methods yield different values for the Hubble constant. Typically, Type Ia supernovae or Cepheid variable stars are used to calculate the distance measurements, but, Peacock said, these methods might be introducing unknown systematic uncertainties. He also showed that when a different standard candle (J-region asymptotic giant branch stars in this case), you can get a value for the Hubble constant that more closely agrees with the CMB value.
The second source of tension Peacock discussed was the results from weak gravitational lensing studies. Mass warps spacetime, and this leads to a lensing effect that produces distorted images. If you know what the undistorted image should look like, you can use the distortions to calculate the mass that must have been along the line of sight and produced the lensing. The technique can be applied to the CMB; by measuring distortions in the CMB, you can back out the amount of mass that must have been along the line of sight. Since the CMB is the edge of the visible universe, the mass along the line of sight probes the distribution of mass throughout the universe, which is fundamentally determined by cosmology.
Peacock showed that we do in fact observe slight distortions to the CMB, and the overall distortion is in good agreement with ΛCDM. However, when distortion was broken down into different redshift intervals, astronomers found something different. When only considering the mass at high redshift, the results were consistent with ΛCDM, but this was not the case at lower redshifts, in the local universe. The result might point towards a potential time evolution in ΛCDM, specifically in the dark energy component of the model (that’s the Λ). However, Peacock was careful to emphasize that these results are still in their early stages, and further study is needed before we make any major adjustments to our cosmological models.
You can read Astrobites’s interview with John Peacock here.
Solar Physics Division Harvey Prize Plenary Lecture: Dissipation and Excitation: The Role of Kinetic-Scale Waves and Instabilities in the Evolution of the Solar Wind, Kristopher G. Klein (University of Arizona)
The Karen Harvey Prize is awarded by the Solar Physics Division of the AAS in recognition of significant contributions to solar physics early in one’s career. This year, the award went to Kristopher Klein of the University of Arizona. Klein studies the solar wind — the tenuous plasma that constantly streams out from the Sun and fills the solar system. Because the Sun is by far the closest star to Earth, there are types of data that we can collect from the Sun that we simply can’t get for any other star or distant plasma environment. While Klein jokingly laments that many solar physicists interact not with pretty pictures of the Sun but instead with densely packed plots of particles and electric and magnetic fields, studies of the Sun have far-reaching implications.
Klein’s work uses simulations to understand how energy is transferred within the solar wind plasma. Energy can be transmitted by waves, instabilities, and turbulence, which transfers energy from large spatial scales to small spatial scales. Studying these factors can help researchers understand electron and proton heating, which can in turn help to interpret observations of distant plasma environments, such as the pictures of Sagittarius A*, the supermassive black hole at the center of the Milky Way.
In addition to simulations, solar physicists work with an abundance of spacecraft data: there are currently 20 missions (27 spacecraft in total) capable of making in situ measurements of the solar wind, and 14 more missions are currently being formulated or implemented. Using this fleet of spacecraft, researchers can extract the basic properties of the solar wind and derive more complex parameters, like the plasma beta (the ratio of the thermal pressure of a plasma to its magnetic pressure). Because the plasma beta varies greatly with position in the solar system, different locations within the solar wind can be used as analogs for many different plasma environments across the universe.
Klein expanded on the projects that he and his research team have undertaken to track down the ways in which energy flows within the solar wind. While important advances have been made with existing data and simulations, most current spacecraft missions measure the properties of the solar wind at a single point, taking measurements as the solar wind blows across the spacecraft. (A few missions like the Magnetospheric Multiscale mission involve multiple spacecraft working in tandem.) Klein introduced the upcoming HelioSwarm mission, which will be composed of nine spacecraft that explore the solar wind, magnetosheath, and foreshock on a variety of spatial scales to study these regions in an entirely new way. With new views of the solar wind incoming, we can expect our knowledge of the solar wind and other plasma environments across the universe to increase in leaps and bounds!

A summary of the current (as of 2022) fleet of heliophysics missions. [NASA’s Goddard Space Flight Center]
The post AAS 244: Day 3 appeared first on AAS Nova.
]]>
On Day 2 of AAS 244, we heard about surprising spiral galaxies, the challenges of exoplanet exploration, and the growing importance of AI in astronomy. Read on to learn more!
The post AAS 244: Day 2 appeared first on AAS Nova.
]]>Editor’s Note: This week we’re at the 244th AAS meeting in Madison, WI, and online. Along with a team of authors from Astrobites, we will be writing updates on selected events at the meeting and posting each day. Follow along here or at astrobites.com for daily summaries, or follow @astrobites.bsky.social on Bluesky for more coverage. The usual posting schedule for AAS Nova will resume on June 17th.
Table of Contents:
- Plenary Lecture: Dark and Quiet Skies for the Future of Astronomy and of the Space Environment (Aparna Venkatesan & Teznie Pugh; University of San Francisco and McDonald Observatory, UT Austin)
- Press Conference: From the Galactic Center to the Galactic Disk
- Unlocking the Mysteries of Exoplanets: The Crucial Role of Laboratory Research (Erika Kohler, NASA Goddard Space Flight Center)
- Press Conference: Massive Black Holes and Surprising Spirals
- Plenary Lecture: Leveraging AI to Transform the Astronomy Data Revolution into a Discovery Revolution (Cecilia Garraffo, Center for Astrophysics | Harvard & Smithsonian)
- Plenary Lecture: With a Wild Surmise: A New Era of Exoplanet Exploration (Tom Beatty, University of Wisconsin at Madison)
Plenary Lecture: Dark and Quiet Skies for the Future of Astronomy and of the Space Environment, Aparna Venkatesan & Teznie Pugh (University of San Francisco and McDonald Observatory, UT Austin) (by Will Golay)
Aparna Venkatesan (University of San Francisco) and Teznie Pugh (McDonald Observatory, UT Austin) started the second day of the AAS by discussing the exponentially growing challenges of protecting dark and quiet skies. Venkatesan and Pugh are co-chairs of COMPASSE (Committee for the Protection of Astronomy and the Space Environment), an AAS committee dedicated to preserving the viability of ground-based, orbital, and lunar astronomy.
There are growing threats to astronomy across the electromagnetic spectrum, the most well known being light pollution. A recent paper used citizen science reports of star visibility and found that the reduced number of visible stars can be explained by the sky brightness increasing between 7% and 10% every year for the last 11 years. If this trend continues, the number of visible stars in the night sky will halve every 10 years, an existential threat to ground-based optical astronomy. The impact on major astronomical observatories is also profound. Another recent result showed that about two-thirds of major astronomical observatories have sky brightnesses exceeding the International Astronomical Union’s recommended 10% above natural levels.
However, the threat does not end in the optical or on the ground. Radio-frequency interference is another rapidly growing problem that could wipe out ground-based radio observatories. At the other end of the spectrum, space-based nuclear power could threaten space-based high-energy observatories like Chandra (#SaveChandra). Also in space, the growing number of satellites has posed a major problem for ground-based observation. Eighty percent of all active satellites have been launched in the last four years, and 60% of active satellites are part of the Starlink constellation. As of 29 May 2024, there are 547,267 combined International Telecommunications Union (ITU) & Federal Communications Commission (FCC) applications for new frequency allocations for space-based satellites. The impact of these satellites is manyfold: from increasing the sky brightness, streaking in images, and the impact of launches (which are not yet well known), 500,000 satellites would make ground-based astronomy almost impossible. Given current predictions on satellite launchers, the Vera Rubin Observatory anticipates streaking in 30% of images during twilight hours.

A zoom-in of the radio frequency allocation plot showing the location of the 21-cm line relative to the frequency allocations. The 21-cm line is not a frequency protected for astronomy. [Slide by Aparna Venkatesan and Teznie Pugh]
However, all is not lost! COMPASSE is taking many steps to combat these challenges. COMPASSE provides templates for local ordinances and advocates for dark skies, education, and outreach in local communities. The committee also works with government organizations like the FCC, the Federal Aviation Administration, the US State Department, etc., to provide comments on the impact of new policies on dark and quiet skies. They are increasing awareness by publishing in scientific journals and popular media outlets, and they’ve taken many more steps to begin combating this issue. Venkatesan and Pugh highlighted that the story is not complete yet, and that it is our story to write by getting involved in advocacy for dark and quiet skies.
You can read Astrobites’s interview with Venkatesan and Pugh here.
Press Conference: From the Galactic Center to the Galactic Disk (by Nathalie Korhonen Cuestas)
The first press conference of the day included five different speakers who described their work on Sagittarius A* (Sgr A*) — the supermassive black hole (SMBH) at the center of our galaxy — and its surroundings. Sgr A* gives us a rare chance to study inactive black holes, which are otherwise too faint to observe with much detail.
The first speaker, Grace Sanger-Johnson (Michigan State University), presented X-ray observations of Sgr A*, which were taken over a period of eight years by the NuSTAR telescope. A puzzling characteristic of Sgr A* is that it flares in X-ray wavelengths. Over a period of a couple hours, Sgr A* can become up to 600 times brighter than it normally appears. The origin of these cosmic fireworks is currently unknown, but there are two main hypotheses: the flares could originate from the magnetic fields in plasma very close to the black hole, or they could be the result of a star coming too close to the black hole and losing some of its mass. Sanger-Johnson’s observations show that there is a correlation between the brightness of a flare and the hardness of a flare. Here, “hardness” refers to how much of the light emitted is at shorter, more energetic wavelengths. A harder flare has more energy at shorter wavelengths, and Sanger-Johnson found that harder flares were generally brighter. This correlation could point to two different origins for these X-ray flares: one that produces dimmer, softer flares, and another that produces brighter, harder flares. Further observations of Sgr A*’s flares will help astronomers determine if this is indeed the case. [Press release]
Next up was Jack Uteg, a rising sophomore at Michigan State University. His talk shifted focus from Sgr A* to the ring of molecular gas that resides around 100 parsecs from the galactic center. This gas, known as the central molecular zone (CMZ), can be observed in X-ray, but we know that molecular gas cannot emit at this wavelength by itself. Therefore, these X-rays may have originated from Sgr A*, and are now being reflected by the CMZ. Uteg specifically studies the emission from a region known as the Bridge Cloud. The distance between Sgr A* and the Bridge Cloud means that light takes about 200 years to travel from Sgr A* to the Bridge Cloud, where it can be reflected. This means that any observations of the Bridge Cloud tell us what Sgr A* was up to 200 years ago. Using X-ray observations taken over 24 years, Uteg reconstructed the X-ray emitting history of Sgr A* and found that around 200 years ago, Sgr A* underwent an outburst that made it 100,000 times brighter than it normally is! [Press release]
Continuing with the theme of the CMZ, Dylan Paré (Villanova University) discussed his observations of the magnetic fields in the CMZ. The FIREPLACE (Far-Infrared Polarimetric Large-Area CMZ Exploration) survey used the polarization of light from the CMZ to map the magnetic fields that thread the clouds. Paré found that the magnetic field was preferentially oriented in two directions, and that higher density regions such as The Brick (see the first inset panel in the image below) have more well-aligned magnetic fields. In the galactic disc, the opposite is observed to be true — denser clouds are less likely to have well-aligned magnetic fields. While further analysis of the different regions of the CMZ is needed, it’s possible that the observed magnetic fields are the result of a large-scale magnetic field, running perpendicular to the galactic plane, being sheared by the molecular clouds.

This picture shows you the CMZ, and the inset panels zoom in to the larger image. Radio emission is shown in yellow, emission from warm dust is shown in purple, and emission from cool dust is shown in cyan. The direction of the magnetic field is shown by the white lines. [Paré et al. 2024]
Last but not least was Dr. Anthony Minter (Green Bank Observatory), who discussed his search for dust and molecules in Smith’s high-velocity cloud. High-velocity clouds are clouds that are flying towards the Milky Way, potentially providing the fuel needed to sustain star formation. Clouds in the Milky Way contain different molecules and dust grains, but Smith’s high-velocity cloud was observed to contain no dust or molecules. It could be that the cloud originally did contain dust and molecules, but over time, they became dissociated, or, it could be that the cloud was formed from a pristine environment. In the galactic disc, we know that clouds further from the galactic plane have less dust and molecules. Minter found that clouds near the galactic center have a similar, but steeper gradient. This means that a cloud at the galactic center will have fewer molecules and dust grains than a cloud at a similar height from the galactic plane, but over the galactic disc. These kinds of abundance patterns help us to understand the structure of the Milky Way and potentially help reconstruct the events that determined the evolution of our galaxy. [Press release]
You can view a video recording of this press conference or take a look at the presenters’ slides.
Unlocking the Mysteries of Exoplanets: The Crucial Role of Laboratory Research, Erika Kohler (NASA Goddard Space Flight Center) (by Catherine Slaughter)
This summer’s AAS meeting is a joint session with the Laboratory Astrophysics Division (LAD). As part of this joint meeting, Dr. Erika Kohler (NASA Goddard Space Flight Center) gave Tuesday’s midday plenary lecture. In this talk, Kohler promoted the use of lab-based experiments in astrophysical research and highlighted a number of her group’s projects, including the prep work for the forthcoming Deep Atmosphere Venus Investigation of Noble gases, Chemistry, and Imaging (DAVINCI) mission.
The talk starts out posing a question that motivates much of the work we do as scientists: “We found it, why not study it?” Kohler describes how recent technological innovation has allowed us to develop advanced spacefaring probes and respond to this question using in situ measurements of solar system planets. The catch, she notes, is that even the most advanced tech could not make in situ measurements of exoplanets. From this, Kohler outlines her talk’s key takeaways: that lab research is fundamental and complements all other astrophysics work, and that (given the cross-disciplinary nature of exoplanet research) communication pathways and user engagement propel us forward. To underscore these ideas she gives two examples from her own research.
The first comes from a study of cloud formation in exoplanet atmospheres. Solar system planets, Kohler explains, represent a very limited region of possible exoplanet parameters, especially in terms of atmospheric pressure and temperature. “If you’re only designing experiments to describe [the solar system planets],” she says, “you’re missing a whole universe out there.” In the project, Kohler and her team used lab-based experiments to recreate the very extreme atmospheric environments found on distant exoplanets. Their goal was to experimentally determine saturation vapor pressure curves — mathematical descriptions of the pressures and temperatures at which a given material will form clouds — for a number of known and expected molecules in exoplanet atmospheres. The preexisting curves were created using calculations based on Earth-like conditions. They found that the heights at which clouds form in a given atmosphere are different in extreme environments, which changes our interpretation of possible exoplanet atmosphere observations. This is a result that could only be reasonably obtained in a lab setting.

A slide from Kohler’s talk, showing the orbital distance–mass parameter space scatter plot for identified exoplanets at present. [Slide by Erika Kohler]

A slide from Kohler’s talk showing a sprawling graph-map diagram of the many features studied in exoplanet research. [Slide by Erika Kohler]
Press Conference: Massive Black Holes and Surprising Spirals (by Kerry Hensley)
Fan Zou (Penn State University) opened the afternoon press conference with a discussion of supermassive black hole growth. Despite nearly all massive galaxies having supermassive black holes, it’s still not known exactly how these objects get so massive. Accretion and mergers are the two possible growth mechanisms, and researchers need to understand both processes to reconstruct the growth history of black holes. Zou explained that astronomers study black hole accretion through X-ray observations, and they study mergers through supercomputer simulations. Combining results from Chandra X-ray Observatory, eROSITA, and XMM-Newton — three premier X-ray observatories — with output from the IllustrisTNG simulations, Zou’s team found that accretion played a larger role in black hole growth than mergers did under most circumstances. The growth rate due to both mechanisms was higher in the early universe, although the two mechanisms have declined at different speeds. Today, mergers play a larger role relative to accretion than in the early universe. [Press release]

Illustration of a quasar with outflowing winds. The spectra at the top right shows how the absorption line has shifted to bluer wavelengths over time. [NASA/CXC/M. Weiss, Catherine Grier and the SDSS collaboration]
Next, Riccardo Arcodia (MIT) presented a study on massive — not supermassive! — black holes in low-mass galaxies. Studying these somewhat-less-than-supermassive black holes in the nearby universe can help researchers understand how supermassive black holes grew from lower-mass seeds in the early universe. Accreting black holes emit light across the electromagnetic spectrum and can be highly variable, so Arcodia’s team searched for low-mass galaxies that are variable in the optical and infrared to identify candidate massive black holes. Of the 200 candidate massive black holes, only 17 emitted X-rays. This result is unexpected because accreting supermassive black holes are extremely luminous in X-rays, and the team estimated that X-rays from the black holes in their sample should have been detectable. This might mean that lower-mass black holes have a different accretion mode compared to supermassive black holes, possibly because of the lower gravity, clumpier interstellar medium, or other factors. [Press release]
Lastly, Vicki Kuhn (University of Missouri Columbia) presented some new results from JWST on spiral galaxies. Previous studies using the Hubble Space Telescope have found that there are very few spiral galaxies earlier than a redshift of z = 2, which corresponds to when the universe was just a few billion years old. Kuhn’s team identified 873 galaxies with high stellar mass and redshifts between 0.5 and 4 in observations from JWST, which can look farther back in time than Hubble can. A team of six researchers visually classified each galaxy in the sample as spiral or not, and they found that JWST sees more spirals than Hubble did, especially at low redshift. To account for the fact that spiral structure is harder to discern at high redshift, Kuhn’s team created a sample of mock high-redshift galaxies. After determining how redshift affects the fraction of galaxies in which spiral structure is visible, the team found that about 30% of galaxies are spirals out to a redshift of z = 3. This is far more spirals than found in previous studies, suggesting a need to recalibrate our expectations for when and how spiral structure formed in early galaxies. [Press release]
You can view a video recording of this press conference or take a look at the presenters’ slides.
Plenary Lecture: Leveraging AI to Transform the Astronomy Data Revolution into a Discovery Revolution, Cecilia Garraffo (Center for Astrophysics | Harvard & Smithsonian) (by Will Golay)
Cecilia Garraffo is a researcher at the Center for Astrophysics | Harvard & Smithsonian and the director of AstroAI. She is an expert in machine learning (ML) and artificial intelligence (AI) data analysis methods. She has developed novel techniques for using machine learning to uncover unique and exciting results from large astrophysical datasets. In her talk, she aimed to highlight what AI can contribute to research in astrophysics.
Garraffo motivated the need for AI methods by reminding us of an important point: although we are building massive observatories that will be coming online in the next five to ten years, are we, as a community, prepared for the immense data influx that will ensue? Once observatories like the Vera Rubin Observatory and the Square Kilometre Array begin observing, we will generate more data in one year than all currently existing astrophysical data. We are entering the era of petabyte astrophysics, an era we are not yet prepared to begin. The data volumes are not the only consideration: as astrophysics research becomes increasingly multi-wavelength and multi-messenger, causing datasets to become heterogeneous, it is even more critical that we have methods that can unify the picture and maximize the scientific value of such unique datasets.
AI is one tool we can apply to begin preparing for the upcoming massive influx of data. Garraffo argues that AI has the unique ability to search for patterns and classes intentionally (even if we don’t know what those patterns are a priori), enabling a chance for discovery spaces that would otherwise be inaccessible in smaller datasets. Even the most basic dimensionality reduction and clustering methods have successfully identified new anomalies in large datasets that we can later follow up on.
How exactly do we execute such a search using ML methods? The astronomy community needs experts in AI to help develop strategies specific to our kind of data. Astronomical data often differs from the data used to train large language models (LLMs) in several ways. Our data are biased and complex, could be multimodal, almost always incomplete, and undoubtedly sparse. To address these issues, we need to take specific steps to prepare our data and our ML models, which require user expertise in identifying methods and successfully applying them in the context of astrophysical research.
Garraffo then shared several examples of how AI has been used in various research contexts inside the AstroAI collaboration. One particularly striking example she shared was using ML methods to generate new “realistic” images of a black hole accreting material for comparison with images from the Event Horizon Telescope (EHT). Since general relativistic magnetohydrodynamic simulations are costly to run, we can use ML methods to interpolate between the model’s parameters. In the case of EHT, they are interested in using these methods to generate images of a black hole with differing spins, significantly affecting how the accretion will appear in EHT images.

A slide from Cecilia Garraffo’s presentation showing two images of a black hole that were generated by simulation and one image that was generated from ML methods. Garraffo is illustrating that the human eye is not well suited to distinguish between these cases. [Photograph by Will Golay]
You can read Astrobites’s interview with Cecilia Garraffo here.
Plenary Lecture: With a Wild Surmise: A New Era of Exoplanet Exploration, Tom Beatty (University of Wisconsin at Madison) (by Jessie Thwaites)
Wrapping up today’s talks was Dr. Tom Beatty, whose plenary lecture explored exoplanets, specifically how we can classify them. We already know of more than 5,600 exoplanets, and that number just keeps growing! He discussed how we can measure a planet’s atmosphere to learn how exoplanets form, explore what makes a planet habitable, and search for signatures of water and oxygen that would be necessary to support life.
The attempt to classify exoplanets is multifaceted, he says, including searching for trends in their mass, gravity, age, metallicity, clouds, specific elemental abundances, and more. But these quantities have complicated relationships; for example, he discusses how ambiguity in cloud models on the planet’s surface can change the abundance measurement we get. These measurements of the spectra of these planets are made via transmission (seeing the spectral lines that appear when the planet passes in front of its star) and emission (seeing the spectral lines than disappear when the planet passes behind its star).
Central to the themes of his talk were how improvements in technology have made these detailed and accurate measurements possible. Initially, these measurements were done with the Spitzer Space Telescope, and massively improved upon with the Wide Field Camera 3 instrument on the Hubble Space Telescope, which allowed for more precise and spectroscopic measurements. And now, with JWST’s improved sensitivity, we can measure carbon and oxygen molecules in exoplanet atmospheres for the first time, get spectroscopic measurements of clouds, and even search for signatures of life on exoplanets!

New questions about our understanding of exoplanets, and properties of exoplanets that are currently being studied. [Slide by Tom Beatty]
You can read Astrobites’s interview with Tom Beatty here.
The post AAS 244: Day 2 appeared first on AAS Nova.
]]>
Day 1 of AAS 244: dozens of newly discovered supernovae, a hypervelocity star in the Milky Way, the Sun's impact on Earth's climate, and much, much more!
The post AAS 244: Day 1 appeared first on AAS Nova.
]]>Editor’s Note: This week we’re at the 244th AAS meeting in Madison, WI, and online. Along with a team of authors from Astrobites, we will be writing updates on selected events at the meeting and posting each day. Follow along here or at astrobites.com for daily summaries, or follow @astrobites.bsky.social on Bluesky for more coverage. The usual posting schedule for AAS Nova will resume on June 17th.
Table of Contents:
- Fred Kavli Prize Plenary Lecture: UNCOVERing Astronomical Gems from Our Backyard to the Edges of the Observable Universe (Rachel Bezanson, University of Pittsburgh)
- Press Conference: Disks, Atmospheres, and Astronomy from the Moon
- Plenary Lecture: Ices in Our Backyard: Searching Ices in the Solar System with JWST (Noemi Pinilla-Alonso, Florida Space Institute)
- Press Conference: Stars and Their Antics
- Plenary Lecture: The Broad Legacy of George Ellery Hale: Observatories, Institutions, and Civic Development (Sam Hale, Alliance of Historic Observatories)
- Solar Physics Division George Ellery Hale Prize Lecture: Solar Irradiance: Earth’s Energy Source (Judith Lean, University of Colorado)
Fred Kavli Prize Plenary Lecture: UNCOVERing Astronomical Gems from Our Backyard to the Edges of the Observable Universe, Rachel Bezanson (University of Pittsburgh) (by Nathalie Korhonen Cuestas)
JWST has pushed our cosmic horizons well beyond what we could previously observe. Its incredible sensitivity, instrument suite, and wavelength coverage makes it excellent at observing previously invisible distant galaxies. These early galaxies can help us understand how galaxies form stars, when they stop growing so rapidly, and how a central supermassive black hole might affect galaxy growth. During this year’s Fred Kavli Plenary Lecture, Prof. Rachel Bezanson discussed how her JWST program UNCOVER is helping us answer these questions.

This diagram shows how a massive galaxy cluster can bend the light rays coming from a more distant galaxy, resulting in magnified images. Click to enlarge. [NASA, ESA & L. Calçada; CC BY 4.0]
By observing galaxies which have been lensed by a massive galaxy cluster Abell 2744 (also known as Pandora’s cluster), Prof. Bezanson is challenging our previous assumptions about galaxy evolution. Many of the galaxies she’s observed are very massive — they can be as massive as the Milky Way, yet their age is just 3% of the age of the universe — and have signatures of evolved stellar populations in their spectra. Some also have supermassive black holes that are much more massive than we’d expect. Our models for galaxy evolution have to be able to explain how these galaxies and their black holes have grown so large, so quickly. Further JWST observations and development of our theoretical models will begin to answer long-held questions and bring up new ones.
You can read Astrobites’s interview with Rachel Bezanson here.
Press Conference: Disks, Atmospheres, and Astronomy from the Moon (by Kerry Hensley)
The first presentation of the AAS 244 press conference series, given by Lisa Prato (Lowell Observatory), tackled the topic of circumstellar disks. Circumstellar disks occur naturally during star formation, forming when a swirling cloud of gas collapses and creates one or more stars. These disks are the sites of planet formation and dissipate after roughly 10 million years, although the time frame can be far shorter. It’s not yet known what sets the lifetime of a circumstellar disk. To learn more, Prato’s team studied planet-forming disks around binary stars. Stars in a binary system have the same age, composition, and radiation environment. Differences in the disks around these stars can then be traced to differences in the stellar properties, such as mass and rotation rate. Prato’s team used the Keck Observatory and the Atacama Large Millimeter/submillimeter Array (ALMA) to observe the circumstellar disks of the FO Tau and DF Tau binary systems. The two stars of FO Tau each had a tidy circumstellar disk and appeared similar in the data from both observatories. Keck data suggested that one star in the DF Tau system lacked a disk, but ALMA showed something different: the secondary star in the system has a disk with a large gap in the middle! Prato proposed that a possible misalignment of the secondary star’s disk could be related to the formation of the cavity. [Press release]

Demonstration of how Beta Pictoris’s spectrum has changed between the Spitzer observations 20 years ago and the recent JWST observations. Click to enlarge. [Roberto Molar Candanosa/Johns Hopkins University, with Beta Pictoris concept art by Lynette Cook/NASA]
Moving from planet formation to fully formed planets, Thomas Beatty (University of Wisconsin-Madison) presented new JWST observations of a sub-Neptune exoplanet named GJ 3470 b. Astronomers can compare the composition of exoplanet atmospheres to the composition of protoplanetary disks to understand the planet-formation process, much like a baker might try to discern the steps needed to make a finished cake from a list of ingredients. Astronomers have mostly looked for carbon and oxygen in exoplanet atmospheres over the last two decades, but there are many other ingredients to look for. Using JWST to observe GJ 3470 b, Beatty’s team found water, methane, carbon monoxide, carbon dioxide, and a surprising compound: sulfur dioxide. Sulfur dioxide has been seen in the atmosphere of another exoplanet, WASP-39b, which is twice as hot and a hundred times more massive than GJ 3470 b. The researchers didn’t expect to find so much of this molecule in the atmosphere of a small and cool exoplanet — in fact, the planet’s atmosphere contains more than a million times more sulfur dioxide than expected. Sulfur dioxide is a major new ingredient that can be used to trace the formation of small sub-Neptune exoplanets, which are one of the most common types of planets. [Press release]

“Selfie” by ROLSES showing the prematurely deployed antenna, circled. [Intuitive Machines]
Plenary Lecture: Ices in Our Backyard: Searching Ices in the Solar System with JWST, Noemi Pinilla-Alonso (Florida Space Institute) (by Will Golay)
Noemí Pinilla-Alonso, a planetary science professor at the Florida Space Institute and the University of Central Florida, gave the final talk of the inaugural morning of AAS 244. In her talk, she described the different kinds of ice in our solar system and discussed what they can tell us about the formation of planetary systems and their relationship to the interstellar medium and molecular clouds.
Ices in our solar system encode information about various stages of its formation history. The most distant objects, broadly categorized as “trans-Neptunian objects” (TNOs), span a spectrum of ice histories. Some of these dirty, icy bodies never melted and thus trace the conditions of the solar nebula. Others have undergone some melting and differentiation; observations of these objects can probe the process of planetary growth and the diffusion of molecules throughout the solar system.
Although TNOs can provide many insights into the solar system’s formation (and the formation of planetary systems in general), they have remained largely unexplored because they are often small and distant, making detailed photometric and spectroscopic studies challenging. Pinilla-Alonso highlighted how JWST, the premier space telescope for infrared observations, will uncover the secrets of our most distant solar system members with its unprecedented spectroscopic capabilities.

A slide from Noemí Pinilla-Alonso’s plenary lecture showing examples of the three spectral groups of trans-Neptunian objects: bowl, double-dip, and cliff-type. Click to enlarge. [Slide by Noemí Pinilla-Alonso]

A slide from Noemí Pinilla-Alonso’s plenary lecture showing how the three spectral classes of trans-Neptunian objects may represent a transition in the distance at which these objects formed from the central star in the protoplanetary disk. Click to enlarge. [Slide by Noemí Pinilla-Alonso]
You can read Astrobites’s interview with Noemí Pinilla-Alonso here.
Press Conference: Stars and Their Antics (by Ben Cassese)
In the afternoon, attendees once again filed into the press briefing room ready to consume another round of news-worthy astronomy research. This session, titled “Stars and Their Antics,” contained talks on individual weird stars, the motions of enormous clusters, and some of the earliest explosions in the universe.
Up first was Adam Burgasser, University of California San Diego, who set the tone with a presentation on a newly discovered speedy star. This object, initially flagged through the citizen science program “Backyard Worlds: Planet 9” doesn’t provide observers the strongest first impression. It’s dim, red, and at only 8% the mass of the Sun with a surface temperature of about 2000K, it easily fits into the “L subdwarf” category of diminutive stars. But, what it lacks in presentation it more than makes up for with pep. Burgasser and colleagues clocked in moving at more than 100 km/s along the line of sight and more than 450 km/s in total. That’s more than a million miles an hour, or so fast that this star has a good chance of escaping the Milky Way altogether. So far the team is not sure how this star got so fast: it may have been kicked around by a supernova, or scattered off a black hole, or it could have fallen in from a satellite galaxy. However it got started, though, it won’t be around for long (cosmically speaking), and the researchers hope that additional measurements can help reveal both where it came from and where it’s going. [Press release]
Up next was Janus Kozdon, a graduate student at Clemson University, who told the assembled audience about his work on a protoplanetary disk with a mysterious line profile. After models of the disk failed to provide a good fit, Kozdon and collaborators realized they could reproduce what they were seeing by considering not just one disk of emitting material, but a pair of two concentric ones. They landed on a best-fitting solution with two nested, eccentric disks, aligned so that their long axes face perfectly away from one another. This eccentricity was likely induced by a baby planet still in the process of growing and forming, a rare and exciting find. [Press release]

Illustration of the symbiotic nova system HM Sagittae. [NASA, ESA, Leah Hustak (STScI)]
Sankrit was followed by Cameren Swiggum (whose hometown is Madison, WI!) from the University of Vienna. Swiggum and collaborators used data from the Gaia spacecraft to trace the trajectories of the nearest, youngest star clusters backwards in time. The team found that, intriguingly, the clusters seem to converge on three distinct but nearby locations about 30 million years ago. These locations must have been huge, dense, chaotic regions that spawned numerous stars quickly. These conditions are ideal for forming large stars that live fast and die young, and the team estimates that there could have been more than 200 supernovae caused by stars born in these progenitor clusters. [Press release]

Three examples of transients discovered through the JADES program. [NASA, ESA, CSA, STScI, Christa DeCoursey (University of Arizona), JADES Collaboration]
Plenary Lecture: Plenary Lecture: The Broad Legacy of George Ellery Hale: Observatories, Institutions, and Civic Development, Sam Hale (Alliance of Historic Observatories) (by Catherine Slaughter)
Each year, the American Astronomical Society’s Solar Physics Division (SPD) awards the George Ellery Hale Prize to “a scientist for outstanding contributions to the field of solar astronomy.” On Monday, to preface the AAS 244 Hale prize talk, Sam Hale, grandson of George Ellery Hale, gave a lecture highlighting his grandfather’s work and multifaceted legacy of astronomical research and the advancement of the sciences in the United States. Sam himself is not an astronomer, but he presently serves as the CEO and Board Chairman for the Mount Wilson Observatory. He is also a founding member of the Alliance of Historic Observatories, an international consortium of famed astrophysics research sites.

Yerkes Observatory, when it first opened in 1987. [Slide by Sam Hale]
Interwoven with stories of his grandfather’s achievements, Hale featured many of the significant scientific discoveries made by other astronomers using the resources GEH worked to build. Of particular note is Edwin Hubble’s work on Mount Wilson, where he took the observations of distant galaxies that became our foundational evidence that the universe is expanding.
At the end of the session, Hale left the audience with the reminder that it was his grandfather’s “insatiable curiosity” that drove him through life — a curiosity that continues to benefit the field to this day.
Be sure to take a look at our interview with speaker Sam Hale for more!
Solar Physics Division George Ellery Hale Prize Lecture: Solar Irradiance: Earth’s Energy Source, Judith Lean (University of Colorado) (by Jessie Thwaites)

Slide showing the total solar irradiance, along with the presence of faculae and sunspots. Click to enlarge. [Slide by Judith Lean]
The solar irradiance is the radiative output of the Sun, which is inherently interconnected with Earth’s atmosphere and climate. The Sun undergoes an 11-year cycle, which determines how much power is emitted. It can have any number of sunspots, which decrease the Sun’s irradiance, or bright faculae, which do the opposite. The irradiance is driven by the magnetic structure of the Sun, and Dr. Lean has developed a model of the Sun’s dynamo to understand these fluctuations. That model, based on 40 years of observations of the Sun, helps us to understand the cycles of the Sun (in addition to the 11-year cycle, it also undergoes a 27-day cycle due to its rotation, a 100-year cycle, and a 2,400-year cycle that are able to change the amplitude of the minima and maxima for the cycle), and predict the Sun’s activity for the future.

Slide showing the contributions to global surface temperature changes. Click to enlarge. [Slide by Judith Lean]
The post AAS 244: Day 1 appeared first on AAS Nova.
]]>
This week we’ll be bringing you updates from the 244th AAS meeting happening in Madison, WI.
The post AAS 244: Welcome! appeared first on AAS Nova.
]]>This week, AAS Nova and Astrobites are attending the American Astronomical Society (AAS) summer meeting in Madison, WI, and online.
AAS Nova Editors Kerry Hensley and Susanna Kohler and AAS Media Fellow Ben Cassese will join Astrobites Media Intern Nathalie Korhonen Cuestas and Astrobiters Will Golay, Catherine Slaughter, and Jessie Thwaites to live-blog the meeting for all those who aren’t attending or can’t make it to all the sessions they’d like. We plan to cover all of the plenaries and press conferences, so follow along here on aasnova.org or astrobites.org! You can also follow Astrobites on Bluesky at astrobites.bsky.social for more meeting content.
Where can you find us during the meeting? We’ll be at the Astrobites booth in the Exhibit Hall all week — stop by and say hello! You can also find Kerry, Susanna, and Ben at the press conferences Monday through Wednesday. AAS press conferences are open to all, and they can also be viewed on the AAS Press Office YouTube channel for anyone not attending the meeting.
Finally, you can read the currently published AAS 244 keynote speaker interviews here. Be sure to check back all week as the remainder are released!
The post AAS 244: Welcome! appeared first on AAS Nova.
]]>
The AAS publishing team is excited to engage with the community at the upcoming AAS meeting. Check out what they'll be up to at the meeting!
The post AAS Publishing at AAS 244 in Madison appeared first on AAS Nova.
]]>AAS 244 is nearly here! The AAS Publishing team looks forward to connecting with meeting attendees in Madison, WI, and we’re excited to share a preview of upcoming publishing-related events. Attending the meeting will be Julie Steffen (AAS Chief Publishing Officer), Ethan Vishniac (AAS Journals Editor in Chief), Gus Muench (AAS Journals Data Editor), and Katie Merrell (AAS Journals Data Editor). Several of the editors of the AAS journals, including Fred Rasio (Editor of the Astrophysical Journal Letters) and Steve Kawaler (Lead Editor of the Stars and Stellar Physics research corridor) will be in attendance as well. Be sure to stop by the AAS booth in the Exhibit Hall to say hello, chat about the journals, have your data questions answered, and pick up some swag!
AAS Nova Editors Kerry Hensley and Susanna Kohler, AAS Media Fellow Ben Cassese, Astrobites Media Intern Nathalie Korhonen Cuestas, and the rest of the Astrobites team will also be available periodically at the Astrobites booth in the Exhibit Hall.
Open Science at AAS 244
Note: The following section contains links to the AAS 244 block schedule. You must be logged in for these links to direct you to the correct session; otherwise, they will take you to the main block schedule page.
On Tuesday, an oral session on outreach and education will take place in Ballroom D from 2:00 to 3:30 pm CDT. One of the talks in this session will introduce a recent special issue of the Bulletin of the American Astronomical Society that provides “eclipse science and investigations, resources for safe viewing, astrophotography, education tools and resources, personal reflections, peer-reviewed papers, explorations of individuals’ reactions to solar eclipses, descriptions of events, and discussions of logistics” for the three most recent solar eclipses to cross North America. As a bonus, this session also includes a talk by Tom Rice (AAS Education Specialist) on eclipse-related outreach to Deaf, hard-of-hearing, and signing audiences.
On Wednesday, be sure to attend the Astrophysics and Open Science splinter session. This session will bring together members of the NASA Astrophysics Division and the NSF on a panel to speak on NASA and NSF efforts to enable Open Science and take questions on this topic. You can submit your questions ahead of time; the link to submit questions is available in the abstract linked above. The session will take place 11:00 am – 12:30 pm CDT in the Hall of Ideas I.
The post AAS Publishing at AAS 244 in Madison appeared first on AAS Nova.
]]>
New research uses ultra-precise measurements from the Gaia spacecraft to track down and study runaway stars in the Small Magellanic Cloud.
The post Stars on the Run appeared first on AAS Nova.
]]>A substantial number of O and B stars say goodbye to their birth clusters and spend their lives zooming through space alone. New research uses the most recent Gaia data to investigate the properties of these runaway stars.
Massive Stars Far from Home
OB stars are typically born in clusters, like the Trapezium Cluster at the heart of the Orion Nebula, shown here. [ESO/IDA/Danish 1.5 m/R.Gendler, J.-E. Ovaldsen, and A. Hornstrup; CC BY 4.0]
Stars can be ejected from their birth clusters by dynamical interactions or supernova explosions. Dynamical ejection happens when stars in a crowded cluster pass too close to one another, slingshotting one or more stars into space. A star that explodes as a supernova can expel its close binary companion from the cluster. In rare cases, the exploding star and its companion can escape the cluster together. It’s not yet known which process creates more runaway stars or how the two populations of runaways differ.
Vectors showing the motion across the sky of the stars in the authors’ sample. Eclipsing binaries (EB) and double-lined spectroscopic binaries (SB2) were ejected dynamically. High-mass X-ray binaries (HMXB) have experienced a supernova. Click to enlarge. [Phillips et al. 2024]
A Search for Runaway Stars
Diving into this question, a team led by Grant Phillips (University of Michigan) investigated more than 300 potential runaways in a nearby dwarf galaxy, the Small Magellanic Cloud. The stars in their sample were chosen for being at least 90 light-years from other OB stars (with the exception of stars in binary systems, which may have escaped their home cluster together).
The binary systems in the sample immediately gave away how they were launched into space: binary systems that don’t contain a neutron star or a black hole can’t have experienced a supernova — those binaries must have been kicked out of their clusters through dynamical interactions. Binary systems that do contain a neutron star or a black hole must have experienced a supernova. As for solo runaway stars, the team’s earlier research suggested that typical OB stars tend to be expelled through dynamical interactions, while stars with emission lines in their spectra due to rapid rotation — OBe stars — tend to be ejected by supernovae.
Population Comparison
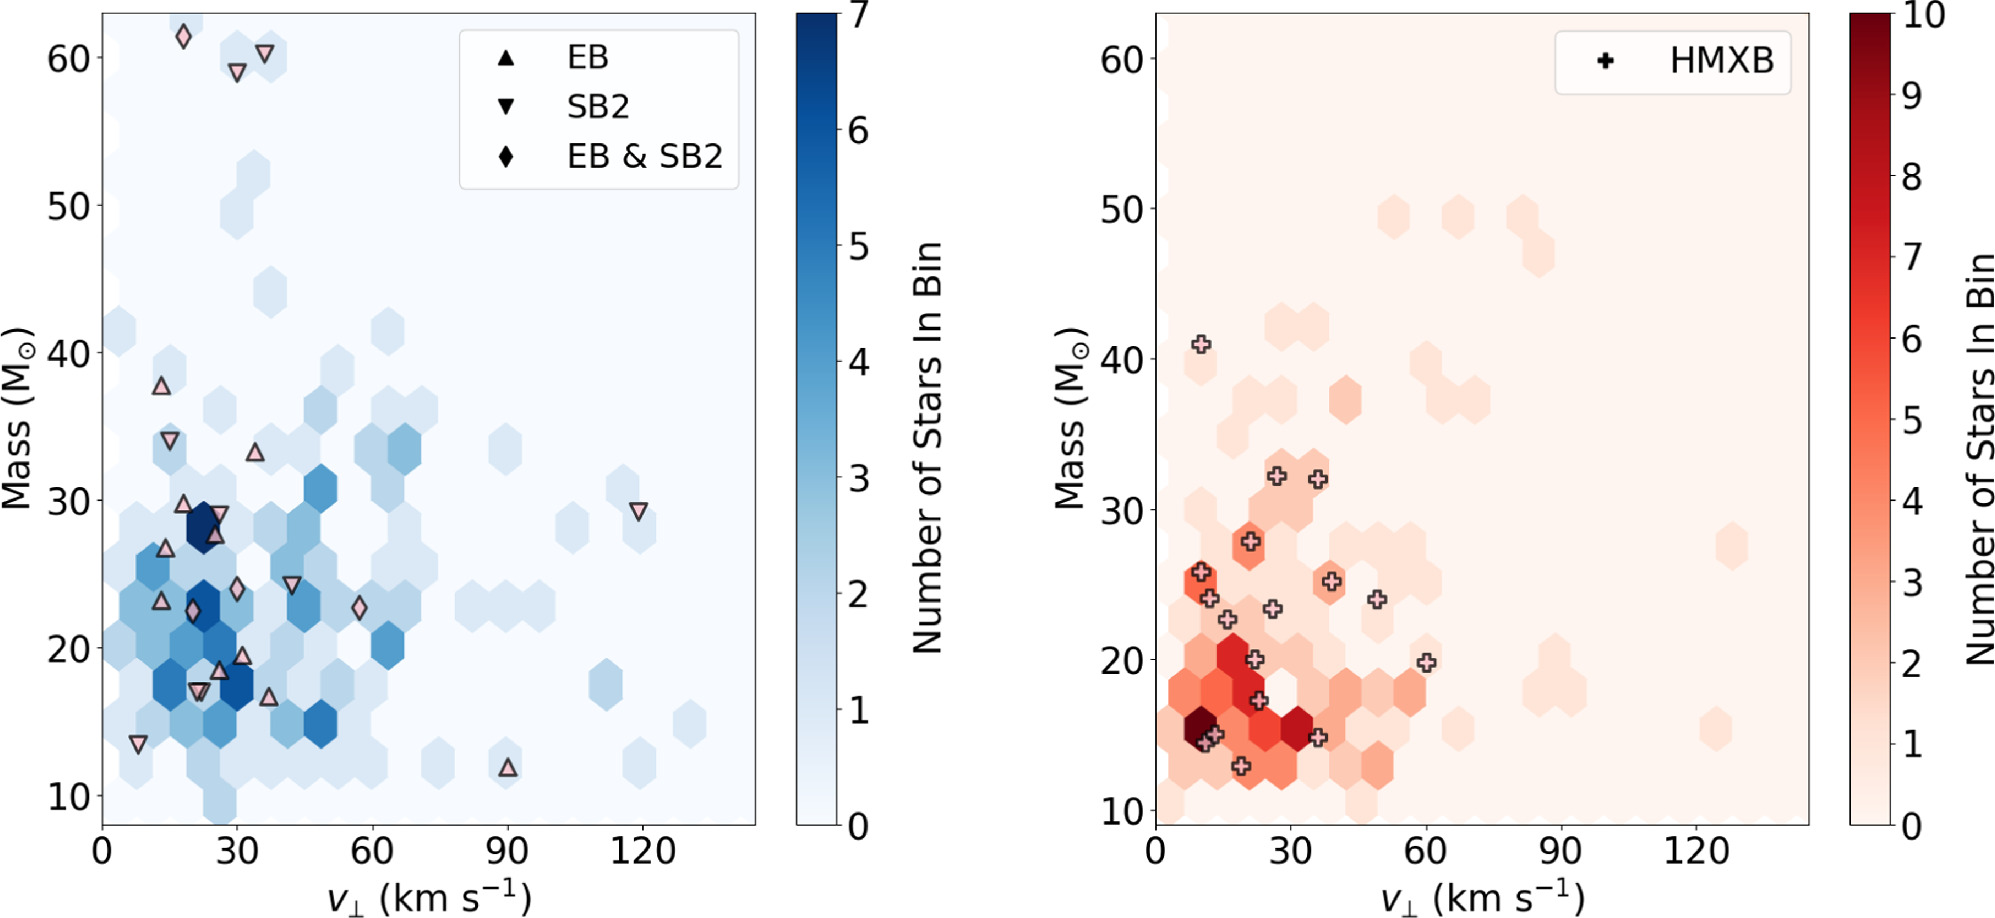
Mass and velocity distributions for stars ejected dynamically (left) and via supernovae (right). Click to enlarge. [Phillips et al. 2024]
The velocities of typical OB stars are similar to the velocities of binary systems ejected dynamically, supporting the hypothesis that these stars are also ejected this way. Intriguingly, the velocity distribution for typical OB stars may have two peaks. The authors speculate that the peaks could point to two groups of dynamical interactions: stars ejected by just a single other star versus stars ejected by a binary system.
Underpinning these findings is the rich, precise dataset from Gaia, which allowed the team to identify systematic offsets from their previous work based on earlier data releases from the spacecraft. Hopefully, future data releases can give even more clues to the origins of these runaway stars!
Citation
“Runaway OB Stars in the Small Magellanic Cloud. III. Updated Kinematics and Insights into Dynamical versus Supernova Ejections,” Grant D. Phillips et al 2024 ApJ 966 243. doi:10.3847/1538-4357/ad3909
The post Stars on the Run appeared first on AAS Nova.
]]>
Astrobites reports on the never-seen-before optical emission shell around the CI Camelopardalis X-ray binary system.
The post The Unexpected Findings of an Emission Shell appeared first on AAS Nova.
]]>Editor’s Note: Astrobites is a graduate-student-run organization that digests astrophysical literature for undergraduate students. As part of the partnership between the AAS and astrobites, we occasionally repost astrobites content here at AAS Nova. We hope you enjoy this post from astrobites; the original can be viewed at astrobites.org.
Title: Discovery of an [O III] Emission Shell Around the X-ray Binary CI Cam
Authors: Robert Fesen et al.
First Author’s Institution: Dartmouth College
Status: Published in RNAAS
From Be Star to X-ray Binary
Among the spectral classes of normal stars that we know and love, there is one particularly eccentric type called the Be stars. Unfortunately, no, the “e” there does not stand for eccentric. Much like the B-type stars, Be stars are incredibly hot and massive objects. However, what sets them apart is the notable presence of excess emission features in their spectral profiles, in contrast with the absorption lines typically seen in the spectra of regular B stars. Thus, the “e” stands for emission.
Our star today, CI Camelopardalis (CI Cam), was initially cataloged as a Be star, but when it was later found that the spectrum was particularly rich in forbidden emission lines, it was reclassified as a B[e]star. The brackets designate the forbidden lines that come from an improbable transition between metastable energy levels in atoms or ions, which can only be observed in low-density astrophysical environments. As an example of this notation, the doubly ionized oxygen forbidden line is written as [O III].

Figure 1: Artist’s illustration of an X-ray binary system that consists of a normal star and a compact object. The gravity of the compact object pulls matter off the normal star creating an accretion disk, shown in blue. [European Space Agency, NASA and Felix Mirabel (the French Atomic Energy Commission & the Institute for Astronomy and Space Physics/Conicet of Argentina)]
The Discovery
In a serendipitous finding, today’s authors uncovered a previously unknown shell of emitting gas surrounding the CI Cam system. This shell, spanning about 8 arcminutes by 12 arcminutes on the sky, is brightest in the forbidden [O III] emission line at 5007 Angstroms (within the optical or visible light regime). The discovery unfolded from the optical data of the large supernova remnant G150.3+4.5 (G150) that was observed as part of a limited wide-field imaging survey of optical emission associated with galactic remnants. This survey was led by Robert Fesen from Dartmouth College (the first author of today’s article). The emission shell was spotted adjacent to the remnant’s filaments along its northwestern edge (see Figure 2).

Figure 2: Composite image showing the emission shell around CI Cam and the western portion of the galactic supernova remnant G150.3+4.5. Blue represents the [O III] emission and red represents the Hα emission. [Adapted from Fesen et al. 2024]

Figure 3: Monochromatic images of the emission shell around CI Cam as seen in [O III] (top) and in Hα (bottom). [Adapted from Fesen et al. 2024]
Due to the similarity in [O III] brightness between the shell and the supernova remnant G150’s filaments, their close proximity raised the question of a potential physical association between the two objects. However, the authors found no direct evidence in the morphology linking the shell to the remnant on the imaging data. They also took into account the available distance estimates for G150 derived from radio and γ-ray observations, which suggested a much closer distance compared to CI Cam. The authors argued that if G150 were actually at CI Cam’s distance, it would have to be a much larger and more ancient supernova remnant, which seems highly unlikely given its bright optical filaments that suggest a relatively young age. The authors then concluded that the apparent proximity of the shell to G150 is likely just a chance alignment with Cl Cam.
While X-ray binaries are primarily studied in the X-ray, optical observations offer a complementary perspective, helping us to understand the details of the binary’s interactions with its surrounding medium. That the size of the emission shell around CI Cam is comparable to those created by powerful Wolf–Rayet stars provides evidence for the strong stellar winds and the transient outburst that CI Cam has unleashed over an extended period. This, in turn, promises to shed light on the mass-loss mechanisms and accretion processes in this class of objects. This discovery not only highlights the significance of wide-field imaging surveys in unveiling previously unknown structures around peculiar objects, but also opens up a new observational window for advancing our understanding of how such systems enrich and shape their cosmic neighborhoods.
Original astrobite edited by Ivey Davis.
About the author, Janette Suherli:
Janette is a PhD student at University of Manitoba in Winnipeg, Canada. Her research focuses on the utilization of integral field spectroscopy for the studies of supernova remnants and their compact objects in the optical. She is also the current chair of Graduate Student Committee for the Canadian Astronomical Society (CASCA). She grew up in Indonesia where it is summer all year round! Before pursuing her PhD in astrophysics, Janette worked as a data analyst for a big Indonesian tech company, combating credit card fraud.
The post The Unexpected Findings of an Emission Shell appeared first on AAS Nova.
]]>
Recent JWST observations highlight narrow filaments and bubble-like structures in the nearby starburst galaxy Messier 82.
The post Featured Image: A Starry Cigar appeared first on AAS Nova.
]]>Starburst galaxies are prolific star factories, churning out tens to hundreds of stars each year. By contrast, the Milky Way crafts just a handful of stars annually. Recently, a team led by Alberto Bolatto (University of Maryland) turned JWST toward the cigar-shaped galaxy Messier 82, which is a starburst galaxy 12 million light-years away. Messier 82’s star formation rate has cooled from an impressive peak of 160 solar masses of stars per year 8–15 million years ago to 12 solar masses per year today. The team sought to study the powerful winds that whisk away star-forming gas from the galaxy’s center. In the image above, which shows the central few thousand light-years of the galaxy, red represents 3.3-micron (1 micron = 10-6 meter) emission that largely comes from polycyclic aromatic hydrocarbons: sooty molecules that contain multiple rings of carbon atoms bonded together. (Green and blue represent 2.5-micron and 1.6-micron emission, respectively; the compact green areas are mostly supernova remnants.) These new observations show in great detail the narrow, intertwined filaments and bubbles highlighted by the 3.3-micron emission. The filaments may have formed when dense, dusty clumps of gas were shredded by the outflowing galactic wind. To dive into the science behind this image, be sure to check out the full research article linked below.
Citation
“JWST Observations of Starbursts: Polycyclic Aromatic Hydrocarbon Emission at the Base of the M82 Galactic Wind,” Alberto D. Bolatto et al 2024 ApJ 967 63. doi:10.3847/1538-4357/ad33c8
The post Featured Image: A Starry Cigar appeared first on AAS Nova.
]]>
Three recent articles examine the making of heavy elements in supernovae, collapsars, and neutron star mergers.
The post Monthly Roundup: Where Elements Are Made appeared first on AAS Nova.
]]>Roughly thirteen billion years ago, the periodic table was easy to memorize: hydrogen, helium, and lithium were the only chemical constituents of the infant universe. Today, things are a little more complicated. Through billions of years of stellar alchemy, the universe is now awash with an abundance of metals — what astronomers call elements heavier than helium. Some of these metals are forged in the cores of stars, while others require explosive events to form. In today’s post, we’ll take a look at three research articles that examine the creation of heavy elements in exotic environments across the universe.
Making Metals in Supernovae
Core-collapse supernovae are one of the sites of element formation, which is also called nucleosynthesis. Core-collapse supernovae are triggered by the collapse of a massive star as the star exhausts its ability to hold off the inward pressure of gravity with the outward pressure of radiation generated by nuclear reactions in its core. When the star’s core collapses, its outer layers recoil from the condensed core and explode into space.
The hot, dense ejecta of a supernova explosion may be a good place for elements to be created through r-process nucleosynthesis. In this process, multiple free-wheeling neutrons pack onto nearby atoms, creating heavier isotopes and elements fast enough that unstable isotopes don’t have the chance to decay. (The counterpart to the rapid r-process is the slow s-process, in which a trickle of neutrons builds elements and isotopes more gradually. The s-process tends to take place in stellar interiors, without the need for a cataclysmic explosion.) It’s not yet clear how much element creation via the r-process happens in core-collapse supernovae or how this quantity depends on the mass of the star or other factors.
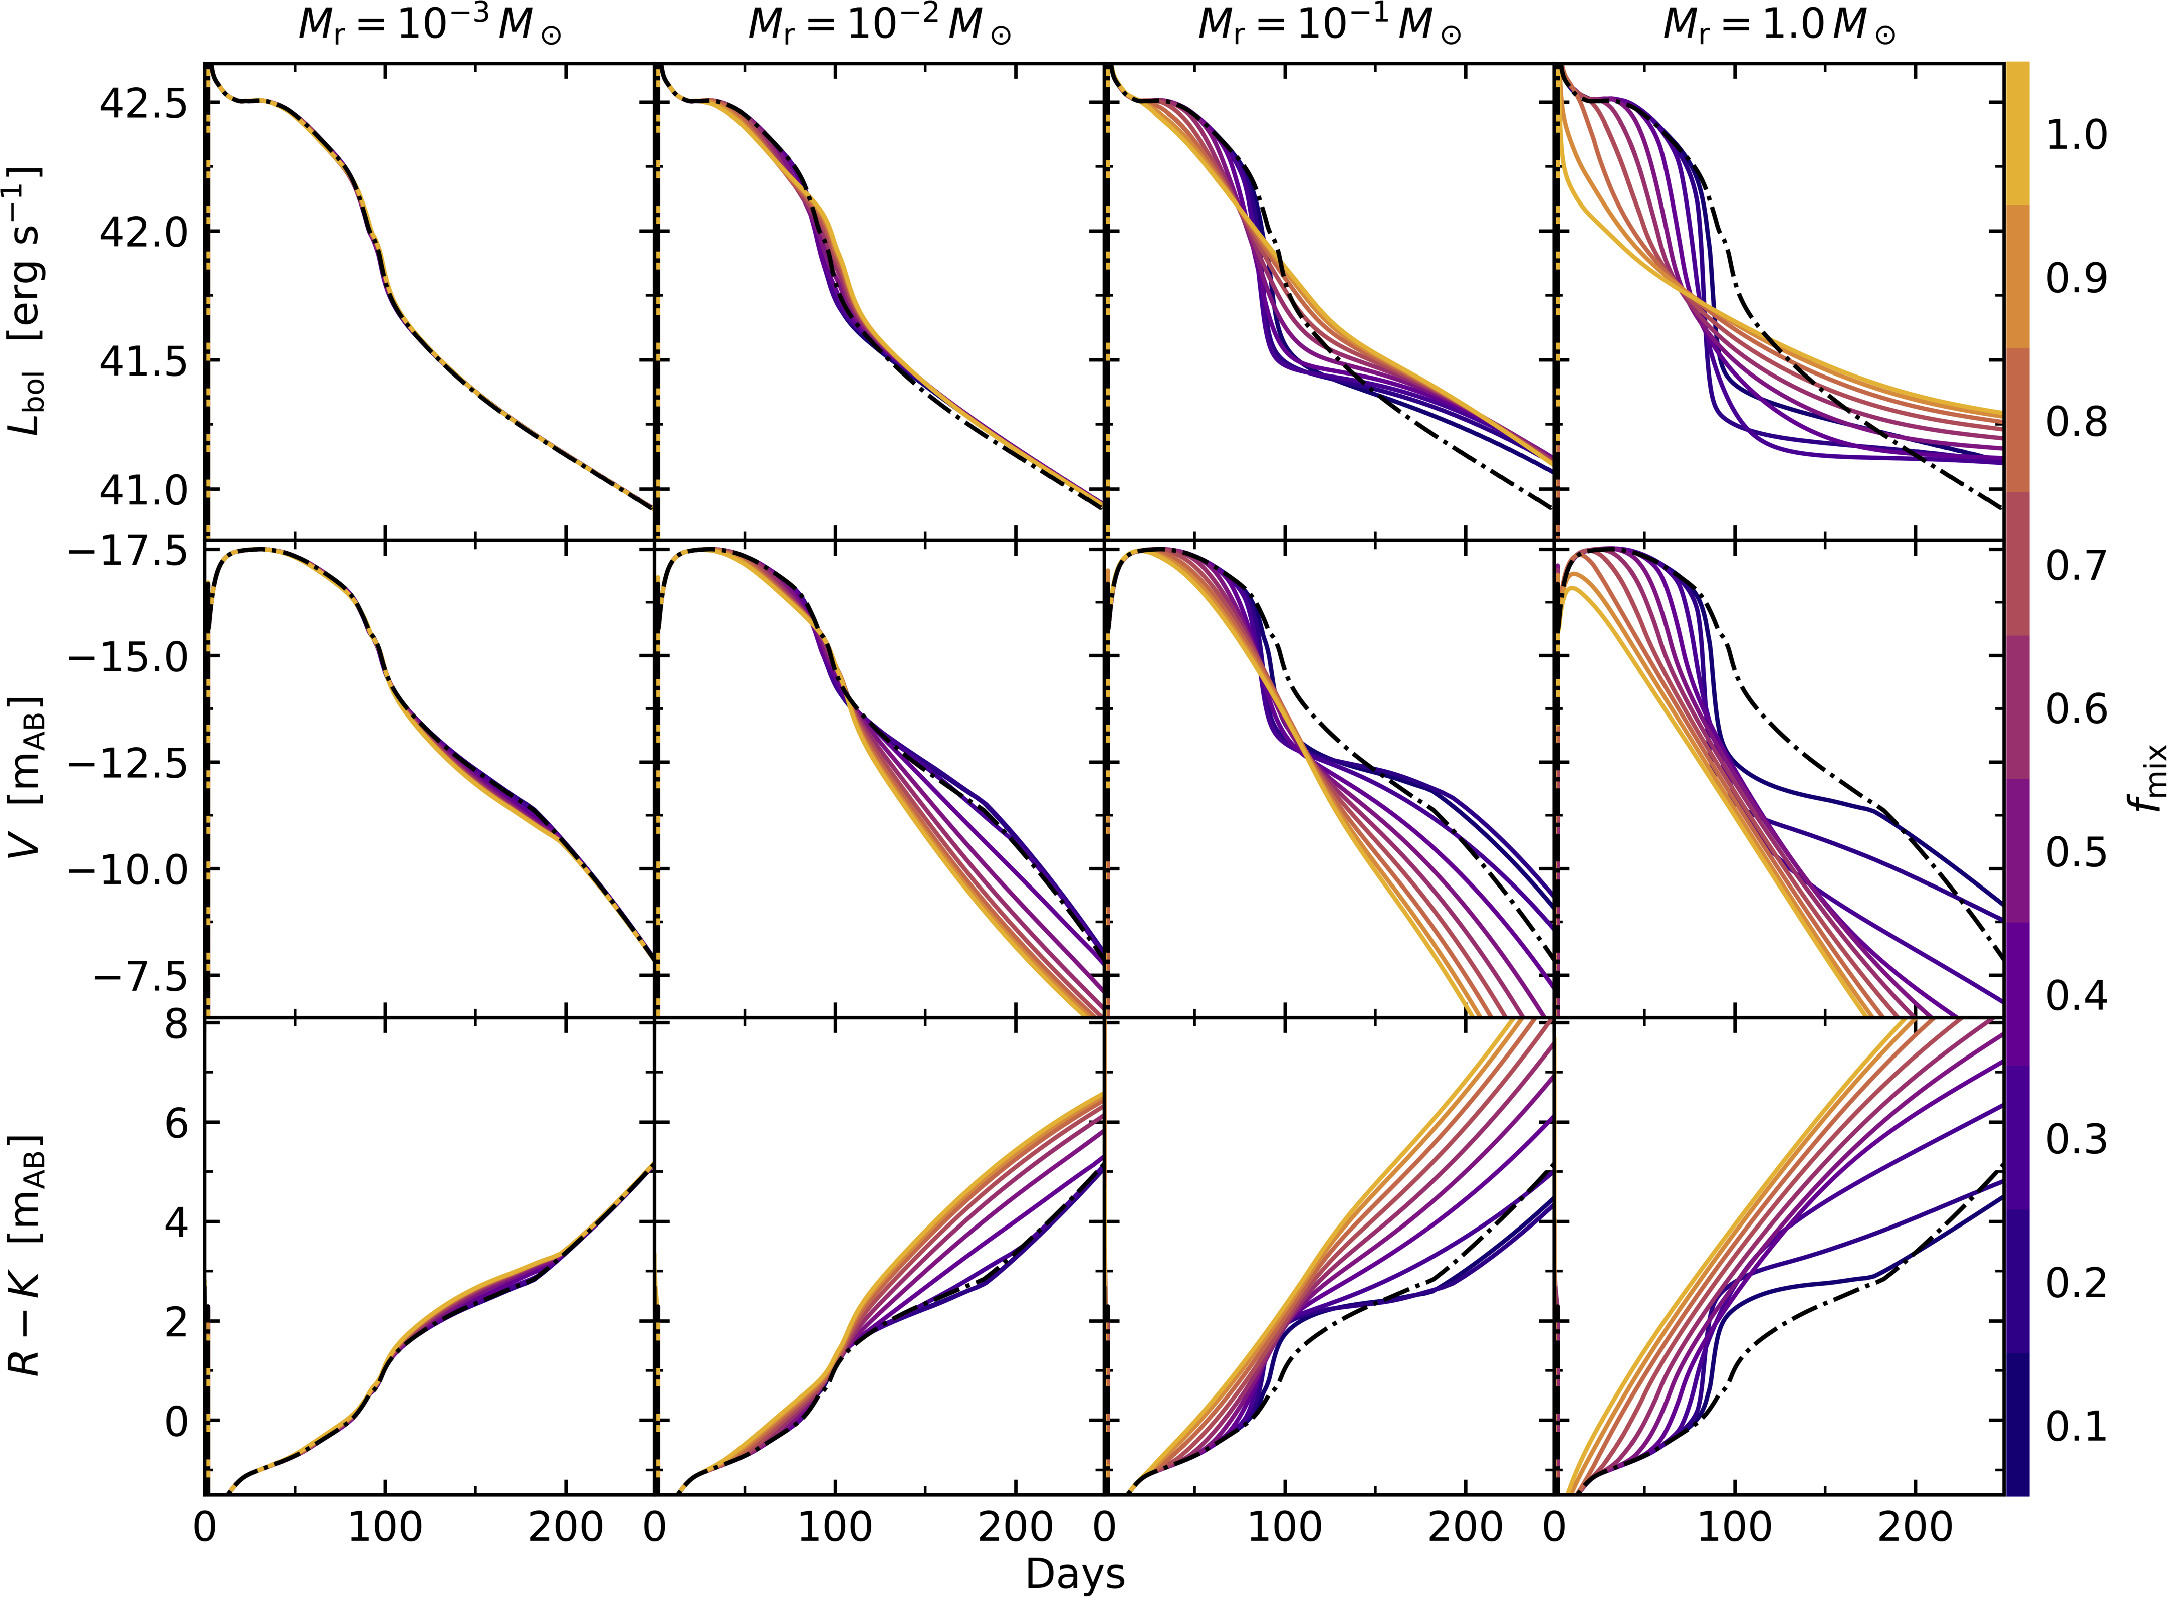
Modeled supernova light curves showing the impact of increasing the amount of r-process material (Mr) and the degree of mixing (fmix). Click to enlarge. [Patel et al. 2024]
Patel and coauthors found that if the amount of r-process material is small — less than a hundredth of the mass of the Sun — the light curve looks scarcely different than if there is no r-process material at all. For larger amounts of r-process material and greater degrees of mixing, the “plateau” phase of the light curve shortens and dims, and the supernova appears redder than it otherwise would. The team’s research suggests that r-process-enriched supernovae should be distinguishable from regular supernovae but may be confused with certain types of rare supernovae.
The Influence of Magnetic Fields
Many core-collapse supernovae leave behind a neutron star: an extraordinarily dense sphere of neutrons about 10 kilometers in radius and about the mass of the Sun. When two neutron stars collide, the merger creates ideal conditions for element formation through the r-process. In a recent article, Kelsey Lund (North Carolina State University and Los Alamos National Laboratory) and collaborators examined element creation in the case of a neutron star merger than produces a black hole surrounded by a hot, dense accretion disk.
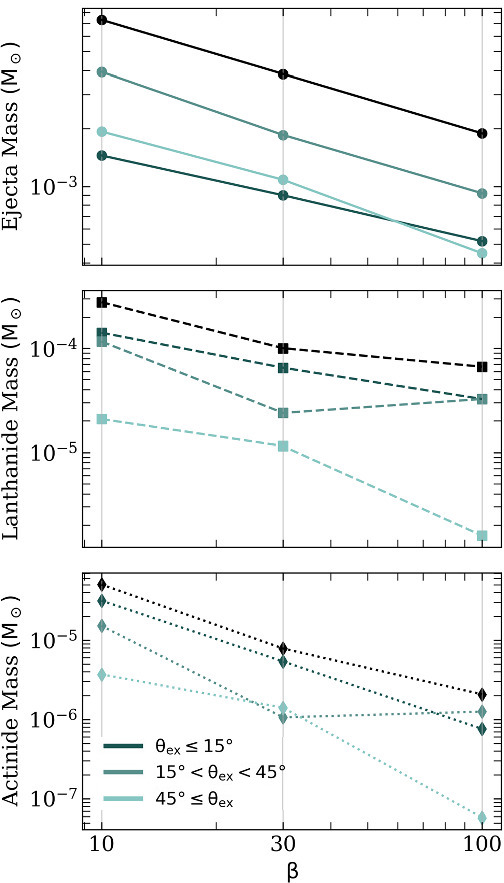
Total ejecta mass, lanthanide mass, and actinide mass as a function of magnetic field strength (lower β corresponds to a stronger magnetic field) and the angle of the outflow. Note the different y-axis scales in the middle and bottom plots. [Adapted from Lund et al. 2024]
Lund’s team used general relativistic magnetohydrodynamics simulations to trace the evolution of the disk that forms after the stars merge. The three simulations capture the nucleosynthesis that occurs within about 127 milliseconds of the collision. When the magnetic field is stronger, more mass is ejected by the merger and larger amounts of elements in the lanthanide and actinide groups — the two rows of heavy elements separated from the rest of the periodic table — are produced. The amounts of lanthanide-group and actinide-group elements both increase with increasing magnetic field strength, but the increase is larger for the actinide-group elements.
This last finding could explain a curious feature of some old stars: while many old stars contain about the same amount of lanthanide-group elements, there is a broad range of actinide-group element abundances. This may reflect the different magnetic field conditions in the neutron star mergers where the elements formed, long before the stars themselves were born.
Collapsar Jets and Nucleosynthesis
The final article of today’s post examines a variety of element-making methods in the aftermath of a collapsar: a rapidly spinning, massive star that collapses into a black hole, slinging jets of material into space in the process. Zhenyu He (Beihang University) and collaborators used an extensive network of nuclear reactions to model the fusion, fission, and decay taking place in the collapsar’s jets.
He’s team found that in the immediate aftermath of a collapsar, the r-process is in full swing, packing neutrons onto outflowing atoms and forming elements like gold and platinum. After about five seconds, the outflow has cooled enough that the r-process stalls. This doesn’t mean that nucleosynthesis stops, though: the team found evidence that the slower s-process and the intermediate-speed i-process take over and continue to churn out heavier atomic species for several hours. The later, slower nucleosynthesis is mainly powered by neutrons from the fission of fermium and rutherfordium.
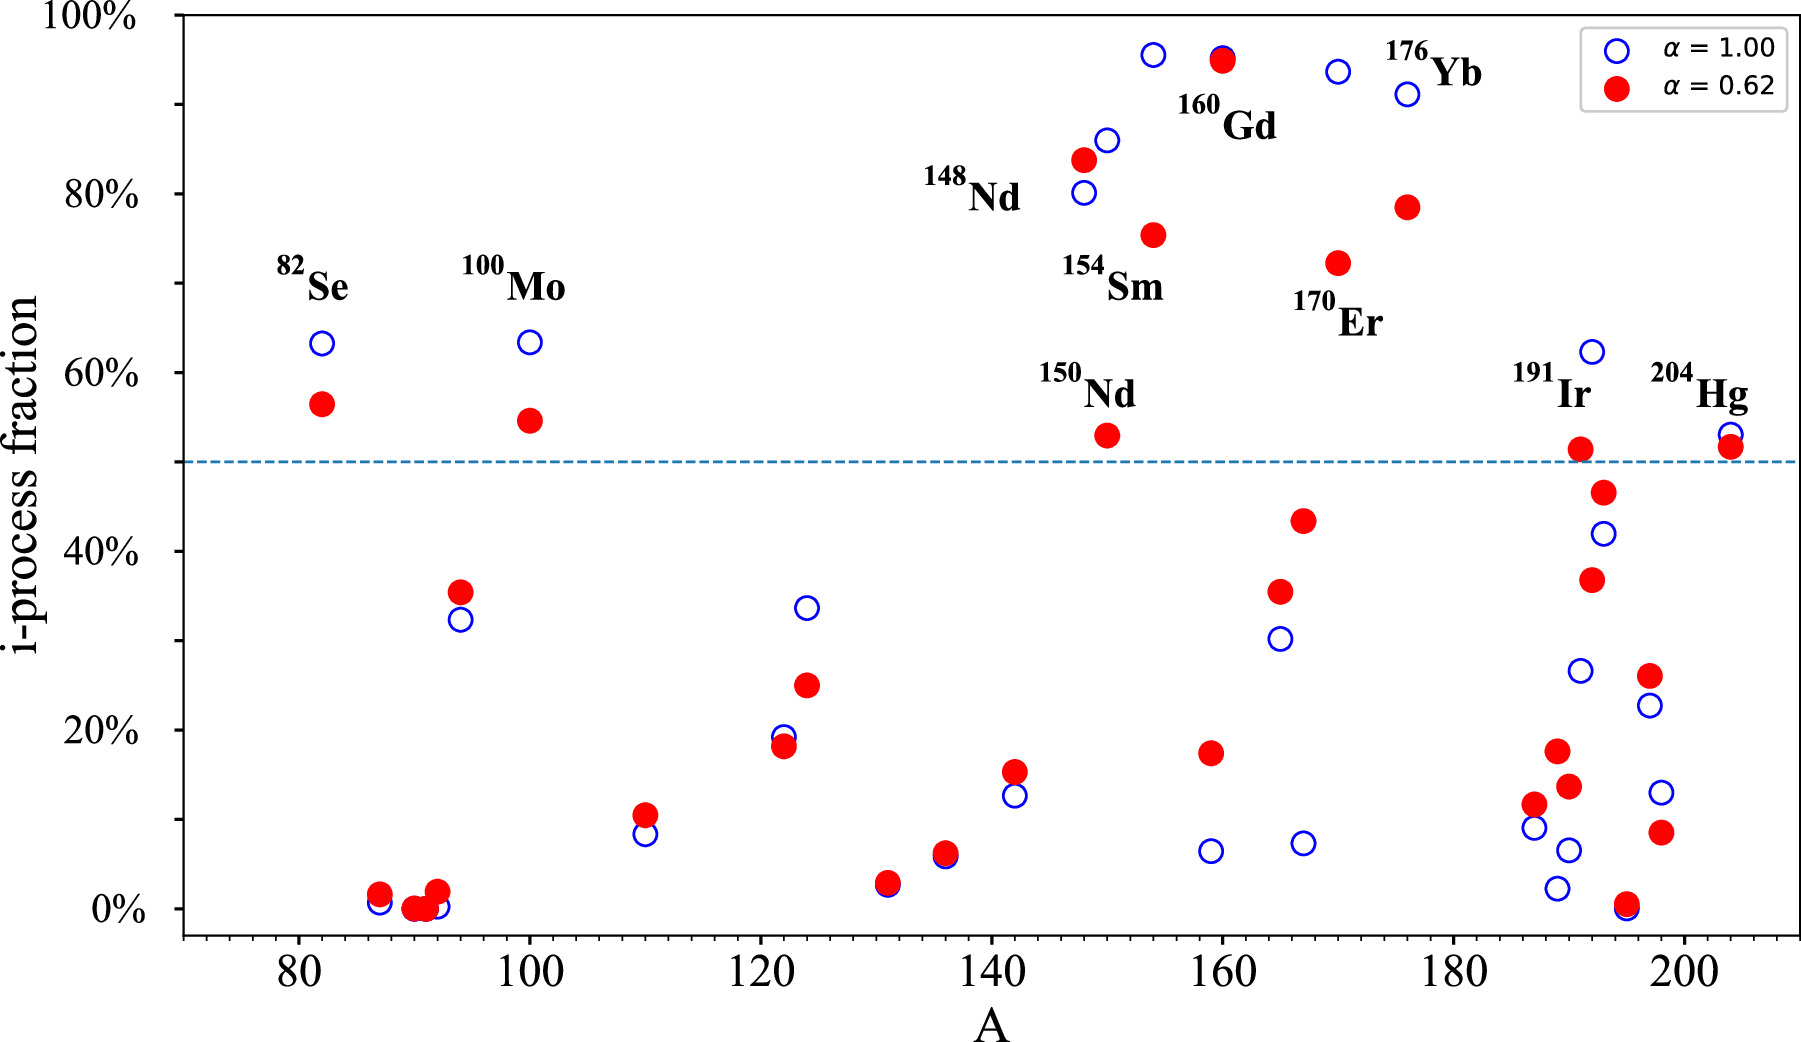
Percentage of element yield (A = atomic mass in atomic mass units) from the i-process. Many elements’ yields are greatly enhanced by the i-process. The two sets of symbols represent results from simulations with different expansion rates. Click to enlarge. [He et al. 2024]
Citation
“The Effects of r-Process Enrichment in Hydrogen-Rich Supernovae,” Anirudh Patel et al 2024 ApJ 966 212. doi:10.3847/1538-4357/ad37fe
“Magnetic Field Strength Effects on Nucleosynthesis from Neutron Star Merger Outflows,” Kelsey A. Lund et al 2024 ApJ 964 111. doi:10.3847/1538-4357/ad25ef
“Possibility of Secondary i– and s-Processes Following r-Process in the Collapsar Jet,” Zhenyu He et al 2024 ApJL 966 L37. doi:10.3847/2041-8213/ad444c
The post Monthly Roundup: Where Elements Are Made appeared first on AAS Nova.
]]>
JWST has detected a faint debris disk surrounding the M-dwarf star Fomalhaut C, marking just the fifth scattered-light debris disk detected around an M dwarf.
The post JWST Spies a Debris Disk appeared first on AAS Nova.
]]>JWST has achieved another first: the telescope has spotted light scattered by dust grains in the debris disk surrounding the star Fomalhaut C for the first time. These observations add to our knowledge of the planet formation process around the smallest and most common stars in our galaxy.
A Fleeting Phase
As stars and planets form out of collapsed clouds of gas and dust, nascent planetary systems pass through a short and poorly understood phase. Lasting just 10 million years, the fleeting debris disk stage is marked by collisions between protoplanets that create disks or rings of dust and rubble.
Studying debris disks is key to understanding how planetary systems form. Very few debris disks have been seen around the smallest, coolest, and most common type of star in the Milky Way — M dwarfs —and detailed observations of the few known M-dwarf debris disks have been scarce. Studies are split on whether low-mass stars are less likely to host debris disks or if these disks are simply more challenging to detect. Luckily, JWST is capable of spotting these elusive disks, and recent observations have given researchers a new perspective on a disk surrounding an M dwarf just 25 light-years away.
Disk Detected
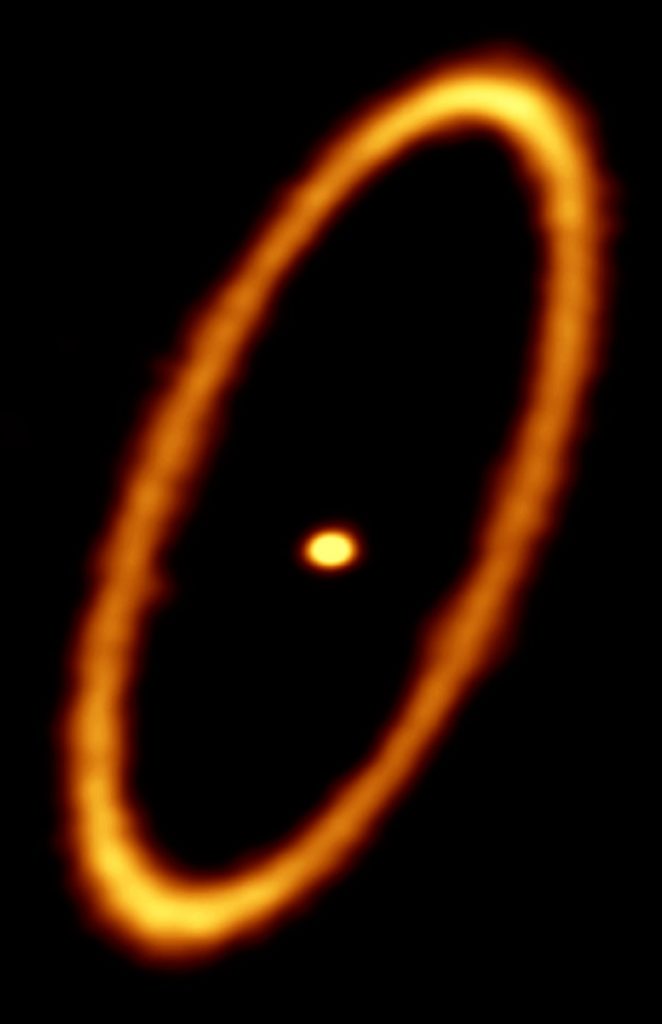
ALMA’s view of the debris disk around Fomalhaut A. [ALMA (ESO/NAOJ/NRAO); M. MacGregor; CC BY 3.0]
Recently, a team led by Kellen Lawson (NASA’s Goddard Space Flight Center) turned JWST toward Fomalhaut C and eight other nearby M dwarfs to search for planets around these stars. In JWST’s 3.56 and 4.44 micron (1 micron = 10-6 meter) filters, the authors detected a faint disk extending beyond the star. In the shorter-wavelength filter, the outline of the disk matched the location of the debris disk seen previously by ALMA. In the longer-wavelength filter, the disk extended slightly beyond the emission seen by ALMA.
Challenging Observations
Fomalhaut C is the smallest and coolest star for which a disk has been detected in scattered light. The new observations highlight JWST’s ability to track down debris disks around small, cool stars, as well as the inherent difficulty of observing these structures: even under JWST’s watchful gaze, the star’s debris disk is seen only faintly, with background objects and noise interfering with the telescope’s view.
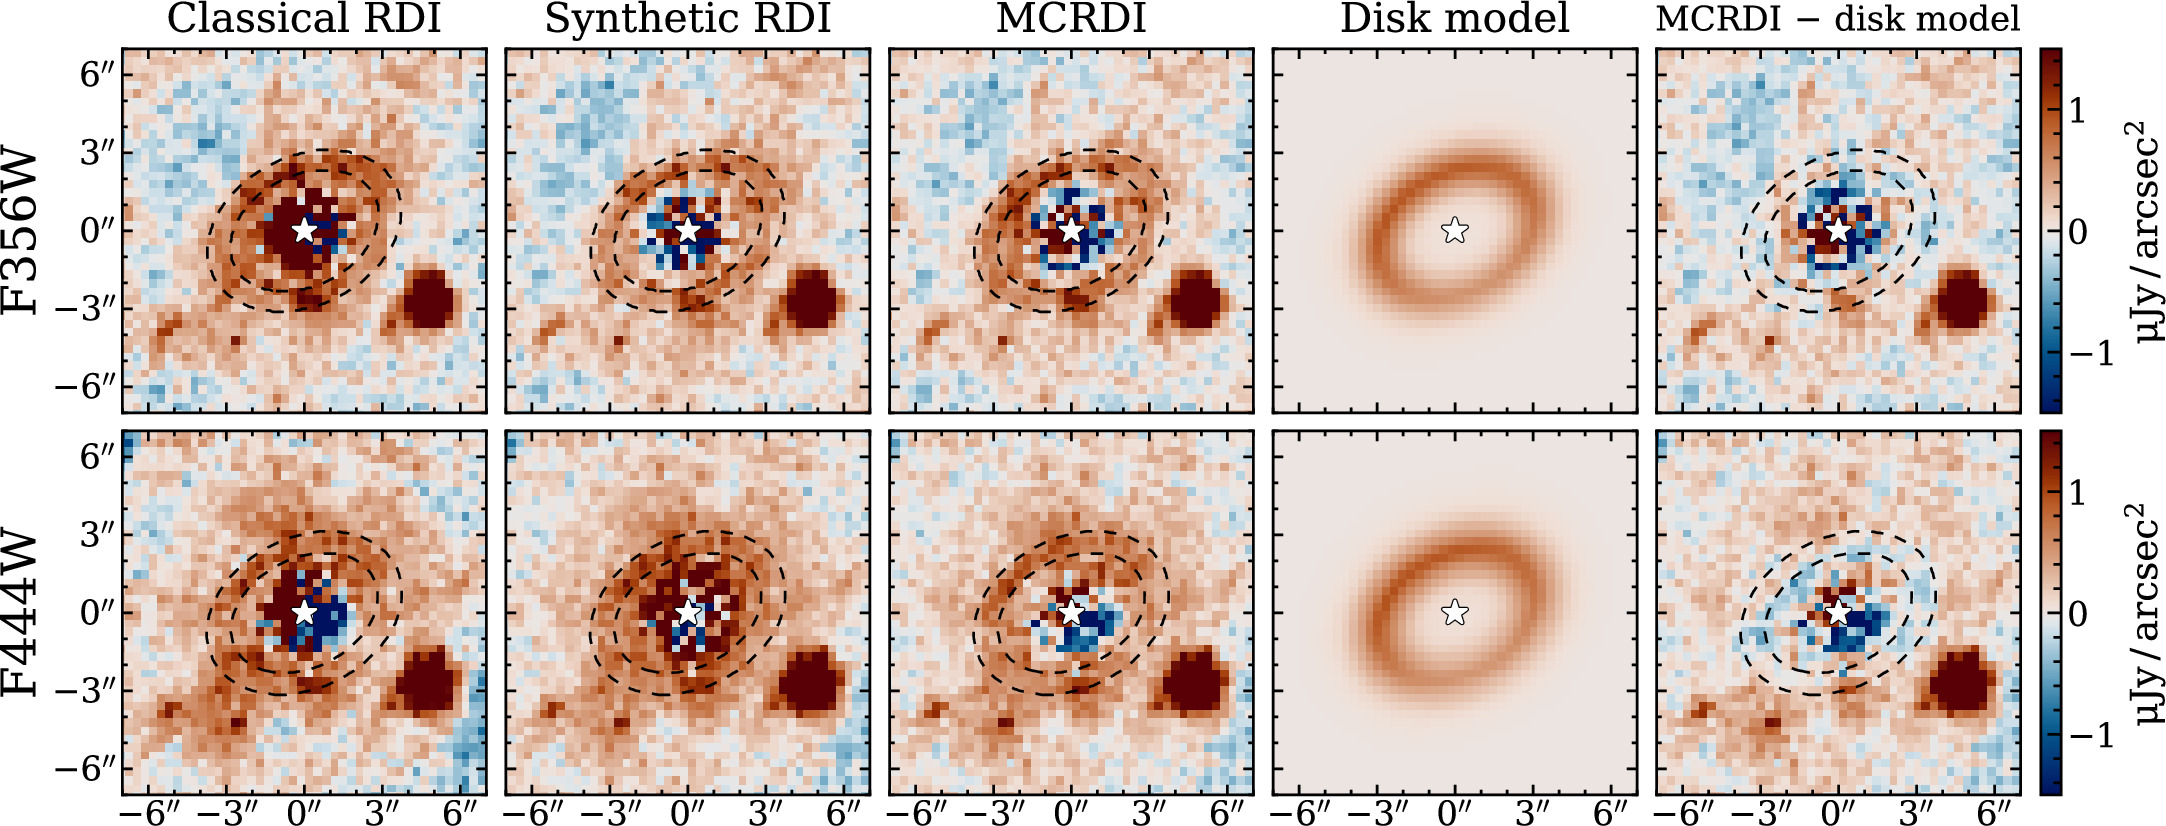
Fomalhaut C’s disk as seen in two different filters and with several different methods of removing diffracted starlight. Click to enlarge. [Lawson et al. 2024]
Follow-up observations of Fomalhaut C may refine our understanding of its debris disk, and future observations with JWST are sure to add to the small but critical sample of debris disks surrounding the smallest stars.
Citation
“JWST/NIRCam Detection of the Fomalhaut C Debris Disk in Scattered Light,” Kellen Lawson et al 2024 ApJL 967 L8. doi:10.3847/2041-8213/ad4496
The post JWST Spies a Debris Disk appeared first on AAS Nova.
]]>
Astrobites reports on a purported exoplanet whose uncertain signal may instead be a sign of stellar activity.
The post Vulcan II: The Wrath of Stellar Activity appeared first on AAS Nova.
]]>Editor’s Note: Astrobites is a graduate-student-run organization that digests astrophysical literature for undergraduate students. As part of the partnership between the AAS and astrobites, we occasionally repost astrobites content here at AAS Nova. We hope you enjoy this post from astrobites; the original can be viewed at astrobites.org.
Title: The Death of Vulcan: NEID Reveals That the Planet Candidate Orbiting HD 26965 Is Stellar Activity
Authors: Abigail Burrows et al.
First Author’s Institution: Dartmouth College and NASA’s Jet Propulsion Laboratory
Status: Published in AJ
It’s possible you may have heard of HD 26965, otherwise known as 40 Eridani A, the stellar host for the fictional planet Vulcan (homeworld of Spock, of Star Trek fame). Back in 2018, two teams of astronomers announced the likely presence of a super-Earth — Vulcan, perhaps — orbiting HD 26965, based on radial-velocity measurements from a variety of instruments. These astronomers measured the planet’s mass to be equivalent to more than 8 Earths and the orbital period to be roughly 42 days. But before Trekkies could break out the Romulan ale, researchers noted that more work was needed to fully separate the radial-velocity signals from those of the exoplaneteer’s eternal enemy: stellar activity, which can mimic planetary signals.
The Fate of Vulcan
Since then, study after study has highlighted stellar activity as the likely primary source of Vulcan’s radial-velocity signal, raising further uncertainty about the existence of the planet. What might bring us closer to a definite answer would be to combine detailed radial-velocity analysis techniques with what we already know about the effects of solar activity on radial-velocity measurements. This knowledge can be applied to high-resolution spectra of HD 26965 taken by NEID at the Kitt Peak National Observatory. NEID represents the latest and greatest in ground-based spectrometers, ensuring clearer, more frequent data than previous studies had access to.
Important to determining the status of HD 26965 b (the standard name for our Vulcan) is the concept of phase lag. Based on what we know from studying solar activity, the observational parameters used to study stellar activity can become offset in time from the effects of stellar activity on radial-velocity measurements. This would mean that stellar activity might not have been fully corrected for in early studies of this planet. If a decaying starspot or plage were present on HD 26965, correcting for it would lead to a reduction in the radial-velocity signal.
Combining Radial Velocity Analysis Techniques
To account for this phase lag, the authors first compute what are essentially smoothed radial-velocity signals by taking the sum of every radial velocity corresponding to every spectral line, weighted by their corresponding errors. These are corrected for NEID systematic quirks (such as by converting measurements into the stellar frame from the observatory frame NEID usually works in). This produces a “template” radial velocity that the authors compare each observed spectral line to, noting differences between observed radial velocity and “template” radial velocity. This comparison allows them to view how phase lag may affect the amplitude and location of the radial-velocity signal.
The Hits Just Keep On Coming
The observed NEID radial velocities have a similar 42-day period to the planet model proposed by an earlier study, but Figure 1 shows that they are out of phase by 30–40%! Straight off the bat, it’s not looking so good for Vulcan with strike number one. In addition, comparing these radial velocities to activity indicator lines Ca Ⅱ, H, and K reveals that they share a similar period but do not seem to be correlated. Strike number two!

Figure 1: The NEID-observed radial velocities of HD 26965 (marked in purple) compared to the planet model proposed by an earlier study (Ma et al. 2018, marked in yellow). The NEID radial velocities are out of phase with the planet model by 30–40%. [Burrows et al. 2024]

Figure 2: Left: A variety of corrected radial-velocity measurements per activity metric, marked with purple circles, accompanied by original radial velocities, marked with gray squares. Right: Periodograms for corrected radial velocities, marked in solid purple, and for original radial velocities, marked in gray dashes. The red diamonds denote periods with the highest remaining power. At the supposed 42-day period, the probability of that being the actual period (called the power) drops significantly for most activity indicators. [Burrows et al. 2024]
Stop, Stop, He’s Already Dead!
These are just a small sampling of demonstrations in the article — ultimately, they all seem to point towards stellar activity probably being the source of the radial-velocity signal from HD 26965, unfortunately for Vulcan.
Fortunately for us, this article aims to act as a Swiss army knife of sorts. It accomplished several things — first, the authors showed that phase lags may be important in determining the relationship between radial velocity and whatever may have affected it. Second, a bundling of analyses makes for a stronger case compared to a single analysis technique on its own, giving more solid evidence for the stellar activity hypothesis.
Last but not least, the methodologies used in this article can be used on radial velocities from other stars, including our own Sun! In addition to testing this multi-pronged analysis on other types of stars, the authors hope to use it on our Sun during especially turbulent activity periods. By refining our understanding of how our Sun and other stars fluctuate through time, we better our exoplanet detection techniques and our chances of finding habitable worlds.
Original astrobite edited by Dee Dunne.
About the author, Diana Solano-Oropeza:
I’m a first-year astronomy PhD student at Cornell University, where I study exoplanets, stars, and habitability using Gaia data. I earned my BS in physics at Drexel University before entering the Bridge to the PhD in STEM program at Columbia University. There, I researched TESS-detected exoplanets for two years. My hobbies include practicing Muay Thai, writing fiction, and playing video games. You can check out my website at https://dianasolano-oropeza.com/.
The post Vulcan II: The Wrath of Stellar Activity appeared first on AAS Nova.
]]>
How do you model an observation when you aren't sure of its source? Radio astronomers have a new answer to that question: a tool called "fitburst."
The post Modeling the Unknown: A New Tool for Radio Bursts appeared first on AAS Nova.
]]>What is the source of radio transients? Astronomers still aren’t sure, but that’s not stopping them from modeling their observations of these mysterious flashes.
The Challenge of Modeling a Mystery
Imagine a radio astronomer in the first moments following an alert that their telescope just recorded something strange in the sky. Their computer informs them that for barely a millisecond, it spotted a mighty flash of radio waves (aptly called a fast radio burst), but before any humans knew something was happening, the flash had already faded. What was that?
In some fields of astronomy, the next steps would be obvious. The scientist would need to write a model that simulates the physics of some known system, then fiddle with the input parameters of that model until its outputs resemble their data. This radio astronomer is not so lucky, though. That’s because although there are many good ideas and many theorists actively working on it, scientists still do not know the source of fast radio bursts.
So, what is the radio astronomer to do? How can you fit a model and learn anything about what you just saw when you don’t know what caused it? That’s where the authors of a recent publication led by Emmanuel Fonseca, West Virginia University, come in.
A New Tool
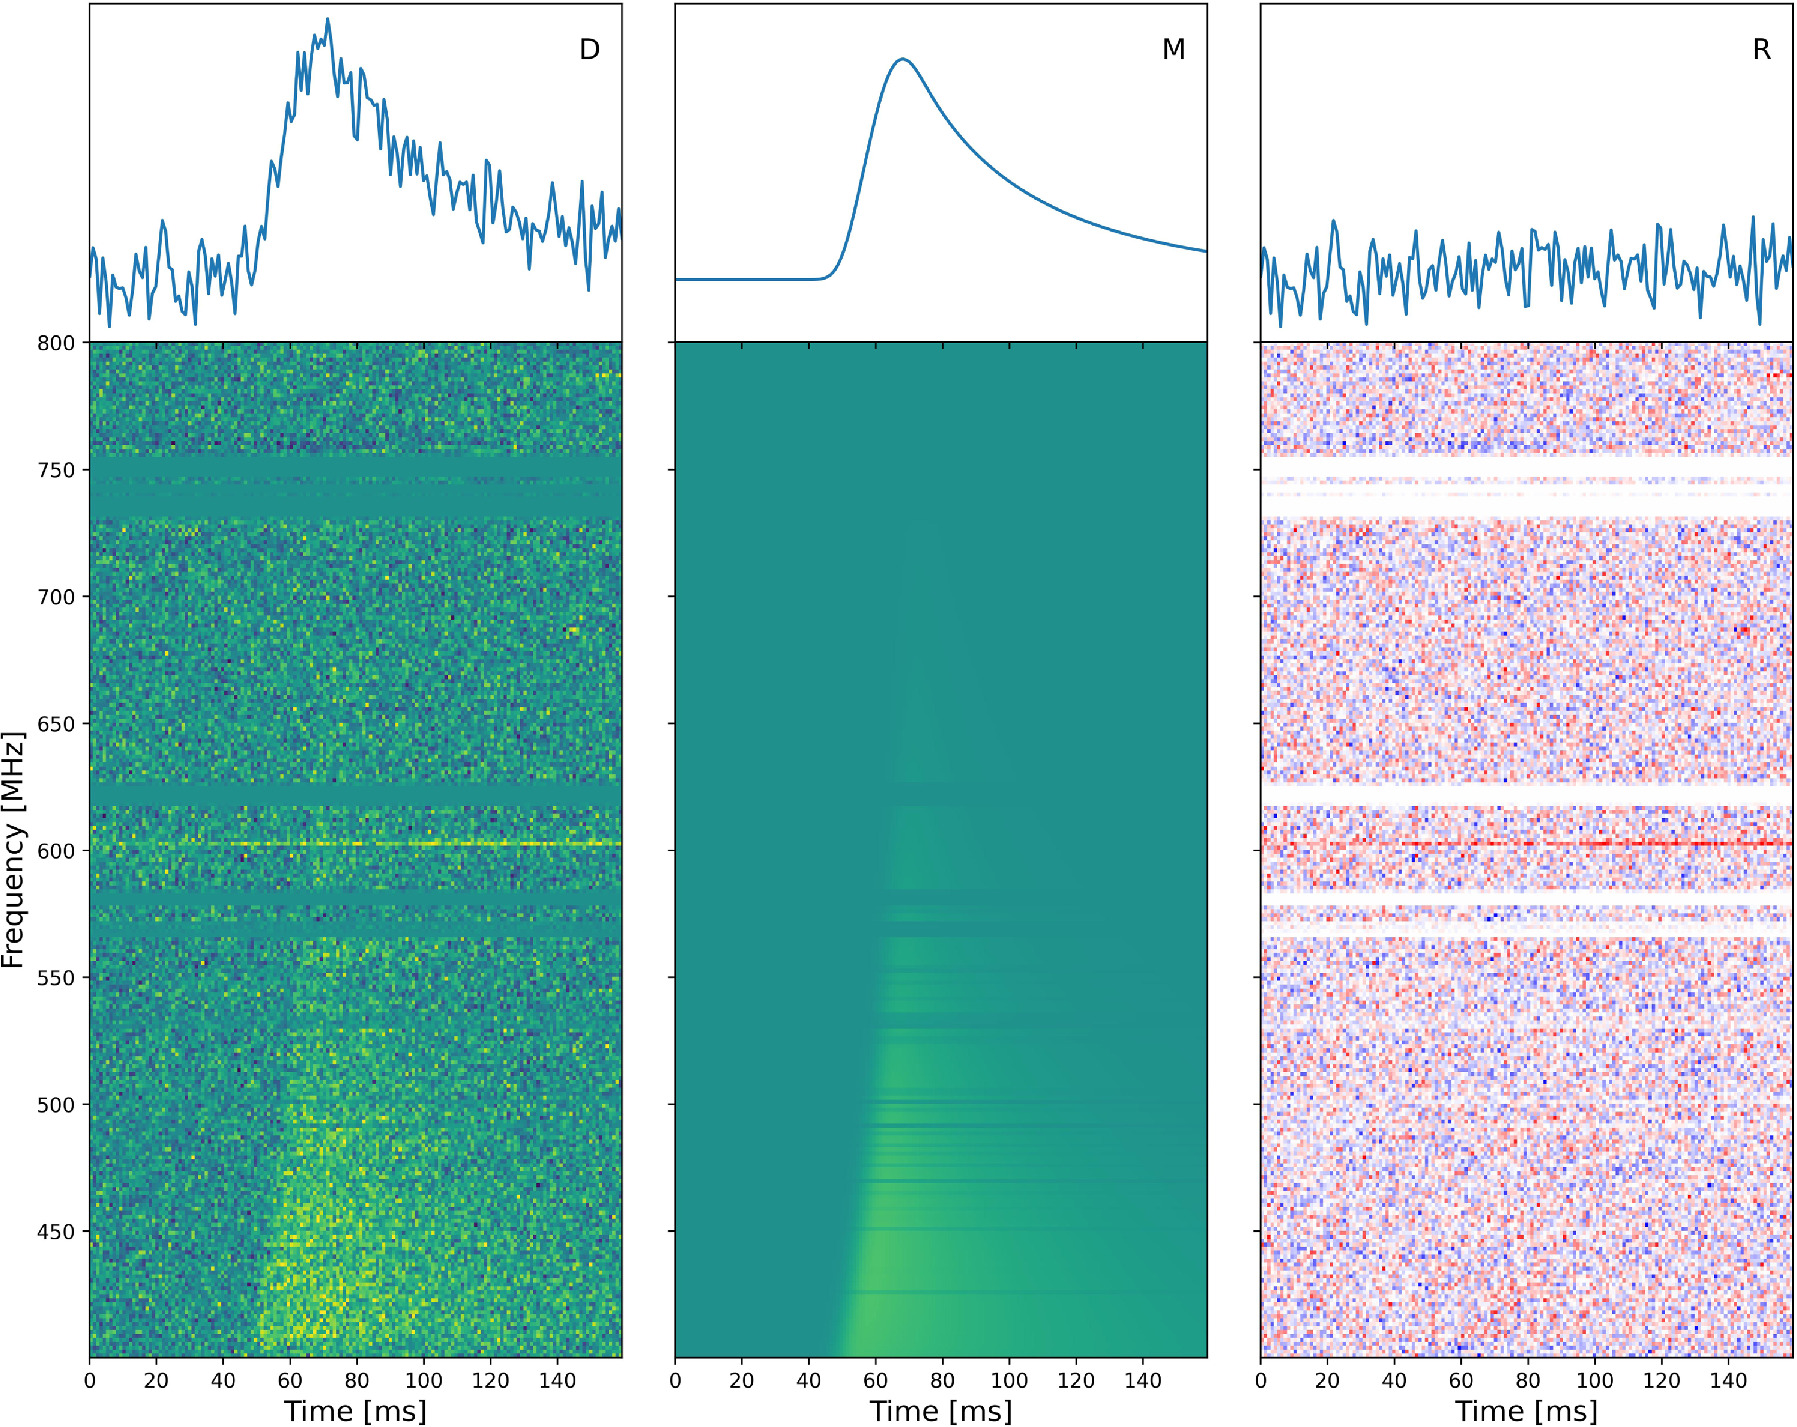
Observed data of a fast radio burst (left), the best-fitting fitburst model (center), and the residuals to the fit (right). Click to enlarge. [Fonseca et al. 2024]
That’s a crucial intermediate step towards developing a more complete theory of fast radio bursts, since it allows scientists to classify the population of observed bursts even without a full understanding of their underlying cause. Already astronomers have noted that there seem to be at least a few distinct types of fast radio bursts, and with a tool like fitburst, they can begin to quantify the differences between these populations.
Careful and Complete Implementation

A fit to a different fast radio burst, which arrived at several staggered, frequency-dependent times. Click to enlarge. [Fonseca et al. 2024]
Excitingly, the researchers also noted that the fitburst model is flexible enough to fit other types of pulses as well. Although designed primarily for fast radio bursts, it can also be used to analyze observations of pulsars and other radio transients. The team encourages all radio astronomers to take fitburst for a spin, and they themselves already list four distinct projects underway. The future of fitburst is bright, much like the mysterious flashes it models.
Citation
“Modeling the Morphology of Fast Radio Bursts and Radio Pulsars with fitburst,” E. Fonseca et al 2024 ApJS 271 49. doi:10.3847/1538-4365/ad27d6
The post Modeling the Unknown: A New Tool for Radio Bursts appeared first on AAS Nova.
]]>
New research examines whether the sources of the highest-energy photons could also be the sources of the highest-energy charged particles.
The post Seeking the Sources of Ultra-High-Energy Cosmic Rays appeared first on AAS Nova.
]]>Where do the highest-energy particles in the universe come from? New research suggests that the sources of ultra-high-energy cosmic rays aren’t necessarily the sources of ultra-high-energy photons as well.
Cosmic Rays Across the Universe
Across the universe, extremely energetic charged particles called cosmic rays zoom through space. These particles are usually protons or the bare nuclei of helium atoms, but they can also be electrons, the nuclei of atoms heavier than helium, or other particles like positrons.
Exactly where these particles are accelerated to nearly the speed of light is an open question. One clue to the origin of the most energetic cosmic rays — ultra-high-energy cosmic rays — is that these particles are not distributed evenly across the sky. Any proposed source of ultra-high-energy cosmic rays, like supernovae, gamma-ray bursts, or other highly energetic cosmic beacons, must be able to explain this distribution.

Distribution of resolved extragalactic gamma-ray sources used in this work. The color bar indicates the gamma-ray flux of each source. [Partenheimer et al. 2024]
From Energetic Photons to Energetic Particles
Angelina Partenheimer (University of Wisconsin) and collaborators investigated the possibility that the highest-energy cosmic rays and the highest-energy photons have the same source. To test this hypothesis, the team constructed a sample of resolved gamma-ray sources with energies between 50 megaelectronvolts and 1 teraelectronvolt. They then modeled the distribution of ultra-high-energy cosmic rays that might be emitted by this collection of gamma-ray sources.
They used two scenarios to model the cosmic-ray distribution. In the first scenario, the cosmic-ray flux scales with the gamma-ray flux, meaning that sources that are brighter in gamma rays also produce more cosmic rays. In the second scenario, each gamma-ray source appears equally bright in cosmic rays from our vantage point. While this doesn’t reflect reality — it would imply that more distant gamma-ray sources produce more cosmic rays — this treatment may help correct for the fact that catalogs of gamma-ray sources are increasingly incomplete at larger distances.

The modeled cosmic-ray flux for the scenario in which the sources are uniformly bright. The resulting dipole for this scenario is roughly five times larger than what has been observed. [Partenheimer et al. 2024]
Cosmic-Ray Bright, Gamma-Ray Dim?
In both scenarios, the modeled cosmic-ray distribution is far more uneven than what has been observed. Much of the unevenness comes from the extremely bright gamma-ray source Markarian 421, which helps to produce a dipole in the cosmic-ray distribution 5–10 times larger than what has been observed. This suggests that resolved gamma-ray sources alone cannot be the sources of ultra-high-energy cosmic rays; many more sources are needed to balance out the few extremely luminous objects.
Partenheimer’s team found that roughly 80,000 “missing” sources are needed to match the observed distribution of ultra-high-energy cosmic rays. This is far larger than the known population of resolved gamma-ray sources, which could mean that the producers of the highest-energy cosmic rays are unresolved gamma-ray sources. Alternatively — and perhaps surprisingly — the sources of ultra-high-energy cosmic rays might not produce gamma rays at all!
Citation
“Ultra-High-Energy Cosmic-Ray Sources Can Be Gamma-Ray Dim,” Angelina Partenheimer et al 2024 ApJL 967 L15. doi:10.3847/2041-8213/ad4359
The post Seeking the Sources of Ultra-High-Energy Cosmic Rays appeared first on AAS Nova.
]]>
Astrobites reports on efforts to detect the shrinking orbits of close-in hot-Jupiter exoplanets.
The post To Inspiral or Not to Inspiral appeared first on AAS Nova.
]]>Editor’s Note: Astrobites is a graduate-student-run organization that digests astrophysical literature for undergraduate students. As part of the partnership between the AAS and astrobites, we occasionally repost astrobites content here at AAS Nova. We hope you enjoy this post from astrobites; the original can be viewed at astrobites.org.
Title: Doomed Worlds I: No New Evidence for Orbital Decay in a Long-Term Survey of 43 Ultra-Hot Jupiters
Authors: Elisabeth R. Adams et al.
First Author’s Institution: Planetary Science Institute
Status: Published in PSJ
Ultra-hot Jupiters: Fleeting Beauties?
Ultra-hot Jupiters are gas giants orbiting close to their stars, with orbital periods less than roughly three days. Because these planets are large and close to their stars, they produce large signals, making them promising targets for detection and characterization. But, you know what they say: all good things must come to an end. These planets are expected to experience large tidal effects from their stars, resulting in a loss of angular momentum, orbital decay, and, eventually, the star engulfing the planet.
Several lines of evidence support the picture that ultra-hot Jupiters are subject to orbital decay over long timescales. For instance, stars hosting hot Jupiters tend to be younger than the average exoplanet host star, and ultra-hot Jupiters are rarer around older host stars. A recent research article even reports a direct detection of a planetary engulfment event from the sudden, short-lived increase in brightness of a faint star. While this evidence paints a compelling picture, it is difficult to estimate how quickly we expect ultra-hot Jupiters to experience orbital decay given theoretical uncertainty in stellar tidal effects.
Keeping Time: Working Hard or Hardly Working?
Because we expect orbital decay to occur and we know of thousands of transiting exoplanets, some of which have been observed for decades, several teams have searched for orbital decay and found two promising detections: WASP-12 b and Kepler-1658 b. Searching for orbital decay relies on the detection of transit-timing variations. This is when a planet passes in front of its star along our line of sight earlier or later than expected. There are many sources of transit-timing variations in addition to orbital decay, including precession, perturbations from companion planets or stars, or acceleration of the host star toward Earth.
Let’s say we observe the transit of a planet at time t = 0 and know its period, P. We expect to observe transits at time P, 2P, 3P, etc. In the case of orbital decay, the period of the planet is getting shorter as time goes on, meaning we need to factor in an additional quadratic term encoding the rate at which the period shrinks. Then, to detect a statistically significant signal of orbital decay, we need to show that the quadratic model fits the data better than the constant-period linear model. The authors of today’s article attempt to do exactly this but with an impressive level of care and attention to detail.
This science depends upon accurate and precise measurements of transit times for each planet in the authors’ sample, most of which have been observed by several teams with various instruments and methodologies over years or decades. Moreover, each transit time must be reported in one unified timing system (click here for more info on one of the most common timing systems). Not every transit observation properly identifies its timing system or accurately converts between timing systems, meaning any historical inaccuracies complicate such studies.
Statistical Methods: Comparing Models
The authors of today’s article compile transit times for 43 ultra-hot Jupiters and take new transit data for six of those planets to extend the temporal baseline of observations. To assess whether the linear (constant period) or quadratic (changing period) model fits the data better, the authors use the Bayesian information criterion (BIC), a model selection criterion that awards a good fit but penalizes additional parameters to avoid overfitting. The authors calculate the difference in the BIC (ΔBIC) between the linear and quadratic models, with a larger ΔBIC suggesting the quadratic model is preferred.
The authors additionally perform a variety of steps to ensure the quality of the data. They perform omit-one tests, where individual transit times are removed from the analysis and flagged if they alter the ΔBIC result by more than 25%. This step is essential since one transit time recorded inaccurately or in the wrong system could result in a spurious detection of orbital decay. The authors additionally perform a “rescaling test,” where the error bars are scaled up to account for unrealistically small error bars in reported transit times.
Results
As shown in Figure 1, four planets out of the sample of 43 had a ΔBIC above the detection threshold, including WASP-12 b, which had been found previously to show orbital decay. The authors measure WASP-12 b’s period to be shrinking by 30 milliseconds per year, matching previously reported values. The planets WASP-121 b and WASP-46 b show tentative period increases, but these results are highly dependent on one or a few data points, warranting further observations. The planet TrES-1 b has prior tentative claims of its period decreasing, and the authors find a tentative period decrease of 18 milliseconds per year. However, this rate of period shrinkage suggests stellar tidal effects that would differ greatly from theoretical predictions, perhaps suggesting a cause of period decrease other than orbital decay.

Figure 1: The value of each planet’s ΔBIC shown relative to a threshold of ΔBIC = 30 (top), zoomed in results (middle), and rescaled results (bottom) with scaled up uncertainties, indicating only WASP-12 b definitively shows signs of orbital decay. [Adams et al. 2024]
Original astrobite edited by Ivey Davis.
About the author, Kylee Carden:
I am a first-year PhD student at The Ohio State University, where I am an observer of planets outside the solar system. I’m involved with the transiting exoplanet survey of the upcoming Roman Space Telescope and working with high-resolution spectroscopic observations of exoplanet atmospheres. I am a huge fan of my cat Piccadilly, cycling, and visiting underappreciated tourist sites.
The post To Inspiral or Not to Inspiral appeared first on AAS Nova.
]]>
How much of Uranus's icy core is made of rock? Researchers propose a new method to make this measurement using a probe of the Uranian atmosphere.
The post Probing for Rocks in an Ice Giant’s Core appeared first on AAS Nova.
]]>Uranus is thought to possess a core of rock and ice beneath its vast frosty atmosphere. Just how much rock lies at the center of this giant world is unknown, but a newly proposed technique could provide a way to find out.
Core Concerns

This JWST Near-Infrared Camera image of Uranus shows the planet’s faint ring system and 9 of its 27 moons. [NASA, ESA, CSA, STScI]
But just how much of the core is made of rock is unknown, and it’s likely to be challenging to measure. Space-based measurements of gravitational pull are are often used to infer a planet’s interior density structure. However, if some of Uranus’s atmospheric gas is mixed into the rock, the mixture will have a density similar to that of ice, making it impossible to differentiate between rock and ice using gravity measurements. How, then, can we tell how much rock is in Uranus’s core?
Noble Gas Method
Francis Nimmo (University of California, Santa Cruz) and collaborators proposed that the amount of rock in Uranus’s core could be calculated by measuring the concentration of argon-40 in its atmosphere. Argon-40, a form of the noble gas argon containing 40 neutrons, is the most common type of argon in Earth’s atmosphere.
Argon can be produced through the radioactive decay of potassium, which clings to silicate-rich materials like the rocks thought to be present in Uranus’s core. As potassium slowly decays to argon with a 1.25-billion-year half-life, the newly produced argon diffuses into the planet’s atmosphere. By measuring the amount of argon in Uranus’s atmosphere, Nimmo’s team suggests, researchers can infer the amount of potassium — and rock, by extension — in the planet’s core.

Concentration of argon-40 as a function of the core rock mass in units of Earth masses, ME, and the transport factor, f. [Nimmo et al. 2024]
A Complex Measurement
Nimmo and coauthors find that if the transport of argon from Uranus’s core to its atmosphere is efficient, an atmospheric probe could easily measure the concentration of argon-40. But because there appears to be a trade-off between the mass of the rock core and how efficiently it propels argon-40 into the atmosphere, a spacecraft would need to measure the total mass of the core through gravity measurements or seismology to get a final estimate of how much rock is in the core.
There are other possible complications: some argon in Uranus’s atmosphere was likely already present when the planet was swirled together from the nebula that birthed the Sun and the planets. To disentangle the argon produced in the core from the argon present since the planet’s birth, a visiting spacecraft would need to measure the ratio of argon-40 to argon-36, a form of the element that is produced in supernovae. This ratio would then need to be compared to the primordial ratio of the two forms of argon, which is not known precisely.
The opportunity to test the authors’ theory may lie ahead: a Uranian orbiter and probe was the top priority in the 2023–2032 Planetary Science and Astrobiology Decadal Survey. With two decades or more until the possible arrival of such a spacecraft, scientists have time to contemplate how to measure the makeup of Uranus’s core.
Citation
“Probing the Rock Mass Fraction and Transport Efficiency Inside Uranus Using 40Ar Measurements,” Francis Nimmo et al 2024 Planet. Sci. J. 5 109. doi:10.3847/PSJ/ad3b93
The post Probing for Rocks in an Ice Giant’s Core appeared first on AAS Nova.
]]>
With T Coronae Borealis expected to rise to naked-eye visibility any day now, recurrent novae are in the news. To learn more about these events, check out today's article about a recurrent nova in a neighboring galaxy.
The post Studying a Guest Star’s Annual Appearances appeared first on AAS Nova.
]]>With T Coronae Borealis expected to have an outburst any day now, recurrent novae are in the news. Recently, researchers reported their investigation of a recurrent nova that brightens every year.
Recurring Stellar Characters

Vertically offset light curves from M31N 2008-12a’s 2013–2022 eruptions. [Basu et al. 2024]
Known recurrent novae have outbursts anywhere from every year to every 98 years. The nova with the most recorded appearances is M31N 2008-12a, which hails from our galactic neighbor, Andromeda. Researchers have witnessed the star brighten 15 times since its discovery in 2008, and a dive into the archives dredged up three previous eruptions in 1992, 1993, and 2001. What can this collection of eruptions tell us about M31N 2008-12a’s past, present, and future?

Light curve in the i’ band, showing the overall behavior as well as the “cusp” feature. Click to enlarge. [Adapted from Basu et al. 2024]
Characterizing Outbursts
Judhajeet Basu (Indian Institute of Astrophysics and Pondicherry University) and collaborators examined optical, ultraviolet, and X-ray data to examine the behavior of M31N 2008-12a during its annual outbursts from 2017 to 2022. Their investigation showed that each outburst was roughly the same — rising rapidly to its peak in about a day, then declining sharply for 2–4 days before fading more gradually.
In some wavelength bands, the light curves show a “cusp” feature rising above the expected curve. The “cuspy” look of the light curve at certain wavelengths could be evidence for outflowing jets emerging from the poles of the star. These types of jets have been seen for other recurrent novae, like the Milky Way’s RS Ophiuchi.
From Nova to Supernova

Demonstration of the possible increase in time between eruptions in the last few years. [Adapted from Basu et al. 2024]
Researchers estimate that M31N 2008-12a has been experiencing nova eruptions every year for the past million years. Despite the repeated eruptions that remove mass from the white dwarf’s surface, the star is gaining more mass than it’s losing, creeping ever closer to the Chandrasekhar limit. Once the star hits this mass limit in another 20,000 years or so, it will be too massive to support itself against gravity and will undergo one final outburst as a supernova.
Citation
“Multiwavelength Observations of Multiple Eruptions of the Recurrent Nova M31N 2008-12a,” Judhajeet Basu et al 2024 ApJ 966 44. doi:10.3847/1538-4357/ad2c8e
The post Studying a Guest Star’s Annual Appearances appeared first on AAS Nova.
]]>
One of the largest surveys of the sky is about to begin. But will tiny bits of space junk doom its carefully laid plans even before the first images are taken?
The post Huge Survey vs. Tiny Space Junk appeared first on AAS Nova.
]]>As construction continues on the Vera Rubin Observatory, the skies above its mountaintop home grow more and more crowded following every rocket launch. Astronomers, conscious of the plans for mega-constellations of new satellites in the next few years, are rightfully worried: will these satellites and the tiny bits of debris that come with every deployment and collision affect the new telescope’s long-awaited, gigantic survey?
Threats to Ambitious Plans
After several decades inhabiting only the dreams and blueprints of astronomers, the Vera Rubin Observatory is finally a real, physical place. Now a building and construction site near the summit of Cerro Pachón in Chile, its concrete and steel structure already houses most of what’s needed to begin one of the most ambitious surveys of the sky ever conceived. The Legacy Survey of Space and Time, or LSST, promises to revolutionize every sub-field of astronomy from cosmology to planetary science, and scientists around the world are eagerly awaiting its kickoff.

The Vera Rubin Observatory. [RubinObs/NSF/AURA/H. Stockebrand; CC BY 4.0]
Tiny Pieces, Potentially Large Impact
Astronomers have known this might be a problem for a while now, and the LSST team has spent considerable time figuring out how to handle satellites and large chunks of space debris. While challenges remain and the correction techniques won’t ever be perfect, the community is prepared to handle anything large enough to be tracked by ground-based radar, or about 10 cm. But, what about smaller objects, like the bits of debris created when two satellites collide?
In a February Research Note, one astronomer voiced concerns that these tiniest pieces of space junk could overwhelm LSST’s transient detection algorithms. This prompted a team led by J. Anthony Tyson, University of California, Davis, to model more thoroughly how glints from small, nearby objects would appear in LSST images.
Closer and Faster Than The Stars

An illustration of how a nearby, moving satellite would be blurred out compared to an equally bright but faraway and stationary star. [Adapted from Tyson et al. 2024]
The authors conclude that “In general… the large population of [low Earth orbit] debris below a few centimeters in size may pose little challenge for LSST transient science.” While there are still hurdles to overcome and challenges to solve before LSST can deliver on its extraordinary promises, thankfully, dealing with tiny bits of space junk likely won’t be one of them.
Citation
“Expected Impact of Glints from Space Debris in the LSST,” J. Anthony Tyson et al 2024 ApJL 966 L38. doi:10.3847/2041-8213/ad41e6
The post Huge Survey vs. Tiny Space Junk appeared first on AAS Nova.
]]>
Astrobites reports on a study that estimates how many galaxies with massive black holes are likely to be present in the early universe.
The post Little Red Dots and Big Black Holes appeared first on AAS Nova.
]]>Editor’s Note: Astrobites is a graduate-student-run organization that digests astrophysical literature for undergraduate students. As part of the partnership between the AAS and astrobites, we occasionally repost astrobites content here at AAS Nova. We hope you enjoy this post from astrobites; the original can be viewed at astrobites.org.
Title: A Census of Photometrically Selected Little Red Dots at 4 < z < 9 in JWST Blank Fields
Authors: Vasily Kokorev et al.
First Author’s Institution: Kapteyn Astronomical Institute
Status: Published in ApJ
Imagine you peek into a kindergarten class and, to your shock, you see that all the children are well over 6 feet tall. That is precisely how astronomers felt when data from JWST showed galaxies with massive black holes just a few hundred million years after the birth of the universe. Some of these black holes have been measured to be a million times more massive than the mass of our Sun, and astronomers are puzzled as to how they could have gained so much mass in such a short time.
The earliest galaxies likely to host these black holes show up as little red dots in the images JWST took of the early universe (as seen in the long exposure images; see the bottom image in Figure 1). They are believed to be compact (with a small radius) galaxies with a Type I active galactic nucleus and obscured (covered by dust), which accounts for their red color and why they are easily observed in the infrared. The spectrum of the galaxy has a “V” shape, a blue continuum from the unobscured part of the active galactic nucleus in the galaxy, and a red continuum from the obscured part (see Figure 1). These little red dots have appeared in several images taken by JWST, hinting that plenty of massive black holes are lurking in the early universe.

Figure 1: The characteristic spectrum of little red dots (on the left), with the compact source contributing to the dust-free blue color in the continuum (top right) and the dust-reddened part (bottom right). [Adapted from Kokorev et al. 2024]
Where You Look Matters!
It is vital to systematically look at these little red dot galaxies to understand how many massive black holes were in the early universe. Two factors can introduce biases in the counting of these galaxies. One is the phenomenon of cosmic variance: is JWST just preferentially looking in a direction with many little red dots, or should we expect the same number even when it looks at different parts of the universe? The other is how crowded it is in the direction in which you are observing: if you have a lot of stars in the direction you are looking, they could be misclassified as little red dots or vice versa. If you happen to have plenty of massive galaxy clusters in the direction you are looking, they may create an illusion that more of these little red dots exist than their true numbers (a phenomenon known as gravitational lensing).
To minimize the errors caused by these effects in determining the number of little red dots in the early universe, the authors of today’s research article specifically look at large areas (640 arcminutes2) of the sky by combining JWST data from various programs. This would minimize the effects of cosmic variance as you can measure the numbers over a bigger area of the sky. They also look specifically at data in blank fields (defined here as areas on the sky without galaxy clusters), which helps them determine the accurate number of objects per unit volume. All these galaxies are photometrically selected (i.e., chosen only from looking at images rather than spectra), meaning there is limited spectroscopic data to help confirm what kind of objects they are. Galaxies are determined to be little red dots based on their red colors and how compact they are in the images. Using the obtained fluxes, the authors then construct spectral energy distributions to determine the redshifts (z) of the sample. Limiting the sample to z > 4 (for the early universe), the authors end up with 260 little red dot galaxies
Do Not Judge a Galaxy by Its Size (in Your JWST Image!)
On calculating the total luminosity of the little red dots and comparing it to their redshifts, the authors find a large number of bright little red dots at redshift of z = 5 (around a billion years after the beginning of the universe). The number of little red dots is almost 100 times more than the number of ultraviolet-selected quasars, which are active galactic nuclei identified using another method. They also find that computer models are unable to reproduce the high fraction of the bright galaxies they uncover at high redshifts (left side of Figure 2). The authors derive the mass of the black holes at redshifts of z = 4.5–6.5 to be around 106–108 solar masses, indicating that these black holes were already massive a few hundred million years after the Big Bang. They find deviations from the predicted number densities of massive black holes at these redshifts from galaxy simulations. This is likely because the galaxies that host more gigantic black holes are very dusty, and thus, their spectra do not have any blue continuum. They may then be missed from selections of little red dots as one of the factors it depends on is the characteristic “V”-shaped spectrum, which would need a contribution from the blue continuum (right side of Figure 2).

Figure 2: Left: The number density of the little red dots as a function of luminosity at 6.5 < z < 8.5 with the predicted values from simulations indicated by the blue solid line. Right: The number density as a function of black hole mass at 4.5 < z < 6.5. The observed number density of more massive black holes is lower than the values predicted by simulations. [Adapted from Kokorev et al. 2024]
Original astrobite edited by Delaney Dunne.
About the author, Archana Aravindan:
I am a PhD candidate at the University of California, Riverside, where I study black hole activity in small galaxies. When I am not looking through some incredible telescopes, you can usually find me reading, thinking about policy, or learning a cool language!
The post Little Red Dots and Big Black Holes appeared first on AAS Nova.
]]>
Simulations explore how supernovae can shake up and eject gas from a starburst galaxy.
The post Featured Image: A Disk Disturbed by Stellar Explosions appeared first on AAS Nova.
]]>When massive stars go supernova, their deaths can reshape their home galaxies. Using a high-resolution fluid dynamics simulation, Evan Schneider and Alwin Mao (University of Pittsburgh) examined how supernova explosions affect the distribution and temperature of a galaxy’s star-forming gas. Their simulations tackled how a galaxy similar to the cigar-shaped starburst galaxy Messier 82 evolves under the influence of supernovae. Synthetic star clusters scattered throughout the modeled galactic disk gradually warm their surroundings as they rotate in the plane of the galaxy, then suddenly inject large amounts of heat and energy when the stars explode. The image above shows a snapshot of the simulation after 30 million years of evolution, with red areas showing denser gas and blue areas showing more tenuous gas. Disrupted by stellar explosions, some of the disk’s gas flows into circumgalactic space, and Schneider and Mao found that the simulated outflow rate matches what has been estimated for nearby starburst galaxies. To learn more about this starburst galaxy simulation, be sure to check out the research article linked below.
Citation
“CGOLS V: Disk-Wide Stellar Feedback and Observational Implications of the Cholla Galactic Wind Model,” Evan E. Schneider and S. Alwin Mao 2024 ApJ 966 37. doi:10.3847/1538-4357/ad2e8a
The post Featured Image: A Disk Disturbed by Stellar Explosions appeared first on AAS Nova.
]]>
The exoplanet 8 UMi b should have been swallowed by its host star — and new research may have upended the standing hypothesis for how the planet escaped its fate.
The post Astronomers Reopen the Mystery of a Planet That Shouldn’t Exist appeared first on AAS Nova.
]]>New research may have revived the mystery of 8 Ursae Minoris b, a seemingly doomed exoplanet that shouldn’t exist.
The Planet That Shouldn’t Be: 8 UMi b
When first discovered, the exoplanet 8 Ursae Minoris b (8 UMi b; also called Halla) puzzled astronomers. The planet should have been engulfed by its host star as the star swelled into a red giant, but there was no question that the planet was there, resolutely tugging on its star as it completed each 93-day orbit.
Previously, researchers explained away this impossibility by suggesting that 8 UMi was once a lower-mass star with a close-in stellar companion. As 8 UMi began its expansion into a red giant, it swallowed its companion. The subsequent shakeup of 8 UMi’s interior changed its evolutionary path and halted its expansion, saving 8 UMi b from a fiery fate.
The key to testing this hypothesis is determining 8 UMi’s age: if the star is old — 9 billion years old or so — then the binary merger scenario is feasible. If the star is young, that would make a merger quite unlikely — and the mystery of 8 UMi b will live on.
Age Estimation

The position of 8 UMi on theoretical isochrones of various ages. This analysis yielded an age of 1.9 billion years for this star. [Adapted from Chen et al. 2024]
Using these data, Chen’s team estimated 8 UMi’s age with three different methods: stellar isochrones (theoretical relations between brightness and temperature for stars with different masses but the same age), kinematics, and chemical abundances. The three methods yielded age estimates in the range of 1.9–3.5 billion years — far younger than the nearly 9 billion years estimated for the binary merger scenario.

Age estimates from two chemical abundance methods. These two methods yielded age estimates of 3.3 and 3.5 billion years. Click to enlarge. [Chen et al. 2024]
A Mystery Once Again
The newly calculated age for 8 UMi would make it extremely unlikely for a merger with a binary companion to be responsible for saving 8 UMi b from engulfment. How, then, does this planet exist?
While Chen and collaborators emphasize that more work is needed to solve the mystery once and for all, one of the newly derived stellar properties could provide an explanation: Chen’s team estimated 8 UMi’s mass to be 1.7 solar masses, which is about 13% larger than previous estimates. This larger mass could mean that 8 UMi is slightly more compact than expected, and it would mean that 8 UMi b’s orbital period corresponds to a slightly larger orbital distance — just large enough, perhaps, for the planet to eke out survival on the edge of its star.
Citation
“The Kinematic and Chemical Properties of the Close-in Planet Host Star 8 UMi,” Huiling Chen et al 2024 ApJL 966 L27. doi:10.3847/2041-8213/ad3bb4
The post Astronomers Reopen the Mystery of a Planet That Shouldn’t Exist appeared first on AAS Nova.
]]>
For the first time, researchers have examined a population of black holes that may fill in the gap between over-massive black holes in the early universe and those present today.
The post Sampling Over-Massive Black Holes at Cosmic Noon appeared first on AAS Nova.
]]>For the first time, researchers have examined unexpectedly massive black holes during a time period called cosmic noon. These black holes may fill in the gap between over-massive black holes in the early universe and those present today.
Black Holes Then and Now

Illustration of the formation of a massive black hole seed from the collapse of a gas cloud in the early universe. Click to enlarge. [NASA/STScI/Leah Hustak]
Observations of black holes in the universe today support the hypothesis that many supermassive black holes grew from massive seeds, and low-mass galaxies with over-massive black holes are common in the local universe as well as in the early universe. But what’s missing from this tale of black hole growth is what happened in between these two time periods: where’s the link between over-massive black holes in the early universe and today?

Observations of a low-mass galaxy with an active galactic nucleus. Click to enlarge. [Adapted from Mezcua et al. 2024]
Activity at Cosmic Noon
To connect these two epochs, Mar Mezcua (Institute of Space Sciences, Spain) and collaborators looked toward a period of the universe’s history known as cosmic noon. This period, when the universe was just 2–3 billion years old, is marked by high star-formation rates and fast black hole growth. To study black holes during this time period, Mezcua’s team searched for galaxies containing actively accreting supermassive black holes, also called active galactic nuclei.
Starting from a sample of more than a thousand galaxies with active galactic nuclei, the team selected 12 low-mass galaxies with high-quality data and redshifts that placed them at cosmic noon. Measurements of emission-line widths revealed that these black holes were roughly 100–1,000 times more massive than the black holes in similarly sized active galaxies in the local universe. They are also more massive than expected given the typical ratio of black hole mass to stellar mass.
Drawn from the Same Population

Black hole mass versus galaxy stellar mass for the black holes in this study (red squares), over-massive black holes in the early universe (dark purple squares), and other populations of black holes. Click to enlarge. [Mezcua et al. 2024]
The two groups of black holes may have different reasons for being overly massive, though: in the early universe, the presence of too-massive black holes is thought to mean that these black holes grew from massive “seed” black holes. Later, at cosmic noon, black hole feedback has had time to disrupt and heat star-forming gas, and interactions between galaxies have stripped away star-forming material. Both of these processes could cause a black hole to remain large compared to its host galaxy.
This marks the first time researchers have studied over-massive black holes during cosmic noon, and there’s much more to learn about black holes in this time period. An investigation into outflows and mergers may help researchers understand how these outsize black holes formed and grew.
Citation
“Overmassive Black Holes at Cosmic Noon: Linking the Local and the High-Redshift Universe,” Mar Mezcua et al 2024 ApJL 966 L30. doi:10.3847/2041-8213/ad3c2a
The post Sampling Over-Massive Black Holes at Cosmic Noon appeared first on AAS Nova.
]]>
Astrobites reports on the serendipitous discovery of Dracula's Chivito, possibly the largest known protoplanetary disk.
The post A Vampire’s Sandwich Filled with Gas and Dust appeared first on AAS Nova.
]]>Editor’s Note: Astrobites is a graduate-student-run organization that digests astrophysical literature for undergraduate students. As part of the partnership between the AAS and astrobites, we occasionally repost astrobites content here at AAS Nova. We hope you enjoy this post from astrobites; the original can be viewed at astrobites.org.
Title: Dracula’s Chivito: Discovery of a Large Edge-On Protoplanetary Disk with Pan-STARRS
Authors: Ciprian T. Berghea et al.
First Author’s Institution: US Naval Observatory
Status: Published in ApJL
Where Planets Are Born
Studying protoplanetary disks helps us understand how planets, including those in our solar system, are born. These disks are vast and flared structures, consisting of dust and gas orbiting a young star. Protoplanetary disks contain the remnants of the stellar birth process, in which a collapsing molecular cloud gives rise to a central star surrounded by a swirling disk of material. Protoplanetary disks are vital to observe as they are the birth sites of planets. The tiny dust particles come together, sticking to each other and forming larger bodies. This process, influenced by gravity, gas, and radiation, leads to the birth of planets in developing planetary systems.
Meet the Vampire Sub
This research article features a large edge-on protoplanetary disk that was stumbled upon when going through images from the Pan-STARRS research project as a part of a study of active galactic nucleus candidates. This disk is one of the largest known disks in the sky and is oriented edge on, completely obscuring its central star. Associated with a source of infrared light in the same region of the sky, IRAS 23077+6707, the disk spans approximately 11″ in apparent size, with a very faint structure in the disk’s northern part extending out to about 17″. It is possibly the largest protoplanetary disk (by angular extent) discovered to date. The structure of this disk is reminiscent of the popular Gomez’s Hamburger, which is not associated with any star-forming region, just like the subject of this article. The similarity to a sandwich, along with the fang-like structures in the northern part of the disk as seen in the images in Figure 1, earned the IRAS 23077+6707 protoplanetary disk the name “Dracula’s Chivito” (chivito is a type of sandwich and the national dish of Uruguay, where one of the co-authors is from).
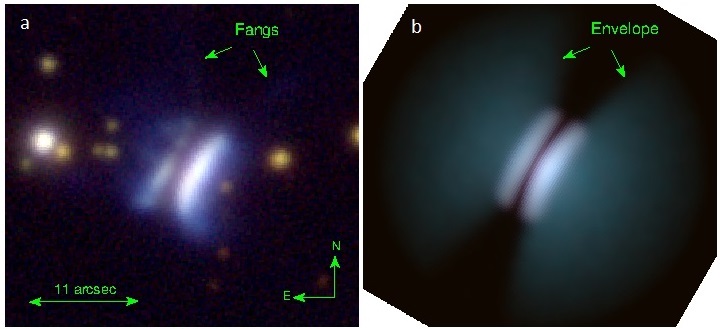
Figure 1: Pan-STARRS image of Dracula’s Chivito (left) and the associated radiative transfer model (right). In the northern part of the disk, very faint filaments are seen extending 17″ out from the edges of the disk. These filaments have been nicknamed “fangs.” These are interpreted as the edges of the disk envelope, as reproduced in the model image. These fangs are likely obscured by a cloud in the southern part of the disk. [Adapted from Berghea et al. 2024]
Decoding DraChi
Analysis: Images of Dracula’s Chivito (henceforth referred to as DraChi) were obtained in the grizy filters of Pan-STARRS (Figure 1). These images and data from the Galaxy Evolution Explorer (GALEX) (ultraviolet), the Two Micron All-Sky Survey (2MASS) (infrared), the Infrared Astronomical Satellite (IRAS) (infrared), and AKARI (infrared) were used for photometric analysis, i.e., flux or brightness measurements. These data were used to construct the spectral energy distribution of the disk (Figure 2), together with a radiative transfer model generated using the code HOCHUNK3D. Radiative transfer models help us understand the disk geometry and how light is scattered by the dust grains in the disk. This light, which we see along our line of sight, is plotted as a spectral energy distribution. Spectral energy distributions give information about how much energy an object gives off at different wavelengths.
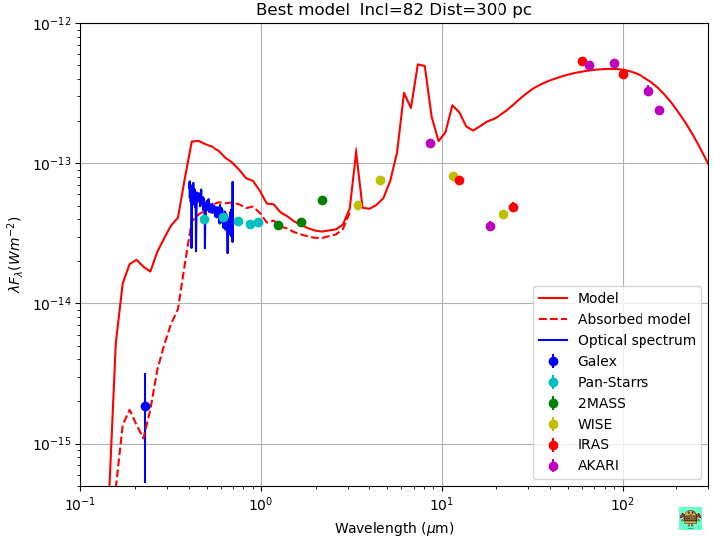
Figure 2: The spectral energy distribution of the disk, using photometric data from the image, the model, and other sources as mentioned in the article. Brightness is plotted as a function of wavelength. The data (colored dots) match the model (the solid red line shows the model without extinction, and the dashed red line shows the model with extinction) in most places except in near- and mid-infrared wavelengths, which could be due to discrepancies between instruments or possible variability in the disk’s luminosity. [Berghea et al. 2024]
Basic Properties: The spectral energy distribution suggests that the host star of the disk is a pre-main-sequence star of type A with a temperature of about 6500–8500K. The images of the disk and the resultant radiative transfer model constrain the disk inclination to be between 80° and 84°. The scale height of the disk is about 25–50 au at a radius of 500 au (astronomical units), where 1 au is the distance from Earth to the Sun. Using the distance and the angular extent of the disk in the sky, the disk’s radius is estimated to be 1,650 au. The radiative transfer model, based on the scattering of the light, quantifies the mass of the disk to be about 0.2 times that of the Sun.
The Fangs: The authors noticed two “fang-like” features in the northern part of the disk, and these features were also reproduced in the model of the disk. The “fangs” closely resemble the “edge” of the shadow created by the disk in the bright surrounding envelope. They could be filaments due to a possible outflow from the central part of the disk, which is characteristic of a young disk at the end of the Class I phase (~0.5 million years old). It is possible that the fangs are present in the south, but this region is likely obscured in the images from Pan-STARRS and could be perhaps seen in infrared (longer-wavelength) imaging.
Is DraChi the Only One?
The short answer is no. DraChi is certainly different from most other protoplanetary disks, given its size and large distance from any known star-forming regions. But the existence of Gomez’s Hamburger proves there are more such disks awaiting discovery. A disk as young as DraChi is vital to understanding planet formation in its earlier stages, and its large size makes for interesting future observations using more sensitive instruments.
Original astrobite edited by Kylee Carden and Jessie Thwaites.
About the author, Maria Vincent:
Maria is a PhD candidate in astronomy at the Institute for Astronomy, University of Hawai’i at Manoa. Her research focuses on adaptive optics and high-contrast imaging science and instrumentation with ground-based telescopes. Driven by a fascination with planet formation and the intricate processes shaping our solar system, she uses the Subaru Coronagraphic Extreme Adaptive Optics suite to observe and study morphological features of protoplanetary disks in near-infrared wavelengths, aiming to understand disk structure and processes governing planet formation. On the instrumentation side, she is working on designing and constructing an optical testbed to test and characterize a new deformable mirror as part of the upcoming High-order Advanced Keck Adaptive Optics upgrade. Outside of work, she enjoys blogging, mystery, historical and science fiction literature and cinemedia, photography, hiking, and travel.
The post A Vampire’s Sandwich Filled with Gas and Dust appeared first on AAS Nova.
]]>
The accretion disks surrounding supermassive black holes could be home to millions of stellar-mass black holes. How can we tell if a disk hosts these black holes?
The post Finding Black Holes Around Black Holes appeared first on AAS Nova.
]]>Researchers estimate that the accretion disks of supermassive black holes could host millions of stars. When these stars evolve into black holes, they may reshape the observational properties of the disks they call home.
Stellar Extremophiles
Countless stars across the universe have taken up residence in the vicinity of supermassive black holes, including in the dusty disks that surround black holes that are actively accreting gas, otherwise known as active galactic nuclei. Some stars are born in these black hole disks, condensing out of the dusty gas on the outskirts of the disk, where the gas is cooler and feels less of the black hole’s tidal pull. Others may be trapped there, the friction of passing through the disk eventually wearing their orbits down until the stars settle within the disk.
Whether born there or captured, many of these stars will evolve into stellar-mass black holes. Researchers estimate that in the 10–100-million-year lifetime of an active galactic nucleus, its disk may host anywhere from 100 to 100 million stellar-mass black holes. How can we tell if a supermassive black hole’s accretion disk is home to stellar-mass black holes?
Heating Up the Outskirts

Modeled temperature of an accretion disk with (blue line) and without (red line) embedded stellar-mass black holes. [Adapted from Zhou et al. 2024]
As stellar-mass black holes orbit within the supermassive black hole’s accretion disk, they accrete some of the gas. This accreted gas becomes extremely hot and emits X-rays that warm the gas that’s nearby. In the outskirts of the disk, where the temperature is lower, this process can heat the disk a potentially measurable amount.

Comparison of the model output for a static standard disk (SSD) and a disk in which stellar-mass black holes are embedded (SSD with sBHs) and a composite active galactic nucleus spectrum. Click to enlarge. [Zhou et al. 2024]
Spotting Black Holes in Black Hole Disks
Zhou’s team compared the spectral energy distributions — how energy output is distributed across different wavelengths of light — for accretion disks that host stellar-mass black holes and those that do not. For a supermassive black hole with a mass of 100 million solar masses, the presence of stellar-mass black holes in the accretion disk greatly boosts the disk’s energy output at wavelengths greater than 470 nanometers (nm) and slightly suppresses the disk’s energy output at shorter wavelengths. For more massive black holes, the energy-boosting effect happens at longer wavelengths, above about 800 nm.
In addition to altering the spectral energy distribution, the presence of stellar-mass black holes may also increase the accretion disk’s half-light radius, or the radius within which half of the disk’s light is emitted. This change is potentially measurable through microlensing of active galactic nuclei by foreground galaxies. In fact, it may have already been measured — some microlensing measurements suggest that the half-light radii of distant active galactic nuclei are 2–4 times larger than expected for a typical accretion disk.
Citation
“Stellar Black Holes Can ‘Stretch’ Supermassive Black Hole Accretion Disks,” Shuying Zhou et al 2024 ApJL 966 L9. doi:10.3847/2041-8213/ad3c3f
The post Finding Black Holes Around Black Holes appeared first on AAS Nova.
]]>
When white dwarfs collide, the merger can create a new white dwarf with a strong magnetic field and powerful winds.
The post Winds of Merged White Dwarfs appeared first on AAS Nova.
]]>In astronomy, sometimes 1 + 1 = 1. That’s the case when white dwarfs collide, creating a single massive remnant that sheds mass through powerful magnetic winds.
When Stellar Remnants Collide
Nearly all of the stars in the Milky Way, including the Sun, are fated to become white dwarfs. These Earth-sized objects are the super-hot crystallized cores of stars that have lost their outer layers after ballooning into red giants. When two white dwarfs collide, the collision can trigger a supernova, create a neutron star — an object even denser than a white dwarf — or merge the two white dwarfs into one.
In a recent research article, Yici Zhong (University of Tokyo) and collaborators modeled the properties of post-merger white dwarfs, focusing on their fast-moving magnetized winds. The results may be applicable to an unusual class of supernovae that are faint, fade quickly, and fail to fully explode — leaving behind a white dwarf remnant.
Magnetic Outflows

Radial velocity of the white dwarf’s wind as a function of latitude. The wind is fastest near the star’s equator. [Adapted from Zhong et al. 2024]
Zhong’s team found that the wind doesn’t emerge from the entire surface of the star equally and is instead fastest and most luminous near the star’s equator. Nor does the wind blow steadily: some of the gas launched from the star’s surface gets trapped in the magnetic field, and a periodic rearranging of the magnetic field ejects bubbles of this trapped gas.
The Winds of WD J005311
These findings may give researchers new ways to study a recently discovered white dwarf called WD J005311, which appears to be the remnant of a collision of white dwarfs that triggered a supernova. Unlike most supernovae caused by colliding white dwarfs, the explosion didn’t destroy the stars completely, and the surviving star’s 16,000-kilometer-per-second winds pummel the supernova remnant from within.

Modeled torque, luminosity, and mass-loss rate of the wind over time. Click to enlarge. [Zhong et al. 2024]
The team’s model also predicts that the star’s wind blows outward 20–40% faster at its equator than its poles, and this asymmetry could be detected through optical spectroscopy. The uneven speed means that the wind exerts more pressure on the surrounding nebula along its equator, possibly creating an uneven shock that could be seen in future X-ray observations.
Citation
“The Optically Thick Rotating Magnetic Wind from a Massive White Dwarf Merger Product. II. Axisymmetric Magnetohydrodynamic Simulations,” Yici Zhong et al 2024 ApJ 963 26. doi:10.3847/1538-4357/ad1f5c
The post Winds of Merged White Dwarfs appeared first on AAS Nova.
]]>
Is GRB 191019A truly a gamma-ray burst, or could it be the first example of an ultra-deep tidal disruption event?
The post A Possible Shredded Star Disguised as a Gamma-ray Burst appeared first on AAS Nova.
]]>Is the gamma-ray burst GRB 191019A a typical long-duration gamma-ray burst from a dying massive star, an anomalously long burst from colliding objects, or something else entirely?
Powerfully Mysterious

An illustration of a neutron star merger, which is one way to create a gamma-ray burst. [ESA 2002/Medialab]
With time and accumulating data, these length-based classifications have become associated with different sources: long gamma-ray bursts seem to arise from core-collapse supernovae, when the curtain closes on stars substantially more massive than the Sun, and short gamma-ray bursts seem to happen when two extraordinarily dense objects like neutron stars collide. However, as the tally of gamma-ray bursts has grown, so has the list of events that fail to fall neatly into these two categories.

This illustration depicts GRB 191019A as resulting from the collision of two stars within the dense environment of a galactic nucleus. Today’s article suggests that the event took place far closer to the galaxy’s supermassive black hole. [International Gemini Observatory/NOIRLab/NSF/AURA/M. Garlick/M. Zamani; CC BY 4.0]
An Alternative Hypothesis
In October 2019, researchers discovered the gamma-ray burst GRB 191019A, which lasted just over a minute and appeared at first to be a standard long burst arising from a supernova. Later, this interpretation was called into question: no associated supernova emission was spotted, the burst was slightly fainter than expected for its type, and its host galaxy wasn’t as vigorously star forming as the galactic hosts of long gamma-ray bursts tend to be. Together, these findings suggested that GRB 191019A may be part of an emerging class of gamma-ray bursts that arise from colliding objects despite lasting longer than two seconds.
In a recent article, a team led by Robert Eyles-Ferris (University of Leicester) explored another possibility: that GRB 191019A isn’t a gamma-ray burst at all. Instead, Eyles-Ferris’s team proposed that rather than a supernova or a cosmic collision, what caused the event was a star that wandered too close to a supermassive black hole and was summarily torn apart — a tidal disruption event.
Examining a Rare Phenomenon
Some aspects of GRB 191019A, such as its location near the center of a galaxy, naturally align with this alternative hypothesis. Other factors, such as the event’s length, seem at odds with this explanation — tidal disruption events tend to play out over the course of months rather than minutes. Eyles-Ferris and collaborators hypothesized that GRB 191019A isn’t just any tidal disruption event but an ultra-deep one, in which the doomed star is so stretched out by the black hole’s tidal forces that the star wraps all the way around the black hole and collides with itself, launching a relativistic jet in the process.
Using a mathematical model, Eyles-Ferris and coauthors showed that GRB 191019A’s luminosity and time scale are consistent with what’s expected for an ultra-deep tidal disruption event. If this hypothesis is correct, GRB 191019A is the first example of an ultra-deep tidal disruption event and just the fifth known jetted tidal disruption event. As rare as these events are likely to be, other instances will crop up somewhere in the vastness of the universe, and Eyles-Ferris’s team has a way to pick them out: a flash of low-energy X-rays that erupts the moment the star collides with itself.
Citation
“Ultradeep Cover: An Exotic and Jetted Tidal Disruption Event Candidate Disguised as a Gamma-ray Burst,” R. A. J. Eyles-Ferris et al 2024 ApJL 965 L20. doi:10.3847/2041-8213/ad3922
The post A Possible Shredded Star Disguised as a Gamma-ray Burst appeared first on AAS Nova.
]]>
Astrobites reports on a class of accreting stars nicknamed "hamstars" that store overflow matter in stellar "cheeks" to eat later.
The post Unveiling Hamstars: The Cheek-Stuffing Accreting Stars appeared first on AAS Nova.
]]>Editor’s Note: Astrobites is a graduate-student-run organization that digests astrophysical literature for undergraduate students. As part of the partnership between the AAS and astrobites, we occasionally repost astrobites content here at AAS Nova. We hope you enjoy this post from astrobites; the original can be viewed at astrobites.org.
Title: Expansion of Accreting Main-Sequence Stars During Rapid Mass Transfer
Authors: Mike Y. M. Lau et al.
First Author’s Institution: Heidelberg Institute for Theoretical Studies
Status: Published in ApJL
In our universe, most stars live in binaries. These stars live together, orbiting around each other, evolving and influencing each other’s lives. For many stars, this can be a tumultuous relationship with periods of mass transfer, altering the stars’ lives from the typical single-star evolution from a main-sequence star to a red giant to a stellar remnant. Mass transfer allows stars to grow and shrink in mass through their evolution, changing their identities and speeding up or slowing down their evolution. Mass transfer can also cause stars to go supernova.

Figure 1: An Illustration of Roche lobe filling of binary stars in three different scenarios, A, B, and C. The left column shows the gravitational potential wells for each star, while the right column outlines the stars and their Roche lobes (the teardrop shapes around them). In scenario A, the matter of both stars is within each potential well and the stars are detached. In scenario B, the left star has expanded and filled its Roche lobe, causing matter to accrete onto the right star. In scenario C, both stars have filled their Roche lobes and orbit in a contact binary. [Storm Colloms, adapted from Pringle and Wade, Interacting Binary Stars (1985, Cambridge University Press)]
As common as mass transfer is in the lives of stars, there are a lot of unknowns about mass transfer processes. Astronomers make simulations of stars transferring mass to try to understand these unknowns better. Simulating a fully accurate model of these processes requires many computational resources to model the hydrodynamic processes in all dimensions, and so models always make some simplifying assumptions.
One big simplifying assumption is how much of the donor star’s mass can be packed onto the accreting star. Previous models assumed that the accreting star does not change with time when accepting mass from the donor star. However, today’s authors are actually able to investigate how the properties of the accreting star change through the mass-transfer period using a stellar evolution code called Modules for Experiments in Stellar Astrophysics (MESA).
The authors show that how the accretor’s mass and radius respond to mass transfer depends on two timescales: 1) the thermal timescale of the accretor — this is the timescale on which the accretor can radiate away all of its thermal energy, and 2) the timescale of the accretion — this is the rate of mass transfer from the donor to the accretor. The thermal timescale of the accreting star is generally much longer than the mass-transfer timescale, meaning that during mass transfer the accreting star is fed mass much more quickly than it can “swallow” it, or have it thermally cool and settle onto the star. However, the accreting star can store this accreted matter in an envelope around it, stuffing it in its cheeks much like a hamster, as long as this does not spill over the edge of the Roche lobe — hence why the authors coin the name “hamstars” for these stars. This “cheek stuffing” makes the accreting star grow in radius and cool much like a typical main-sequence star becoming a red giant, as shown in Figure 2. As the star accretes more and more and its luminosity increases, its thermal timescale decreases, and it can radiate away the energy of accreting mass and “swallow” the matter faster. The star then shrinks from its expanded radius, having grown several times in mass.
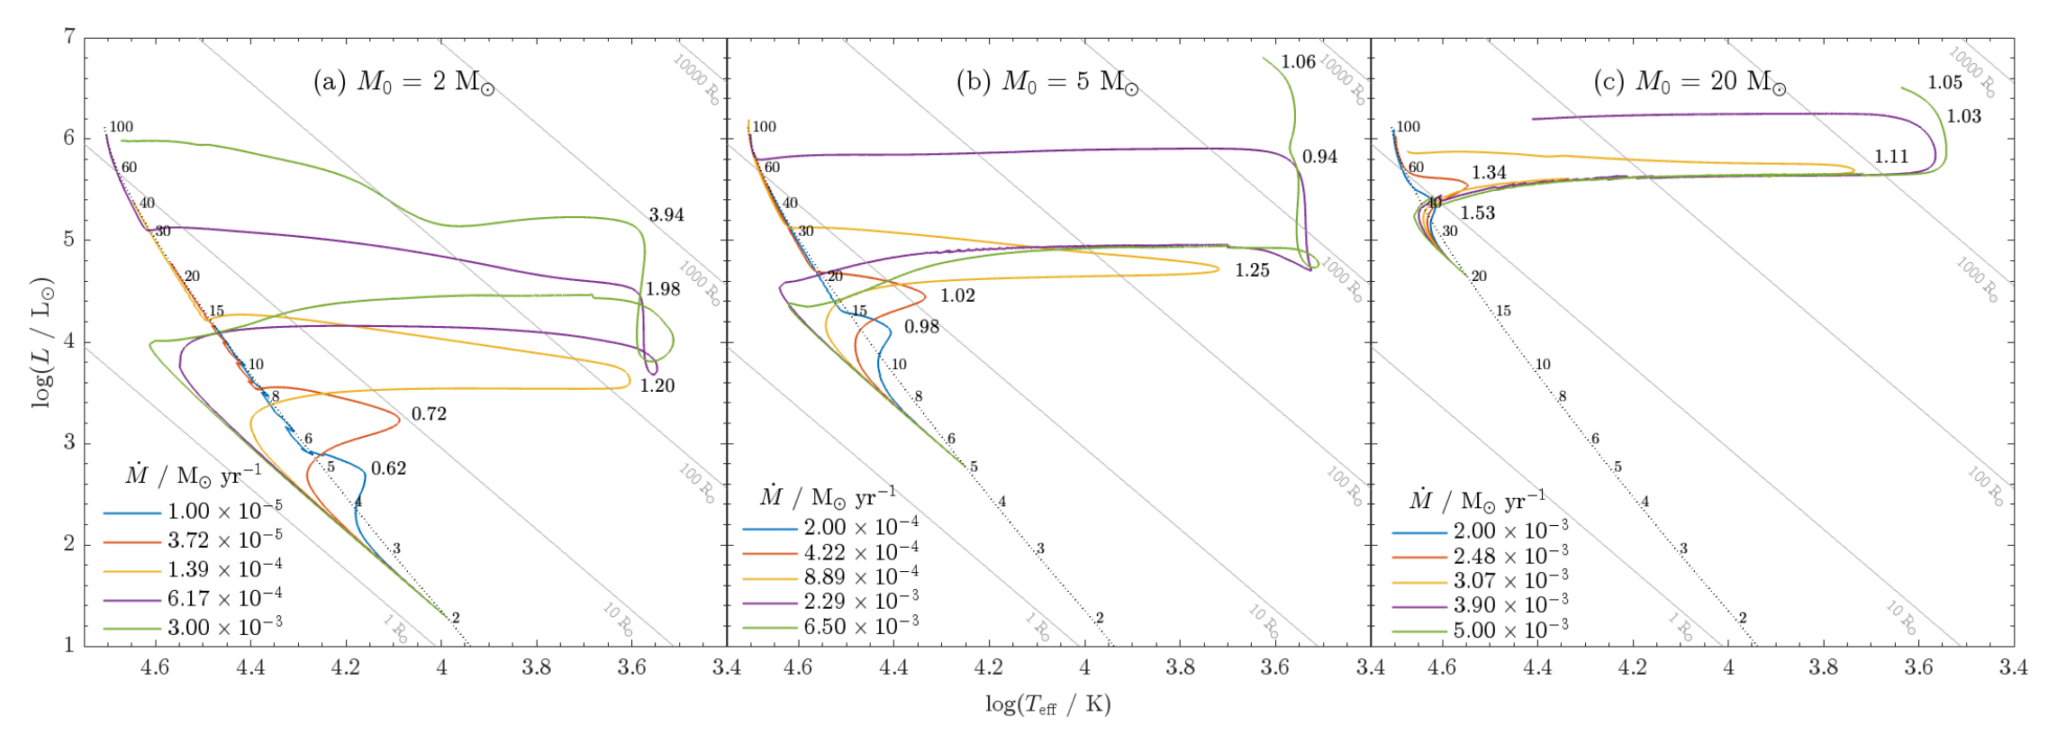
Figure 2: Hertzsprung–Russell diagrams showing the evolution of the accreting star during mass transfer. The three panels show the temperature versus luminosity for accretors of different initial masses, and each track in the panels is a different rate of mass transfer in the simulation. Most of the stars cool at some point in evolution, expanding in radius, before the accreted matter can cool onto the star and it shrinks and heats again, resuming its usual evolution having grown several times in mass. [Lau et al. 2024]
The accretion efficiency determines how much of the mass accreted actually makes it onto the accreting star, versus how much might be lost during mass transfer. While low-mass stars can pack a lot of accreting matter in their hamster cheeks, high-mass stars have a lower limit for how much matter they can chew. These higher-mass accreting stars make up observed populations of X-ray binaries and the progenitors of pairs of black holes and/or neutron stars. Compared to current models, the authors’ prescription for accretion efficiency is in better agreement with the observed population of X-ray binaries and predicts fewer merging black hole binaries that could be observed with gravitational waves, something we could investigate further with more observations.
While today’s article considers the accretor’s response to mass transfer (pinning down the similarities between stars and rodents), it does not account for the accreting star’s spin or mass loss. If a star is spinning fast, it could limit how much the accreting star can expand. Some mass can also be swept away by stellar winds, meaning that not all of the mass lost by one star is accreted onto the other. Future work is needed to incorporate these additional factors before we can look up into the cosmos for a great hamstar hunt!
Original astrobite edited by Lucie Rowland.
About the author, Storm Colloms:
Storm is a postgraduate researcher at the University of Glasgow, Scotland. They work on understanding populations of binary black holes and neutron stars from the gravitational wave signals emitted when they merge, and what that tells us about the lives and deaths of massive stars. Outwith astrophysics they spend their time taking digital and film photos, and making fun doodles of their research.
The post Unveiling Hamstars: The Cheek-Stuffing Accreting Stars appeared first on AAS Nova.
]]>
Compact blue dwarf galaxies share many properties with galaxies in the early universe, giving researchers a way to study distant, ancient galaxies up close.
The post Featured Image: A Tale of Three Dwarf Galaxies appeared first on AAS Nova.
]]>The images above show three blue compact dwarf galaxies dotted with pink star-forming knots. Just a tenth of the size of the Milky Way, blue compact dwarfs are unique among galaxies with high star-formation rates in that they’re mostly free of dust and have low abundances of metals (elements heavier than helium) — properties they share with galaxies in the early universe. Using Hubble Space Telescope data, Rupali Chandar (University of Toledo) and collaborators investigated the star-formation histories of the three blue compact dwarfs pictured above. The team sought to understand whether these galaxies are all undergoing bursts of star formation, in which new stars are created at 10 times the usual rate. Their analysis revealed that while all three galaxies are forming plenty of new stars, only Haro 11 is truly experiencing a burst; ESO 185 was forming stars about four times faster than normal about 40 million years ago, and ESO 338 hasn’t seen much change in its star formation over the last few billion years. To learn more about the star-formation histories of these peculiar blue galaxies, be sure to check out the full research article linked below.
Citation
“A Tale of Three Dwarfs: Cluster-Based Star Formation Histories of Blue Compact Dwarf Galaxies,” Rupali Chandar et al 2024 ApJ 965 95. doi:10.3847/1538-4357/ad293a
The post Featured Image: A Tale of Three Dwarf Galaxies appeared first on AAS Nova.
]]>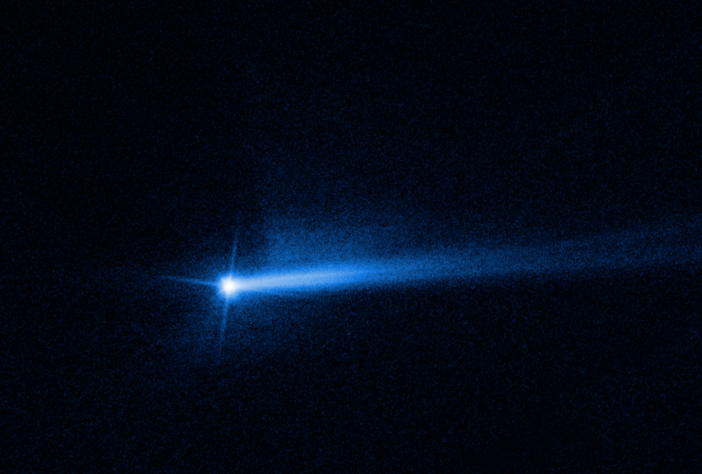
After observing a planned impact between an asteroid and a spacecraft, astronomers wondered: could we detect colliding pairs of natural asteroids?
The post Possibility of Detecting Clumsy Asteroids appeared first on AAS Nova.
]]>A bold NASA experiment demonstrated that when an asteroid runs into something really hard, all of the ejected material reflects extra light back to Earth and makes the bruised asteroid appear slightly brighter for a short time. Recently, astronomers have built on that finding to estimate the chances of observing a similar flash out in the wilds of the main belt when two asteroids bump into each other by chance.
A DART of Inspiration
Back in September of 2022, NASA did its best to avenge the dinosaurs by slamming a small spacecraft into the moon of an asteroid. Aside from their vindictive motives, the agency had another, slightly more important reason for such an aggressive act. Astronomers and planetary defense experts wanted to watch how the asteroid would respond to a high-speed collision, and knowing exactly when one would occur allowed them to be ready with their telescopes. The Double Asteroid Redirection Test (DART) mission, as it was called, was a fabulous success, and the scientists involved got plenty of data along with the satisfaction of carrying out revenge 65 million years in the making.
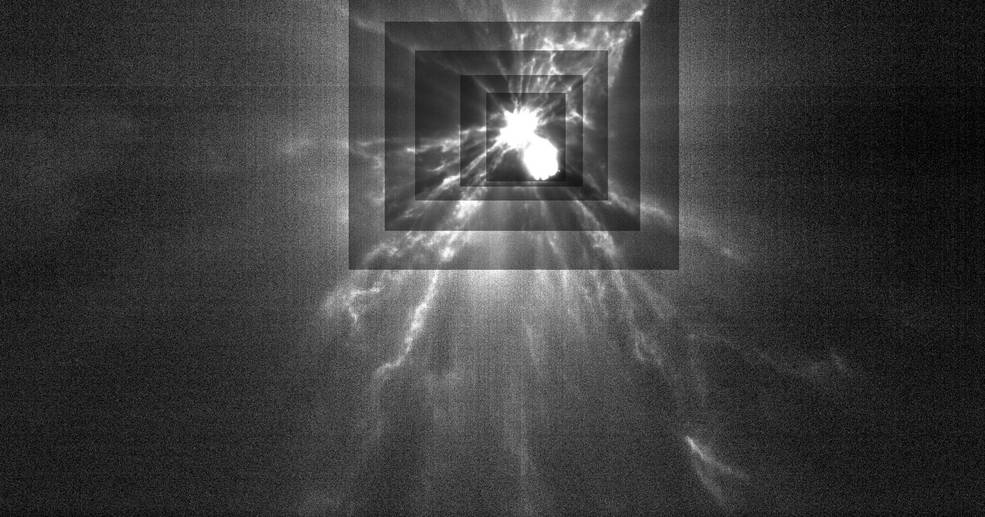
A close-up view of the aftermath of the DART impact captured by a nearby spacecraft. [ASI/NASA/APL]
Now, many months after the initial excitement, a team of astronomers led by Eran Ofek, Weizmann Institute of Science, have hit upon a realization: if asteroids flash during a collision, could we detect the small blips caused by an impact between two natural asteroids, instead of an asteroid and a human-made spacecraft?
Estimating Collision Rates
To answer their question, Ofek and collaborators needed to combine the answers to two smaller questions. First, would these natural collisions be bright enough to observe from Earth? Second, how often would these collisions actually take place? Both questions are non-trivial to solve, though following the success of DART, the first was slightly easier to tackle.
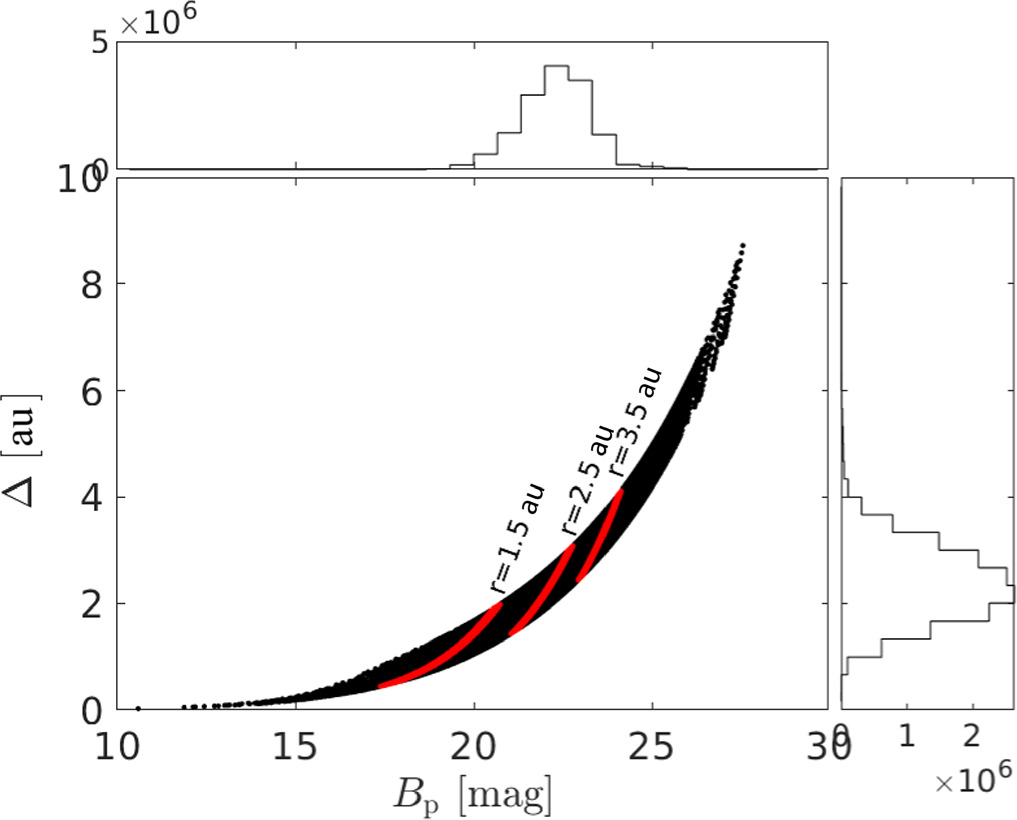
The distribution of brighness and distance to potential asteroid collisions. [Ofek et al. 2024]
Potential for Discoveries
Combining their insights, the researchers established that about 7,000 asteroid collisions could be detectable every year, plus or minus about an order of magnitude. That’s thrilling, but also puzzling: if multiple asteroids slam into each other and flash every night, why haven’t we seen them? The team offered two solutions: first, we actually have detected this phenomenon, and collisions make up at least a subset of the three or so “active asteroids” that are spotted each year. Second, these flashes are just too short to be caught by standard surveys, which would have to observe the same spot in the sky at least twice in one hour to resolve the brightening. Happily, that means with the right survey design, we could potentially recover many more of these collisions. Perhaps in the years to come astronomers will observe asteroid collisions even when they aren’t the cause of them.
Citation
“Asteroid Collisions: Expected Visibility and Rate,” Eran O. Ofek et al 2024 AJ 167 190. doi:10.3847/1538-3881/ad2c03
The post Possibility of Detecting Clumsy Asteroids appeared first on AAS Nova.
]]>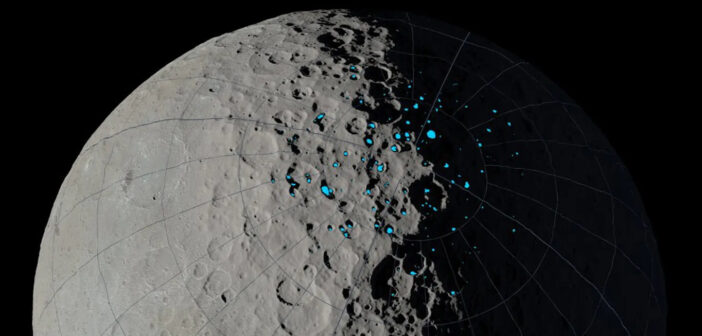
The dwarf planet Ceres hosts water ice in cold, shadowed craters. New research suggests that these ice deposits are remarkably young.
The post Ice Trapped in Craters on Ceres Is Surprisingly Young appeared first on AAS Nova.
]]>Many of the craters on the dwarf planet Ceres are home to deposits of water ice. New research examines the ice-trapping properties these cold, shadowed craters and finds that the ice must be surprisingly young.
Dwarf Planet Discoveries
The Dawn spacecraft captured this image of a crater wall on Ceres from an altitude of about 26 miles (43 kilometers). [NASA/JPL-Caltech/UCLA/MPS/DLR/IDA]
From 2015 to 2018, NASA’s Dawn mission examined Ceres from orbit, reaching an altitude as low as 22 miles (35 kilometers) above the dwarf planet’s surface. Dawn peered into the craters at Ceres’s poles, many of which never see direct sunlight during Ceres’s 4.6-Earth-year orbit around the Sun, and discovered ice on some of the shadowed crater floors. Now, researchers have examined the locations and properties of these ice deposits to estimate how long they’ve been present.
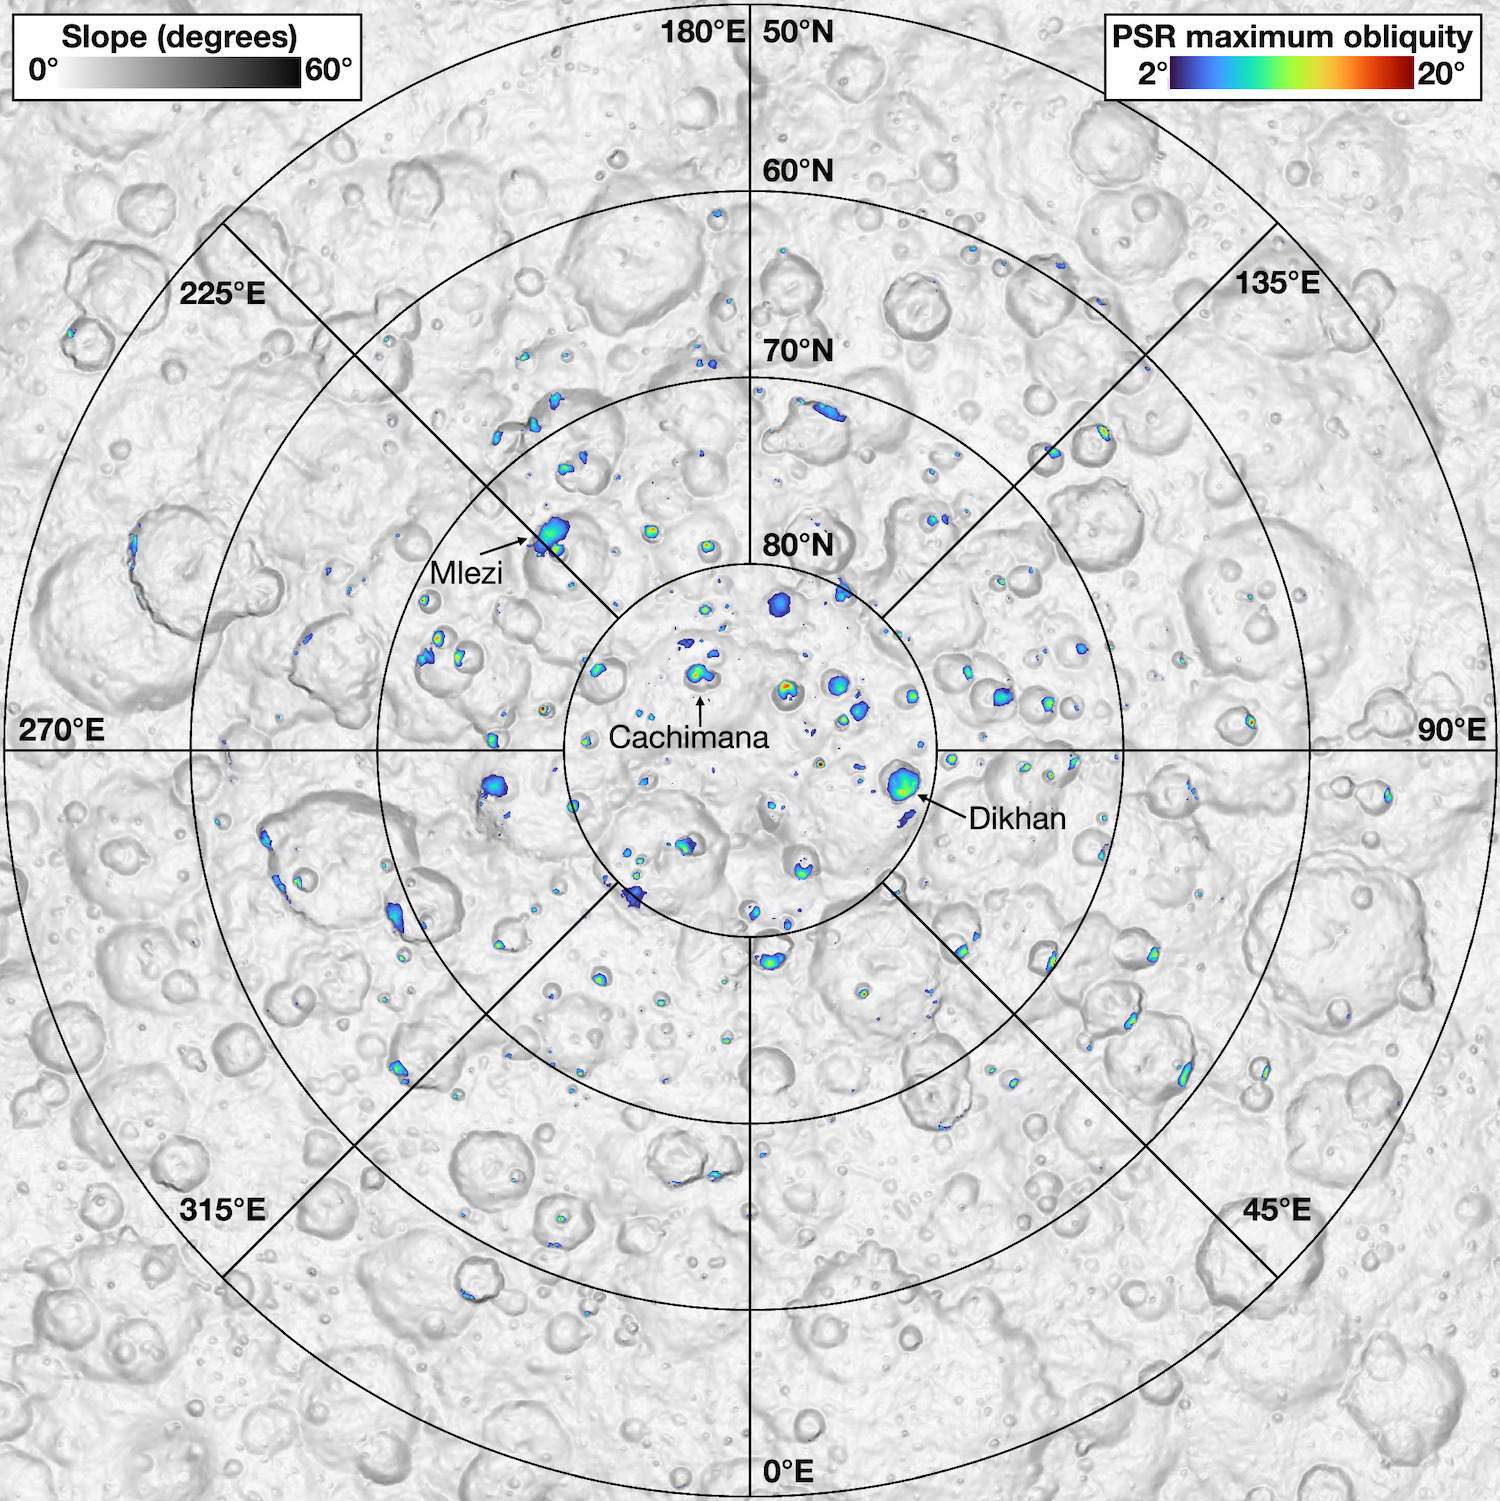
The slope of the terrain surrounding Ceres’s north pole (grayscale) with the locations of permanently shadowed regions colored by the maximum obliquity at which they remain in shadow. Click to enlarge. [Schorghofer et al. 2024]
Crater Considerations
Norbert Schorghofer (Planetary Science Institute) and collaborators used a detailed model of Ceres’s shape based on Dawn data to predict which of Ceres’s craters remain shadowed as its axial tilt, or obliquity, changes. Influenced by tidal forces from the Sun and Jupiter, Ceres’s obliquity varies from 2 degrees to 20 degrees over the course of 24,000 years. The team found that when Ceres reaches its maximum obliquity, there are no crater floors that remain shadowed throughout a Ceres year.
To understand what this means for the history of ice deposits on Ceres, Schorghofer’s team estimated how long it would take for ice on Ceres disappear through sublimation, transitioning directly from solid to gas. They found that when exposed to direct sunlight, ice deposits on Ceres sublimate rapidly, disappearing at a rate of more than a centimeter per year. If sublimation rates were small, that could mean that ice on Ceres could survive for billions of years. Instead, this result means that Ceres’s ice can’t survive long when exposed to sunlight and must be young.
Young Ice
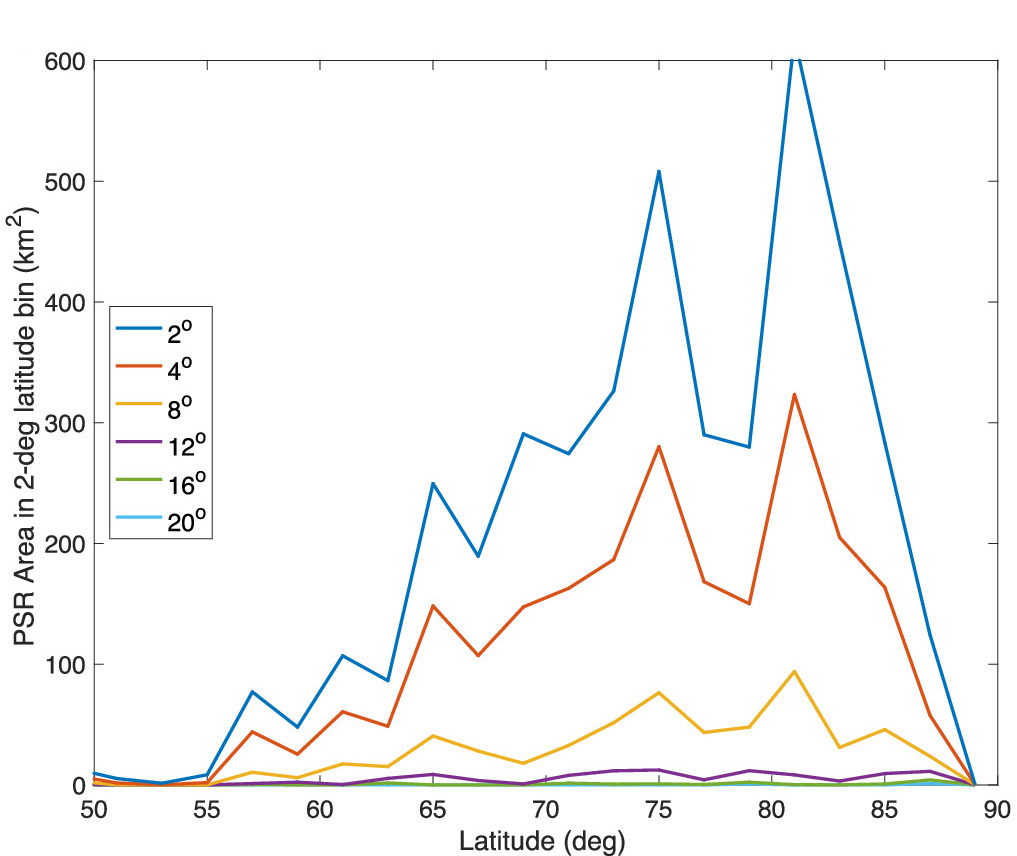
The area of shadowed regions as a function of latitude and obliquity. When Ceres’s obliquity reaches 20 degrees, there are no places that remain shadowed all year. [Adapted from Schorghofer et al. 2024]
Ceres contains a lot of ice hidden under just a few centimeters of rocky surface material, so anything that disturbs the surface, such as landslides or impacts, could expose the ice. The authors find that the most likely source of Ceres’s surface ice is an impact that created a temporary atmosphere that condensed into ice in its craters.
Finally, the authors looked into the possibility of other types of ice, such as carbon dioxide ice, lining crater floors on Ceres. Despite being incredibly cold, Ceres’s craters are too warm to trap gases other than water vapor as ice.
Citation
“History of Ceres’s Cold Traps Based on Refined Shape Models,” Norbert Schorghofer et al 2024 Planet. Sci. J. 5 99. doi:10.3847/PSJ/ad3639
The post Ice Trapped in Craters on Ceres Is Surprisingly Young appeared first on AAS Nova.
]]>
Astrobites reports on whether photoevaporation or core-powered mass loss is more likely to be responsible for the exoplanet radius gap.
The post The Case of Shrinking Planets appeared first on AAS Nova.
]]>Editor’s Note: Astrobites is a graduate-student-run organization that digests astrophysical literature for undergraduate students. As part of the partnership between the AAS and astrobites, we occasionally repost astrobites content here at AAS Nova. We hope you enjoy this post from astrobites; the original can be viewed at astrobites.org.
Title: Scaling K2. VII. Evidence for a High Occurrence Rate of Hot Sub-Neptunes at Intermediate Ages
Authors: Jessie L. Christiansen et al.
First Author’s Institution: NASA Exoplanet Science Institute, California Institute of Technology
Status: Published in AJ
Exoplanets come in all shapes and sizes. Some are large and gaseous, like Jupiter or Neptune, while others are small and rocky, like Earth. Curiously, there seems to be a lack of a certain size of planet — those that have radii 1.5–2 times Earth’s radius — and no one is sure why. Since we can detect exoplanets with sizes above and below this radius range, this dearth of planets is not likely due to a detection bias, but rather some physical mechanism at play. Astronomers believe that planets that form in this intermediate size range have a hard time holding onto their atmospheres and shrink due to some mass-loss mechanism. The authors of today’s research article investigate which mechanism is the most likely culprit for this observed phenomenon.
Mind the (Radius) Gap
Since the first detection of an exoplanet in 1992, the number of confirmed exoplanets has been increasing astronomically. Now astronomers have detected enough planets (5,612 and counting) to try to understand the underlying distributions between different populations of planets. When plotting the radius distribution of planets detected by the Kepler space telescope, Fulton et al. 2017 found that the radius distribution of small planets is bimodal — that is, there are two distinct peaks corresponding to two different planet populations, known as super-Earths and sub-Neptunes, and few planets in between them (see Figure 1). Super-Earths are rocky planets with sizes around 1.5 times that of Earth, while sub-Neptunes are gaseous planets, similar in composition to Neptune, but with radii between 2 and 3 times the radius of Earth. The scarcity of planets between these two populations, between 1.5 and 2 times the size of Earth, is often referred to as the “radius gap” or “radius valley,” where the occurrence rate of known exoplanets is much lower than expected.
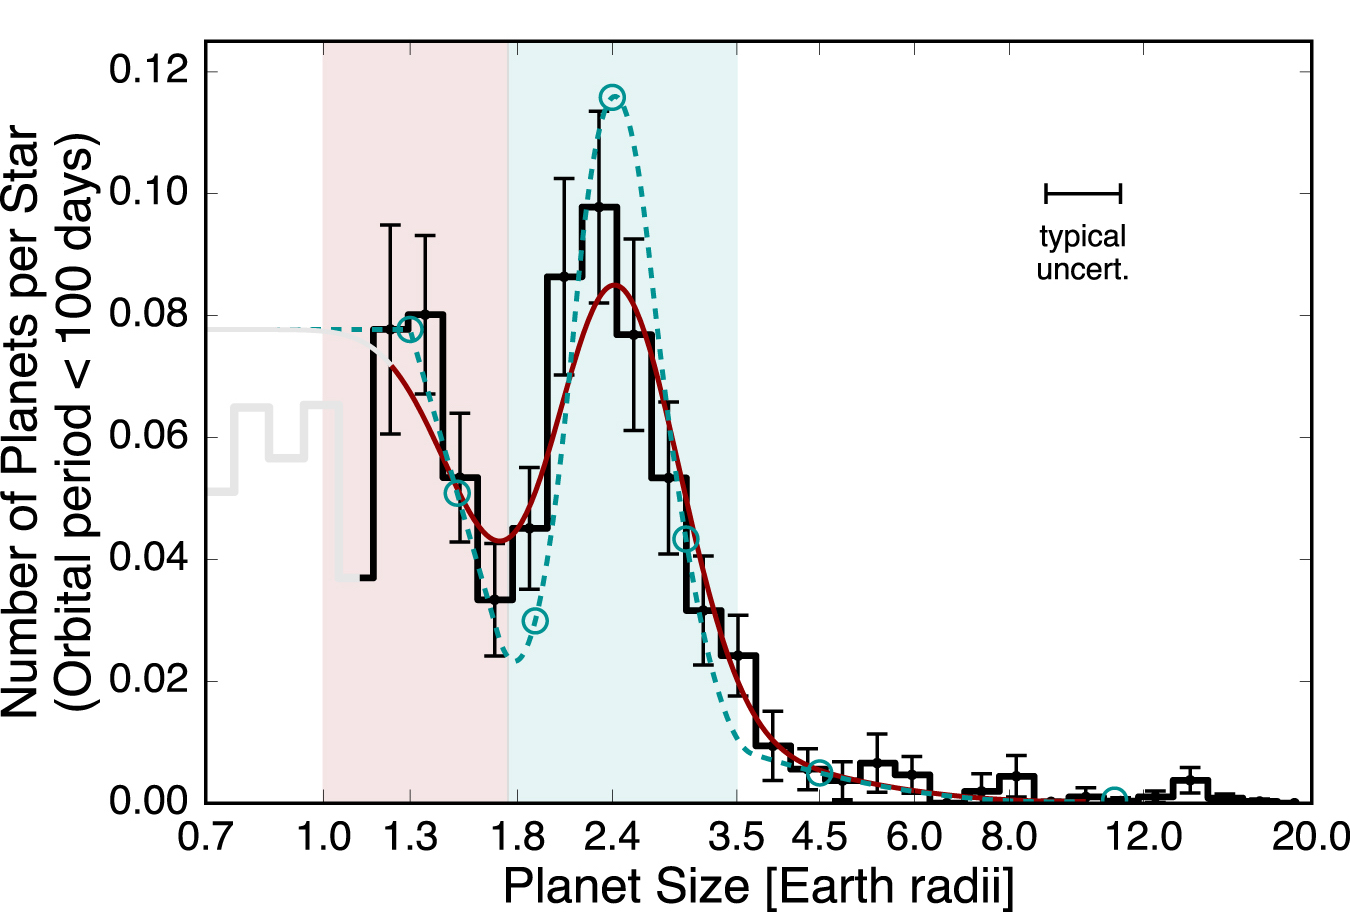
Figure 1: The histogram of planet radii for a sample of Kepler planets with orbital periods shorter than 100 days. The super-Earth and sub-Neptune regimes are highlighted in light red and light cyan, respectively. The “radius gap” corresponds to the decreased occurrence rate between 1.5 and 2.0 Earth radii. [Adapted from Fulton et al. 2017]
On the other hand, the core-powered mass-loss scenario predicts that the energy generated from the planet’s own core as it cools propagates to its outer layers and blows away its atmosphere if the planet is not initially massive enough to hold onto it. This process is much slower, taking a whopping 0.5–2 billion years to complete. Both theories have a lot of compelling evidence, so which is more likely? In order to address this question, the authors of today’s article turned to NASA’s K2 mission.
Photoevaporation or Core-Powered Mass Loss?
While NASA’s Kepler space telescope was originally designed to observe just one patch of the sky, its high-precision pointing began to fail in 2013, causing it to stray away from its original field of view. Luckily, it was able to be repurposed into the K2 mission, where it instead began to observe stars along the ecliptic plane. Its new field of view contained the Praesepe and Hyades star clusters, two populations of stars between 600 million and 800 million years old. Because planets are roughly the same age as their host stars, astronomers were able to detect a large number of planets old enough to experience photoevaporation, but not old enough to have undergone core-powered mass loss. The authors looked for sub-Neptune-sized planets in these two clusters (i.e., the planet population just above the radius valley) and predicted that if they observed a high occurrence rate of sub-Neptunes, they can conclude that photoevaporation could not be the leading cause of this mysterious mass loss.
And that is exactly what they observed. As shown in Figure 2, the occurrence rate of sub-Neptunes is 79%–107% for stars in the Praesepe cluster. This occurrence rate is much higher than the occurrence rate of ~20% for sub-Neptunes around field stars (i.e., stars not associated with a cluster), which can be much older. This result is also consistent with a previous result from clusters observed by the Transiting Exoplanet Survey Satellite (TESS), where the authors found a fractional occurrence rate of ~100% for sub-Neptunes that were roughly 50 million years old. If photoevaporation were the driving mechanism of mass loss, the occurrence rate of sub-Neptunes should be closer to that of planets around field stars, since their atmospheres would have been completely stripped by photoevaporation by this age.
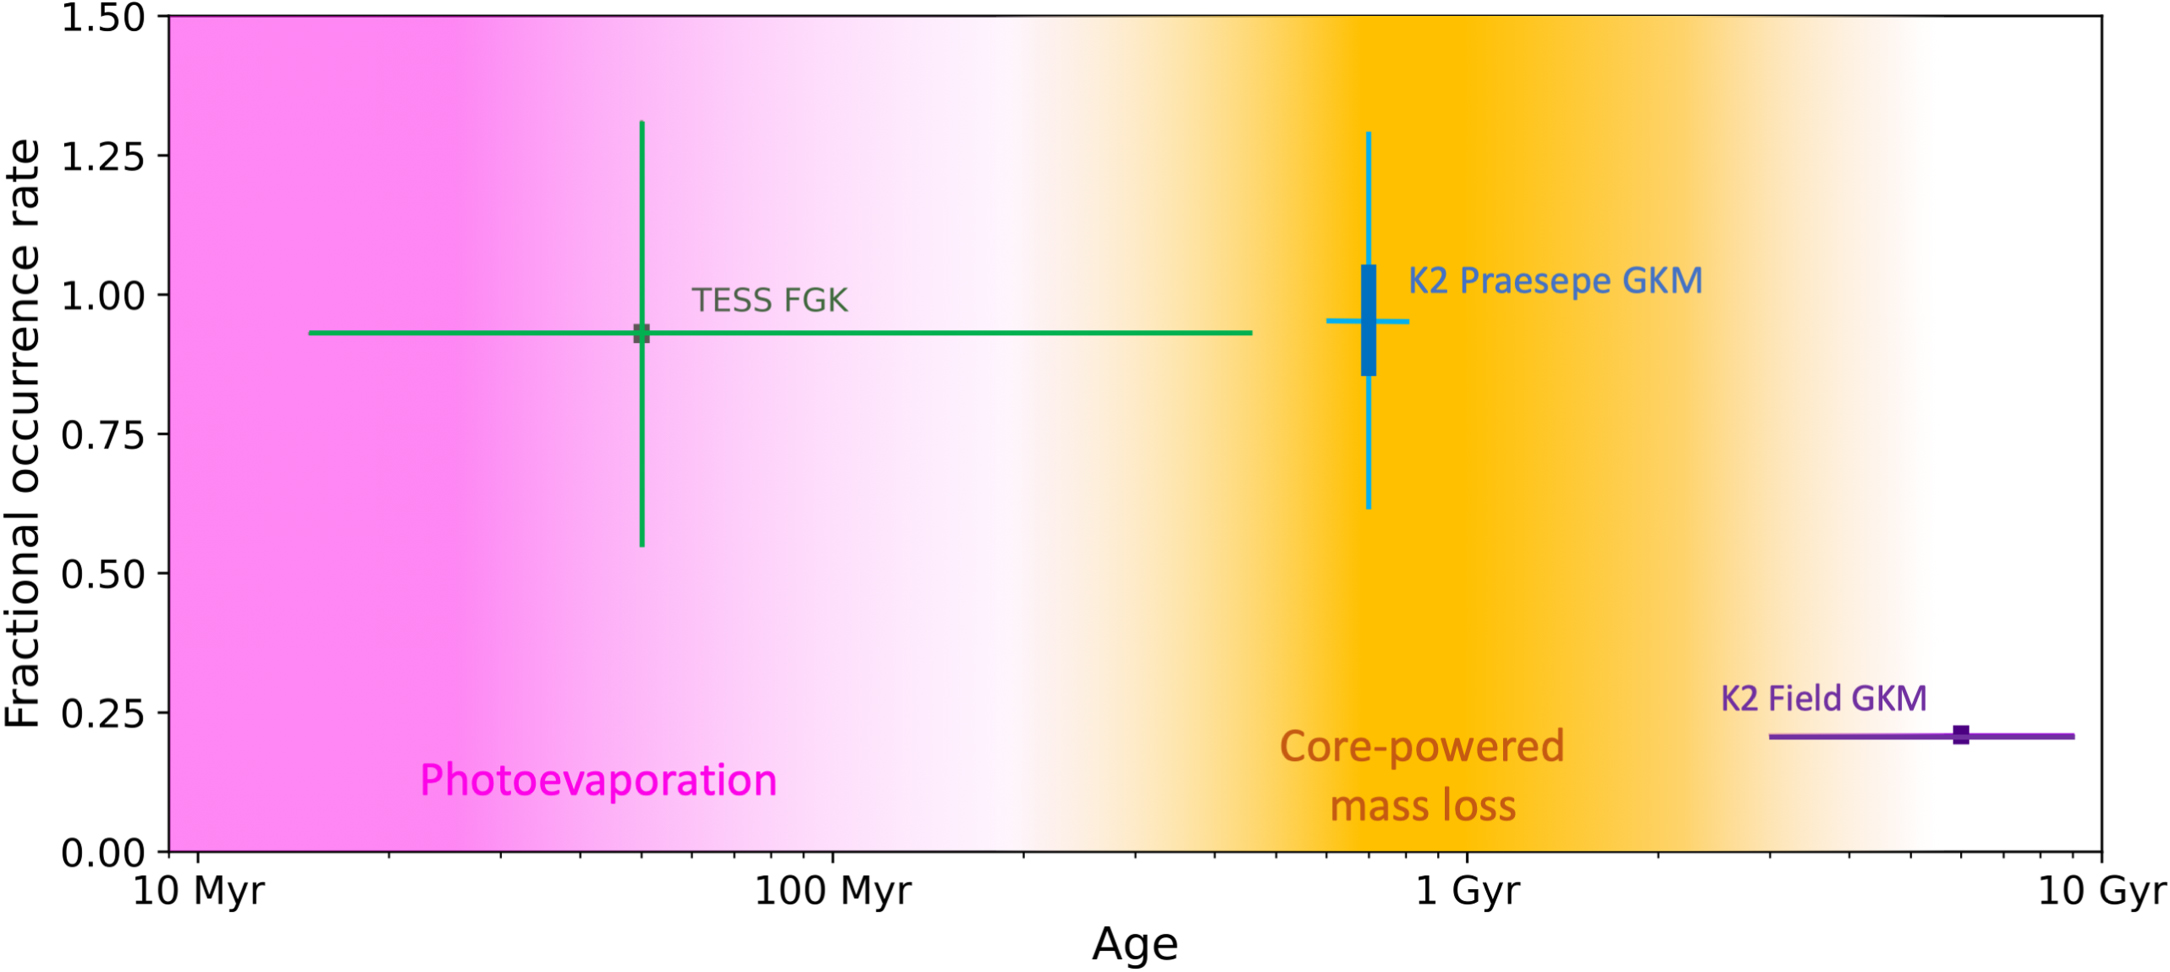
Figure 2: The occurrence rates of sub-Neptunes over time, from the young cluster stars detected with TESS (15–450 Myr) from Fernandes et al. 2023, to the intermediate-age (600–800 Myr) Praesepe stars detected with K2 from this paper, to the old field K2 stars (3–9 Gyr). The shaded pink region indicates the timescales where photoevaporation is predicted to occur (<100 Myr) and the orange shaded region shows the timescale where core-powered mass loss is predicted to occur (0.5–2 Gyr). The drop in occurrence rate occurs after the core-powered mass-loss timescale, making it the more favorable mass-loss mechanism. [Christiansen et al. 2023]
Original astrobite edited by Junellie Gonzalez Quiles.
About the author, Tori Bonidie:
I am a 4th-year PhD candidate studying exoplanets at the University of Pittsburgh. Prior to this, I earned my BA in astrophysics at Franklin and Marshall College, where I worked on pulsar detection as a member of NANOGrav. In my free time you can find me cooking, napping with my cat, or reading STEMinist romcoms!
The post The Case of Shrinking Planets appeared first on AAS Nova.
]]>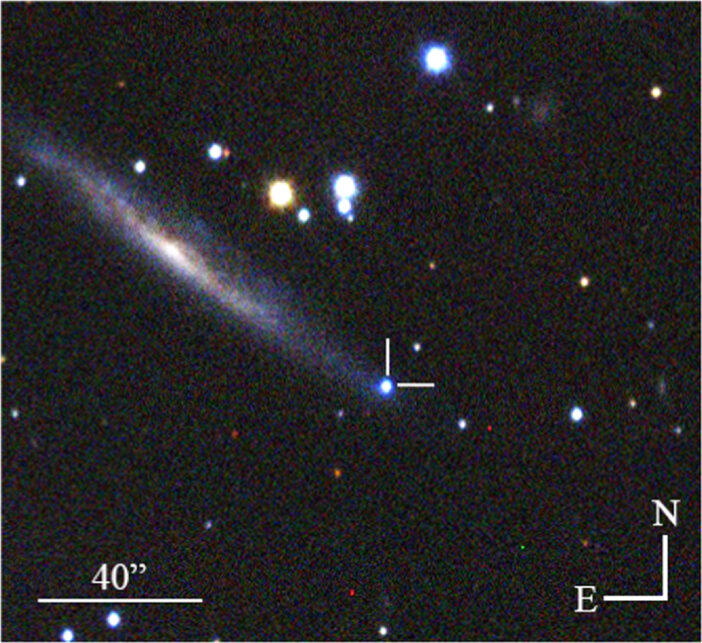
If caught just a few days later, SN 2022jox would've looked like just another ordinary core-collapse supernova, but early observations set it apart, revealing the gas expelled in the star's final years.
The post Early Observations May Separate “Ordinary” Supernovae from Intriguing Ones appeared first on AAS Nova.
]]>If caught just a few days later, SN 2022jox would’ve looked like just another ordinary core-collapse supernova, but early observations set it apart, revealing the gas expelled in the star’s final years.
The Extraordinary Made (More) Ordinary
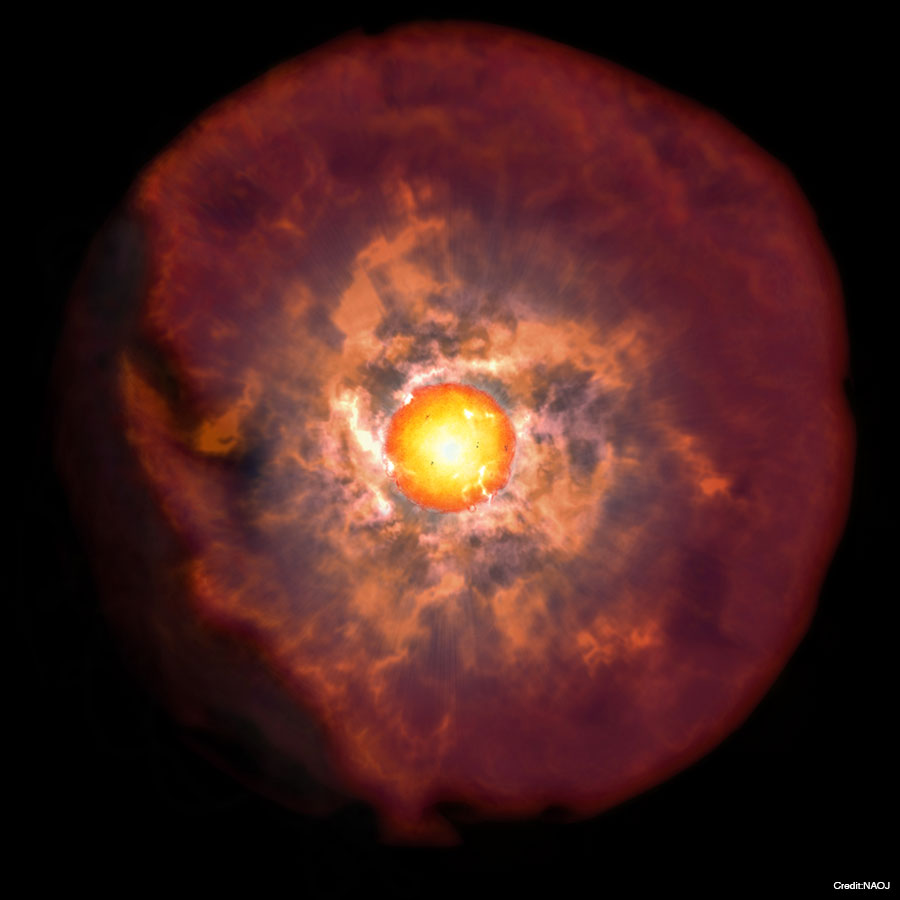
An illustration of a red supergiant star surrounded by thick circumstellar material. [NAOJ]
These once-elusive early observations give a critical look at what the star was up to before its collapse. Observations suggest that in the final years of their lives, many massive stars lose mass through winds or eruptions. In the first few hours or days after a supernova explosion, the expanding ejecta collides with the material previously lost by the star, creating a burst of short-lived emission lines called a flash spectrum. Once the flash spectrum fades, this crucial information about the star’s immediate surroundings is lost.
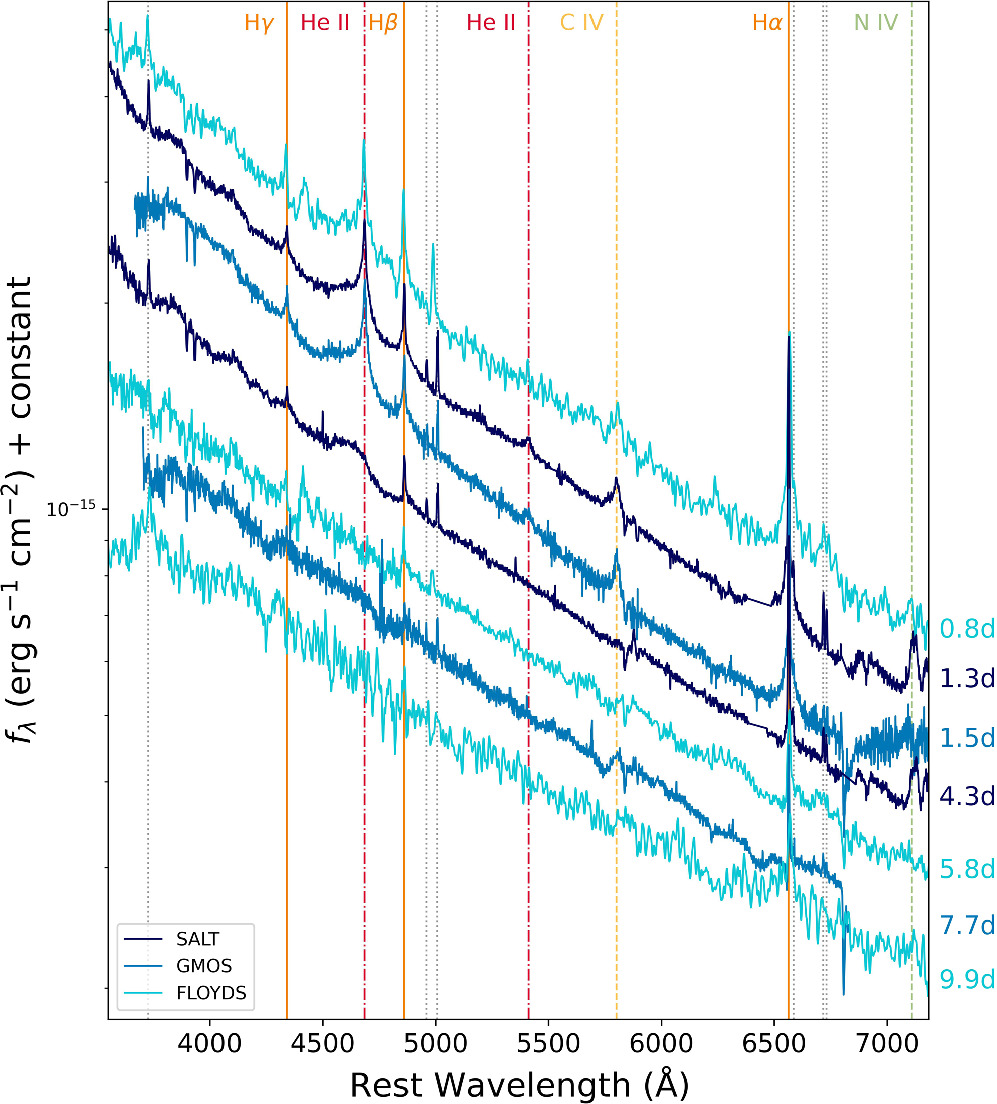
Spectra of SN 2022jox taken 0.8–9.9 days after explosion. Click to enlarge. [Andrews et al. 2024]
Early Observations
In a recent research article, Jennifer Andrews (NSF’s NOIRLab and Gemini Observatory) and collaborators analyzed the flash spectrum and light curve of the supernova SN 2022jox. The event was caught soon after exploding by the Distance Less Than 40 Mpc Survey, which aims to find supernovae in nearby galaxies (within about 130 million light-years) within one day of the explosion reaching Earth.
At just 0.8, 1.3, and 1.5 days after the explosion, spectra of SN 2022jox showed narrow emission lines from hydrogen, helium, carbon, and nitrogen. Using radiative transfer modeling, Andrews’s team found that the gas surrounding the supernova was likely lost by its progenitor star at the rate of a thousandth to a hundredth of a solar mass per year — a high value for a quiescent red supergiant star, but typical for other supernovae with flash features in their spectra.
Critical First Days
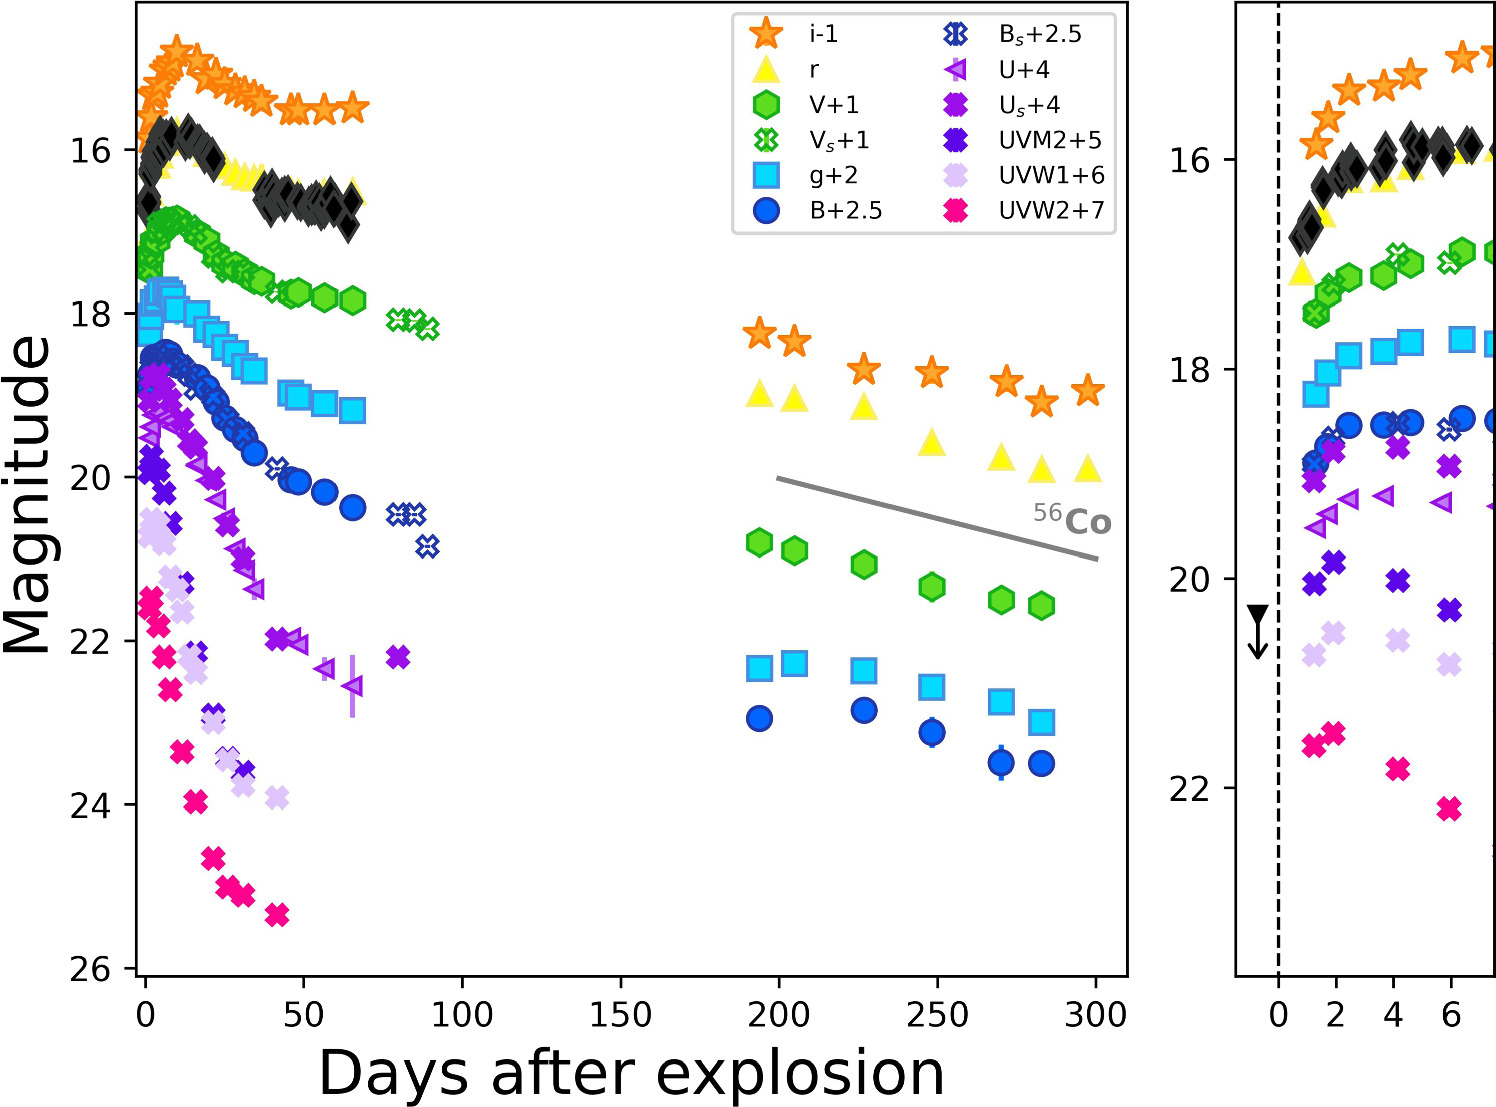
Multi-band light curves of SN 2022jox. The right panel shows a zoom-in of the first week of data. Click to enlarge. [Andrews et al. 2024]
Months after SN 2022jox was detected, the authors saw evidence for the expanding supernova interacting with circumstellar gas once again. Taken together, the very early and very late observations of this supernova suggest that it may be common for circumstellar material to be present around “ordinary” supernovae, and observations over a wide time frame are needed to detect these cases.
Citation
“SN 2022jox: An Extraordinarily Ordinary Type II SN with Flash Spectroscopy,” Jennifer E. Andrews et al 2024 ApJ 965 85. doi:10.3847/1538-4357/ad2a49
The post Early Observations May Separate “Ordinary” Supernovae from Intriguing Ones appeared first on AAS Nova.
]]>
New research explores a way to probe for cracks in special relativity with a subtle measurement of gamma-ray photons.
The post Devising a Test for Special Relativity appeared first on AAS Nova.
]]>One of the fundamental tenets of Einstein’s special theory of relativity is that the laws of physics are the same regardless of your vantage point. New research suggests a way to probe for cracks in this theory with a subtle measurement of gamma-ray photons.
Testing Special Relativity
Special relativity, which describes how mass, space, and time behave for objects moving close to the speed of light, has weathered every experimental challenge that researchers have thrown at it. A key edict of relativity is Lorentz invariance, or the idea that the laws of physics don’t vary from observer to observer. Other theories don’t hold Lorentz invariance so dear; some theories of quantum gravity, like string theory, allow for Lorentz invariance to be broken at very high energies.
If Lorentz invariance is violated — if the laws of physics do depend on your frame of reference — it opens the door to a host of bizarre effects. For one, the speed of light would not be constant, but would instead depend on the energy of the photon! In a recent research article, Justin Finke and Parshad Patel (US Naval Research Laboratory) explored another potential consequence of Lorentz invariance violation that could affect measurements of gamma-ray photons.
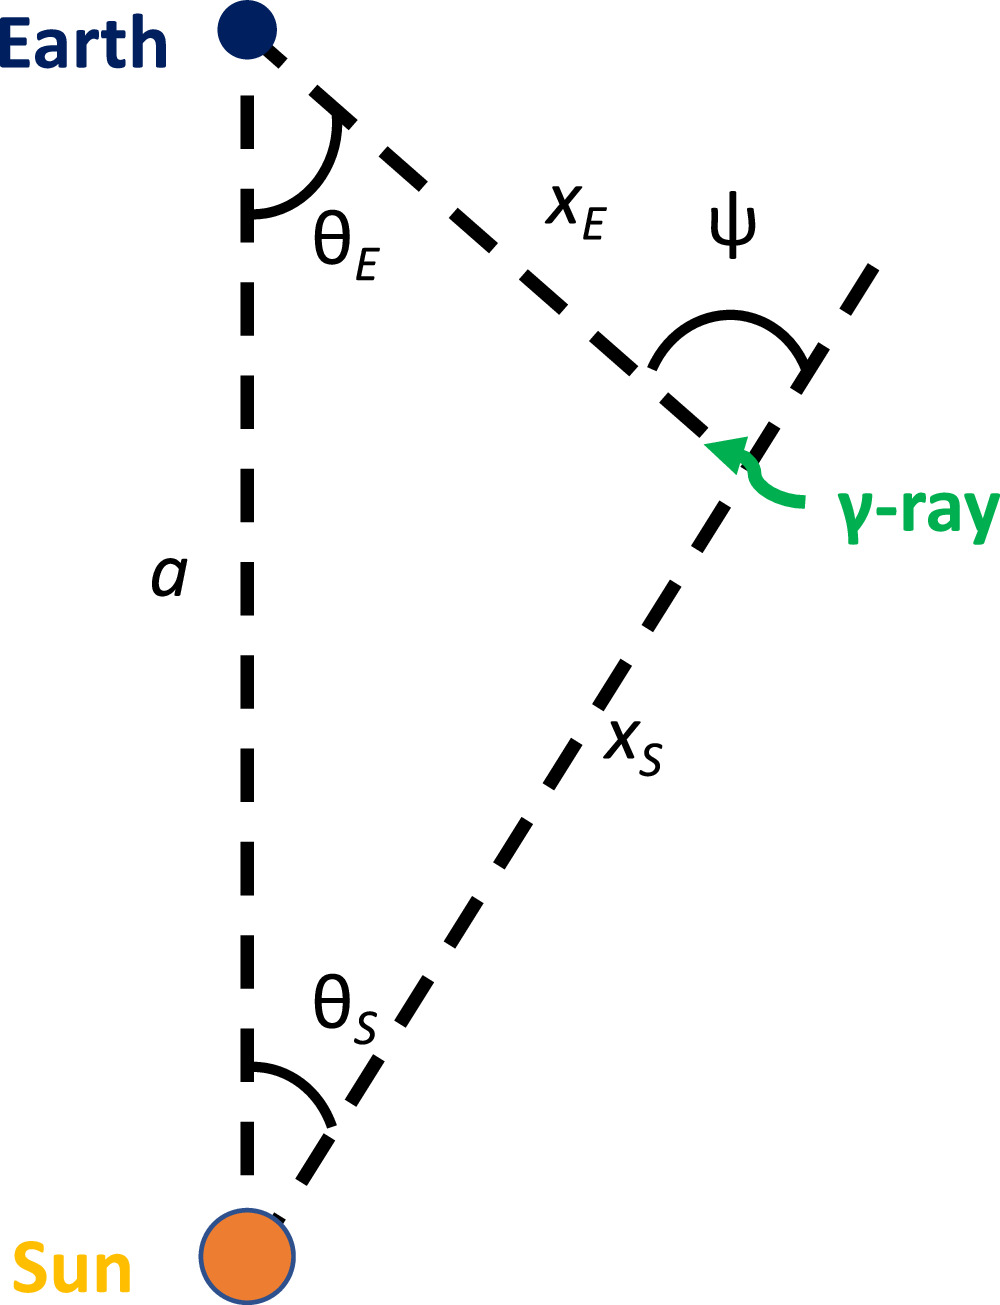
Schematic of the model showing the positions of Earth, the Sun, and incoming gamma rays. [Finke & Patel 2024]
Making Particles from Photons
Very rarely, two photons can interact to produce a particle and its antiparticle — for example, an electron and a positron. If Lorentz invariance is violated, it could change the likelihood of these rare photon–photon interactions and impact observations of distant gamma-ray sources.
Finke and Patel explored a possible way to search for Lorentz invariance violations by examining the interaction between gamma-ray photons from extragalactic sources and photons from the Sun. Their mathematical model describes the rate at which gamma rays interact with solar photons as a function of the gamma ray’s energy, the angle between the gamma-ray source and the Sun, and the energies at which Lorentz invariance is violated.
Identifying an Invariance Violation
The team found that the number of gamma rays that interact with other photons to produce particle–antiparticle pairs, called the absorption optical depth, can increase or decrease as a result of Lorentz invariance violation. Whether the optical depth increases or decreases depends on the energies of the interacting photons — in this case, solar photons. For interactions with solar photons, this effect potentially becomes important for incoming gamma rays with energies above 10 teraelectronvolts.
An example of how the absorption optical depth, τνν, can either increase or decrease relative to its behavior in absence of Lorentz invariance violation, depending on the photon energy. This example shows gamma-ray absorption by the extragalactic background light. Click to enlarge. [Finke & Patel 2024]
That’s how the measurement would work in theory — but could our present tools make it a reality? As of now, not in a reasonable time frame: given the sensitivity and observing limitations of current detectors, such as the High-Altitude Water Cherenkov Observatory, it could take more than 30 years to detect invariance violation, should it exist. If existing detectors could be tuned to distinguish between gamma rays and high-energy charged particles, it could shorten that time frame to as little as 1.3 years.
Citation
“Probing Lorentz Invariance Violation with Absorption of Astrophysical γ-Rays by Solar Photons,” Justin D. Finke and Parshad Patel 2024 ApJ 965 44. doi:10.3847/1538-4357/ad3212
The post Devising a Test for Special Relativity appeared first on AAS Nova.
]]>
One person's space junk is another's research opportunity: scientists study an artificial object mistaken for an asteroid to understand how to identify these objects in future surveys.
The post How to Tell Space Rocks from Space Junk appeared first on AAS Nova.
]]>Upcoming surveys will find dozens of near-Earth objects each night, but some of those objects will be space junk rather than asteroids. How will we tell the difference?
Masquerading as Asteroids
When humankind sent its first rocket toward the Moon 65 years ago, it marked the beginning of a long era of lunar exploration. Now, the cast-off rocket parts from decades of lunar missions are cropping up in an unexpected place: searches for near-Earth asteroids.
Phase angle (top) and light curve (bottom) of an artificial object mistaken for an asteroid. [Battle et al. 2024]
One Person’s Space Junk Is Another’s Research Opportunity
In 2020, a planetary defense survey discovered a candidate near-Earth object named 2020 SO. Later, dynamical studies suggested that rather than being an asteroid, 2020 SO is instead a discarded Centaur-D rocket body from NASA’s Surveyor 2 mission to the Moon. 2020 SO’s orbit is unusual for a natural object, and while it’s large, roughly 10 meters by 3 meters, it’s lightweight enough that just the gentle pressure of the Sun’s radiation can push it off course.
Reflectance spectrum of 2020 SO (black) compared to those of two types of asteroids (green and blue). The spectra are normalized at 0.7 μm. [Battle et al. 2024]
Conversely, it’s close in color to three known Centaur-D rocket bodies in Earth orbit, although the colors don’t match perfectly. This suggests that if 2020 SO is also a Centaur-D rocket body, its surface has changed after decades of space aging from radiation and particle impacts.
Spectroscopy Has the Last Word
While it’s possible for artificial objects to be similar in color and reflectance to asteroids, spectroscopy lays their differences bare by revealing what they’re made of. A Centaur-D rocket body is largely covered in stainless steel and a polymer called polyvinyl fluoride, and its spectrum likely contains features from both materials. Using data from the Infrared Telescope Facility, Battle and coauthors compared the spectrum of 2020 SO to the spectrum of a known Centaur-D rocket as well as laboratory spectra of stainless steel and polyvinyl fluoride.
Infrared spectra of 2020 SO (black) and a Centaur-D rocket body (green). [Battle et al. 2024]
This study shows that photometry and infrared spectroscopy can reveal the colors and spectral features necessary to identify near-Earth objects. To take the identification of artificial objects a step further, future work may require a database of artificial-object spectra and laboratory studies of common spacecraft materials.
Citation
“Challenges in Identifying Artificial Objects in the Near-Earth Object Population: Spectral Characterization of 2020 SO,” Adam Battle et al 2024 Planet. Sci. J. 5 96. doi:10.3847/PSJ/ad3078
The post How to Tell Space Rocks from Space Junk appeared first on AAS Nova.
]]>
Astrobites reports on how astronomers use pulsating stars to look for stellar halos around ultra-faint dwarf galaxies, some of the smallest galaxies in the universe.
The post Ultra-Faint Dwarf Galaxies: Not as Small as We Thought? appeared first on AAS Nova.
]]>Editor’s Note: Astrobites is a graduate-student-run organization that digests astrophysical literature for undergraduate students. As part of the partnership between the AAS and astrobites, we occasionally repost astrobites content here at AAS Nova. We hope you enjoy this post from astrobites; the original can be viewed at astrobites.org.
Title: Extended Stellar Populations in Ultra-Faint Dwarf Galaxies
Authors: Elisa A. Tau, A. Katherina Vivas, and Clara E. Martínez-Vázquez
First Author’s Institution: University of La Serena
Status: Published in AJ
The Runts of the Galaxy Litter
The first galaxies formed only a few hundred million years after the Big Bang. Galaxies start out small, then grow by pulling in the surrounding gas and merging with each other. Most galaxies today are about 100,000 light-years across (roughly the size of the Milky Way), but some of the largest galaxies can be millions of light-years across. At the other end of the scale, we have dwarf galaxies, which are closer to 10,000 light-years across. As a result of their small size, dwarf galaxies have few stars and aren’t very luminous. Dwarf galaxies often orbit larger galaxies as satellites, similar to how moons orbit planets and planets orbit stars.
Dozens of dwarf galaxies have been discovered orbiting the Milky Way. You’ve likely already heard of the most famous of these — the Large and Small Magellanic Clouds, which are visible from the Southern Hemisphere. However, most of the dwarf galaxies orbiting the Milky Way are much smaller and dimmer than the Magellanic Clouds, making them difficult to make out with the naked eye. Astronomers often identify dwarf galaxies by finding a collection of stars and gas that moves together with star-mapping surveys like Gaia. Ultra-faint dwarf galaxies are particularly difficult to detect because they have so few stars; where a normal dwarf galaxy may have millions or billions of stars, ultra-faint dwarfs usually only contain thousands or tens of thousands. Ultra-faint dwarf galaxies lack stars because most of the mass in these galaxies consists of dark matter.
A topic of discussion among astronomers studying dwarf galaxies is how large these galaxies can be. The size of a dwarf galaxy can be determined by measuring the distance to the farthest stars that belong to the galaxy. Stars located near the edges of dwarf galaxies would belong to a stellar halo, which contains older stars. Stellar halos around dwarf galaxies are incredibly difficult to detect because they contain so few stars, so it is not clear how often ultra-faint dwarfs host stellar halos or what the halo properties are. One way to trace stars that may belong to stellar halos is with RR Lyrae variable stars. In addition to being older stars, meaning we expect them to be more common in stellar halos, these stars are a type of “standard candle,” meaning they have a known luminosity or energy output. RR Lyrae stars pulsate, and the variation in their luminosities is related to the period of their pulsations, so astronomers can infer an RR Lyrae star’s luminosity by measuring changes in its brightness. Previous studies have attempted to look for stellar halos in ultra-faint dwarfs with RR Lyrae stars, but this method was challenging to carry out before the data and telescopes that became available in the last few years. The authors of today’s article are continuing the search for RR Lyrae stars in the outer reaches of ultra-faint dwarfs to probe the presence of extended stellar populations and stellar halos.
Finding Ultra-Faint Dwarfs
The authors compiled a list of known ultra-faint dwarfs around the Milky Way, many of which were discovered by the Dark Energy Survey (DES). They also compiled a sample of RR Lyrae stars that were detected by a series of stellar surveys, including Gaia, the Zwicky Transient Facility (ZTF) surveys, DES, and the first Panoramic Survey Telescope and Rapid Response System (Pan-STARRS) survey.
But how do astronomers actually determine which stars belong to an ultra-faint dwarf, especially when these galaxies contain so few stars? Astronomers use a couple of quantities to determine this. First, they are looking for a collection of stars that are in the same area of the sky and are all roughly the same distance from Earth. The authors measure the distance to each star by using the star’s luminosity, since it is related to the distance by the equation L = 4πFd2, where L is the luminosity (total power emitted), F is the flux (power per unit area detected at Earth), and d is the distance. Again, astronomers know the luminosities of these stars because the luminosity of an RR Lyrae star is related to how quickly its light output varies. By comparing this known luminosity to how much light they actually detect, astronomers can estimate the distance between us and the RR Lyrae star.
The next main variable the authors use is proper motion, which is a measurement of how quickly an object moves across the sky. A group of stars with similar proper motions are likely moving together, which is necessary for the collection to be called a dwarf galaxy. Astronomers consider the angular distance between each RR Lyrae star and the center of the dwarf galaxy. Then, they use the distances and proper motions they measured to determine if that RR Lyrae star belongs to the dwarf galaxy or the Milky Way.
Lastly, we need to discuss a quantity called the half-light radius, which the authors denote by Rh. The half-light radius is the radius out to which half the light emitted by a galaxy is contained. Since galaxies don’t have clear edges, the half-light radius provides a useful scale for measuring galaxy sizes. Note that the full radius of a galaxy isn’t 2 Rh since galaxies are brighter in the center and dimmer near the edges. The authors are looking for RR Lyrae stars that are several half-light radii from the centers of their ultra-faint dwarfs, which is where they believe the stellar halos would exist.
Living on the Edge
The authors identify more than 100 RR Lyrae stars in ultra-faint dwarfs from the surveys mentioned above and find that nearly half of the ultra-faint dwarfs contain at least one RR Lyrae star. Some examples of the RR Lyrae stars and their locations in the galaxies are shown in Figure 1.
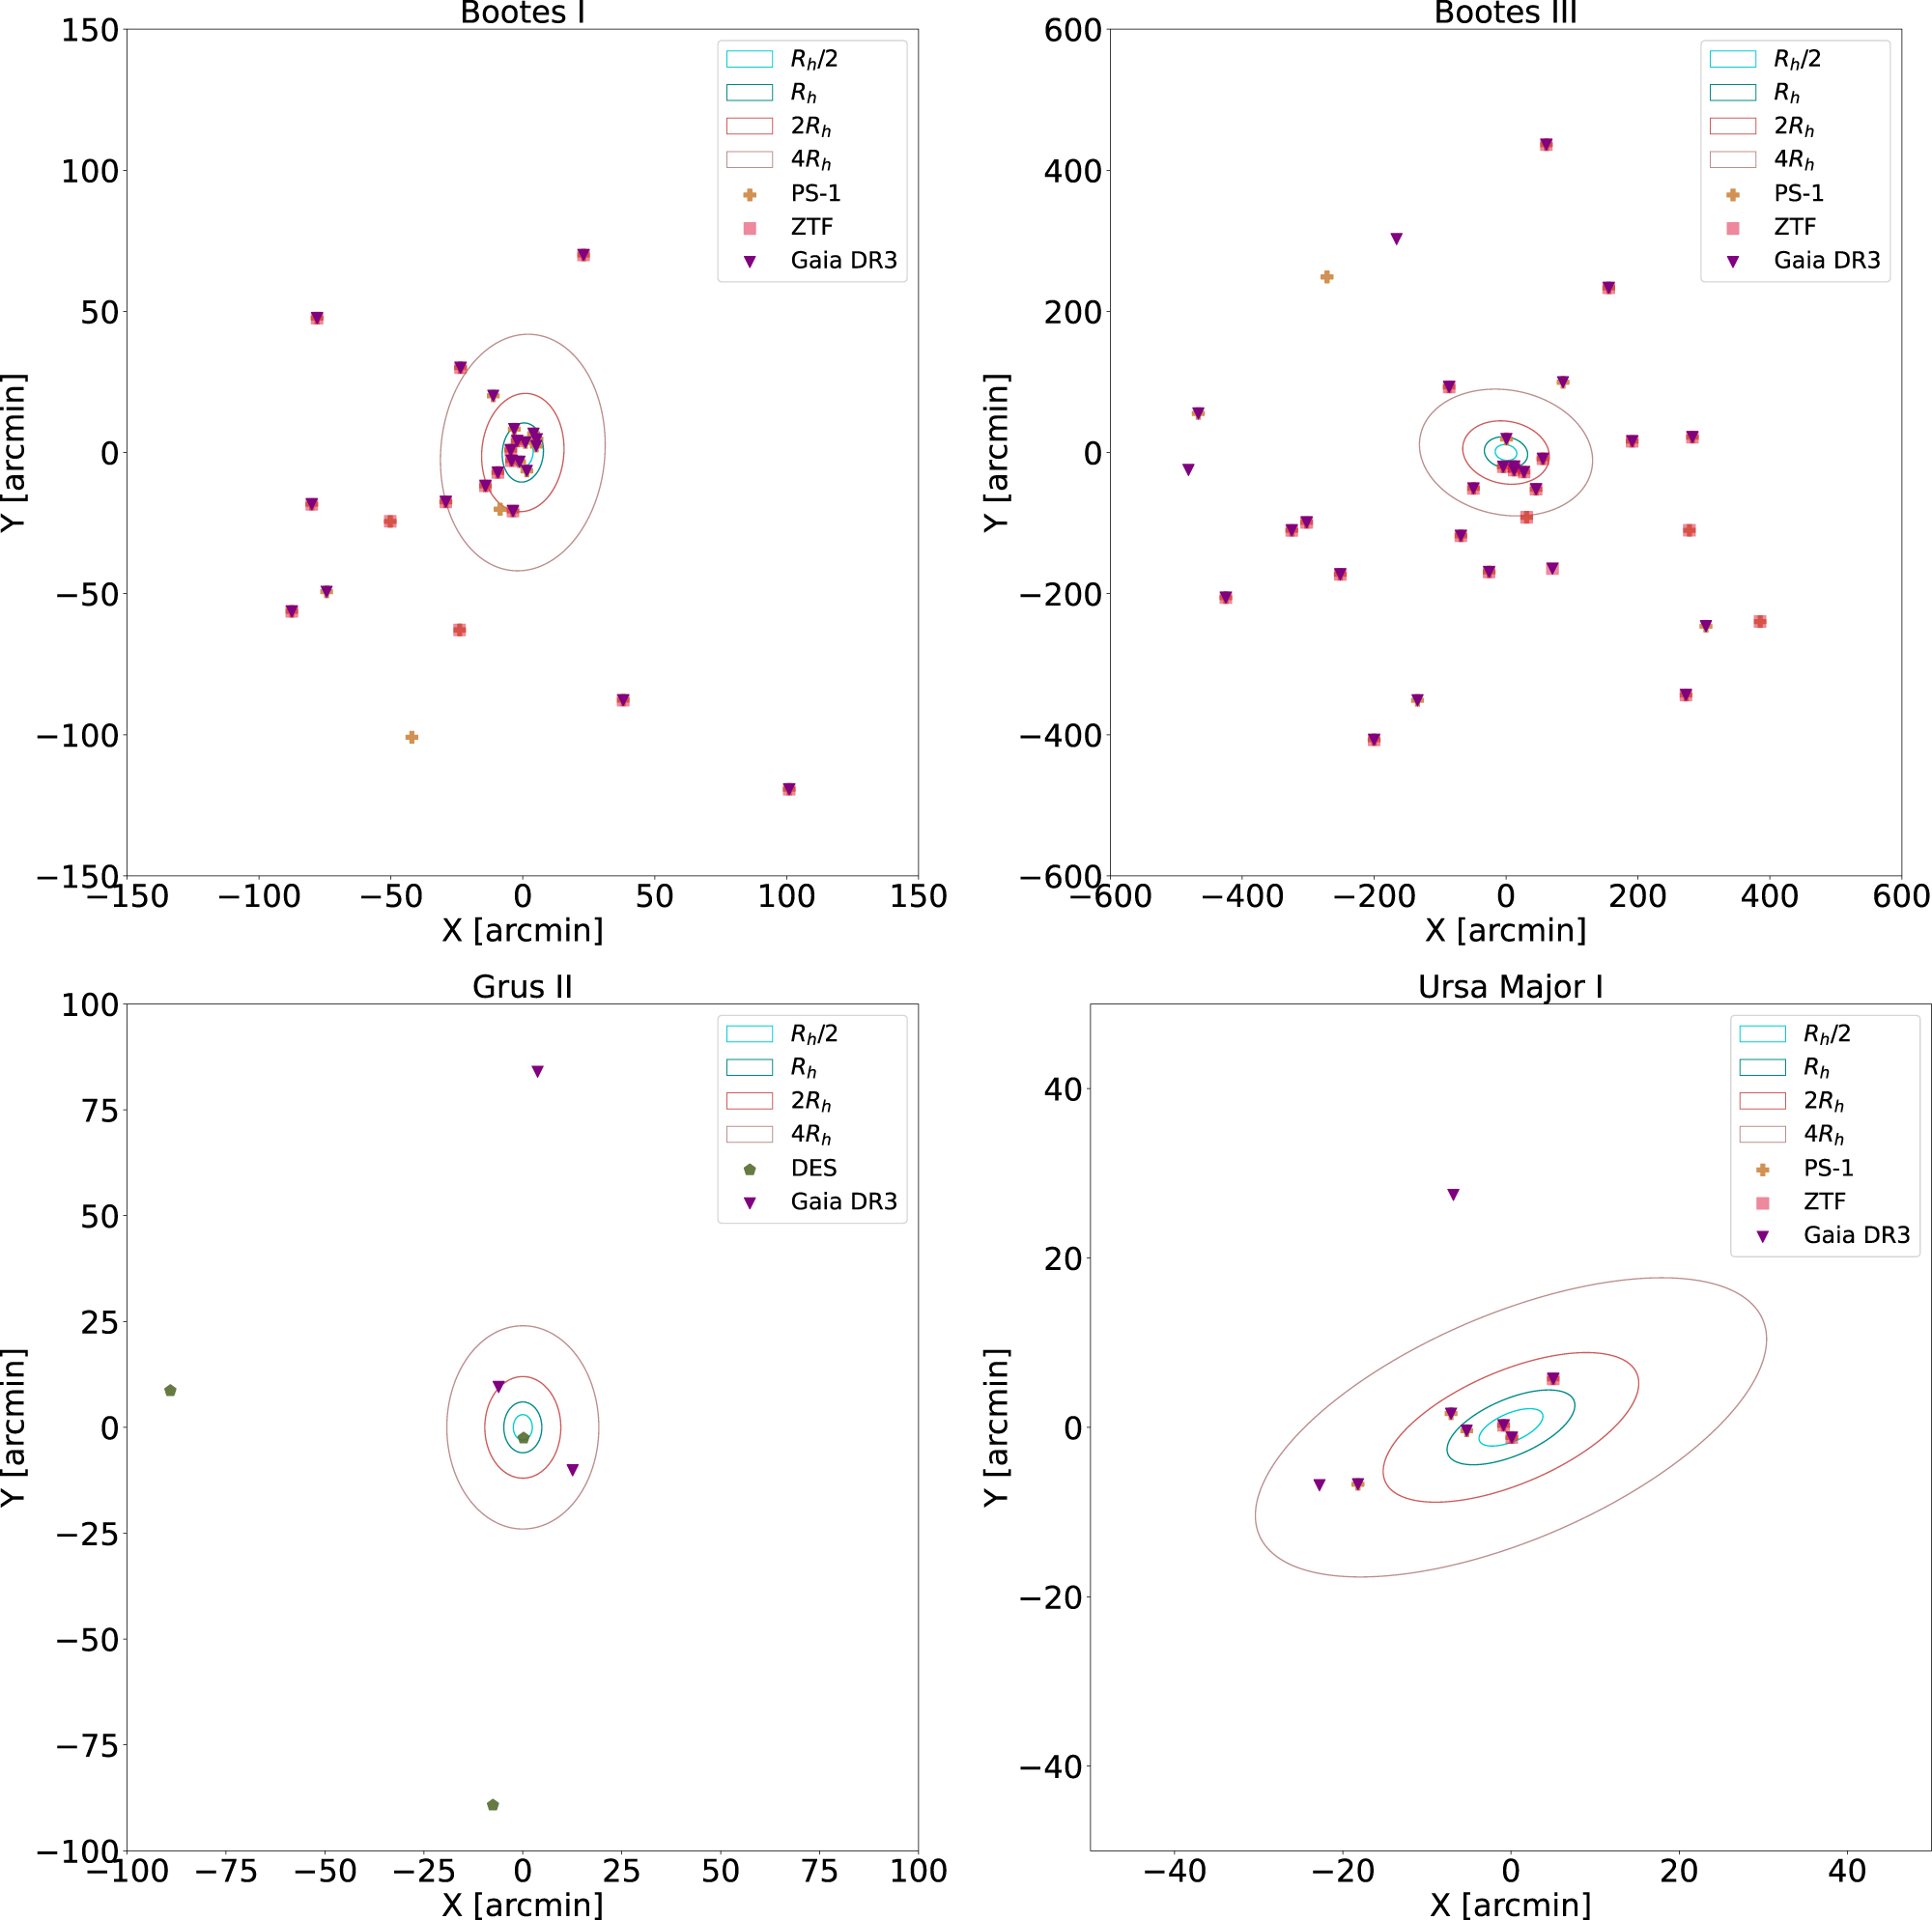
Figure 1: A sample of ultra-faint dwarf galaxies and their associated RR Lyrae stars. Symbols correspond to the catalog that the star’s position comes from, and the contours represent different radii. Note that some of the stars for the Bootes dwarf galaxies may actually belong to the Sagittarius Stream, which is a part of the Milky Way. [Tau et al. 2024]
A more comprehensive showcase of the RR Lyrae stars is highlighted in Figure 2. While most RR Lyrae stars (and, therefore, most stars) are expected to be within 2 Rh of the center, several have been found well beyond this distance. This again highlights that RR Lyrae stars can be located beyond the main body of the ultra-faint dwarfs in what are likely stellar halos.
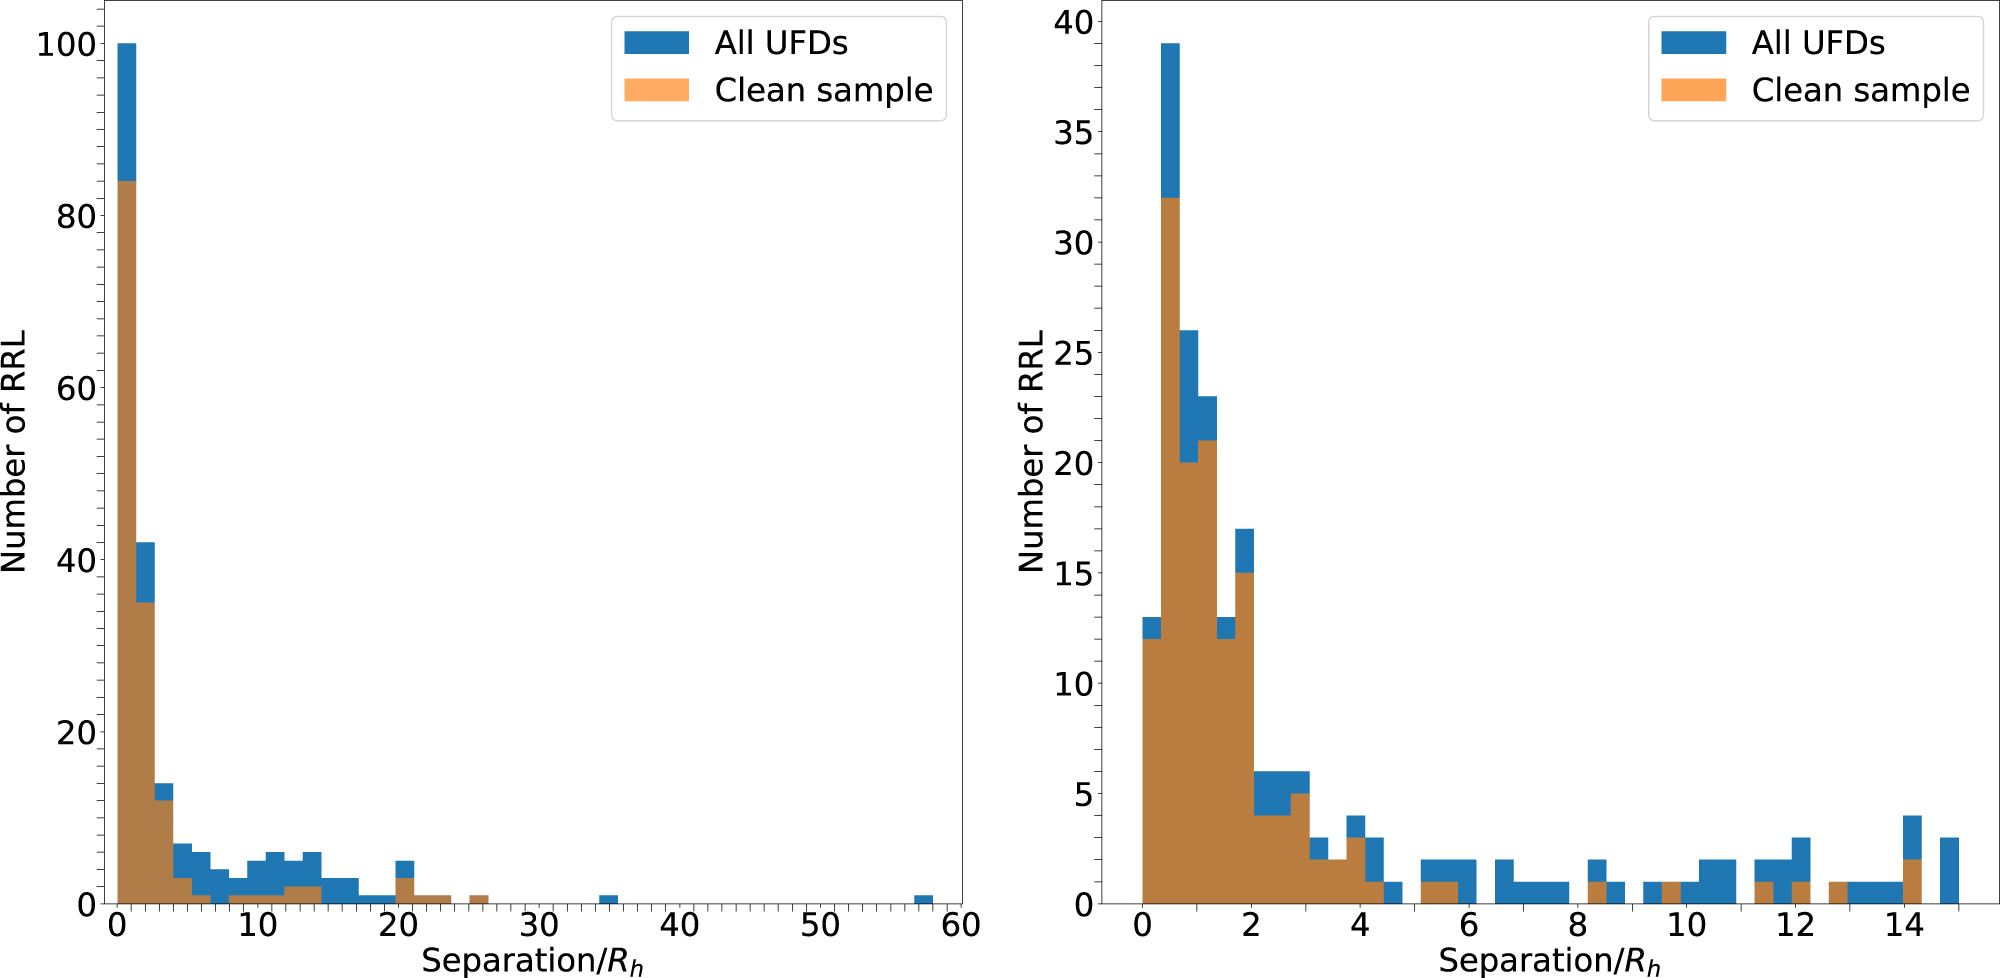
Figure 2: Histograms of RR Lyrae stars and their distances from the center of their ultra-faint dwarf (UFD) host galaxy in units of Rh. Blue represents all RR Lyrae stars, and orange represents a cleaned sample that has removed stars from ultra-faint dwarfs for which the authors are concerned about contamination (e.g., stars in the Bootes dwarf galaxies due to contamination from the Sagittarius Stream). The right panel is a zoom-in of the left panel, focusing on distances of up to 15 Rh. [Tau et al. 2024]
Original astrobite edited by Alexandra Masegian.
About the author, Brandon Pries:
I am a graduate student in physics at Georgia Institute of Technology (Georgia Tech). I do research in computational astrophysics with John Wise, using machine learning to study the formation and evolution of supermassive black holes in the early universe. I’ve also done extensive research with the IceCube Collaboration as an undergraduate at Michigan State University, studying applications of neural networks to event reconstructions and searching for signals of neutrinos from dark matter annihilation.
The post Ultra-Faint Dwarf Galaxies: Not as Small as We Thought? appeared first on AAS Nova.
]]>
A new suite of supernova simulations allows researchers to find correlations between the properties of these cosmic explosions and properties of the stars they came from.
The post Featured Image: A Suite of Exploding Stars appeared first on AAS Nova.
]]>A research team led by Adam Burrows (Princeton University and the Institute for Advanced Study) has created the largest collection yet of state-of-the-art, three-dimensional core-collapse supernova simulations. The image above shows the results of several of the team’s simulations, showcasing the wide variety of structures and sizes attained by exploding stars just a few seconds after the stars’ outer layers rebounded off their collapsed cores. The smooth outer blue bubble shows the location of the expanding shock, while the more complex inner bubbles show the location of the ejected material. Red material is moving outward and blue material is moving inward. These simulations, which follow the collapse of stars with masses between 9 and 60 solar masses, allowed the team to find correlations between the properties of the explosions and the properties of the stars they came from. For example, the mass of the resulting neutron star is correlated with the compactness of the star. The simulations also predicted a correlation between the energy of the explosion and how asymmetrical it is, which can be tested in future studies. To learn more about the results of this study, be sure to check out the full research article linked below.
Citation
“Physical Correlations and Predictions Emerging from Modern Core-Collapse Supernova Theory,” Adam Burrows et al 2024 ApJL 964 L16. doi:10.3847/2041-8213/ad319e
The post Featured Image: A Suite of Exploding Stars appeared first on AAS Nova.
]]>
How do cosmic rays move through the galaxy? Thanks to data collected by the aging Voyager 1 spacecraft, astronomers are closer to finding out.
The post Cosmic Rays Near and Far appeared first on AAS Nova.
]]>How do cosmic rays spread through the galaxy? Historically, that’s been a hard question to answer from within the Sun’s protective bubble that shields us from some fraction of these high-energy particles. However, now that Voyager 1 has completed its hard-fought journey into interstellar space, astronomers can study cosmic rays beyond the reach of the Sun to build a fuller picture of the lives of these lightning-fast bits of matter.
Tiny Bullets
A schematic of Voyager 1. The cosmic ray experiments are in the upper right. [NASA’s Goddard Space Flight Center]
For about a decade, however, astronomers have been able to call upon a hardy scout that has flown beyond the reaches of our Sun and into the region where cosmic rays roam free. Voyager 1, launched an astounding 46 years ago and still limping along despite recent communication challenges, was the first human-made object to reach interstellar space back in 2012. Even as the spacecraft shut down other instruments to ration its limited power source, it kept its cosmic ray experiments powered up and collecting data. Now, by combining measurements from Voyager 1 with data collected by instruments on the International Space Station, astronomers can revisit their models of how cosmic rays move through the galaxy and within our solar system.
The Alpha Magnetic Spectrometer after its installation aboard the International Space Station. [NASA]
Many Models Mostly Working
Ethan Silver, University of California Berkeley, and Elena Orlando, University of Trieste, recently attempted this comparison. Using about a decade’s worth of data from Voyager 1 and from the Alpha Magnetic Spectrometer aboard the International Space Station, they were able to fit six different types of models of how cosmic rays move through the galaxy, each with many parameters that needed to be carefully tuned. Some of these models assumed that one can capture the behavior of cosmic rays using only a diffusion framework, while others were much more complex and allowed for numerous discontinuities in the input spectra of energies for each type of particle.
Silver and Orlando found that in general, all of the models they tested could explain the observed data with reasonable success. Though unsurprisingly the more complex models with more free parameters agreed with the measurements the best, the lighter-weight models held their own and couldn’t be confidently ruled out. Interestingly, all of the models tested failed on the same subset of observations: none of the schemes they tested, including the most complex diffusion-convection-reacceleration models, accurately predicted the flux of antiprotons with energies around ∼10 giga-electron volts. This missed prediction suggests that even with the help of probes far beyond our confines here on Earth, there is still much we don’t know about the production and transportation of cosmic rays. However, the general success of the models indicates that we’re on the right track, a validation enabled in large part by a distant and aging but well-loved spacecraft.
Citation
“Testing Cosmic-Ray Propagation Scenarios with AMS-02 and Voyager Data,” Ethan Silver and Elena Orlando 2024 ApJ 963 111. doi:10.3847/1538-4357/ad1ce8
The post Cosmic Rays Near and Far appeared first on AAS Nova.
]]>
The cratered surfaces of our solar system's moons record impacts reaching back billions of years. How do researchers measure the ages of these surfaces, and what can these ages tell us about how the moons formed?
The post Measuring Ages from Craters on Giant Planet Satellites appeared first on AAS Nova.
]]>The giant planets in our solar system — Jupiter, Saturn, Uranus, and Neptune — collectively host nearly 300 moons. What can craters tell us about how old these moons are and how they formed?
How Are Moons Made?
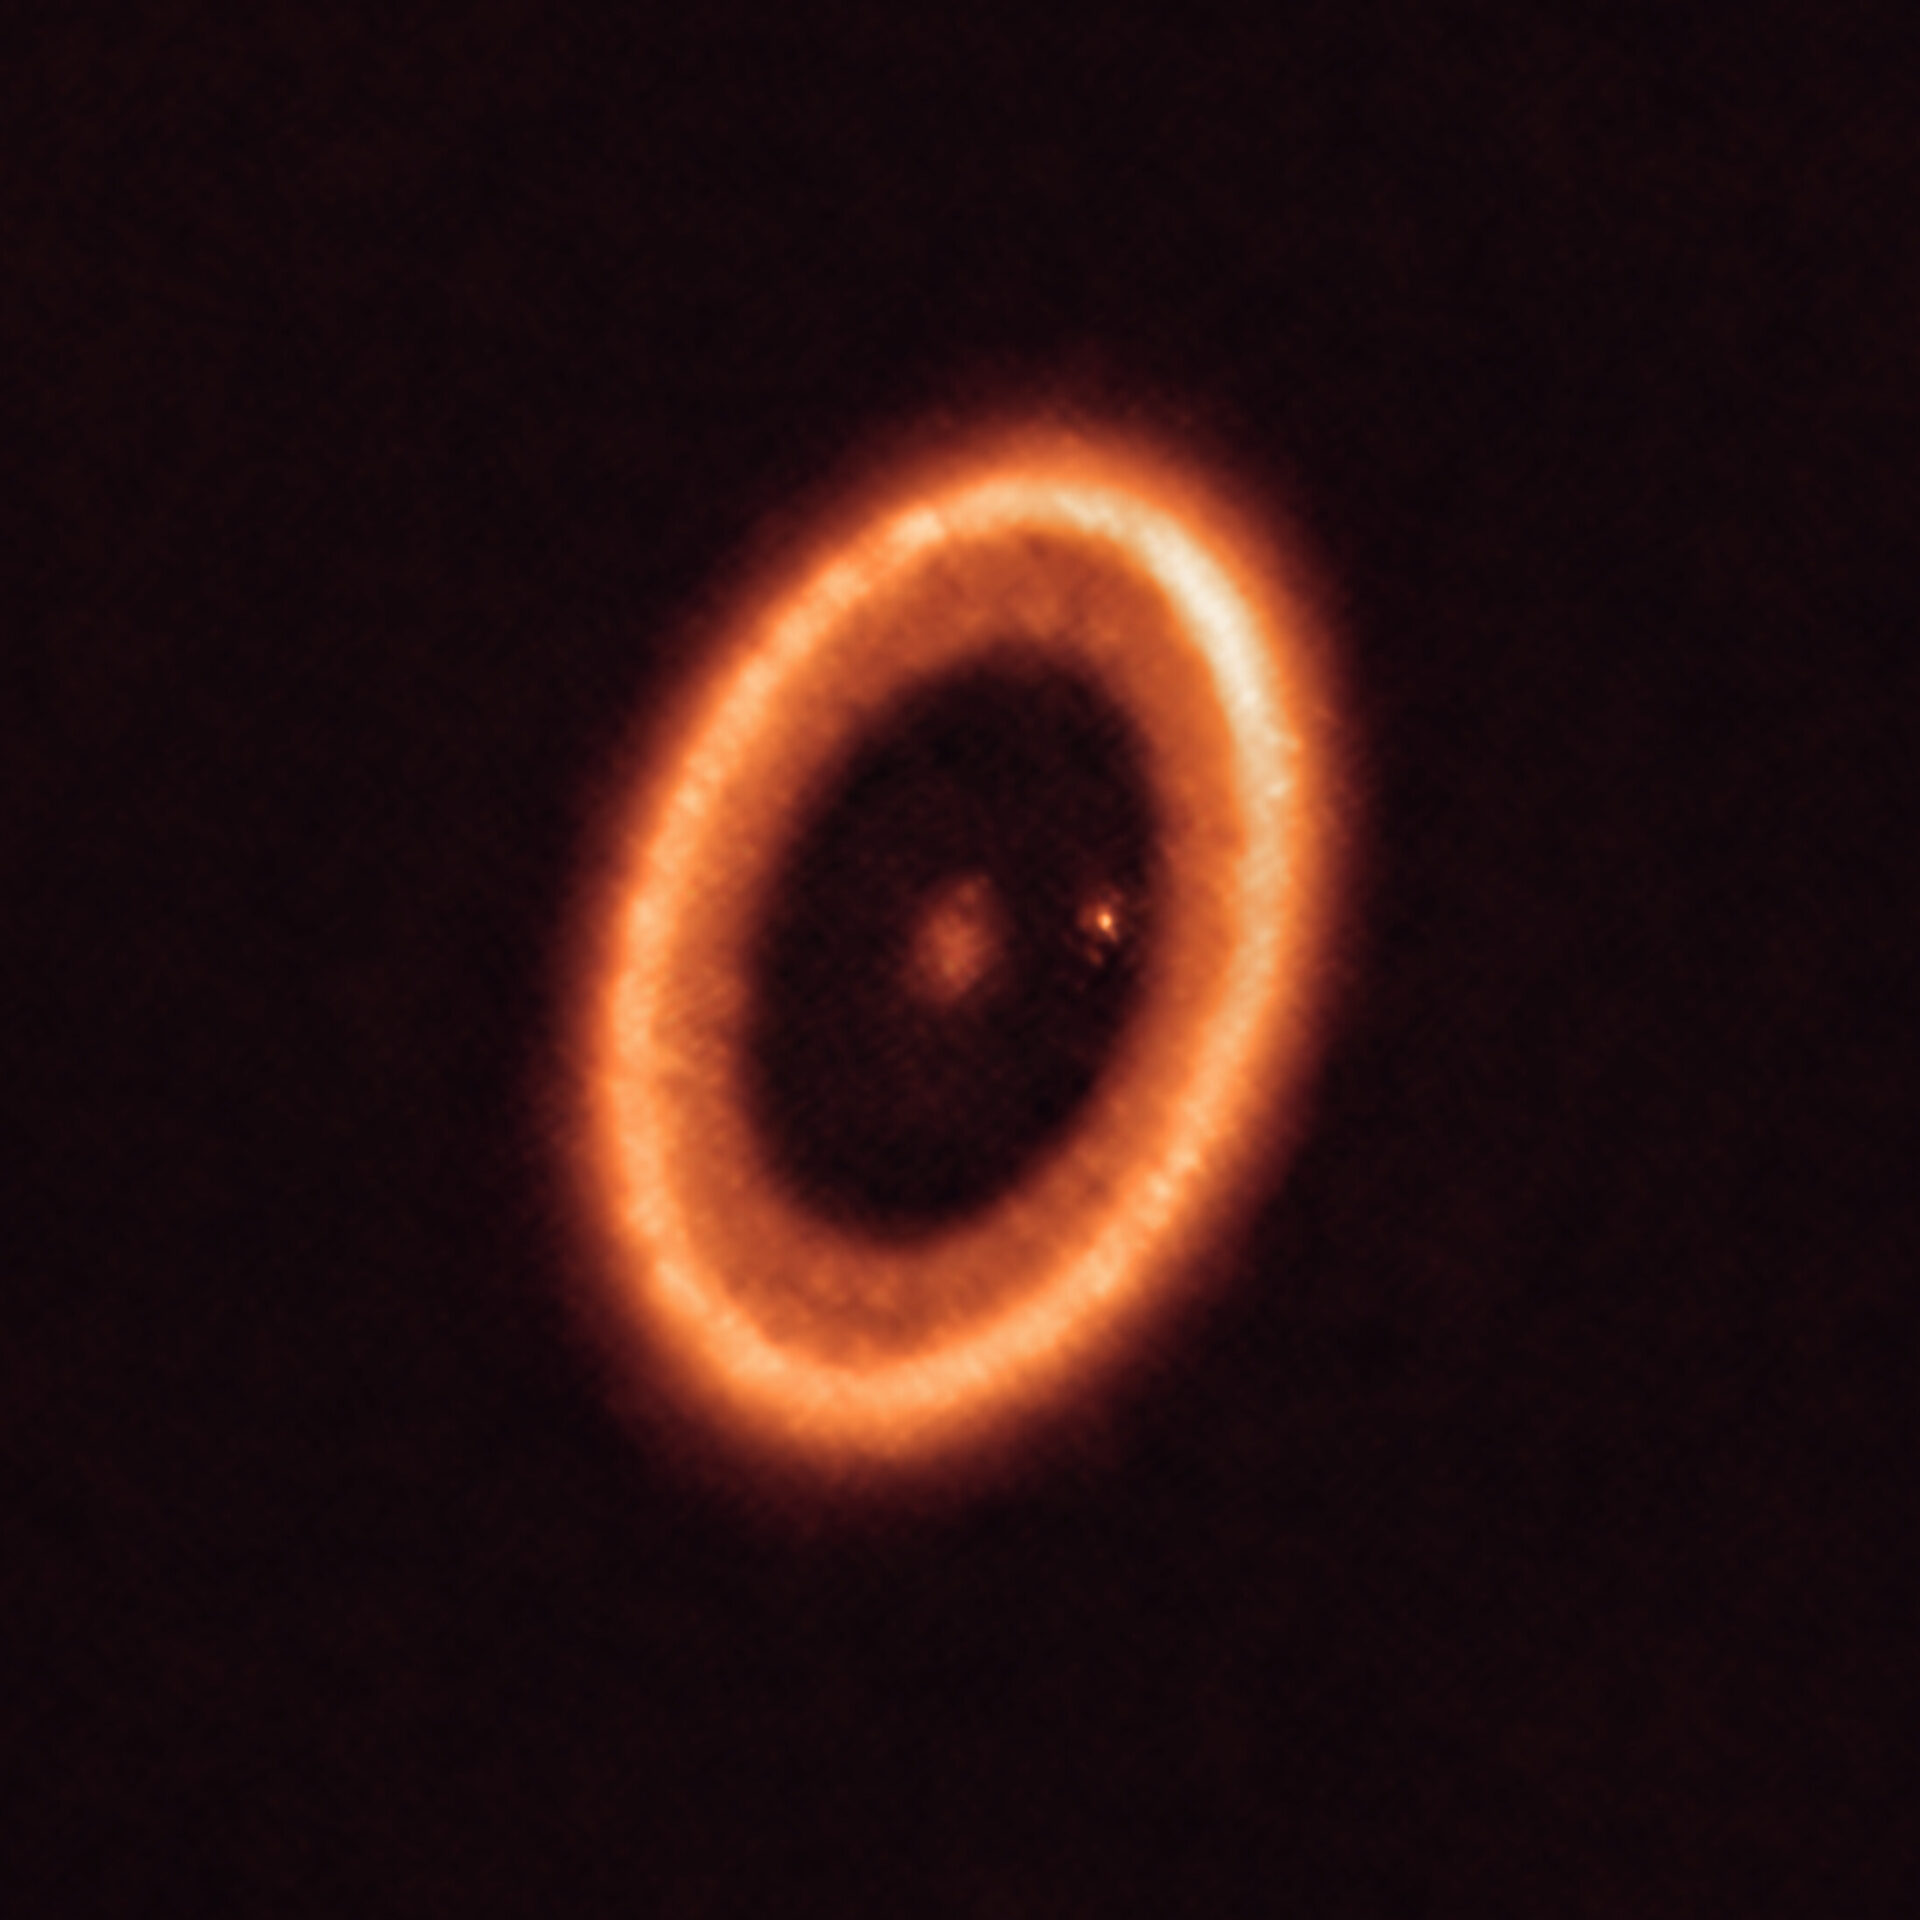
A submillimeter image of the PDS 70 planetary system. Between the outer ring of gas and the central star sits the Jupiter-like exoplanet PDS 70c, which is surrounded by a possible moon-forming circumplanetary disk. [ALMA (ESO/NAOJ/NRAO)/Benisty et al.; CC BY 4.0]
Crater counting provides a way to estimate the ages of satellite surfaces — placing limits on the ages of the objects themselves — and helps test these theories of satellite formation. To understand how the craters on a moon’s surface relate to the age of the surface, researchers had to imagine conditions in the solar system nearly 4.5 billion years ago, when things were far more chaotic than they are today.
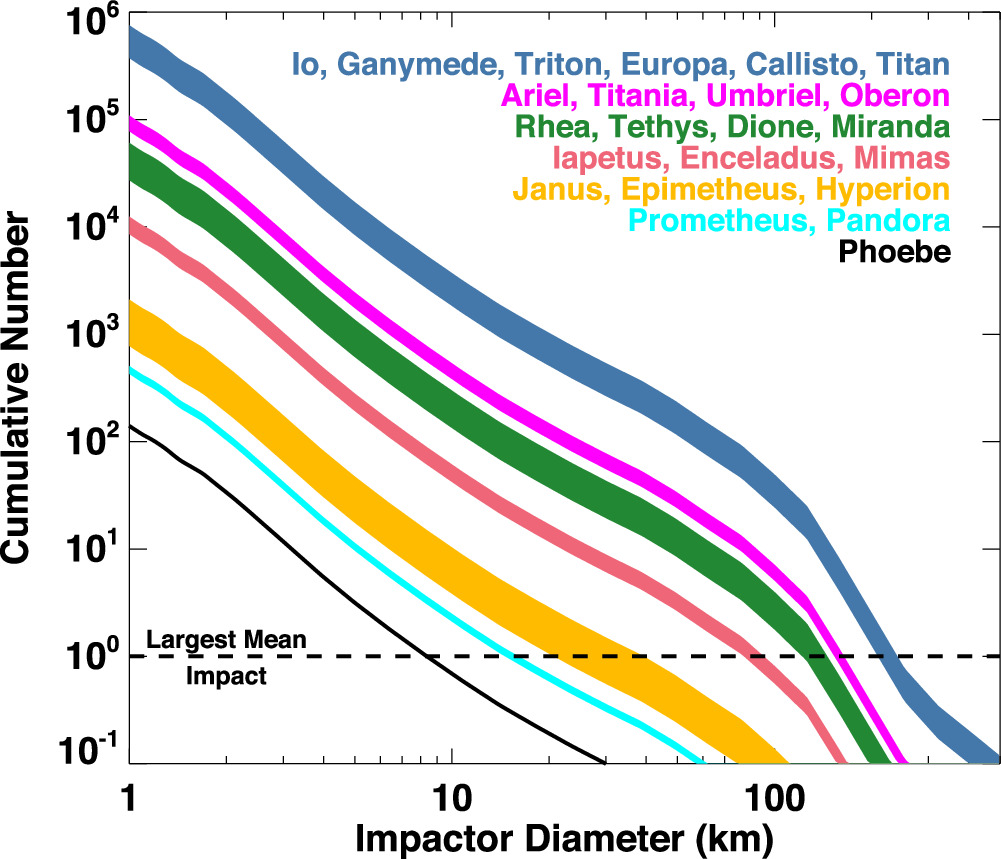
Modeled cumulative number and size of impactors striking giant planet satellites since the beginning of the bombardment period. Satellites with similar collision probabilities are grouped together for clarity. Click to enlarge. [Bottke et al. 2024]
Shuffling the Solar System
A few tens of millions of years after the gaseous nebula that enveloped the young Sun and its budding planets dissipated, Neptune shook up the solar system. As Neptune migrated outward from the Sun, it crossed into a primordial disk of planetesimals, kicking 99.9% of these icy bodies into the solar system. (The remaining 0.1% of planetesimals remained behind and formed what is today known as the Kuiper Belt.) Thus began a long period of bombardment that is recorded on the surfaces of the many moons of the outer solar system.
Recently, William Bottke (Southwest Research Institute) and collaborators assigned ages to the surfaces of 26 satellites of Jupiter, Saturn, Uranus, and Neptune by modeling crater formation during this bombardment period.
To measure surface ages from the craters observed on these satellites today, the team modeled the sizes and numbers of craters forming due to bombardment on each satellite as a function of time. This model accounts for the relationship between the size of the impacting body and the size of the crater, changes in the sizes of the impacting bodies over time due to collisions between impactors, and other factors.
Missing Early History
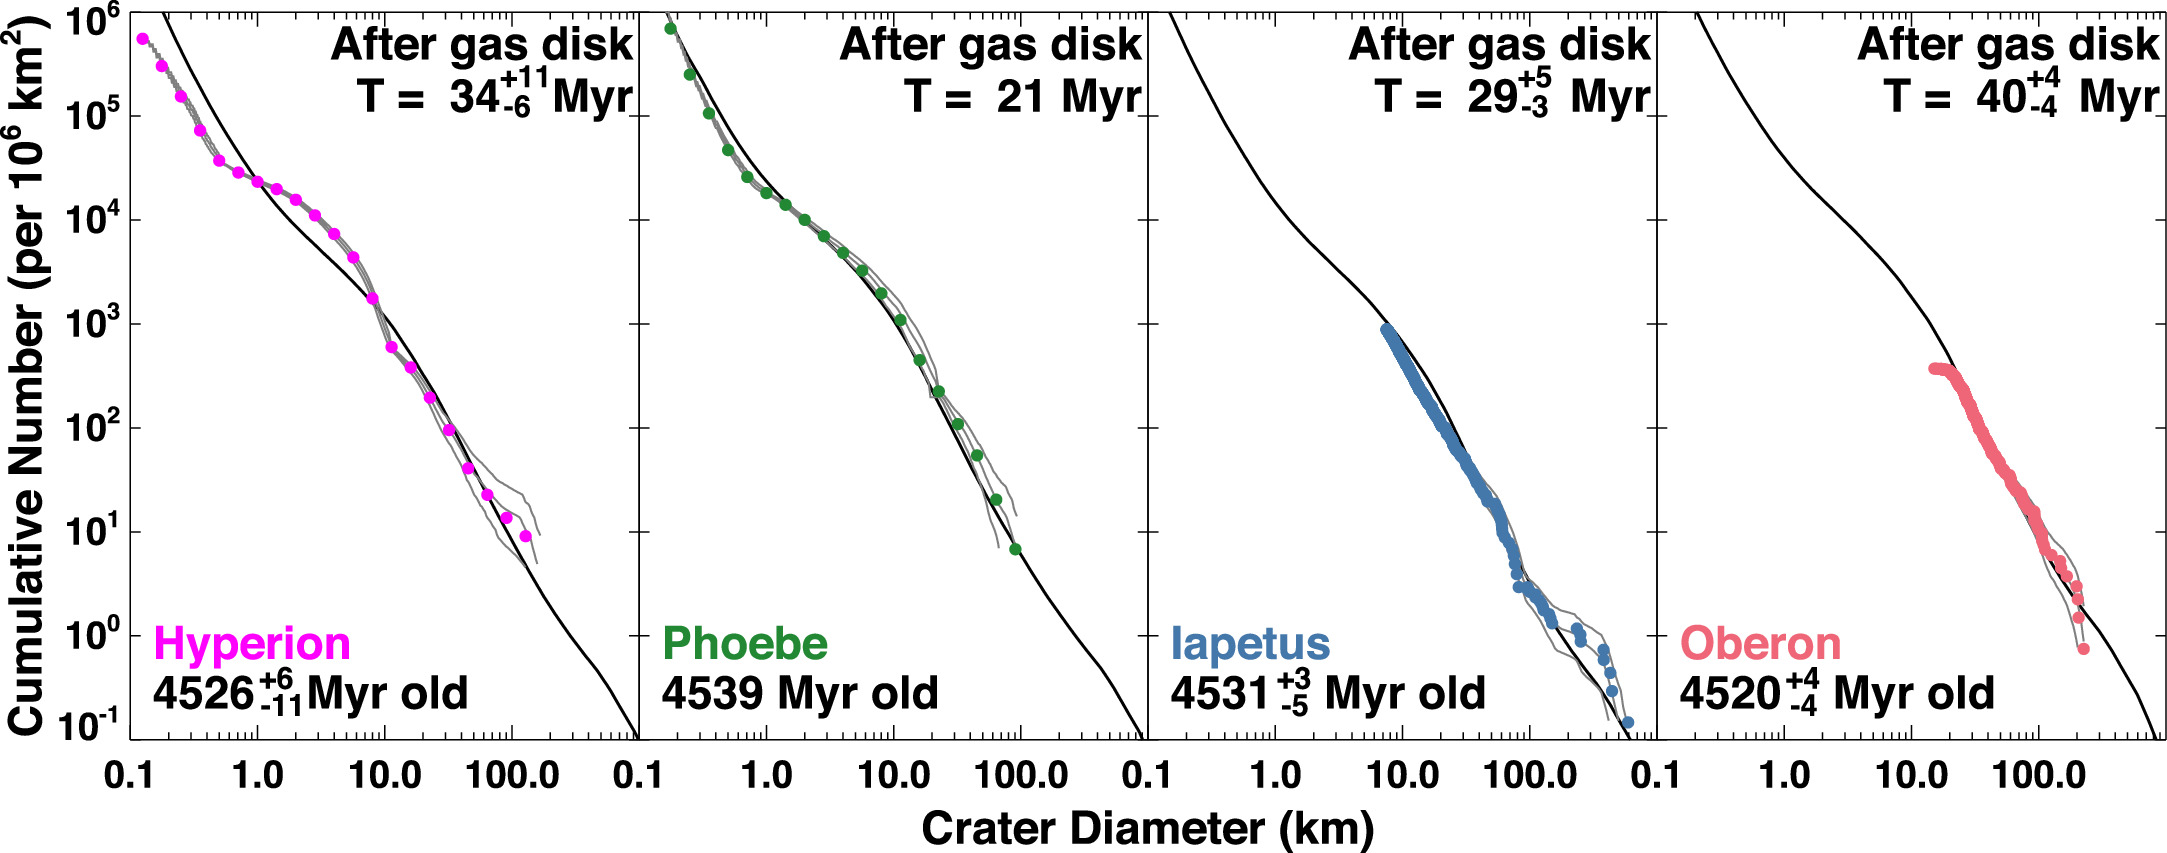
Modeled (black lines) and observed (colored circles) crater size and frequency values for several small moons. The derived surface ages are listed in each panel. Bombardment begins at T = 20 million years after the gas disk disperses. Click to enlarge. [Bottke et al. 2024]
With early history erased by large impacts, it’s not possible to definitively state how these worlds formed — though Bottke’s team notes that for midsize and large moons, their model results are consistent with what’s expected for satellites forming in a disk around their host planets. Significant roadblocks exist for other theories. If future spacecraft can make sensitive gravity measurements of these worlds, revealing bombardment-induced changes to their crusts and interiors, it could reveal this hidden era of solar system history.
Citation
“The Bombardment History of the Giant Planet Satellites,” William F. Bottke et al 2024 Planet. Sci. J. 5 88. doi:10.3847/PSJ/ad29f4
The post Measuring Ages from Craters on Giant Planet Satellites appeared first on AAS Nova.
]]>
Astrobites reports on a tragic final encounter between a supermassive black hole and a stellar neighbor that came a bit too close.
The post Tragic Tidal Disruption Events: How Black Holes Shred Stars appeared first on AAS Nova.
]]>Editor’s Note: Astrobites is a graduate-student-run organization that digests astrophysical literature for undergraduate students. As part of the partnership between the AAS and astrobites, we occasionally repost astrobites content here at AAS Nova. We hope you enjoy this post from astrobites; the original can be viewed at astrobites.org.
Title: Optical Appearance of Eccentric Tidal Disruption Events
Authors: Fangyi (Fitz) Hu et al.
First Author’s Institution: Monash University
Status: Published in ApJL
While the typical image of a supermassive black hole swallowing up everything in its path may be a trope of science fiction, there is some truth to the violent nature of these enigmatic cosmic objects. Namely, the ultra-strong gravitational fields surrounding supermassive black holes have been observed to shred stars, tearing them apart and producing bright and dramatic transient phenomena known as tidal disruption events, or TDEs. In the process, much of the stellar material becomes unbound and is flung away from the system, with the remainder surrounding the black hole in an accretion disk, the source of the emitted radiation.
As per usual, though, nothing in astrophysics is ever straightforward. Over the years, a disparity between what we expect and what we actually see has emerged when it comes to these events that are reminiscent of a Shakespearean tragedy. More specifically, due to the very-high-temperature gases involved, X-rays are expected to dominate the spectrum of most TDEs. However, observers have found that most TDEs are instead observed at lower energies, producing significant but poorly understood optical emission.
Enter today’s article from researchers at Monash University in Australia, who have simulated the tidal disruption of a Sun-like star in the hopes of uncovering the origin of the perplexing optical emission.
The Nitty Gritty of the Simulation
For simulations to be realistic, theorists typically attempt to account for as many physical processes as possible. Thus, the authors of today’s article employed the PHANTOM code, which includes both general relativistic and hydrodynamical effects. The protagonists of this astrophysical tragedy are a solar-mass star and a million-solar-mass, non-spinning black hole with a highly eccentric, or elliptical, orbit.
Cut to several days later, and the simulation has evolved to a point where the star is in tatters and the supermassive black hole is surrounded by a bright and brand-new accretion disk composed of stolen material from the star. By tracking the time evolution of the system, the authors were able to understand how the accretion disk formed, with the hope of unmasking the source of the optical emission.
The Last Dance
Figure 1 shows the evolution of the system’s column density, indicating the location of the stolen stellar material. In the first two panels at 0.55 and 0.91 day, the stellar debris stream is visible. In the third panel, the debris stream collides with itself, leading to the formation of the accretion disk. In the fourth panel at 2.74 days, the accretion disk is clearly seen as a circular structure surrounding the supermassive black hole at the centre.
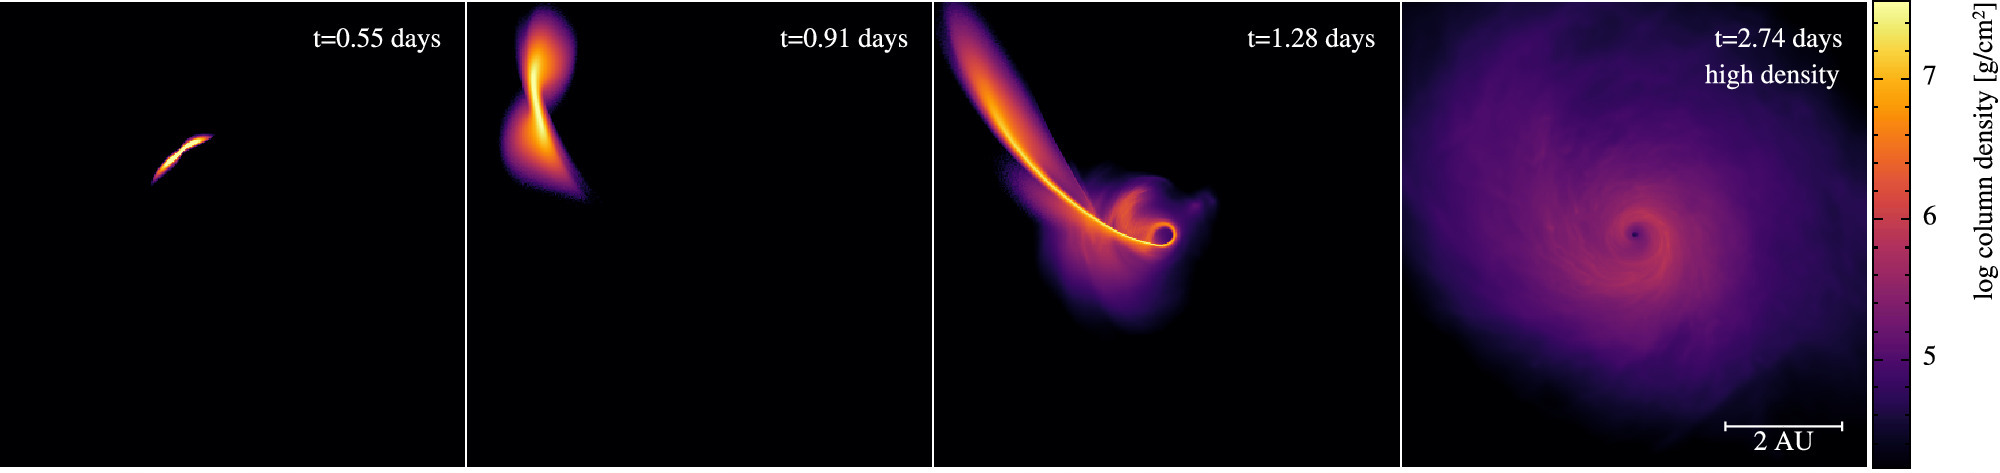
Figure 1: The column density of the stellar material surrounding the supermassive black hole at different times. Larger column densities are indicated by more yellow colours, while lower column densities are shown in purple and black. From left to right, the panels show the simulation at 0.55, 0.91, 1.28, and 2.74 days. [Adapted from Hu et al. 2024]
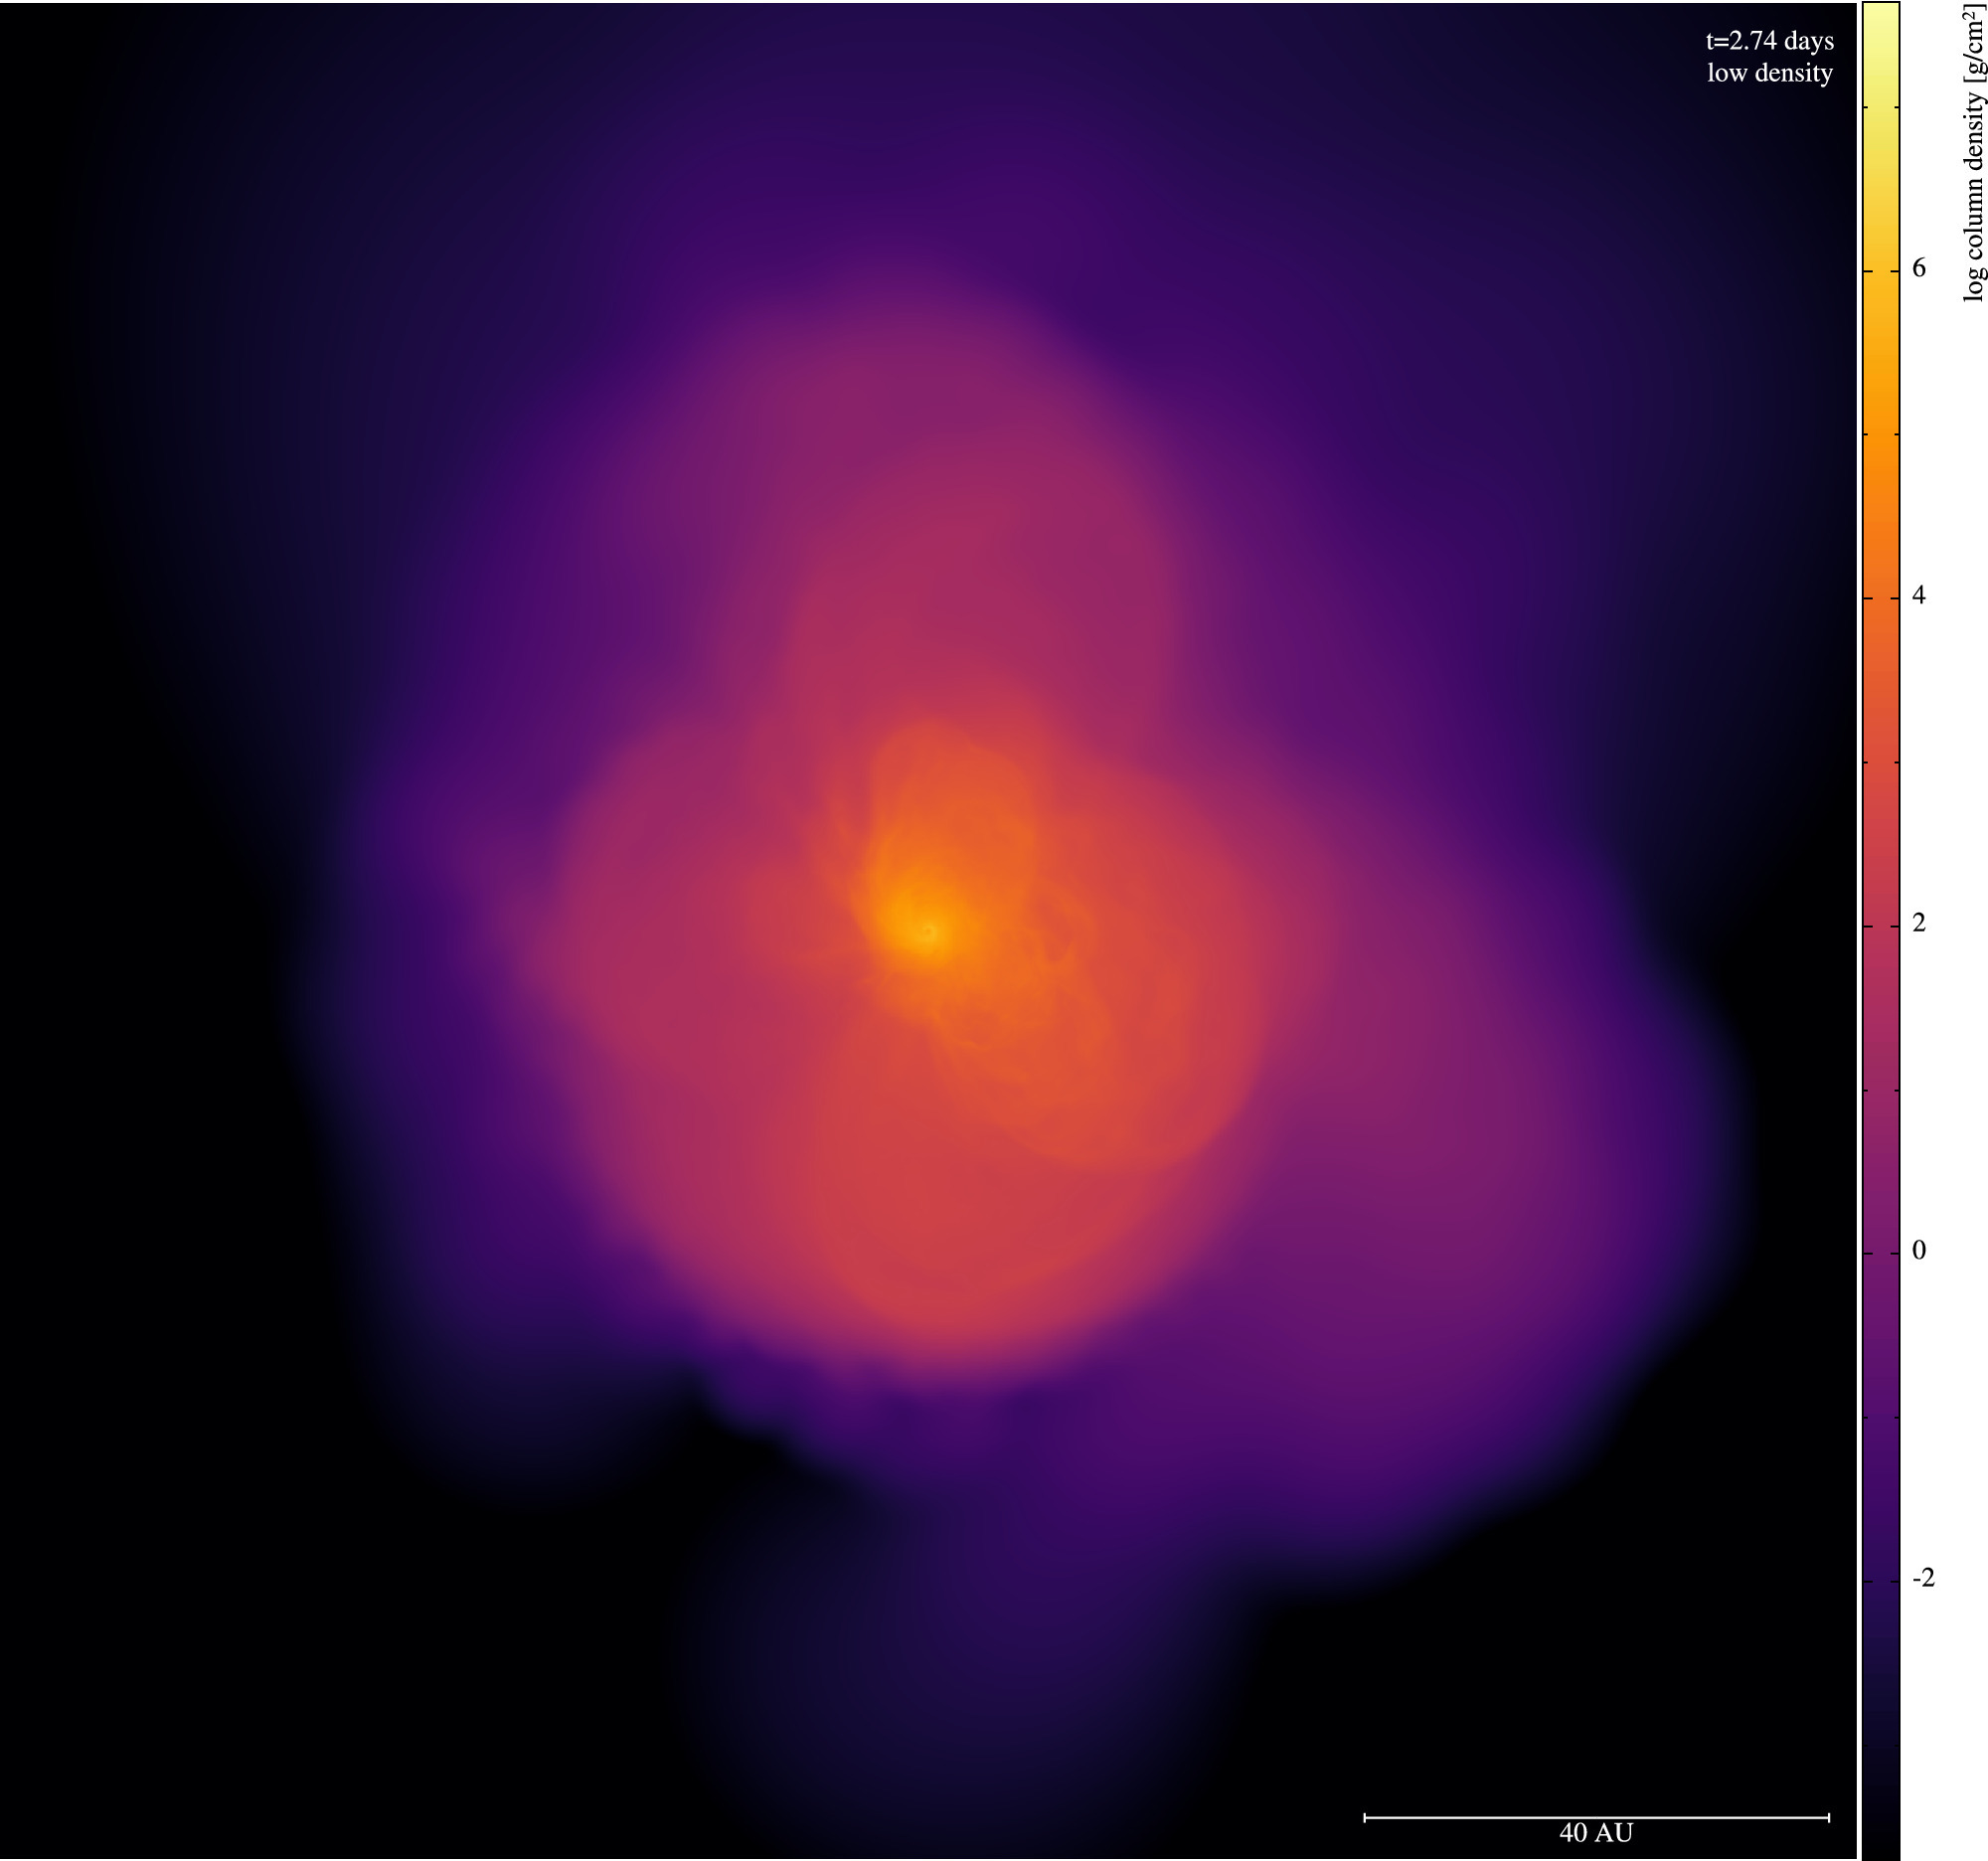
Figure 2: The column density of the stellar material surrounding the supermassive black hole at t = 2.74 days as in Figure 1, but from a zoomed-out perspective (note the larger scale compared to Figure 1). [Adapted from Hu et al. 2024]
But how does this match with actual TDE observations? To test this, the authors constructed spectra and light curves from their simulation results. They found that their synthetic spectra were broadly consistent with the genuine TDE spectra, as were their inferred luminosities from their synthetic light curves. However, their calculated blackbody radii and temperatures were systematically higher or lower than the observations, albeit of the correct order of magnitude. Therefore, the authors conclude that while the model is realistic, it does not yet accurately account for certain physical processes such as radiation transport, which can be improved upon in future simulations.
And thus ends the tragic tale of a supermassive black hole and its stellar neighbour that came a little too close. Clearly, surrounding outflows play an important role in this astrophysical tragedy that rivals Hamlet or Macbeth, processing the high-energy X-rays from the accretion disk into the lower-energy optical photons seen by observers. Unfortunately for us, though, we’ll have to wait for future simulations to find out how the story truly ends.
Original astrobite edited by Archana Aravindan.
About the author, Sonja Panjkov:
I’m a second-year PhD student at the University of Melbourne. My research focuses on the high-energy emission from the supernova remnants in the Magellanic Clouds. In my spare time, I enjoy hanging out with my cats and going to see live music.
The post Tragic Tidal Disruption Events: How Black Holes Shred Stars appeared first on AAS Nova.
]]>
Take a moment to delve into three solar physics research articles with us today to learn how researchers are studying our home star.
The post Monthly Roundup: Solar Science on a Solar Eclipse Day! appeared first on AAS Nova.
]]>Today’s the day! The Moon’s shadow will sweep across Mexico, the United States, and eastern Canada, plunging millions of eclipse viewers into a few minutes of mid-afternoon twilight. I’ll be enjoying a partial eclipse in partly cloudy Colorado, having bailed on my original plans for totality in Texas due to thunderstorms. See you all in Spain in August 2026, perhaps?
Whether your plans have been sidelined by weather or you’re enjoying the eclipse under sunny skies, take a moment to delve into three solar physics research articles with us today to learn how researchers are studying our home star.
Launching the Solar Wind with Tiny Jets
The solar wind is a hot, tenuous plasma that constantly streams out from the Sun, whipping past Earth at about 400 kilometers per second. How the solar wind is launched from the Sun’s atmosphere is a hot topic, with recent research suggesting that thousands of small jets powered by the release of pent-up magnetic energy could provide the boost the solar wind needs to get going.
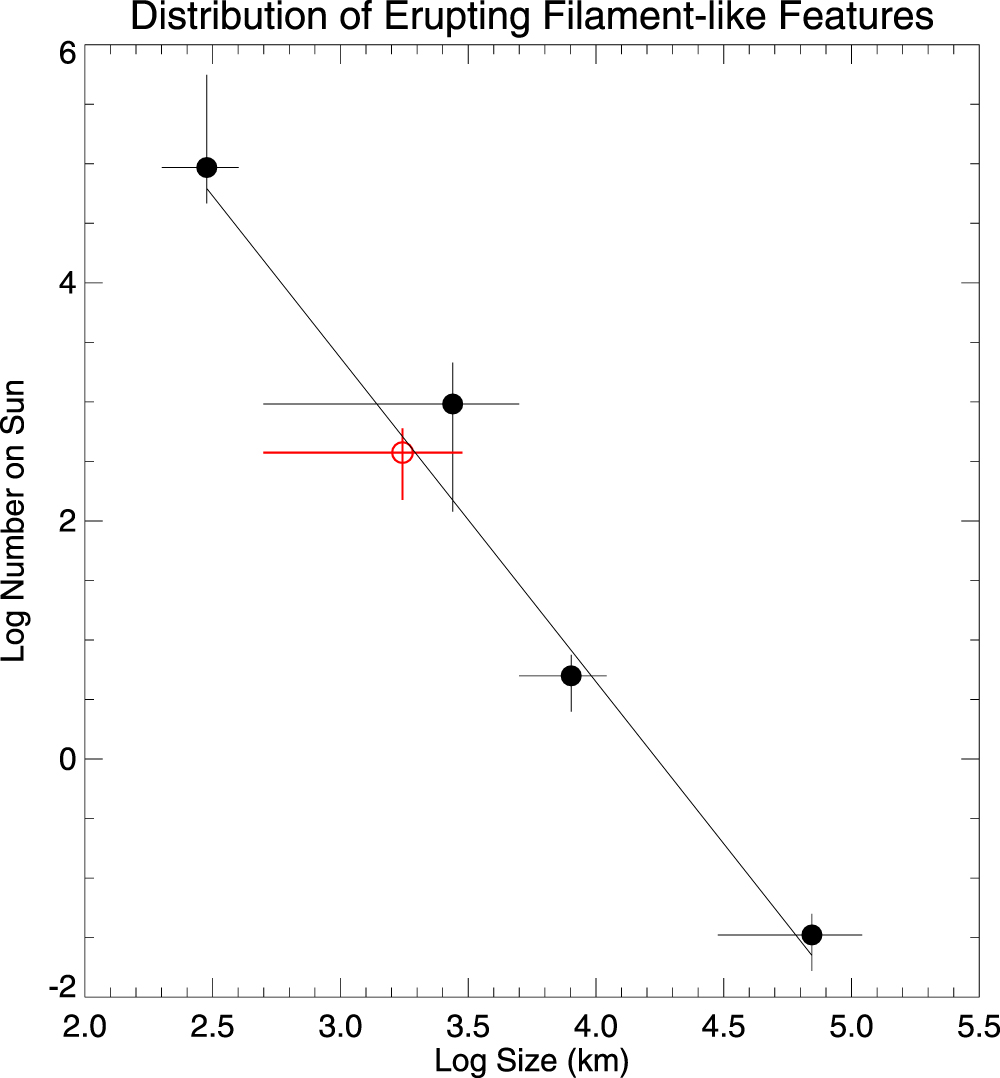
Number and size distribution of erupting filaments on the Sun. From left to right, the black circles represent microfilament eruptions, jetlets, minifilament eruptions, and solar flares and coronal mass ejections. [Sterling et al. 2024]
Looking more closely at the connection between jets and the solar wind, Sterling’s team proposed that when a flux rope erupts, the material ensnared within the rope is launched outward, and the intrinsic twist of the magnetic field in a flux rope could be transferred to field lines that extend out into the solar system. The movement of this magnetic field twist could produce magnetic zigzags called switchbacks, which have been observed in detail by the Parker Solar Probe and Solar Orbiter, connecting the beginnings of the solar wind to phenomena seen farther downwind.
A Coronal Mass Ejection Seen from Mercury, Earth, and Other Locations in Space
With spacecraft orbiting Earth, zooming around other planets, and even skimming the Sun’s atmosphere, we can study the Sun from more angles than ever before. In February 2022, three spacecraft made ultraviolet observations of a loop of solar plasma suspended within the Sun’s magnetic field. The loop of plasma, called a prominence, eventually erupted as a coronal mass ejection. The BepiColombo spacecraft and the Parker Solar Probe weathered the coronal mass ejection from their positions near Mercury’s orbit, just 0.35 au from the Sun.
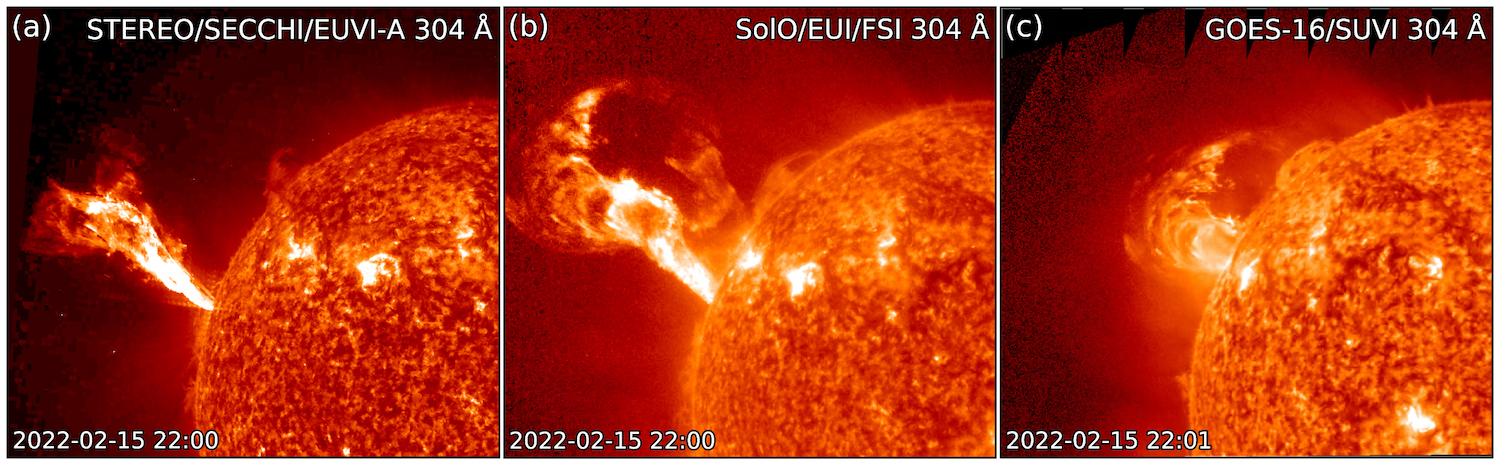
Three extreme-ultraviolet viewpoints of the same event on 15 February 2022. From left to right: the STEREO spacecraft, at Earth’s orbital distance; Solar Orbiter, around 0.75 au; and the GOES spacecraft, in orbit around Earth. [Palmerio et al. 2024]
This allowed Erika Palmerio (Predictive Science Inc.) and collaborators to study how the structure of a coronal mass ejection varies on these scales. Despite the small separation of the spacecraft, many of the properties they measured were considerably different. For example, they measured different directions of the shock as it passed over them, and the time it took for the coronal mass ejection to pass over them was measured to be different by more than 9 hours. This reveals that coronal mass ejections have considerable variations over the scales examined in this study, and more work is needed to understand how and why these variations exist.
A Potential Solution to a Persistent Problem
Magnetic field lines that emerge from the Sun’s surface and loop back to re-enter the surface are called closed field lines, while those that extend out into the solar system are called open field lines. For decades, researchers modeling the solar corona have encountered a persistent issue: models predict far less open magnetic flux than spacecraft measure. The discrepancy can be a factor of two or more, and the mismatch tends to be greatest when modeling the Sun at its most active.
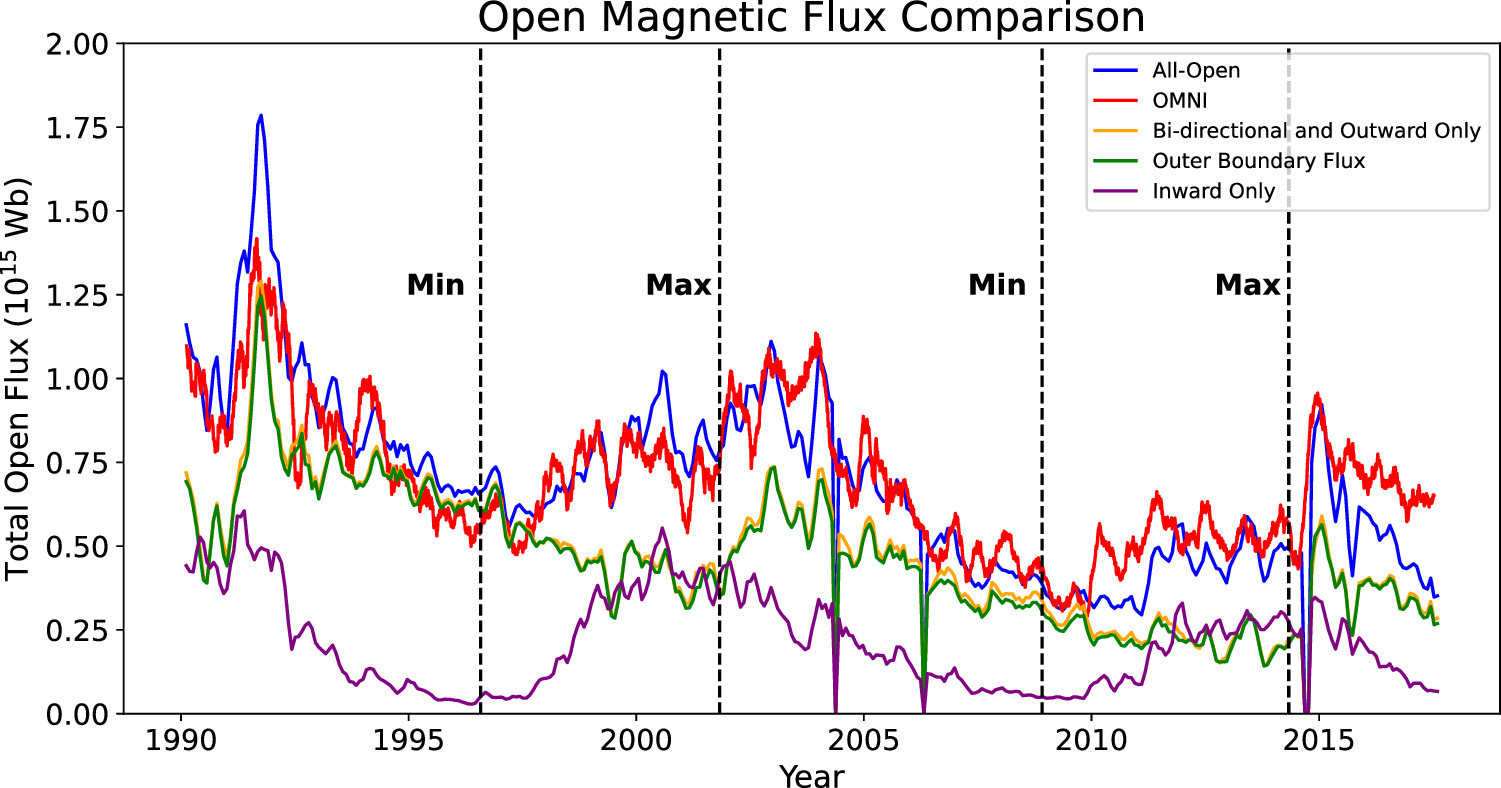
Comparison of the observed open magnetic flux (red line) with the results of various methods of tallying the flux. The blue line shows the results of the method explored in this study. Click to enlarge. [Arge et al. 2024]
The mismatch between the two methods is greatest when the grid cells of the model fall upon an active region — an area of especially strong and complicated magnetic fields — that lies on the edge of a coronal hole, where a concentration of open magnetic field lines carries solar plasma into space. This fact hints at why previous methods were least successful in matching the observed open flux when the Sun was active; high solar activity means more active regions, and more opportunities to miss open flux.
While the new method hasn’t yet been perfected, tending to overestimate the open magnetic flux in some cases, the authors hope that it will finally bring the open flux mystery to a close.
Citation
“How Small-Scale Jetlike Solar Events from Miniature Flux Rope Eruptions Might Produce the Solar Wind,” Alphonse C. Sterling et al 2024 ApJ 963 4. doi:10.3847/1538-4357/ad1d5f
“On the Mesoscale Structure of Coronal Mass Ejections at Mercury’s Orbit: BepiColombo and Parker Solar Probe Observations,” Erika Palmerio et al 2024 ApJ 963 108. doi:10.3847/1538-4357/ad1ab4
“Proposed Resolution to the Solar Open Magnetic Flux Problem,” C. Nick Arge et al 2024 ApJ 964 115. doi:10.3847/1538-4357/ad20e2
The post Monthly Roundup: Solar Science on a Solar Eclipse Day! appeared first on AAS Nova.
]]>
If simulations "remember" the conditions they started with, that could complicate the modeling of magnetized accretion disks around supermassive black holes.
The post What Do Accretion Disk Models Remember? appeared first on AAS Nova.
]]>Do models of turbulent, magnetized gas in accretion disks around black holes “remember” the conditions they started with, or is that information washed away as the model evolves?
Magnetic Fields and Accretion Disks
If you’re an astronomer, you may already know this joke: an astronomer is speaking with a therapist, discussing a recent bout of sleeplessness. The therapist asks, “What do you think it is that’s keeping you up at night?” Staring wide-eyed at the ceiling, the astronomer whispers, “Magnetic fields…”
Today’s article presents one example of why astronomers might lose sleep over magnetic fields. Magnetic fields are a key component of accretion disks, which feed material to growing stars, black holes, and other objects. Researchers have had great success in modeling magnetized accretion disks, but the huge computational cost of increasingly complex models has prompted the use of time-saving shortcuts with the potential for unintended side effects.
Testing a Model’s Memory
One way to speed up simulations is to start out with the model’s magnetic fields close to the desired end state. Recently, Payton Rodman (University of Cambridge) and Christopher Reynolds (University of Cambridge and University of Maryland) tackled the question of whether it matters what kind of magnetic fields a model starts with when simulating accretion disks around supermassive black holes.
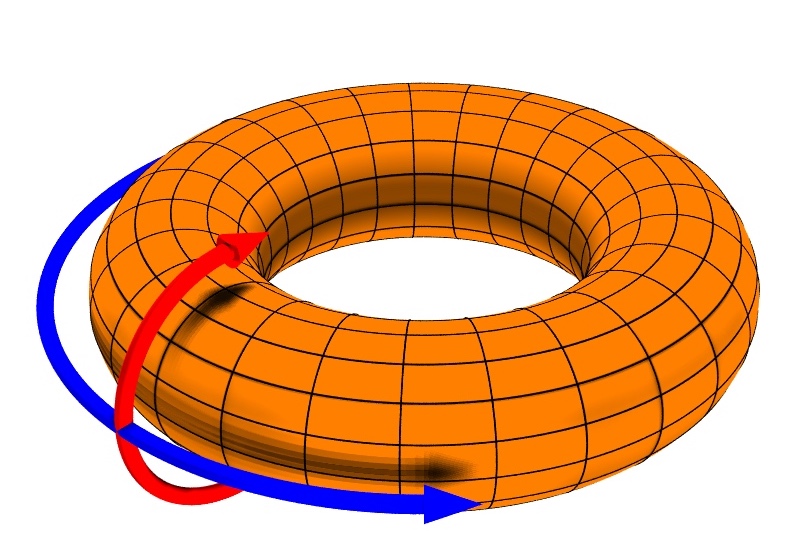
Illustration of the poloidal (red arrow) and toroidal (blue arrow) directions. [Wikipedia user DaveBurke; CC BY 2.5]

To save time, many models start out with a strong poloidal magnetic field. However, real accretion disks might instead start out with weak toroidal magnetic fields, which circle the black hole horizontally. If all magnetic fields, regardless of initial strength of configuration, “forget” their initial state and eventually evolve into the strong poloidal fields that researchers observe, that means that modelers can choose any reasonable starting parameters. If the magnetic fields retain a memory of their initial state, modelers will need to carefully examine their starting conditions and how the fields evolve.
A Clear Imprint
Rodman and Reynolds compared the evolution of weak and strong toroidal magnetic field models to test the “memory” of their accretion disk model. They found that the weak and strong magnetic field simulations diverged quickly and didn’t reach the same end point — the final outcome retained an imprint of the initial field strength.
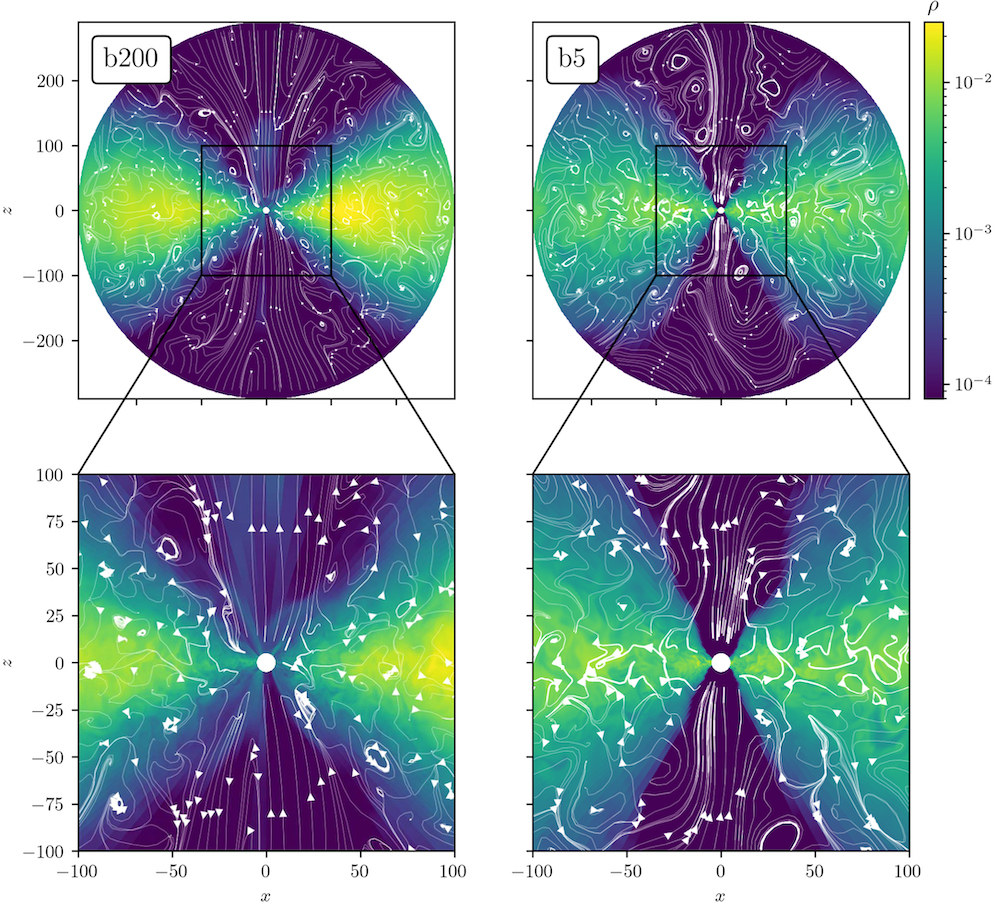
Magnetic field streamlines for simulations with a weak initial magnetic field (left) and a strong initial magnetic field (right). Click to enlarge. [Rodman & Reynolds 2024]
The results of this study make it clear that initial magnetic field conditions must be chosen carefully, as accretion models appear to have long memories. Future work should delve into this issue further, hopefully helping astronomers everywhere to rest easier.
Citation
“Evolution of the Magnetic Field in High- and Low-β Disks with Initially Toroidal Fields,” Payton E. Rodman and Christopher S. Reynolds 2024 ApJ 960 97. doi:10.3847/1538-4357/ad0384
The post What Do Accretion Disk Models Remember? appeared first on AAS Nova.
]]>
The merger of two stars can make a blue supergiant, suggesting that many of the galaxy's brightest stars are not born, but made.
The post Evidence Says Some Blue Stars Come from Two Stars appeared first on AAS Nova.
]]>New research shows that the properties of some blue supergiant stars can be explained by the merger of a massive star with a smaller companion. This suggests that many of the brightest and hottest stars in our galaxy are not born, but made.
One Star or Two?
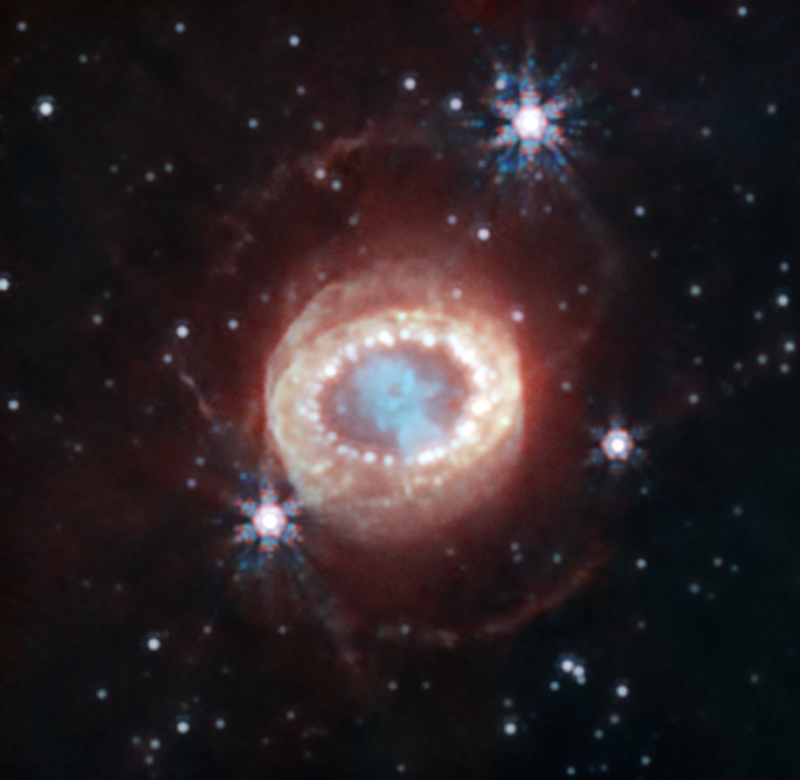
JWST image of SN 1987A. Some research suggests that the intricate ejecta pattern could not be possible without the supernova progenitor star undergoing a merger. [NASA, ESA, CSA, Mikako Matsuura (Cardiff University), Richard Arendt (NASA-GSFC, UMBC), Claes Fransson (Stockholm University), Josefin Larsson (KTH)]
Researchers have applied this line of thinking to several famous massive stars like Eta Carinae and the progenitor of the supernova SN 1987A, showing that the merger model explains these stars’ unusual properties. Now, a research team led by Athira Menon (Institute of Astrophysics of the Canary Islands and University of La Laguna) has taken the investigation a step further, using this model to explain the varied properties of a population of blue supergiant stars in a neighboring galaxy.
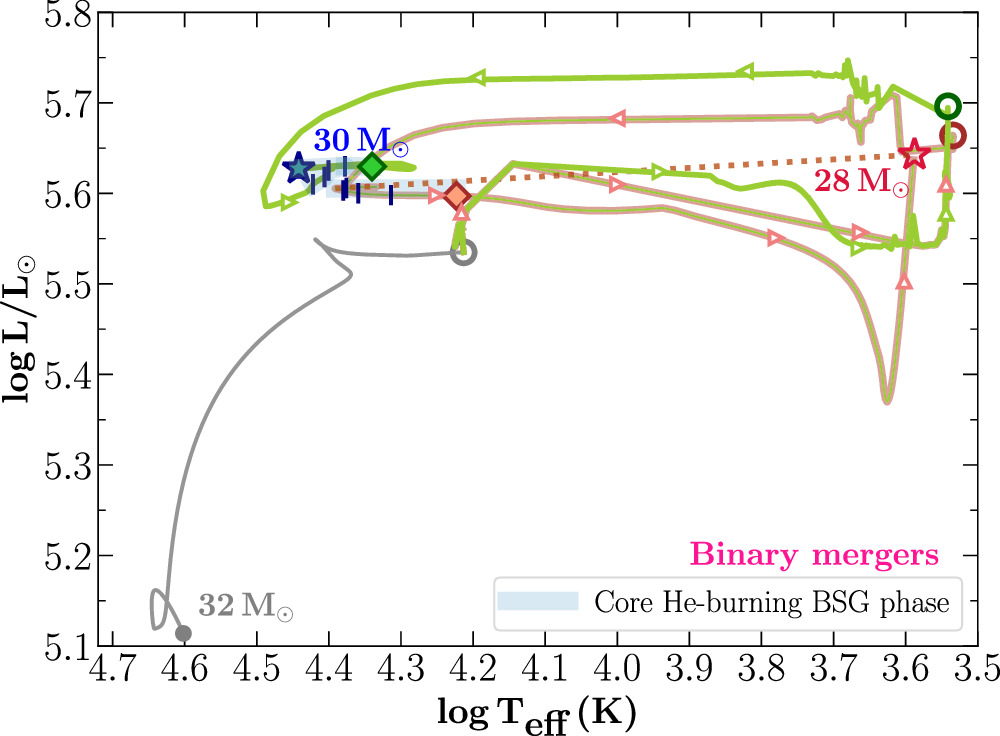
Evolutionary track for the merger product of a 31.6-solar-mass star and a 3.2-solar-mass star. [Menon et al. 2024]
A Star Is Made
Menon’s team used the Modules for Experiments in Stellar Astrophysics (MESA) to model the evolution of post-merger stars and to compare the properties of blue supergiants coming from single stars to those coming from stellar mergers.
In the stellar merger scenario, blue supergiants result from the collision of a massive post-main-sequence star and its main-sequence binary companion. As the massive star expands, it donates some of its mass to its companion, which eventually becomes entangled in the extensive outer atmosphere of the larger star. Doomed by friction and tidal forces, the smaller star “dissolves” within the larger star, setting the resulting star on a new evolutionary path.
Clues from Chemical Abundances
The team found that blue supergiants formed through mergers have different surface abundances of elements like carbon and oxygen compared to supergiants arising from single stars. To compare these results to the properties of actual blue supergiants, the team amassed a sample of 59 blue supergiant stars in the Large Magellanic Cloud and divided them into three groups based on the ratios of their carbon, nitrogen, and oxygen abundances.
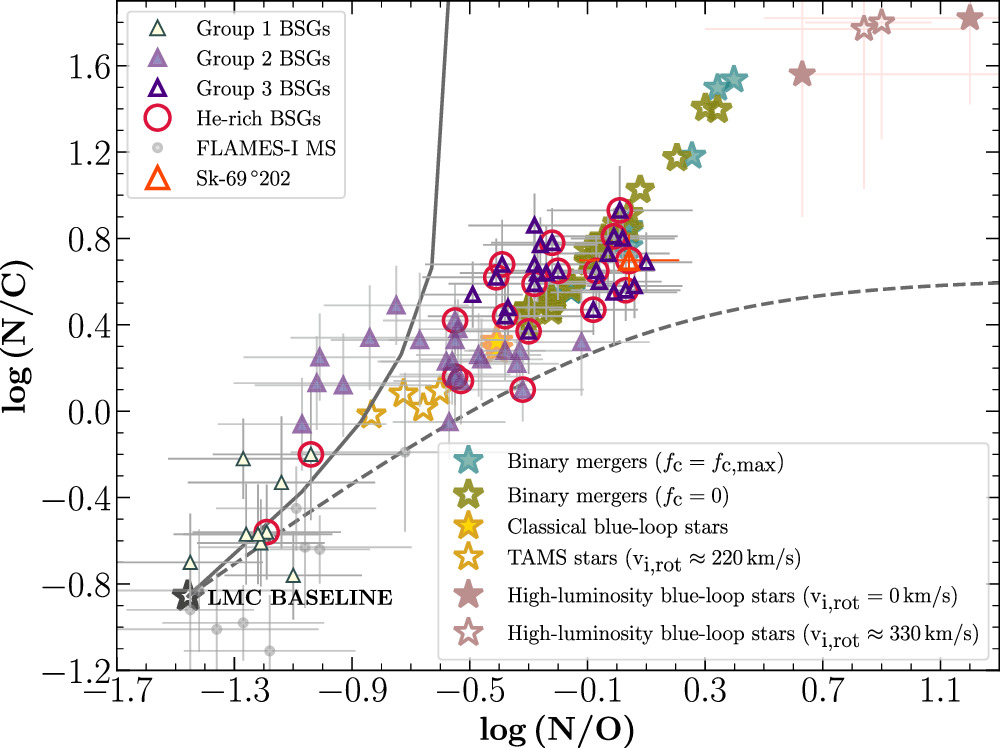
Chemical abundance ratios for modeled stars (star icons) and observed blue supergiants (BSGs; triangles). Click to enlarge. [Menon et al. 2024]
Taking into account other factors, such as systematic offsets, Menon’s team concluded that more than half of the 59 stars in their sample came from stellar mergers. This suggests that many blue supergiant stars owe their status to a stellar merger, and the merger model is a valuable tool to understand blue supergiant populations throughout the universe.
Citation
“Evidence for Evolved Stellar Binary Mergers in Observed B-type Blue Supergiants,” Athira Menon et al 2024 ApJL 963 L42. doi:10.3847/2041-8213/ad2074
The post Evidence Says Some Blue Stars Come from Two Stars appeared first on AAS Nova.
]]>
Astrobites reports on a study that aims to determine whether the sources of gamma-ray bursts could also be a source of ghostly neutrinos.
The post Ghost (Particle) Hunting in Gamma-ray Bursts appeared first on AAS Nova.
]]>Editor’s Note: Astrobites is a graduate-student-run organization that digests astrophysical literature for undergraduate students. As part of the partnership between the AAS and astrobites, we occasionally repost astrobites content here at AAS Nova. We hope you enjoy this post from astrobites; the original can be viewed at astrobites.org.
Title: Search for 10–1,000 GeV Neutrinos from Gamma-ray Bursts with IceCube
Authors: IceCube Collaboration
Status: Published in ApJ
Particle Accelerators, but in Space!
Gamma-ray bursts are some of the most powerful explosions in the universe, releasing a “fireball” of particle-filled plasma in a powerful jet that accelerates these particles through the universe. Gamma-ray bursts are understood to originate either from compact object (neutron star or stellar-mass black hole) mergers (these are called short gamma-ray bursts and last less than two seconds!) or from core-collapse supernovae (these are called long gamma-ray bursts but are just defined as anything longer than two seconds). Gamma-ray bursts are the most powerful particle accelerators in the universe and are really useful for looking for new particles and new particle interactions!
Today’s authors look at gamma-ray bursts as a possible source of ghost particles, i.e., neutrinos. Neutrinos rarely interact with other matter, which makes them really hard to detect — like a ghost! The IceCube Neutrino Observatory sees neutrinos all over the sky but can’t pinpoint where they’re coming from. Since gamma-ray bursts could produce neutrinos in their outbursts, the authors search through all of IceCube’s data to see if there are any bursts of high-energy neutrinos that came in at the same time as a gamma-ray bursts.
How Many Gamma-ray Bursts Does It Take to Find a Neutrino?
Today’s authors search for coincident neutrinos in the time periods surrounding the 2,298 bursts that happened during the lifetime of IceCube-DeepCore (IceCube’s highest-energy neutrino detector). They do this by looking at each time window individually and by combining many time windows to add faint signals that might not be seen in individual windows, but together might show an association between neutrinos and gamma-ray bursts.
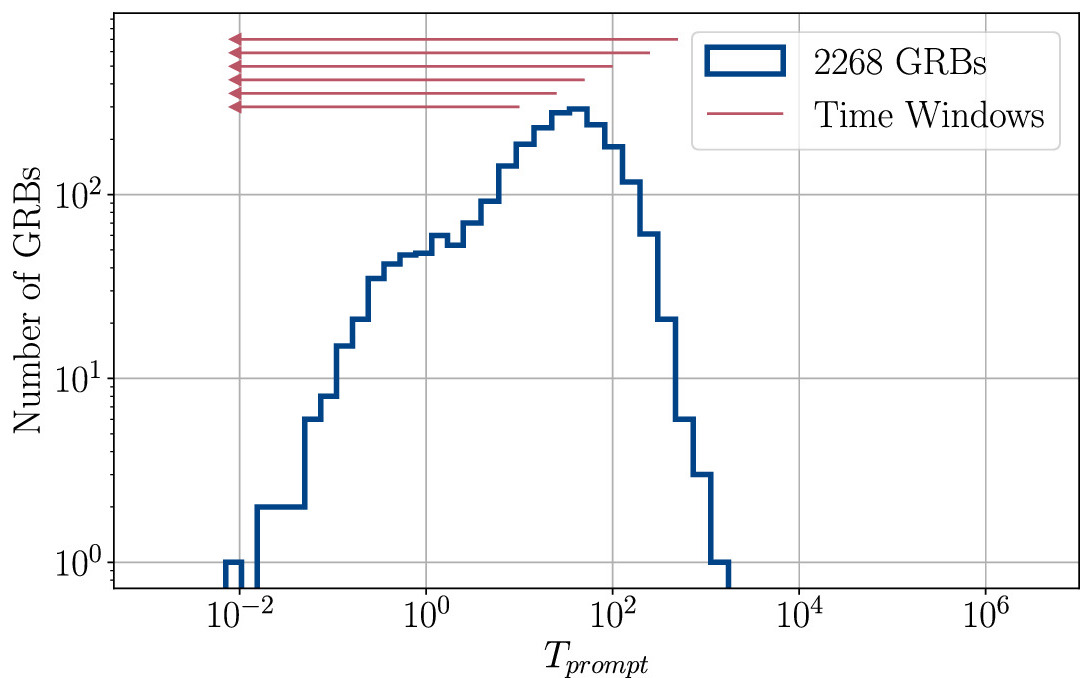
Figure 1: A histogram of the initial gamma-ray burst emission (called prompt emission) duration for all 2,268 gamma-ray bursts used in this study. The time windows investigated in this article are shown as red arrows. [Adapted from IceCube Collaboration et al. 2024]
The second search looks at groups of gamma-ray bursts that are associated in location and time with neutrino events. The authors look at the combined probability of burst/neutrino association of all the events in this group. This makes it possible to correlate gamma-ray bursts with neutrinos even if the events don’t individually stand out. Using this method, the authors didn’t find any groups of neutrinos that are any more statistically significant than individual neutrinos that fall within gamma-ray burst time windows.
Trials Factors and Tribulations
The winning burst of the first search (i.e., the most significant neutrino–gamma-ray burst correlation) is GRB bn 140807500. (Since there are a lot of gamma-ray bursts recorded by burst-hunting instruments like the Fermi Gamma-ray Burst Monitor (Fermi-GBM) and the Swift Burst Alert Telescope (Swift-BAT), it’s too much of a hassle to give the bursts individual names. Instead, the bursts get “telephone numbers” corresponding to the date they were detected.) The corresponding neutrino falls within 100 seconds of GRB bn 140807500 and has a p-value of 4.6 x 10⁻⁵, which is the probability that the correlation between the burst and the neutrino is just a lucky coincidence and not from actual correlation (i.e., small p-values mean a more likely detection of neutrinos from gamma-ray bursts!).
This probability seems really small, and at first glance it seems like the neutrino and the gamma-ray burst are most likely connected here! Unfortunately, this doesn’t take into account trials factors (also called the look-elsewhere effect), which quantify the statistical statement that if you look at enough gamma-ray bursts and neutrinos, there will be some events that line up with each other in space and time, just by chance. To account for this, the authors must correct for 2,268 trials, one for each burst. After correcting for trials, this leaves us with a much larger p-value of 0.097, meaning there’s a one in ten chance that the gamma-ray burst and the neutrino aren’t really connected. Generally particle (and astroparticle) physicists require a p-value of 3×10⁻⁷ (about 1 in 3.5 million, corresponding to the [in]famous 5-sigma threshold!) to feel confident in saying that these events are actually correlated.
Don’t Forget About the BOAT
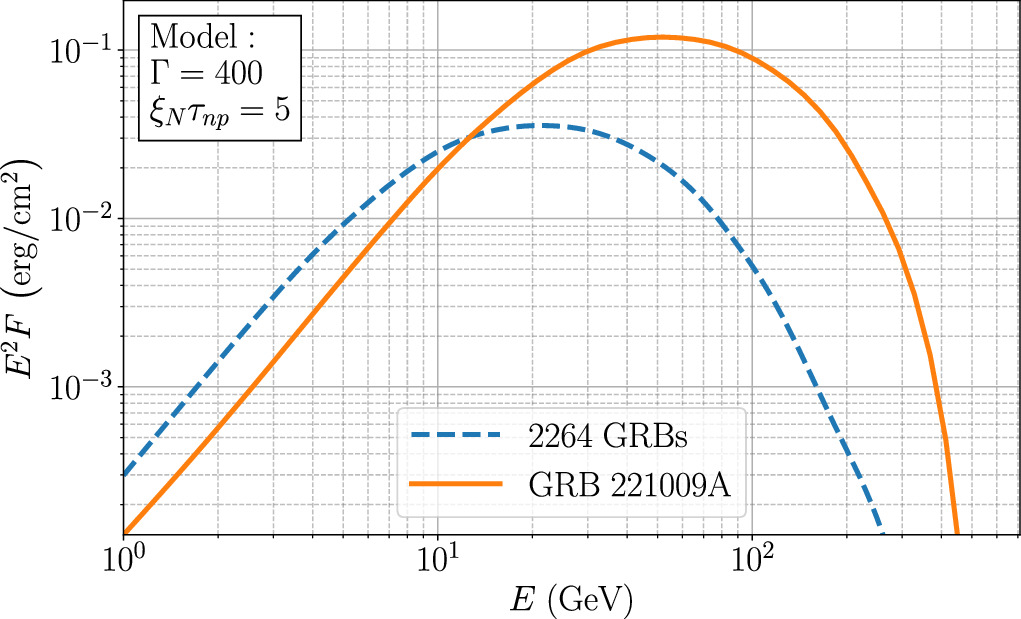
Figure 2: Estimated neutrino flux (number of neutrinos detected at a given energy per area) for 2,264 gamma-ray bursts combined (blue) compared with the BOAT gamma-ray burst (orange). (Four of the bursts used in this study were excluded from this analysis.) [IceCube Collaboration et al. 2024]
There’s still work to be done to see if there are any neutrino events that seem to come from the BOAT gamma-ray burst, but this leaves the idea open that neutrinos could come from gamma-ray bursts (or at least, that we can more confidently say that they don’t)! The universe sometimes throws surprises like the BOAT at us, allowing astronomers to study the high-energy universe a lot more easily. Luckily, we’ve entered into the era of time-domain astronomy where instruments like Fermi-GBM and Swift-BAT allow us to catch more bursts and explosions than ever before, giving us an increasingly large sample of gamma-ray bursts to study!
Original astrobite edited by Cole Meldorf.
About the author, Samantha Wong:
I’m a graduate student at McGill University, where I study high-energy astrophysics. This includes studying all sorts of extreme environments in the universe like active galactic nuclei, pulsars, and supernova remnants with the VERITAS gamma-ray telescope.
The post Ghost (Particle) Hunting in Gamma-ray Bursts appeared first on AAS Nova.
]]>
A giant star-forming region in the Milky Way has a new infrared portrait, thanks to a telescope flying through the stratosphere.
The post Featured Image: Giant Star-Forming Cloud appeared first on AAS Nova.
]]>The brightest giant star-forming region in the Milky Way has a new portrait, thanks to observations from a telescope flying through the stratosphere. A team led by James De Buizer (NASA Ames Research Center) paired new data from the airborne Stratospheric Observatory for Infrared Astronomy (SOFIA) with archival observations from the venerable Spitzer and Herschel infrared space telescopes to create the new image, shown above. The new observations yielded the highest-resolution data of the region at a wavelength of 25 microns (1 micron = 10-6 meter) and enabled the researchers to study star formation and search for structures around young stars. The clump of stars at the center of the image, HD 97950, is a starburst cluster that contains some of the most massive stars known. De Buizer’s team identified new massive young stellar objects, studied the dusty outflow of an evolved blue supergiant, and found several candidate high-mass proplyds: baby stars surrounded by dusty disks that are being blown away by intense radiation. To learn more about this enormous, dynamic star-forming region, be sure to check out the full article linked below.
Citation
“Surveying the Giant H II Regions of the Milky Way with SOFIA. VI. NGC 3603,” James M. De Buizer et al 2024 ApJ 963 55. doi:10.3847/1538-4357/ad19d1
The post Featured Image: Giant Star-Forming Cloud appeared first on AAS Nova.
]]>
Fitting models to pulsar arrival times is typically a tricky business. A new algorithm might let computers take on some of the decision-making burdens.
The post Making Computers Count Pulses appeared first on AAS Nova.
]]>Pulsars are the universe’s natural lighthouses, and we can learn much about them by modeling their periodic flashes. But, fitting these models is a tricky task that often requires manual decision-making. A new algorithm, however, promises to offload that work to the computers.
Listening to the Sky
The Green Bank Telescope, a workhorse among pulsar timing observatories. [NRAO/AUI/NSF, CC BY 3.0]
At first glance, carrying out these fits might seem like a straightforward task since pulsar system can be described by only a handful of parameters including the spin frequency and its drift rate over time. So, naively one would think that if you’re just looking for the best-fitting parameters, you could code up a model, then fiddle around with its inputs until the fit looks correct. Unfortunately, radio astronomers are not so lucky.
Counting (Pulsar Rotations) Can Be Hard
The residuals to the initial fit for one example pulsar. Since the model’s spin frequency is slightly incorrect, the scatter in the residuals is far larger than expected given the tiny error bars. [Taylor et al. 2024]
So, astronomers typically proceed cautiously. Instead of rushing in and immediately trying to fit all of the data with all of the parameters at once, they instead fit subsets of the data with simpler models, then iteratively add complications until they’re left with the full, final model. Historically, this was a manual process that involved a lot of choices about what to include and reject at each step, and scientists would often spend hours on each pulsar to get it right.
New Automation
An illustration of how the new algorithm tries different paths towards the final model fit. [Taylor et al. 2024]
Taylor and collaborators designed their algorithm to handle not just isolated pulsars, but also more complicated systems where the pulsar has a nearby companion that affects its motion. To test their code, they let their new algorithm loose on two newly discovered pulsars that would have been very challenging to fit “by hand” due to the limited number of observations. Happily, they found that their procedure succeeded where a human would struggle: after exploring many different decision trees, it landed on a satisfactory solution in both cases.
Though it still requires several hours to arrive at the global best fit, being able to check so many paths in such a uniform way is an enormous benefit to previously bogged-down astronomers. As we continue to discover more and more pulsars, tools like this will likely see increased use over the next several years.
Citation
“Algorithmic Pulsar Timer for Binaries,” Jackson Taylor et al 2024 ApJ 964 128. doi:10.3847/1538-4357/ad1ce9
The post Making Computers Count Pulses appeared first on AAS Nova.
]]>
The Event Horizon Telescope Collaboration has analyzed data that show our home galaxy's central black hole in a new light — polarized light, to be precise.
The post A New Way of Looking at the Milky Way’s Supermassive Black Hole appeared first on AAS Nova.
]]>In 2022, the Event Horizon Telescope Collaboration released the first image of the supermassive black hole at the center of the Milky Way. Now, the team has taken a closer look at our hometown black hole to understand the nature of its magnetic fields, the spin of its accretion disk, and more.
A First Look at the Milky Way’s Supermassive Black Hole
The first EHT image of Sgr A*. [EHT Collaboration; CC BY 4.0]
These observations revealed a bright ring of emission from the superheated accretion disk surrounding Sgr A* and confirmed that it is indeed a supermassive black hole with an event horizon — a surface beyond which nothing, including light, can escape the black hole’s immense gravitational pull.
Top: Average polarization fraction for Sgr A*. Bottom: Polarization “field lines” showing the spiral pattern of the polarization angles. [EHT Collaboration et al. 2024]
From Brightness to Polarization
But the EHT did more than just measure the brightness of the glowing gas surrounding Sgr A* — it also measured the light’s polarization. As light waves wiggle through space, they can be oriented in any direction. If the light is oriented every which way, that light is unpolarized. If instead the waves are oriented along a particular plane, the light is polarized.
Hot, magnetized plasma emits linearly polarized light because the magnetic field influences the direction in which light waves oscillate. If this polarized light travels through magnetized material, the direction of polarization might rotate or become random. By analyzing the polarization of an object’s emitted light, researchers can study the strength and structure of the object’s magnetic fields and determine whether or not there is magnetized material between the source and our telescopes.
The EHT data show that the light from the hot, gaseous accretion disk surrounding Sgr A* is strongly polarized, with certain parts of the glowing disk being up to 40% linearly polarized. Some of the light — 5–10% — is circularly polarized, which means that the orientation of the waves rotates as the light travels. The polarization direction follows a distinct pattern, forming a spiral that curls around the black hole.
Measurements, Modeling, and Magnetic Fields
The amount of polarized light and the direction of polarization can help researchers disentangle the structure of the magnetic field lines close to the black hole and determine the properties of its accretion disk. The EHT collaboration used simple analytic models and rigorous numerical general relativistic magnetohydrodynamics models to study these properties.
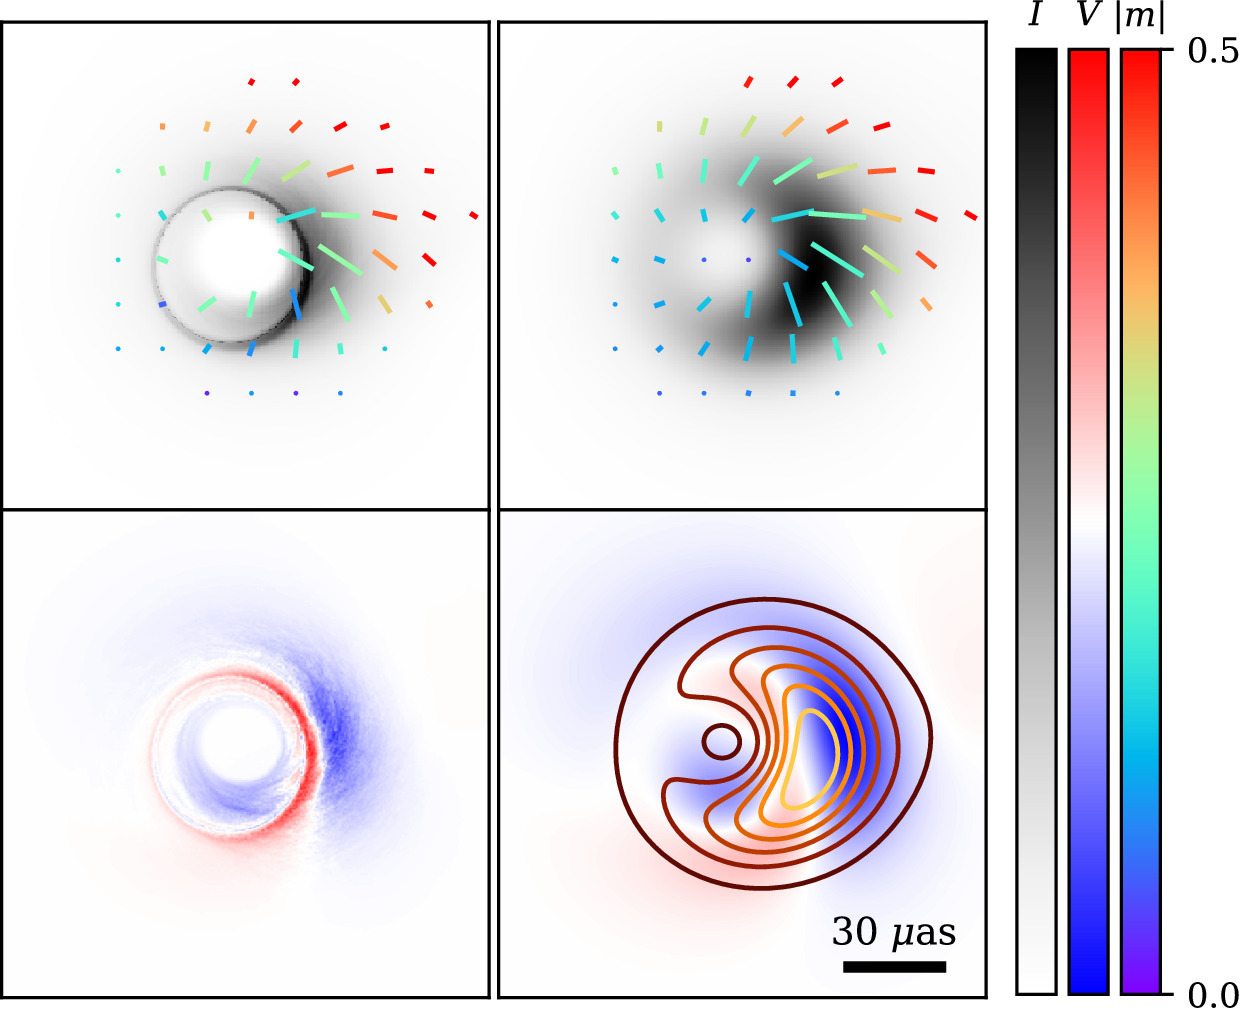
The best-fit model of Sgr A* showing simulated images that are unblurred (left column) and blurred to the approximate resolution of the EHT (right column). The top row shows the total intensity, strength, and direction of the linearly polarized light. The bottom row shows the circularly polarized light. Click to enlarge. [Adapted from EHT Collaboration et al. 2024]
If the material is inside the emitting region, this suggests that the black hole’s accretion disk rotates in the opposite direction from what researchers have inferred from previous observations. Additionally, none of the models that place the material inside the emitting region can meet all of the observational constraints. If the material is instead outside this region, this would mean that the disk rotates in the expected direction, and the team finds one model that can meet all of the observational constraints. In this model, Sgr A* is surrounded by strong magnetic fields and the black hole rotates in the same direction as the material swirling around it.
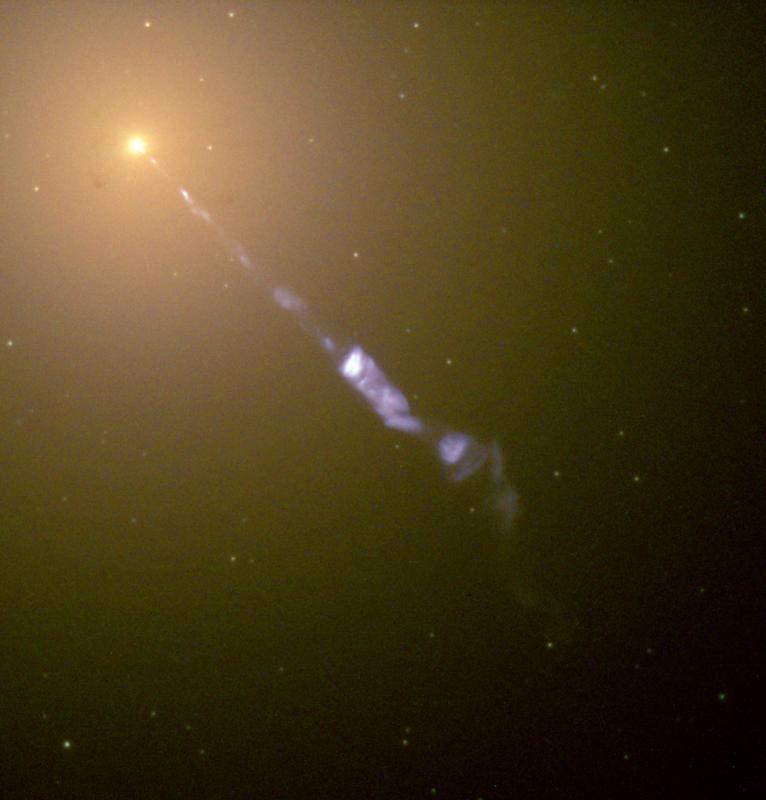
This visible-light image from the Hubble Space Telescope shows the massive elliptical galaxy Messier 87. The Milky Way’s central black hole is much less massive than Messier 87’s, and Messier 87’s larger black hole powers a jet of electrons and other particles, seen here. [NASA and The Hubble Heritage Team (STScI/AURA)]
How Does Sgr A* Stack Up?
In addition to Sgr A*, the EHT has observed M87*, the supermassive black hole at the center of the massive elliptical galaxy Messier 87. M87* is about 1,500 times more massive than the Milky Way’s black hole, and it’s far more active, too — a jet of particles powered by the black hole stretches 5,000 light-years beyond the galaxy, whereas Sgr A* appears to have no jet at all.
Compared to Sgr A*, M87*’s light is much less strongly polarized, with the polarization fraction topping out around 15%. This means that hot, magnetized plasma close to the black hole is scrambling the polarization of the emitted light.
Despite these differences, both M87* and Sgr A* favor magnetically arrested disk models, in which magnetic fields pile up at the inner edge of the accretion disk and moderate the rate at which gas from the disk falls onto the black hole. Because magnetic fields are thought to play a critical role in the creation of supermassive black hole jets, the similarities in the magnetic fields of M87* and Sgr A* could mean that our galaxy’s black hole has a jet that’s yet to be discovered.
Looking Ahead
The EHT Collaboration’s results show that the closest supermassive black hole isn’t necessarily the easiest one to study; Sgr A* varies rapidly, changing noticeably even over the course of a single day’s observations, making the challenging feat of extracting information from the new polarized images even more complicated. The articles published today represent just the beginning of the investigation into Sgr A*’s polarized light, and future advances could come from new observations as well as improvements in modeling.
Models that have different starting conditions, include electrons with different energies, or fuel the black hole with helium gas instead of hydrogen gas, may provide a path forward. Future observations by the EHT will probe Sgr A* at a higher frequency, potentially allowing researchers to discern whether the material that is rotating the polarized light from the disk lies within the emitting region or outside of it.
While you wait for new measurements and modeling breakthroughs, be sure to check out all the Sgr A* research from the EHT team in the Focus Issue on First Sgr A* Results from the Event Horizon Telescope.
Citation
“First Sagittarius A* Event Horizon Telescope Results. VII. Polarization of the Ring,” EHT Collaboration et al 2024 ApJL 964 L25. doi:10.3847/2041-8213/ad2df0
“First Sagittarius A* Event Horizon Telescope Results. VIII. Physical Interpretation of the Polarized Ring,” EHT Collaboration et al 2024 ApJL 964 L26. doi:10.3847/2041-8213/ad2df1
The post A New Way of Looking at the Milky Way’s Supermassive Black Hole appeared first on AAS Nova.
]]>
Astrobites reports on how we can find isolated black holes by searching for the twinkling of stars that these black holes pass in front of.
The post How to Tell If a Black Hole Is Making Your Fairy Lights Twinkle appeared first on AAS Nova.
]]>Editor’s Note: Astrobites is a graduate-student-run organization that digests astrophysical literature for undergraduate students. As part of the partnership between the AAS and astrobites, we occasionally repost astrobites content here at AAS Nova. We hope you enjoy this post from astrobites; the original can be viewed at astrobites.org.
Title: Disentangling the Black Hole Mass Spectrum with Photometric Microlensing Surveys
Authors: Scott Ellis Perkins et al.
First Author’s Institution: Lawrence Livermore National Laboratory
Status: Published in ApJ
Lonesome Black Holes
Seeing the darkness is something that is a great mystery in modern physics, from dark matter to black holes. How do you see something that doesn’t emit light?
Current methods of detecting black holes include observing their accretion from surrounding matter, whether that’s supermassive black holes in the centres of galaxies or smaller black holes that are stealing matter from a stellar companion. Black holes that don’t have any glowing surrounding matter may have a black hole or neutron star partner to spiral into, releasing gravitational waves that we detect with the LIGO, Virgo, and KAGRA detectors. But lonely black holes sitting in the darkness are significantly harder to uncover. In the Milky Way, it’s expected that there are 100 million isolated and binary black holes that are born from dead massive stars. Of those, only ~50 have been detected.
Twinkling Lights
Fortunately, there’s a detection method that can fill this gap: microlensing. If an isolated black hole is located in front of a star or galaxy much farther away, that background object’s brightness will vary with time as its light is lensed by the black hole moving in front of it (see Figure 1). This is similar to a magnifying glass passing in front of the star’s tiny pinprick of light, but instead the lens of the glass is the curvature of spacetime due to the mass of the black hole. Because the lens magnifies the background object, it will appear to change in brightness, twinkling like fairy lights.
Figure 1: An animation of a black hole passing in front of a background star. Because the black hole bends spacetime along the path from the star to the observer, two images of the star are created. The lensing also changes the apparent brightness of the star, which is still detectable photometrically even when the different images are too close to be separately resolved by the observer. [NASA’s Goddard Space Flight Center Conceptual Image Lab]
However, there are a few different kinds of objects that can lens background stars. Black holes, white dwarfs, neutron stars, and free-floating planets have all been found through microlensing. If we can know the mass of the lens, then we can characterise a lens as a stellar-mass black hole (usually 5–100 times the mass of the Sun). However, an individual microlensing light curve doesn’t carry any useful information about the mass of the lens without also knowing the astrometric shift in the lensed object — something we don’t have for many microlensing observations. However, studying a larger group of microlensing events can break the degeneracies present in individual light curves, helping researchers classify lensing events and search for the hidden black holes in the dark. Today’s article defines a framework for determining the class of individual detections and groups of microlensing events using probabilistic models and Bayesian statistics.
Looking at Populations of Black Hole Lenses
Different types of lenses will be distributed differently in the effects they create in the light curves that we detect. For example, there will be more black holes over a certain range of masses and more white dwarfs over a different range of masses. This means that the distributions of some of the measurements of the lensing profile, such as the angle between the image of the source and the actual source location, will be different because of correlations between these parameters and the lens mass.
This article looks at three kinds of lenses: free-floating planets, stellar-mass black holes, and primordial black holes. Accounting for primordial black holes in the model separately from stellar-mass black holes allows this method to demonstrate a measure of the abundance of primordial black holes, which could provide an explanation for dark matter or evidence for the first black hole seeds in the early universe. The authors construct five simulated universes with the same number of mock microlensing events for free-floating planets and stellar-mass black holes, but each with a different number of primordial black holes. For each of these universes, the distribution of the distances and the kinematics of the events are the same, but there is a different distribution of lens masses caused by the varying fraction of primordial black holes.
Using these mock events, the authors construct a probability distribution for events belonging to a certain class for each universe. If you assume a fixed group of certain types of lenses (meaning a fixed mock universe and lens mass distribution), and you know the profiles of the microlensing light curves that are likely to be produced by each of those different lens types, you can say how probable it is that a microlensing event is caused by a specific type of object. Their method reliably classifies most of the true black hole events from each population’s mock events, as shown in Figure 2. While their method has fewer correct black hole candidates, or “true positives,” than previous methods, their identified population of black holes has many fewer false black hole identifications and therefore a much higher purity of detection.
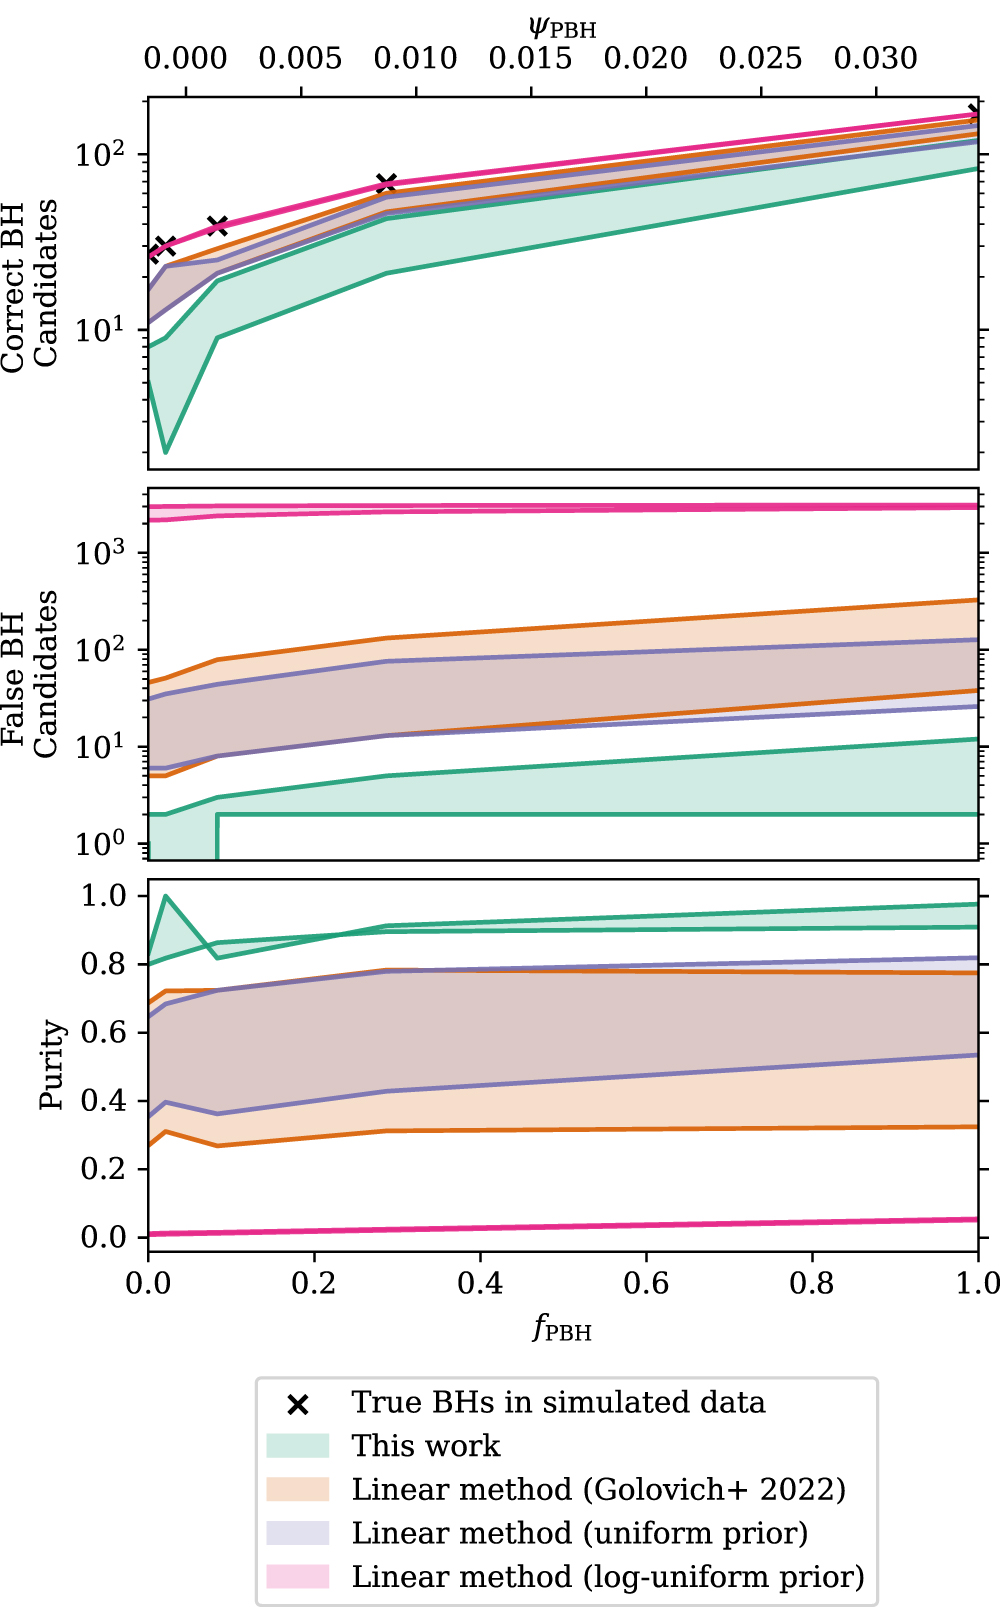
Figure 2: The number of mock microlensing events correctly categorised as black holes (top panel), incorrectly categorised as black holes (e.g., these were simulated free-floating planets but appeared to be black holes in their framework; middle panel), and the fraction of correctly identified black holes divided by the total number of black hole identifications (bottom panel), versus the fraction of primordial black holes in each population. This method is shown in the green band, while previous methods are shown in orange, purple and pink. The bottom edge of each band represents the number for which the classification probability is above a 50% confidence, while the upper edge is 90% confidence. While this method does not reach the true number of correctly identified black hole events (black crosses), it does have the highest purity of all methods. [Perkins et al. 2024]
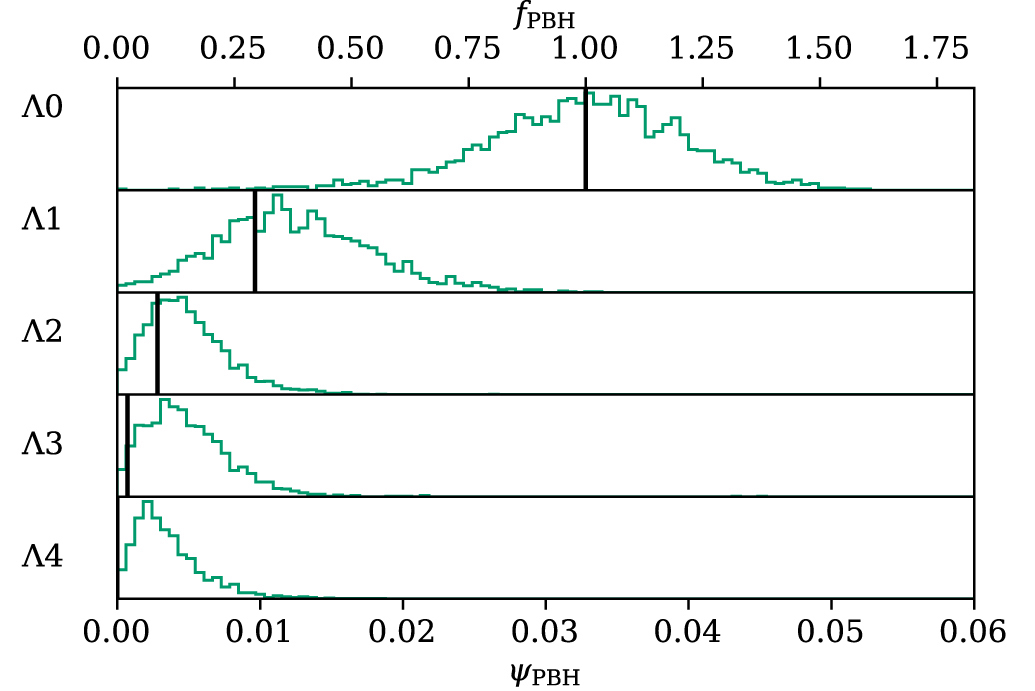
Figure 3: The predicted values for the fraction of primordial black holes (fPBH) with the authors’ framework (green), for five simulated universes (Λ 0-4). The true value is marked with the black vertical line for each universe. The predicted fraction follows the true fraction well, and the width of this distribution represents the uncertainty determined by the framework. [Adapted from Perkins et al. 2024]
The Future of Black Hole Microlensing Surveys
The next step for the authors’ statistical framework is to test it with real photometric measurements of microlensing from the Optical Gravitational Lensing Experiment (OGLE), a survey of more than a billion stars for time-domain astrophysics. By combining this method and real observations with more realistic model universes and more sophisticated simulations of primordial black holes, stellar-mass black holes, and other types of lenses, this could tell us more about the population of stellar-mass black holes alone in the wild. Pairing these results up with astrometric measurements that will come from the Nancy Grace Roman Space Telescope in the next few years will provide even more knowledge about the kinds of black holes making stars (or fairy lights?!) twinkle in the night sky.
Original astrobite edited by Samantha Wong.
About the author, Storm Colloms:
Storm is a postgraduate researcher at the University of Glasgow, Scotland. They work on understanding populations of binary black holes and neutron stars from the gravitational wave signals emitted when they merge, and what that tells us about the lives and deaths of massive stars. Outwith astrophysics they spend their time taking digital and film photos and making fun doodles of their research.
The post How to Tell If a Black Hole Is Making Your Fairy Lights Twinkle appeared first on AAS Nova.
]]>
When white dwarfs begin to crystallize, can the change prompt the formation of magnetic fields millions of times stronger than Earth's?
The post Crystallization, Convection, and a Magnetic White Dwarf Mystery appeared first on AAS Nova.
]]>Most stars in the Milky Way will evolve into white dwarfs: ultra-hot, crystallized stellar cores, some of which have magnetic fields millions of times stronger than Earth’s. Could the crystallization of white dwarf interiors explain why some of these stars have such strong magnetic fields?
Magnetic Mystery
When a super-hot white dwarf illuminates the diffuse shells of gas that surround it, we see a glowing planetary nebula. The central white dwarf is visible in this image of the Ring Nebula. [NASA, ESA and the Hubble Heritage (STScI/AURA)-ESA/Hubble Collaboration]
Some white dwarfs have extremely strong magnetic fields, and the origin of these fields isn’t yet clear. Though the magnetic fields in question are a million times stronger than Earth’s, they might form in similar ways, as new research from José Rafael Fuentes (University of Colorado Boulder) and collaborators shows.
Creating Crystal Interiors
Many magnetic fields in the universe, including Earth’s, form in liquids that have three properties: they’re electrically conductive, they rotate, and they convect — rising and falling like the globs of wax in a lava lamp. As white dwarfs begin to cool, a process begins by which their liquid interiors may achieve all three criteria necessary to generate a magnetic field.
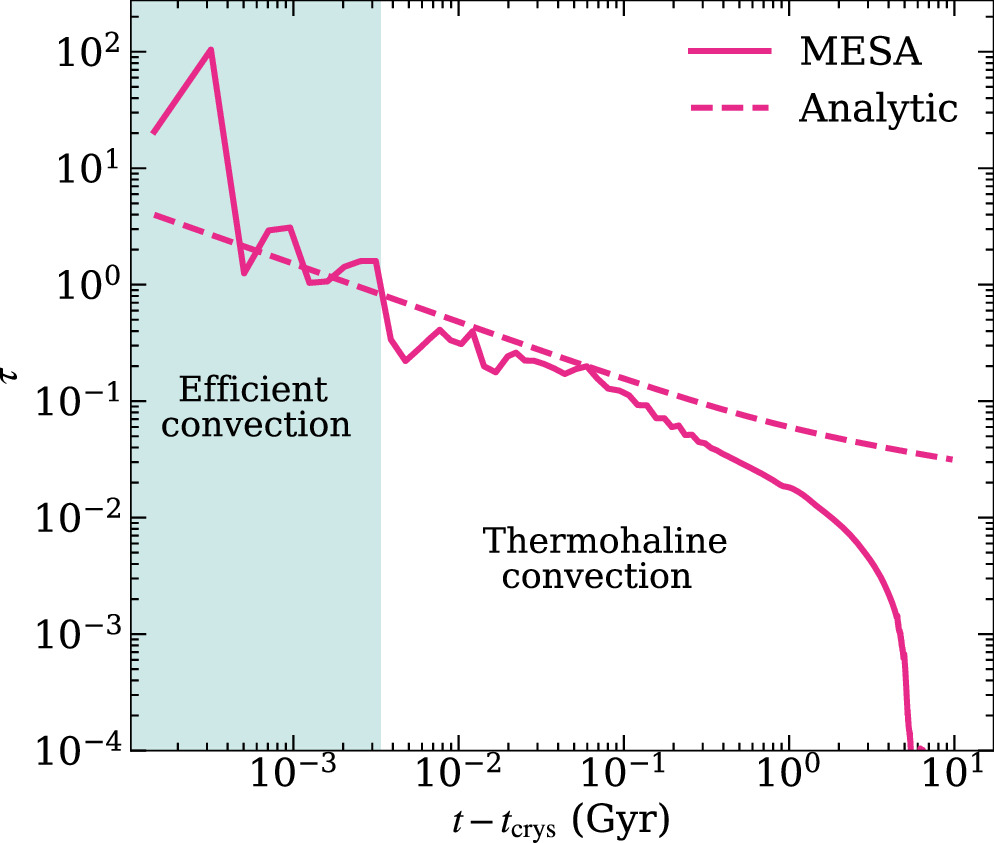
The composition flux, τ, as a function of time for a 0.9-solar-mass white dwarf. Convection of the white dwarf’s liquid layer is only efficient while the composition flux is large. [Fuentes et al. 2024]
To probe whether crystallization could help create the million-Gauss magnetic fields seen in some white dwarfs, Fuentes and collaborators modeled the interiors of white dwarfs as they crystallize. The team used the Modules for Experiments in Stellar Astrophysics (MESA) stellar evolution model to show that during a brief, 10-million-year period, strong convection could generate magnetic fields of 1–100 million Gauss.
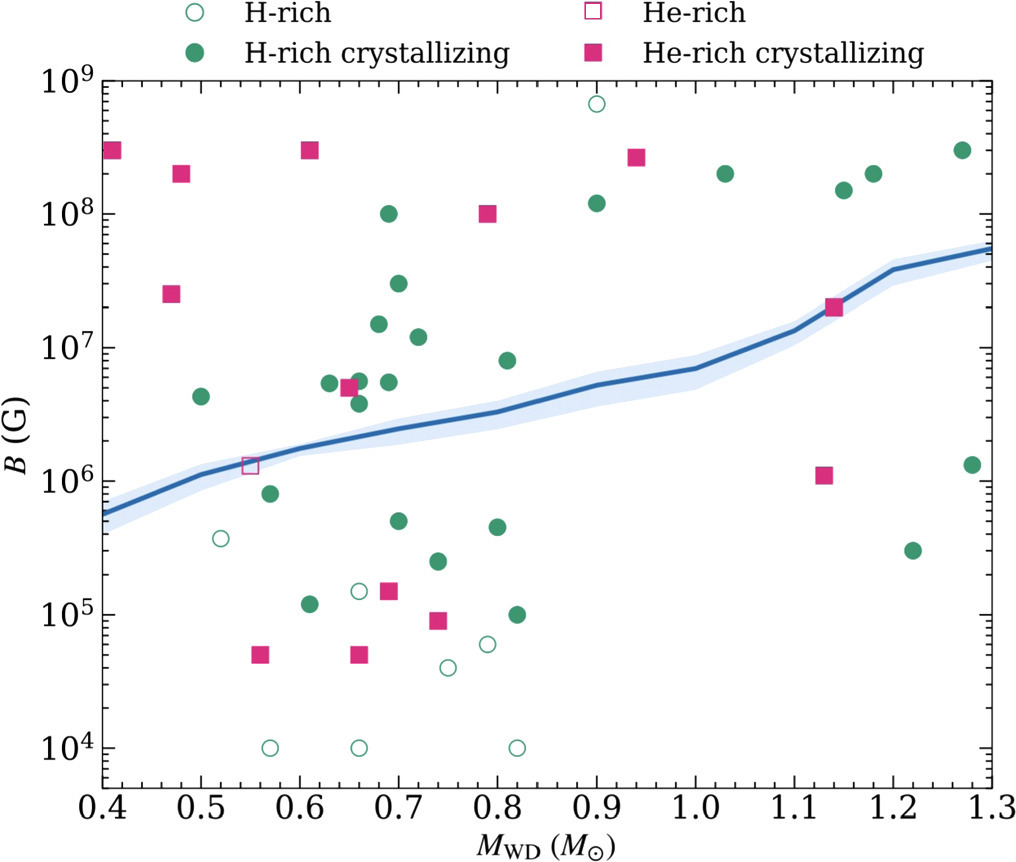
Comparison of the magnetic field strengths obtained though modeling (blue line) with the observed magnetic fields of white dwarfs (symbols). The filled symbols show white dwarfs that are expected to be crystallizing, given their ages, while the open symbols show white dwarfs that are likely not yet crystallizing. Click to enlarge. [Adapted from Fuentes et al. 2024]
Short Phase, Lasting Consequences
While the period of strong convection that creates magnetic fields is short lived, the magnetic field is likely to be long lasting; it takes a long time for magnetic fields to dissipate in a white dwarf, especially once it crystallizes completely.
The models used by Fuentes and coauthors reproduce some observed properties of white-dwarf magnetic fields, such as the lack of a dependence of the field strength on the rotation rate. However, the models also predict that magnetic fields should be stronger for more massive white dwarfs, which observations don’t support. Extending the modeling forward in time may reveal how the magnetic fields evolve and diffuse as the star cools, helping to make sense of these magnetic crystalline stars.
Citation
“A Short Intense Dynamo at the Onset of Crystallization in White Dwarfs,” J. R. Fuentes et al 2024 ApJL 964 L15. doi:10.3847/2041-8213/ad3100
The post Crystallization, Convection, and a Magnetic White Dwarf Mystery appeared first on AAS Nova.
]]>
Are you an astronomy graduate student who’s interested in science communication? Apply for the AAS Media Fellowship by June 21!
The post AAS Media Fellowship Now Open for Applications appeared first on AAS Nova.
]]>Are you an astronomy graduate student who’s interested in science communication? Do you wish you had the opportunity to explore that interest and gain professional development without having to take time off from your graduate studies? Do you want to write for AAS Nova, report on astronomy meetings, help organize and run press conferences, and learn the ins and outs of academic publishing?
Then the AAS Media Fellowship might be for you! This position was developed in 2017 by the American Astronomical Society to provide training and experience for a graduate student in the astronomical sciences interested in science communication. The fellowship is a remote, quarter-time, one-year (with the possibility of extension to two years) position intended to be filled by a current graduate student at a US institution. The new AAS Media Fellowship term will begin in Fall 2024.
If this sounds like a good fit for you, you can get more information below or at the job register posting. Apply by 21 June 2024 by submitting your contact information, a cover letter, and a short CV to personnel@aas.org. See the job register posting for the full application details.
Essential Duties & Responsibilities
The AAS Media Fellow will report to the AAS Communications Manager. The Fellow will work the equivalent of one day per week (on a schedule that will be jointly developed and agreed upon by the Fellow, the AAS Communications Manager, and the AAS Communications Specialist) and be responsible for a wide range of duties. The Fellow will be expected to:
- Assist in sharing astronomy press releases via AAS press office channels.
- Regularly write and publish articles for AAS Nova.
- Occasionally help to prepare other written communications such as AAS or Division press releases.
- Assist in managing AAS communications such as social media accounts, postings to the AAS website, and emails to members or authors.
- Serve as backup to the AAS Communications Manager or the AAS Communications Specialist during absences for daily tasks like distributing press releases and publishing AAS Nova posts.
- At the AAS winter and summer meetings, help the AAS Communications Manager plan and run press conferences, help represent AAS Nova, and help organize live-blogging coverage of the meeting by Astrobites and AAS Nova.
Qualifications
The Fellow must:
- Be a graduate student in good standing in the astronomical sciences or a related field at a US institution.
- Receive the approval of their advisor or department chair to apply.
- Receive their primary support from their home institution.
- Have a keen eye for detail and accuracy.
- Have the ability to absorb complex material, synthesize information, and write short articles that concisely reflect key points of the material to a target audience.
- Have good working knowledge of, and/or ability to quickly master, tools such as WordPress, Drupal, Microsoft Office, and Adobe Creative Suite.
Compensation
The stipend for this position is $7,500 per year for the equivalent of one day of work per week, payable on a quarterly basis. Travel support will also be provided for travel to the summer and winter AAS meetings.
The post AAS Media Fellowship Now Open for Applications appeared first on AAS Nova.
]]>
A new modeling technique lets black holes and their surroundings "talk" more easily, allowing researchers to simulate the complicated physics of accretion and feedback.
The post Modeling a Conversation Between a Black Hole and Its Galaxy appeared first on AAS Nova.
]]>A new modeling method allows black holes and the gas that surrounds them to “talk” back and forth, painting a more realistic picture of how black holes collect material and churn out energy.
A Problem of Scale
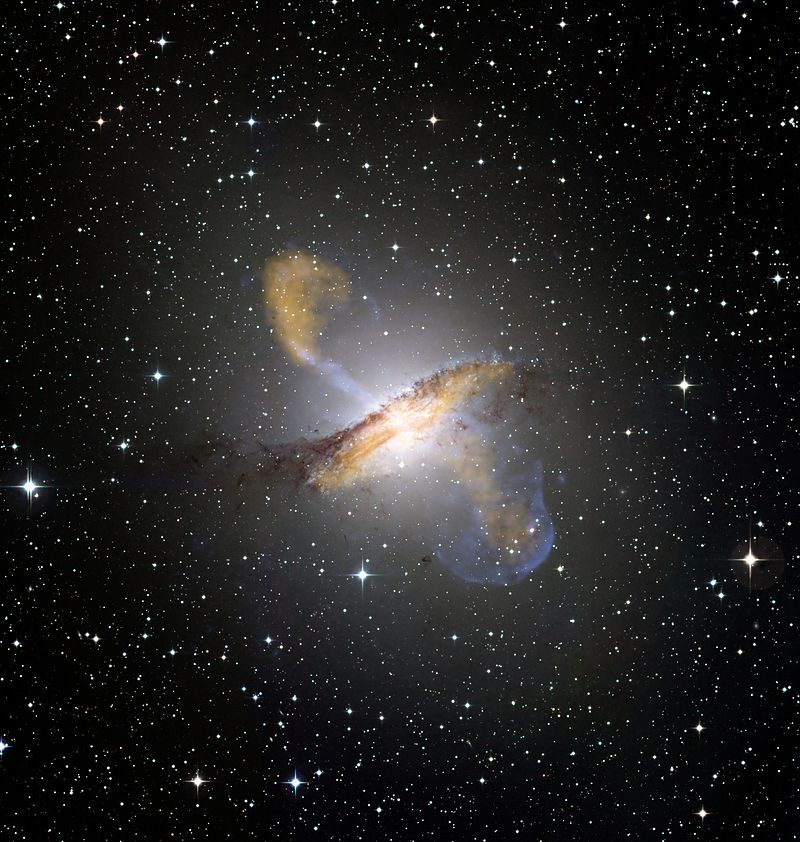
Composite image of Centaurus A, a galaxy whose appearance is dominated by the large-scale jets powered by the supermassive black hole at its center. [ESO/WFI (Optical); MPIfR/ESO/APEX/A.Weiss et al. (Submillimetre); NASA/CXC/CfA/R.Kraft et al. (X-ray); CC BY 4.0]
Supermassive black holes, though enormous, are tiny compared to their host galaxies — the Milky Way’s central black hole’s event horizon stretches roughly 15 million miles, just a minuscule fraction of our galaxy’s half-quintillion-mile diameter. Despite this size mismatch, supermassive black holes are so powerful that they can influence entire galaxies, leaving researchers with the enormous challenge of modeling the complex processes of accretion and feedback across a wide range of spatial scales.
Building a Two-Way Radio
Typically, models of hungry black holes handle the spatial scale issue by nesting simulations spanning different scales within each other and running them in sequence, starting far from the black hole and spiraling in toward it. This strategy helps the model communicate to the black hole what’s going on around it — how much gas there is to snack on, for example — but it needs to let the black hole talk back, too. That’s where a new technique from a team led by Hyerin Cho (조혜린), Center for Astrophysics | Harvard & Smithsonian and the Black Hole Initiative, comes in.
This new technique uses general relativistic magnetohydrodynamics to model black hole accretion and feedback across seven orders of magnitude in spatial scale. The key advance is that the model spirals from large scales down to small scales — and back — hundreds of times, allowing the black hole to chat freely with its surroundings.
Focusing on Feedback
To demonstrate the new method’s capabilities, Cho and collaborators first showed that they could reproduce the standard analytical solution for a black hole accreting unmagnetized gas. Then, they moved on to a more realistic system that includes magnetic fields. Unlike the unmagnetized case, where gas swirls toward the black hole in a smooth and orderly way, the magnetized case is chaotic: random, turbulent movements as the gas is pulled toward the black hole make the accretion rate vary wildly.
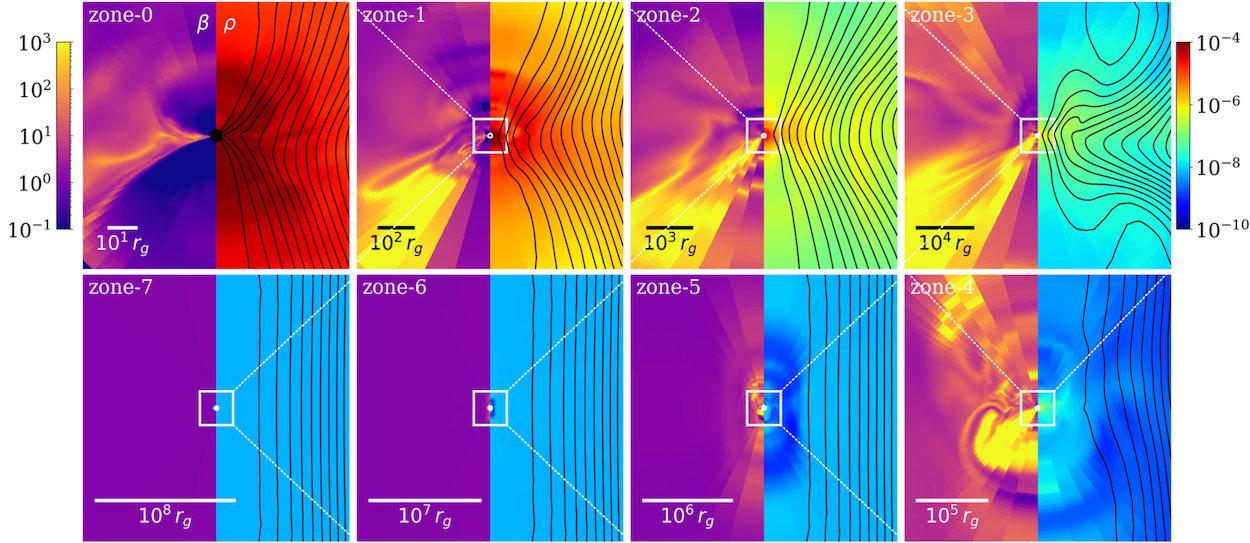
Maps of plasma beta (β; the ratio of thermal pressure to magnetic pressure within a plasma) and plasma density (ρ) across eight orders of magnitude in spatial scale. Click to enlarge. [Adapted from Cho et al. 2023]
Importantly, Cho’s team’s results mesh with what researchers have seen for the black holes they’ve observed closely, especially the central supermassive black holes of the Milky Way and the massive elliptical galaxy Messier 87. While this two-way communication represents a huge advance in the modeling of black hole accretion and feedback, there’s more work to be done; future investigations will tackle spinning black holes surrounded by rotating gas.
Citation
“Bridging Scales in Black Hole Accretion and Feedback: Magnetized Bondi Accretion in 3D GRMHD,” Hyerin Cho et al 2023 ApJL 959 L22. doi:10.3847/2041-8213/ad1048
The post Modeling a Conversation Between a Black Hole and Its Galaxy appeared first on AAS Nova.
]]>
Astrobites reports on two objects whose unusually spaced-out radio pulses have puzzled astronomers. Could these objects be white dwarfs or magnetars?
The post The 80s Called, They Want Their Ultra-Long-Period Radio Transient Back appeared first on AAS Nova.
]]>Editor’s Note: Astrobites is a graduate-student-run organization that digests astrophysical literature for undergraduate students. As part of the partnership between the AAS and astrobites, we occasionally repost astrobites content here at AAS Nova. We hope you enjoy this post from astrobites; the original can be viewed at astrobites.org.
Title: Long-Period Radio Pulsars: Population Study in the Neutron Star and White Dwarf Rotating Dipole Scenarios
Authors: Nanda Rea et al.
First Author’s Institution: Institute of Space Sciences (ICE-CSIC), Barcelona, Spain
Status: Published in ApJ
Earth is constantly bombarded by radio waves from all across the Milky Way. The shorter time-scale signals, known as “radio transients,” can sometimes be periodic. These periodic signals are often attributed to rotating neutron stars, which act as cosmic lighthouses, sending out radio waves that appear to us as “pulses” of emission. Normally, the slowest of these sources have pulses separated by milliseconds or seconds. However, the recent detection of two signals with astounding periods of 18 and 21 minutes has completely surpassed even the slowest signals previously detected. What could be causing these ultra-long-period radio signals, and what can they tell us about the populations of extreme compact objects they come from? The authors of today’s article investigate these very questions.
Time for a Mystery
GLEAM-X J1627–52 and GPM J1839–10 (astronomers love brevity) are the names given to these two ultra-long-period radio transients. Amazingly, we have archival data dating back to 1988 showing that GPM J1839–10 has been active for more than 30 years! It is still a great mystery what kind of object could produce such a long-period signal, but two kinds of stars might be the culprits.
White dwarfs, Earth-sized stars that form toward the end of the lifecycle of intermediate-mass stars like the Sun, are the first potential source of these signals. White dwarfs often have slow enough rotation periods to account for the ultra-long-period signals, but there is no known mechanism by which lone white dwarfs could produce bright enough radio signals. It is thought that a companion star could possibly enhance the white dwarf’s radio emission via the companion’s stellar wind. As the white dwarf’s emission beams cross through this stellar wind, the emission accelerates particles within the stellar wind, releasing radio waves as accelerated electrons interact with the white dwarf’s magnetic field.
Only two radio-emitting white dwarfs have ever been observed, and both were in binary systems. Based on the lack of an optical or infrared component, researchers thing that GLEAM-X J1627−52 is likely not in a main-sequence binary system similar to these radio-emitting white dwarfs. GLEAM-X J1627−52 could still have a low-mass companion, similar to the AR Scorpii system, which is a white dwarf pulsar binary containing a low-mass, red dwarf companion star (learn more about AR Scorpii in this Astrobite). GPM J1839–10 has not yet been constrained to be in a binary using optical and infrared observations.
Highly magnetized neutron stars known as magnetars are the second potential source. Magnetars are the extremely dense, extremely magnetic leftovers of stellar explosions. How dense and how magnetic, you might ask? Just one tablespoon of magnetar matter weighs as much as Mount Everest, and their magnetic fields, which are a thousand trillion times stronger than Earth’s magnetic field, make them the most magnetic objects known. Magnetars tap directly into their magnetic fields to fuel their powerful beams of radio waves.
Not So Perfect Sources
Despite the amazing properties of both white dwarfs and magnetars, the authors find several issues when trying to explain GLEAM-X J1627–52 and GPM J1839–10 using these types of objects. While observations from back in 2018 show that GLEAM-X J1627−52 does have a brightness and polarization similar to other radio magnetars, X-ray measurements put limits on the source that challenge a magnetar being responsible. The ultra-long period is also not in line with the rest of the neutron star population. On the other hand, white dwarfs are not known to produce the observed bright emission.
Crossing the Line
To figure out whether neutron stars or white dwarfs might be responsible for these long-period signals, the authors use two methods: death-line analyses and population-synthesis simulations.
“Death line” sounds like an ominous term, but it simply defines the threshold at which radio emitters no longer put out bright enough signals for us to detect with our telescopes, meaning they are effectively “dead.” The authors create a range of death lines (shown in Figure 1) based on models ranging from the simplest models available to more extreme models that incorporate complicated physics like twisted magnetic field lines.
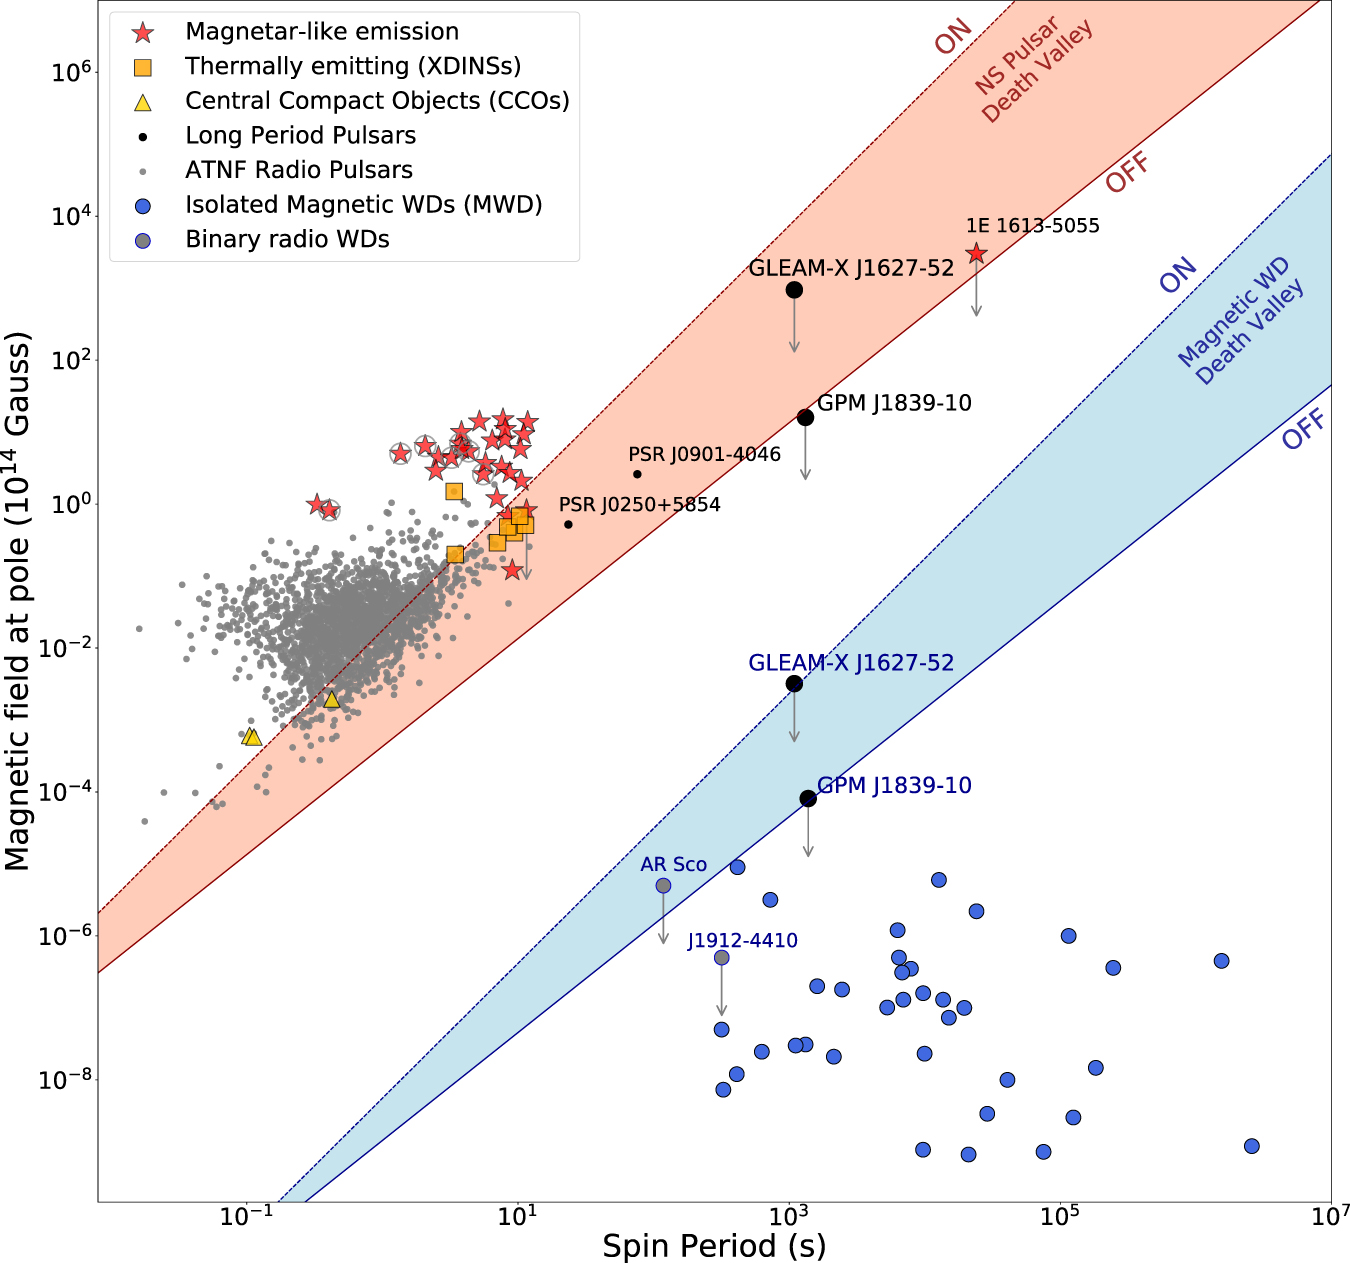
Figure 1: The two death “valleys” of the neutron star and white dwarf populations. An object that falls below the death line no longer emits strongly enough for detection using our current radio telescopes or no longer emits at all, hence why it is “dead.” The neutron star death lines are marked in red and white dwarf death lines are marked in blue. The bounds of the valleys come from the range of different models. For both populations, GPM J1839-10 falls below even the most extreme death line. [Rea et al. 2024]
The second method is called population synthesis, which uses statistics from the already existing sample of neutron stars and white dwarfs to try and simulate the total population of these stars. The authors vary different parameters like magnetic field strength, birth rate, and the angle between the magnetic field axis and rotational axis to try and figure out if a special population of neutron stars or white dwarfs with these slow periods might exist in the galaxy.
The authors find that a large population of long-period radio emitters cannot be easily explained by neutron stars, even when assuming extremes like no magnetic field decay, stronger magnetic fields, etc. The white dwarf population synthesis shows that magnetized white dwarfs with long periods are more common, but isolated white dwarfs are not expected to be able to emit bright, coherent (constant phase) radio emission, based on the existing population.
This is likely just the first step in uncovering an entire unknown population of ultra-long-period radio transients. Many more sources like the two discussed in today’s article could be out there, but for now the authors recognize that the sample size is small. If either of the two sources, GLEAM-X J1627−52 or GPM J1839–10, is confirmed to be a neutron star or white dwarf in the future, it will tell us a lot about the physics of these extreme objects. It may even require a revision of our understanding of neutron stars or white dwarfs, both in terms of how exactly they emit radio waves, and what their populations look like in the galaxy!
Original astrobite edited by Maryum Sayeed and Annelia Anderson.
About the author, Magnus L’Argent:
Magnus is a first-year Master’s student and Trottier Fellow at McGill University. When not searching for new pulsars, fast radio bursts, and other radio transients, he enjoys going on hikes, reading sci-fi, and watching movies.
The post The 80s Called, They Want Their Ultra-Long-Period Radio Transient Back appeared first on AAS Nova.
]]>
Researchers measure tiny distortions in the oldest light in the universe to determine where matter is concentrated.
The post Featured Image: Mapping Matter in the Universe appeared first on AAS Nova.
]]>This image may look like a work of modern art, but it’s actually a map of the matter in our universe. A team led by Mathew Madhavacheril (University of Pennsylvania and Perimeter Institute for Theoretical Physics) developed this map from new measurements of the cosmic microwave background — the oldest light in the universe, which was emitted not long after the Big Bang. As this ancient light wends its way to us, it curves around the gravitational wells of intervening galaxies and galaxy clusters. By measuring the degree to which the microwave background is warped, researchers can determine how matter is scattered throughout the universe. The image above shows regions with lots of matter in white and regions without much matter in black. The orange and blue contours show the locations of dusty galaxies, which appear to be correlated with the location of matter measured from the microwave background. Researchers can test cosmological models with this new dataset, which covers nearly a quarter of the sky — the image here shows just a tiny fraction of the available data. To learn more about how researchers map matter and study structures in our universe, be sure to check out the original research article linked below.
Citation
“The Atacama Cosmology Telescope: DR6 Gravitational Lensing Map and Cosmological Parameters,” Mathew S. Madhavacheril et al 2024 ApJ 962 113. doi:10.3847/1538-4357/acff5f
The post Featured Image: Mapping Matter in the Universe appeared first on AAS Nova.
]]>
Massive stars are not typically inclined to go gentle into the good night. Some, new work suggests, might dramatically cut themselves in two using a "relativistic blade."
The post How to Slice a Star appeared first on AAS Nova.
]]>Though astronomers already knew that strange things can happen in the final moments of a massive star’s life, a recent model may have just taken the top prize as the most bizarre possible ending. In their last gasps, some stars might be cut clean down the middle by a “relativistic blade.”
Raging, Raving Stars
An artist’s illustration of a jet escaping from a collapsing star. [NASA, ESA and M. Kornmesser]
Though that scenario sounds plenty dramatic, new work by Marcus DuPont and Andrew MacFadyen, New York University, suggests a potentially even more striking scene. Under the right conditions, they surmise that instead of narrow, polar jets, a blast wave could instead expand straight outward along the star’s equator, break through the surface, and cleave the dying star clean in two.
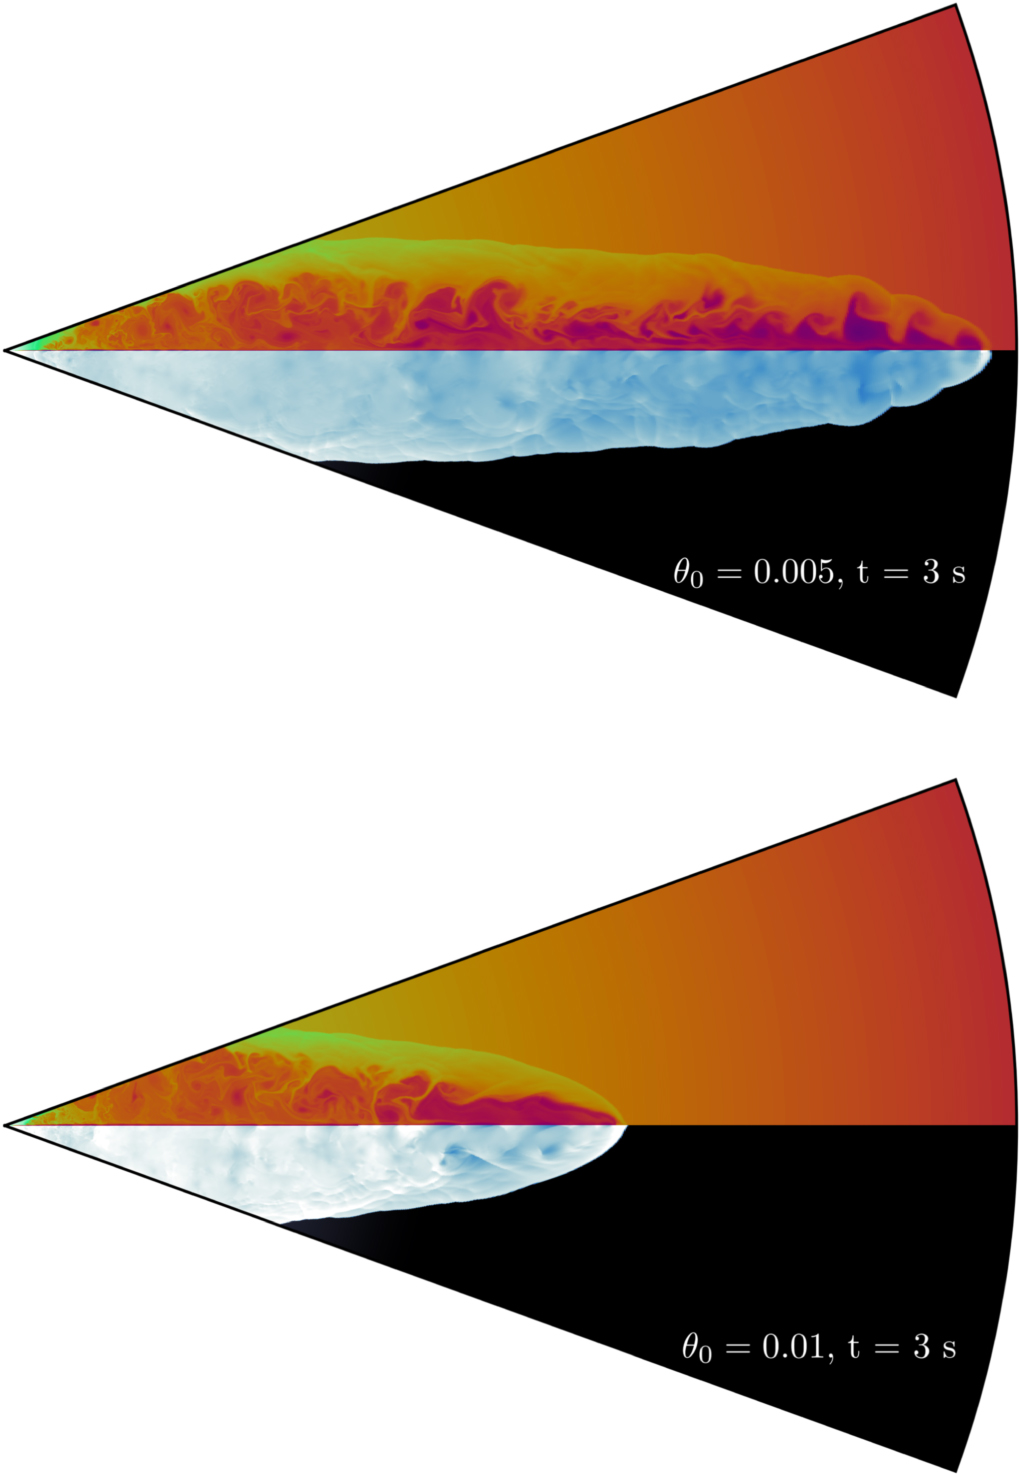
Views of two relativistic blade simulations, one for a narrow blade (top) and one for a wider blade (bottom). In both, the upper hemisphere illustrates density, while the southern illustrates pressure. [DuPont and MacFadyen 2023]
Carving a Star
DuPont and MacFadyen introduce their model of a “relativistic blade” in a playful yet highly technical publication that includes mentions of “pizza slices of uneven length” right alongside topics like “relativistic magnetohydrodynamics” and no fewer than 21 equations in the first five pages. In their telling, as a massive star begins its final collapse, its core can transform into an ultra-dense, ultra-magentized, and rapidly rotating neutron star known as a millisecond magnetar. This rotten heart would seal the star’s doomed fate: the intense winds and magnetic field surrounding the magnetar would deposit enormous quantities of energy into the area around the core that must escape to the surface. Thanks to the magenetar’s spin, that energy would be concentrated into narrow “lamina,” or blades, of outflowing matter that would propagate outwards in just a few seconds.
Moving beyond mathematical musings and into numerical simulations, the pair used software developed earlier by DuPont to illustrate a few caveats of their model. For one, the blades would have to be initially more collimated than their jet counterparts, and for another, the width of the blades has a strong impact on their efficiency and breakout time. But, under a reasonable set of conditions, the simulations show that the blades would “affec[t] a clean slice through the progenitor.”
Consequences of Slashed Stars
Though everyone loves a good star-killing relativistic blade for its own sake, DuPont and MacFadyen did have practical considerations in mind when concocting such a sci-fi sounding model. It’s not currently clear where mysterious flashes of high-energy radiation known as gamma-ray bursts actually come from. Astronomers have developed several models to explain their observations of these bursts, and one of the leading ideas is the earlier-mentioned jets, which would crackle with gamma rays on their journey from their stars’ cores. These blades, too, would unleash gamma rays as they cut through their stars, and thus could also be a source of the observed flashes.
DuPont and MacFadyen suggest that how these bursts fade over time would differ between stars pierced by jets and those cut by blades, meaning that detailed observations may be able to tell the two mechanisms apart some day. They also suggest that more complex models are needed to dial what these blades would look like and how likely they are to arise. That’s great news both for serious astronomers hoping to better understand gamma-ray bursts and space-opera fans alike, who can both look forward to more work on this dramatic hypothesis.
Citation
“Stars Bisected by Relativistic Blades,” Marcus DuPont and Andrew MacFadyen 2023 ApJL 959 L23. doi:10.3847/2041-8213/ad132c
The post How to Slice a Star appeared first on AAS Nova.
]]>
Three recent studies of the famous red supergiant examine the aftermath of the Great Dimming, probe the possibility of a stellar merger, and reconsider some critical evidence that suggests that Betelgeuse was once two stars.
The post Monthly Roundup: Betelgeuse, Betelgeuse, Betelgeuse appeared first on AAS Nova.
]]>
An artist’s impression of a cloud of dust partially blocking Betelgeuse from view during the Great Dimming. [ESO, ESA/Hubble, M. Kornmesser; CC BY 4.0]
Today, we’re introducing three recent articles that examine Betelgeuse’s intriguing behavior and uncertain past.
How Did the Great Dimming Affect Betelgeuse?
Betelgeuse’s brightness (top) and radial velocity (bottom) over time. The Great Dimming, marked by the vertical purple line, appears to have brought about a new periodicity in these quantities. Click to enlarge. [MacLeod et al. 2023]
MacLeod’s team used hydrodynamics simulations to connect the change in variability to changes in the star’s interior. The gaseous outer envelope of Betelgeuse’s atmosphere is constantly churning with large-scale convective motions, similar to the movement of boiling water, that transport heat throughout the star. MacLeod’s team modeled an unusually hot plume of gas that broke free from the star’s surface, powering the surface mass ejection that caused the dimming. When this hot gas plume rose, it could have interrupted Betelgeuse’s typical pulsations, energizing a new pulsation mode that cycles twice as quickly.
If this process is responsible for the change in Betelgeuse’s behavior, the new pulsation mode will eventually lose energy and fade away: MacLeod and collaborators predict that the star should return to its previous 400-day pulsation period within 5–10 years.
Was Betelgeuse Once Two Stars?
Most massive stars grow up with a nearby binary companion, and at some point in their lives these stars may transfer mass back and forth. A recent research article takes this concept of mass transfer to the extreme, exploring whether Betelgeuse engulfed its binary companion, fundamentally altering the course of its evolution.
Results of stellar evolution simulations showing how the surface velocity and nitrogen, oxygen, and carbon abundances change with time. The black boxes indicate the values of these quantities when the modeled stars have similar temperatures and luminosities to present-day Betelgeuse. Click to enlarge. [Shiber et al. 2024]
After allowing the merger product to evolve until its temperature and luminosity were similar to Betelgeuse’s, Shiber’s team calculated the surface composition and rotation rate of the resulting star, since these quantities are potentially measurable. Post-merger stars appear to have more nitrogen at their surface than stars that have evolved normally, and they may rotate more rapidly than typical stars, as well. Observations suggest that Betelgeuse is both rapidly rotating and rich in nitrogen, supporting the hypothesis that it was once two stars.
Is Betelgeuse Actually Rotating Rapidly?
If Betelgeuse is a mashup of two stars, simulations suggest that it should be rotating rapidly. Several years ago, researchers studied Betelgeuse with the Atacama Large Millimeter/submillimeter Array (ALMA) and interpreted the observations to mean that the star was rotating at a rate of 5 kilometers per second — twice the pace expected for a single star. A team led by Jing-Ze Ma (马竟泽) from the Max Planck Institute for Astrophysics investigated this critical piece of evidence by testing whether large-scale convection — the roiling motion that causes material to rise and sink within a star, helping to transport heat from the star’s interior to its surface — could be mistaken for rapid stellar rotation.

The intensity (top row) and radial velocity (bottom row) for a simulated star, simulated ALMA observations, and actual ALMA observations. Click to enlarge. [Ma et al. 2024]
As always, researchers need more data to investigate this issue further. One or more ALMA observations could clarify whether Betelgeuse is truly rotating rapidly, supporting the hypothesis that it’s the result of a stellar merger, or if the star’s massive convective motions have been misleading.
Citation
“Left Ringing: Betelgeuse Illuminates the Connection Between Convective Outbursts, Mode Switching, and Mass Ejection in Red Supergiants,” Morgan MacLeod et al 2023 ApJ 956 27. doi:10.3847/1538-4357/aced4b
“Betelgeuse as a Merger of a Massive Star with a Companion,” Sagiv Shiber et al 2024 ApJ 962 168. doi:10.3847/1538-4357/ad0e0a
“Is Betelgeuse Really Rotating? Synthetic ALMA Observations of Large-Scale Convection in 3D Simulations of Red Supergiants,” Jing-Ze Ma et al 2024 ApJL 962 L36. doi:10.3847/2041-8213/ad24fd
The post Monthly Roundup: Betelgeuse, Betelgeuse, Betelgeuse appeared first on AAS Nova.
]]>
Astrobites reports on the changing-look active galactic nuclei seen in the first year of the fifth Sloan Digital Sky Survey.
The post A First Glimpse of Changing-Look Active Galactic Nuclei with SDSS-V appeared first on AAS Nova.
]]>Editor’s Note: Astrobites is a graduate-student-run organization that digests astrophysical literature for undergraduate students. As part of the partnership between the AAS and astrobites, we occasionally repost astrobites content here at AAS Nova. We hope you enjoy this post from astrobites; the original can be viewed at astrobites.org.
Title: Exploring Changing-Look Active Galactic Nuclei with the Sloan Digital Sky Survey V: First Year Results
Authors: Grisha Zeltyn et al.
First Author’s Institution: Tel Aviv University
Status: Published in ApJ
Challenging the Original Picture
Supermassive black holes are among the most powerful objects in the universe. Those that are accreting gas from their surroundings (called active galactic nuclei, or AGN for short) release an enormous amount of energy back to their surroundings — enough to unbind an entire galaxy! Historically, AGN have been classified by the emission lines in their optical spectra: Type 1 AGN show broad emission lines, especially from the Balmer series of hydrogen, whereas Type 2 AGN do not show broad emission lines (see this Astrobite for details on the different classifications). As early as the late 1980s/early 1990s, it was hypothesized that these two classifications could be unified into a single model, where the difference in AGN optical spectra was related to the viewing angle to the nucleus. In this model, broad emission lines can only be seen if the observer is seeing the AGN nearly face-on, whereas these lines tend not to be seen in edge-on systems where the observer is probably looking through dense clouds of gas and dust called the torus (see this Astrobite for more on the dusty torus).
This view is supported by the existence of Type 2 AGN with broad emission lines in their polarized spectra. These spectra only contain polarized light, which can contain emission from the broad lines being scattered off of the gas and dust. However, recently there have been a subset of AGN that show changes between these different spectral types on timescales of months to decades. This new class is called “changing-look” AGN, and they challenge the idea that the viewing angle alone determines the type of AGN you see. An example of a changing-look AGN (newly found in today’s article) is shown in Figure 1. The black spectrum was taken 20 years after the blue one and clearly shows a newly formed broad Hβ line as well as an increasingly strong Hα line.

Figure 1: Example of a changing-look AGN spectrum. The blue spectrum shows the original spectrum from 2002, and the other spectra are from 2021–2022, where there is now a strong, broad Hβ line and a blue continuum. [Adapted from Zeltyn et al. 2024]
Introducing: Changing-Look AGN in SDSS-V
Detecting changing-look AGN is difficult because the changes occur on relatively long timescales and require multiple optical spectra of the same AGN (which is rather rare to have!). However, no need to fear, today’s article is here! The authors of today’s article present one of the first systematic searches for changing-look AGN using a new survey, the Black Hole Mapper program as part of SDSS-V, the fifth generation of the Sloan Digital Sky Survey. This survey was designed to take numerous optical spectra of hundreds of thousands of AGN. Today’s article focuses on the first year of data, which contains almost 30,000 AGN with multiple optical spectra. From this sample, the authors find 116 changing-look AGN that vary on timescales ranging from 2 months to 19 years!
It’s All About the Rate!
By comparing their new, robust sample of changing-look AGN to a control sample of ordinary AGN, the authors investigated if there were any crucial differences between the two samples that could help illuminate the origin of changing-look AGN. They found that the black hole mass and total energy output were not significantly different between the two samples, but the accretion rate normalized to the black hole mass (also known as the Eddington ratio) was different. This is shown in Figure 2, with the red showing the changing-look AGN and the blue showing the control sample of ordinary AGN. The two different panels show different control samples, but importantly, they both show this same exact trend. This confirms what other studies have suggested — that the most important factor for determining whether an AGN will undergo a changing-look event is its relative accretion rate!
Figure 2: Comparison of the Eddington ratio (the accretion rate normalized to the black hole mass) of ordinary AGN (blue) and changing-look AGN (red). The ordinary AGN (control sample) are drawn from a past research article and are matched to other quantities — the bolometric luminosity (left) and black hole mass (right) — of the changing-look AGN to control against. The changing-look AGN show a statistically lower Eddington ratio than both control samples. [Adapted from Zeltyn et al. 2024]
Figure 3: Comparing the relative change in the Hα and Hβ lines for AGN where both can be observed. The two are positively correlated, which is expected, but the Hβ lines seem to vary more than the Hα on average. This could indicate that the observed changes are due to some alterations to the gas and dust along our sight line to the supermassive black hole. [Adapted from Zeltyn et al. 2024]
Wondering how these cosmic curiosities fit into the grand picture of AGN? Keep your eyes peeled because this is coming next! The authors stress that continued SDSS-V/Black Hole Mapper observations will lead to larger samples of changing-look AGN and will help us better understand how these changing-look events relate to normal AGN variability.
Original astrobite edited by Janette Suherli.
About the author, Megan Masterson:
I’m a 4th-year PhD student at MIT studying transient accretion events around supermassive black holes, including tidal disruption events and changing-look active galactic nuclei. I primarily use multi-wavelength observations to study from the inner accretion flow to the obscuring material in these transients. In my free time, you’ll find me hiking, reading, and watching women’s soccer.
The post A First Glimpse of Changing-Look Active Galactic Nuclei with SDSS-V appeared first on AAS Nova.
]]>
A new interpretation of JWST spectra suggests that exoplanet K2-18b is a gas-rich world without a habitable surface rather than an ocean world.
The post K2-18b May Not Be Habitable After All appeared first on AAS Nova.
]]>Exoplanet K2-18b made headlines when researchers reported that JWST observations of the planet were consistent with a habitable ocean world. Now, another team has published a different interpretation of the data, suggesting that the purported water world is instead a gas-rich planet with no habitable surface.
Everybody Wants to Rule the Find a Habitable World
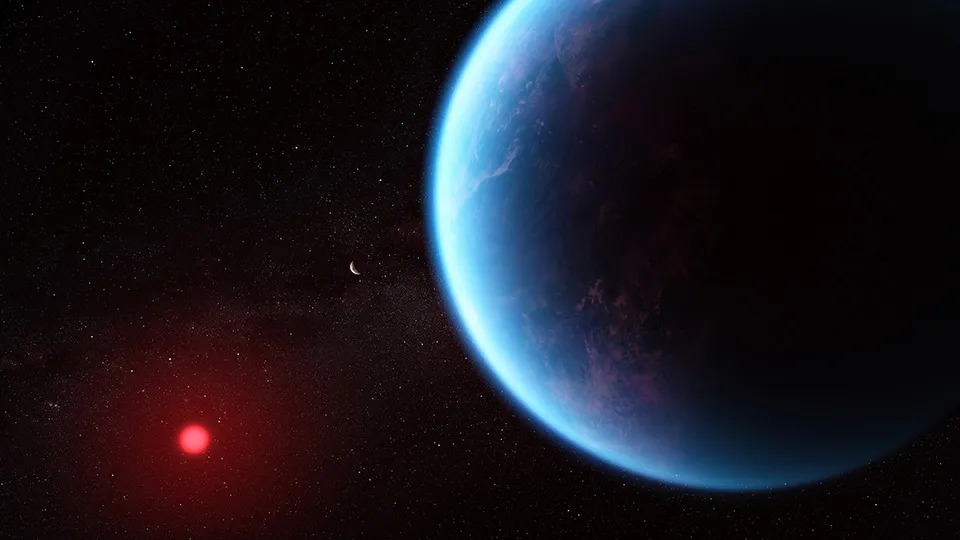
An artist’s impression of K2-18b as an ocean world. [NASA, ESA, CSA, Joseph Olmsted (STScI)]
To make matters more interesting, the same research team reported weak evidence for dimethyl sulfide, a compound that on Earth forms almost exclusively due to life. This led many onlookers to the eyebrow-raising conclusion that K2-18b is not just habitable but inhabited.
These intriguing interpretations, however, are far from settled. Is K2-18b truly a habitable ocean world, or could alternative explanations fit the JWST data equally well?
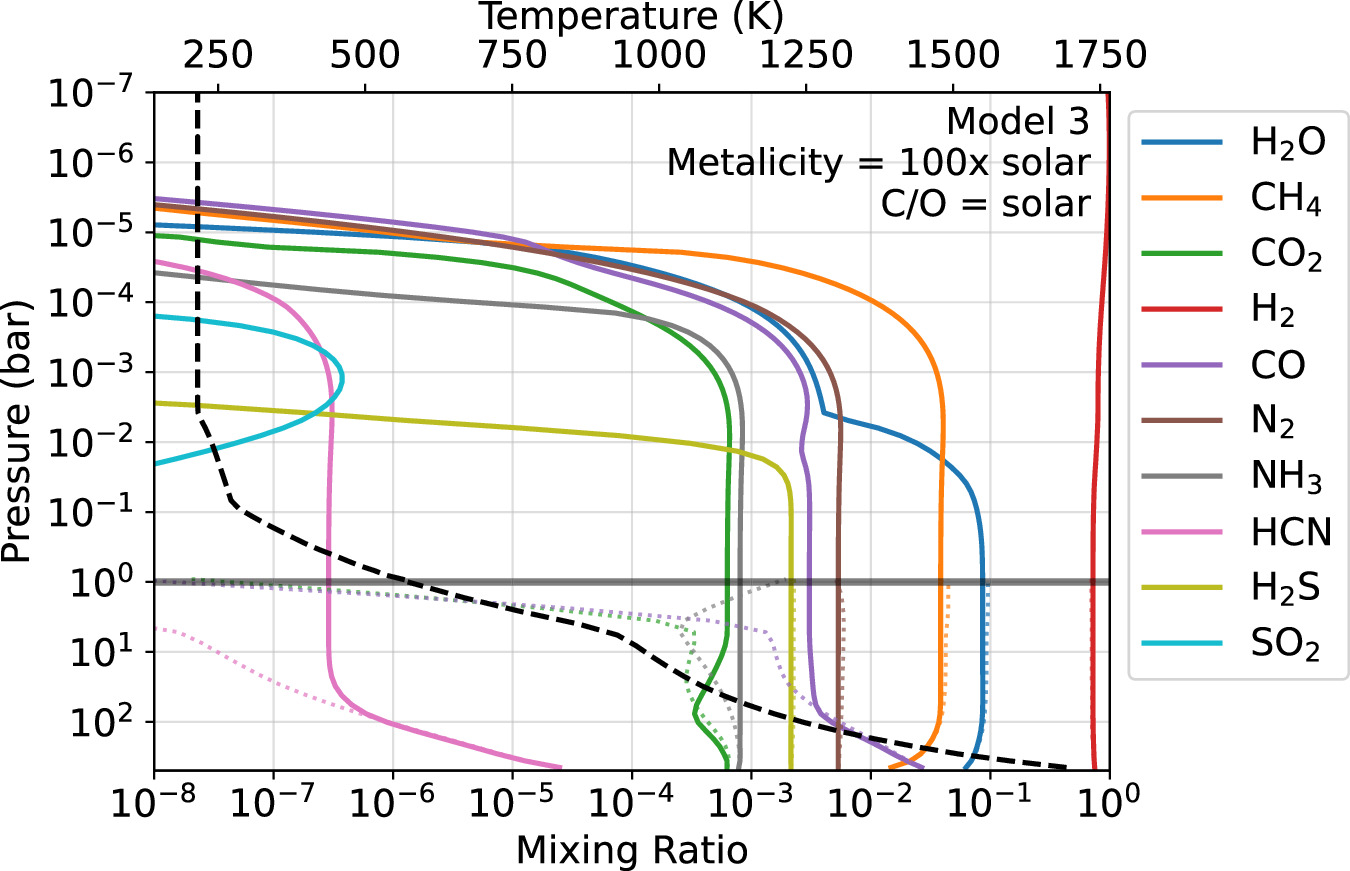
Example simulation output for K2-18b as a gas-rich planet without a habitable surface. Click to enlarge. [Wogan et al. 2024]
Water World or Gas Planet?
A team led by Nicholas Wogan (NASA Ames Research Center and University of Washington) tackled this question by applying two sets of models to the JWST data. The first set describes rocky planets with surface oceans, with and without life, and the second set describes gaseous planets without a surface and without life. The models predict the planet’s photochemistry — chemical reactions in the atmosphere driven by photons from the host star — and climate.
Wogan’s team found that K2-18b is unlikely to be a lifeless water world, since this type of planet wouldn’t contain enough methane in its atmosphere to produce the signal seen in the JWST observations. Intriguingly, a water world with microbial life is more promising: acetotrophic methanotrophs — a tongue-twisting name for simple methane-producing organisms — may be able to produce the supply of methane seen in the planet’s atmosphere.
Not So Fast…
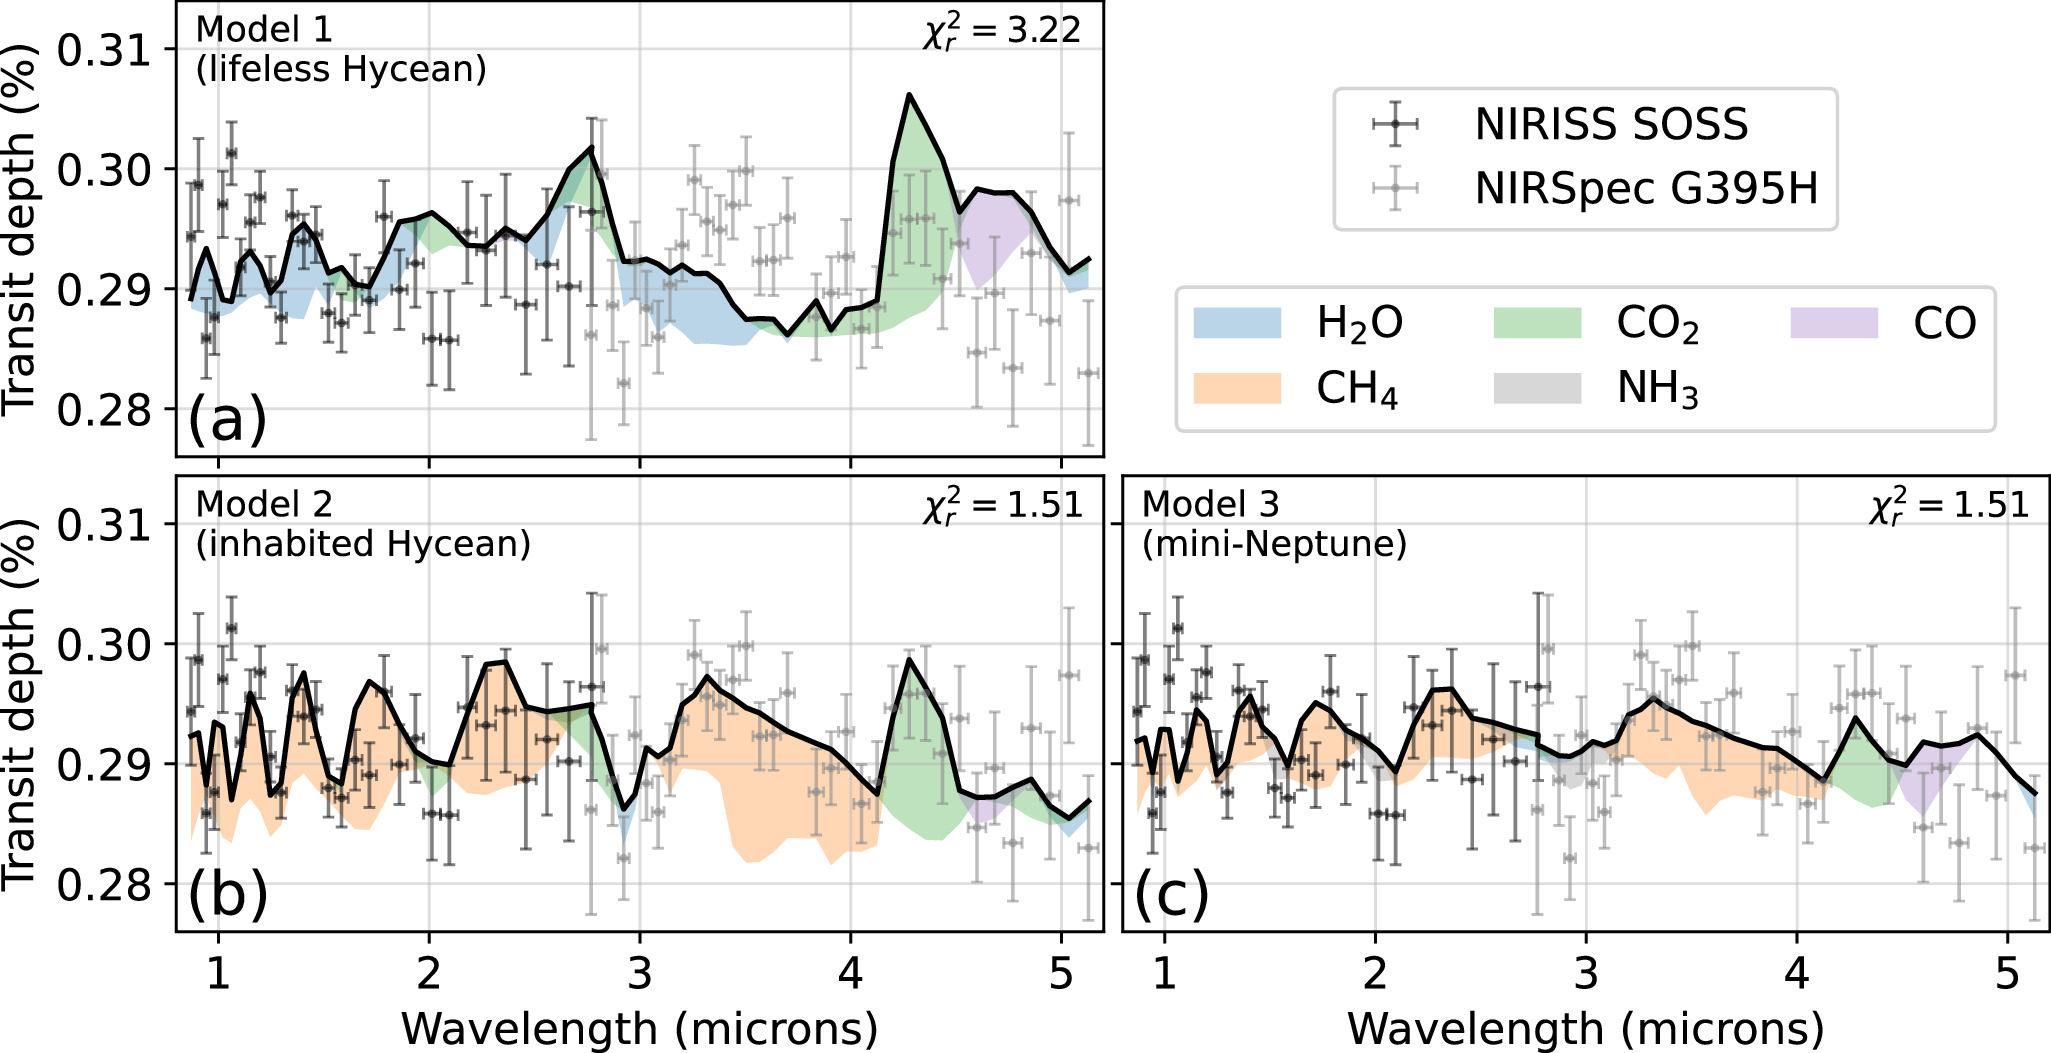
JWST transmission spectra (black and gray points with error bars) and modeled spectra for K2-18b as a lifeless ocean world (top left), an ocean world with life (bottom left), and a lifeless gas-rich planet (bottom right). Click to enlarge. [Wogan et al. 2024]
This isn’t the last word on K2-18b — there are features in the planet’s spectrum that aren’t well fit by a lively ocean world or a lifeless gas-rich planet, and both models have their challenges. Future data from JWST might dredge up a detection of ammonia, which would point to a gaseous planet, or dimethyl sulfide, which would tilt the scales considerably toward an inhabited water world. In the meantime, the hunt for habitable planets goes on.
Citation
“JWST Observations of K2-18b Can Be Explained by a Gas-Rich Mini-Neptune with No Habitable Surface,” Nicholas F. Wogan et al 2024 ApJL 963 L7. doi:10.3847/2041-8213/ad2616
The post K2-18b May Not Be Habitable After All appeared first on AAS Nova.
]]>
While collisions between dwarf galaxies usually result in bursts of star formation, new research suggests that galaxy interactions can also make star formation shut off.
The post Do Dwarf Galaxy Collisions Start or Stop Star Formation? Yes. appeared first on AAS Nova.
]]>Researchers have spotted an unusual pair of interacting dwarf galaxies: one with many bright young stars, the other with none. New research examines how two seemingly similar galaxies can have such different outcomes, shedding light on why quiescent dwarf galaxies are so rare.
A Clash of Small Galaxies
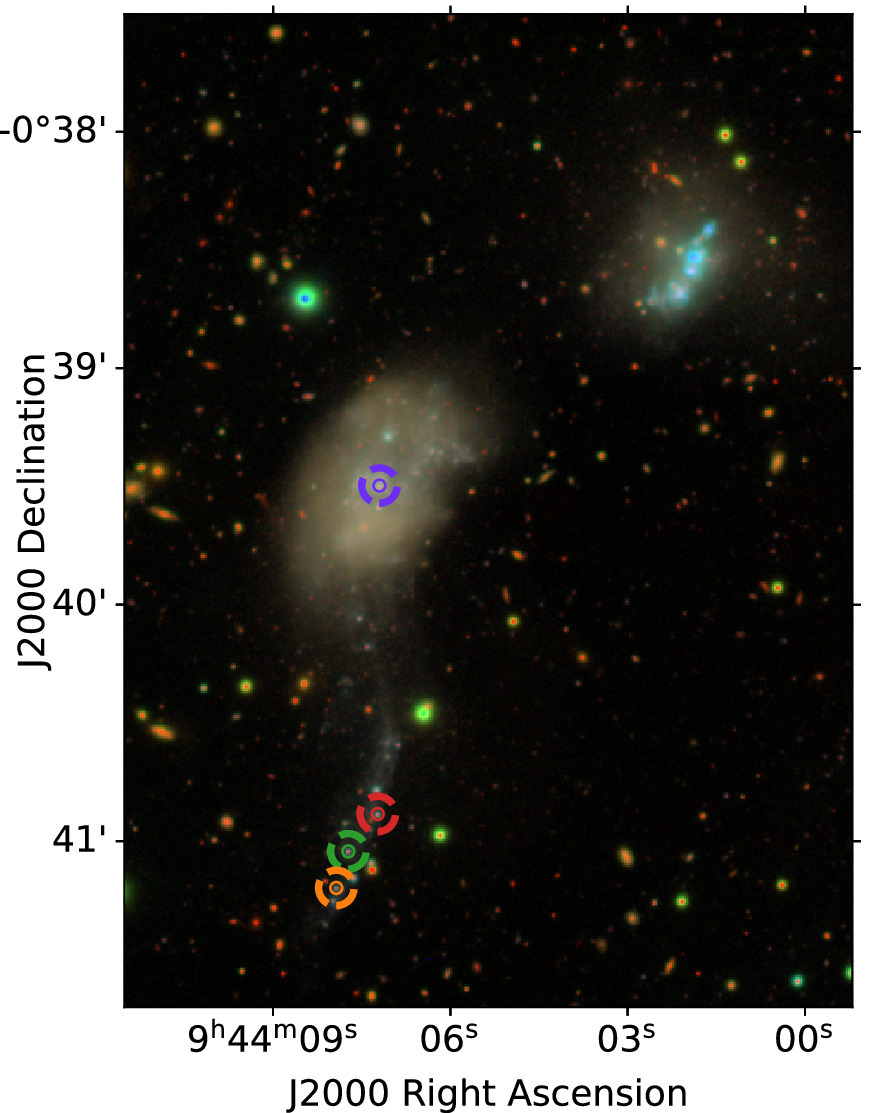
A visible-light and infrared view of UGC 5205 (left) and PGC 027864 (right). [Adapted from Kado-Fong et al. 2024]
Enter UGC 5205 and PGC 027864, a pair of dwarf galaxies that have responded in remarkably different ways to their interaction. PGC 027864 is a typical dwarf starburst galaxy ablaze with new stars, but UGC 5205 is eerily quiet. Previous observations show that the two nearly equal-mass galaxies each contain abundant star-forming gas, making UGC 5205’s lack of new stars a real mystery. Now, new data have solved the mystery of the missing star formation.
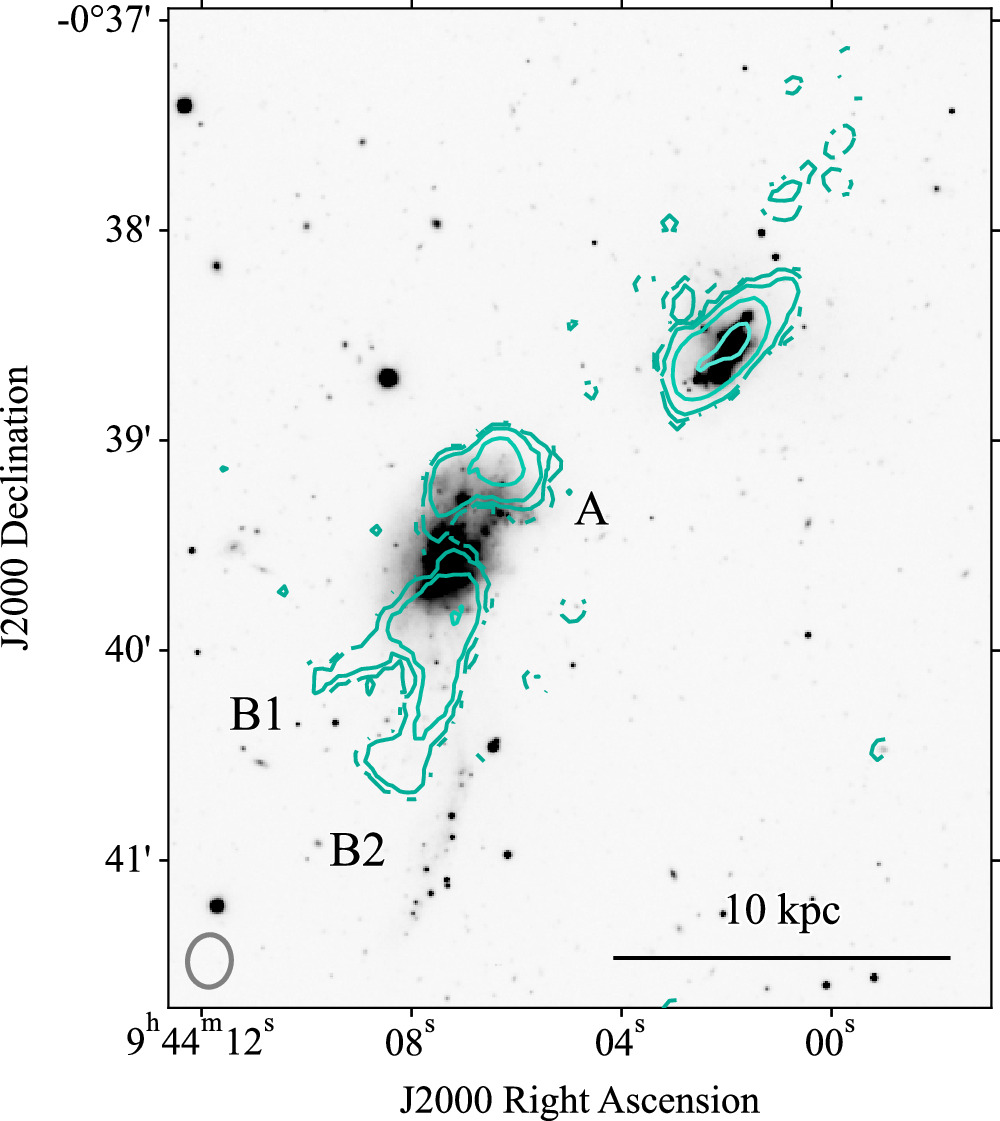
Contours from the new Very Large Array data showing the location of neutral hydrogen gas (green) overlaid on a grayscale optical image. [Kado-Fong et al. 2024]
A Close Look at Cold Gas
Erin Kado-Fong (Yale University) and collaborators collected new observations of the interacting galaxy pair with the radio dishes of the Very Large Array. These new high-resolution observations show that while UGC 5205 contains an adequate amount of star-forming fuel, most of it has been expelled from the main body of the galaxy into three tidal structures. PGC 027864’s gas, on the other hand, looks mostly normal, with just a small tidal tail. While the reason for the different behavior isn’t clear — perhaps PGC 027864’s gas was more concentrated — this shows that UGC 5205’s star-formation shutdown is due to a lack of neutral hydrogen gas.
How long ago did this rare quiescent dwarf galaxy’s star formation shut down? Optical and ultraviolet images of the galaxy pair show that though UGC 5205 shines brightly in the ultraviolet, indicating abundant star formation on the order of 100 million years ago, it’s invisible at optical wavelengths that trace star formation in the past 10 million years. By modeling the light emitted by different populations of stars, Kado-Fong’s team found that UGC 5205 likely underwent a quenching event 100–300 million years ago.
Quiescent for Now
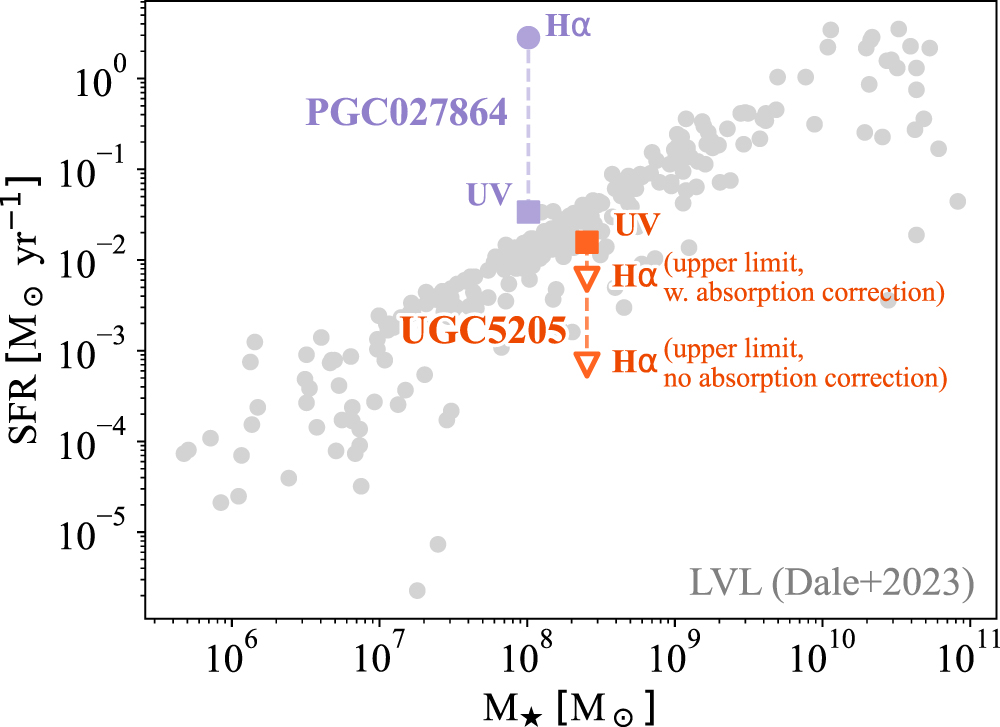
The star formation rates and masses of the two galaxies in this study compared to low-mass galaxies on the star-forming main sequence. The two galaxies have similar rates measured from ultraviolet (UV) light, which traces star formation on the order of 100 million years ago, but dramatically different rates measured from Hα, which traces star formation in the last 10 million years. [Kado-Fong et al. 2024]
Citation
“Dwarf–Dwarf Interactions Can Both Trigger and Quench Star Formation,” Erin Kado-Fong et al 2024 ApJ 963 37. doi:10.3847/1538-4357/ad18cb
The post Do Dwarf Galaxy Collisions Start or Stop Star Formation? Yes. appeared first on AAS Nova.
]]>
New research explores how a star colliding with a disk of gas around a supermassive black hole might give rise to the quasi-periodic eruptions seen in certain galaxies.
The post When Stars, Disks, and Black Holes Meet, Outbursts Follow appeared first on AAS Nova.
]]>Astronomers have discovered a handful of supermassive black holes that are associated with bursts of X-rays that recur every few hours or days. New work expands on a theory that explains these X-ray outbursts and explores how we can spot them at other wavelengths.
Investigating Quasi-periodic Eruptions
For the past few decades, researchers have seen X-ray flares coming from the centers of certain galaxies. These flares, dubbed quasi-periodic eruptions, last about an hour, and individual flares are separated by a few hours to a few days. The brightness changes from flare to flare, and the flares don’t recur at precise intervals, giving the events their name. The cause of quasi-periodic eruptions isn’t yet known, but leading models involve a star being partially torn apart by a supermassive black hole or an object interacting with gas accreting onto a black hole.
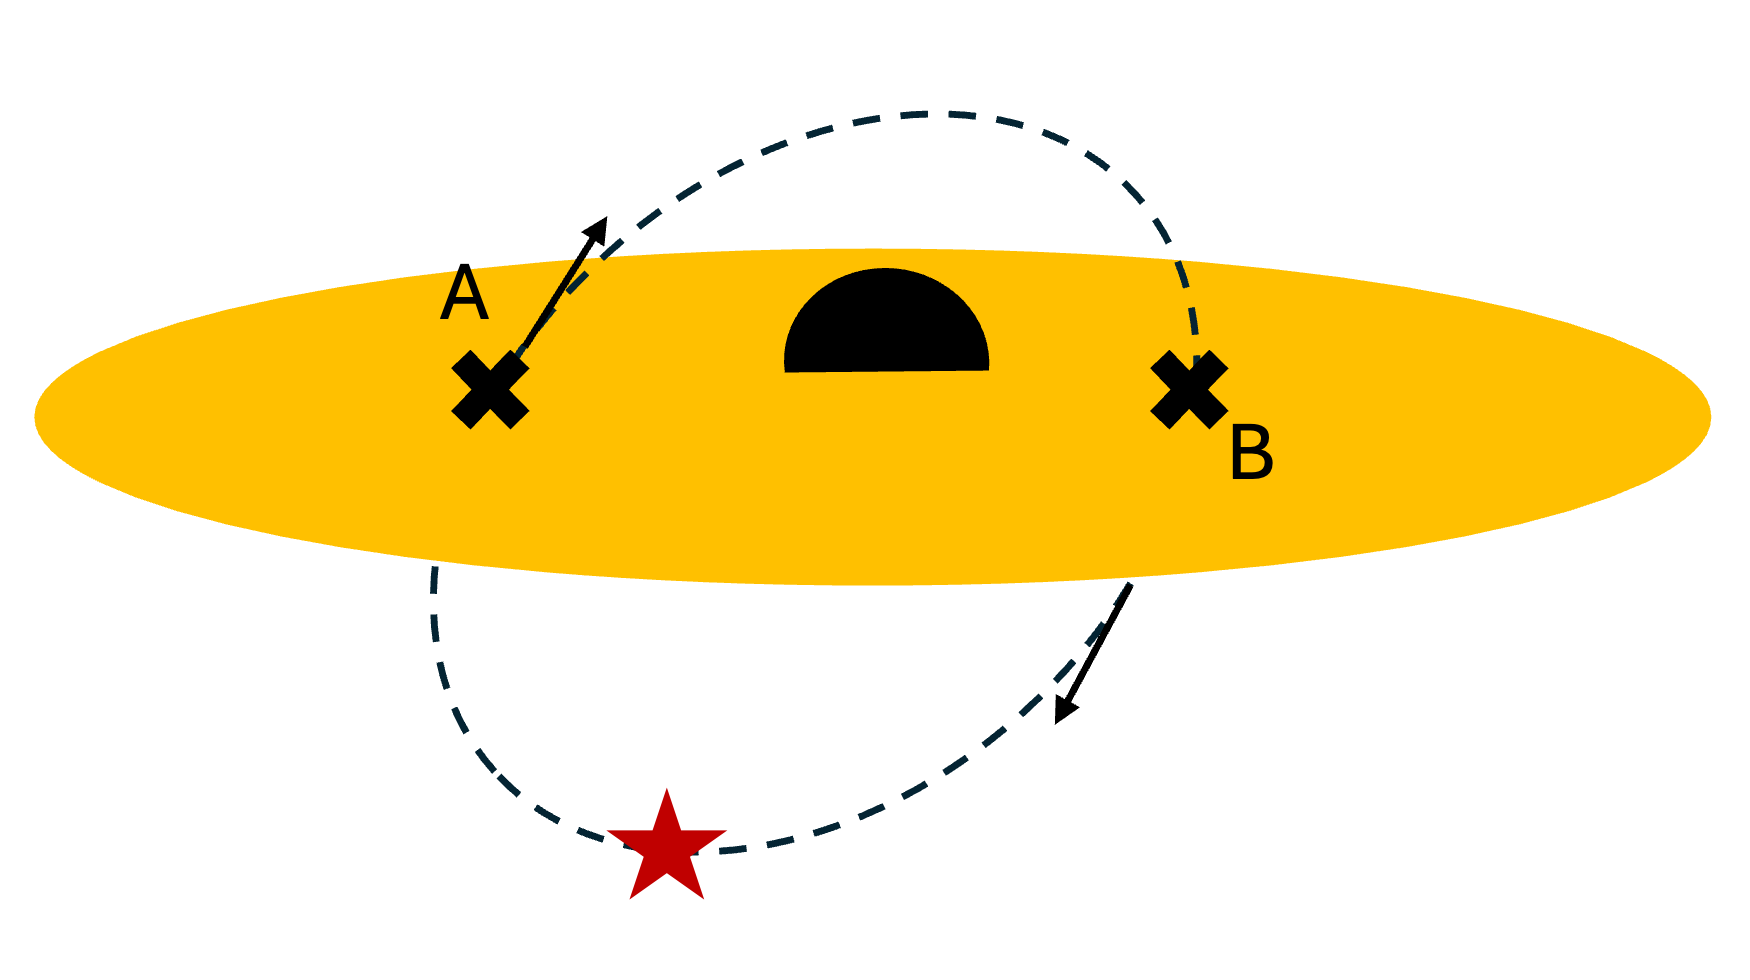
A simple diagram showing the proposed model. A star orbits a supermassive black hole on an orbit that is slightly elliptical (exaggerated here for clarity) and inclined relative to the accretion disk (yellow). The X’s mark the places where the star passes through the disk. The time between crossings at A and B is shorter than the time between crossings at B and A. [AAS Nova/Kerry Hensley]
An Ultraviolet Possibility
Now, Linial and Metzger have explored the implications of this model further, delving into the properties of quasi-periodic eruptions to understand if these events can only be observed at X-ray wavelengths, or if it’s possible to see them at other wavelengths as well. Because there are several planned and proposed ultraviolet survey missions, the team focused on the possibility of observing quasi-periodic eruptions in the ultraviolet. By outlining the equations that describe a star punching through a thin disk of gas around a supermassive black hole, the authors predicted how the brightness and timing of the flares depend on the size and mass of the star, how quickly the black hole is accreting gas from the disk, and other factors.
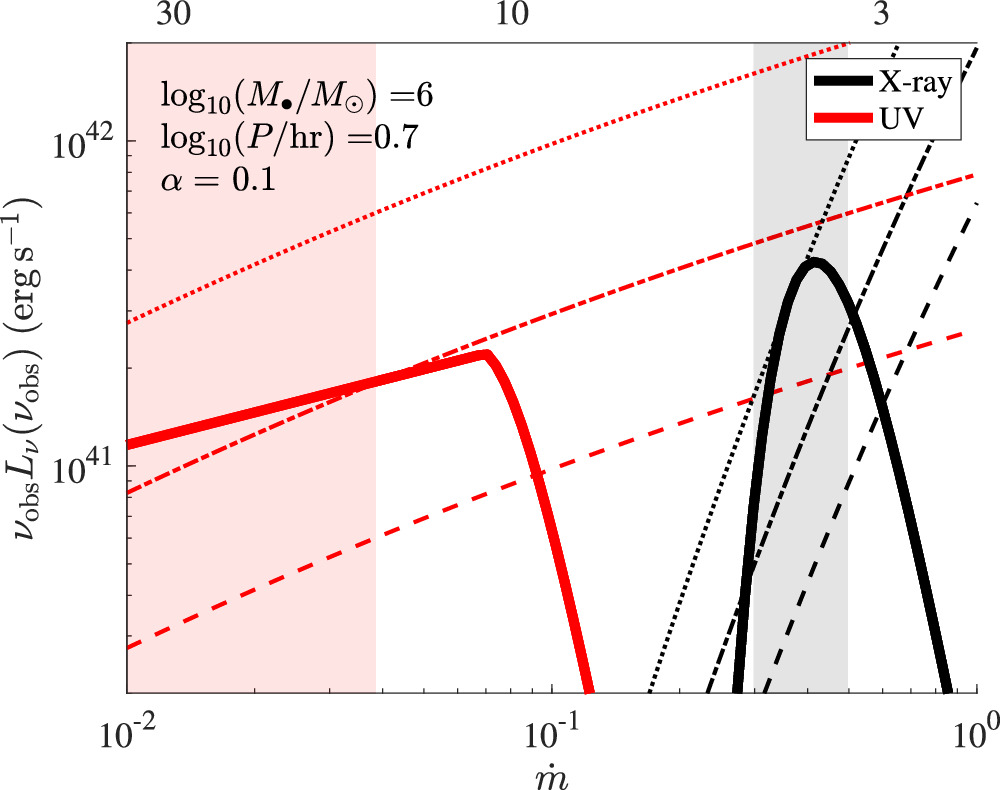
Luminosity of quasi-periodic eruptions as a function of accretion rate. This plot demonstrates how a system might transition from producing X-ray flares to ultraviolet flares, or vice versa, as the accretion rate changes. Click to enlarge. [Linial & Metzger 2024]
Citation
“Ultraviolet Quasiperiodic Eruptions from Star–Disk Collisions in Galactic Nuclei,” Itai Linial and Brian D. Metzger 2024 ApJL 963 L1. doi:10.3847/2041-8213/ad2464
The post When Stars, Disks, and Black Holes Meet, Outbursts Follow appeared first on AAS Nova.
]]>
Astrobites reports on the possibility that an ancient rogue planet is responsible for the unusual orbits of a trio of solar system objects called sednoids.
The post Sednoids: Echoes of a Rogue Planet in the Early Solar System? appeared first on AAS Nova.
]]>Editor’s Note: Astrobites is a graduate-student-run organization that digests astrophysical literature for undergraduate students. As part of the partnership between the AAS and astrobites, we occasionally repost astrobites content here at AAS Nova. We hope you enjoy this post from astrobites; the original can be viewed at astrobites.org.
Title: Primordial Orbital Alignment of Sednoids
Authors: Yukun Huang (黄宇坤) and Brett Gladman
First Author’s Institution: University of British Columbia
Status: Published in ApJL
The outermost region of our solar system is home to a small group of distant objects with orbits that deviate significantly from the rest of the objects at similar distances from the Sun: Sedna, 2012 VP113, and Leleākūhonua — collectively known as sednoids — have peculiar orbital characteristics that have intrigued astronomers and led to questions about the earliest conditions of the solar system.
The Remarkable Orbits of Sednoids
Figure 1: Orbital configuration of the three sednoids. (Leleākūhonua is also cataloged as 2015 TG387.) [Wikipedia user Tomruen; CC BY-SA 4.0]

Today’s authors set out to determine whether the current orbital alignment of the sednoids could be traced back to an event, such as the possible encounter with a rogue planet or a close stellar flyby, that occurred during the planet formation epoch approximately 4.5 billion years ago. This event would have had the power to imprint a lasting apsidal orientation on these distant objects, guiding them into the peculiar orbits we observe today.
The authors used computer simulations to trace the orbits of the three sednoids backward in time, thus effectively simulating the dynamical evolution of Sedna, 2012 VP113, and Leleakuhonua over billions of years. These simulations calculated the gravitational influence of the Sun and the giant planets — Jupiter, Saturn, Uranus, and Neptune — on the sednoids’ trajectories. To enhance the accuracy of their model, the researchers also took into account a range of initial conditions that reflect the current observational uncertainties in the sednoids’ orbits. This approach allowed them to assess how these uncertainties could influence the backward-in-time orbital paths of these distant objects, ensuring a robust analysis of the sednoids’ dynamical history while minimizing the impact of potential observational biases.
The simulations revealed that 4.5 billion years ago, the sednoids’ orbits may have aligned such that the lines connecting their closest approaches to the Sun, known as their apsidal lines, converged at a perihelion longitude of 200° (see Fig. 2). The perihelion longitude is a specific angle measured in the plane of the solar system that pinpoints the direction toward which each object makes its closest approach to the Sun in its elliptical path. The fact that these apsidal lines clustered so closely in the past suggests that the sednoids did not arrive at their current orbits by random processes alone. Instead, it hints at a shared historical influence or event, potentially during the formation of the solar system, that nudged these objects into such precisely aligned paths. This event could be the gravitational disturbance from a passing star, which may have been common in the densely packed environment where the Sun formed.
Figure 2: Past evolutions of perihelion longitudes for the three sednoids. The only time that the three apsidal lines converge is about 4.5 billion years ago. [Huang & Gladman 2024]
Figure 3: Simulation demonstrating the influence of a hypothetical rogue planet on the orbits of trans-Neptunian objects by plotting longitude of perihelion versus perihelion distance. The left panel shows the orbital configurations shortly after the rogue planet’s departure 185 million years post-formation, while the right panel depicts the current arrangement. The ejection of the rogue planet leads the initially clustered longitudes of perihelion to homogenize, except for bodies where precession periods are comparable to the age of the solar system. As this is the case for sednoids, this may hint at the presence of an additional planet in the early solar system. [Huang & Gladman 2024]
Bad News for Planet Nine
The discovery of unusual orbital patterns among trans-Neptunian objects led to the Planet Nine hypothesis, which posits a yet-undetected ninth planet far beyond Neptune that influences the orbits of these distant celestial bodies. However, the apparent one-time alignment of the sednoids’ orbits 4.5 billion years ago suggests a singular historical event, not consistent with the ongoing perturbations expected from a persistent ninth planet. Such a planet would actively sculpt the orbits over time, potentially erasing the signatures of past orbital configurations. The lack of current apsidal clustering supports the idea that today’s orbital architecture of sednoids stems from an early solar system incident, rather than the continuous presence of a large, undiscovered planet.
Future Discoveries and Solar System Secrets
Nonetheless, due to the intricate nature of the solar system’s dynamics, a more comprehensive dataset is essential to substantiate these findings. The advent of advanced telescopic technology and extended astronomical surveys holds promise for the detection of additional sednoid-like objects. Such observations would be crucial, as they could either corroborate the theory of a primordial event influencing sednoid orbits or compel us to reconsider our current understanding of the solar system’s evolution.
The study on sednoids offers a glimpse into the conditions of the early solar system. The sednoids’ unique orbital alignment could serve as a record of a major event that occurred shortly after the solar system’s formation. As more data become available, we may be able to piece together a clearer picture of our solar system’s history, from its most chaotic beginnings to its current state.
Original astrobite edited by Mark Dodici.
About the author, Konstantin Gerbig:
I’m a PhD student in astronomy at Yale University. I’m interested in the theory of (exo)planets and protoplanetary disks and do hydro simulations thereof. I also like music, as well as dancing salsa and tango.
The post Sednoids: Echoes of a Rogue Planet in the Early Solar System? appeared first on AAS Nova.
]]>
Researchers investigate the behavior of minidisks: the small disks of gas that collect around the individual supermassive black holes in a binary pair.
The post Featured Image: Minidisks in Massive Binaries appeared first on AAS Nova.
]]>From millions of light-years away, how can we tell if a galaxy contains one supermassive black hole or two? It’s a tricky problem: the gas around single supermassive black holes glows across the electromagnetic spectrum and varies on timescales from hours to years, and it’s not obvious how adding a second black hole changes these behaviors. As a step toward differentiating the two scenarios, a team led by John Ryan Westernacher-Schneider (Leiden University and Clemson University) simulated the gas surrounding pairs of black holes. When binary black hole systems ensnare gas from their surroundings, the gas collects in a large accretion disk around both black holes and in smaller disks around the individual black holes. These smaller disks are called minidisks. Each frame above shows a simulated minidisk with different physical parameters. Because of instabilities, the simulated minidisks sometimes become extremely elongated, and if future work suggests that this elongation is likely to happen in real disks, it may provide a way to interpret variations in the light from distant sources and pinpoint binary black holes. To learn more about these minidisk simulations, be sure to check out the full article linked below.
Citation
“Eccentric Minidisks in Accreting Binaries,” John Ryan Westernacher-Schneider et al 2024 ApJ 962 76. doi:10.3847/1538-4357/ad1a17
The post Featured Image: Minidisks in Massive Binaries appeared first on AAS Nova.
]]>
To speed up their models of supernovae, astronomers are turning to neural networks for an AI-assist.
The post Supernova Nickel and Neural Nets appeared first on AAS Nova.
]]>Accurate models of supernova spectra are typically pretty slow, but neural networks are both fast and capable of mimicking many other codes. Recently, a team used the latter facts to overcome the former challenge and created a set of neural networks capable of rapidly modeling real supernova data.
Complex Explosions
As one might expect when dealing with one of the most violent, rapid, and energetic processes in the universe, one must take great care when modeling a supernova. In the seconds, hours, and days after the initial explosion, many different processes unfold on many different scales: unstable elements birthed from the raw power of the eruption decay into more durable forms; heavy elements are accelerated to mind-boggling speeds; nearby material begins to glow as the temperatures approach values beyond comprehension. Each of these processes and others affect the spectra that we measure here on Earth, and each of them must be closely tracked in order to correctly explain our observations.
The immense complexity of the problem places large demands on the codes that simulate the aftermath of a supernova. Despite many different simplifications and approximations, the inescapable fact remains that each of these simulations take a lot of time to run. For example, one code named TARDIS requires about one CPU hour to transform inputs such as total luminosity, time after explosion, and the structure of the ejecta into an output model spectrum. For astronomers who want to compare their real data to potentially millions of models to find the best-fitting values for those input parameters, that runtime won’t cut it.
A recently adopted unspoken code among the astronomy community states that if one scientist says “complex model” and “slow runtime” three times fast, another will appear with a machine learning solution to the problem. A team led by Xingzhuo Chen, Texas A&M University, just published a neural-network-accelerated supernova inference framework that answers this latest call.
Neural Networks and Nickel
The training progress of the neural networks as a function of iterations through the training data. [Chen et al. 2024]
The inferred nickel abundance over time for several real supernovae. The expected decay rate is shown in the solid line. [Chen et al. 2024]
Even still, the authors state that their work “represent[s] a significant improvement in the quality of the spectral modeling of [supernovae] compared to similar models in the literature.” By using this technique of harnessing neural networks to speed up complex physical models, astronomers can look forward to many more breakthroughs that wouldn’t be possible without an AI-assisted boost.
Citation
“Artificial Intelligence Assisted Inversion (AIAI): Quantifying the Spectral Features of 56Ni of Type Ia Supernovae,” Xingzhuo Chen et al. 2024 ApJ 962 125. doi:10.3847/1538-4357/ad0a33
The post Supernova Nickel and Neural Nets appeared first on AAS Nova.
]]>
New research challenges expectations that the smaller a planet is, the faster it will lose its atmosphere when exposed to fierce stellar winds and intense radiation.
The post Hold On to Your Atmospheres: How Planet Size Affects Atmospheric Escape appeared first on AAS Nova.
]]>Which planets are most likely to lose their atmospheres? New research finds a surprising relationship between planet size and atmospheric escape and suggests that the smallest planets aren’t losing their atmospheres the fastest.
The Role of Atmospheric Loss
An illustration of Mars losing ions from its atmosphere during a solar storm. [NASA/GSFC]
Other planets in distant star systems are not as lucky: pummeled by fierce radiation and howling stellar winds, many exoplanets will lose most or all of their atmospheres. A planet’s ability to hold on to its atmosphere shapes its habitability, the possibility of harboring long-lived oceans, and other critical factors. With exoplanet habitability a persistently hot topic in astronomy, it’s critical to know which planets are most likely to have atmospheres.
What’s Radius Got to Do with It?
To approach this question, a team led by Laura Chin (Boston University) investigated how a rocky exoplanet’s size affects its ability to hang on to its atmosphere. Using fluid dynamics models, Chin and collaborators simulated the atmospheric loss due to stellar radiation and stellar winds. High-energy radiation ionizes atmospheric particles, allowing them to be picked up and carried away by the magnetized stellar wind, and imparts enough energy to some particles to allow them to escape the planet’s gravitational pull.
Model output showing the escape of oxygen ions from planets of varying sizes. Click to enlarge. [Chin et al. 2024]
A Surprising Finding
Escape rate as a function of planetary radius for three types of ions (colored lines) and all atmospheric particles (black line). [Chin et al. 2024]
The increase in the escape rate for planets with radii from 0.5 to 0.75 RV appears to be driven by the increase in the planet’s size; a larger planet’s atmosphere absorbs more starlight (i.e., energy), creating more ions that can be stolen away by a magnetized stellar wind and boosting the escape rate. Above 0.75 RV, the decrease in the escape rate is driven by the increase in the planet’s gravitational pull, which makes it harder for atoms to depart the atmosphere.
This result contrasts with expectations that the atmospheric escape rate is largest for the smallest planets. Future surveys of rocky planets around M-dwarf stars may be able to search for a connection between planet size and atmosphere thickness, testing this finding.
Citation
“Role of Planetary Radius on Atmospheric Escape of Rocky Exoplanets,” Laura Chin et al 2024 ApJL 963 L20. doi:10.3847/2041-8213/ad27d8
The post Hold On to Your Atmospheres: How Planet Size Affects Atmospheric Escape appeared first on AAS Nova.
]]>
Astrobites reports on a class of stars known as complex periodic variables and the possible causes of their variations.
The post Ripples in Time: The Transient Nature of Mysterious M Stars appeared first on AAS Nova.
]]>Editor’s Note: Astrobites is a graduate-student-run organization that digests astrophysical literature for undergraduate students. As part of the partnership between the AAS and astrobites, we occasionally repost astrobites content here at AAS Nova. We hope you enjoy this post from astrobites; the original can be viewed at astrobites.org.
Title: Transient Corotating Clumps Around Adolescent Low-Mass Stars from Four Years of TESS
Authors: Luke G. Bouma et al.
First Author’s Institution: California Institute of Technology
Status: Published in AJ
The flow of time gently pushes us all downstream, making the present past and the future present. So much of science, and even life, is trying to understand how time will change what we experience and observe. What remains the same? Is this something stable that we can rely on? What changes? Is this moment precious? Just a fleeting incident? And how can we tell the difference? These are hard questions, no matter the subject. Today’s authors are unfazed by the challenge and seek to understand what can be said about a mysterious group of M-dwarf stars that seem to be stable in their changing!
Complex Periodic Variables
The subjects of today’s study are complex periodic variables, a new name for objects previously called complex rotators and, before that, scallop-shell objects. While the name has changed, the type of object the name describes hasn’t. Complex periodic variables are all young (less than 200 million years old), rapidly spinning (rotation periods of less than two days), small M-dwarf stars. Only about 150 of them are known, and each has been associated with groups of other young stars, ranging from 2 to 200 million years of age.
What makes complex periodic variables stand out from the crowd in their young groups are their light curves: the measure of their brightness over time. Young stars tend to have big, dark starspots on their surfaces that rotate into and out of view. Starspots normally produce a smooth repeating pattern in the light curve, varying at the spin rate of the star. However, complex periodic variables’ light curves show sudden, sharp repeating features rather than smooth ones. This can’t be caused by starspots alone, but like starspots, these repeating features are stable for weeks and seem to change with the star’s rotation. These sharp features are thought to be caused by either clumps of material orbiting at the right distance to be phased with the star and blocking starlight, or material in prominences formed off the surface of the star due to its magnetic field (Figure 1).
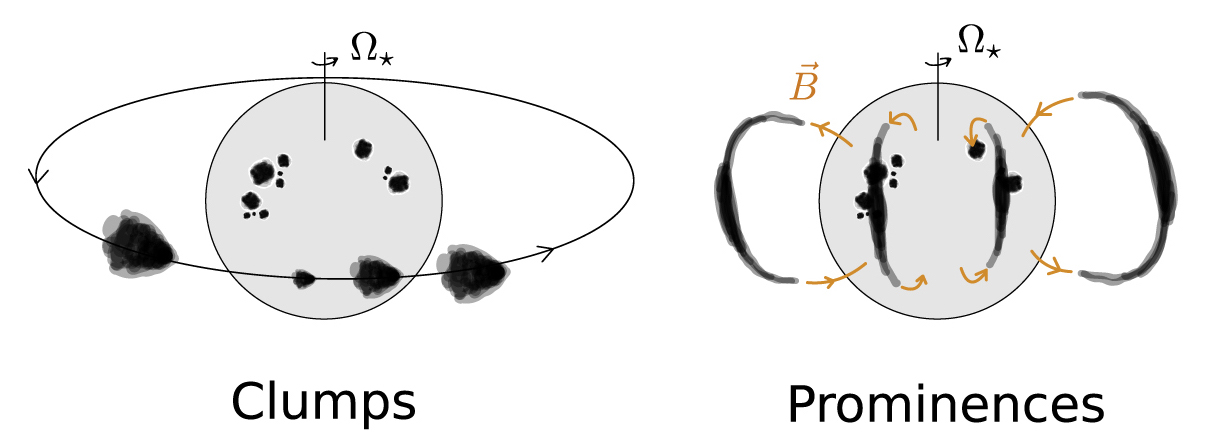
Figure 1: Two possible physical causes for the complex light curve shapes. The spotted star is seen with clumps of material orbiting around it (left), or with material trapped in the star’s magnetic field as prominences off the surface (right). [Adapted from Bouma et al. 2024]
What Remains the Same? What Changes?
To get a better handle on how stable these complex variations are, and to potentially find some more, the authors searched the two-minute-cadence data from the Transiting Exoplanet Survey Satellite (TESS) for objects with complex variability and found 50 of them. Many of the objects were previously known, but some were new, and the 50 objects served as a great data set for looking at the complex shapes of the light curves. Of the 50, a subset had observations at least two years apart. The authors show the difference in the repeating light curve shape for 27 of the objects in Figure 2.
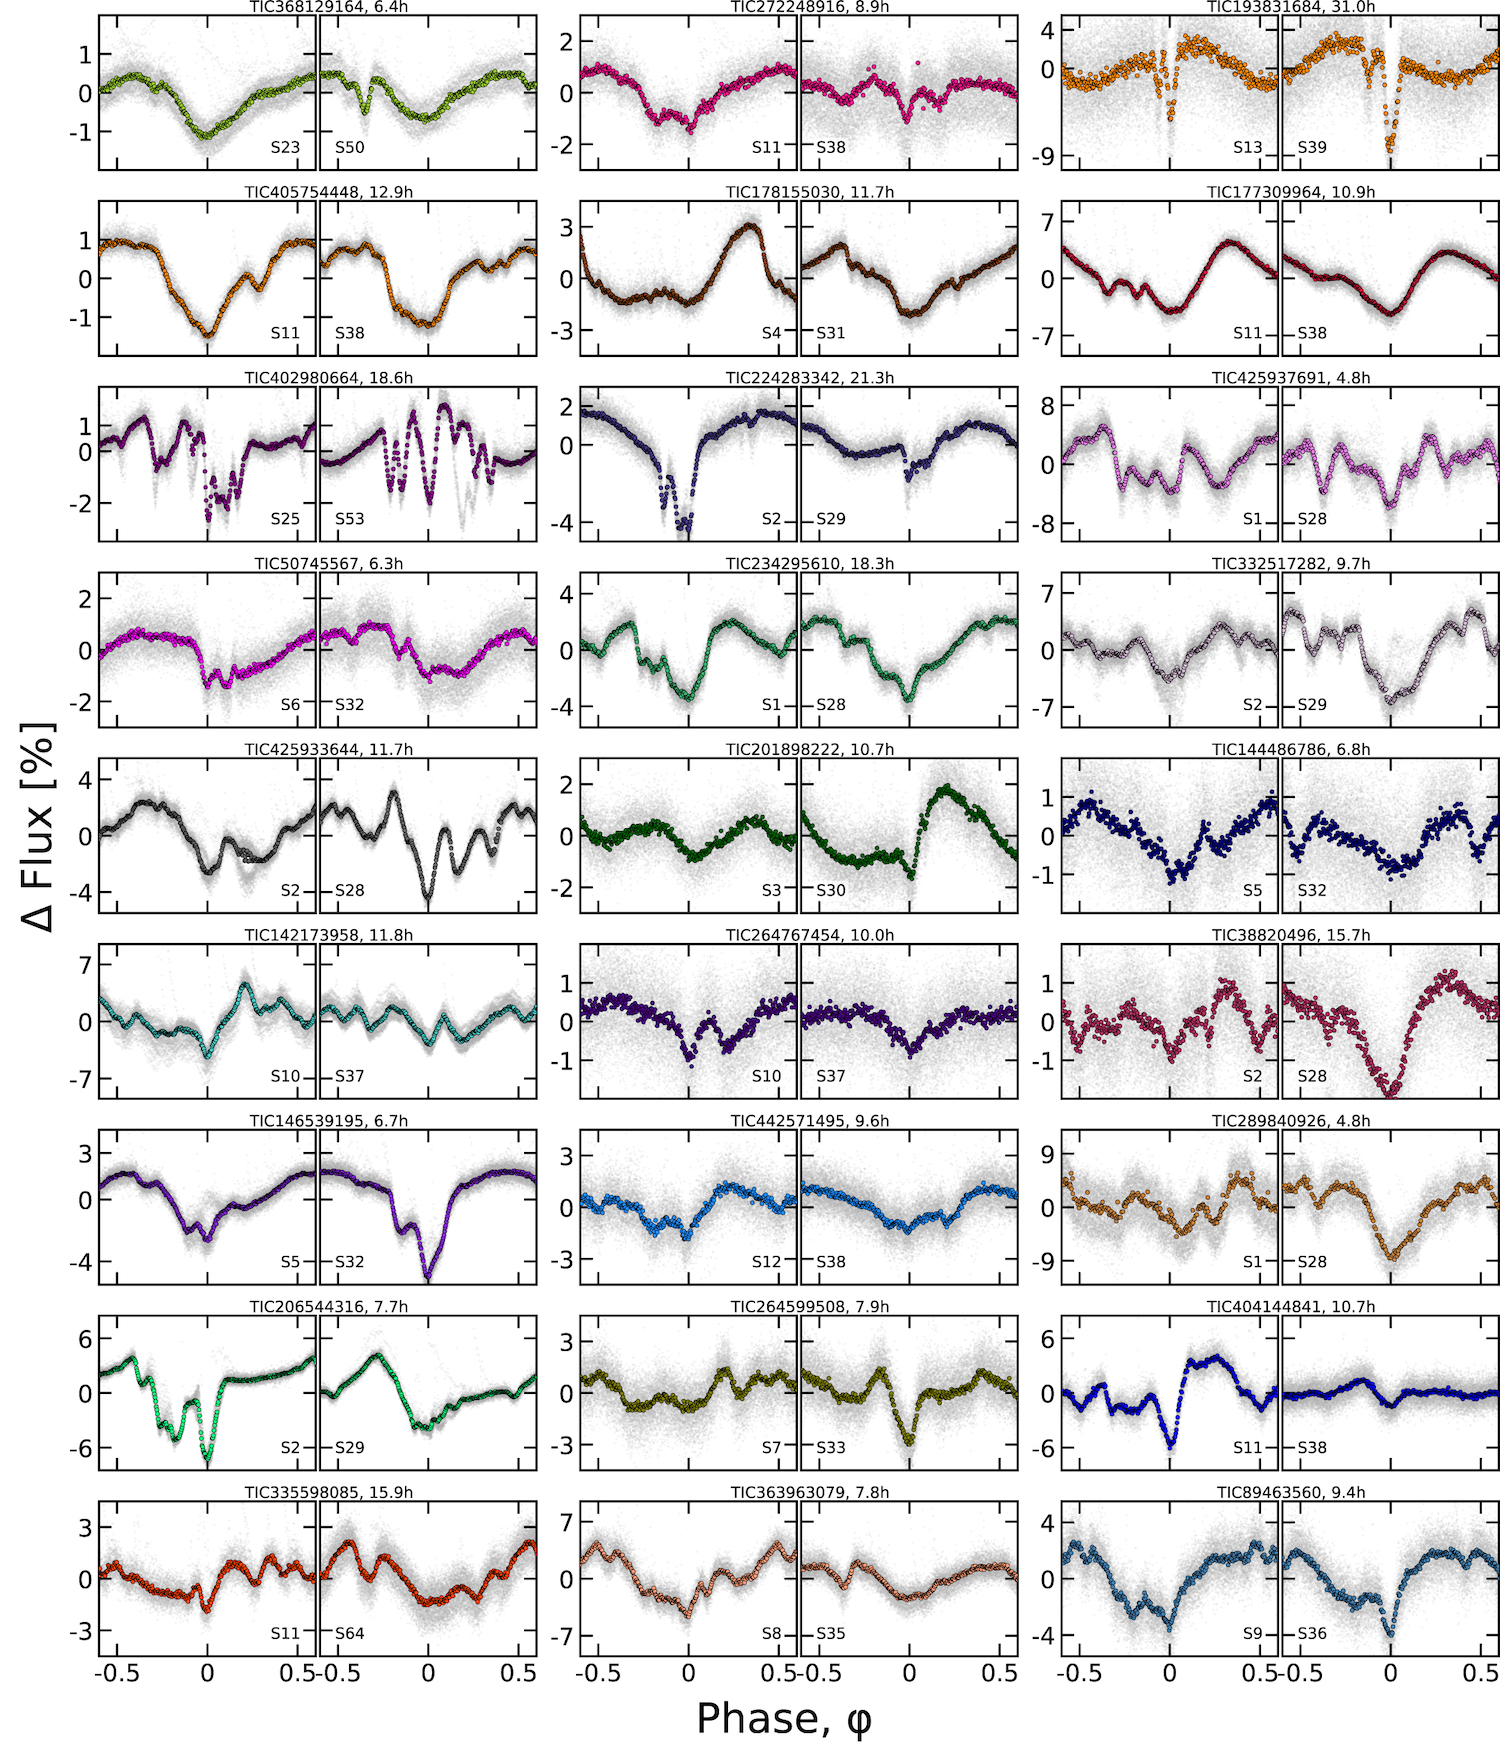
Figure 2: Twenty-seven complex periodic variables that have TESS observations separated by at least two years. For each object there are two panels, showing first the earlier and then the later observations. The x axis is the rotational phase, or when the star is in the repeating pattern, and the y axis is the percent change in brightness. Tag yourself, I’m TIC 264767454. [Bouma et al. 2024]
To examine that further, the authors did a deep dive on a particular star: LP 12-502. They broke up the light curve patterns even further; now, instead of looking at month-long TESS observation sectors, they look at a specific number of cycle repetitions for the object (Figure 3). This finer subdivision revealed that even after every 10–20 cycles of rotation there were subtle, and sometimes dramatic, changes in the shape of the light curve. Furthermore, they were able to point to noticeable flares occurring before some of the changes in the light curve, potentially pointing to a link between flares and changing light curve shape.
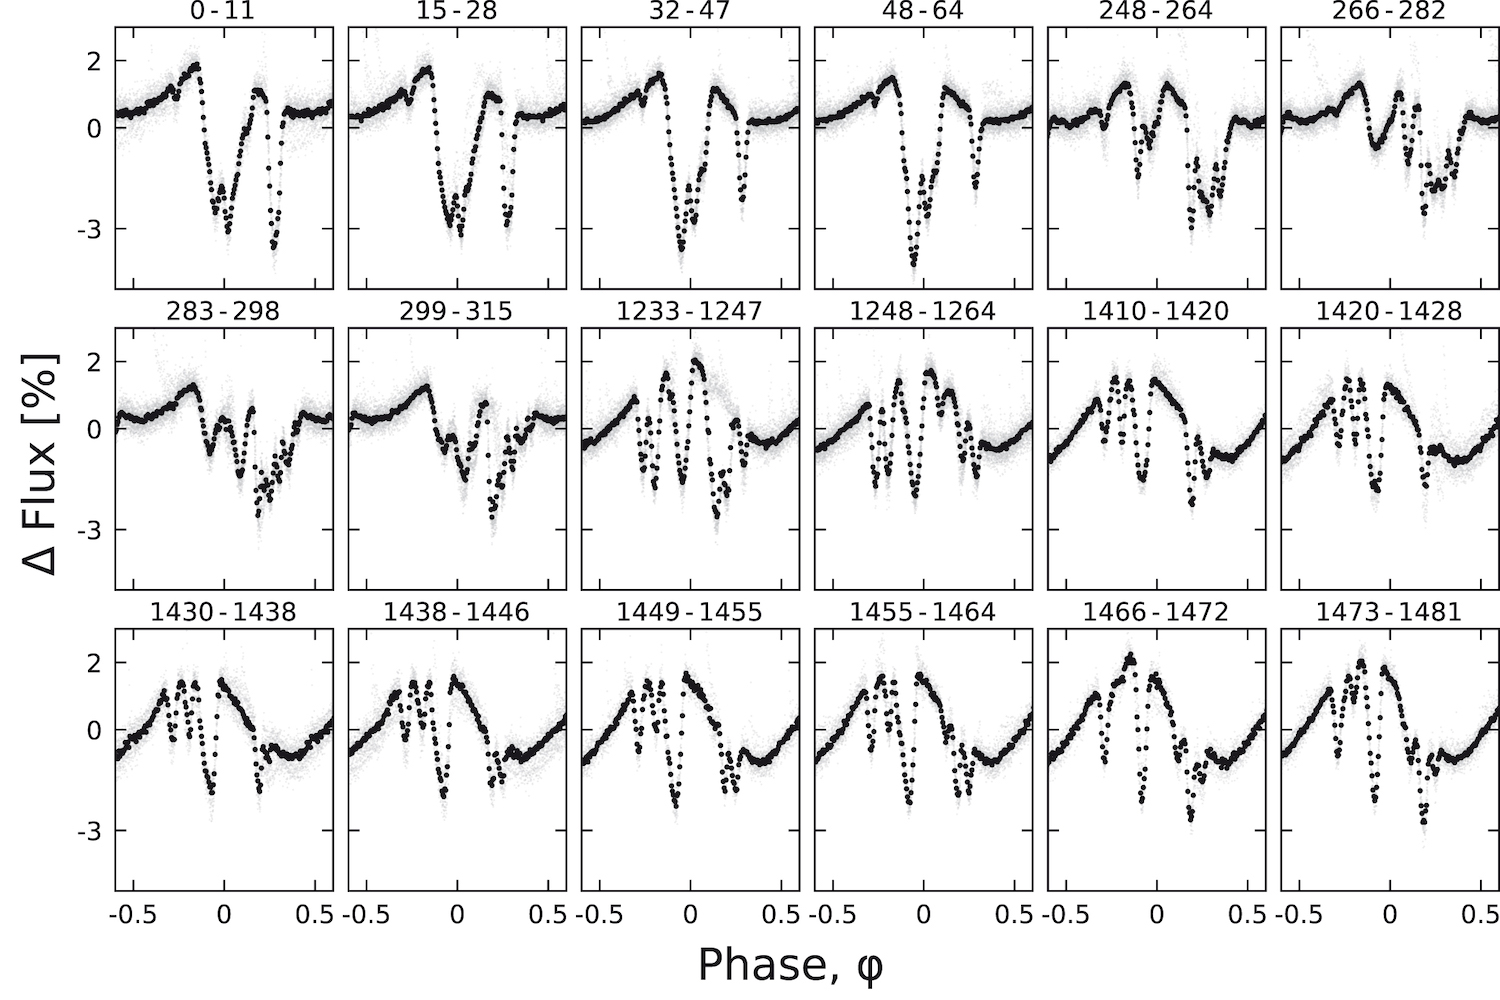
Figure 3: The light curves of the complex rotator LP 12-502 broken up over particular cycles of rotation (given in the title of each panel). Gaps in coverage are caused by TESS’s observation windows. The patterns of complexity shift and change subtly even over these short time frames. [Bouma et al. 2024]
The River of Time
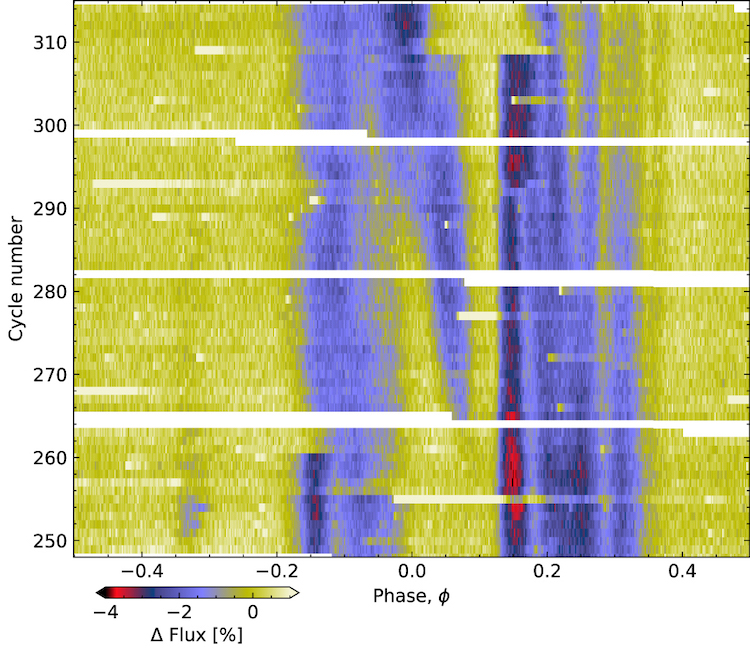
Figure 4: A river plot for the star LP 12-502, showing the change in brightness as a function of cycle on the y axis and rotational phase on the x axis. The light curve has been sliced into cycles of rotation and then converted into strips of color stacked on top of each other. [Adapted from Bouma et al. 2024]
I find these plots peaceful; I want to be sat in an inner tube, floating along their surface. Tough questions of change become easier when considered in comfort. The ripples of brightness ferry me down the lazy-flowing river of time, the gentle motion meandering my thoughts around the potential cause of these mysterious objects.
Original astrobite edited by Ivey Davis.
About the author, Mark Popinchalk:
I’m a postdoc at the American Museum of Natural History. I study the age of stars by measuring how quickly they rotate. I enjoy ultimate frisbee, baking bread, and all kinds of games. My favorite color is sky-blue-pink.
The post Ripples in Time: The Transient Nature of Mysterious M Stars appeared first on AAS Nova.
]]>
A metal-poor star in the Milky Way's halo may have formed from the remains of the very first stars to flicker into existence, opening a window into the properties of our universe's original stars.
The post Have We Found a Direct Descendant of the First Stars? appeared first on AAS Nova.
]]>The star J1010+2358 may have descended from just one of the first stars, which would make it a powerful probe of the elusive first generation of stars. However, new research finds that its properties are consistent with a range of stellar ancestries.
Seeking the First Generation of Stars
The first stars in the universe collapsed into being in clouds of pristine gas containing just hydrogen, helium, and a tiny amount of lithium. This simple set of chemical ingredients likely allowed the first generation of stars to attain enormous masses, although the exact distribution of their masses is unknown. These early stars created new elements in their cores and scattered them throughout the universe in expansive clouds of metal-enriched gas.
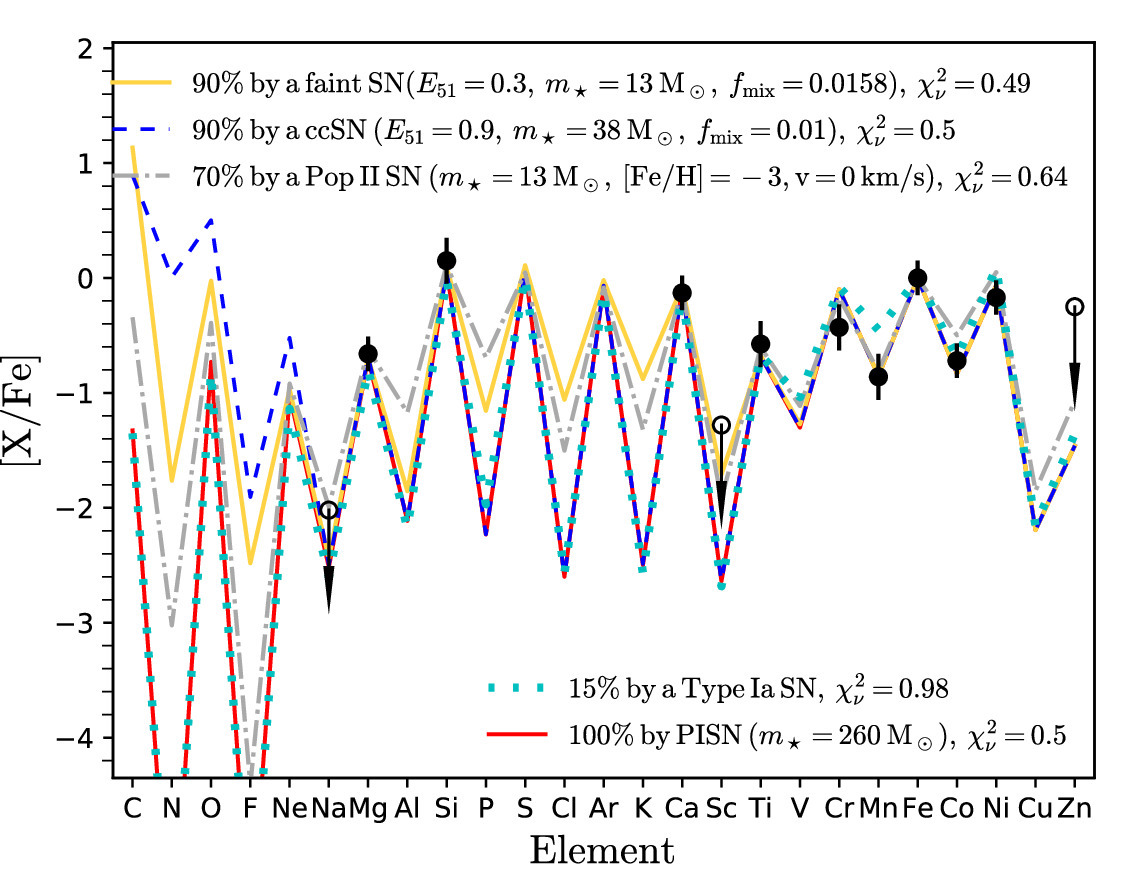
Measured chemical abundances for J1010+2358 (black circles) and model predictions for several different stellar ancestries. The prediction for a single 260-solar-mass ancestor is shown in red. Click to enlarge. [Adapted from Koutsouridou et al. 2024]
The star’s overall lack of metals (elements heavier than helium, in astronomer parlance) and curious chemical abundance pattern suggest that it was made from gas left behind by a 260-solar-mass star; J1010+2358 is especially lacking in elements with odd atomic numbers, such as sodium, compared to even-numbered elements. Now, a team led by Ioanna Koutsouridou (University of Florence) has investigated whether J1010+2358 is truly the descendant of a single, massive member of the first generation of stars.
A Study in Stellar Genealogy
Koutsouridou’s team examined whether J1010+2358 contains material passed down from only a single 260-solar-mass star, or if it contains material from several stars. Using chemical abundance modeling, the team found that J1010+2358 must have descended from a 260-solar-mass star — but it could have other stellar parents as well. In fact, without being able to measure several critical chemical elements in J1010+2358’s spectrum, it’s only possible to say that the reported stellar ancestor contributed at least 10% of J1010+2358’s metals.
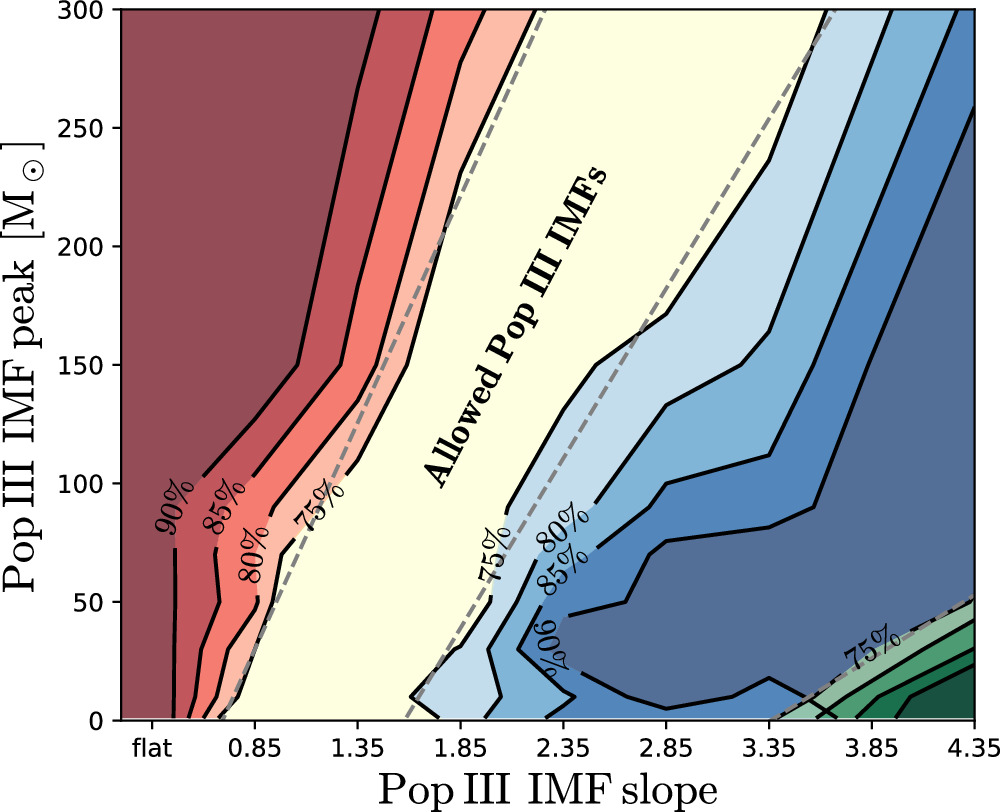
Allowed and excluded initial mass functions based on the non-detection of single-ancestor stars in the Stellar Abundances for Galactic Archaeology database (red contours) and the properties of J1010+2358. The green and blue contours show the constraints placed by J1010+2358 if it inherited 70% or 90%, respectively, of its metals from a single star. [Koutsouridou et al. 2024]
The hunt for descendants of the first stars goes on: high-resolution surveys continue to dredge up stars with just one first-generation stellar ancestor, and future observations may fill in the missing elemental abundance measurements in J1010+2358’s spectrum and clarify its family tree.
Citation
“True Pair-instability Supernova Descendant: Implications for the First Stars’ Mass Distribution,” Ioanna Koutsouridou et al 2024 ApJL 962 L26. doi:10.3847/2041-8213/ad2466
The post Have We Found a Direct Descendant of the First Stars? appeared first on AAS Nova.
]]>
Dive into three recent research articles that explore how pulsars are detected, where their pulses come from, and how they interact with their surroundings.
The post Monthly Roundup: Discovering, Modeling, and Characterizing Pulsars appeared first on AAS Nova.
]]>When a massive star goes supernova, the explosion can leave behind a pulsar: the core of a dead star containing 1–2 times the mass of the Sun in a sphere just 20 kilometers across. Pulsars are almost entirely composed of neutrons and spin extremely quickly — the fastest recorded pulsar spins 716 times every second, meaning that a point on its surface moves at roughly a quarter of the speed of light. Pulsars emit beams of radio waves from their poles, and an observer on Earth sees pulses of radio emission in time with the star’s rotation. The word pulsar comes from pulsating radio source.
Observing pulsars helps us understand the evolution of massive stars, provides a way to study the physics of ultra-dense materials, and gives us a means to search for the background gravitational hum of supermassive black holes in colliding galaxies. Today, we’ll take a look at three recent research articles that explore fundamental questions in pulsar science.
How Do We Find Pulsars?
Jocelyn Bell Burnell discovered the first pulsar by chance in 1967, when the characteristic pulses popped up in radio observations taken with a new telescope. Today, researchers design surveys tuned to the particular properties of pulsars to make them stand out from other signals in the sky. Namely, radio surveys can search for sources with steep spectra — in other words, signals that are far brighter at low frequencies than at high frequencies — or strongly polarized light.
Ziteng Wang (Curtin University) and collaborators used the Australian Square Kilometre Array Pathfinder (ASKAP), a 36-dish radio interferometer, to search for circularly polarized signals from pulsars. In addition to known stars and pulsars, the observations pinpointed a strongly circularly polarized source with no known counterpart at other wavelengths. The team followed up on this promising discovery with the 64-meter Murriyang radio telescope at Parkes Observatory and found a pulsar with a rotation period of 78.72 milliseconds. The pulsar, cataloged as PSR J1032−5804, has an estimated age of 34,600 years, making it relatively young and possibly still associated with a visible supernova remnant. The team found a compact region of emission surrounding the pulsar, but they couldn’t rule out the possibility that the material belongs to unrelated nebulae.
PSR J1032−5804 is notable because its pulses are highly scattered by interstellar gas and dust. Highly scattered pulsar signals are hard to detect because scattering broadens and weakens the signal, especially at lower frequencies where pulsars should be at their brightest. Wang’s team has shown that searching at relatively high frequencies — the team’s observations were made at 3 gigahertz — is a viable way to detect scattered pulsars.
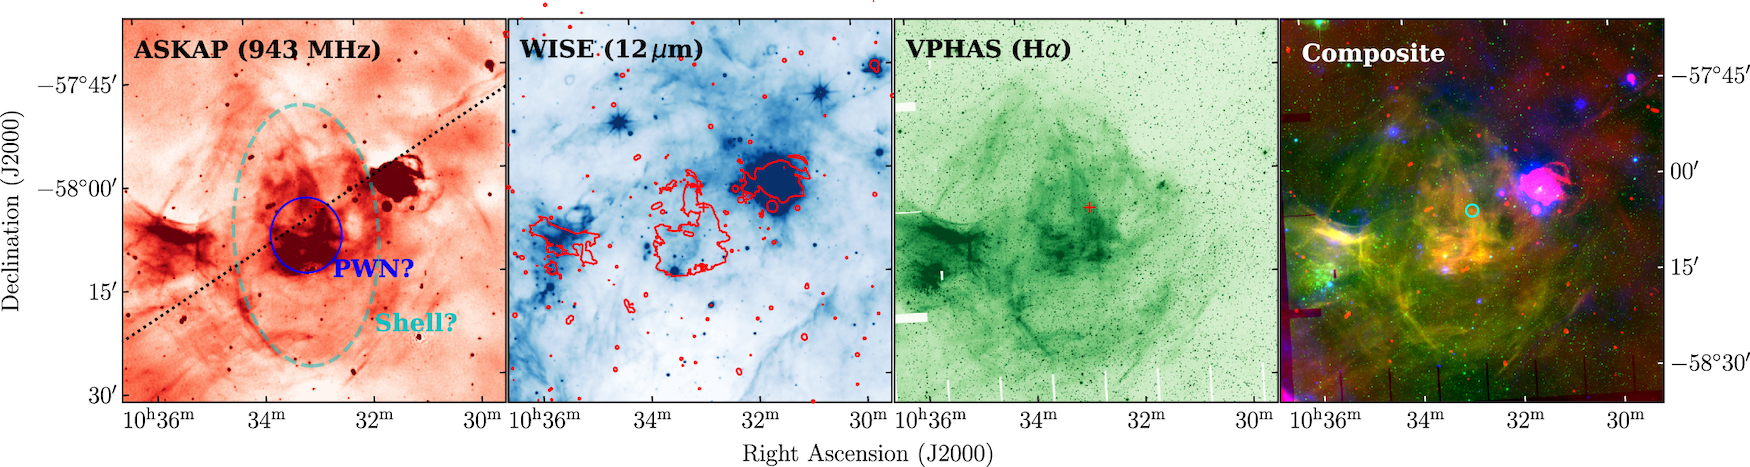
The field surrounding PSR J1032−5804 shown at, from left to right, radio, infrared, and visible wavelengths, as well as a composite of all three. [Wang et al. 2024]
How Do Pulsars Make Their Pulses?
Pulsars may be most famous for their characteristic pulses of radio emission, but the origin of those pulses is still under debate. To understand what powers these radio beacons, researchers use detailed simulations that track the behavior of individual particles to understand how they behave under the exotic conditions present at the surface of a pulsar. To date, localized simulations have been able to produce radio waves from a pulsar’s poles, and global simulations have discerned the source of pulsars’ gamma-ray pulses (10% or so of pulsars produce gamma-ray pulses in addition to radio pulses), but radio pulses have not yet been seen in global simulations.
Ashley Bransgrove (Columbia University and Princeton University) and collaborators carried out high-resolution global simulations of a pulsar’s magnetosphere: the region immediately surrounding a pulsar where its strong magnetic field dominates the motion of charged particles. The simulations show how the rapid rotation of the pulsar lofts charged particles from its surface and accelerates them, filling the magnetosphere with gamma rays and a dense sea of electrons and their positively charged counterparts, positrons. Near the pulsar’s poles and farther out in its magnetosphere, gaps form where the electric current is mismatched, and pairs of electrons and positrons are generated in these gaps. When the gaps discharge — think of a spark, or lightning — they excite waves in the plasma and, subsequently, electromagnetic waves. The emitted radiation is similar in frequency and luminosity to observed pulsars, suggesting that electric discharge may generate the radio waves that pulsars are known for.
The team notes that it’s too soon to apply their simulations to observations of individual pulsars, and more work is needed to understand the role of gamma-ray emission, explore the details of electron–positron pair production, and extend the work to pulsars whose spin axes and magnetic axes are misaligned.
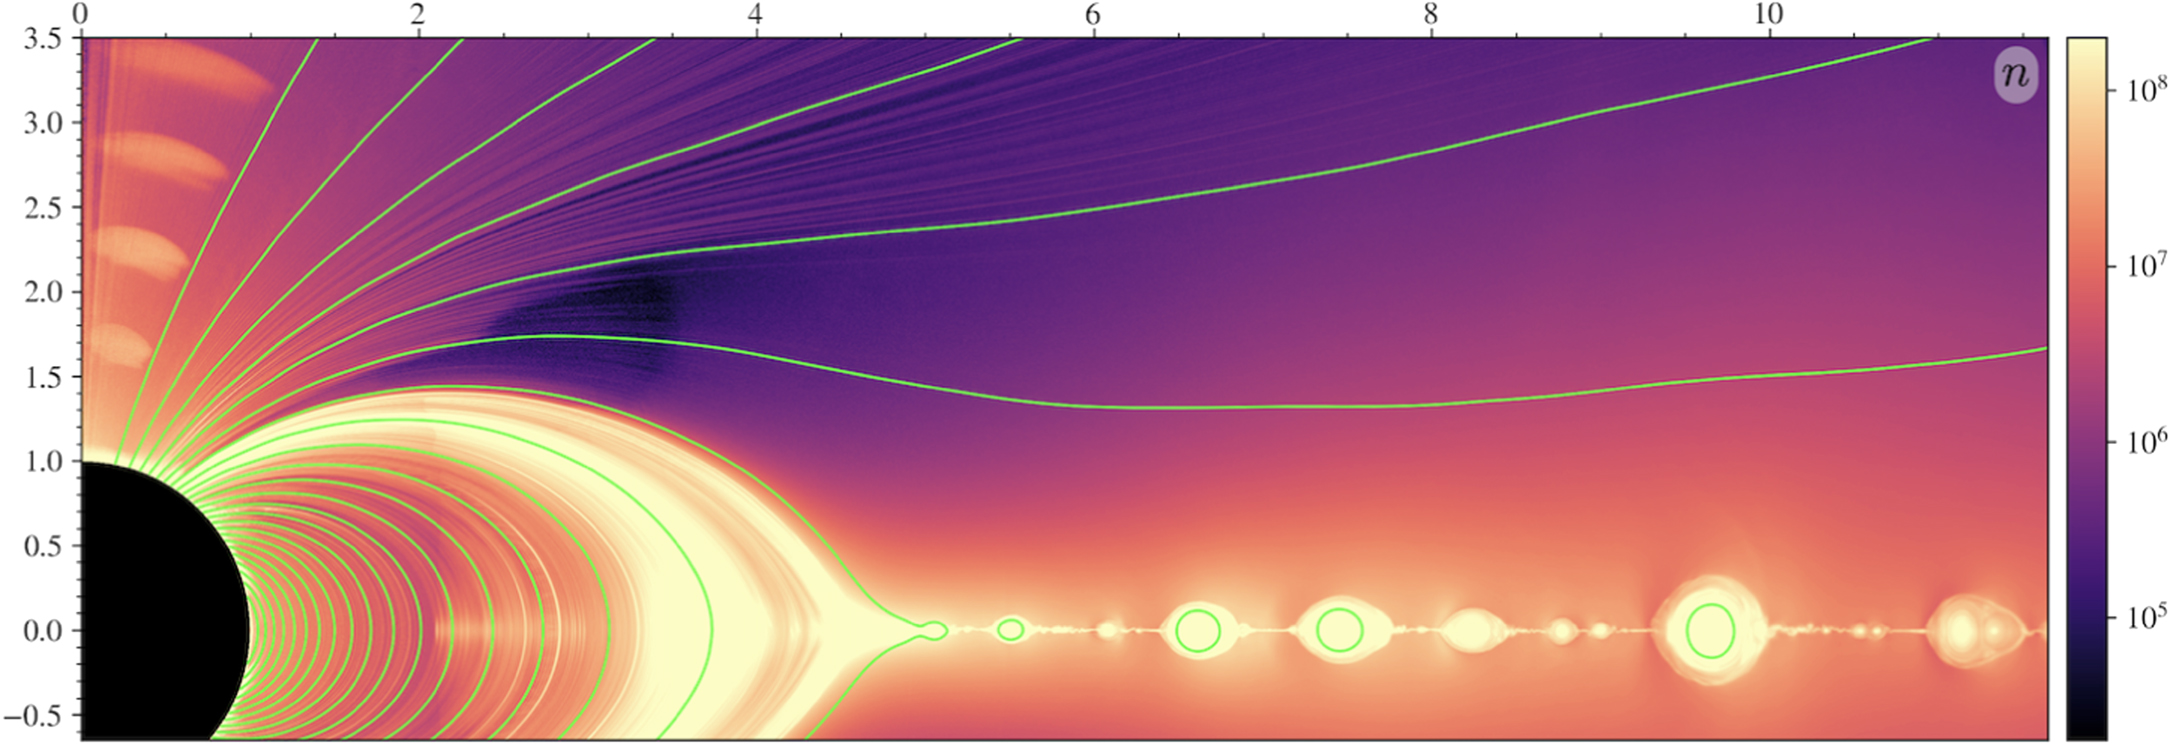
Simulation output showing the magnetic field lines (green curves) and plasma density (background color) in a pulsar’s magnetosphere. [Bransgrove et al. 2023]
How Do Pulsars Interact with Their Surroundings?
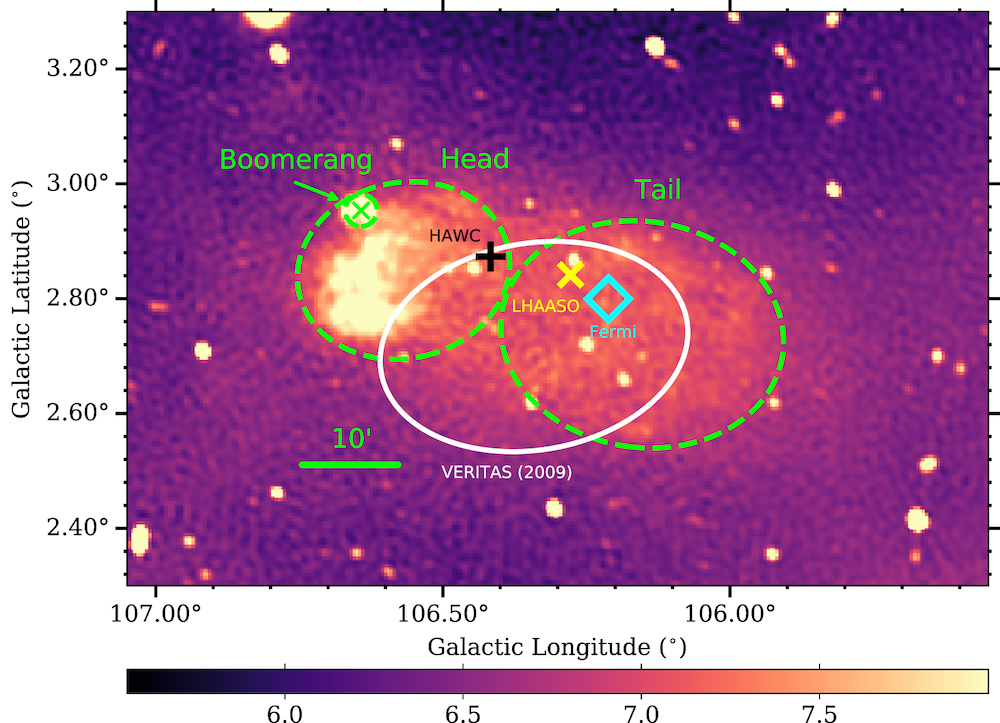
The location of the Boomerang within the supernova remnant surrounding the pulsar PSR J2229+6114. [Pope et al. 2024]
The teams combined archival data from radio telescopes and the Chandra X-ray Observatory with newly collected data from NuSTAR, VERITAS, and the Fermi Gamma-ray Space Telescope to probe the nebula’s multiwavelength behavior. These observations revealed that the nebula appears far larger at radio wavelengths than at X-ray wavelengths, a common feature of pulsar wind nebulae due to the difference sources of emission: the nebula’s size at radio wavelengths is set by outflowing particles, while its size at X-ray wavelengths comes from the rate at which electrons lose energy as they spiral around magnetic field lines and emit X-rays. The nebula’s size even varies across X-ray wavelengths, appearing smaller at shorter wavelengths.
Judging from how the nebula’s size changes with wavelength, its overall energy output, and its X-ray emission over the past two decades, the authors provide a new estimate on its distance and magnetic field strength, finding it to be more distant and with a far weaker magnetic field than previously thought. By modeling how the nebula’s energy output may have evolved over time, the team also found that the Boomerang is, well, boomeranging! Roughly 1,000 years ago, a backwards-moving supernova shock wave crashed into the expanding nebula, crushing the nebula and temporarily reversing its expansion. Today, the nebula is re-expanding in the wake of the shock wave, showcasing how pulsars dynamically interact with their surroundings.
Citation
“Discovery of a Young, Highly Scattered Pulsar PSR J1032-5804 with the Australian Square Kilometre Array Pathfinder,” Ziteng Wang et al 2024 ApJ 961 175. doi:10.3847/1538-4357/ad0fe8
“Radio Emission and Electric Gaps in Pulsar Magnetospheres,” Ashley Bransgrove et al 2023 ApJL 958 L9. doi:10.3847/2041-8213/ad0556
“A Multiwavelength Investigation of PSR J2229+6114 and Its Pulsar Wind Nebula in the Radio, X-ray, and Gamma-ray Bands,” I. Pope et al 2024 ApJ 960 75. doi:10.3847/1538-4357/ad0120
The post Monthly Roundup: Discovering, Modeling, and Characterizing Pulsars appeared first on AAS Nova.
]]>
Brown dwarfs unlucky enough to orbit black widow pulsars can't survive forever, and recent radio observations are providing new insights into their untimely ends.
The post Magnetic Last Moments appeared first on AAS Nova.
]]>Black widow pulsars are cruel, fascinating beasts that have understandably attracted much attention. Recently, a new set of radio observations has shined light not on the pulsars themselves, but on the properties of their unlucky victims.
Cruel Stars
Black widow pulsars, as their name suggests, easily rank among the deadliest creatures that roam our galaxy. These vicious beasts are a member of the pulsar family, meaning they are dense balls of neutrons formed during the collapse of a massive star. Similarly to a more peaceful (though still quite energetic) subset of their pulsar brethren, they spin so rapidly that they complete one rotation in less than a hundredth of a second. Unlike their docile counterparts, however, each black widow has trapped a low-mass companion into a nearby orbit. These companions, usually a small star or a brown dwarf, feel the full force of the intense radiation spewing from their captors. As the companion helplessly circles the pulsar, this radiation strips material away and peels the object apart. Eventually, the companion meets the same fate as the insolent soldiers who gazed upon forbidden artifacts in Steven Spielberg’s Raiders of the Lost Ark: they melt into nothingness, unable to withstand the heat.
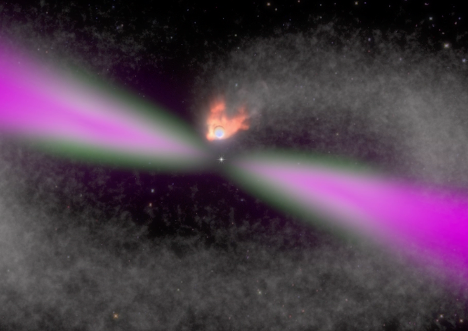
An illustration of a black widow pulsar that includes the tail of the disintegrating companion. [NASA’s Goddard Space Flight Center]
An Unwilling Comet
As the doomed brown dwarf completes laps around the pulsar, the material blown off forms a long tail extending behind it, much like a scaled-up comet. This material slightly impedes our view of the system from Earth, and with periodic regularity, it causes different properties of the observed radio emission to shift around. The simplest of these properties is the brightness of the emission: When the densest part of the comet-like tail falls into our line of sight to the pulsar, some low frequencies are blocked entirely, while higher frequencies manage to shine straight through. These “eclipses” have been seen in this system and others in the past, and the range of frequencies blocked can help constrain the environment of the tail.
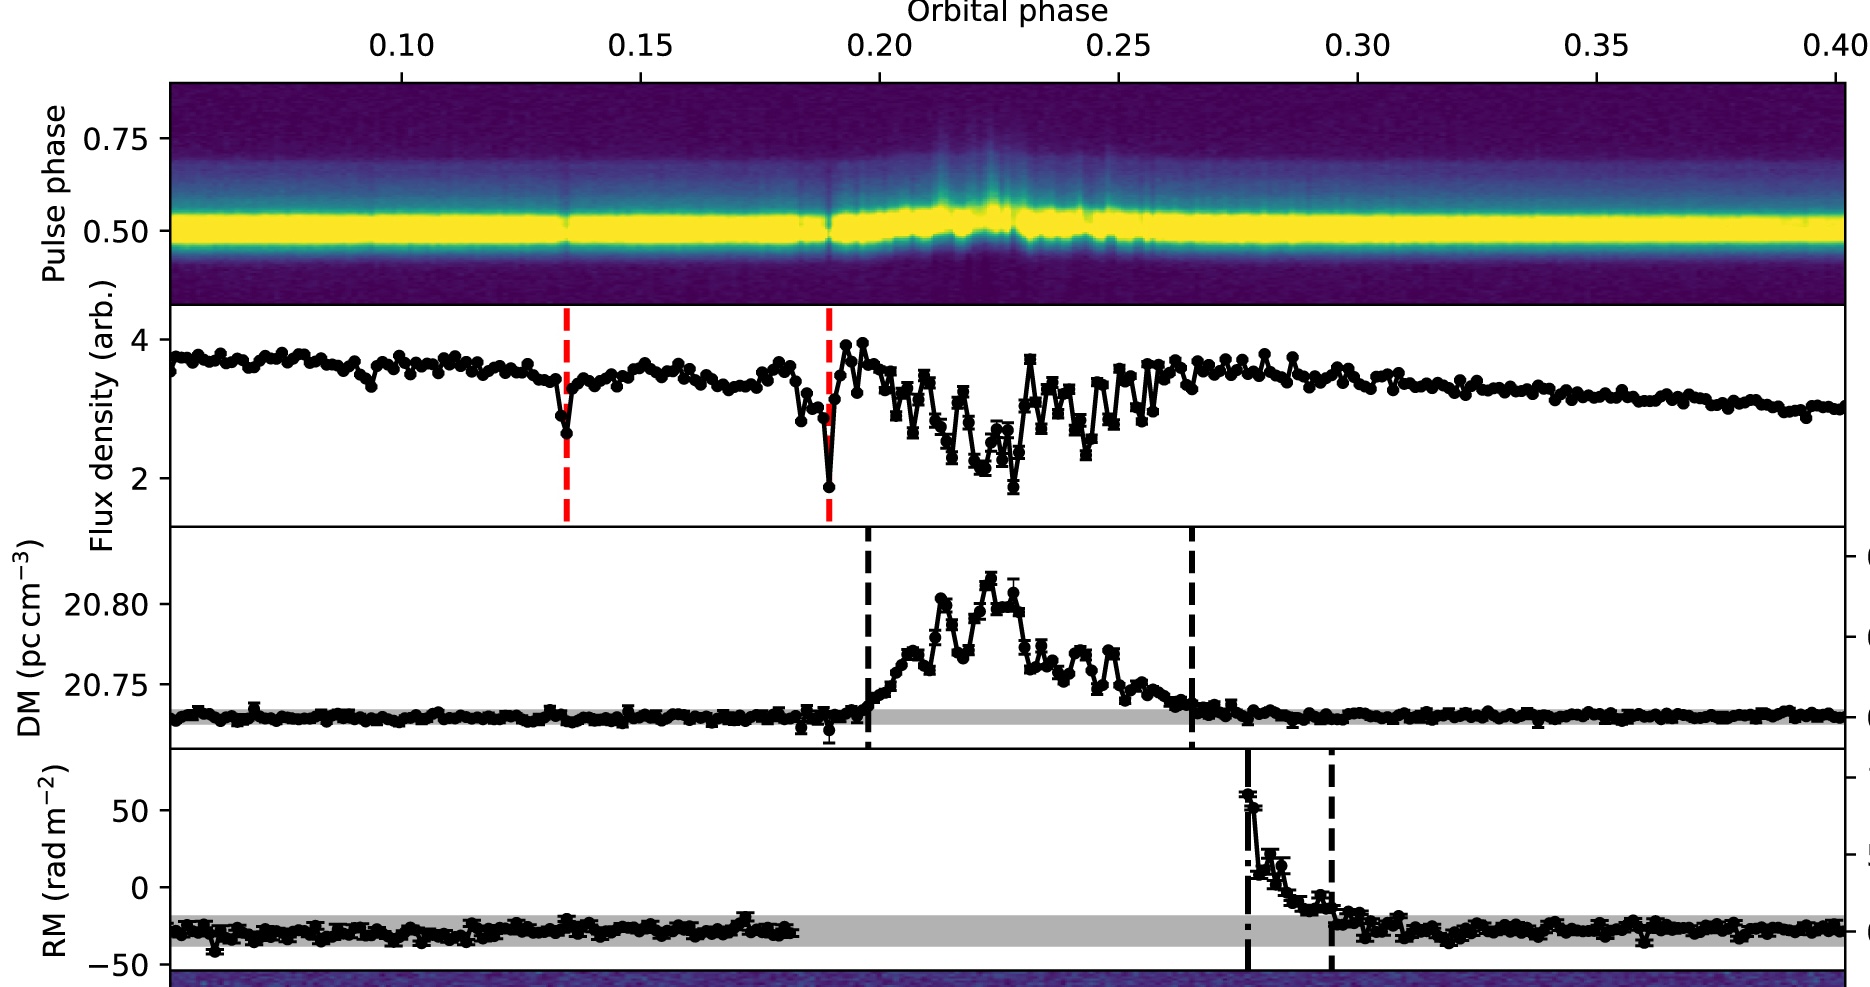
Different measured quantities as a function of the brown dwarf’s orbital phase. The bottom plot show the rotation measure: the authors attribute the decrease between the dash-dotted and dashed vertical line to the tail’s magnetic field. [Adapted from Wang et al. 2024]
During the main eclipse, the relatively dense, turbulent material of the tail leaves the polarization scrambled in a way that makes it difficult to measure the RM. However, during the egress of the eclipse when the tail begins to thin out, Wang and collaborators discovered that the RM steadily decreased until it reached its steady, out-of-eclipse value. They infer that this shift is due to a magnetic field in the tail: the material that used to make up the outer atmosphere of the brown dwarf is slightly magnetized with a field strength of about 0.1 Gauss, a little weaker than Earth’s magnetic field at the surface.
Novel, For Now
The researchers note that this is the first time this orbital-phase-dependent change in the RM has been observed, meaning that it’s also the first precise measurement of the magnetic field in the material blown away from black widow’s a companion. However, with FAST now fully operational and proven capable of this kind of measurement, similar observations are likely to follow. We’re likely about to learn much more about the tragic futures of these low-mass companions, and in doing so, more about the pulsars that will bring about about their demise.
Citation
“Change of Rotation Measure during the Eclipse of a Black Widow PSR J2051−0827,” S. Q. Wang et al 2023 ApJ 955 36. doi:10.3847/1538-4357/acea81
The post Magnetic Last Moments appeared first on AAS Nova.
]]>
Astrobites reports on an investigation into whether active galactic nucleus feedback can shut down star formation in galaxies.
The post Does Active Galactic Nucleus Feedback Cause Our Universe to Take a Cosmic Afternoon Nap? appeared first on AAS Nova.
]]>Editor’s Note: Astrobites is a graduate-student-run organization that digests astrophysical literature for undergraduate students. As part of the partnership between the AAS and astrobites, we occasionally repost astrobites content here at AAS Nova. We hope you enjoy this post from astrobites; the original can be viewed at astrobites.org.
Title: Distinguishing Active Galactic Nuclei Feedback Models with the Thermal Sunyaev–Zel’dovich Effect
Authors: Skylar Grayson et al.
First Author’s Institution: Arizona State University
Status: Published in ApJ
Let’s imagine the evolution of the universe as a regular day on Earth. If the Big Bang was when the clock struck midnight, then the cosmic “dawn” is when the first stars and galaxies started to light up our universe. After the cosmic dawn ended, galaxies continued to form stars and grew rapidly throughout the morning. Around cosmic “noon,” most galaxies in our universe were huge and even hosted massive black holes at their centers. However, as the afternoon rolled by, the universe seems to have gotten pretty lethargic in forming stars and expanding galaxies. Looks like the universe is fond of taking an afternoon siesta!
What caused the rapidly forming galaxies in the universe to suddenly slow down and stop star formation? Why didn’t they continue growing to bigger and bigger sizes? Some astronomers believe this cosmic downsizing is due to feedback from active black holes (also known as active galactic nuclei). This feedback typically occurs when the black hole spews out fast winds called outflows that contain gas and dust and expel it to large distances, sometimes far beyond the galaxy itself. Such outflows can clear the galaxy of any star-forming gas and effectively shut down star formation.
There is still much mystery around exactly how the active galactic nucleus feedback affects star formation in the galaxy. Nevertheless, various feedback models are often incorporated into simulations of galaxy formation to understand how the universe evolved. This leads to contrasting theories of galaxy evolution, so comparing the simulation feedback models to actual observations of feedback effects is essential to improve our understanding of active galactic nucleus feedback.
It is hard to directly observe an active galactic nucleus outflow, as they can be as fast as thousands of kilometers per second and cannot be captured instantaneously. Instead, we can look for indirect evidence. Our universe is filled with a microwave background believed to be a remnant of the primordial universe. If we have some high-energy electrons from gas heated by a powerful activity, such as a black hole ejecting material, they would possibly interact with the low-energy photons from the cosmic microwave background and give the low-energy photons a slight boost. This effect, known as the thermal Sunyaev–Zeldovich effect, is a good clue of a possible active galactic nucleus feedback episode.
The authors of today’s research article set out to do look for this indirect evidence of active galactic nucleus feedback. They compare observations of galaxies with signals from the thermal Sunyaev–Zeldovich effect and signals produced by galaxy simulations with and without active galactic nucleus feedback. This can help them determine if the simulations correctly model feedback and if this feedback accurately explains the observed cosmic downsizing.
Comparing Simulations vs. Observations
The authors generate maps of the thermal Sunyaev–Zeldovich effect signal from SIMBA, which is a simulation that explores the co-evolution of galaxies and black holes. They generate one set of maps with galaxies that have active galactic nucleus feedback and another set with no feedback. They highlight a sub-sample of galaxies from the former as quiescent or galaxies that have shut down and have no ongoing star formation. There are plenty of such galaxies in the universe, and they are likely there because active galactic nucleus feedback completely removed all the gas in the galaxy and thus permanently halted star formation.
The thermal Sunyaev–Zeldovich effect can be detected in observations by looking for distortions in the cosmic microwave background from data collected by radio telescopes. (The photons of the cosmic microwave background have low energies and thus need telescopes sensitive to long wavelengths of light to study them.) The authors take radio data of a similar sample of galaxies with active galactic nuclei (including quiescent galaxies) and without. They do this at two different redshifts, z = 1 and z = 0.5. The authors matched the simulated data with suitable observational effects so they could be compared realistically.
The Compton y-parameter is then used to compare the observed signal to the simulated signal. The Compton y-parameter is defined as the number of scatterings multiplied by the energy gained per scatter instance and is a commonly used term to characterize scattering in a system. As seen in Figure 1, at z = 1, the observed data match well with the quiescent active galactic nucleus model and the active galactic nucleus model in general. The data do not line up well with the no active galactic nucleus (i.e., no feedback) model, indicating that the feedback incorporated by the simulation is successful at replicating observed properties at these redshifts.
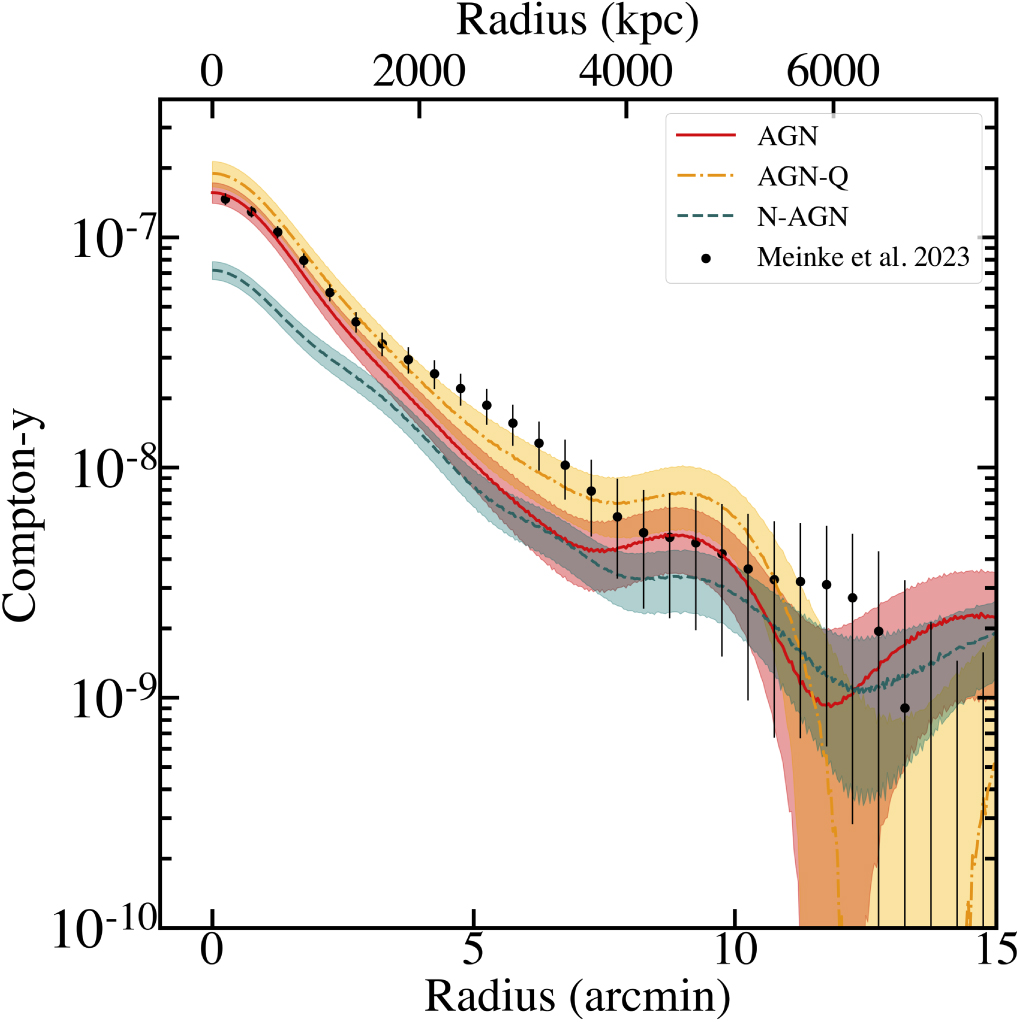
Figure 1: A comparison of observed and simulated thermal Sunyaev–Zeldovich signals at a redshift of z = 1. The observed data (black points) agree with the active galactic nucleus feedback model. [Grayson et al. 2023]
Figure 2: A comparison of observed and simulated thermal Sunyaev–Zeldovich signals at a redshift of z = 0.5. The observed data (black points) do not agree with the active galactic nucleus feedback model, but this is likely because the feedback is modeled incorrectly in the simulations. [Grayson et al. 2023]
Original astrobite edited by Jack Lubin.
About the author, Archana Aravindan:
I am a PhD candidate at the University of California, Riverside, where I study black hole activity in small galaxies. When I am not looking through some incredible telescopes, you can usually find me reading, thinking about policy, or learning a cool language!
The post Does Active Galactic Nucleus Feedback Cause Our Universe to Take a Cosmic Afternoon Nap? appeared first on AAS Nova.
]]>
Researchers may have spotted two giant exoplanets around white dwarfs, providing evidence that the giant planets in our solar system will survive the Sun's red giant phase.
The post JWST Photographs Possible Giant Planets Around White Dwarfs appeared first on AAS Nova.
]]>JWST has directly imaged what appear to be two giant exoplanets in orbit around white dwarf stars. This discovery has important implications for the fate of giant planets in our solar system as the Sun evolves into a red giant and eventually becomes a white dwarf.
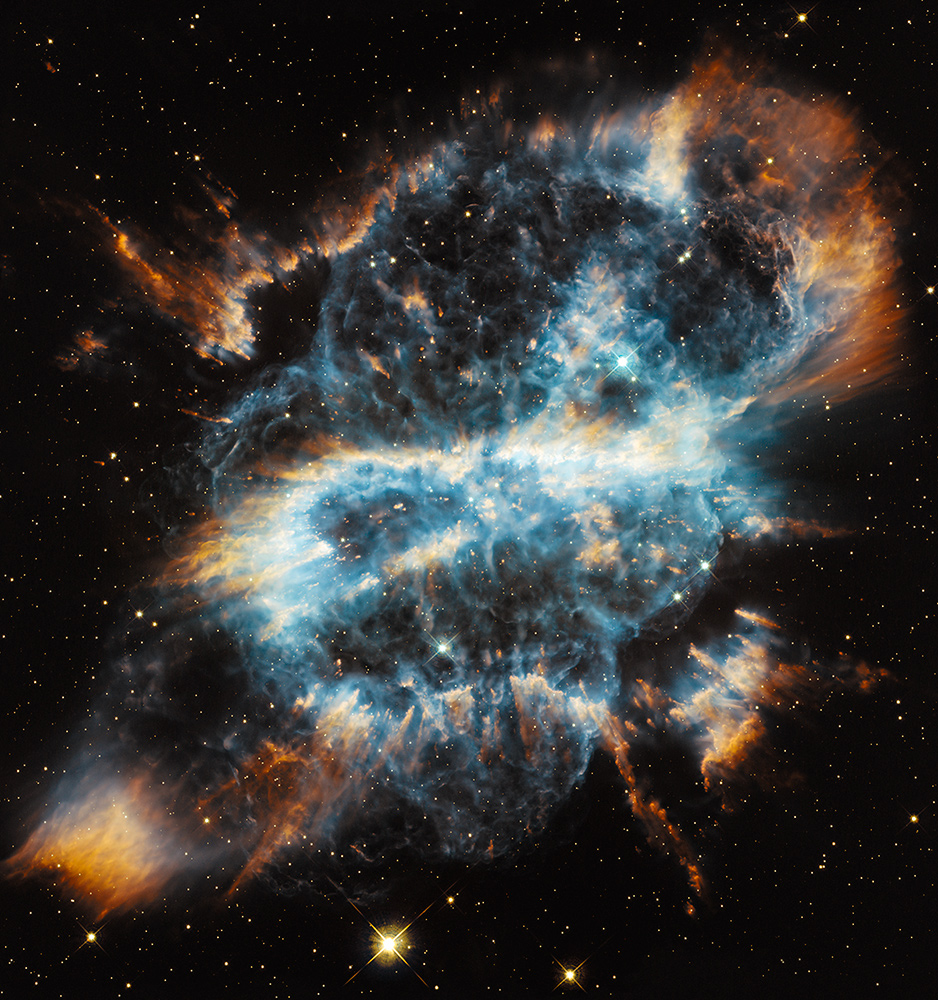
A planetary nebula appears briefly during the life cycle of most stars, including those like the Sun. Planetary nebulae tend to appear round or elliptical, but they can have dramatically varied shapes, like NGC 5189 shown here. [NASA, ESA, and the Hubble Heritage Team (STScI/AURA)]
The Fate of Most Stars
While brilliant supernova explosions demand our attention when they burst onto the scene, the vast majority of stars will end their lives more quietly, lofting their outer layers into space and forming a glowing planetary nebula that surrounds the star’s exposed core. The core, now a white dwarf containing roughly the mass of the Sun in a sphere roughly the size of Earth, starts out extremely hot and cools slowly over billions of years.
As stars evolve from main-sequence stars to red giants to white dwarfs, it’s clear that close-in planets will meet a fiery fate: as a red giant, the Sun will swell to more than 200 times its current radius, engulfing Mercury, Venus, and possibly Earth. But exactly how the transition affects planets watching things unfold from a distance isn’t yet clear. To learn more, we’ll need to study planets that survived the transformation, and recent observations with JWST may have revealed two planets that fit the bill.
Investigating Metal-Polluted White Dwarfs
Only a handful of planetary-mass objects have been discovered around white dwarfs, but many more are thought to exist; 25–50% of seemingly solo white dwarfs show metals in their spectra, which suggests that they’re collecting cast-off material from unseen planets or asteroids. If giant planets are common around these “metal-polluted” white dwarfs, it would suggest that 1) these planets are able to survive their home star’s red giant phase, and 2) they play a role in gravitationally nudging material toward the white dwarf.
The two white dwarfs and their candidate planets. The object in the upper-left corner of the top row of images is a galaxy. [Mullally et al. 2024]
Potential Planets on Outlying Orbits
The observations show a reddish object near two of the white dwarfs. If these objects are indeed planets and the same ages as their host white dwarfs (5.3 and 1.6 billion years old), they likely have masses of 1–7 and 1–2 Jupiter masses, respectively. They’re currently orbiting at estimated distances of 11.47 and 34.62 astronomical units (au), which correspond to orbital distances of 5.3 au and 9.7 au when their host stars were on the main sequence — similar to the present-day orbital distances of Jupiter and Saturn.
A comparison of the ages and orbital separations of the two new planet candidates (red triangles), the four giant planets in our solar system (blue stars), and objects with masses less than 12 Jupiter masses discovered previously through direct imaging (black circles). Click to enlarge. [Mullally et al. 2024]
If future JWST observations show that these white dwarfs and their candidate planetary companions march across the sky in step, it will mark the first direct imaging detection of planets similar to the giant planets in our solar system in age, mass, and orbital distance. More than that, it will provide evidence that widely separated planets survive their host stars ballooning into red giants, and that giant planets around white dwarfs are common and help their hosts accrete metal-rich material.
Citation
“JWST Directly Images Giant Planet Candidates Around Two Metal-Polluted White Dwarf Stars,” Susan E. Mullally et al 2024 ApJL 962 L32. doi:10.3847/2041-8213/ad2348
The post JWST Photographs Possible Giant Planets Around White Dwarfs appeared first on AAS Nova.
]]>
Stars passing within a few light-years of our solar system add an element of chaos to planetary orbits, limiting how far back we can study Earth's past orbit.
The post Passing Stars Shake Up Simulations of Earth’s Past Orbit and Climate appeared first on AAS Nova.
]]>The chaotic interactions between solar system bodies prevent us from knowing Earth’s precise orbit billions of years in the past or future. New research shows that passing stars introduce even more uncertainty, shortening the time out to which we can reliably predict Earth’s past orbit by 10%.
Uncertain Future, Uncertain Past
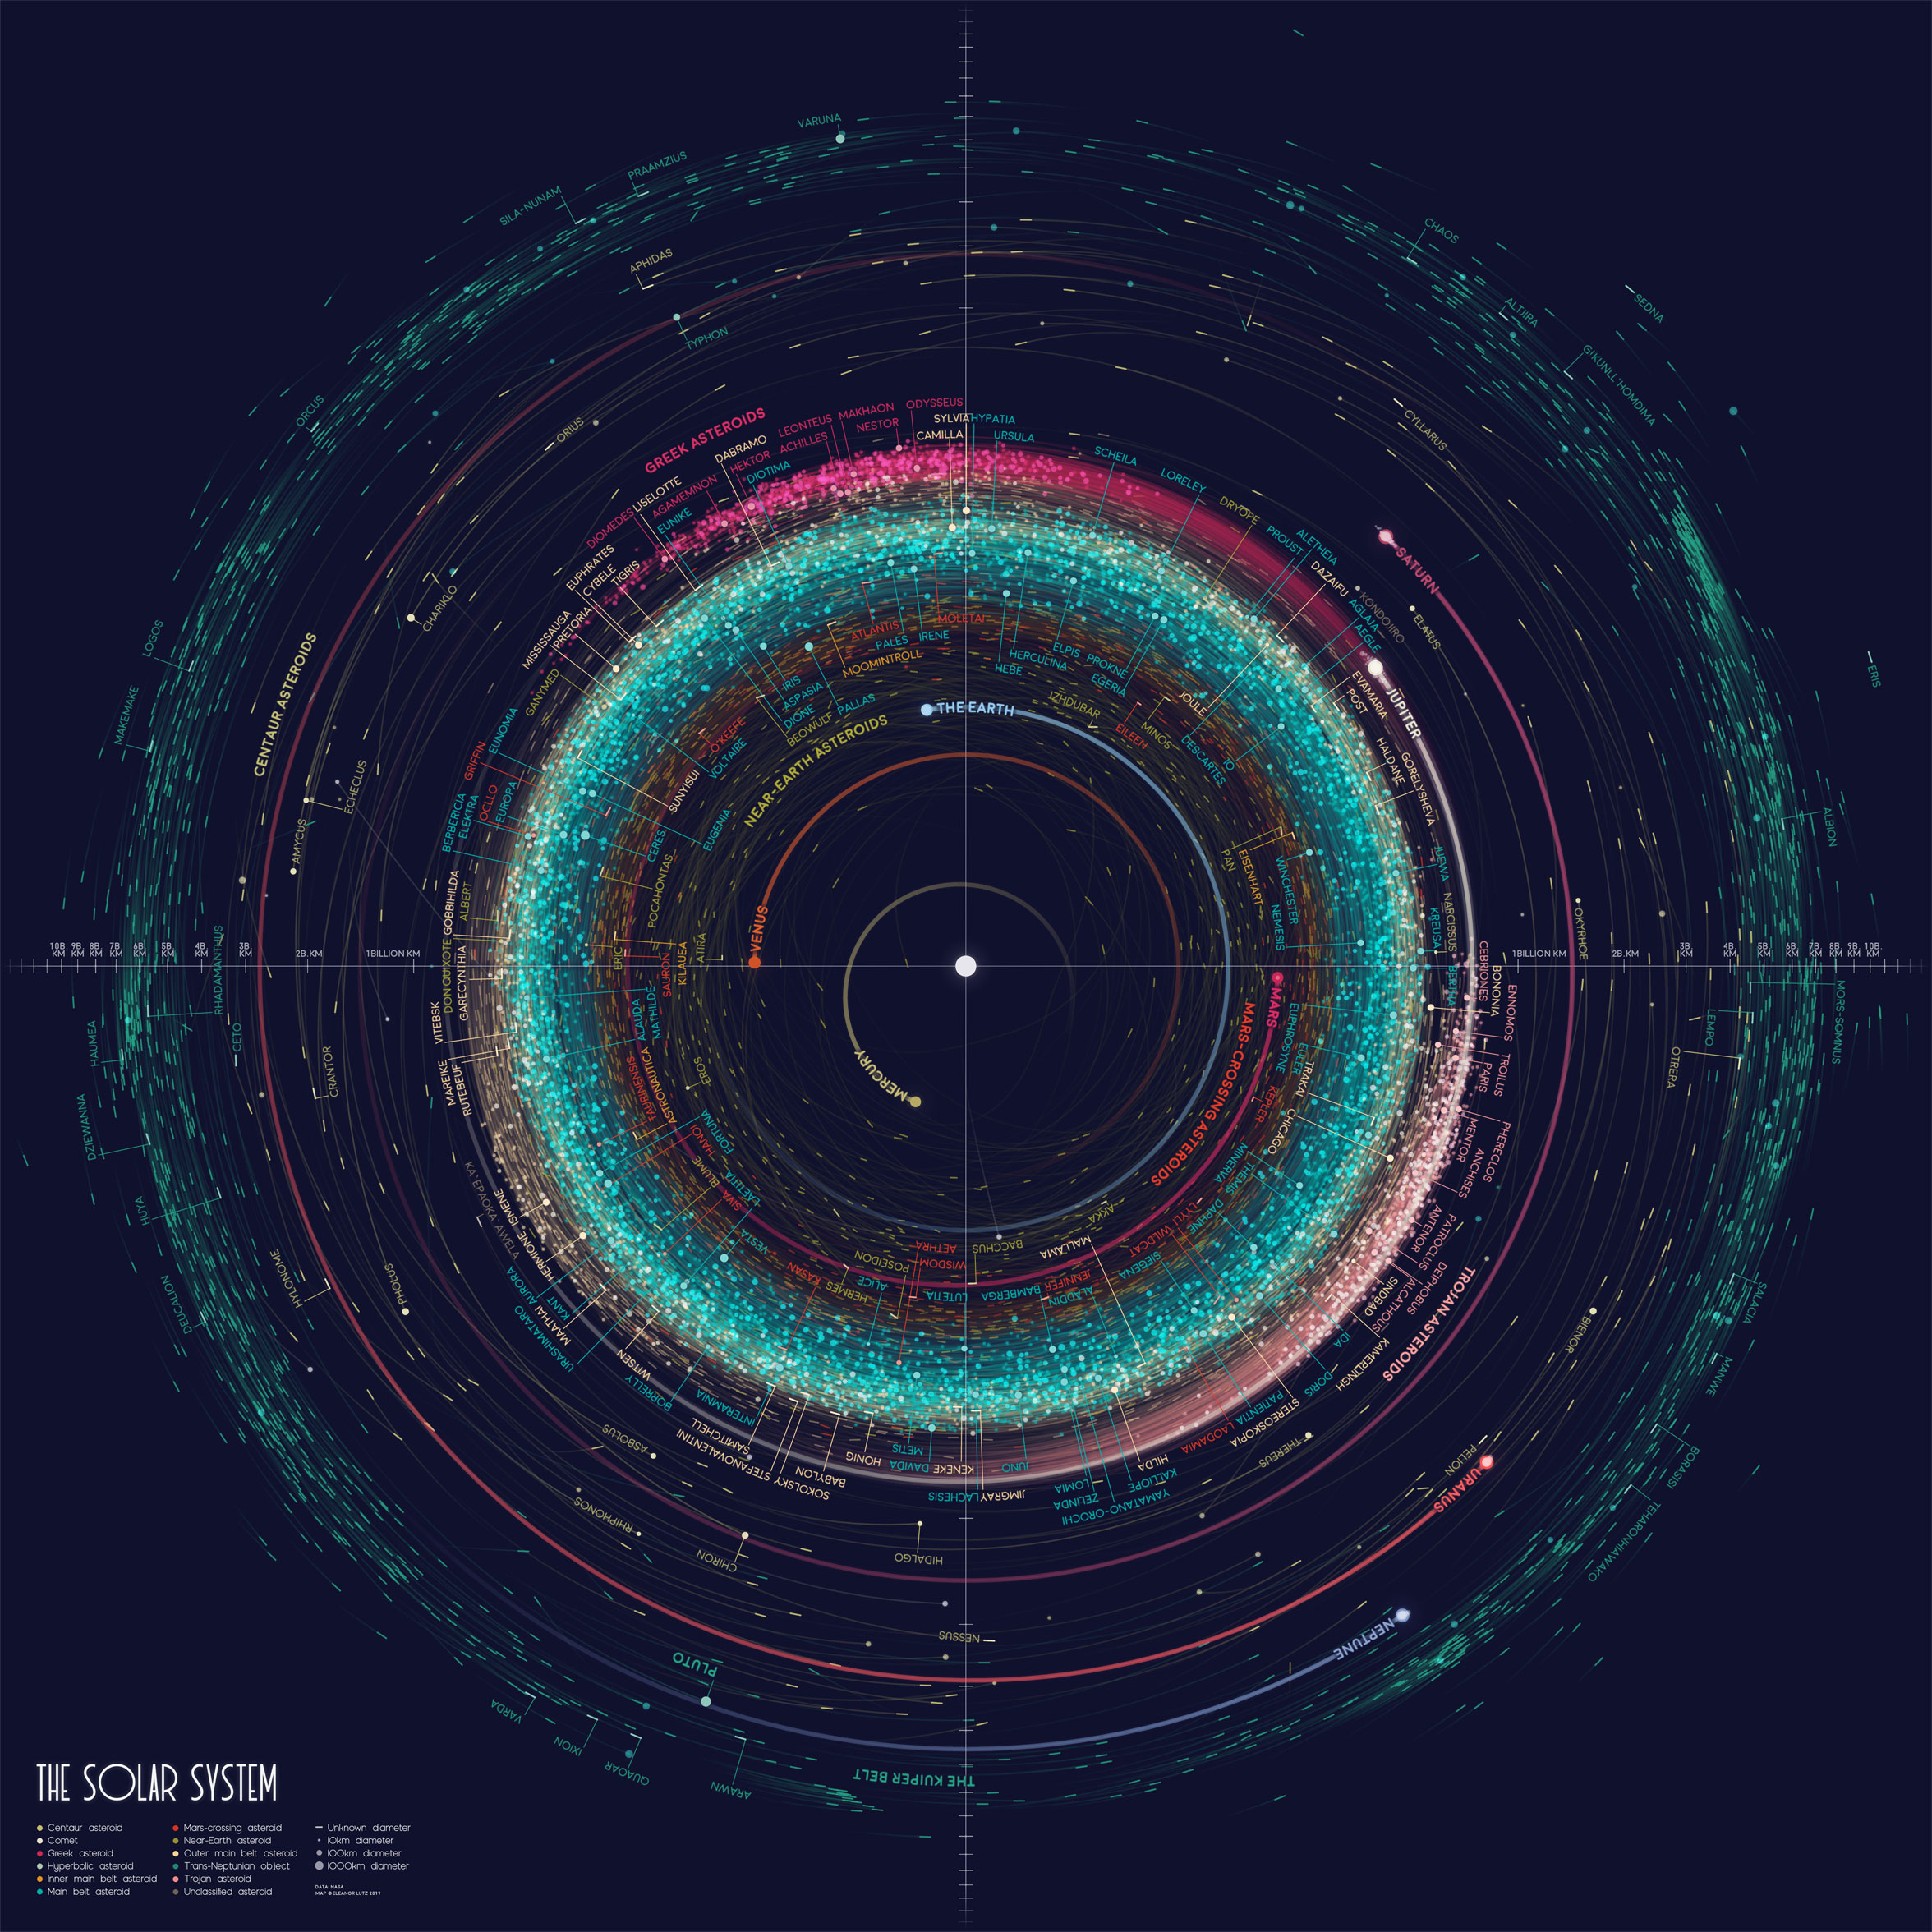
A map showing the positions of the planets and 18,000 asteroids on New Year’s Eve in 1999. Click for the high-resolution version of this image. [Eleanor Lutz; CC BY-NC-ND 4.0]
This chaotic element doesn’t just introduce uncertainty into the future behavior of the planets. It also means we can’t look infinitely far into their past motions, either. For Earth, the limit seems to lie around 60–70 million years ago, meaning that we cannot extrapolate Earth’s orbital history beyond that point. Because changes in Earth’s orbit influence our planet’s climate, researchers interpreting the ancient climate record contained in ice cores and sediment consider the behavior of Earth’s past orbit, and it’s critical for them to know how far back our orbital simulations are reliable.
Previous studies have focused on how planets and asteroids affect simulations of Earth’s past orbit. But the solar system doesn’t exist in a vacuum (metaphorically speaking) — could passing stars affect our ability to study Earth’s orbital history as well?
Chaos Caused by Passing Stars
In a research article published today, Nathan Kaib (Planetary Science Institute and University of Oklahoma) and Sean Raymond (National Centre for Scientific Research, France; University of Bordeaux) used numerical simulations to understand how passing stars impact our ability to trace back Earth’s orbit. Kaib and Raymond added a tiny amount of scatter in the positions of the planets and large asteroids and allowed the system to evolve backwards over 150 million years of simulation time.
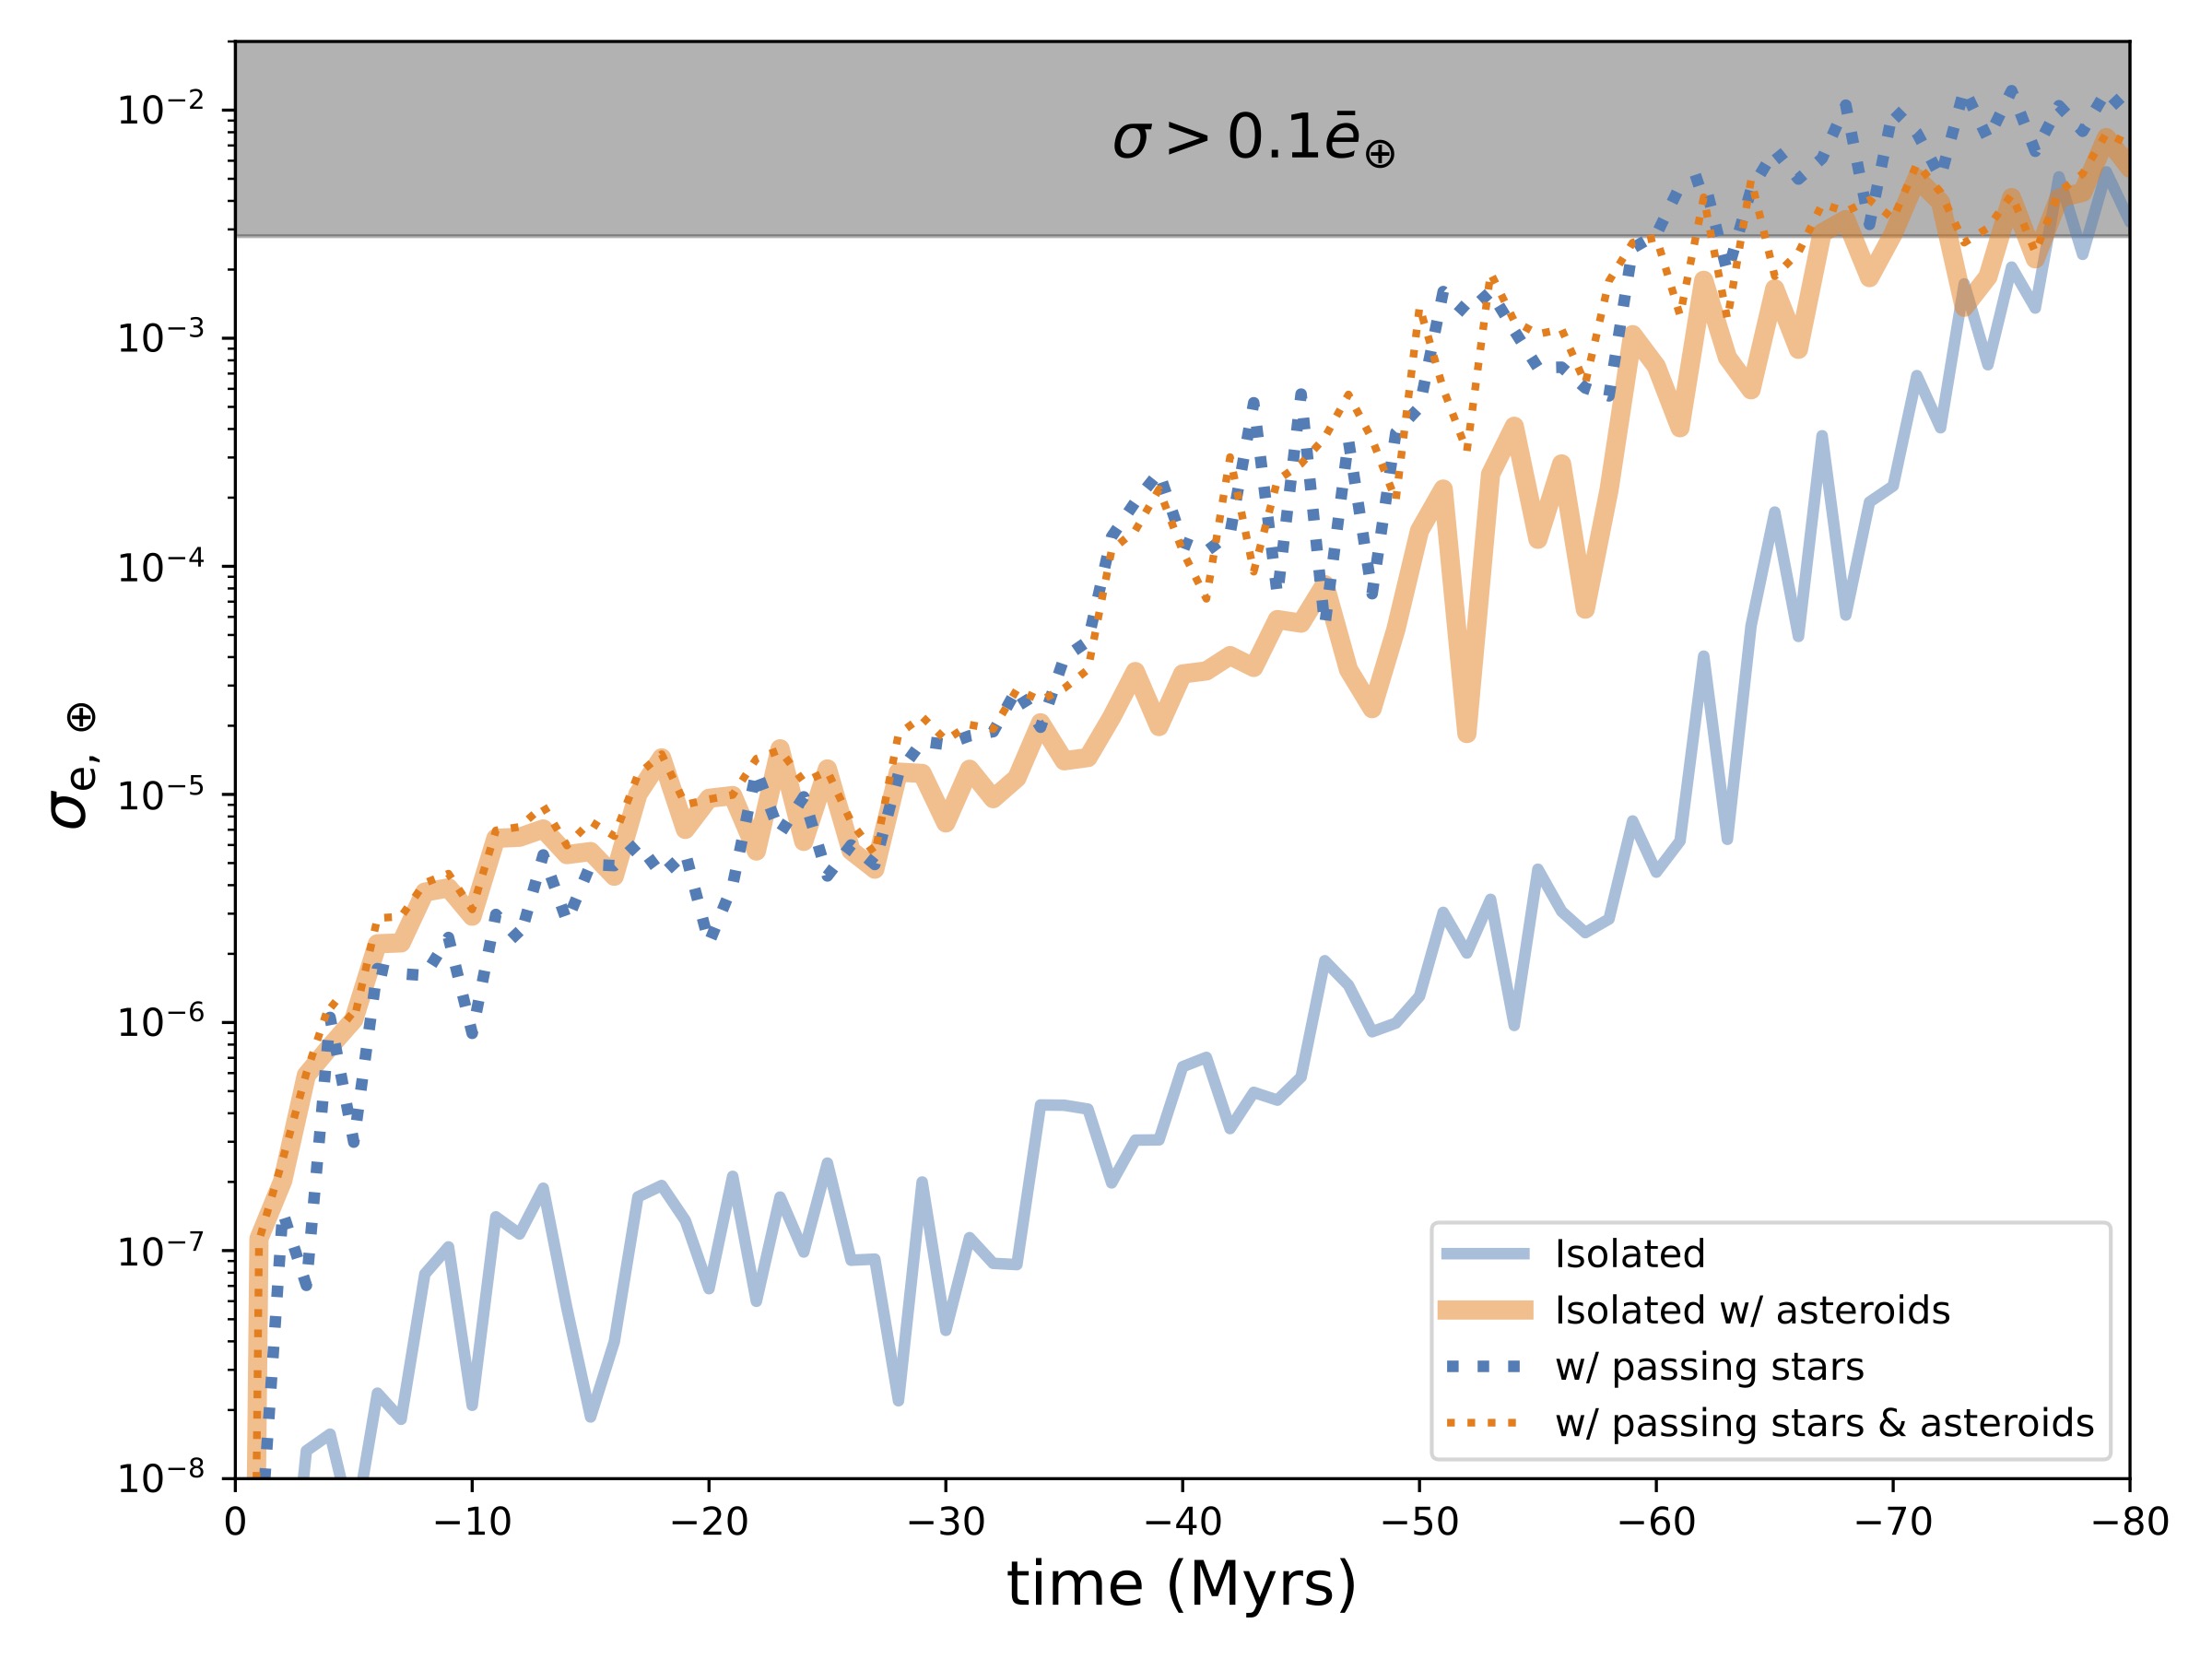
The standard deviation of Earth’s orbital eccentricity as a function of time in the past. [Kaib & Raymond 2024]
Close Encounters of the Stellar Kind
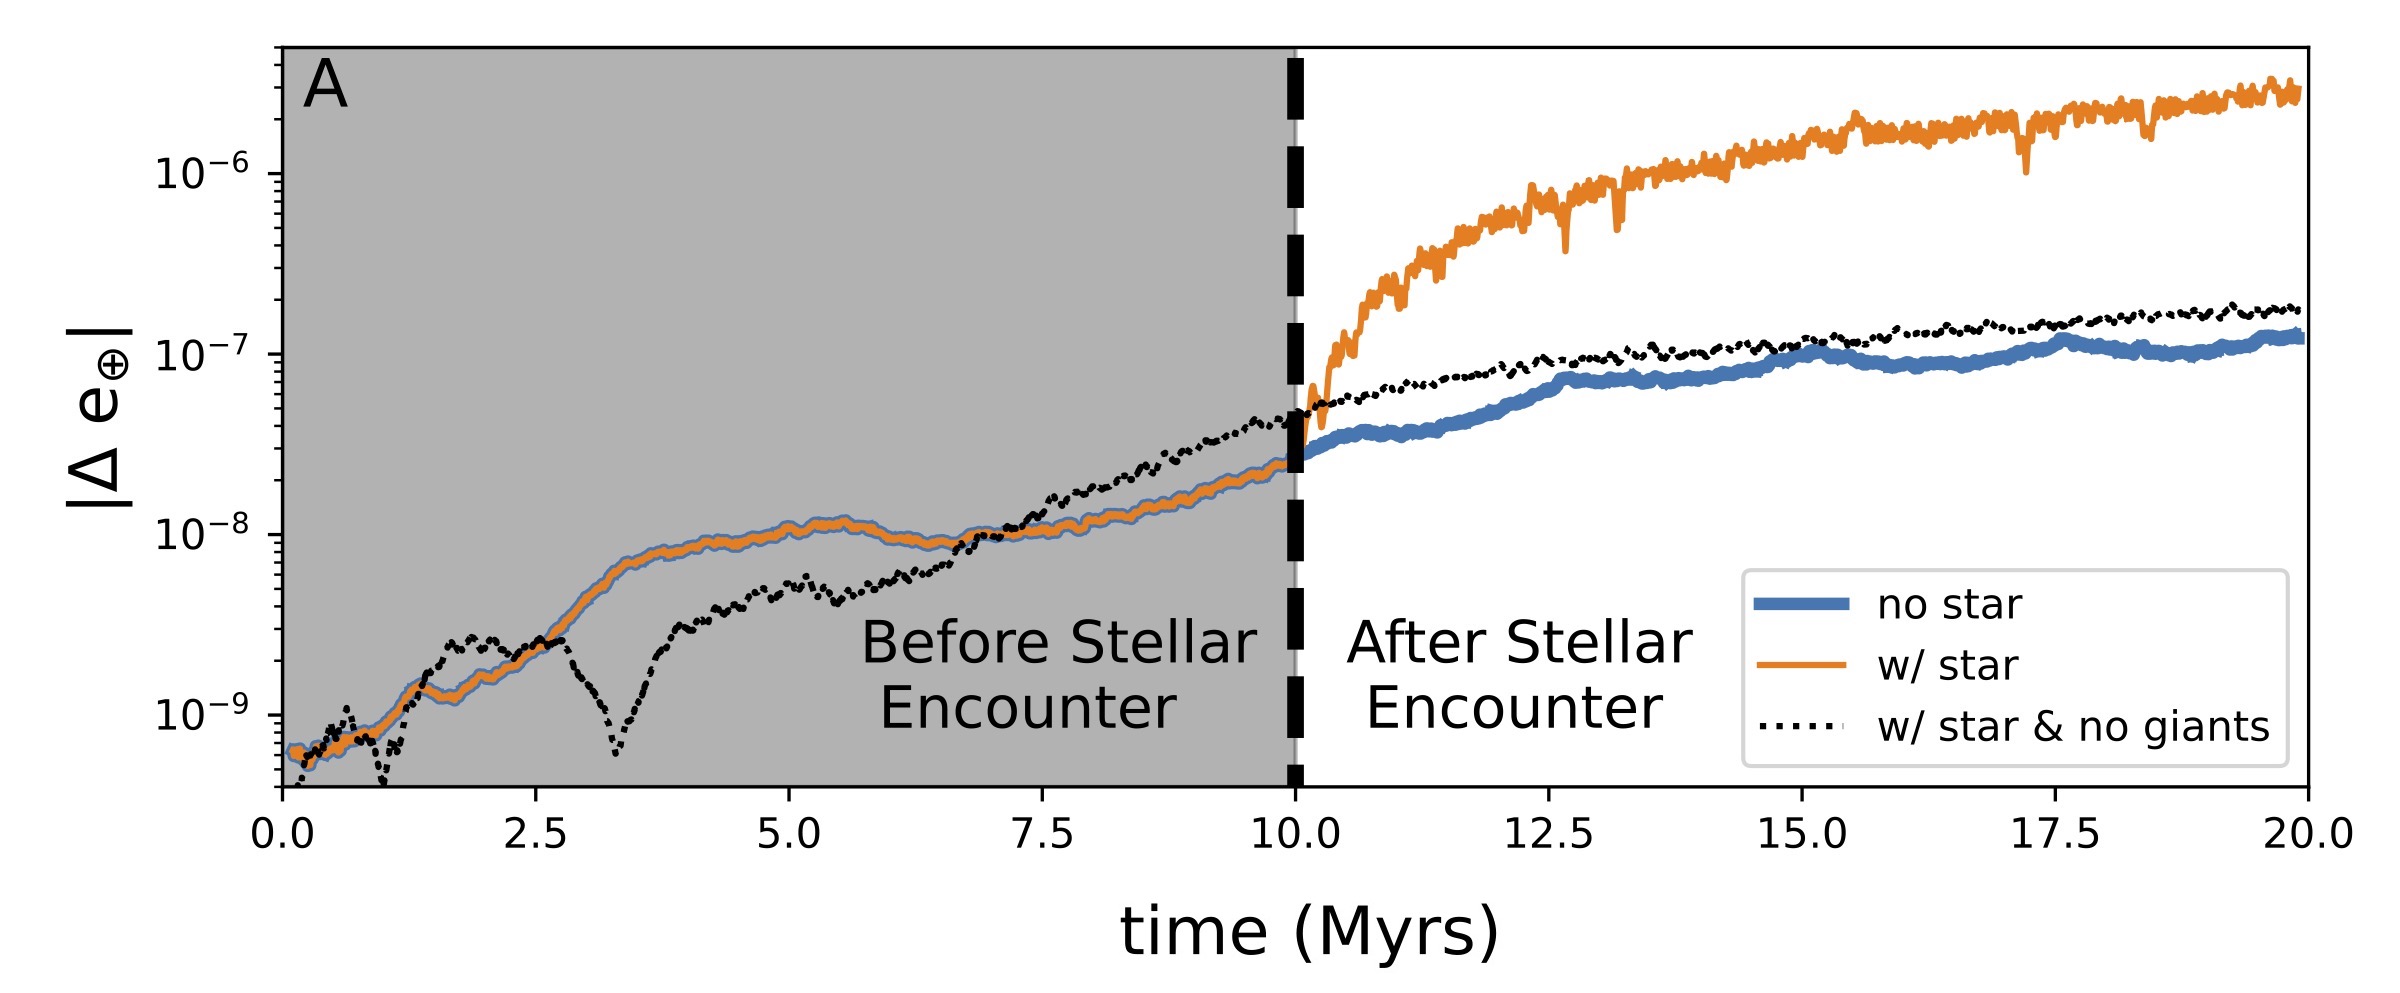
The change in Earth’s orbital eccentricity, showing the effects of an HD 7977-like encounter at a time of 10 million years. Click to enlarge. [Adapted from Kaib & Raymond 2024]
To look more closely at a specific event, Kaib and Raymond considered the star HD 7977. HD 7977 currently sits about 250 light-years away, but its trajectory suggests that it passed within about 13,200 astronomical units (au) of our solar system 2.8 million years ago, making it possibly the closest recent stellar encounter. The team showed that the star’s passage likely didn’t impact Earth’s orbit much, unless the star came as close as the data allow — there’s a 5% chance that the star came within 3,900 au.
If HD 7977 did approach the solar system so closely, the encounter may have introduced a large amount of uncertainty into simulations of Earth’s past orbit. This allows for a broader range of past orbital eccentricities, opening up new possibilities to consider for Earth’s orbital and climatic past.
Citation
“Passing Stars as an Important Driver of Paleoclimate and the Solar System’s Orbital Evolution,” Nathan A. Kaib and Sean N. Raymond 2024 ApJL 962 L28. doi:10.3847/2041-8213/ad24fb
The post Passing Stars Shake Up Simulations of Earth’s Past Orbit and Climate appeared first on AAS Nova.
]]>
Astrobites reports on using deconvolution methods to see hidden features in a JWST image of an active galactic nucleus.
The post Making Sense of Convoluted Images appeared first on AAS Nova.
]]>Editor’s Note: Astrobites is a graduate-student-run organization that digests astrophysical literature for undergraduate students. As part of the partnership between the AAS and astrobites, we occasionally repost astrobites content here at AAS Nova. We hope you enjoy this post from astrobites; the original can be viewed at astrobites.org.
Title: Deconvolution of JWST/MIRI Images: Applications to an AGN Model and GATOS Observations of NGC 5728
Authors: M. T. Leist et al.
First Author’s Institution: The University of Texas at San Antonio
Status: Published in AJ
Optical Instrumentation 101
When it comes to optical instrumentation in astronomy, one of the fundamental principles is the Rayleigh criterion for angular resolution: how far apart on the sky do two sources need to be for you to distinguish them from each other? For single-piece circular apertures — i.e., most apertures smaller than about 5 meters — the angular scale is famously defined as 1.22 λ/D, where λ is the wavelength you’re observing at and D is the diameter of your aperture. This equation comes from taking the Fourier transform (a translation from spatial information to spatial frequency information) of a circular aperture and describes how the aperture “responds” to light coming in. This response is more commonly referred to as the point spread function, in part because it describes how a point source (like most stars) looks on your detector. More specifically, what your detector sees is the convolution of the point source with the point spread function. An example of this is shown in Figure 1.

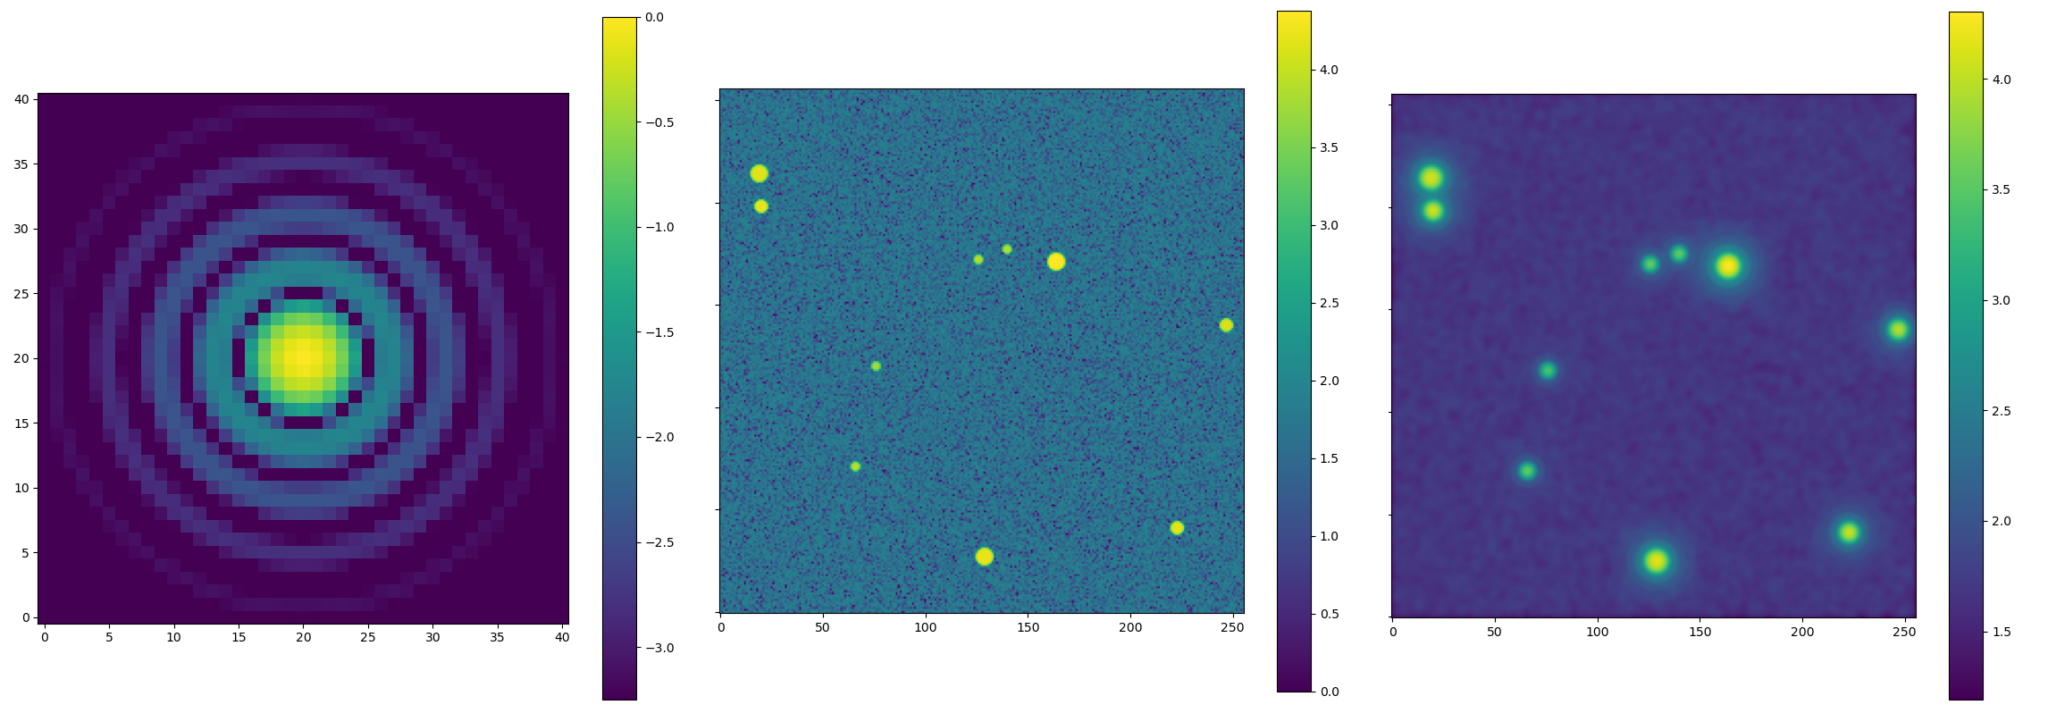
Figure 1: From left to right: 1) A point spread function for a circular aperture made from the AiryDisk2DKernel class, a part of astropy’s convolution module; 2) a fake field of stars acting as “true sources” made using the random module in numpy and the CircularAperture class in photutils; and 3) the convolution between the point spread function and the field of stars to make a model image of how a telescope might see the star field, done using the convolve function of astropy’s convolution module. This is a very simplified version of the model image building that the authors do, and you can play around with the parameters yourself here! [Ivey Davis]
Figure 2: Modeled JWST point spread functions of five different filters ranging from 5.6 microns (leftmost panel) to 21 microns (rightmost panel) made with the WebbPSF package. [Leist et al. 2024]
This Work
To figure out how effectively they can deconvolve a JWST image of an active galactic nucleus, the authors start by building a model image of what they expect the active galactic nucleus to look like to JWST’s mid-infrared imaging instrument, MIRI. This way, they’ll know what the deconvolved image is supposed to look like and can thus better evaluate the performance of the deconvolution methods.
Their active galactic nucleus model has four components: 1) The central region of the active galactic nucleus (panel 1 in Figure 3); 2) long, collimated outflows of dust originating from the poles of the central region, called polar outflows (panel 2 in Figure 3); 3) two cones of ionization, called ionization bicones, that are commonly seen in certain types of active galactic nuclei (panel 3 in Figure 3); and 4) the host galaxy of the active galactic nucleus, taken here to be the galaxy NGC 5728 (panel 4 in Figure 3). While the host galaxy and the ionization bicones can be resolved and are thus extended features, the polar outflows can only be resolved along one axis, and the central region appears only as a point source. This makes the model a really rigorous example for the effects of both the point spread function and the deconvolution processes.
Figure 3: The four components of the active galactic nucleus model used as a “real source” for the model JWST observation. [Leist et al. 2024]
Of the five deconvolution methods used, the method that improved the point spread function the most, and did so at all wavelengths, was a method called Kraken deconvolution. Not only did it improve the point spread function the most, but it also did it in the fewest number of iterations — 22 iterations at most, while all other methods required between 29 and 105 iterations. Despite the quality of Kraken’s performance, it was not able to make the polar outflow component detectable. Regardless, the method showed true improvement in image quality and so was used to deconvolve a real JWST observation of NGC 5728 that was collected as a part of the Galactic Activity, Torus, and Outflow Survey (GATOS).
The original JWST image of NGC 5728 and the results of running the Kraken deconvolution method are shown in Figure 4. The Kraken method deconvolved the JWST image both in a similar number of iterations as well as to a similar quality as it had for the mock observation, meaning the results are consistent with expectations! The results also reveal extended structure to the south east of the central region, as shown in Figure 4. Although this feature had been observed in 2019 with other instruments, it would be undetectable in JWST images without the deconvolution technique.
Figure 4: The JWST observation of NGC 5728 as observed by the MIRI instrument (left) and the result of deconvolving the image using the Kraken method (right). Although the outflow is indistinguishable in the original JWST image, it is readily observed to the bottom left of the central region in the deconvolved image. [Leist et al. 2024]
Original astrobite edited by Isabella Trierweiler.
About the author, Ivey Davis:
I’m a fourth-year astrophysics grad student working on the radio and optical instrumentation and science for studying magnetic activity on stars. When I’m not crying over radio-frequency interference, I’m usually baking, knitting, harassing my cat, or playing the banjo!
The post Making Sense of Convoluted Images appeared first on AAS Nova.
]]>
New research investigates how ice might alter lunar soil and create fine particles in permanently shadowed lunar craters.
The post Water-Ice Weathering in Permanently Shadowed Craters on the Moon appeared first on AAS Nova.
]]>On Earth, rocks and soil are weathered by wind and water, but what weathers surfaces on the Moon? New research investigates how ice might alter lunar soil in permanently shadowed lunar craters.
The Importance of Lunar Soil
Photograph of the sunlit rim of Shackleton crater, a crater at the Moon’s south pole. The interior of this crater never receives direct sunlight. [NASA/GSFC/Arizona State University]
NASA’s upcoming Artemis missions will bring astronauts to the lunar south pole, which is dotted with steep-sided craters that lie in permanent shadow. Because some of these craters are thought to harbor water ice, it’s important to know if the ice is likely to weather the lunar surface material, creating an abundance of harmful and irritating fines.
A Lunar Experiment on Earth
Autumn Shackelford (University of Central Florida) and collaborators examined how lunar regolith might be weathered by water ice. If a tiny bit of liquid water seeps into fine cracks in lunar surface particles, the expansion of the water as it freezes will widen the cracks. The mechanical stress caused by this expansion may cause the crack system to grow, potentially reshaping the particle.
An image of a sample that contained 30% water by weight and was frozen for 6 months. The numbering and outlines reflect the counting and characterization of individual particles and clumps of particles. Click to enlarge. [Shackelford et al. 2024]
The team varied the amount of water added to the samples from no water — the control samples — to 30% water by weight, and left the samples in a freezer for 1, 3, or 6 months. After the samples finished hibernating, the team characterized the size and shape of the particles, counted the number of fine particles, and took spectra to search for possible spectral changes.
Water Weathering
The number of fines per particle, as a function of time spent in the freezer, amount of water, and type of particle. Click to enlarge. [Shackelford et al. 2024]
With humans potentially exploring lunar regions where water ice lingers in shadowy craters, this work provides an important first look at how ice plays a role in producing fine particles. Future astronauts, take heed!
Citation
“Morphological and Spectral Characterization of Lunar Regolith Breakdown Due to Water Ice,” A. Shackelford et al 2024 Planet. Sci. J. 5 1. doi:10.3847/PSJ/ad0041
The post Water-Ice Weathering in Permanently Shadowed Craters on the Moon appeared first on AAS Nova.
]]>
Researchers explore whether the choice of initial magnetic field impacts the outcome for models of the solar corona.
The post How Important Are Initial Conditions in Models of the Solar Corona? appeared first on AAS Nova.
]]>Many models of the Sun’s upper atmosphere, or corona, use magnetohydrodynamics, in which collections of particles are assumed to behave like an electrically conducting fluid. A recent research article explores how sensitive magnetohydrodynamics models are to the conditions they start with.
A Powerful Modeling Tool
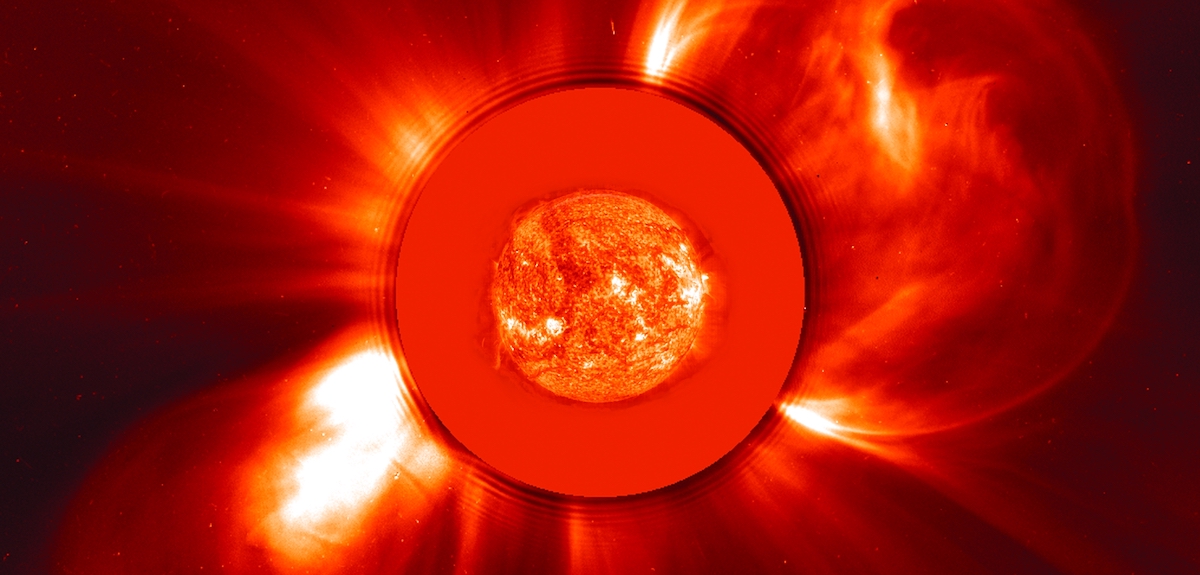
Two coronal mass ejections launched from the Sun in November 2000, as seen by the Solar and Heliospheric Observatory. [ESA/NASA/SOHO]
With so many ways to implement these models, it’s worth taking the time to consider how choices of model parameters affect the outcome. In other words, how much does what you get out depend on what you put in?
Testing Model Memory
To begin to address this question, Graham Barnes (NorthWest Research Associates) and collaborators studied the impact of initial conditions on magnetohydrodynamics simulations of the solar corona driven by electric fields. Just as the term suggests, initial conditions refer to the state of the model just before the modelers press go. For example, modelers might define the initial strength and direction of magnetic and electric fields and the density, temperature, and motion of the particles.
After a simulation begins, it will often undergo an adjustment period in which the initial quantities “relax” into a steady state. Once this steady state is reached, the model can be “driven,” such as by applying a force to the base of the corona, to study how the system changes over time. Barnes’s team sought to understand whether a model’s “memory” of the initial conditions persists through this relaxation phase. If the initial conditions are washed out during the relaxation phase, that means that any reasonable choice of parameters will do — but if the models retain a clear memory, researchers must choose their initial conditions more carefully.
Relating Relaxed Output to Initial Input
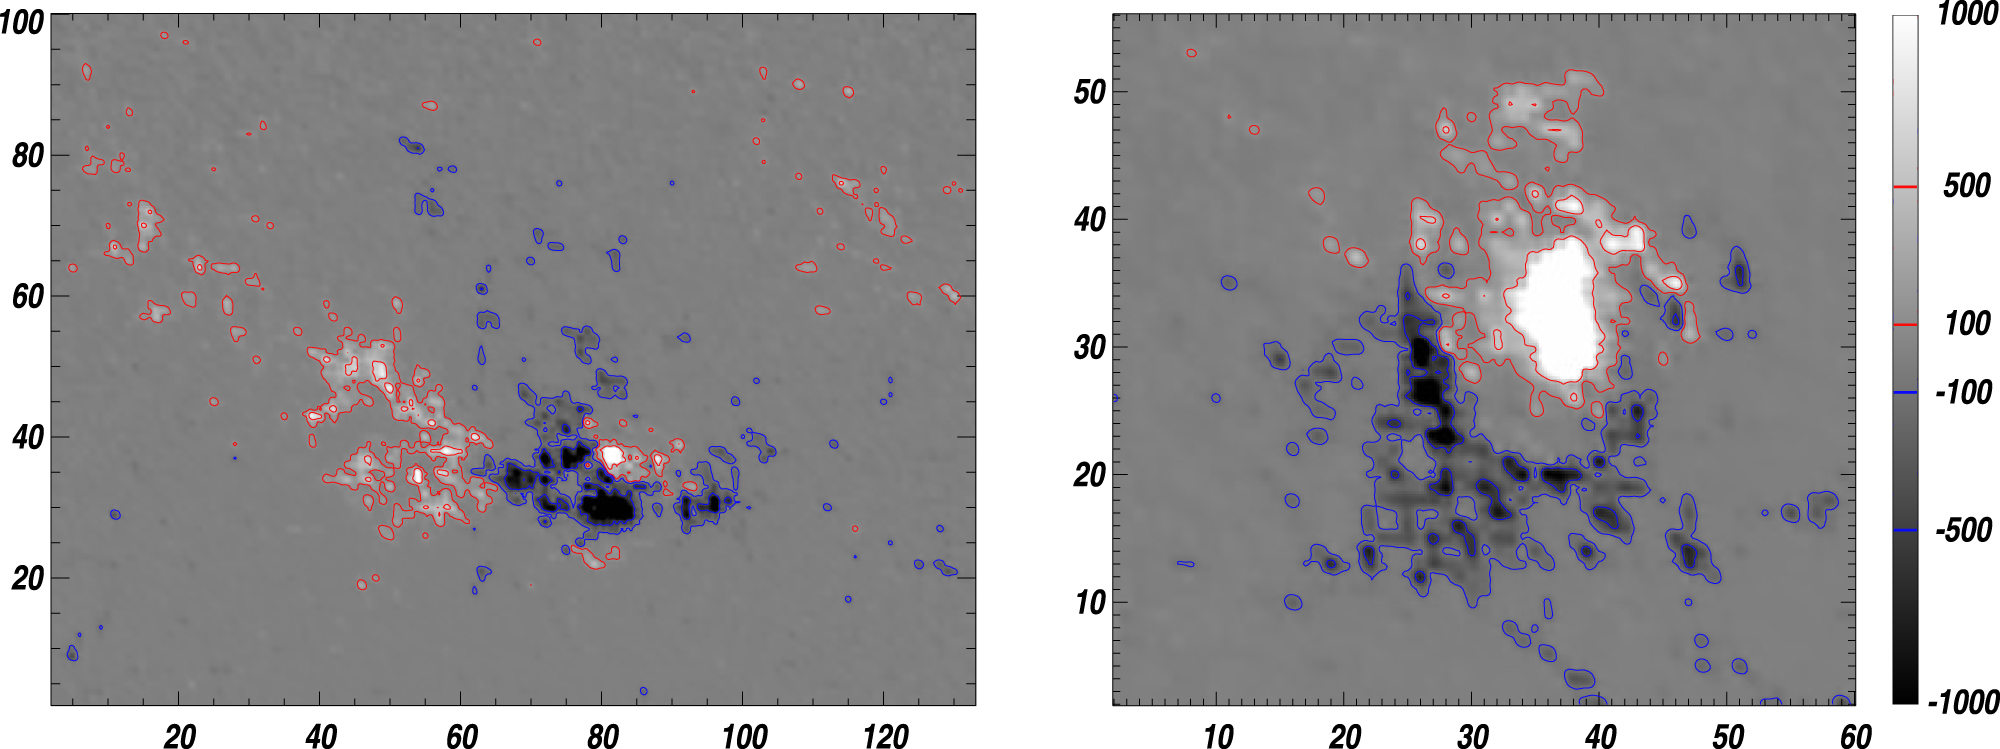
The two active regions used in this study. The greyscale shows the strength of the vertical component of the magnetic field. Click to enlarge. [Barnes et al. 2024]
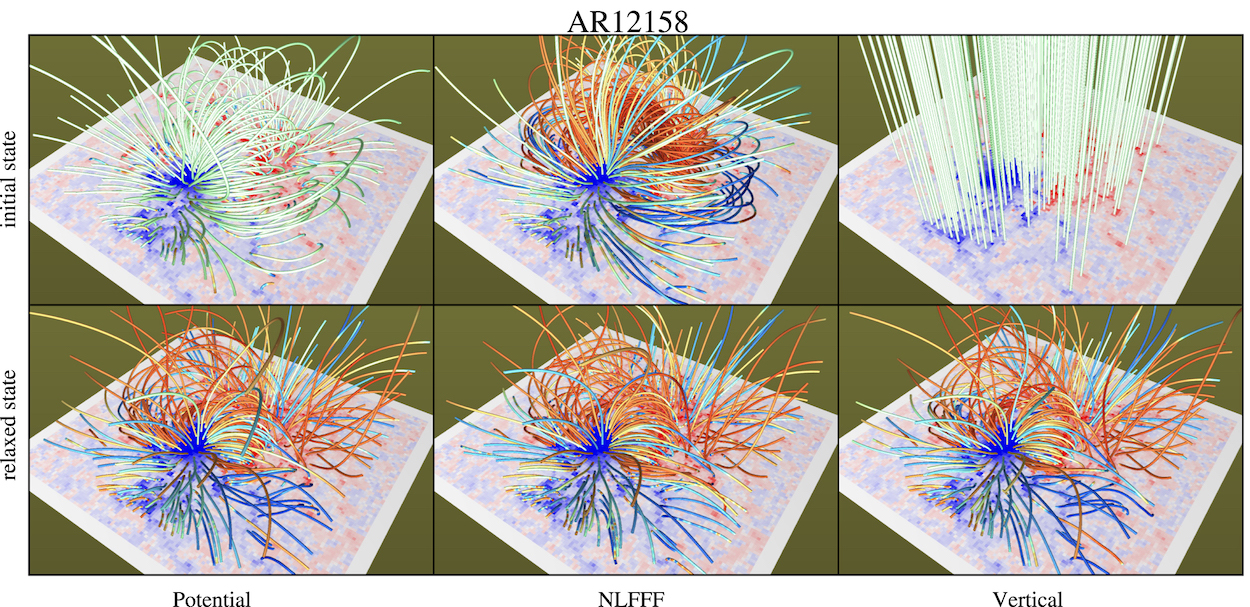
Initial conditions (top row) and relaxed state (bottom row) for the modeled magnetic field of one of the active regions. This shows that the relaxed state is largely insensitive to the initial state when comparing potential field, nonlinear force-free field, and vertical field initial conditions. Click to enlarge. [Adapted from Barnes et al. 2024]
With models appearing to lack a clear memory of the conditions they started with, this work suggests that any reasonable initial magnetic field can be used for electric-field-driven models. More work is needed to understand if this result holds for other types of magnetohydrodynamics models, such as velocity-driven models.
Citation
“Are Electric-Field-Driven Magnetohydrodynamic Simulations of the Solar Corona Sensitive to the Initial Condition?” Graham Barnes et al 2024 ApJ 960 102. doi:10.3847/1538-4357/ad10a7
The post How Important Are Initial Conditions in Models of the Solar Corona? appeared first on AAS Nova.
]]>
Researchers quantified the impact of artificial lighting on sites across Chile for the first time, showing that we must actively preserve dark skies in remote areas and urban corridors alike.
The post Even Dark Sky Sites Aren’t Immune to Light Pollution appeared first on AAS Nova.
]]>Chile’s Coquimbo region is renowned for its starry skies and is home to some of astronomy’s most powerful and productive telescopes. In a recent article, researchers quantified the impact of artificial lighting on sites across the Coquimbo region for the first time and showed that we must actively preserve dark skies in remote areas and urban corridors alike.
Measuring the Impact of Light Pollution
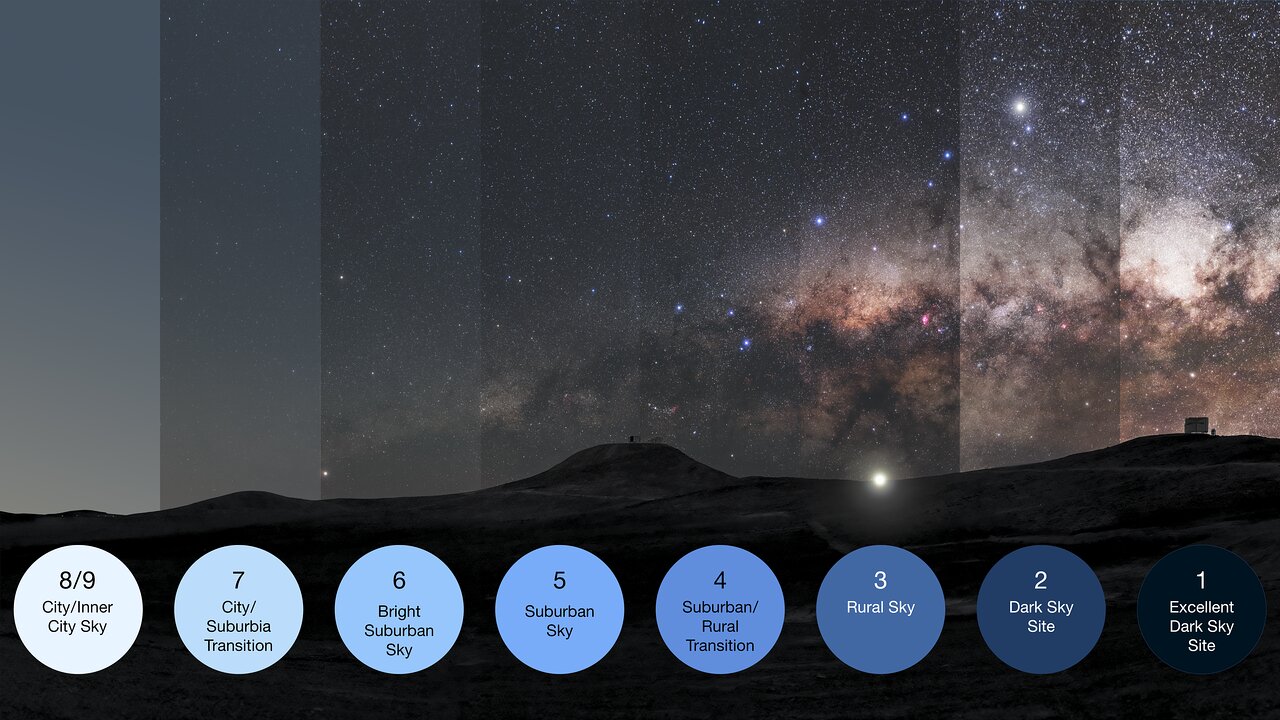
An illustration of the Bortle scale value, which describes the degree of light pollution experienced in different settings. Click to enlarge. [ESO/P. Horálek, M. Wallner; CC BY 4.0]
While city dwellers might make do with a dwindling number of visible stars, professional astronomical observatories rely on exquisitely dark skies. To understand the impact of light pollution on professional observatories as well as cities, Rodolfo Angeloni (Gemini Observatory) and collaborators assessed the degree of light pollution at four sites across Chile’s Coquimbo region: 1) Fray Jorge National Park, a certified Starlight Reserve; 2) Las Campanas Observatory, a professional astronomical observatory atop a mountain in the Atacama Desert; 3) Collowara Astrotourism Observatory, located near a city of 11,000 people; and 4) La Serena, a city of 450,000 people.
Angeloni’s team used ground-based all-sky imaging sensors to measure the brightness of the night sky at these locations on cloudless, moonless nights. By comparing the all-sky images to models of sky brightness and cross-referencing them with the positions of artificial light sources as seen from space, the team estimated the contribution of artificial light to the night sky brightness in each area.
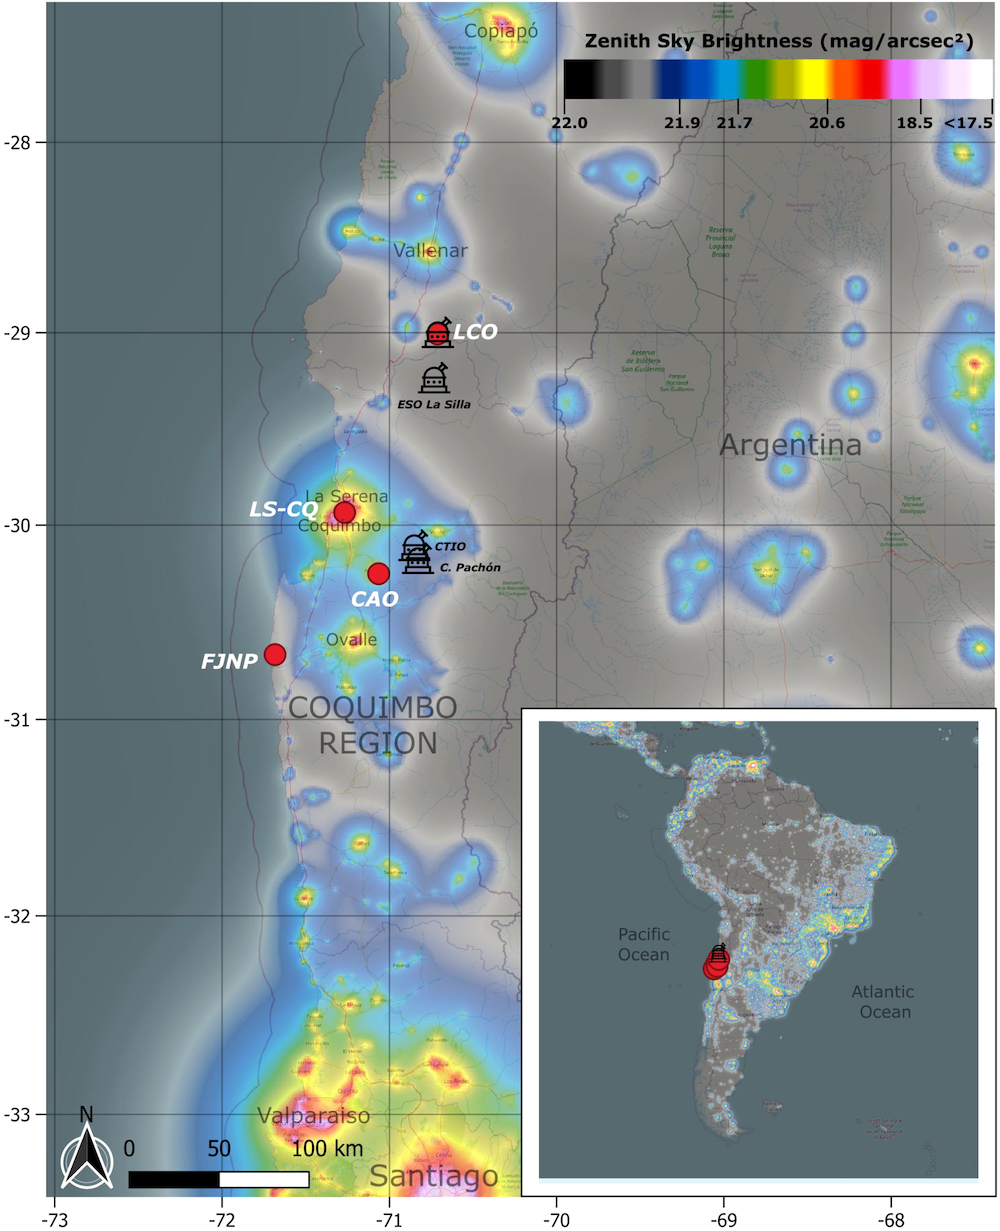
Locations of Las Campanas Observatory (LCO), La Serena (LA-CQ), Collowara Astrotourism Observatory (CAO), and Fray Jorge National Park (FJNP) on a map of artificial night sky brightness. Click to enlarge. [Angeloni et al. 2024]
From Light to Dark
The measurements confirmed that Fray Jorge National Park is an exceptional dark sky site, with just 4% of the night sky brightness coming from artificial lights. (Scattered starlight, scattered sunlight, and airglow are natural sources of night sky brightness.) Fray Jorge National Park is one of the darkest measured sites in the world, and this study highlights the immediate need to protect this site from light pollution.
At Las Campanas Observatory, the future home of the 25-meter Giant Magellan Telescope, artificial lights contributed about 11% of the observed sky brightness, with the largest contributions coming from the cities of La Serena and Vallenar (117 and 49 kilometers away, respectively). Luckily, the impact of light pollution on the observatory is currently small, but the growth of nearby cities and the ongoing Pan-American Highway project could brighten the skies at Las Campanas.
Collowara Astrotourism Observatory, situated near the 11,000-person city of Andacollo, has artificial sky brightness comparable to that of Flagstaff, AZ, a much larger city. Another way of looking at this finding is that Flagstaff, named the world’s first Dark Sky Community in 2001, has night sky brightness comparable to that of a much smaller city — in other words, active efforts to reduce light pollution work, and cities worldwide can take proven steps to address the issue.
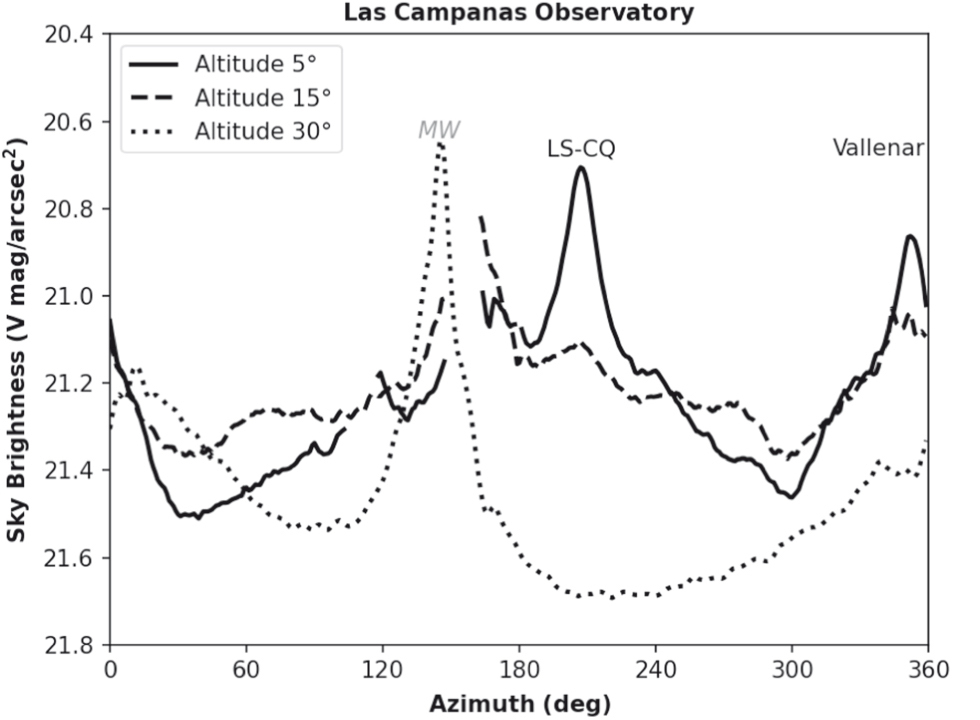
The sky brightness surrounding Las Campanas Observatory, with the major sources of natural and artificial sky brightness labeled. The Milky Way (MW) dominates at about 150 degrees, with La Serena (LS-CQ) just slightly less bright but extending to a lower altitude. The city of Vallenar is also a source of sky brightness. [Angeloni et al. 2024]
Bonus
Check out the video below to see a time-lapse of the night sky conditions at Collowara Astrotourism Observatory.
Citation
“Toward a Spectrophotometric Characterization of the Chilean Night Sky. A First Quantitative Assessment of ALAN Across the Coquimbo Region,” Rodolfo Angeloni et al 2024 AJ 167 67. doi:10.3847/1538-3881/ad165c
The post Even Dark Sky Sites Aren’t Immune to Light Pollution appeared first on AAS Nova.
]]>
Astrobites reports on the exciting goings-on around the sloshing center of the galaxy cluster Abell 2495.
The post Sloshing in the Universe’s Biggest Bathtub appeared first on AAS Nova.
]]>Editor’s Note: Astrobites is a graduate-student-run organization that digests astrophysical literature for undergraduate students. As part of the partnership between the AAS and astrobites, we occasionally repost astrobites content here at AAS Nova. We hope you enjoy this post from astrobites; the original can be viewed at astrobites.org.
Title: Deep Chandra Observations of Abell 2495: A Possible Sloshing-Regulated Feedback Cycle in a Triple-Offset Galaxy Cluster
Authors: Luca Rosignoli et al.
First Author’s Institution: University of Bologna and National Institute for Astrophysics, Italy
Status: Published in ApJ
Galaxy clusters are the biggest gravitationally bound objects in the universe. They have three main components: galaxies, their surrounding dark matter halos, and hot gas between the galaxies known as the intracluster medium. It’s the interaction between these components that makes galaxy clusters so interesting, and also (we think) significantly affects galaxy formation and evolution as a whole. As an example of this interaction, many galaxy clusters have a supermassive black hole inside their central galaxy (known as the brightest cluster galaxy) that’s acting as an active galactic nucleus — it’s being fed so much material by the galaxy and the cluster that it can’t contain it all, and it’s spitting material and energy back out into the cluster.
Thanks to gravity, each of these three components in a galaxy cluster should be centered on the same point in space — the dark matter forms a kind of gravitational “pit” that both the intracluster medium and the galaxies themselves can’t help but be pulled into. Other forms of energy (like heat keeping the intracluster medium puffed out, or leftover kinetic energy keeping the galaxies orbiting) prevent the intracluster medium and galaxies from collapsing entirely into the center of the pit, but they’re still definitely centered on where the pit is deepest. It’s very interesting, therefore, when the mass centers in galaxy clusters aren’t fully lined up. In today’s article, the authors explore one of these cases.
A Misaligned Galaxy Cluster
The cluster explored in this study, called Abell 2495, has been known about for a long time — it was discovered in 1998 through an X-ray search for clusters using the ROSAT satellite. Since then, a wide variety of data have been collected about this cluster at many different wavelengths that trace different components of the cluster. The data that are most relevant here are radio data from the Very Large Array at a frequency of 5 gigahertz (tracing activity from the active galactic nucleus inside the central brightest cluster galaxy) and optical images (showing the positions of the galaxies in the cluster) from the Hubble Space Telescope.
In addition to the ROSAT observations used to discover the galaxy cluster, there were also Chandra X-ray Observatory data of Abell 2495. However, the observations from both telescopes had very low sensitivity, making it difficult to distinguish any features in the X-ray-emitting gas. The authors present six new deep Chandra observations in this article, vastly improving the sensitivity of the X-ray observations (which trace the hot gas of the intracluster medium). Figure 1 combines several of these different types of observations, plotting them together as contours. X’s mark the various centers of the galaxy cluster components.
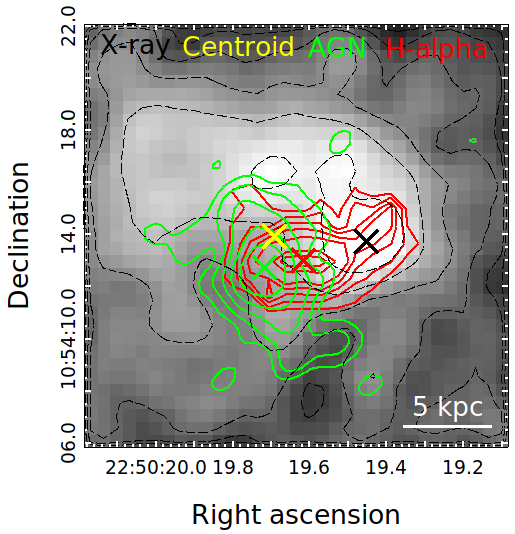
Figure 1: Multiwavelength observations of the galaxy cluster Abell 2495. The greyscale (and black contours) shows the X-ray emission from the hot gas in the galaxy cluster, the red contours show hydrogen gas (Hα), and the green contours show radio emission coming from the supermassive black hole inside the cluster’s central galaxy. The X’s show the center of the cluster determined in different ways: the black X is the center of the X-ray emission, the red X is the center of the Hα emission, the yellow X is the center of mass of the cluster (determined using the positions of the individual cluster galaxies), and the green X is the center of the brightest cluster galaxy. [Rosignoli et al. 2024]
A Gassy History
In order to understand why the galaxy cluster isn’t centered properly, we need to look back at the history of its movements. Luckily, there’s an easy way to do that — the X-ray light, which traces the intracluster medium, contains signatures of any strange happenings in the cluster’s recent history. This is because the intracluster medium is normally smooth and symmetric, but it takes a while to settle after disturbances. The authors’ new Chandra observations are thus perfect for finding out what’s going on in Abell 2495.
Some of the more interesting features the authors found in the X-ray observations are shown in Figure 2. The four cavities (the dark regions in Figure 2a) are indicators that the active galactic nucleus inside Abell 2495’s brightest cluster galaxy had periods in the past where it was extra active, emitting enough energy to blast holes in the intracluster medium. What’s particularly interesting is how some of these cavities line up with the current position of the emission from that active galactic nucleus (shown with the blue contours). The authors also found a significant density jump on one side of the intracluster medium (the light region in Figure 2b), suggesting that some force has piled up the gas on one side of the cluster in a dense cold front.
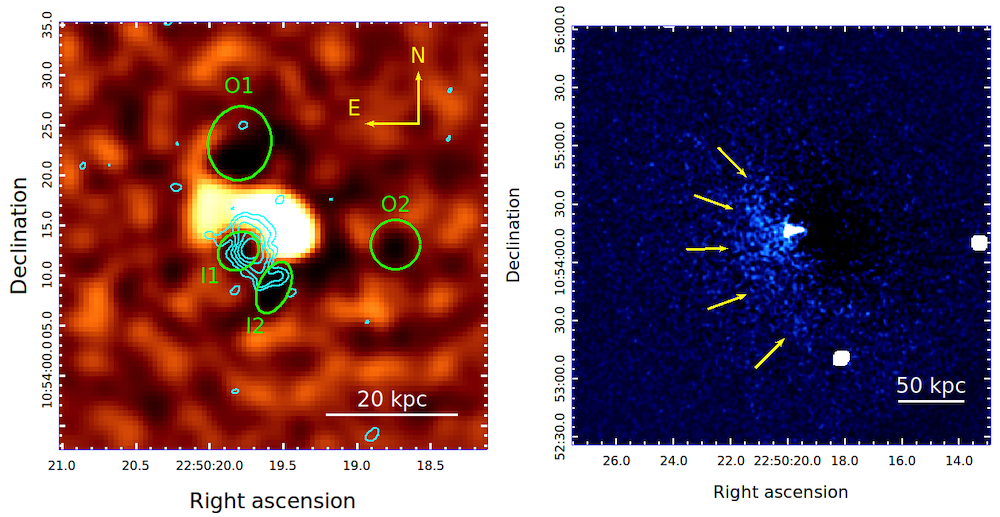
Figure 2: Interesting features in the X-ray observations of Abell 2495. In the left panel, the four cavities discovered by the authors are circled in green. These are areas of the otherwise smooth intracluster medium where very little material is present. In the right panel, a fitted profile of the intracluster medium has been removed, showing a large asymmetry with a significant jump — a “cold front.” [Adapted from Rosignoli et al. 2024]
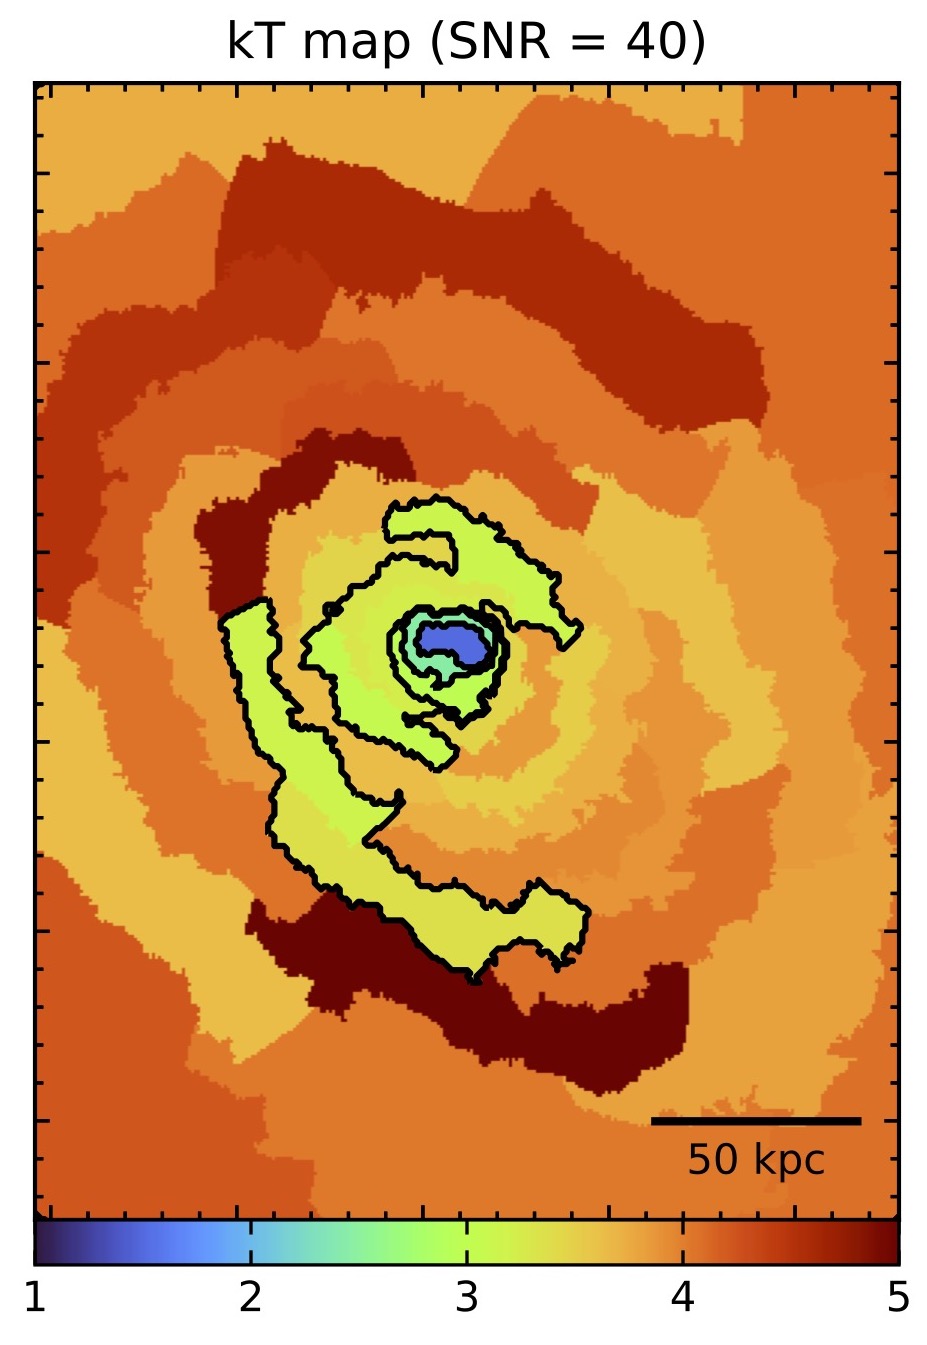
Figure 3: A binned temperature map of the intracluster medium inside Abell 2495, measured using the X-ray emission. The regions outlined in black are cold enough to condense significantly in a reasonable timescale. [Adapted from Rosignoli et al. 2024]
The Cosmic Bathtub
The authors of this article believe that all of this evidence points to one very interesting phenomenon: the galaxy cluster is sloshing. This is a phenomenon that’s appeared widely in simulations and has also been observed several times. It happens when some gravitational disturbance, typically a small “sub-cluster” of galaxies, passes by the cluster. This disturbance pulls both the dark matter and the intracluster medium in its direction. The dark matter can pass right through anything in its way, but the intracluster medium of the sub-cluster collides with the other intracluster medium of the other cluster, creating cold fronts, and so the two components get separated. This results in offsets between the centers, just like the ones observed in Abell 2495! As the disturbance passes, the dark matter and intracluster medium fall back towards the center of the cluster, setting up an oscillation just like water sloshing in a bathtub.
The Scientific Relevance of Baths
The reason why sloshing is so fascinating is because it could be regulating active galactic nucleus feedback. Normally, galaxy clusters act out the feedback cycle described in the introduction — the intracluster medium cools and collapses onto the active galactic nucleus, which in turn gets extra active and heats the intracluster medium back up again. In this case, however, the authors believe that the sloshing in this galaxy cluster is driving the whole feedback cycle. There is some quantitative evidence for this — the time the cluster takes to slosh is fairly consistent with the time between the formation of the different cavities in the intracluster medium, and the size of the X-ray cavities is consistent with the amount of energy that would be involved. If this is the case, sloshing could drive the whole life cycle of the cluster.
Sloshing Towards the Future
The authors have done a lot of analysis to come up with these findings, but there are some limitations in the data that mean significant uncertainties remain. Better X-ray data could uncover more details about the X-ray cavities, helping to narrow down when they were formed and how much energy was required to create them. A clearer picture of the cold front would allow the intracluster medium in the cluster center to be examined in more detail. It would also be helpful to get a larger sample of clusters with active galactic nucleus feedback potentially regulated by sloshing to understand if this is a common process, or if Abell 2495 is unique. Either way, this is a fascinating addition to our picture of one of the most extreme places in the universe — the center of a galaxy cluster.
Original astrobite edited by Lina Kimmig.
About the author, Delaney Dunne:
I’m a PhD student at Caltech, where I study how galaxies form and evolve by mapping their molecular gas! I do this using COMAP, a radio-frequency line intensity mapping experiment based in California’s Owens Valley.
The post Sloshing in the Universe’s Biggest Bathtub appeared first on AAS Nova.
]]>
How far do we need to be from a kilonova to be safe from the explosion's X-rays, gamma rays, and cosmic rays?
The post Featured Image: How Close Is Too Close to a Kilonova? appeared first on AAS Nova.
]]>The image above shows the radiation and particles generated by a kilonova, the explosion produced when the remnants of two massive stars collide. Kilonovae made headlines in 2017, when scientists observed gravitational waves and a kilonova from colliding neutron stars for the first time. Recently, a research team led by Haille Perkins (University of Illinois Urbana-Champaign) used information gleaned from the 2017 event to estimate the threat posed by a kilonova’s X-rays, gamma rays, and cosmic rays. Fortunately for us, a kilonova would have to be quite close for life on Earth to be endangered by its X-rays or gamma rays — within about 3 light-years for X-rays or 13 light-years for gamma rays. Even after the initial glow of the collision fades, though, there’s still danger: high-energy charged particles called cosmic rays pose a threat years after the dangerous radiation has passed, and a kilonova’s cosmic rays can be lethal out to 36 light-years away. Luckily, kilonovae are extremely rare, and the danger to life on Earth is minimal. As researchers observe more kilonovae and improve their models, we’ll be able to refine our understanding of how close is too close when it comes to kilonovae, the threat they pose to Earth, and the role they play in determining where in the universe life can form and flourish.
Citation
“Could a Kilonova Kill: A Threat Assessment,” Haille M. L. Perkins et al 2024 ApJ 961 170. doi:10.3847/1538-4357/ad12b7
The post Featured Image: How Close Is Too Close to a Kilonova? appeared first on AAS Nova.
]]>
One of the most popular planets is also maddeningly ambiguous: is LHS 1140b rocky, watery, or gaseous?
The post What Kind of World is LHS 1140b? appeared first on AAS Nova.
]]>One would be forgiven for thinking that it’s easy to tell different types of planets apart. Unfortunately, the most interesting worlds look awfully like comparatively boring ones to our telescopes. A well-studied planet, LHS 1140b, nicely illustrates this tension: after a re-analysis of archival data, it’s unclear if the planet has a potentially habitable surface ocean, or just a thin layer of hydrogen over a rocky surface.
Previous Work
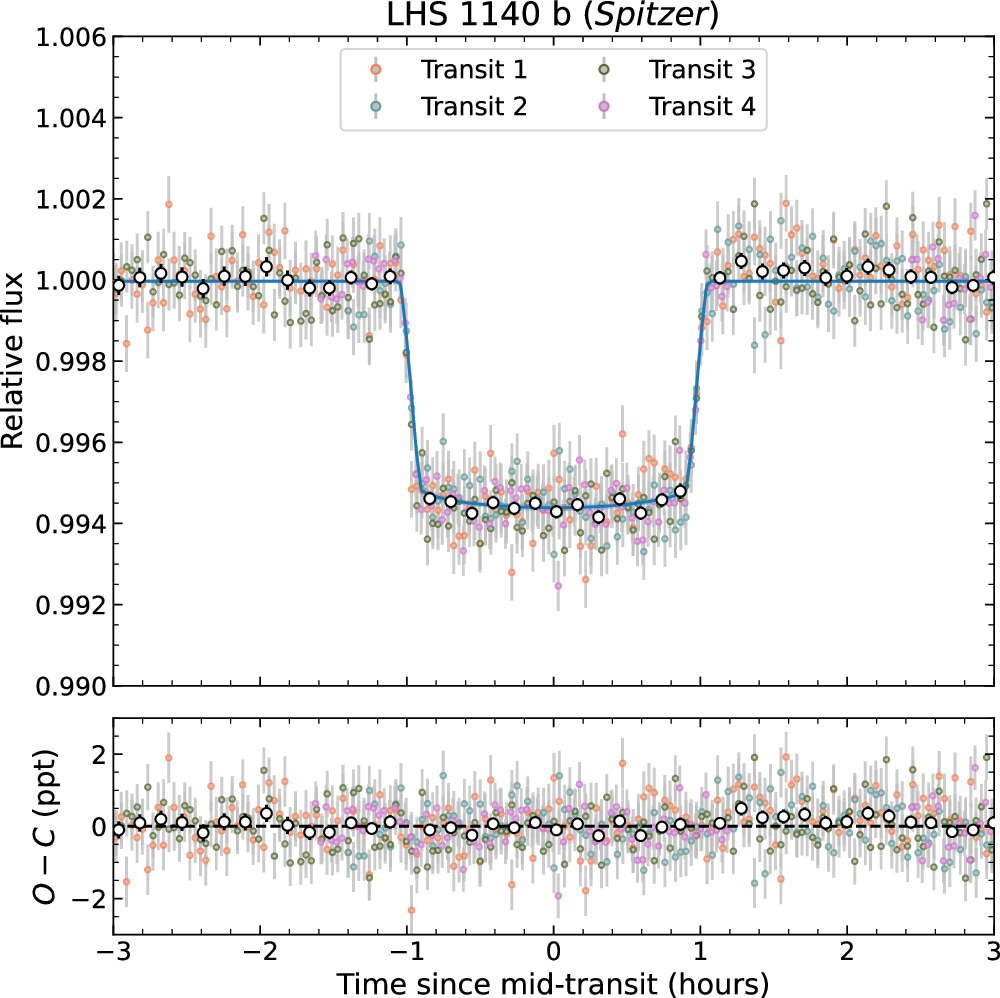
Observations of four transits of LHS 1140b collected by the Spitzer Space Telescope. [Cadieux et al. 2024]
Consequently, LHS 1140 has been observed with a battery of instruments since the discovery of its two accompanying planets in 2017 and 2019. When analyzed one-by-one these datasets suggest that the two worlds, creatively christened in the typical exoplanet fashion as LHS 1140b and LHS 1140c, are a little bigger and heavier than our home world but basically made of the same combination of rock and metal. However, all of these observations hadn’t before been analyzed in a single, joint study.
Another Look
Charles Cadieux, University of Montreal, took up this challenge and led a team to reprocess nearly every byte of information collected on these worlds in an attempt to better constrain their masses and radii. They succeeded: as the authors put it, “the LHS 1140 planets are [now] among the best-characterized exoplanets to date, with relative uncertainties of only 3% for the mass and 2% for the radius.”
However, the team wasn’t aiming to shrink the old error bars just for precision’s sake. Instead, their ultimate aim was to constrain the composition of each planet. Although their analysis confirmed that LHS 1140c is likely a generic super-Earth, their new measurements placed LHS 1140b in a strange corner of parameter space.
The mass and radius of the LHS 1140 planets, along with contours belonging to different compositions. LHS 1140b falls just above the rocky line, but one the very edge of the gas-envelope region. [Cadieux et al. 2024]
A Path Forwards
While it’d be thrilling to have a potentially habitable planet in our galactic backyard, our current data, even when collected with our best instruments and processed with the most cutting-edge techniques, is frustratingly unable to distinguish between the two scenarios. There is technically a path forward to resolving the uncertainty: the authors boldly advocate for an 18-transit observational campaign with JWST to confirm a thick, water-friendly atmosphere. However, with many planets to point to and galaxies galore to observe, there’s no guarantee that the community will choose to dedicate so much time to one target. We may have to live with just the hint that there’s a nearby alien ocean: a bitter, but awe-inspiring, ambiguity.
Citation
“New Mass and Radius Constraints on the LHS 1140 Planets: LHS 1140 b Is either a Temperate Mini-Neptune or a Water World,” Charles Cadieux et al 2024 ApJL 960 L3. doi:10.3847/2041-8213/ad1691
The post What Kind of World is LHS 1140b? appeared first on AAS Nova.
]]>
You can take a star apart layer by layer — all you'll need is a black hole and a set of precisely tuned orbital parameters.
The post How to Peel a Star Apart with a Black Hole appeared first on AAS Nova.
]]>Sometimes, stars and black holes can happily coexist. Other times, the star gets ripped apart. In a recent research article, a team explored what can happen in between those two extremes.
Challenging Companions
Dense star clusters, like the Milky Way’s nuclear star cluster depicted at the center of this image, provide opportunities for black holes and stars to get dangerously close. [NASA, ESA, and the Hubble Heritage Team (STScI/AURA)]
When stars and black holes meet, it can be spectacular: a black hole’s tidal forces can pull apart a star, resulting in a tidal disruption event that powers bright emission across the electromagnetic spectrum. Tidal disruption events can fully or partially disrupt a star, and they can occur around supermassive or stellar-mass black holes (the latter events are called micro tidal disruption events). Tidal disruption events take place when stars approach black holes on parabolic or highly elliptical orbits — what happens when the star’s orbit is nearly circular, instead?
Tidal Peeling Events
Chengcheng Xin (Columbia University) and collaborators used smoothed-particle hydrodynamics simulations to model the interaction between a star and a black hole in a close binary system. They modeled 96 combinations of starting parameters, changing the eccentricity of the system from a perfect circle to a slightly squashed one, varying the mass of the star from 1 to 15 solar masses, and exploring different values of the penetration factor: the ratio between 1) the distance from the black hole at which an object would be tidally disrupted and 2) the pericenter distance.
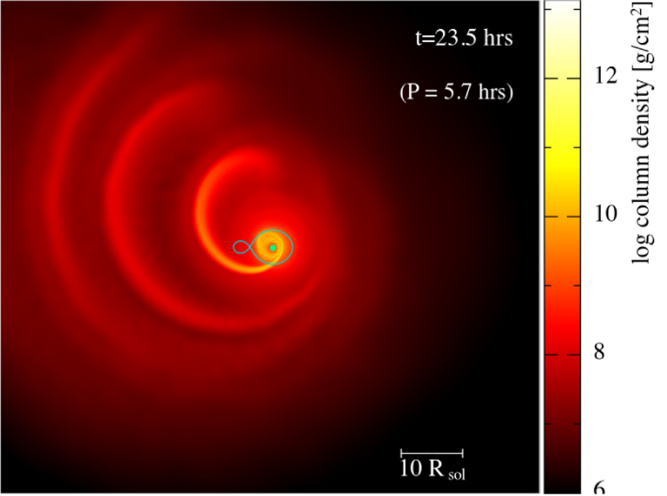
Example of the spiral gas structure created in a tidal peeling event. [Adapted from Xin et al. 2024]
A New Kind of Transient Phenomenon?
From our distant vantage point, would we be able to distinguish a tidal peeling event from a micro tidal disruption event? Both phenomena exhibit intense electromagnetic radiation powered by accretion of stellar gas onto a black hole. The rates of accretion are similar between tidal peeling events and micro tidal disruption events, but their timescales and time evolution are different. Tidally peeled stars are stripped apart over the course of several short orbits — likely a few to a few tens of hours — while micro tidal disruption events can be slower to play out.
As this study is an initial exploration of tidal peeling events, there is still much to learn about their physical and observational characteristics. Future avenues for investigation include the impact of outflowing jets and winds, shocks that form when the star collides with its own tidal debris, and what changes might arise when simulations are started sooner, long before the star and the black hole are already positioned close together and poised for the peeling to begin.
Citation
“‘Tidal Peeling Events’: Low-eccentricity Tidal Disruption of a Star by a Stellar-mass Black Hole,” Chengcheng Xin et al 2024 ApJ 961 149. doi:10.3847/1538-4357/ad11d3
The post How to Peel a Star Apart with a Black Hole appeared first on AAS Nova.
]]>
Astrobites reports on the recent exciting discovery that the Small Magellanic Cloud is actually composed of two distinct star-forming systems.
The post Two Small Magellanic Clouds Are Better than One appeared first on AAS Nova.
]]>Editor’s Note: Astrobites is a graduate-student-run organization that digests astrophysical literature for undergraduate students. As part of the partnership between the AAS and astrobites, we occasionally repost astrobites content here at AAS Nova. We hope you enjoy this post from astrobites; the original can be viewed at astrobites.org.
Title: A Galactic Eclipse: The Small Magellanic Cloud is Forming Stars in Two, Superimposed Systems
Authors: Claire E. Murray et al.
First Author’s Institution: Space Telescope Science Institute
Status: Published in ApJ
The Small Magellanic Cloud is one of the most-studied galaxies in our universe due to its proximity (just 200,000 light-years away), and because its structure and elements are so distinctly different from our own Milky Way galaxy. For example, it has a lower metallicity and is therefore an excellent laboratory for understanding the physics of the interstellar medium at lower-metallicity conditions. The interstellar medium is the gas and dust between stars within a galaxy (as opposed to the circumgalactic medium, which is the gas and dust between galaxies).
Despite its potential utility as a nearby parallel probe of galaxy evolution, the Small Magellanic Cloud’s structure is still relatively unknown. For example, stars with different ages appear to be distributed through the galaxy differently. The oldest stellar populations appear to be distributed spherically without rotating, whereas younger stars are rotating. Furthermore, the structure of the Small Magellanic Cloud’s interstellar medium indicates that it has potentially been severely disrupted by recent interactions with the Large Magellanic Cloud. Modeling the evolution and interaction history of the Small Magellanic Cloud from its conflicting observational constraints will help inform our understanding of its future.
The authors combined observations of neutral hydrogen (HI) gas emission and radial velocity (velocities along our line of sight) measurements to model the Small Magellanic Cloud’s evolutionary history. Because the interstellar medium of the galaxy is dominated HI emission (hydrogen gas that has not been ionized by any astrophysical source like a star), observing this atomic gas allows us to trace the bulk properties of the interstellar medium. As shown in Figure 1, the radial velocities derived from the emission of the HI gas show two distinct structures moving away from us — one at a higher speed and one at a lower speed.
Figure 1: The radial-velocity map derived from HI emission of the Small Magellanic Cloud shows two distinct structures moving away from us, one at high radial velocity (~170 km/s) in red on the left, and one at low velocity in blue on the right (~130 km/s). The magenta cross represents the center of the Small Magellanic Cloud. [Adapted from Murray et al. 2024]
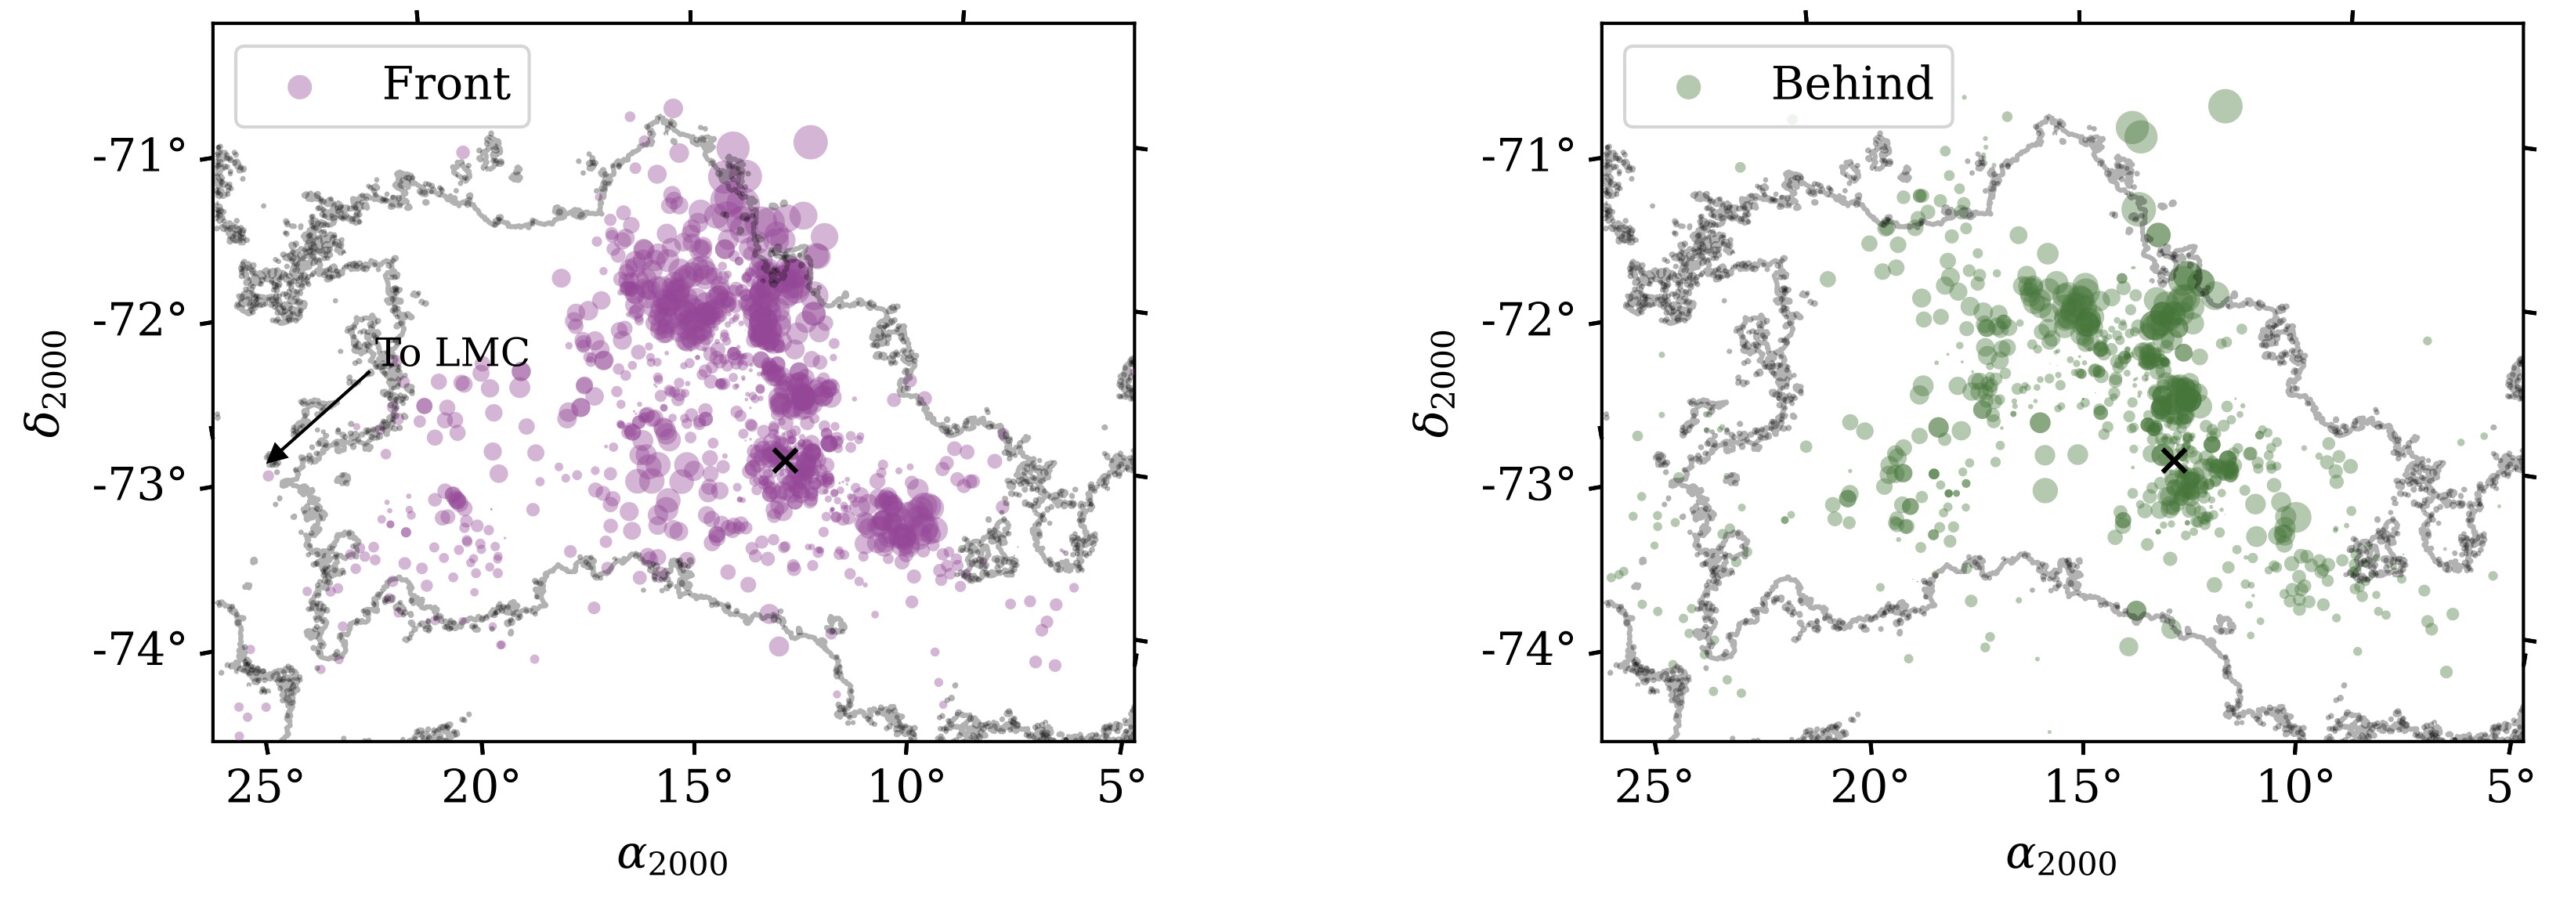
Figure 2: The stars in the “front” structure and stars in the “behind” structure, derived from the extinction and radial velocities of these stars. [Murray et al. 2024]
In conclusion, these results indicate the Small Magellanic Cloud is clearly composed of two distinct star-forming systems. One possible explanation for these results is that these two systems are actually remnants of different galaxies, potentially indicated by the fact that they have different metallicities. Alternatively, the authors propose that the “behind” structure is actually tidal debris from an interaction with the Large Magellanic Cloud. Ultimately, further observational constraints, such as direct distance measurements to the interstellar medium components and simulations of the Small Magellanic Cloud’s evolution, will help paint a more detailed picture of its history and future.
Original astrobite edited by Jessie Thwaites.
About the author, Abby Lee:
I am a graduate student at UChicago, where I study cosmic distance scales and the Hubble tension. Outside of astronomy, I like to play soccer, run, and learn about fashion design!
The post Two Small Magellanic Clouds Are Better than One appeared first on AAS Nova.
]]>
Today's post introduces four research articles that examine various aspects of supernova science, from attempts to determine how lightweight a supernova progenitor star can be to exploring why some massive stars don't produce supernovae at all.
The post Monthly Roundup: Supernovae in the Spotlight appeared first on AAS Nova.
]]>A supernova is a spectacular way for a star to die. Massive stars meet this fate when the outward pressure exerted by core nuclear fusion can no longer hold off the gravity of the star’s outer layers, and the remnants of lower-mass stars can attain this honor through accretion or collisions. Today we’ll introduce four research articles that examine various aspects of supernova science, from attempts to determine how lightweight a supernova progenitor star can be to exploring why some massive stars don’t produce supernovae at all.
Probing the Smallest Supernova Stars
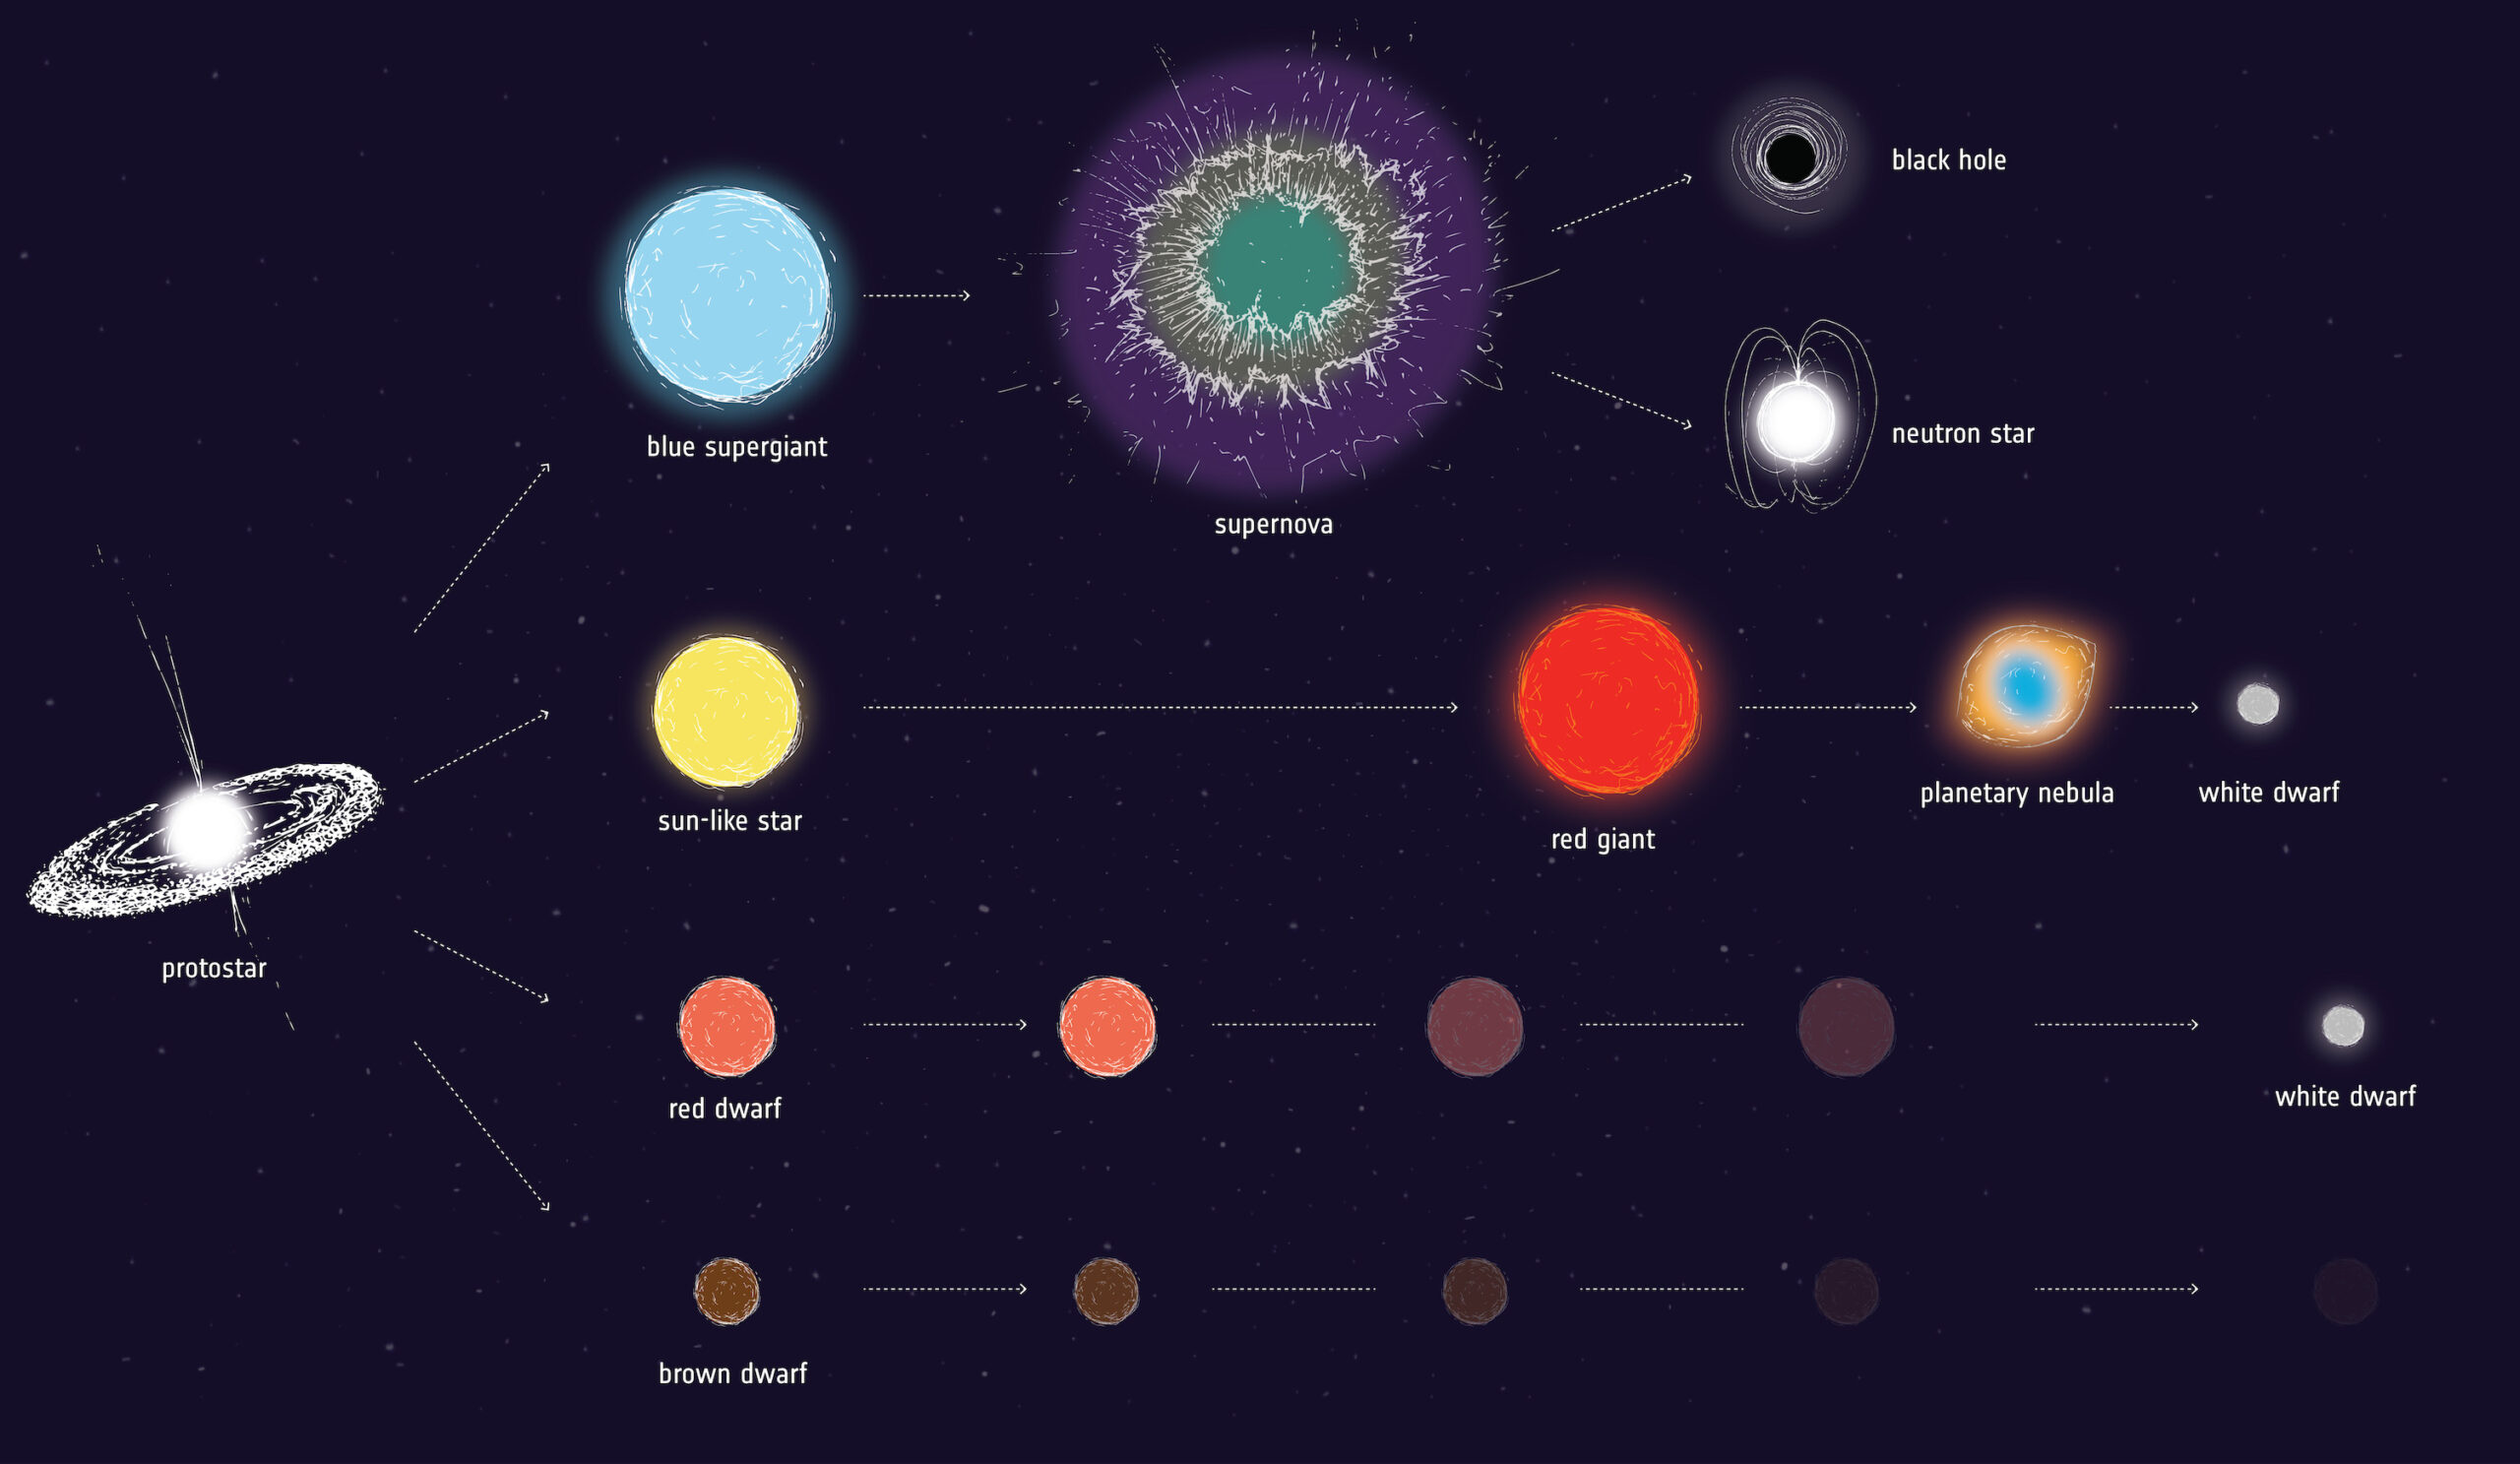
The main stellar evolution pathways. It’s not yet clear exactly which stars explode as supernovae and which become white dwarfs. Click to enlarge. [ESA]
Luckily, increasing coverage by transient-hunting surveys has generated a growing sample of these faint, fast events. Kaustav Das (California Institute of Technology) and coauthors studied nine supernovae detected by the Zwicky Transient Facility that were found to have certain chemical abundance ratios that hint at the progenitor stars being low mass. These supernovae are calcium-rich Type IIb supernovae, which have much larger [Ca II]/[O I] ratios than typical core-collapse supernovae.
Das’s team used spectra of each of these supernovae to measure the amount of oxygen present, which can be used in theoretical models to estimate the mass of the star that exploded. The mass estimates for all stars in the sample were less than 12 solar masses, suggesting that this type of supernova tends to arise from stars near the low-mass end of the progenitor mass range. The current sample of known calcium-rich Type IIb supernovae is still small, but future detections should allow researchers to refine models and improve estimates.
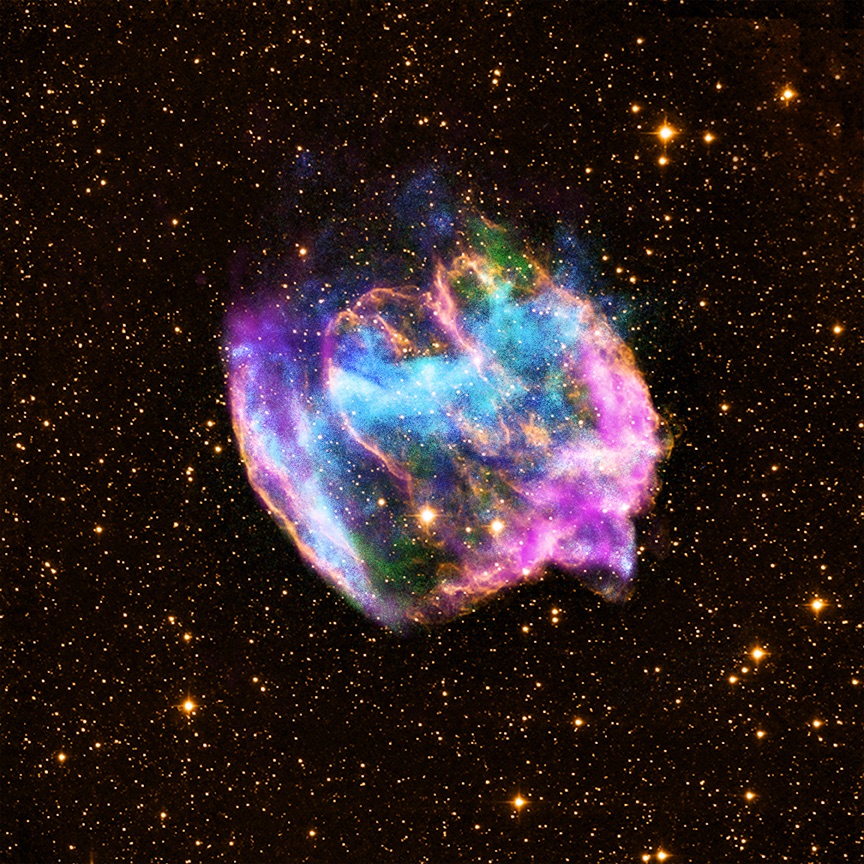
Not all massive stars end their lives as supernovae, leaving behind a supernova remnant like W49B shown here. [X-ray: NASA/CXC/MIT/L.Lopez et al.; Infrared: Palomar; Radio: NSF/NRAO/VLA]
Focusing on Failed Supernovae
When massive stars extinguish their core nuclear fusion and collapse, do they always generate luminous supernovae? Both observations and theory suggest that the answer is no, with some would-be supernovae forming a black hole with no accompanying supernova. Up to a third of massive stars might fail to generate a supernova!
Eric Coughlin (Syracuse University) performed a mathematical exploration of failed supernovae, focusing on the creation and propagation of a shock between the collapsing core and the outward-moving outer layers of the star. Coughlin showed that while some dying massive stars don’t produce supernovae per se, they still undergo an explosion that marks their impending demise. The strength of the explosion from a failed supernova depends on the properties of the star and how much of its mass is lost in the form of neutrinos: chargeless, nearly massless subatomic particles that rarely interact with matter.
In addition to the mathematical solutions that described the explosions, the equations also permitted a solution in which the matter settles near the central object. While we’ll have to wait for future work for a full examination of these solutions, it’s possible that they’ll apply to smaller stellar outbursts that do not destroy the star.
Prospects for Detecting Supernova Neutrinos
When a massive star’s core collapses, it can form a black hole or a neutron star: an extremely dense, rapidly spinning, city-sized sphere made almost entirely of neutrons. As protons and electrons are crushed into neutrons in the star’s core, the transformation produces neutrinos that push the star’s collapsing outer layers outward. While most of the star’s outer layers escape, forming the glowing, complex structures of a supernova remnant, a small fraction of the material falls back onto the protoneutron star, generating even more neutrinos.
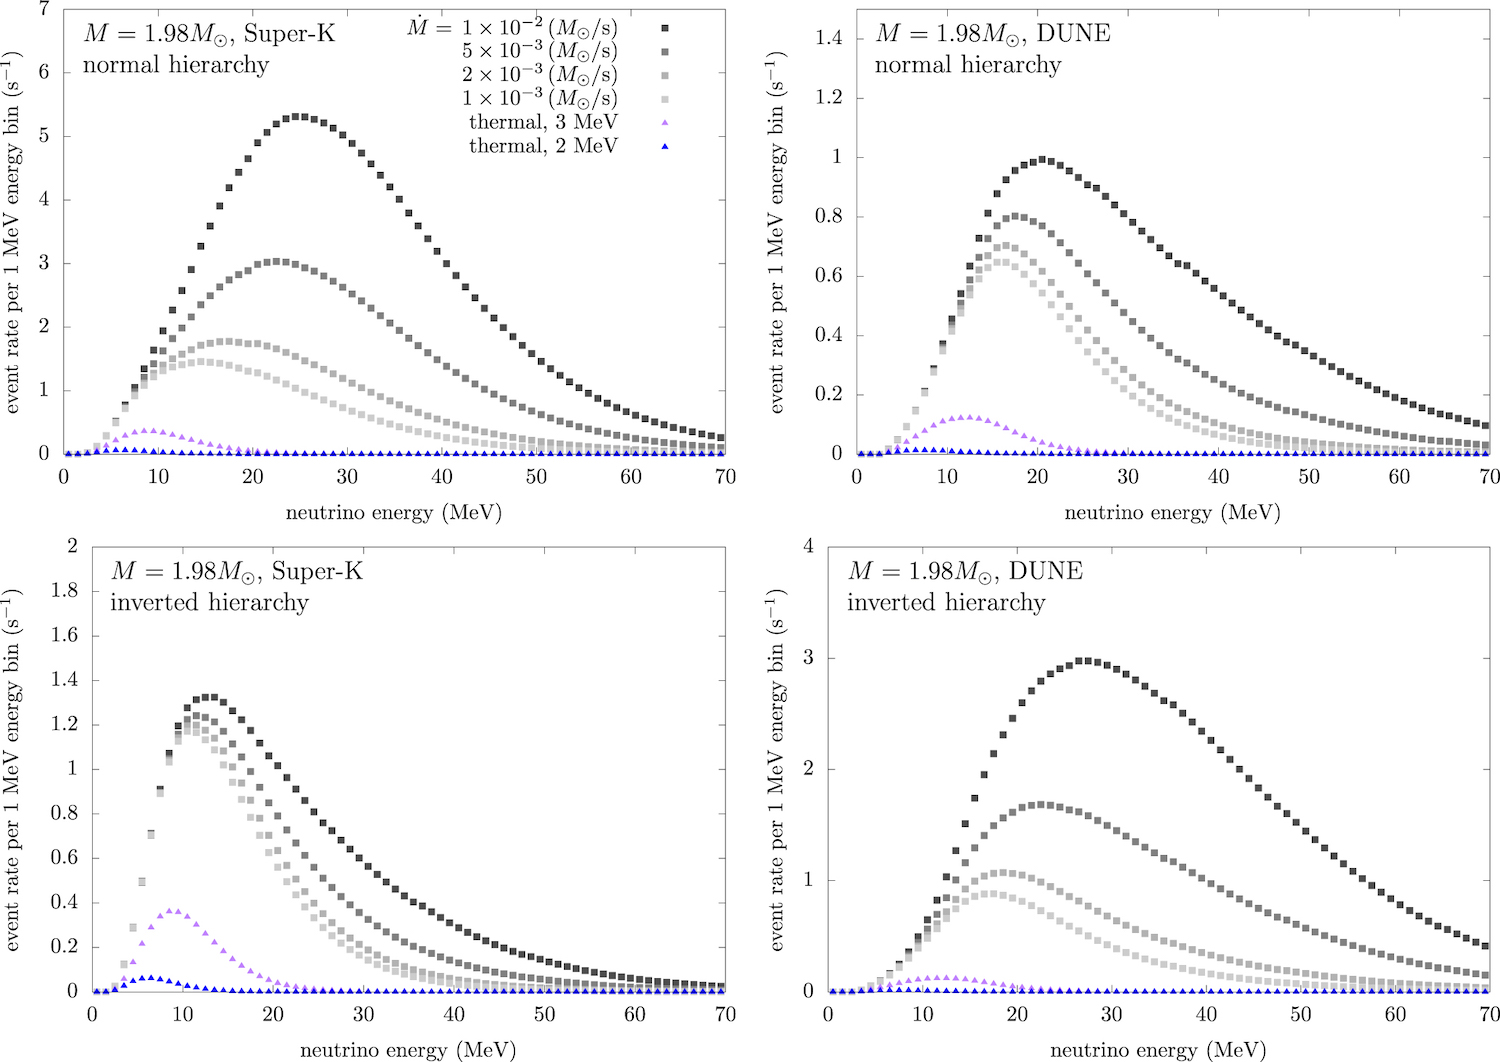
The event rates for a 1.98-solar-mass protoneutron star with various accretion rates as seen by Super-Kamiokande (left) and DUNE (right) and for normal (top) and inverted (bottom) neutrino mass hierarchies. [Akaho et al. 2024]
Akaho’s team found that the mass of the protoneutron star and the rate at which it gathers material from its surroundings both have an impact on the output neutrino luminosity and the average energy of the neutrinos. For a supernova happening about 33,000 light-years away, the neutrino flux should rise above the background measured by the existing Super-Kamiokande and under-construction Deep Underground Neutrino Experiment (DUNE) detectors. The exact strength of the signal depends on several factors, including neutrino oscillation — the process through which a neutrino born in a certain “flavor” morphs to a different flavor as it travels through space.
Investigating Type Ia Supernova Diversity
Supernovae aren’t always the result of massive stars collapsing. Many arise from white dwarfs, which are the exposed cores of low- to intermediate-mass stars that have finished fusing hydrogen in their cores and lost their outer layers. When a white dwarf accretes gas from a companion star, the white dwarf gains mass and heats up, eventually triggering a supernova. Alternatively, the collision of two white dwarfs can generate a supernova. Supernovae arising from white dwarfs are called Type Ia or thermonuclear runaway supernovae.
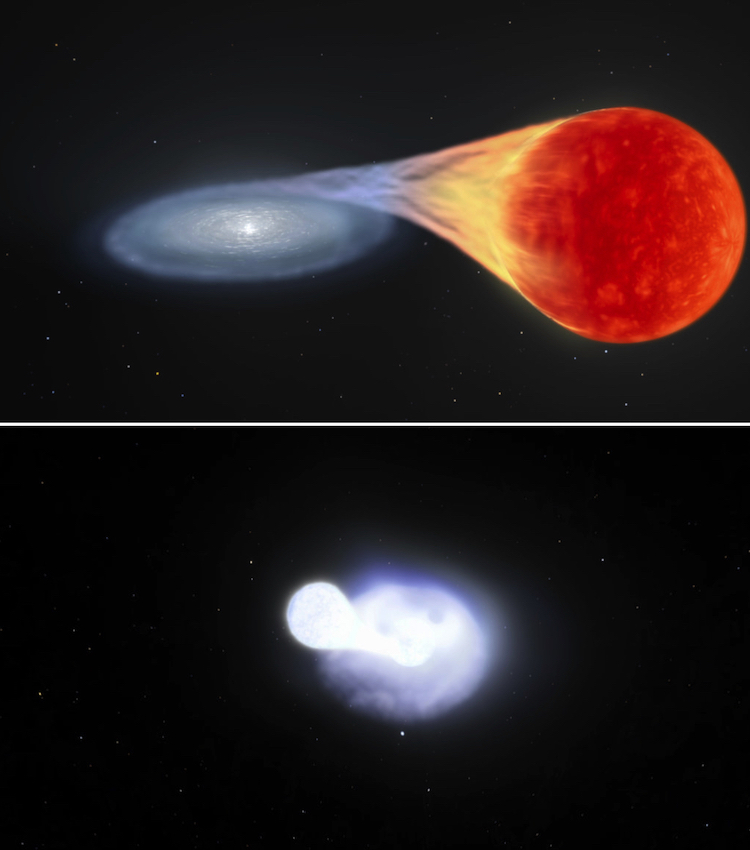
Illustrations of the two main Type Ia supernova pathways: the single-degenerate model (top) and the double-degenerate model (bottom). [Both images from NASA’s Goddard Space Flight Center Conceptual Image Lab]
The team selected a sample of 14 Type Ia supernovae for which spectra were collected within one week of the explosion being detected at Earth. The sample included high-velocity supernovae, normal-velocity supernovae, and some that were similar to the peculiar supernova SN 1999aa. The team then used radiative transfer modeling to model the spectra and extract the properties of the supernova ejecta. Ultimately, they found that the supernovae fell into two groups: one with high-density, carbon-poor ejecta, which makes up the high-velocity sample and some of the normal-velocity sample and one that has low-density, carbon rich ejecta, which makes up the remaining normal-velocity sample and those like SN 1999aa. While more work remains to be done, the team suspects these two groups might be the result of different formation mechanisms.
Citation
“Probing the Low-Mass End of Core-Collapse Supernovae Using a Sample of Strongly Stripped Calcium-Rich Type IIb Supernovae from the Zwicky Transient Facility,” Kaustav K. Das et al 2023 ApJ 959 12. doi:10.3847/1538-4357/acfeeb
“The Division Between Weak and Strong Explosions from Failed Supernovae,” Eric R Coughlin 2023 ApJ 955 110. doi:10.3847/1538-4357/acf313
“Detectability of Late-Time Supernova Neutrinos with Fallback Accretion onto Protoneutron Star,” Ryuichiro Akaho et al 2024 ApJ 960 116. doi:10.3847/1538-4357/ad118c
“Systematic Investigation of Very-early-phase Spectra of Type Ia Supernovae,” Mao Ogawa et al 2023 ApJ 955 49. doi:10.3847/1538-4357/acec74
The post Monthly Roundup: Supernovae in the Spotlight appeared first on AAS Nova.
]]>
Could measuring ultraviolet light from small galaxies in the early universe help researchers test the leading theory of cosmology?
The post Using Ancient Ultraviolet Light to Probe Theories of Cosmology appeared first on AAS Nova.
]]>By studying the formation and evolution of galaxies in the early universe, researchers seek to test the predictions of our leading theory of cosmology. New research suggests that the ultraviolet luminosity of low-mass galaxies just a few hundred million years after the Big Bang may provide a way to differentiate between cosmological models.
Supersonic Flows in the Early Universe

Simulation output showing the distribution of dense dark matter (orange), diffuse dark matter (blue), and high-velocity gas (white) in and surrounding two galaxy clusters. [TNG Collaboration]
While galaxies today are nestled within dark matter halos and arrayed along strands of dark matter scaffolding, dark matter and luminous matter weren’t always so aligned; ΛCDM predicts that in the very early universe, just after protons and electrons came together to form atoms, there were places where normal matter moved relative to dark matter with immense speed — faster than the local speed of sound. This supersonic relative motion complicated the formation of the first stars and galaxies, potentially altering early galaxy formation in a measurable way.

Comparison of the gas and stellar structures that form when the relative velocity between dark and normal matter is supersonic (left) and when there is no velocity difference between dark and normal matter (right). Click to enlarge. [Williams et al. 2024]
Suppression of Small-Scale Structure
Claire Williams (University of California, Los Angeles) and collaborators set out to understand the impact of this supersonic relative motion on the formation of low-mass galaxies. Using high-resolution fluid dynamics simulations, Williams’s team modeled the evolution of galaxies from a redshift of 200 to a redshift of 12. Their simulations tackled the cooling and condensing of molecular clouds, the ignition of the first stars, and the assembling of galaxies and star clusters.
The team found that having dark matter and normal matter moving at supersonic velocities relative to one another makes it harder for small galaxies to form; an order of magnitude fewer galaxies formed with stellar masses less than about 3 million solar masses when a velocity difference was present. Larger galaxies formed in the same numbers regardless of the velocity difference.
Clues from Ultraviolet Photons

Modeled ultraviolet luminosity functions in the case of a supersonic velocity difference (pink line) and no velocity difference (blue line). The remaining colored data points are values derived from observations and the gray and black lines are model predictions. [Adapted from Williams et al. 2024]
Williams’s team found key differences in these quantities at a redshift of 12 in areas with the velocity difference and areas without. In regions without the supersonic flow, small galaxies and star clusters form readily and begin to churn out stars. In regions with the supersonic flow, small galaxies are uncommon, and the gas that would have gone toward the smallest galaxies is instead captured by and spurs star formation in slightly more massive galaxies, in the 10-million-solar-mass range. This means that the ultraviolet luminosity function is lower for the smallest, faintest galaxies but is boosted for slightly brighter and more massive galaxies at a redshift of 12.
Because ultraviolet photons emitted in the distant past are shifted to longer wavelengths when they reach us today, the ultraviolet luminosity function is potentially measurable at infrared wavelengths with JWST. Ultra-deep JWST observations such as the NGDEEP survey may reach ultraviolet magnitudes as faint as −14, potentially revealing the small galaxies that can probe early-universe cosmology.
Citation
“The Supersonic Project: Lighting Up the Faint End of the JWST UV Luminosity Function,” Claire E. Williams et al 2024 ApJL 960 L16. doi:10.3847/2041-8213/ad1491
The post Using Ancient Ultraviolet Light to Probe Theories of Cosmology appeared first on AAS Nova.
]]>
Researchers have used new models to explore whether reported correlations in the properties of black hole binary systems are real or just a consequence of previous statistical methods.
The post Are Binary Black Hole Spins and Mass Ratios Correlated? appeared first on AAS Nova.
]]>When researchers scour the detections of merging black holes made by gravitational wave observatories, they use models and statistics to make careful inferences about the population of black holes in our universe. In a recent article, researchers explored whether an emerging trend in gravitational wave data is real or an artifact of previous analysis methods.
A New Window on the Universe

Illustration of the first black hole merger detected by LIGO. [Aurore Simmonet (Sonoma State University)]
One potential result that has emerged from several analyses of gravitational wave signals is that the effective spins and the ratios of the masses of merging black hole binaries appear to be anticorrelated. But as with all results that are extracted delicately, statistically from complex data sets, it’s important to ask if this is a real feature of the data, with real implications for how black hole binary systems are assembled, or if it’s a result of our models or statistical analyses.
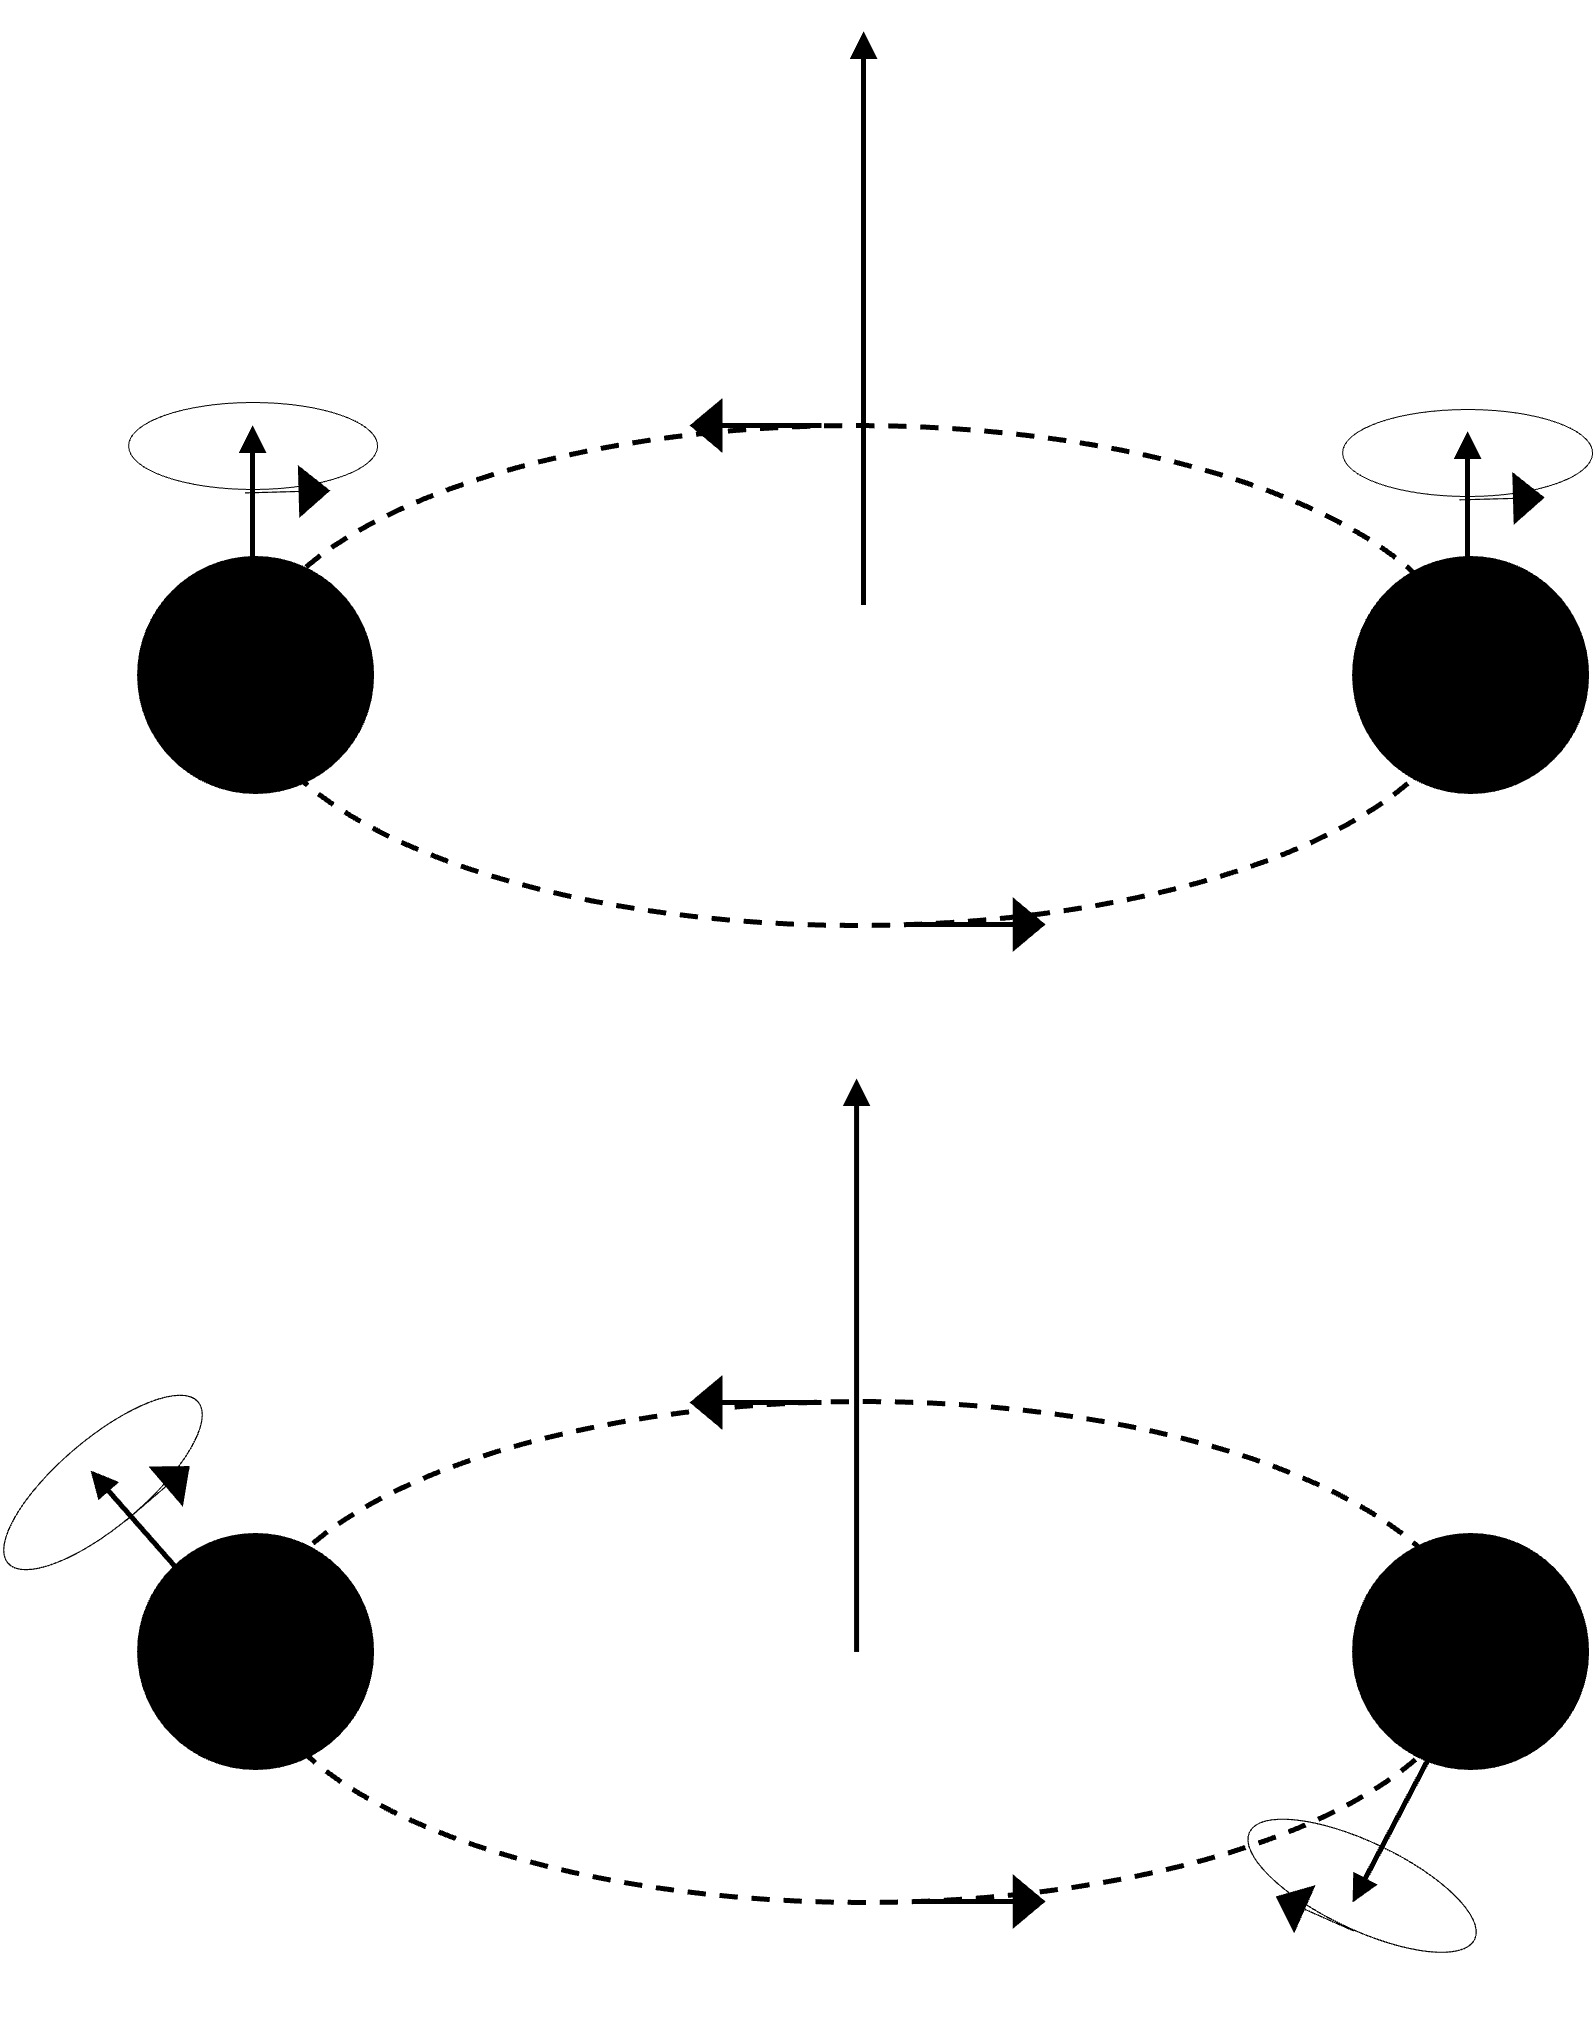
Top: The black hole spins are aligned with the system’s orbital angular momentum (positive effective spin). Bottom: The black hole spins are misaligned with the system’s orbital angular momentum (negative effective spin). [AAS Nova/Kerry Hensley]
Statistical Investigation
Christian Adamcewicz (Monash University and OzGrav) and collaborators approached this question by applying a new statistical treatment to detections of black hole mergers. This new treatment features a new model for effective spin and allows for a subpopulation of black hole binaries with zero effective spin, which hasn’t yet been ruled out and might have an impact that hasn’t been accounted for.
The team applied their population model to the third catalog of gravitational wave signals from the LIGO and Virgo detectors and used Bayesian statistical methods to extract the properties of the overarching population of black holes. They found that the previously reported anticorrelation between effective spin and mass ratio is likely real, ruling out the possibility of there being no correlation at 99.7% probability.
More Work, a Paradox, and Astrophysical Possibilities
Adamcewicz and collaborators acknowledge that this work doesn’t provide a final verdict on this question (as they put it, “a modeler’s job is never done”), and that other statistical effects need to be rooted out. One lingering possibility is that this result is due to the amalgamation paradox, which arises when trends present in different factors disappear or flip when the factors are considered together.
If the observed anticorrelation holds up to further statistical scrutiny, a number of astrophysical phenomena could be responsible for this effect. Extensive mass transfer between black hole progenitor stars, stars evolving within a common envelope and accreting matter at a high rate, or even black hole binary systems assembled within the accretion disks of active galactic nuclei should all be investigated with future black hole population models.
Citation
“Evidence for a Correlation Between Binary Black Hole Mass Ratio and Black Hole Spins,” Christian Adamcewicz et al 2023 ApJ 958 13. doi:10.3847/1538-4357/acf763
The post Are Binary Black Hole Spins and Mass Ratios Correlated? appeared first on AAS Nova.
]]>
Astrobites reports on how the messy evolution of tilted planetary systems around binary stars could help explain the existence of free-floating planets.
The post Tilted Tatooines Can Serve as a Source of Strange Solo Planets appeared first on AAS Nova.
]]>Editor’s Note: Astrobites is a graduate-student-run organization that digests astrophysical literature for undergraduate students. As part of the partnership between the AAS and astrobites, we occasionally repost astrobites content here at AAS Nova. We hope you enjoy this post from astrobites; the original can be viewed at astrobites.org.
Title: Tilted Circumbinary Planetary Systems as Efficient Progenitors of Free-Floating Planets
Authors: Cheng Chen et al.
First Author’s Institution: University of Leeds
Status: Published in ApJL
All planets orbit stars.
Okay, that was a lie. But a hundred years ago, it seemed super true — we only knew of the planets around our own Sun.
Then, later, it still seemed decently true. Astronomers started finding planets around other stars in the 1990s (which the opening statement supported!). At this point, though, the field had at least begun to consider that there could be a population of “free-floating planets”: planet-sized bodies wandering through space, unaffiliated with any particular star.
Because our methods of finding planets, at that point, relied on the dimming or shifting of a host star’s light, these rogues seemed unknowable (if they existed at all). So perhaps the statement could be modified to read “all planets that we can detect orbit stars,” which would still maybe hold a little truth.
As our telescopes (and our techniques) have improved, though, it has become very clear that the statement is… irredeemably untrue. Since the turn of the century, largely through a more direct observational technique called microlensing, we’ve gradually uncovered a rich population of free-floating planets dancing in the vast cosmic dark. (Just in the past few months, JWST revolutionized yet another sub-field with its discovery of free-floating pairs of planets, but that’s a topic for another ’bite.)
Young, Wild, and Free: The Instability of Newborn Planetary Systems
But where do these unbound beauts come from? There are a few proposed mechanisms, but one of the most likely methods involves planets forming around stars (like normal!) but subsequently being violently ejected from their bound orbits.
The period immediately following the formation of the planets is often suspected to be pretty messy. In the solar system, we think there was a major instability right after planets formed, in which our eight major planets interacted strongly with each other before settling into roughly the orbits they have today.
In fact, simulations of such an instability suggest that there could have originally been a fifth giant planet in the outer solar system, formed alongside Jupiter, Saturn, Uranus, and Neptune. During the period of unrest (often called a “late instability” due to its occurrence after planet formation was complete), this planet would have been “kicked” off of its original orbit — and ejected from the solar system altogether — through interactions with the other giants. Any such planet would, at this point, be a free-floater.
Today’s article talks about these sorts of “planet–planet scattering” ejections, but it doesn’t talk about the solar system (nor any particular observed planetary system). Instead, in a common theorist tactic, the authors consider a whole class of planetary systems: those existing around two stars rather than one.
Two Stars Are Better than One (for Planetary Ejections)
Just as planets can orbit stars, stars can orbit each other. And if their orbit is small enough, protoplanetary disks — and, thereafter, planets — can form around the pair of them. One of the most famous (fictional) examples of such a system is Star Wars’ Tatooine, which enjoys an iconic double sunset courtesy of the binary stars around which it orbits. A diagram of planets orbiting a pair of stars is shown in Figure 1.
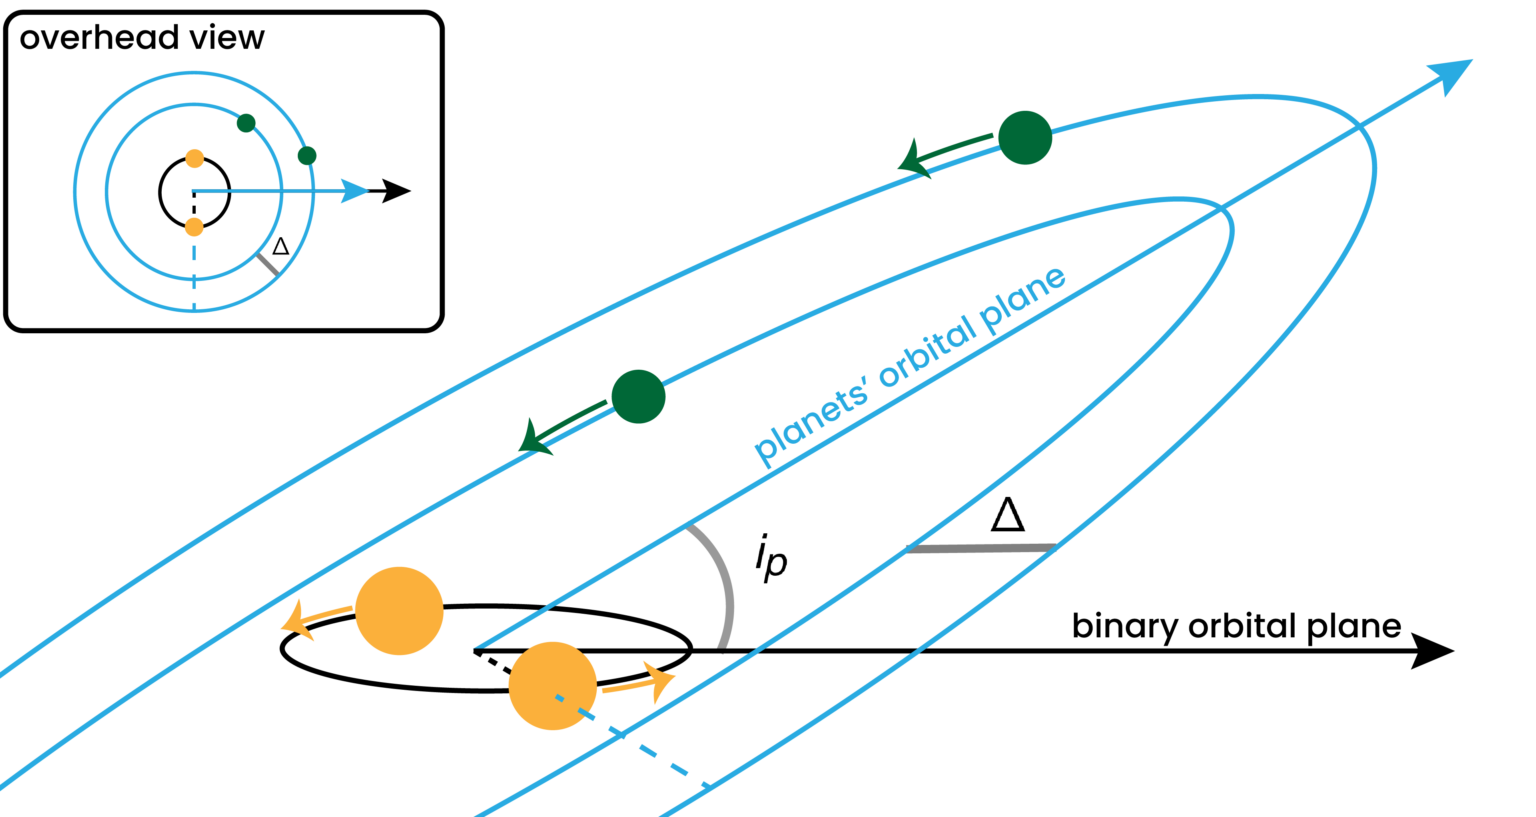
Figure 1: In the setup described in this work, two planets (green) orbit around a binary pair of stars (yellow). The planets’ orbits are separated by a dimensionless distance parameter Δ — the distance between the orbits in terms of their mutual sphere of influence. The orbits start off aligned with each other (though this can change over the course of a simulation!), but they aren’t necessarily aligned with the orbit of the stellar binary. The authors test the stability of systems spanning a range of different inclinations (ip) and separations (Δ). [Mark Dodici]
(This isn’t an unreasonable addition; binary pairs — and even binaries close enough to allow for planet formation — make up a significant fraction of all stars, so they’re definitely worth modeling.)
Specifically, the authors simulate planetary systems where two planets, separated by some distance, trace out orbits that are inclined relative to the orbit of the central binary stars. (See Figure 2 for examples of different orbital inclinations.) They test systems with a range of initial inclinations, for a range of planet separations, for a select few choices of unequal planet masses. Through these simulations, they cover a broader range of parameter space — i.e., the ranges of values that a real-life system could have for its properties — than previous work.
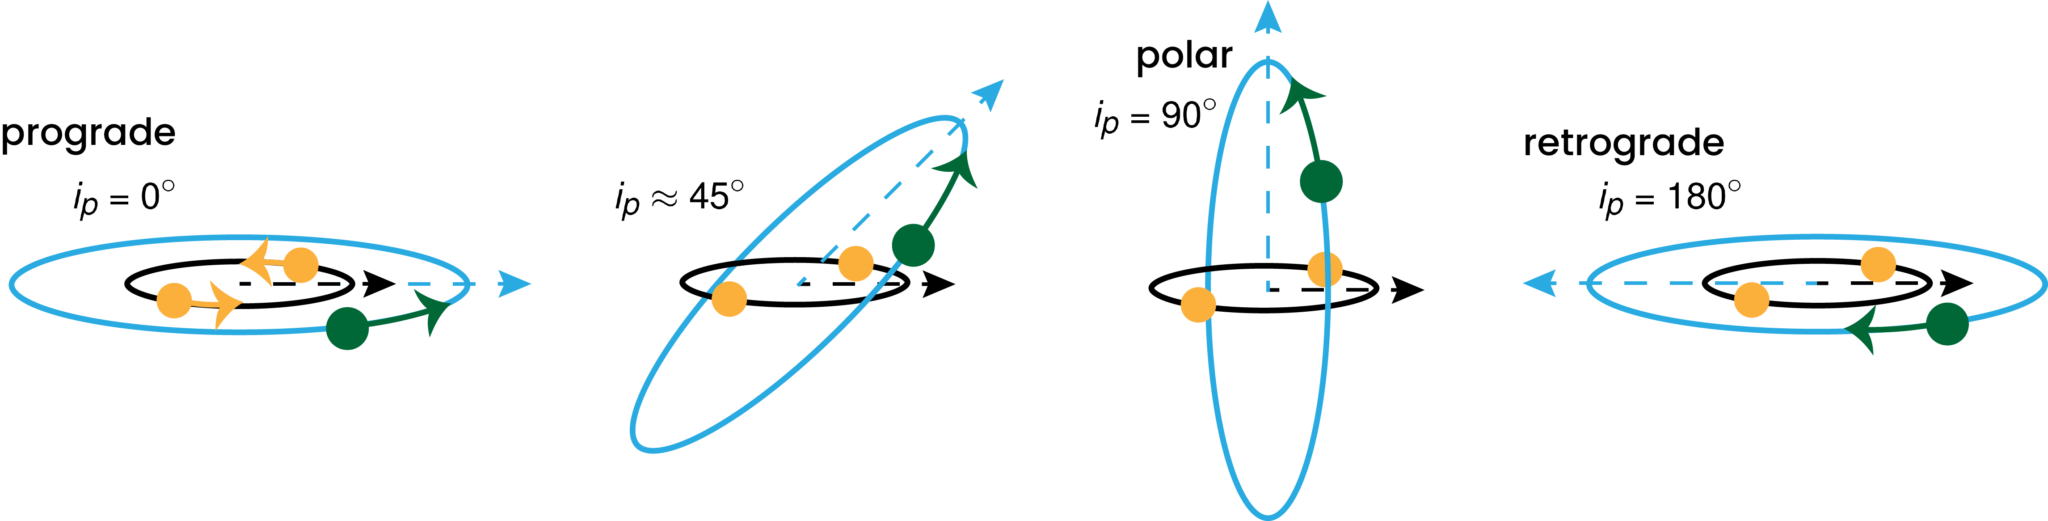
Figure 2: Examples of planetary systems with a few different inclinations, from prograde to retrograde. From this work, the orbits that most commonly lead to ejections are neither prograde, nor polar, nor retrograde — that is, systems with ip ≈ 45° see ejections most often. [Mark Dodici]
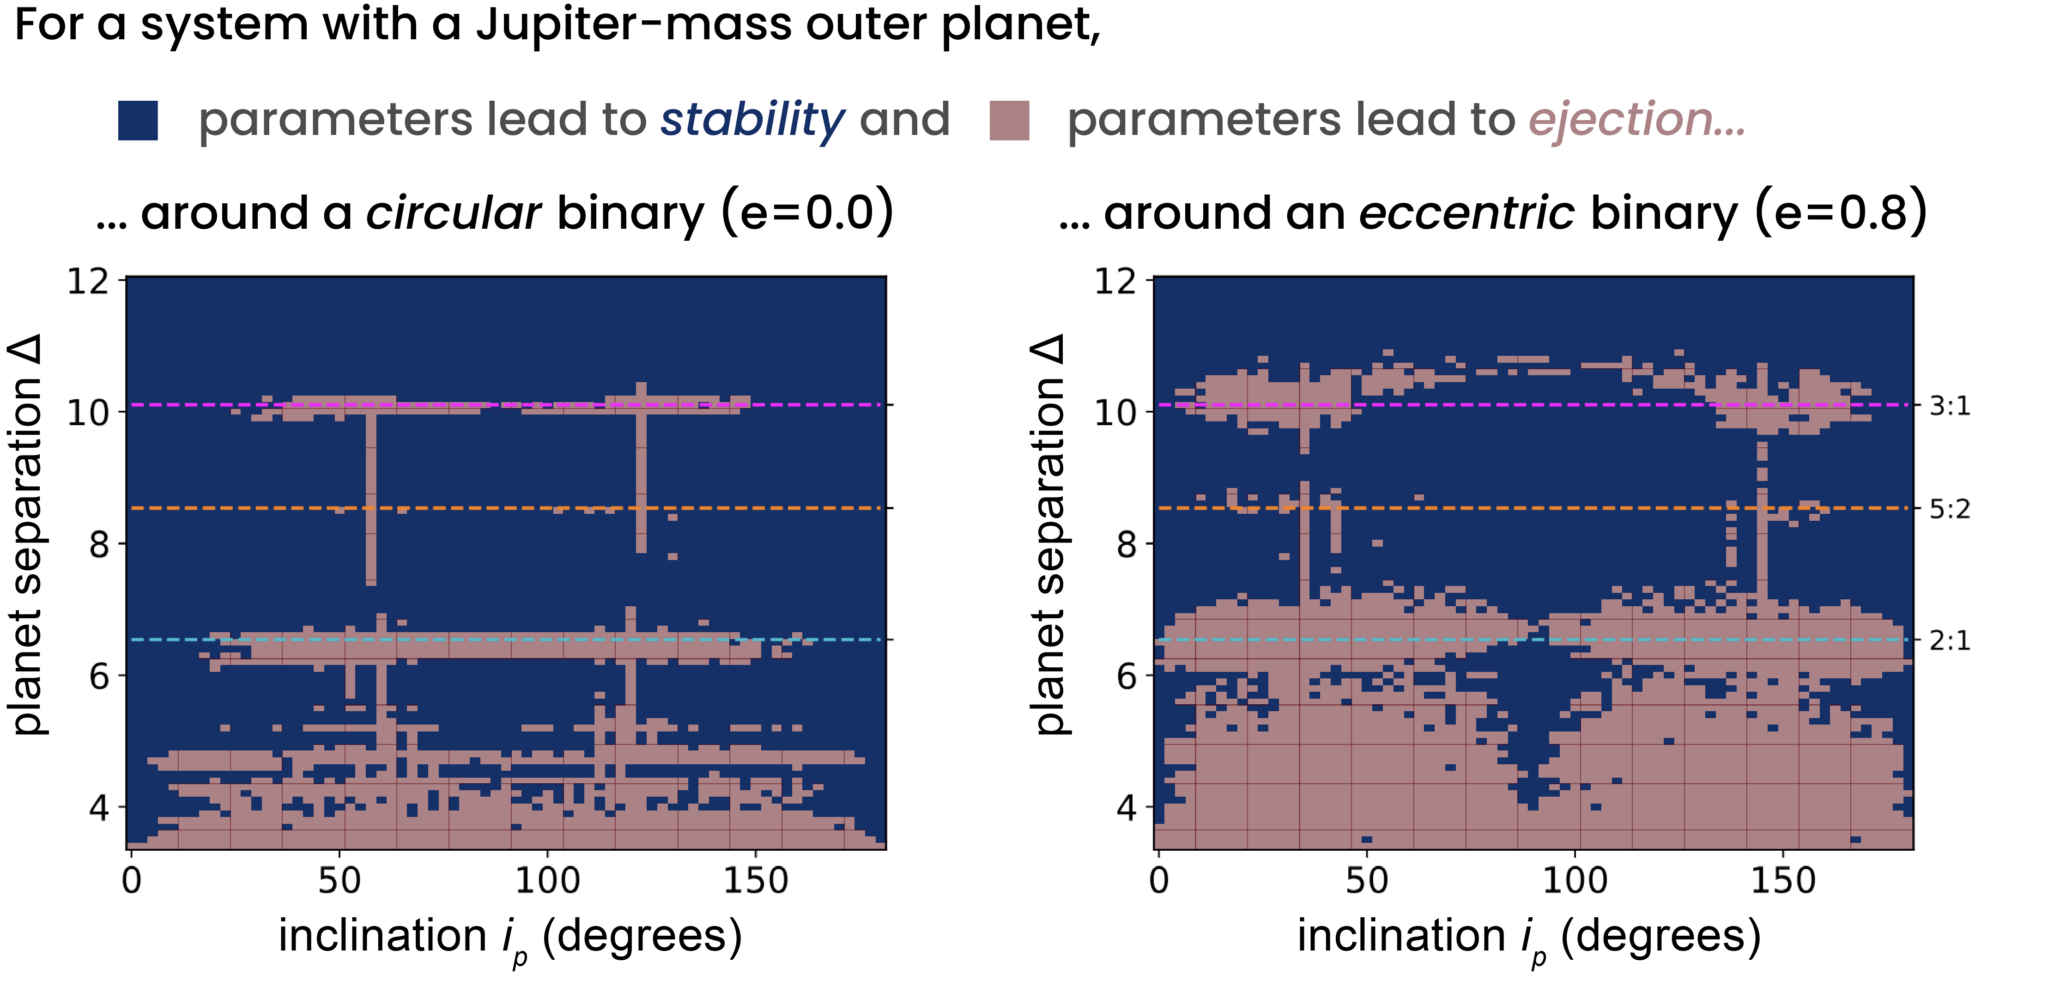
Figure 3: For a given system, the authors reported whether each set of parameters was stable (blue) or resulted in an ejection (light red). On the left, we see a range of systems with different inclinations and planet separations around circular binaries. On the right, we see the same range of inclinations and separations around eccentric binaries, with e = 0.8. All systems in these plots have a Jupiter-mass outer planet with an Earth-mass planet orbiting interior to it. Dashed, colorful lines on these plots point out a few mean motion resonances (see text), which are known to be unstable in tilted planetary systems. In the article, the authors show similar plots for different combinations of planet masses; these generally show similar trends in ejection vs. stability for various inclinations and separations. [Adapted from Chen et al. 2024]
A Few More Free-Floaters
That all said, this isn’t an article about planetary dynamics — it’s about free-floating planets. These results show that a decent variety of planets can be ejected from planetary systems around binary stars, yielding a decent total occurrence rate for free-floaters from this mechanism. This is a decent win for planet–planet scattering as a potential source of unbound planets!
As in any theory article, there’s work to be done to constrain exactly how often we expect these Tatooine-like systems to eject planets, as well as the range of masses we would expect these ejected planets to have. And in reality, the total population of free-floating planets almost certainly comes from some combination of several effects, each contributing their own subpopulations. But with recent and upcoming observations from Subaru Hyper Suprime-Cam, TESS, Roman, and JWST, there will certainly be no lack of data to which models like these can be compared.
Original astrobite edited by Sahil Hedge.
About the author, Mark Dodici:
Mark is a PhD student in astronomy and astrophysics at the University of Toronto. His space-based interests include planetary systems, from their births to their varied deaths, as well as the dynamics of just about anything else. His Earth-based interests include coffee, photography, and a little bit of singing now and again. You can follow him on X (@MarkDodici) or on BlueSky (@dodici.bsky.social).
The post Tilted Tatooines Can Serve as a Source of Strange Solo Planets appeared first on AAS Nova.
]]>
Quasars that have been gravitationally lensed by galaxy clusters provide a way to measure the expansion rate of the universe and possibly alleviate the Hubble tension.
The post Featured Image: Lensed Quasars and the Hubble Constant appeared first on AAS Nova.
]]>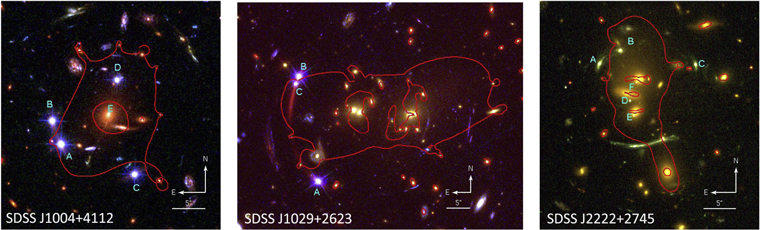
Hubble Space Telescope images of the three lensed quasars studied in this work. The multiple lensed images of the quasars are indicated by the cyan letters. [Napier et al. 2023]
Finding other ways to measure the Hubble constant may help alleviate the tension. In a recent article, Kate Napier (University of Michigan) and collaborators describe their derivation of the Hubble constant from observations of distant quasars: extremely luminous galactic centers in the early universe that are powered by matter falling onto a supermassive black hole. The quasars in the team’s sample are gravitationally lensed by clusters of galaxies, meaning that their light has been bent and magnified by the immense gravity of the clusters. The resulting value of the Hubble constant is consistent with measurements made from both the cosmic microwave background and supernovae, but the technique isn’t yet precise enough to favor one value over the other. To learn more about the use of lensed quasars for measuring the Hubble constant, be sure to check out the full article linked below.
Citation
“Hubble Constant Measurement from Three Large-Separation Quasars Strongly Lensed by Galaxy Clusters,” Kate Napier et al 2023 ApJ 959 134. doi:10.3847/1538-4357/ad045a
The post Featured Image: Lensed Quasars and the Hubble Constant appeared first on AAS Nova.
]]>
Following the recent AAS meeting, the AAS Press team led a group of reporters to LIGO Livingston to learn about the history and future of gravitational wave detections.
The post The AAS Goes to LIGO appeared first on AAS Nova.
]]>Joseph Giaime, a Professor of Physics at Louisiana State University, doesn’t sleep as soundly as he used to. The cause is obvious: every so often, his phone will emit a random, loud ping, regardless of the hour and without care for his desire to rest. He could turn these notifications off, but he purposefully chooses not to. In fact, he’s grateful for the recent disturbances: that’s because Giaime isn’t being woken up by a mindless news alert or a sleepless colleague, but by an automated system within the Laser Interferometer Gravitational-Wave Observatory (LIGO) informing him that it has just spotted a collision at the edge of eternity.
Giaime, like many physicists and astronomers, had to wait many decades to get these notifications, and now savors each one. What was once a just-out-of-reach dream has morphed into a steady stream of discoveries and phone alerts. Every few days LIGO reports that it heard the “sounds” of another merging pair of black holes, or occasionally a set of neutron stars that just smashed each other apart.
To better understand these extreme phenomena and how humanity got so good at detecting them, the AAS Press team led a group of reporters to the LIGO Livingston facility in southern Louisiana after the recent 243rd meeting of the AAS in New Orleans. Here, we provide a summary of that tour and what we learned from the dedicated scientists and support staff that worked for so long to hear the universe’s most distant rumbles.
Ripples in Reality
The “O” in LIGO denotes that the facility is an observatory, but unlike the vast majority of astronomical facilities throughout the world and in space, LIGO does not look for electromagnetic light. Instead, the massive 4-km-long arms that make up the Livingston facility were constructed to detect a different kind of wave: ripples in spacetime itself.

An artist’s rendition of two neutron stars spiraling towards each other and emitting gravitational waves. [ESA, CC BY-SA 3.0 IGO]
The Road to Detection
Today’s reality where LIGO regularly hears these signals (one was detected just three days before our visit) is very unlike the previous several decades of quiet. LIGO’s origins lie in a proposal to the National Science Foundation (NSF) submitted in the late 1980s. The team broke ground at the two identical facilities in Washington state and Louisiana in 1994 and 1995, respectively, before many of the graduate students currently working on the data analysis were born. Then, from the early 2000s through 2010, both facilities “listened” to the universe, but heard nothing.

Monitors in the LIGO control room to track the real-time noise contributions of various sources, including “human activity,” “ocean waves,” and “earthquakes.” [Ben Cassese]
Instead of backing away from their commitment, already one of the largest projects in their history, the NSF doubled down in 2010 and approved another tranche of funding to upgrade the facilities. LIGO went dark for five years as the collaboration overhauled numerous components, implementing both lessons learned during previous observations and new technologies that had been invented in the past decade. In 2015, they were ready to begin testing their new setup, dubbed “Advanced LIGO.”
Immediate and Continuing Payoff
In September, the collaboration was in the middle of an “engineering run,” meaning the detectors were fully operational but the team hadn’t yet transitioned into science operations. As has been well documented elsewhere, the impatient universe did not bother with their commissioning plans, and almost immediately the team recorded the distinctive and amazingly clear “chirp” of two merging black holes. “This [signal]was so big that we didn’t even need theorists” says Giaime, and immediately it became clear that the long wait for a gravitational wave signal was over.

Photographs hung on the walls of the LIGO Livingston site depicting scenes from upgrades and maintenance over the years. Click to enlarge. [Ben Cassese]
Other facilities have already joined the search for gravitational waves, and have now detected them at other frequencies. The NANOGrav collaboration and their discovery of a gravitational wave background, for example, was the focus of the kickoff plenary session at the 243rd meeting of the AAS. Other proposed projects, such as LISA, should continue exploring yet more frequencies in the coming years. Each of these missions will stand on the shoulders of scientists working near the Louisiana swamps, and the LIGO Livingston facility will rightly be remembered as a historical site in science.
The post The AAS Goes to LIGO appeared first on AAS Nova.
]]>
A pilot survey that scanned a small area of the sky with the world's largest radio dish has discovered four new pulsars, including two millisecond pulsars.
The post Four Pulsars Discovered in New Survey appeared first on AAS Nova.
]]>A pilot survey using the world’s largest radio dish has led to the discovery of four pulsars, two of which are ultra-precise millisecond pulsars. This survey highlights the wealth of pulsars that await discovery at intermediate galactic latitudes.
Small Stars with a Big Impact
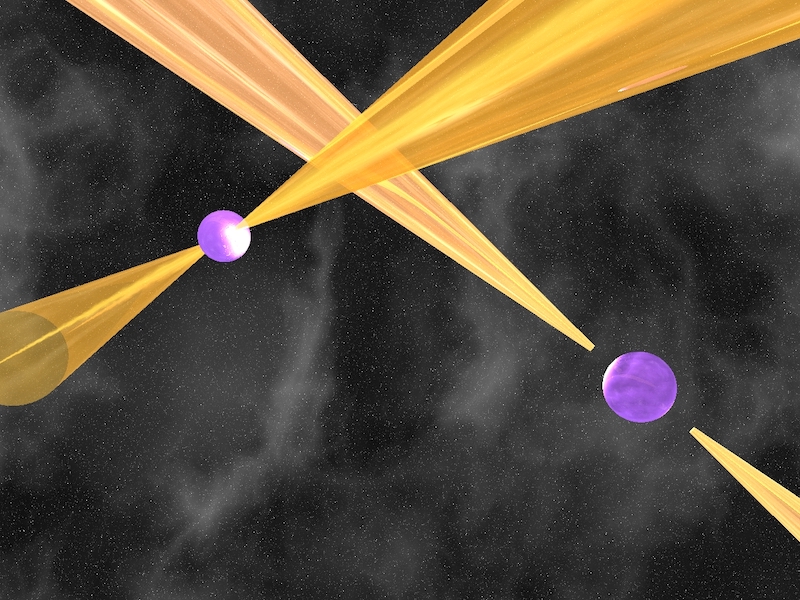
An artist’s impression of a pair of pulsars. [Michael Kramer (Jodrell Bank Observatory, University of Manchester)]

Several thousand pulsars have been discovered in our galaxy, but there’s a need to find even more: pulsars provide a path to studying stellar evolution, the interiors of neutron stars, and even gravitational waves. Millisecond pulsars — those with the shortest rotation periods, around 10 milliseconds or less — are especially precious, as their pulses are exceptionally regular. By monitoring the arrival times of the pulses from many millisecond pulsars at once, researchers have found evidence for the gravitational wave background, which is thought to be the combined signals of millions of distant supermassive black hole binaries.
A Small FAST Survey
Where and how do we find pulsars? The word pulsar is short for pulsating radio source, and most pulsars are identified in surveys by their characteristic pulses of radio emission. Like most stars, pulsars are concentrated in the thin disk of our galaxy, but interstellar clouds of gas and dust in this region can scatter pulsar signals. Searching the area just above the galactic plane makes for easier pulsar discovery, and current evidence suggests that millisecond pulsars may be more common in these higher-latitude regions.

Pulse profiles of the four newly discovered pulsars. Click to enlarge. [Zhi et al. 2024]
More Pulsars to Come

Illustration of how galactic latitude is measured. [AAS Nova/Kerry Hensley]
Zhi and collaborators expect that many more pulsars await discovery at intermediate galactic latitudes, 5 to 15 degrees above the midplane of the Milky Way. Considering the success of their limited pilot study, the team expects that roughly 900 millisecond pulsars could be found in that region.
Citation
“Discovery of Four Pulsars in a Pilot Survey at Intermediate Galactic Latitudes with FAST,” Q. J. Zhi et al 2024 ApJ 960 79. doi:10.3847/1538-4357/ad0eca
The post Four Pulsars Discovered in New Survey appeared first on AAS Nova.
]]>
Astrobites reports on using machine learning to make tracing the complex chemistry of protoplanetary disks a little easier.
The post What Drives Chemistry in a Protoplanetary Disk? appeared first on AAS Nova.
]]>Editor’s Note: Astrobites is a graduate-student-run organization that digests astrophysical literature for undergraduate students. As part of the partnership between the AAS and astrobites, we occasionally repost astrobites content here at AAS Nova. We hope you enjoy this post from astrobites; the original can be viewed at astrobites.org.
Title: Disentangling CO Chemistry in a Protoplanetary Disk Using Explanatory Machine Learning Techniques
Authors: Amina Diop et al.
First Author’s Institution: University of Virginia
Status: Published in ApJ
As the birthplaces of planets, protoplanetary disks hold many useful clues for how planets form and evolve. One of the pieces of information we can gather from disks is composition — to date, more than 35 different molecules have been detected in disks (see this bite for a summary of how these molecules are detected). Ideally, we want to be able to connect the abundances of different molecules to disk properties, such as total mass. This is more easily said than done, however, as a lot of different factors can alter the observed abundances of different molecular species. For example, one of the molecules we arguably have the best chemical understanding of is CO (carbon monoxide), which has been studied in a number of protoplanetary disks. Nonetheless, measured CO abundances tend to be lower than expected, indicating that effects such as local variations in temperature and dust distributions throughout the disk may have a significant impact on the observed abundances.
In order to try to understand the connection between local disk environments and molecular abundances, studies typically simulate a disk many times over, running through a huge range of different disk properties. As you might imagine, this approach is slow and takes a lot of computational resources. Today’s authors are trying a new method, using machine learning to more quickly find connections between disk properties and abundances. The goal is to use machine learning to search large parameter spaces and understand which physical disk properties are most important to creating and destroying CO in disks.
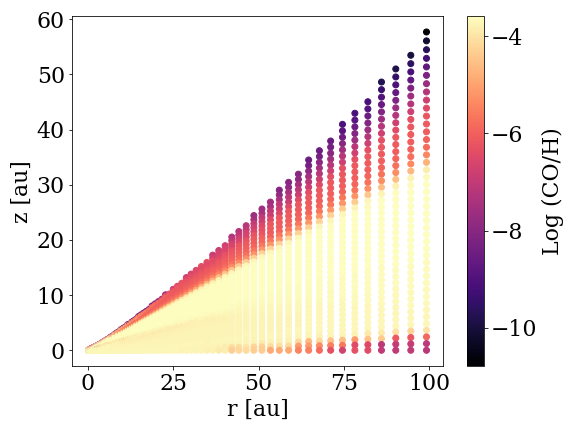
Figure 1: The initial CO abundances relative to hydrogen throughout the disk. You can think of r and z as x and y coordinates in the disk, where the star would be at (0,0). [Diop et al. 2024]
Making a Disk Model
The authors start with a disk around a T Tauri star (a type of young variable star that could be a typical host to disks). They assign a corresponding temperature and X-ray luminosity to the star, and they assume the disk is a mix of gas and dust, with both large and small dust grains. After assuming some initial compositions for the disk, they then apply a complex chemical code, including several thousand (!) different reactions to the modeled disk to calculate the CO abundances over 3 million years. Figure 1 shows the initial distribution of CO in one of these models.
Bring on the Machine Learning!
The authors consider each CO abundance calculated in the disk as a separate sample (so each point in Figure 1 is a sample) and check how each point’s CO value compares to local disk properties at that point, such as temperature, ultraviolet flux, and gas density. Figure 2 shows one example, with CO abundances plotted for specific temperatures and gas densities throughout the disk.
Figure 2: The disk from Figure 1, a million years later. The points now show the CO abundance ratio for the corresponding temperature and gas density at each point in the disk. [Adapted from Diop et al. 2024]
The Top Contributors
After running their model and machine-learning algorithms, the authors found that the log of gas density is the most important factor in determining CO abundance. They note that this makes sense because the abundance of CO is typically related to the abundance of hydrogen (H2) gas in a disk. Interestingly, they also find that the log of gas density squared decreases with increasing CO. This is because at higher densities there is a competing effect of depleting CO as it freezes into ice in dense, cold regions of the disk.
Figure 3: The coefficients indicating positive or negative correlation of the parameters listed on the left with CO abundance. Tgas and ngas correspond to the gas temperature and density, while FUV is the ultraviolet flux from the star, ζcr describes the cosmic ray rate, and ζxr is the X-ray rate. [Diop et al. 2024]
Know Thy Disk
This study provides a great proof of concept for the ways in which machine learning can be used to identify complex relationships in datasets — a particularly useful tool for studying the large number of entwined reactions involved in chemistry. It also brings up the important issue that molecular abundances can be influenced by many different factors, so we should consider disks as holistically as possible and always think about how multiple parameters may interact for a particular disk!
Original astrobite edited by Lucas Brown.
About the author, Isabella Trierweiler:
I’m a fifth-year grad student at UCLA. I’m interested in planet formation, and I study the compositions of exoplanets using polluted white dwarfs. In my free time I like knitting, playing train games, and growing various fruit trees.
The post What Drives Chemistry in a Protoplanetary Disk? appeared first on AAS Nova.
]]>
On the final day of AAS 243, we heard about a curious gamma-ray anisotropy, the role of small bodies in the solar system, and the relic of an active galactic nucleus's eruption.
The post AAS 243: Day 4 appeared first on AAS Nova.
]]>Editor’s Note: This week we’re at the 243rd AAS meeting in New Orleans, LA. Along with a team of authors from Astrobites, we will be writing updates on selected events at the meeting and posting each day. Follow along here or at astrobites.com for daily summaries, or follow @astrobites.bsky.social on BlueSky for more coverage. The usual posting schedule for AAS Nova will resume on January 16th.
Table of Contents:
- Committee on Astronomy and Public Policy Plenary Lecture: Lia Epperson (American University – Washington College of Law)
- Press Conference: High-Energy Universe
- Plenary Lecture: New Views of Dust and Star Formation in Nearby Galaxies with JWST, Karin Sandstrom (University of California, San Diego)
- Press Conference: Oddities in the Sky
- Dannie Heineman Prize Lecture: Small Bodies: Primitive Witnesses to the Birth of a Habitable Solar System, Karen Meech (University of Hawaiʻi)
- Berkeley Prize Lecture: Exploring Our Transient Universe In All Colors, Wen-fai Fong (Northwestern University)
Committee on Astronomy and Public Policy Plenary Lecture: Lia Epperson (American University – Washington College of Law) (by Briley Lewis)
The final day of AAS 243 began with a plenary on an important topic: what the recent Supreme Court decisions on the use of race in college admissions mean for us as educators. In these cases, a group called Students for Fair Admissions (SFFA) challenged Harvard University and University of North Carolina (UNC) on their race-based considerations in admissions.
Epperson began by saying, “In an era where sometimes the pursuit of knowledge is maybe less appreciated than we would have liked as educators, I think it’s important for all of us to really understand the history of how we got to this moment.” Before diving into the details of the current cases, she provided an overview of how race, education, and affirmative action have been intertwined in the history of US law.
Race is embedded in the US Constitution (with the three-fifths, importation, and fugitive slave clauses), clearly indicating that our country’s founding document cared about “embedding a racial hierarchy,” said Epperson. This initial founding law has had “ripple effects on education and access to education” throughout US history, she added.
The first landmark case on education and race was Sweatt vs. Painter in 1950, when a Black student challenged a Texas law school. The Supreme Court decided that denying admission denied the student “standing in the community, traditions, and prestige customarily accorded to white students.” This ruling made clear that diversity and inclusion were to be considered a fundamental part of higher education.
Soon after, in 1954, the famous Brown vs. Board of Education ruling was issued, establishing separate education as inherently unequal. The term “affirmative action” then appeared in 1961 — not as a Supreme Court ruling or law specific to education, but from an executive order from President Kennedy initially intended for employment and contracting. The order stated that “government contractors may take affirmative action” to ensure treatment is not racially divided.
Forty years of legal precedent thereafter solidified the importance of race in holistic admissions processes, citing the benefits to democracy and pathways to leadership provided by education. Three crucial cases in this precedent were Bakke vs. Regents of UC Davis (1978), Grutter v. Bollinger and Gratz v. Bollinger (2003), and Fisher v. Texas I and II (2003, 2006). Research on K-12 schools has also shown that diverse schools improve students’ critical thinking skills, increase their civic engagement, and lead to higher graduation rates.
The Harvard case was the first to challenge race-conscious admissions, at an institution that excluded people of color for 85% of its 400-year history. UNC was founded in 1789 to serve the children of slave owners and didn’t admit their first Black student until 1951 (and even then, it was only due to a federal court order).
The questions posed before the court in these two contemporary cases were the following: Does Harvard violate Title IX by discriminating against Asian Americans? Do these schools fail to use race-neutral alternatives? Do they use race as more than just a factor to boost applicants?
Lower court decisions upheld the precedent supporting race-conscious admissions, yet the Supreme Court changed tack. In a decision that Judge Ketanji Brown Jackson described as defying “law, history, logic, and justice,” the court cited that there was no compelling interest to continue affirmative action (considering diversity only a “commendable goal”), claimed that affirmative action relied on racial stereotypes, and that there was no clear end in time for affirmative action as described in the past.
Epperson clearly described what colleges may and may not do in the wake of this decision, and factors the court did not address. Colleges may design their missions as they see fit, and they may include qualities from student experiences based on race. The decision did not address scholarships, financial aid, recruitment, retention, pathway programs, employment, or DEIA programs — only admissions. It also does not affect employment, which is covered by Title VII of the Civil Rights Act.
Additionally, colleges are still allowed other forms of affirmative action that universities use to shape their student population. Legacy admissions are still legal, and often biased towards white students; for example, Princeton legacy applicants have nearly a 30% success rate in admissions, while everyone else has a less than 5% shot. Similarly, colleges are allowed to consider major donors, demographic/regional preferences, socioeconomic status, and athletes. Shockingly, only 11% of athletes would be admitted without this bonus factor in their favor.
In the wake of this decision, SFFA is instigating further litigation, including a challenge to a prestigious high school magnet program focused on diversity, to fellowship and grant programs aimed at increasing diversity, and to West Point (because the original court decision didn’t apply to military academies). Epperson also highlighted ongoing efforts to counter these efforts and increase diversity in university admissions: targeted recruitment and retention, a more holistic admissions process, elimination of other forms of affirmative action (e.g., legacy), elimination of college entrance exam requirements, and legislation to further diversity.
Press Conference: High-Energy Universe (by Mark Popinchalk)
It’s the last day of AAS, and while attendees might have low energy, this press conference was full of high-energy (astrophysics)!
Evidence of a Relic Active Galactic Nucleus Eruption (Press release)
The press conference started with Kimberly Weaver (NASA Goddard SFC) telling us how XMM Newton found a relic of an eruption from an active galaxy! Active galactic nuclei (AGN) are the centers of galaxies with a supermassive black hole accreting a hot disk of material. This produces lots of energy, and it can even produce high-powered jets, such as the AGN in Messier 87.
The team wanted to understand how AGN may affect star formation and power galactic outflows. All this high energy and moving matter should have a significant effect on galaxy evolution, and it was expected that one could trace previous nuclear activity.
So the researchers used ESA’s XMM Newton to look at NGC 4945. NGC 4945 is a spiral galaxy, also classified as a starburst due to its recent star formation. XMM has high sensitivity and a wide field of view. With just one observation they could image the entire galaxy.
Using their data, they saw that high-energy X-rays were outlining a huge clump of cold gas, 32,000 light-years long! But there were clearly some things in the way of the gas, such as individual stars and the light from the AGN itself. So they took further images using NASA’s Chandra X-ray Observatory. Using these observations they could remove the intervening features and still see a huge amount of cold gas.

A slide from the press conference of Kimberly Weaver showing cold gas in a distant galaxy.
The gas lined up with other observations suggesting a strong collimated outflow of material. The team thinks that 5 million years ago, jets from the AGN weren’t aimed out into space like they are in Messier 87, but instead smashed into the rest of the galaxy! Theory says that once they smash into the thing, the jets then disappear. So what we have leftover is a relic signature of how the jet drove in and left behind the cold gas clouds as a fossil of that activity.
Unveiling the Most Promising Formation Channel of Fast Radio Bursts Using Local Universe Bursts (Press release)
Next up were Aaron Pearlman (McGill University) and Mohit Bhardwaj (Carnegie Mellon University), who were presenting the evidence for a potential dominant formation channel of fast radio bursts (FRBs). FRBs are bright radio pulses of millisecond duration. What causes them is unknown, but the source must be very powerful, as the signals travel between galaxies. We know this because as radio waves move through intervening material, the signal disperses, and the amount of dispersion in FRB signals implies that they come from outside the galaxy.
But what causes them? And can there be multiple formation channels? The researchers used the CHIME radio telescope. Using it, they are able to find roughly 100 new FRBs per month. Using the telescope they can identify the location of the FRBs within 1 arcmin.
Using their previous database, they associated four of the FRBs to nearby spiral galaxies. Then they looked at other local-universe FRB sources that were associated with a galaxy, and saw that the sources are spiral galaxies.
Now that they had spiral galaxies as a clue, they could rule out many of the proposed formation methods. Globular clusters as a source was out, as we would see them from elliptical galaxies too. Certain stellar interactions? No way, otherwise it wouldn’t just be spirals either. Since they were all coming from spirals, they think this means it has to be one thing and one thing only: core collapse supernovae.

A slide from the press conference of Aaron Pearlman and Mohit Bhardwaj showing potential origins of fast radio bursts.
The prevalence of spiral hosts in the local universe is a major clue for FRBs, but it doesn’t answer everything. For example, we know of repeating FRBs — how does a supernova happen twice!
Evidence for Large-Scale Anisotropy in the Gamma-ray Sky (Press release)
Next up was Alexander Kashlinsky (NASA Goddard SFC), who had a real mystery to share with us all, about the distribution of gamma-ray radiation in the universe.
To start, there is a well-documented and studied dipole distribution in the cosmic microwave background radiation. In other words, there seems to be a preferred direction to it. There shouldn’t really be, but one possible explanation is that it could be due to the motion of the solar system making it appear that way.
If the CMD dipole is simply due to the solar system’s motion, then it should be detectable in gamma-ray radiation, too. If it isn’t, then it could have a potential cosmological implication.
Kashlinsky intended to probe for the dipole moment of the gamma-ray sky using Fermi LAT observations. Gamma rays are not microwaves, and due to relativistic effects they expected any dipole to be a bit higher in amplitude than that of the CMB.
However, what they measured was a gamma-ray dipole 10 times greater in amplitude than the CMB! They checked to see if the same is true for ultra-high-energy cosmic rays and found a similar dipole. They thought that maybe the ultra-high-energy cosmic rays are causing the gamma-ray dipole when they cascade and decay, but after looking at how that energy would be dissipated, it doesn’t make sense.

A slide from the press conference of Alexander Kashlinsky showing the location of the bizarre gamma-ray dipole.
Instead, it may be possible that the ultra-high-energy cosmic rays and the gamma rays come from the same source. So this co-emission of both ultra-high-energy cosmic rays and gamma rays seems to be coming from a yet unknown source!
Astronomers Find Spark of Star Birth Across Billions of Years (Press release)
Finally, Michael Calzadilla (MIT) asked the room how we arrived at the galaxies that we see today. Galaxies that we see today are either elliptical, sometimes called “red and dead,” while others are star-forming spirals. How do galaxies acquire the gas needed for star formation? Gas comes in and out of galaxies, and when the thermodynamics is right, stars can form. This atmospheric cooling has been known for the last 2 billion years and shown to be important for modern galaxies, but what about the past?
Well, the past was different! The peak of cosmic star formation was in the past, as well as galaxy mergers and black hole accretion, all peaking in the last 7–11 billion years. The challenge has been to find distant clusters and get multiwavelength follow up to understand their star formation.
The team used a well studied SPT-Chandra sample, which consists of an unbiased sample of 95 galaxy clusters spanning 10 billion years in evolution and that already had multiwavelength follow up.

A screenshot of the press conference of Michael Calzadilla discussing the atmosphere needed for star formation in galaxies.
They showed that the necessary thermodynamic conditions to trigger star formation that exist in the most recent 2 billion years are also needed back to 10 billion years ago too. So, it seems like making stars is still pretty similar! However, they found that the black hole feedback that regulates star formation in the current universe might not be doing the same thing in the past.
Perhaps a topic for a press conference at a future AAS!
Plenary Lecture: New Views of Dust and Star Formation in Nearby Galaxies with JWST, Karin Sandstrom (University of California, San Diego) (by William Lamb)
JWST is the gift that keeps on giving. It’s revolutionising astrophysics, cosmology, and our view of the universe. In this plenary, Karin Sandstrom offered attendees a snapshot of the incredible science that is being conducted with JWST after only 1.5 years of science operation.
Before JWST, there were some outlying questions regarding the baryon cycle: the flow of gas and dust from the interstellar medium onto galaxies that fuels star formation, which then causes the expulsion of material via outflows from the galaxy back into the interstellar medium. Those questions include what controls the gas reservoir for star formation and what controls the efficiency of star formation?
Previously, we had limited techniques to trace the interstellar medium and stellar formation, but with the telescope’s resolution and sensitivity to the near- and mid-infrared spectrum, this is no longer an issue. For example, Dr. Sandstrom attempted to get the audience excited about polycyclic aromatic hydrocarbons (PAHs), which are large carbonaceous molecules. The infrared emission from PAHs is strongly correlated with the presence of the interstellar medium. Thus, this makes PAHs a high-resolution tracer, which means by detecting PAHs, you detect where the interstellar medium is and where it is flowing. JWST’s light filters were designed to capture the emission from PAHs, hence JWST can create high-resolution maps of the interstellar medium in our Local Group. With this new map, we can compare simulations of galaxy formation to high-quality data to improve our models, and further refine our models of stellar formation.
And of course, Sandstrom just had to share some of the stunning images from JWST’s remarkable instrumentation…

Sandstrom presenting an image of NGC 628 as taken by JWST.
Press Conference: Oddities in the Sky (by Isabella Trierweiler)
True to its name, this session included a variety of puzzling phenomena that challenge our current astronomical models!
A Big Ring on the Sky: Alexia Lopez (Jeremiah Horrocks Institute – University of Central Lancashire) (Press release)
The standard model describes our best understanding of cosmology in our universe, and it hinges on a critical assumption, that the structure of our universe is isotropic and homogeneous on the largest scales. Verifying the assumption of homogeneity is really important; we currently estimate that the scale of homogeneity is about 1.2 billion light-years. In other words, the universe should not have any overarching structures that are larger than this scale. However, two years ago Lopez presented one large-scale structure that challenges homogeneity (the “Giant Arc”), and today she presented a second such structure called the “Big Ring.” The two structures are 3.3 billion and 1.3 billion light-years across, respectively.
To find these structures, Lopez uses the light from distant quasars to identify clumps of intervening matter. From the quasar mapping, she can construct a 3D map of intervening large-scale structure, with locations based on the dimmed quasars and distances extrapolated from Mg II absorption. Both of the identified structures are curiously about 9.2 billion light-years away, and they are quite close together on the sky. However, it’s unclear if this is a sign of a larger trend in the distribution of large scale structures. If these structures are proof that our current standard model for cosmology is insufficient, some options for improving our model include invoking cosmic strings, which may construct large scale structures, or assuming a “conformal cyclic cosmology” in which we are living in an infinite cycle of universes, resulting in the creation of circular structures. Lopez plans to continue her quasar analysis to get a better idea of how common these homogeneity-breaking structures might be.
A Potentially Isolated Quiescent Dwarf Galaxy: Timothy Carleton (Arizona State University)
Carleton presented an odd galaxy that was fortuitously observed by the PEARLS project, an extragalactic survey using JWST. He noticed the galaxy (called PEARLSDG) in the PEARLS images due to its odd appearance relative to the other nearby galaxies, which were the original targets of the survey. PEARLSDG is a dwarf galaxy imaged in remarkable detail — JWST was actually able to resolve individual stars in the galaxy! While most dwarf galaxies imaged by PEARLS and other projects are either young and isolated or old with a massive companion, PEARLSDG sticks out as an old, isolated galaxy. How old and isolated galaxies form remains an open question, and Carleton says further spectroscopy of the galaxy will help characterize it and hopefully shed more light on how it formed.

Timothy Carleton presents JWST observations of a potential isolated dwarf galaxy.
Close Encounters of the Supermassive Black Hole Kind: Tidal Disruption Events and What They Can Reveal About Black Holes and Stars in Distant Galaxies: Ananya Bandopadhyay (Syracuse University) (Press release)
Supermassive black holes (SMBHs) are intriguing objects that are generally very difficult to study as they do not emit light. Because of this, tidal disruption events (TDEs) are especially valuable events, providing some insight into the properties of the SMBH. TDEs occur when a star approaches a SMBH and is disrupted by the strong tidal forces around the black hole. The disruption and accretion of the star in turn spark a flare whose light curve we can measure. TDEs are relatively rare, and we know of about a hundred of these events so far. The typical pattern for a TDE light curve is a rise in brightness over a 30–50 day period, followed by a gradual tapering off period. The main question in this work is what determines the peak luminosity and the timescale of this light curve.
We typically use analytical approximations to recreate the shape of the light curves, but Bandopadhyay demonstrated that the generally accepted analytical model for TDEs results in a very different light curve relative to detailed hydrodynamical simulations, motivating the need for a new model. She presented an updated model for TDE light curves in which she demonstrated that the timing of the peak in the light curve is actually independent of the mass of the accreted star, remaining at ~50 days across the board, while the peak luminosity of the TDE scales with the stellar mass. One of the implications of this finding is that TDEs that are energetic enough to cause jets around the SMBH are likely related to the disruptions of high-mass stars.
Impressively, much of the work of the project was completed by high school students! Syracuse University hosts a summer research program, and their student interns worked on the numerical simulations for the TDEs and are co-authors for this work.
Zooniverse People-Powered Research Platform Reaches New Milestones: Laura Trouille (The Adler Planetarium; Zooniverse)
Zooniverse is the largest platform available for citizen science, with over 2.6 million participants around the world. It was started in 2007 through the founding of the GalaxyZoo project, in which members of the public helped classify different galaxy images. The platform grew rapidly, particularly after 2015 when a DIY project builder was added so that any researcher could easily create their own project. Laura shared that currently 40–50 new projects are added every year! Between the large user base and integrated machine learning algorithms, Zooniverse is a very powerful tool for analyzing large datasets and has led to over 400 scientific publications, often with citizen scientists included as co-authors.
Trouille noted a few recent results from Zooniverse projects. Having so many different eyes on the data makes Zooniverse especially good at identifying unusual features that would typically escape notice in simple coded pipelines. In the past few weeks, the project “Planet Hunters TESS” discovered a habitable-zone planet while the “Backyard Worlds” team identified an aurora on a brown dwarf! To date, citizen science users have contributed 1.6 million hours of work to Zooniverse projects, the equivalent of nearly 800 full-time workers.
If you’d like to contribute as a citizen scientist, getting involved is super easy! Consider joining the gamma-ray bursts team, or hunt for asteroids with the Daily Minor Planet group. And if you’re a scientist who would like to start your own project, definitely do reach out to Trouille and her team.
Dannie Heineman Prize Lecture: Small Bodies: Primitive Witnesses to the Birth of a Habitable Solar System, Karen Meech (University of Hawaiʻi) (by Yoni Brande)
Karen Meech, the winner of the 2023 Dannie Heineman Prize for Astrophysics, has spent her career studying small bodies (like comets and asteroids) in the solar system. Her prize lecture today focused on how observations of these bodies can teach us about how both our own solar system evolved and how extrasolar planetary systems may be able to develop habitability.
Our current understanding of the development of life says that habitability needs liquid water, organic energy sources, and rocky planets. No currently known extrasolar planetary systems meet these criteria, so we need to know whether the conditions in our solar system are unique.
A common refrain in astrobiology is “follow the water” — that is, understand where water is in a system and how it moves around, and then we should be able to predict where life might arise. In order to study the water content of the early solar system, astrobiologists like Meech and collaborators use remote observations as well as direct analysis of samples of comets and asteroids, which are cosmic detritus left over from those early eras. Meech showed a short review of this history, showing that within a few hundred million years of Earth’s formation, it already had liquid water oceans. The main question, then, is how the water got here.
One theory says that icy bodies from the outer reaches of the solar system were gravitationally scattered to the inner solar system and eventually impacted Earth. This cometary water then became the main reservoir. To test this, we can look at the ratio of deuterium to hydrogen (D/H). The D/H ratio of the early solar system is low near the Sun and increases with distance from the Sun, making it a good tracer of formation location. Earth’s D/H value is significantly elevated for its current position, which is a point in favor of the icy body delivery theory. If high D/H comets swung by Earth and dropped off their water, that could increase Earth’s D/H ratio. However, the last few decades of observations have shown mixed D/H results for different small bodies, and Meech stressed that we really don’t fully understand these primordial isotopic ratios, or if they are even meaningful in studying these formation and evolution processes.
Ultimately, Meech says, water probably comes from multiple sources — we just need to figure out which sources and when. Planet formation is complex, with many chemical and dynamical processes jumbling up the possible tracers of this history. A newly observed kind of comet may finally untangle some of this historical web.
Long-period, tailless comets called “Manxes” (named after the cat) show spectra similar to inner-solar system rocky asteroids. Meech and collaborators’ studies of Manxes show they may have a complex history. They likely began their lives as normal main-belt asteroids (hence the similar spectra), but were dynamically scattered out to the Oort Cloud, and then scattered back into the inner solar system on comet-like orbits. They appear to have a range of surface colors, which could be evidence of diverse formation locations across the solar system.
Meech concluded with some final thoughts: the study of Earth’s water is interdisciplinary, merging expertise from astronomy, planetary science, geology, and more. We need a better understanding of the chemical and dynamical history of our solar system, and in order to obtain that we need in-situ explorations of solar system planets, small bodies, and even interstellar interlopers like ʻOumuamua. These topics have far-reaching implications for habitability and the origin of life. If the solar system is not representative of planetary systems in general, and if the conditions here are special, we can’t assume all other potentially habitable systems will have them as well.
Berkeley Prize Lecture: Exploring Our Transient Universe In All Colors, Wen-fai Fong (Northwestern University) (by Pratik Gandhi)
Wen-fai Fong, while receiving the Berkeley Prize, remarked that the award is important to her because it recognizes not only her work but also that of her amazing research group. Throughout her plenary talk, she highlighted the work of her graduate students, postdocs, and external collaborators. Fong likes to study astronomical “transients,” or phenomena that are time-varying, using the technique of multi-messenger astronomy — probing these phenomena using observations across the entire electromagnetic spectrum from radio waves to gamma rays, and also using gravitational waves. As she remarked, “the universe varies on remarkably human timescales,” and she derives great joy from observing it in all its variety of colors.
Speaking of colors, Fong highlighted three key themes throughout her talk: (1) Teamwork, which she discussed as being crucial for the kind of fast-paced, time-sensitive research required in transient astronomy, (2) the importance of color, in terms of leveraging the entire electromagnetic spectrum, and (3) that timing is everything, especially in the discipline that she and her group specialize in.
In terms of why the study of transients is important, Fong mentioned that they are often the birthplaces of numerous heavy elements, laboratories for studying extreme physics, the sources of gravitational waves, and probes of otherwise invisible material that we wouldn’t have noticed otherwise. The sources of transients are often the formation of the three classes of compact objects: white dwarfs (WDs), neutron stars (NSs), and black holes (BHs). These compact objects are all the end stages of the life cycles of stars of different masses, with NSs and BHs occurring as a result of massive stars going supernova (which happen to be the most common transients).
Gamma-ray bursts (GRBs)
Fong mentioned how GRBs were first discovered in the 1960s, after which NASA developed multiple gamma-ray observatories in space. Thousands of GRBs have been detected to date, and they are usually extragalactic in origin. GRBs come in two populations (long and short), with short GRBs occurring during NS-NS mergers and long GRBs happening during the collapse of massive stars. Her group focuses mainly on short GRBs; the first evidence for which was the 2017 discovery of gravitational waves from a NS-NS merger followed by a GRB. Short GRBs have been detected in galaxies out to redshifts of z ~ 2!
Fong highlighted how when GRBs are detected (by the Swift telescope, for example), her phone will ping with notifications. Time is of the essence, because they have to mobilize multiple telescopes across the spectrum immediately. Right before Thanksgiving 2023 there was a GRB that was detected, and it was only through the amazing teamwork of her group that they were able to mobilize multiple telescopes and get memos (“circulars”) out to the transients community!
Questions that the Fong group is trying to address concerning GRBs include the following: What do two NSs create? How and where are heavy elements created? What conditions are required to produce these rare transients? The afterglow radiation that produces the GRBs gives us a handle on burst energetics. The NS-NS merger itself tells us about the mass of heavy elements produced. Finally, her group is working on building the BRIGHT repository, a catalog of galaxies that host GRBs, to try to understand the conditions required for them to occur.
Fast radio bursts (FRBs)
Fong also highlighted a second kind of transient, which has only recently been discovered. In 2007, a serendipitous discovery sparked the fast radio burst (FRB) revolution. FRBs are milliseconds-long bright radio pulses similar to GRBs but on the radio side of the spectrum. Some FRBs repeat periodically while others do not, and the cause of this difference is still unknown! Leading hypotheses for the sources of FRBs include magnetars, or extremely magnetized neutron stars. The Fong group is part of the “Fast and Fortunate FRB Follow-up” (F4) collaboration, which mobilizes telescopes across the electromagnetic spectrum, from ALMA to Chandra, in order to also look at the host galaxies of the FRBs.
Fong concluded the talk by returning to the importance of teamwork, color, and timing, and saying, “There is incredible momentum behind this field and the era of 1,000+ hosts is not far away — we’re thrilled; we’re excited; we’re scared!”
The post AAS 243: Day 4 appeared first on AAS Nova.
]]>
Day 3 of AAS 243 brought an investigation of inflation, discussions of neutron stars, and a spectacular star that contains the signature of a supernova 13 billion years ago.
The post AAS 243: Day 3 appeared first on AAS Nova.
]]>Editor’s Note: This week we’re at the 243rd AAS meeting in New Orleans, LA. Along with a team of authors from Astrobites, we will be writing updates on selected events at the meeting and posting each day. Follow along here or at astrobites.com for daily summaries, or follow @astrobites.bsky.social on BlueSky for more coverage. The usual posting schedule for AAS Nova will resume on January 16th.
Table of Contents:
- Henry Norris Russell Lectureship: Frank Shu’s Legacy in Unraveling Star Formation, Susana Lizano (Instituto De Radioastronomia Y Astrofisica)
- Press Conference: Supernovae and Stars
- Annie Jump Cannon Prize Lecture: Marta Bryan (University of Toronto)
- Press Conference: Stars, Disks & Exoplanets
- Plenary Lecture: Investigating the Early Universe, Jamie Bock (California Institute of Technology)
- Newton Lacey Pierce Prize Lecture: Characterizing the Properties of Accreting Neutron Stars through X-ray Observations, Renee Ludlam (Wayne State University)
Henry Norris Russell Lectureship: Frank Shu’s Legacy in Unraveling Star Formation, Susana Lizano (Instituto De Radioastronomia Y Astrofisica) (by Ivey Davis)
Frank Shu was a titan of astrophysical fluid dynamics theory, with his work being seminal to our understanding of star and planet formation, protoplanetary (and planetary) disk structure, galactic spiral arm formation and stability, and nigh countless other topics across essentially all fields in astrophysics. He was awarded the Henry Norris Russell Lectureship before his passing in April of 2023. Upon being awarded the Lectureship, he not only requested that Susana Lizano give this lecture on his behalf, but also donated the associated money back to the AAS. In honor of Shu’s contribution to astrophysical fluid dynamics, and astronomy as a whole, Lizano gave an overview of Shu’s career, which in a way is an overview of the field of star formation theory.
Shu’s first work was addressing the spiral structure of galaxies by treating them as density waves propagating through a disk, rather than as fixed, physical structures as had originally been assumed. This new framework solved the winding problem that had arisen in the fixed-structure framework, as well as addressed other galactic features like color gradients and the locations of OB star associations. Similar density-wave treatments would later be applied to other places we see disks, such as in Saturn’s rings and in the material around young or forming stars.
In 1977, Shu published his work on the collapse of spheres of gas as a way to explain core formation and subsequent star formation. A decade later, he, along with Lizano and Fred Adams, would publish the review that is still used as the star formation paradigm, showing how pressure, temperature, and density evolve with time to eventually form young stellar objects from molecular gas clouds and also explains the onset of the Hayashi track. Expansions of this work to rigorously analyze the effects of magnetic fields and rotation on gaseous bodies, both by Shu and by others, would go on to explain or elaborate on evolutionary sequences from protostars to main-sequence stars, the scale height and aspect ratio of accretion disks, disk formation conditions, planetary migration, planetesimal formation, and so much more.
Shu was an active researcher and astronomical community member, serving as president of the AAS from 1994 to 1996, and most recently was investigating technologies to help combat the climate crisis. Questions following Lizano’s talk not only included questions about what the future of the field looked like, but also recountings of individuals’ personal experiences with Shu. This lecture was a truly heartfelt tribute to a dedicated astronomer and mentor.
Press Conference: Supernovae and Stars (by Mark Popinchalk)
This press conference was all about stars going supernova! (Except for one result about galactic gas that was shuffled into the session due to a missed flight.)
A 12.4-Day Periodicity in a Close Binary System After a Supernova (Press release)
First, Ping Chen (Weizmann Institute of Science) shared a peculiar system with us. You can measure the kind of light a supernova gives off to see what elements are in it. It may have some hydrogen, or helium, or neither. This is often thought to be due to what the outer layers of the star were doing before the explosion. The dense core will stay put, but the outer layers of hydrogen or helium may or may not get stripped off. Whether this stripping always occurs, and how it happens, is hotly debated.
The case of the supernova SN 2022jli is especially weird. Its brightness shows a periodic dimming and brightening on a 12.4-day period, which is already unique. It becomes even more interesting that the spectra of the supernova usually doesn’t show hydrogen, except for particular points in the 12.4-day period!

A six-panel slide from Ping Chen’s talk showing the orbital interactions of the compact supernova survivor and its binary companion.
The story appears to be that there were two stars in a binary system, one that went supernova and is now a compact object, and the other a star in an elliptical orbit around the remnant. When the outer star approaches the remnant on its orbit, the remnant strips some hydrogen from the outer star and the extra hydrogen is added to the remnant’s spectra. The outer star has to be on an elliptical orbit so that the stripping only occurs at certain points during the star’s orbit.
Interesting!
Rare Insight Into the Origins of Type Ia Supernovae Progenitors From a Double Detonation (Press release)
Estefania Padilla Gonzalez (UC Santa Barbara and Las Cumbres Observatory) introduced the audience to a great candidate for a double detonation Type Ia supernova. She started by introducing us all to Type Ia supernovae. They have predictive luminosity, which is to say that the light from their explosions are understood really well, and they have been used as “standard candles” to enable distance measurements to other galaxies.
Even though they are well understood, there are still some questions on how Type Ia supernovae explode. The common understanding is that to have a Type Ia supernova you need a white dwarf that is under 1.4 solar masses, the Chandrasekhar limit. Then you need another nearby star to feed mass onto the white dwarf until it crosses that limit, and boom! Supernova!
However, there may be sub-Chandrasekhar-mass explosions. Their occurrence is not currently supported by observations, but they are theoretically possible. How can we get the smaller stars to explode? The idea is that the helium layer surrounding the core of the star starts to ignite early, which causes a shock wave that travels around the star. When the shock waves meet each other, that provides even more force that could trigger the rest of the core to go full supernova.

Summary slide from Estefania Padilla Gonzalez’s talk.
And that’s where the team’s research comes in! SN 2022joj is a Type Ia supernova that has a few different characteristics, a non-standard candle. For example, there is suppression in the blue wavelengths of the light it emits, which might be due to helium ash absorption at those wavelengths. However, once the full explosion occurs, the end result looks like a regular Type I supernova.
It’s an exciting candidate for a double detonation of a thin helium shell!
Periodic Eruptions of a Supernova Impostor
Mojgan Aghakhanloo (University of Virginia) was next, and had an intriguing system, an impostor supernova! SN 2000ch is the impostor in question, and it’s thought to be an evolved massive star that has undergone non-terminal eruptions. What does that mean? It’s a big star that’s not dead yet. Eta Carinae is a great example that some might be familiar with — huge outer layers barely contained in its gravity influence, a star that is just clinging to life. It went through a “Great Eruption” in the past.
SN 2000ch is having an even worse time. Since 2000, it’s had 23 different eruptions, and the team has shown that there is an interesting periodicity to it, that the eruptions occur approximately every 200.7 ± 2 days. What’s the cause? It’s probably another binary system!

A summary slide from Mojgan Aghakhanloo’s talk showing the binary orbit interacting with the outer layer of the massive star.
The big evolved star is not by itself and has a secondary companion in the system, orbiting around it. As the other star gets close, it passes through the outer layers, causing eruptions. And since the layers are so extended, it is likely that the material the path goes through changes, explaining why some eruptions are bigger than others.
These eruptions look just like those that Eta Carinae went through, and makes this a target of “great interest.” The next eruption is likely in March of this year!
Spectacular Nucleosynthesis from Early Massive Stars (Press release)
Alexander Ji (University of Chicago) brought us a really interesting story, a star with such a bizarre composition, that it likely formed from the supernova of a really big star! That’s right: learning about an older star by looking at a current one.
SDSS is a huge survey mission that is “lawn-mowering the sky” taking spectra of stars. It discovered a star with spectacular composition. J0931, an old star, has unusually low magnesium abundance for its metallicity, and was flagged for follow up by the Magellan telescope. The additional observation showed that it also had strangely low amounts of sodium, and tons of strontium.
What does that all mean? Well, if they trace back to when the star is likely to have formed (~10 billion years ago), it must have come from a peculiar cloud of material to have these kinds of elemental ratios. These kinds of elements only form when a star goes supernova, and when compared to theoretical models of the kind of star that would need to go supernova to make that peculiar cloud, (to form the smaller star that exists today) it would have to be massive.

A slide from Alexander Ji’s talk showing the progenitor supernova star before the next star.
So massive, that it would have to be > 50 times the mass of our Sun, even up to 80 solar masses. The challenge is that no model fits all the element ratios they find, and most models predict that stars that big shouldn’t even go supernova! A star that big should collapse directly into a black hole. The presence of this star shows that the existing supernova models are too simple, and that this particular star is a blockbuster.
They’ve given it a special name since they were working on it this summer: The Barbenheimer Star : )
The Nuclear Outflow from the Milky Way (Press release)
Last but not least was Jay Lockman (Green Bank Telescope), who had finally made it to AAS after flight troubles and was given a chance to speak at this press conference rather than the one he missed.
He pointed out that when we look at most large galaxies, they have bursts of energy in their cores that drive winds which carry mass out from the galaxy center. There is data to suggest a similar effect is happening in the Milky Way, but it is hard to see since we are in the plane of the disk. However, there are new observations that show that cold hydrogen clouds are being pushed by the hot wind from black holes or starbursts in the center of our galaxy.

A summary slide from Jay Lockman showing gas clouds shot out of the Milky Way.
A good analogy would be that the forces pushing from the center of the galaxy are an astrophysical mixture of a snow blower and a leaf blower! The movement of the gas is in straight lines out from the source and then spreads out, which is what a snow blower does. However the gas is being pushed around like leaves by a leaf blower. An autumnal/winter analogy!
The team has been attempting to locate over 300 clouds with the Green Bank Telescope. The flows are coming out in two cone shapes, at high velocities, with some clouds approaching the escape velocity of the Milky Way. They likely won’t escape, but it shows that the forces can certainly launch material around the galaxy!
Annie Jump Cannon Prize Lecture: Marta Bryan (University of Toronto) (by Ali Crisp)
In her lecture, 2023 Annie Jump Cannon Prize award winner Marta Bryan led us through her research on the dynamics of giant exoplanets and how dynamics can provide insight into the formation mechanisms of giant planets, their impacts on other planets in their systems, and even how they affect the potential habitability of a system.
To begin, she briefly explained what planetary properties we can learn from more “traditional” exoplanet studies using the radial velocity and transit techniques: the mass of the planet from radial velocity measurements, the radius of the planet from transit detections, and the orbital period, inclination, and eccentricity from either. She then adds that with new atmospheric detections, you can get information about the composition, spin, planetary obliquity, and weather on a giant planet.
But what does combining all these properties tell us? For one thing, characterizing planetary spin and comparing it to the host star’s spin can give us information about how the planet and star formed. In a perfect system, the spin of the star and planet would be aligned, and their equators would be parallel. However, we see even in our own system that this isn’t the case. Uranus, for instance, is tilted on its axis 98 degrees relative to the equator of the Sun, and Venus spins in the opposite direction from all the other planets. Constraining the orbital dynamics of exoplanets and finding any misalignments or spin oddities can indicate some sort of gravitational interaction occurred. In systems with close-in super-Earths and far-out giant planets, these suggested interactions could indicate that the giant planet caused misalignments or spin changes through, e.g., migration during its formation.
Bryan ends by contextualizing her observations and constraints in the search for biosignatures. As the number of confirmed exoplanets increases, it becomes impossible for us to characterize all their atmospheres. Since we know our own solar system hosts life and contains both close-in terrestrial planets and far-out gas giants, we could prioritize observations of similar systems for biosignatures and hopefully help constrain what constitutes habitability.
Press Conference: Stars, Disks & Exoplanets (by Isabella Trierweiler)
This session provided new insights into a variety of planetary systems and included two projects led by undergraduate students!
Stellar Paternity Tests: Matching High-Latitude B Stars to the Open Clusters of Their Birth (Press release)
Brandon Schweers and Ginny McSwain (Lehigh University)
Star formation in the Milky Way is generally believed to be restricted to the thin disk of the galaxy. However, there is an interesting population of B-type stars that have been observed far outside of the thin disk. Brandon Schweers, an undergrad at Lehigh University, sought to trace back the trajectories of these so-called “orphan” B stars to figure out whether they did indeed form in the thin disk and migrated away from home, or whether they represent a different pathway for star formation.
Schweers used kinematic data from Gaia to reconstruct the trajectories for stars in and around clusters over the past 30 million years. They then used those trajectories to see whether orphaned stars ever crossed paths with a potential “parent” cluster. Overall, Schweers found 22 intersections between orphan stars and parent clusters, with some stars intersecting multiple clusters. To validate whether the paired orphans and parents were indeed related, Schweers constructed color–magnitude diagrams for the parent clusters and checked whether the orphaned stars fell within the cluster’s parameter space. From this analysis, Schweers found 15 matches between orphan stars and parent clusters and was able to estimate the times at which the stars were originally ejected from their host clusters, as well as the initial velocities at the time of ejection. Based on the ejection velocities, Schweers found that one star was ejected due to a very energetic event, like a supernova, while the rest were likely ejected due to dynamical interactions with their parent cluster. Interestingly, a few orphan stars never intersected with any clusters, bringing up the question of whether there may be some star formation going on above and below the thin disk after all.
Weakened Magnetic Braking in the Exoplanet Host Star 51 Pegasi (Press release)
Travis Metcalfe (White Dwarf Research Corporation)
51 Pegasi (51 Peg) is one of the most famous stars in exoplanet science, as it hosts the first exoplanet astronomers ever discovered around a main-sequence star. Despite its planet being so well known, Travis Metcalfe showed that there is still more to learn about 51 Peg from its magnetic field structure. 51 Peg is a Sun-like star, which means it was likely born with a rapid spin and eventually slowed down as it shed angular momentum. The main mechanism for slowing rotation in a young star is called magnetic braking, where angular momentum is carried away by stellar winds, and the rate of the loss of angular momentum is depending on both the strength and complexity of the magnetic field around the star.
To map the magnetic field structure around 51 Peg, Metcalfe used data from the Large Binocular Telescope to first map the magnetic surface of the star and then reconstruct the magnetic field lines. Interestingly, he found that 51 Peg follows an unusual trend in magnetic braking where young, rapidly rotating stars have relatively strong braking, and then somewhat suddenly fall to a weakened braking state as they age. While the source of the drop is not entirely clear, it may have to do with changes in the complexity of the magnetic field structure around the aging stars. The Sun seems to have gone through this drop in braking as well, and curiously the timing of the drop in magnetic braking corresponds to emergence of land-based life on Earth, raising the question of how magnetic evolution of host stars and planet habitability may be intertwined.
JWST’s New View of Beta Pictoris Suggests Recent Episodic Dust Production from an Eccentric, Inclined Secondary Debris Disk (Press release 1, press release 2)
Christopher Stark (NASA Goddard)
Beta Pictoris is another well-known exoplanet system, remarkable both because its two known exoplanets reside in a debris disk and because it has shown evidence of exo-comets. Beta Pictoris’s debris disk has been a point of interest for decades, and more recently it was shown to have two components: an edge-on main disk and a somewhat warped secondary disk with interesting CO emissions. The complexity doesn’t stop there though; using NIRCam and MIRI data, Christopher Stark showed that even more features are hidden in Beta Pictoris’s disk!
The new MIRI images show a fork, an elongated feature (named the “cat’s tail”), and several shorter nebulous features. The data show that these features are connected to the secondary disk of Beta Pictoris, and that the material of the secondary disk appears to be different both in temperature and in composition from the main disk. Stark says the secondary disk material seems to be consistent with fluffy, organic, refractory material, not unlike the samples obtained by OSIRIS-REx. As far as the origins of the cat tail and other features, the most likely explanation is that they are the tails left by collisions within the debris belt. Stark showed that such a collision would need to occur in about the last 150 years to create the observed features, and furthermore that the shape of the cat tail is consistent with the same organic, refractory material extrapolated from the MIRI data. To complete the picture, the 150-year estimated timescale fits nicely with the observed CO emission. CO dissociates in about 150 years, so the observed CO would have been created relatively recently, and the collision that created the cat tail is a perfect candidate for emitting CO into the disk! Stark noted that in addition to providing more insight into the Beta Pictoris disk, these observations prove that debris disks could be a lot more active than we previously thought and should definitely be further investigated using JWST.
How Do Ultra-Massive Planets Form? Gaining New Insight by Measuring the Orbital Tilt of a Rare Transiting Brown Dwarf (Press release)
Steven Giacalone (Caltech)
Thus far, planets have been observed at a huge range of size scales, from our terrestrial planets up to Jupiter masses. However, there’s currently a gap between objects of Jupiter mass and low-mass stars. The few ultra-massive planets / brown dwarfs in this gap are intriguing objects, and their origins are an ongoing question. There are generally two options for their formation: either they form like planets, accreting in disks around stars, or they form like binary stars and collapse directly from gas. So far, most of the brown dwarfs appear to have orbits and compositions that are consistent with star-like formation. However, Steven Giacalone has a new observation that brings planet-like formation back into the picture.
For this study, Giacalone measured the orbital tilt of a brown dwarf, GPX-1b. GPX-1b is 20 times more massive than Jupiter and resides quite close to its host star. The orbital tilt is related to the formation pathway because brown dwarfs that form as planets should be aligned with the spin of the host star (like the planets in our own solar system), while brown dwarfs that form similar to stars could have any orbital orientations. Giacalone used the Keck Planet Finder to observe the brown dwarf’s transit. To measure the orbital tilt, he analyzed the wiggles in the transit spectrum that arise from the transiting brown dwarf crossing first the blue-shifted and then red-shifted portions of the star’s surface. From this method, he found that the tilt is aligned with the star, indicating that GPX-1b likely formed as a planet. Brown dwarfs are relatively rare objects, so this was the first measurement of its kind, and it introduces interesting new evidence for brown dwarf formation!
An Earth-Sized Addition to a 400-Myr Planetary System in the Ursa Major Moving Group (Press release)
Alyssa Jankowski and Melinda Soares-Furtado (University of Wisconsin – Madison)
Young planets are really important to our understanding of planet formation, but they are generally very difficult to find and reliably date. Alyssa Jankowski, an undergraduate at the University of Wisconsin-Madison, leveraged the power of moving groups, or stars that all formed from a common molecular cloud, to better date planet ages and search for young systems. In particular, Jankowski studied the system HD 63433, which is part of a moving group that includes many stars in the Big Dipper. HD 63433 is a Sun-like star, but it’s only about 400 million years old (compared to our solar system’s 4.6-billion-year age).
Previous work on the system unveiled two sub-Neptune sized plants, both on very short orbits. However, using new TESS data, Jankowski identified a third, Earth-sized planet in the system! The new planet has an incredibly short period of only 4 days, and while it is interior to the two sub-Neptunes, the whole system still fits within the orbit of Mercury. As the new planet is so close to the host star, it is likely tidally locked, leading to day-side temperatures of 1500K and a likely lava hemisphere. The new planet is really intriguing and presents an interesting opportunity to study atmospheric loss, a common trademark of young planets. Jankowski says there are plans to re-observe the system with Hubble and JWST soon and check for any heavy-element outgassing.
Plenary Lecture: Investigating the Early Universe, Jamie Bock (California Institute of Technology) (by Isabella Trierweiler)
In his plenary lecture, Jamie Bock shared some exciting new insights into the early universe, along with the technological improvements that will help us probe this era in greater detail in the coming years. In particular, Dr. Bock is interested in inflation, the period of time when the universe grew exponentially. Inflation is especially difficult to study; it was an incredibly high-energy event, making it impossible to study through experimentation (the energy scale is 1016 GeV, whereas the Large Hadron Collider currently reaches about 104 GeV), and it was a period of time when the universe very quickly moved from quantum scales to large-scale structures, complicating any attempts at simulation or computation. Thus direct observations remain our most powerful tool in studying the early universe.

A map of temperature fluctuations in the cosmic microwave background from WMAP. This map shows temperature deviations of up to 200 microkelvin. [NASA / WMAP Science Team]
Since its discovery in 1964, the cosmic microwave background (CMB) has been our main means of studying inflation. The CMB is the earliest light we can detect, made up of the photons that come from the moment the universe cooled enough for light to pass freely through space. To first order, all parts of the CMB are the same temperature, 2.7K. This is strong evidence of inflation because it means all parts of the sky needed to have been in contact at one point before growing to its current size. However, very small fluctuations exist in the CMB, and it is these fluctuations that allow us to more precisely study inflation. The fluctuations are a result of inflation amplifying quantum fluctuations in the early universe, and we can work backwards from the fluctuations to characterize inflation.
To characterize the fluctuations, we collect all the information about the size and strength of the fluctuations into a plot called the power spectrum. The goal of the power spectrum is to understand whether temperatures in the CMB are more correlated at particular spatial scales than others. Constructing the power spectrum is somewhat complex, but you can roughly imagine picking two points on the sky at some set distance apart and checking whether their temperatures are the same, and then repeating this for every set of points on the sky at that same set distance, and then doing the whole thing again at all possible distances. The structure of the resulting plot determines parameters like the geometry of the universe and the density of matter and dark matter. Over the past few decades, we’ve been able to fill in more and more of the power spectrum, and we have now reached a point where further measurements are only limited by photon noise.
So far, the results are well in favor of inflation. However, the difficulty now is to come up with a specific model for how it occurred. Currently over 100 proposed models exist, conveniently packaged into this 777-page document. Dr. Bock says there are two main questions to address to narrow down the options: 1) Is there a primordial gravitational wave background, and 2) so far CMB statistics seem to be Gaussian, but is there a non-Gaussian component? The gravitational wave background would tell us the energy scale of inflation, while the non-Gaussian component would show whether a single decaying field or multiple fields were responsible for causing inflation. So far, the BICEP and Keck arrays have been used to measure CMB polarization, concluding that inflation does not proceed simply along a power law. Meanwhile, the upcoming SPHEREx mission is poised to start measuring patterns in large scale structure, looking for correlations in the geometries of the structure to answer the question of non-Gaussian components and further narrow down the set of potential inflation models.
Newton Lacey Pierce Prize Lecture: Characterizing the Properties of Accreting Neutron Stars Through X-ray Observations, Renee Ludlam (Wayne State University) (by Ivey Davis)
We’ve heard quite a bit about the power of pulsars in astrophysics through the lectures on Monday and Tuesday, but today, Renee Ludlam focuses more generally on neutron stars, the various ways they can exist, and what that can tell us about physics.
As mentioned in previous talks, neutron stars push the extremes of our understanding of physics since we can’t measure such conditions on Earth. They have extreme pressures, densities, and magnetic fields that we could (presumably) never hope to replicate on Earth. Such extremes push our understanding of physics, especially how we describe the radial profiles of density, pressure, and temperature, called equations of state (EOSs). Although we have many ideas for what the EOS of neutron stars might be, it’s difficult to constrain what the correct solution is without being able to identify both the mass and the radius of the neutron star.
Because neutron stars push our understanding of physics to such extremes, we don’t know which model of neutron star interiors is most accurate. In order to constrain this, it’s important to understand the neutron star’s mass (somewhat well constrained in binary systems) and radius (much harder to constrain). Ludlam uses NuSTAR and NICER observations of X-ray binaries in order to put constraints on neutron star radii. These are systems that include a neutron star in a binary system (usually) with a main-sequence star. The neutron star occasionally accretes material from its companion star and produces X-rays. Constraining a neutron star’s radius requires measuring properties of the accretion disk around the neutron star in such a binary. But, this in turn relies on making assumptions about the process responsible for making the accretion disk. By studying the observational properties of accretion onto neutron stars, and how it compares with our models of the accretion, we can start to make conclusions about the system as a whole, as well as about the properties of the individual neutron star.
By observing extreme systems like ultra-compact X-ray binaries, Ludlam has additional spectral lines to study the effects of accretion onto neutron stars, which has helped to further put constraints on neutron star radii. As we continue to observe the unique effects of accretion onto neutron stars, and the various ways that this accretion can occur, there should be more and more stringent constraints on the EOS for neutron stars, and therefore a more robust understanding of physics and how it operates in such extreme circumstances.
The post AAS 243: Day 3 appeared first on AAS Nova.
]]>
Day 2 of AAS 243 brought investigations into brown dwarfs, discussions on dark matter, and a look at what we would learn from a radio telescope on the Moon.
The post AAS 243: Day 2 appeared first on AAS Nova.
]]>Editor’s Note: This week we’re at the 243rd AAS meeting in New Orleans, LA. Along with a team of authors from Astrobites, we will be writing updates on selected events at the meeting and posting each day. Follow along here or at astrobites.com for daily summaries, or follow @astrobites.bsky.social on BlueSky for more coverage. The usual posting schedule for AAS Nova will resume on January 16th.
Table of Contents:
- Plenary Lecture: Radio Astrophysics and Cosmology from the Moon, Jack Burns (University of Colorado, Boulder)
- Press Conference: Exoplanets and Brown Dwarfs
- High Energy Astrophysics Division Bruno Rossi Prize Lecture: Anatoly Spitkovsky (Princeton University)
- Press Conference: High-Energy Phenomena and Their Origins
- Annie Jump Cannon Prize Lecture: Theories of Planet Formation, Eve Lee (McGill University)
- Plenary Lecture: Sukanya Chakrabarti (University of Alabama, Huntsville)
Plenary Lecture: Radio Astrophysics and Cosmology from the Moon, Jack Burns (University of Colorado, Boulder) (by Briley Lewis)
Day 2 started off with a science fiction dream becoming reality: putting telescopes on the far side of the Moon. Jack Burns, Professor Emeritus at University of Colorado, Boulder, detailed the actual plans to do so in this morning’s plenary. This isn’t a new idea — radio telescopes on the lunar far side were envisioned even before the Apollo 11 landing. Science fiction author Arthur C. Clarke (most famous for 2001: A Space Odyssey) at the time said, “In a few generations, all serious astronomy will be with telescopes on the Moon or in space.” Burns noted that “it has now been a few generations” and we have incredible space telescopes like JWST, leaving only the Moon part left to do.
What makes the lunar far side so appealing is that it’s uniquely radio quiet, with a dry and stable environment and no ionosphere to generate interference. There’s one particular signal radio astronomers and cosmologists want to chase: the well-known 21-centimeter line, which can act as a cosmological probe to explore the dark ages and reionization in the early days of the universe.
NASA is already going back to the Moon with its Artemis program, and its Commercial Lunar Payload Services initiative partners with private companies to deliver more scientific payloads to the Moon. One such project is Radio Wave Observations at the Lunar Surface of the Electron Sheath (ROLSES), which will fly aboard Intuitive Machines 1 in February. The experiment consists of telescoping antennas which will pop out in a spring-loaded system with a classic spectrometer, and will cover a wide frequency range to detect radio signals from a variety of astrophysical signals. It plans to land at the lunar south pole near Shackleton crater, setting the record for closest landing to the lunar south pole; the Indian Chandrayaan-3 probe recently landed 30 degrees away, and this project will only be 10 degrees away.
ROLSES has many science goals, including measuring the electron sheath created by interactions between solar wind and lunar regolith, which is expected to exist but hasn’t yet been measured. It’ll be observing the galactic radio spectrum, measuring the dielectric constant of the lunar subsurface, and — perhaps most importantly — proving that detecting radio signals from the lunar far side is possible, paving the way for future missions. Although ROLSES’ galactic observations won’t reach the pot of gold at the end of the rainbow (the 21-cm line background measurement), it will help characterize the radio emission of the galaxy, which needs to be known, so the Milky Way can be effectively removed from the foreground of future cosmological observations.
Looking further ahead, the LuSEE-Night mission will work on actually measuring that 21-cm line for cosmology purposes in 2025. In the even more distant future, the proposed FARSIDE project would set up an interferometric radio array on the Moon, and the ambitious Far View project would expand such an array to 100,000 dipole antennas, constructed from resources gathered in situ on the Moon.
Press Conference: Exoplanets and Brown Dwarfs (by Pratik Gandhi)
This press conference had four exciting presentations on brown dwarfs and exoplanets, collectively dubbed “other worlds,” by researchers from the American Museum of Natural History and University of California, Los Angeles!
Extrasolar Worlds Exhibit Exotic Sandy Clouds at the Equator

An example BD infrared spectrum from their sample is shown in the bottom right of this photo. The characteristic feature highlighted in red indicates the presence of sandy clouds in the BD atmosphere.
Kicking off the session was Genaro Suarez, a postdoc at the American Museum of Natural History (AMNH), and member of the Brown Dwarfs in New York City group (or BDNYC), who told us about how the equators of exoplanets are often cloudier than the poles! Brown dwarfs (BDs) are considered the link between the lowest-mass stars and gas giant planets — they have insufficient mass to carry out fusion and radiate like stars, but they often have a little too much mass to be considered “planets.” Suarez’s focus is on L-type BDs, which are the hottest category. Using archival data from the Spitzer Space Telescope (the precursor to JWST), they identified a feature in the spectra of BD atmospheres that is indicative of clouds that are composed mostly of sandy grains (see Figure 1)! Additionally, their team found a correlation between the inclination or viewing angle, cloud cover, and color of the BD atmosphere — all of which suggest that BDs have more sandy clouds along their equators than at their poles.
Using Citizen Science to Identify New Ultracool Benchmark Systems
The second talk of this press conference was by Austin Rothermich, a graduate student at the CUNY Graduate Center, and also a member of the BDNYC collaboration. Rothermich’s presentation demonstrated the power of citizen science projects, and how they can lead to important scientific progress with the invaluable contributions of the citizen scientist volunteers! The problem that Rothermich’s research was trying to address is that BDs often have huge degeneracies in their mass, temperature, and age, making it hard to tell these properties apart. Since it’s easier to determine these properties for regular stars (so-called “main sequence stars”), if one finds a regular star near a BD, one can assume they have similar fundamental properties since they must have formed together — then, by measuring the properties of the star, we can infer those of the hard-to-measure BD. This method is therefore called using “ultracool benchmarks”!

A collage showing some of the volunteers who participated in the Backyard Worlds project!
Via the citizen science project “Backyard Worlds,” Rothermich’s team was able to incorporate the work of over 175,000 volunteers who analyzed more than 1 million images from the WISE telescope — by flagging the images, the citizen scientists could indicate whether they found a candidate ultracool benchmark system. Their team then followed up 32 of these systems with spectroscopy, and those observations were often aided by citizen scientists.
Rothermich ended the presentation on a poignant and uplifting note, thanking the volunteers who participated for their time and effort, and talking about how his scientific career as an undergrad was also kick-started via the Backyard Worlds project, from the citizen volunteer side!
JWST Indicates Auroral Signature in an Extremely Cold Brown Dwarf

Comparison of two BD spectra showing a number of absorption features due to different molecules like water and CO2. A bump in one of the spectra (in blue) to the left indicates the presence of methane emission.
Next up was Jackie Faherty from AMNH, founder of the BDNYC collaboration, and co-founder of the Backyard Worlds project. Faherty’s results focused on Y-type BDs (the coldest kind), whose surface temperatures range from the setting on a home oven to that of a cold day at the North Pole! Her team used JWST spectra to study the atmospheric compositions of the BDs and found that they were chemically analogous to Jupiter with water ice, methane, carbon dioxide, etc. Faherty showed a comparison of two of their BD spectra, whose “spectra are sculpted by intriguing chemistry,” and discussed how one of them shows a characteristic bump from methane emission (see Figure 3, with the bump towards the left). Normally such a cold object shouldn’t be showing any emission spectra, but using the example of Jupiter they hypothesized that the emission could be due to aurorae at the poles of the BD (similar to those on Jupiter), and that these aurorae could be excited by the presence of a nearby active moon (like Io for Jupiter) or some other internal process. Faherty’s team plans on applying for more JWST time to follow up this system and learn more about whether it has a companion or not. Finally, she ended by discussing how the terms “planet” and “brown dwarf” are often ambiguous, which is why she prefers the term “other worlds” to encompass them all.
WASP-69b’s Escaping Atmosphere Is Confined to a Tail at Least 7 Planet Radii
The final presentation was by Dakotah Tyler, a graduate student at UCLA studying the exoplanet WASP-69b and its curious “tail”-like feature. WASP-69b is one of the 5,000+ known exoplanets, and it belongs to a sub-type known as “hot Jupiters,” or Jupiter-mass planets that orbit really close to their host star and are therefore quite hot. Hot exoplanets can often lose atmospheric mass due to the heating and escape of gaseous material, and Tyler’s team used WASP-69b as a test bed to study exoplanet mass loss in real time. They obtained transit data of the planet crossing the stellar disk, and by looking at helium absorption features in the atmosphere, they found that some of the helium was “blueshifted,” or appeared to be moving fast in our direction — indicating that it had been ejected from the planet’s atmosphere.

Animation showing what a comet-like exoplanet atmosphere “tail” would look like as it crosses in front of its host star.
The estimated mass loss rate they found is around one Earth mass per billion years, which is higher than previous studies had measured. They also found that although the planetary outflow might have initially been radial or spherical, by coming into contact with the host star’s stellar winds, it got reshaped into a comet-like tail. Finally, Tyler highlighted that their estimate of the size of the tail is roughly 7.5 Earth radii, which is again larger than previously measured for WASP-69b, thanks to the power of JWST!
High Energy Astrophysics Division Bruno Rossi Prize Lecture: Anatoly Spitkovsky (Princeton University) (by Ivey Davis)
In the Bruno Rossi Prize Lecture, Anatoly Spitkovsky of Princeton University succinctly summarized the underlying principle of the field of astrophysical plasmas: “How microscopic processes affect macroscopic astronomical objects.” Few systems (if any) better allow for us to examine the most extreme conditions where plasma physics operates than pulsars. As Spitkovsky recounts, since the discovery of pulsars by Dame Jocelyn Bell Burnell in 1967, the incredible consistency in the arrival time of pulsar pulses have been used for studying the structure of the interstellar medium, served as a test for general relativity, and were used as galactic-scale interferometers for studying gravitational waves as was covered in Monday’s first plenary. While pulsars also serve as a “playground” for theorists due to their extreme magnetic field strengths (billions to trillions of times that of the Sun’s field), densities (100 billion times that of Earth), and rotation rates (as short as a millisecond), there remain questions about the emission processes of pulsars that have persisted since their discovery.
Spitkovsky compares the problem-solving process of pulsar magnetic fields and emission to The Incredible Machine — you keep putting pieces together until something finally clicks and the solution is found, even if a bit convoluted (see associated figure). In the world of pulsar theory, more and more puzzle pieces have been incorporated as the computational power available has increased. For instance, until nearly the year 2000, models of pulsars assumed there was no surrounding plasma; this was relatively computationally inexpensive, but inherently non-representative of pulsar environments. To address this problem, the next piece introduced was a global plasma; this could reproduce how pulsars slow down over time, but could not explain the gamma-ray emission we observe. The most recent — and most computationally expensive — piece has been to transition from a global plasma to individual plasma particles that interact with both the magnetic field and each other. This has served to be the most reliable method to date to reproduce the gamma-ray double-peak light curve and the synchrotron spectrum as observed by the Fermi spacecraft, as well as some other unique pulsar emission.

Spitkovsky’s graphic to explain the process of solving problems for pulsar magnetospheres.
The conclusion of this work not only seemed to robustly address the age-old problem of pulsar magnetic field morphology and its interaction with plasma, but also fundamentally shifted how we understand where the emission is coming from. We now understand that gamma rays are likely generated by the merger of pockets of plasma, and that this occurs much farther from the surface than we originally assumed the emission to be originating from. This solution was decades in the making, and now that we have it, Spitkovsky is enthusiastic about the new opportunities it affords in addressing other phenomena that are unique to pulsars but inform our overall understanding of plasma astrophysics.
Press Conference: High-Energy Phenomena and Their Origins (by Yoni Brande)
Revealing Dual Quasars and Their Host Galaxy With JWST and ALMA: Yuzo Ishikawa (Johns Hopkins University)
Quasars, ultra-bright actively accreting supermassive black holes (SMBHs), are some of the brightest objects in the sky, often totally outshining the rest of the light from their host galaxies. Most galaxies have a single SMBH in their centers, but some galaxies have two! Yuzu Ishikawa and his collaborators presented their studies of “dual quasars.”
As the name implies, dual quasars have two accreting SMBHs, either as part of two merging galaxies or both in a single galaxy. Most of these have been observed at low redshift, but the dual quasar population at redshifts greater than 1 is not well understood. Perhaps there’s a connection between galaxy mergers and quasar triggering, or the properties of their host galaxies.
To answer these questions, Ishikawa and collaborators studied one particular dual quasar, DQ J0749, at a redshift of 2.17 (or over 10 billion years ago!). The quasars are separated by 3.5 kpc, and the system was discovered with the Hubble Space Telescope. Ishikawa was awarded JWST time to observe the system and found that extended H-alpha emission implies there’s a single host galaxy (a rotating disk!) and that the host is forming lots and lots of stars! The quasars in the system are pretty similar, possibly both accreting gas from the same region in the host. These observations are some of the best-quality data available on these enigmatic high-redshift systems, and Ishikawa and his collaborators hope to learn more about these with future observations.
Breaking Cosmic Scales: JWST’s Discovery of Unexpectedly Massive Black Holes: Fabio Pacucci (Center for Astrophysics | Harvard & Smithsonian)
There’s a well-known relationship between the mass of a SMBH and the mass of the stars in its host galaxy, with the stars outweighing the SMBH by a ratio of about 1000 to 1. However, there’s a population of “overmassive” SMBHS, which JWST has been finding at high redshift (z > 4). Fabio Pacucci and his collaborators studied these to find out if this is an observational bias, or if these mass ratios are being accurately estimated.
At these high redshifts, JWST is able (to paraphrase Dante) “to see the stars again,” allowing Pacucci and collaborators to estimate the stellar mass ratios in these galaxies. They found that, compared to local galaxies, there is a statistically significant difference in these mass ratios, going from 1000 to 1 nearby down to 100 or even 10 to 1 at high redshift.
These results are suggestive of the history of these black holes: by comparing black holes that started their lives light and those that are seeded heavy, the JWST results imply that these overmassive black holes must have started with heavy seeds.
Revealing the Environment of the Most Distant Fast Radio Burst with the Hubble Space Telescope: Alexa Gordon (Northwestern University)
Astronomical transients are non-periodic events that occur and disappear on short timescales. Fast radio bursts (FRBs) are a relatively new class of transients with enigmatic causes that manifest as highly energetic radio pulses on the scale of milliseconds. Alexa Gordon and her collaborators presented a study of FRB 20220610A, the farthest (z = 1) and brightest (4x brighter than any other) FRB yet observed.
Only about 50 or so FRBs have been localized to specific source galaxies, which is critical to understanding the processes that may produce them. Ground-based followup of FRB 20220610A showed inconclusive results as to its source, only showing either a large amorphous galaxy or a merging cluster of three smaller galaxies. Gordon’s team used the Hubble Space Telescope to re-observe the FRB source, and found that it actually originated from a compact group of seven galaxies that together are about the size of the Milky Way! Less than 1% of galaxies at this redshift occur in groups like this!
These galaxies appear to be tidally interacting, which can trigger star formation. Gordon speculates that this tells us about the source of the FRB, as one potential mechanism for FRBs are magnetars, highly magnetized young neutron stars which have very strong emission and are produced as a result of core-collapse supernovae. Gordon and her collaborators are hoping to continue to observe more of these types of FRBs, especially as upgrades to new observatories come online and continue to discover these sources at even higher redshifts.
Burst Chaser: Unveiling the Mysterious Origin of Gamma-ray Bursts with Citizen Science: Amy Lien (University of Tampa)
Gamma ray bursts (GRBs) are the most powerful explosions in the universe. A typical GRB outshines every other source in the gamma-ray sky, combined! The Swift Observatory, NASA’s premier gamma-ray observatory, has detected more than 1,600 of these events across the sky.
GRBs come in many shapes and sizes, with differing energies and pulse traces, with short GRBs (< 2 seconds) typically thought to be produced by mergers of compact objects (like neutron stars or black holes) while long GRBs (> 2 seconds) are thought to be produced by supernovae. However, these are not hard classifications, and Lien and her colleagues turned to citizen science to more accurately classify these energetic signals to more accurately characterize them by their physical origins.
A test program showed that volunteer human classifiers (made up of a beta test group of astronomers and the interested public) perform better than existing GRB classification codes for sorting these traces by their observed shapes. Now, Lien and her collaborators are taking their program to the public, using the Zooniverse website to host their GRB classification data. You can join this project at https://www.zooniverse.org/projects/amylien/burst-chaser.
Seeing Our Sun Through a New Lens: The First Large Catalog of Hot Thermal Solar Flares: Aravind Valluvan (University of California, San Diego)
Solar flares, random broadband energetic bursts from the Sun, are a critical component of space weather. These events typically last about 20 minutes or so, but they could be as short as a few minutes or as long as half a day. These are the most energetic explosions in the solar system, and they have long been known to pose a threat to electronic communications infrastructure and sensitive operations like high-altitude aviation. These effects are important to study, in order to be able to predict them in advance and mitigate their effects.
Aravind Valluvan, from UCSD, studies these flares, looking specifically at “hot thermal flares”: flares with relatively symmetric light curves. The typical “impulsive” flare has a very quick, energetic rising phase and a much more gradual decay, while hot thermal flares increase and decrease in intensity on roughly the same timescales.
Valluvan says that while typical impulsive flares are caused by rapid magnetic field reconnection quickly dumping energy into the solar corona, hot thermal flares instead may be a result of slower magnetic reconnection processes, or slower energy transfer to the corona. Valluvan’s group observed 2,200 of these hot thermal flares and their catalog will be critical to properly interpreting these flares’ formation mechanisms. Are there connections between hot thermal flares and other solar phenomena like coronal mass ejections or solar particle events? Maybe! ISRO’s recently launched Aditya-L1 mission recently reached its final orbit, where it will use its X-ray spectrometer and ultraviolet imager to study the Sun and its energetic outbursts, just in time for solar maximum. Valluvan is hopeful that this mission will help us finally answer some of these critical questions.
Annie Jump Cannon Prize Lecture: Theories of Planet Formation, Eve Lee (McGill University) (by Briley Lewis)
For the 2022 Annie Jump Cannon Prize lecture, Eve Lee discussed the detailed (and quite complicated!) theoretical physics of planet formation. The planet populations we observe, she reminded the audience, are the consequences of coagulation and chemistry in the protoplanetary disk, disk–planet interactions, orbital dynamics, and atmospheric processes. She considered all these factors to try to explain: (1) a set of three puzzling (and seemingly contradictory) observations, (2) the origin of the Neptune desert, and (3) the favored location of Jupiter-like planets.
Let’s start with the trio of puzzling observations. First, outer giant planets appear to be more common around higher-mass stars. Second, inner super-Earths are more common around lower-mass stars. Third, systems with outer giants tend to have inner super-Earths. At first glance, it seems like the third observation is in tension with the first two — but Lee described in her talk (and also in a paper published last year) why these observations are actually reconcilable, and explainable by physics. Outer giants have inner super-Earths, because if a disk is large enough to form a giant planet, it also likely has enough mass to form a smaller super-Earth. Large stars have larger disks, so they form big planets, and small stars are able to convert pebbles to planetesimals more efficiently because they are cooler.
The Neptune desert — a notable lack of planets similar in size to Neptune in a region close to the host star — isn’t the result of just one factor, according to Lee. Part of the gap is from planets that just formed like that, lacking in metals to effectively cool themselves and accrete a gaseous envelope. Then, the gap is further carved by atmospheric evaporation caused by the star.
Finally, to determine why Jupiters so often form between 1 and 10 au, she considered what’s going on physically at each bound of that range. At the inner boundary, migration cuts off the ability for large planets to exist there. At the outer boundary, dust grains drift faster than they can grow, limiting the size of planets that can form.
Lee’s talk was a great reminder that planetary systems are extremely complex, and we have so much left to learn about how they become the worlds we observe — and even about how our own planet came to be.
Plenary Lecture: Sukanya Chakrabarti (University of Alabama, Huntsville) (by William Lamb)
Our galaxy rotates faster than it should if it only contains observable matter. This is why astrophysicists predict the existence of a dark matter halo surrounding the Milky Way to account for the extra, unobserved mass that must be there. The problem is, we don’t know much about dark matter because we have never observed it directly, and we don’t know how it is distributed in our galaxy. Sukanya Chakrabarti’s talk focused on probing dark matter by directly measuring the acceleration of stars within the Milky Way’s gravitational potential, which should bring further enlightenment on the effects of dark matter within a galaxy.
Traditionally, astrophysicists would estimate the acceleration induced on galactic stars by gravity by taking observations of the velocities and positions of those stars. This requires the assumption that galaxies are in equilibrium, where the gravitational potential and hydrostatic pressures that affect the motion of stars within the galaxy are balanced. However, galaxies are dynamic — interactions with satellite dwarf galaxies perturb galaxies over time. By directly measuring the acceleration of stars, Chakrabarti’s research enables the study of “real-time galaxy dynamics.”
Her group achieves this in four ways. First, they run dynamic simulations of the Milky Way, as opposed to simulations featuring static potentials. Second, they take high precision radial velocity observations, requiring a precision of 10 cm/s on velocity measurements, to measure the acceleration of some galactic objects. Third, they use pulsar timing measurements, such as those from NANOGrav, to effectively create a “galactic accelerometer” to measure the accelerations of pulsars. And fourth, they take measurements of the mid-points of exoplanetary eclipses, requiring a precision of 0.1 second across a 10-year baseline, to measure the accelerations of stars with exoplanets.
These measurements are extreme and on the edge of the technical capabilities of modern instruments and data analysis techniques. However, Chakrabarti is showing that this is possible, and hopefully insights from her work will further our understanding of dark matter in our galaxy.
The post AAS 243: Day 2 appeared first on AAS Nova.
]]>
On Day 1 of AAS 243, we heard about ORCs (not of the Tolkien variety), aromatic molecules, and the rarity of life in the universe.
The post AAS 243: Day 1 appeared first on AAS Nova.
]]>Editor’s Note: This week we’re at the 243rd AAS meeting in New Orleans, LA. Along with a team of authors from Astrobites, we will be writing updates on selected events at the meeting and posting each day. Follow along here or at astrobites.com for daily summaries, or follow @astrobites.bsky.social on BlueSky for more coverage. The usual posting schedule for AAS Nova will resume on January 16th.
Table of Contents:
- Fred Kavli Plenary Lecture: NANOGrav: The Dawn of Gravitational-Wave Astronomy at Light-Year Wavelengths, Stephen Taylor (Vanderbilt University)
- Special Session: International Students and Researchers in Astronomy: Issues and a Path Forward
- Press Conference: Dust, Clouds & Darkness
- Helen B. Warner Prize Lecture: The PAH Revolution: Cold, Dark Carbon at the Earliest Stages of Star Formation, Brett McGuire (Massachusetts Institute of Technology)
- Press Conference: Stars, Protostars & More Clouds
- Helen B. Warner Prize Lecture: The Milky Way as a Cosmological Laboratory, Ana Bonaca (Carnegie Institution for Science)
- Plenary Lecture: The Rarity of Life in the Universe, Alan Lightman (Massachusetts Institute of Technology)
- LeRoy E. Doggett Prize Lecture: It All Began with Tebbutt! The Peripatetic Path from New Zealand to New Orleans, Wayne Orchiston
Fred Kavli Plenary Lecture: NANOGrav: The Dawn of Gravitational-Wave Astronomy at Light-Year Wavelengths, Stephen Taylor (Vanderbilt University) (by William Lamb)

Steve Taylor speaking at the Kavli Plenary Lecture, 8 January 2024. [William Lamb]
The plenary began by acknowledging the early start to the day and jumping straight into the results from the North American Nanohertz Observatory for Gravitational Waves (NANOGrav). In June, in coordination with the European Pulsar Timing Array, the Indian Pulsar Timing Array, the Parkes Pulsar Timing Array, and the Chinese Pulsar Timing Array, we independently published strong evidence for a nanohertz-frequency gravitational wave background using pulsar timing arrays. He built up the talk by describing the gravitational wave spectrum, how pulsar timing arrays detect the background, and the likely astrophysical sources that create the background. To finish, Taylor explored the new science that should result from pulsar timing arrays, from probing supermassive black hole binaries and detecting their electromagnetic counterparts, to constraining “new physics” models that are generating a lot of excitement in the high-energy physics field. I can tell you: it is certainly a very exciting time for NANOGrav.
Special Session: International Students and Researchers in Astronomy: Issues and a Path Forward (by William Lamb)
For the first time at an AAS meeting, a session was dedicated to discuss the issues faced by international researchers and students that work and study in the US. The intent was to understand what these issues are and how AAS can help to tackle these issues. The session opened with Arpita Roy, a Program Scientist at Schmidt Futures. She shared her story about moving to the US to study astrophysics at Franklin & Marshall College before getting her PhD at Pennsylvania State University, where she worked on exoplanets with instruments from around the world. She reminds us that “astronomy is a global endeavour, but resources can be highly localised.” She remarked how international researcher issues are often framed in the context of logistics — what do they need to get to the US — but we often forget the value they bring to US research, and we should be focusing on that more. “It’s hard to work on your science when as a human being, you are being disrespected.”
The second speaker was Óscar Chávez Ortiz, a 4th-year graduate student at the University of Texas at Austin. He spoke about navigating academia as someone with DACA (Deferred Action for Childhood Arrivals) status. Chávez Ortiz’s family migrated to the US when he was very young, leaving him without lawful status in the US. He didn’t consider higher education until the DACA program existed, which finally “allowed me access to my dream.” However, being a “dreamer” still comes with barriers, such as being unable to leave the US for international conferences and being unable to apply to most, if not all, Research Experience for Undergraduates (REU) programs because applicants require citizenship. The DACA act has been life-changing for Chavez, but he still faces barriers, such as the legal limbo faced by people with DACA status, in particular when a new government administration or state chooses to become hostile to them.
I (William Lamb) spoke about my experience of moving to the US in August 2020 — during the height of the COVID-19 pandemic. I shared stories about my challenge to find safe, affordable accommodation to quarantine while taking online classes when I first moved, and some of the complications that I encountered in my first few months in the US which were exacerbated by the pandemic. I argued that these problems weren’t because of COVID-19, but because of the systematic problems in the US immigration system that urgently need to be addressed.
Following these talks, we were joined by the Chair of the AAS Education Committee, Tania Anderson; AAS agent Rica Sirbaugh French of MiraCosta College; and the organisers of the session, Yaswant Devarakonda from the AAS and Fabio Pacucci from the Center for Astrophysics. During the panel discussion with the audience, I believe we identified some important work and changes that need to be implemented by the AAS. For example, there are a lot of resources to support international researchers out there, but access to those resources is difficult and a lot of those resources conflict with each other. Another issue is the divide between access to REU programs, PhD fellowships, and even grants for professors, between domestic and international researchers. We agreed that the AAS needs to support international researchers significantly more, especially those with DACA status. We were buoyed by the news that the AAS is taking these concerns seriously, and they are planning on establishing a committee to discuss the barriers faced by international researchers.
If you would like to kept in the loop about the AAS’s plans, email Yaswant Devarakonda, who is the John N. Bahcall Public Policy Fellow for the AAS. We also encourage you to show your support for an AAS committee for international students by emailing the AAS with your story.
Press Conference: Dust, Clouds & Darkness (by Briley Lewis)
The first press conference of AAS 243 was a fun mashup of different topics, all in some way related to one particular fundamental component of the cosmos: dust.

A diagram from Butterfield’s talk on the M0.8-0.2 polarized dust ring. This illustrates the location of the dust ring in the Milky Way, and visualizes the magnetic field lines within.
The session kicked off with Natalie Butterfield from the NRAO unveiling the discovery of a polarized ring of dust in the Milky Way’s center. This fascinating observation came from one of SOFIA’s legacy programs — FIREPLACE II, the 2nd Far-InfraRed Polarimetric Large Area CMZ Emission survey — that are keeping the flying telescope’s legacy alive even after its retirement. The extreme environment of the galactic center contains dense clouds, with magnetic fields of around 100 microgauss (very tiny compared to refrigerator magnets that may come to mind, but quite strong for interstellar space!).

A diagram from Butterfield’s talk showing how an expanding shell of a supernova remnant might sweep up magnetic field lines into the observed circular pattern.
In one specific ring, known as M0.8-0.2, they observed a curved magnetic field, tracing the ring of dust, with strengths around 1 milligauss — at least 10 times stronger than the background of the galactic center. They think this feature is actually a supernova remnant, with an expanding shell sweeping up material and compressing magnetic fields.

The new image of the Cassiopeia A supernova remnant including data from JWST. More details on the image are available in the Chandra press release. [X-ray: NASA/CXC/SAO; Optical: NASA/ESA/STScI; IR: NASA/ESA/CSA/STScI/Milisavljevic et al., NASA/JPL/CalTech; Image Processing: NASA/CXC/SAO/J. Schmidt and K. Arcand]
Jin Koda (Stony Brook University) and Amanda Lee (U. Mass Amherst) then presented a brand new data set from ALMA, looking at a region on the outskirts of the galaxy Messier 83 for molecular clouds, the sites of star formation. Using multiple telescopes and an international collaboration, they detected molecular clouds at the edges of a galaxy for the first time. Now, this leaves them with the question: how does the diffuse gas in the fringes of Messier 83 end up as molecular clouds?
Karen O’Neil from Green Bank Observatory announced another particularly exciting discovery: a new radio source that just might be the first primordial galaxy we’ve detected. This extremely faint source is about 83 megaparsecs away, with characteristics (like mass and rotation rates) of a pretty normal spiral galaxy. But, it’s extremely low brightness. It has a wealth of gas for star formation, yet not enough stars for it to shine in the sky — a dark galaxy seen before star formation really begins. It’s unclear why this galaxy is so unevolved, but they speculate that the gas may be too diffuse to start forming stars or there haven’t been any major interactions to spur star formation or tear the galaxy apart. Either way, this is likely one of a new class of objects, with hopefully many more to be found in upcoming radio surveys. “This is real,” said O’Neil. “We have spent many hundreds of hours of GBT [Green Bank Telescope] time to pin this down.”
To round out the session, Alison Coil (UCSD) presented another mysterious class of objects: odd radio circles, or ORCs (and yes, this acronym is bringing back how much I wish I saw Gimli in the exhibit hall yesterday!). ORCs were initially discovered in 2021, and they appear as large (~1 arcmin) rings in radio continuum centered on a galaxy, with physical sizes of hundreds of kiloparsecs across. Only about 11 are known, with a new one discovered about every two to three months. One particular ORC (ORC4, originally discovered by ASKAP) is huge, with a massive central galaxy and a radius of 200 kiloparsecs. Recently, astronomers imaged its host galaxy using the Keck Cosmic Web Imager, finding very strong OII emission lines, even far away from the galaxy — but not quite as far as the ORC. They determined that a burst of star formation in the galaxy’s past caused both the ORC and the OII ring. When the wind driven by the star formation burst shuts off, the forward shock (and its corresponding radio emission) continue propagating outwards, while the backwards shock with the OII falls back towards the galaxy. Perhaps ORCs aren’t so odd after all — or at least now we might know where they come from!

A diagram from Coil’s talk illustrating how the forward and reverse shocks from a star formation burst travel over time, creating the outer ORC and inner OII emission ring.
Helen B. Warner Prize Lecture: The PAH Revolution: Cold, Dark Carbon at the Earliest Stages of Star Formation, Brett McGuire (Massachusetts Institute of Technology) (by Ben Cassese)
Just before the first lunch break in New Orleans, the inhabitants of Grand Hall A were treated to a plenary session delivered by Brett McGuire of the Massachusetts Institute of Technology. McGuire’s day on the plenary stage was a long time coming: he had received the AAS’s Helen B. Warner Prize in 2022, but because of pandemic-related meeting disruptions he could not deliver his talk, “The PAH Revolution: Cold, Dark Carbon at the Earliest Stages of Star Formation,” until now.

The lifecycle of matter in the universe, from a molecular cloud, to cats, and back. [B. McGuire]
McGuire’s primary tool in this endeavor is the Green Bank Telescope (GBT), and his favorite place to point it is the Taurus Molecular Cloud 1, a frigid but well-studied assemblage of gas and organics that he and collaborators suspected would provide fertile hunting grounds for new molecules. They were correct: in 2018, they found the second 5- or 6-membered ring species ever spotted in space, then went on to discover a laboratory stockroom’s worth of bizarre, complex molecules. Among these are the first four polycyclic aromatic hydrocarbons (PAHs) conclusively identified beyond the solar system, and many long, linear, and sometimes kinked chains of carbon.

A slide to illustrate why laboratory experiments are necessary counterparts to theory and modeling. [B. McGuire]
Overall, McGuire’s talk was a lighthearted and joyful overview of recent advances in laboratory and data processing techniques that have uncovered dozens of new molecules in space. One left certain both that the recent past few years of cosmochemistry have been exciting, and that the next few will be even more so.
Press Conference: Stars, Protostars & More Clouds (by Mark Popinchalk)
At this conference there were four speakers, shining bright and talking about stars!
Asymmetric Gamma-ray Emission from the Quiet Sun

A slide from Elena Orlando’s press conference showing the solar activity cycle.
The first presenter was Elena Orlando (University of Trieste and Stanford University), telling us about asymmetry in our Sun seen in gamma rays. The Sun has a steady state of gamma radiation due to cosmic rays from beyond our solar system hitting it. This was first discovered in 2000. However, the Fermi mission has better sensitivity and angular resolution. The Sun crosses in front of Fermi daily, although to get good images one needs to integrate a few hundred days of data. Still, the researchers had Fermi data from 2008 to today to look through that covered the entirety of the solar 11-year activity cycle.
In the hundred-day window that included the peak of the solar activity, Orlando’s team noticed that there were more high-energy gamma rays from one pole and more low-energy gamma rays from the other! This peak in activity happens when the solar magnetic field flips. Orlando doesn’t yet have a full explanation, but this does suggest a crucial role of the magnetic field and opens up a link between astronomy, particle physics, and plasma physics.
A Colossal Star Erupts: Examining One of the Largest Stars in the Milky Way as It Fades From View
Narsireddy Anugu (CHARA Array; Georgia State University) introduced us all to RW Cephei, a huge hypergiant that has undergone a recent eruption! One of the largest stars in the galaxy, it reached an historical faintness in 2023. Anugu and collaborators wanted to learn more, but even with the star’s great size, it appears a million times smaller than our full Moon. Therefore they needed to use the CHARA array, the world’s largest optical interferometer. It combines six telescopes to make an effective diameter of 360 meters!

A slide from Narsireddy Anugu’s press conference showing the change in brightness of different regions of RW Cephei.
From these observations they were able to get an idea of the brightness of the object, and they saw that while there was one side that was fainter during the dimmest observation, it changed when the star started to brighten.
Anugu and collaborators proposed a similar mechanism to Betelgeuse’s great dimming event: a convective cell ejected a gas cloud, and as the cloud cools and forms dust it falls back onto the surface of the star, causing it to dim. These ejections might impact the mass of the star, which in turn might determine its ultimate fate!
Early Evolution of Planetary Disk Structures Seen for the First Time
Cheng-Han Hsieh (Yale University) changed the topic by releasing baby pictures of planetary systems — that is, some of the youngest planetary disk structures ever seen. Planets form in big dusty protoplanetary disks. Previous studies using ALMA targeted large luminous disks of more evolved disks with ages greater than 2 million years, but substructures in younger disks are hard to find.

A slide from Cheng-Han Hsieh’s press conference showing tasty-looking protoplanetary disks.
The team used ALMA to survey nearly all the embedded protostars in seven young stellar populations. They grouped the substructures into two classes: those that seem to look like a donut (rings with a large central cavity), and those that look like filled buns (multiple ring systems with center filled). To be clear, this session was held directly after lunch, but this astrobiter certainly left hungry.
These disk substructures started to appear for sources that were at least 300,000 years old, which could perhaps be the start of giant planet evolution! But another question that arises is that if these two groups represent different kinds of disk populations, which population(s) can create solar systems like our own?
The Wondrous 3D World of Protostellar Shocks in NGC 2071
Finally Nicole Karnath (Space Science Institute) wanted to show us that young stars like to rock and roll. To do this, she and her collaborators looked at NGC 2071 IR, a star-forming region that hosts seven young stellar objects, including two protostars named HOPS-361 A and C. These are both intermediate-mass protostars, which will become stars bigger than our Sun. However, intermediate-mass stars aren’t as well studied. There is a need to assess the driving of turbulence in these regions, since if the stars are lashing out in their youth they could be lowering the overall star-formation efficiency in their surroundings. To do this, there needs to be an accurate map of the 3D motion of the gas the young stars are kicking off. This is difficult to obtain.
Fortunately, the team had the right tools: the Hubble Space Telescope (HST) and the SOFIA airplane-based telescope. They used an archival HST image that had the outflow from HOPS 361-A, and then another image from 2021. Just by comparing the two images you can see the gas moving!

A slide from Nicole Karnath’s press conference showing the outflow of gas from a young star.
HOPS 361-A has a compact, complex outflow of gas. The amount of gas kicked out seems to be the same between the 2009 and 2021 images, and the outflows are shooting off at hundreds of kilometers per second. Normally, it’s thought that most of the outflow material should be moving in a similar direction, but the outflows are going in different directions. It looks like this young star is very messy! Meanwhile HOPS 361-C has a knot of gas that is slowing down. Furthermore, it’s wobbling as it is throwing out gas, spinning over a loop every 2,000 years.
Finally, the data from SOFIA were included to show the full 3D movement, which wouldn’t have been possible without the infrared coverage (and it remains an open question of where the field can get similar data now that the mission has been ended.) Ultimately these two stars are causing very different outflows in NGC 2071 IR.
Helen B. Warner Prize Lecture: The Milky Way as a Cosmological Laboratory, Ana Bonaca (Carnegie Institution for Science) (by Kerry Hensley)
In the second Warner Prize lecture of the day, Ana Bonaca (Carnegie Institution for Science) introduced the study of stellar streams and how it can help us understand the nature of dark matter. Dark matter is a mysterious substance thought to make up 85% of the matter in the universe by mass. The nature of dark matter is encoded in its spatial distribution: hot dark matter produces a smooth distribution, while warm dark matter has a little structure, and cold dark matter clumps into structures and substructures down to low masses.

These images highlight the ghostly stellar streams looping around Messier 94 (left) and Messier 63 (right). Stellar streams are the remnants of globular clusters or dwarf galaxies. [Giuseppe Donatiello / Michele Trungati; Public Domain]
Using data from multiple sources, especially the Dark Energy Survey and the Gaia spacecraft, Bonaca and collaborators have discovered and characterized numerous stellar streams. The Milky Way contains about a hundred known stellar streams, mostly within 65,000 light-years, but Bonaca estimates that more than a hundred streams remain to be found — especially farther out. These far-out streams are enticing targets because they are farther from the gravitational disturbances created by the Milky Way’s spiral arms and central bar of stars, making the streams more sensitive to the influence of dark matter.
Of the known stellar streams, many have signs of past perturbations that could point to a close encounter with a dark matter subhalo. Modeling of one particular disrupted stellar stream suggested a fairly recent encounter with a massive (5 million solar masses or so) object, and Bonaca’s team will use the Hubble Space Telescope to study the stream further and narrow in on the location of the purported perturbing dark matter subhalo.
Bonaca identified three focus areas for future study: 1) Stellar streams with known progenitors (i.e., it is known which globular cluster or dwarf galaxy the stream came from), 2) stellar streams in the outer regions of the Milky Way, and 3) the population of stellar streams as a whole. Advancing each of these goals will require precise radial-velocity measurements, wide sky coverage, and the ability to study very faint targets. To that end, Bonaca and collaborators started the VIA project to build a spectrograph that meets their requirements, and the proposed project will involve a five-year survey that produces three million spectra. The Rubin Observatory’s Legacy Survey of Space and Time will also expand our understanding of stellar streams, helping us to study streams that are farther away and in much greater detail than is possible today.
Plenary Lecture: The Rarity of Life in the Universe, Alan Lightman (Massachusetts Institute of Technology) (by Yoni Brande)
It’s hard for most people to grasp the scales on which the universe exists. With a width of a hundred billion light-years, from 13.6 billion years in the past to a possibly infinite existence in the future, we are, as Carl Sagan put it, “on a mote of dust suspended in a sunbeam” in the universe. Alan Lightman’s plenary lecture today focused on putting ourselves into perspective, reflecting on our cosmic insignificance, as well as the immense significance of our unique position as observers of, and in, the universe.
Humans have been wondering about our place in the universe for our entire history as a species. Twenty thousand years ago, cave paintings in the Lascaux complex depicted the Pleiades star cluster, debates over differing cosmologies raged between geocentrism and heliocentrism, spiral nebulae and island universes, and the static and expanding universe. The development of modern astronomy, Lightman posits, is characterized by the continuing realization that we are not special in our place in the universe. We are, in fact, starstuff, made up of elements originally synthesized in the Big Bang and then in the explosive deaths of massive stars as supernovae.
In Lightman’s view, the vastness of the universe — with hundreds of billions of galaxies all made up of hundreds of billions of stars each — implies that life (and even intelligent life) must exist elsewhere in space and time. However, even if every habitable planet in the universe was teeming with life, the greatest fraction of living matter in the universe would be akin to a few grains of sand in the great Gobi desert.
Life must be rare in time as well as space, and perhaps even more concerning, Lightman says, is the fact that life has an end date. Life probably was able to arise after a billion years or so after the Big Bang, and in a hundred thousand billion years, the expansion of the universe will have stripped every galaxy away from every other galaxy, never to meet again. Lightman predicts this isolation will be the final nail in life’s coffin, lasting a mere 105 years out of a total potential universal lifetime of 1,084 years, from a Planck time after the Big Bang until the final proton decay, after which the universe will be in an eternal steady state. Life must be fleeting, Lightman says, but this gives it, and us, meaning. We must share a curiosity about and a consideration for our own isolation and mortality with everyone and everything that has ever or will ever live.
Lightman closed with a philosophical example: the “reverence for life” of Albert Schweitzer, German-French Nobel Laureate, physician, and philosopher. If Schweitzer’s biocentrism holds that there is a common kinship between all living beings on Earth, Lightman’s “cosmic biocentrism” extends this to all living things in the universe. “We few grains of sand in the desert are the only means by which the universe can consider itself. The cosmos will grind on for eternity long after we’re gone — cold and unobserved — but for these few powers of ten, we have been, we have seen, we have felt, we have lived.”
Plenary Lecture: LeRoy E. Doggett Prize Lecture: It All Began with Tebbutt! The Peripatetic Path from New Zealand to New Orleans, Wayne Orchiston (by Ali Crisp)
To wrap up Day 1 of AAS 243, we had the “first ever” evening plenary at the conference, given by Wayne Orchiston. His talk was primarily biographical, focusing on his own journey from a young boy inspired by the night sky to his talk tonight as the LeRoy E. Doggett Prize recipient for his contributions to the history of astronomy. A common theme throughout was the inspiration he took from the Australian astronomer John Tebbutt.
Orchiston explained that he first became interested in Tebbutt and historical astronomy in general as a teen, when his father’s job caused the family to move from Lincoln, New Zealand, to Sydney, Australia. There he discovered the Windsor Observatory — founded by Tebbutt — and the thousands of letters, observing logs, journals, and other documents of Tebbutt. He held onto this interest through several jobs: working as a radio telescope operator with CSIRO as he worked on his undergraduate degree, a postdoc in geology and human evolution in Melbourne, and director of the museum studies and astronomy programs at Victoria College.
During his time at Victoria College, the centennial of many of Tebbutt’s contributions, such as the discovery of the Great Comet of 1881 and the Australian bicentennial, fanned the flames of Orchiston’s interest in history of science research. He went on to explain how the papers he published about Tebbutt led him to new information about other astronomers or areas of astronomy, and to new job opportunities. Ultimately, through (by his count) 12 moves, Dr. Orchiston ended up living in Thailand with a remote position at the University of Science and Technology of China, where he hosts workshops with his wife/research collaborator, co-edits the open source Journal of Astronomical History and Heritage, and hosts a monthly virtual lecture series on the history of astronomy.
Orchiston closed his lecture by sharing amazement with where his career has taken him, describing himself as “a geography teacher who lost his way.” He stated that the Prize is one of his proudest achievements, and emphasized the main things he believes have led him to this point: opportunity, networking and role models, dedication, getting his work out there, flexibility, maintaining passion in his work, and the support of his wife.
The post AAS 243: Day 1 appeared first on AAS Nova.
]]>
This week we’ll be bringing you updates from the 243rd AAS meeting happening in New Orleans, LA.
The post AAS 243: Welcome! appeared first on AAS Nova.
]]>
This week, AAS Nova and Astrobites are attending the American Astronomical Society (AAS) winter meeting in New Orleans, LA.
AAS Nova Editors Kerry Hensley and Susanna Kohler and AAS Media Fellow Ben Cassese will join Astrobites Media Intern Briley Lewis and Astrobiters Ali Crisp, Pratik Gandhi, Ivey Davis, Isabella Trierweiler, Mark Popinchalk, William Lamb, Yoni Brande, and Junellie Gonzalez Quiles to live-blog the meeting for all those who aren’t attending or can’t make all the sessions they’d like. We plan to cover all of the plenaries and press conferences, so follow along here on aasnova.org or astrobites.org! You can also follow Astrobites on BlueSky at astrobites.bsky.social for more meeting content.
Where can you find us during the meeting? We’ll be at the Astrobites booth in the Exhibit Hall all week — stop by and say hello! We’ll also be engaged in several education and outreach activities throughout the meeting (please note that many of these links will take you to the AAS 243 block schedule; you must be logged in for the links to take you to the correct session):
Briley Lewis will give a talk during the Enhancing Learning Experience in Astronomy Courses session titled “Exploring the Effects of Astrobites Lesson Plans on Undergraduate Astronomy Students” on Wednesday, January 10, from 3:00 to 3:10 pm CST in Room 222 (program number 345.07). Briley will also be giving a presentation on Astrobites at the exhibitor theater in the Exhibit Hall on Wednesday, January 10, at 3:30 pm CST.

This flyer lists the community discussions hosted by the Rainbow Village. Click to enlarge. [Arianna Long]
Junellie Gonzalez Quiles invites all meeting attendees to stop by the Rainbow Village in the Exhibit Hall throughout the week. The Rainbow Village is a collaboration between the AAS Committee on the Status of Minorities in Astronomy (CSMA), #BlackinAstro, VanguardSTEM, and the League of Underrepresented Minoritized Astronomers (LUMA) that aims to create a gathering place for people of color and allies at AAS meetings. Stop by for support, celebration, daily discussions, and more! They’re even collecting a list of presentations by BIPOC astronomers, so you can show your support. You can learn more about the Rainbow Village and read interviews with organizers Junellie Gonzalez Quiles, Arianna Long, Ashley Walker, and Nicole Cabrera Salazar.
There are several social events associated with the Rainbow Village, including a dinner hosted by 1400 degrees on Monday from 6:30 to 9:00 pm, an AAS Committee for Sexual-Orientation & Gender Minorities in Astronomy LGBTQIA+ Meet and Greet on Monday from 6:30 to 8:00 pm, a Black in Astro networking dinner on Tuesday from 6:00 to 8:00 pm, and a CSMA meet and greet on Wednesday from 6:00 to 7:30 pm. Lastly, be sure to attend the Astronomy’s Poverty Problem session and the Effective Partnerships with Historically Black Colleges and Universities session.
Mark Popinchalk will be representing Astronomy on Tap NYC. You can join Astronomy on Tap Tuesday, January 9, at Republic NOLA (Doors and food at 6 pm CST, event starts 7 pm CST), which aims to be the largest Astronomy on Tap yet!
Finally, you can read the currently published AAS 243 keynote speaker interviews here. Be sure to check back all week as the remainder are released!
The post AAS 243: Welcome! appeared first on AAS Nova.
]]>
The AAS publishing team is excited to engage with the community at the upcoming AAS meeting. Check out what they'll be up to at the meeting!
The post AAS Publishing at AAS 243 in New Orleans appeared first on AAS Nova.
]]>AAS 243 is nearly here! The AAS Publishing team looks forward to connecting with meeting attendees in New Orleans, LA, and we’re excited to share a preview of upcoming publishing-related events. Attending the meeting will be Julie Steffen (AAS Chief Publishing Officer), Ethan Vishniac (AAS Journals Editor in Chief), Frank Timmes (AAS Journals Associate Editor in Chief), and Chris Lintott (Editor of Research Notes of the AAS). The entire AAS Journals data editing team will be in attendance as well — that’s Gus Muench, Greg Schwarz, and Katie Merrell. Finally, Jennifer Kelzenberg from IOP Publishing will be on site to talk about the AAS Chandrasekhar Style Guide. Be sure to stop by the AAS booth in the Exhibit Hall to say hello and pick up some swag, including some newly designed AAS Nova bookmarks!
AAS Nova Editors Kerry Hensley and Susanna Kohler, AAS Media Fellow Ben Cassese, Astrobites Media Intern Briley Lewis, and the rest of the Astrobites team will also be available at the Astrobites booth in the Exhibit Hall.
Data Editors Help Desk
The AAS Journals data editors will be staffing a help desk in the Exhibit Hall for the first time at AAS 243. Stop by the help desk to learn more about the work of the data editors, how they can help you present and organize your data in published research articles, and get one-on-one assistance with your data challenges. The data editors will be available anytime the Exhibit Hall is open. One-on-one sessions are also available over email; reach out to data-editors@aas.org for more information.
AAS Peer Review Workshop
Building on the successes of the first-ever in-person peer review training at AAS 242, this workshop led by the scientific editors of the AAS journals will teach participants about the peer review process, give them the opportunity to see both poor and exemplary referee reports, and provide them with hands-on experience in writing a peer review report. Participants will receive a graduation certificate.
While signups for this instance of the peer review workshop are closed, another workshop is planned for AAS 244 in Madison, WI, so keep an eye out for more information about upcoming opportunities!
Open Science at AAS 243
Note: The following section contains links to the AAS 243 block schedule. You must be logged in for these links to direct you to the correct session; otherwise, they will take you to the main block schedule page.
There are many exciting sessions, splinters, and exhibit hall booths occurring this week on the hot topic of Open Science. Love ADS? On Monday, the oral session #134 Laboratory Astrophysics and Open Science (Room R05) includes a talk presenting the ADS for All of NASA Science — the all new SciX! Don’t miss any of the Tuesday’s wide-ranging iPoster session #258 Data Tools and Open Science. The main session for talking to the presenters about their open-source codes and analysis techniques is Tuesday at 5:30–6:30 pm, though their iPosters are available all week.
Wednesday brings two important forums for learning about and engaging with Open Science. In the morning, a public splinter session titled Transform to Open Science Ethos Training runs from 9:00 am to 11:30 am in Room 242 and intends to introduce the ethos of open science. Learners will become familiar with the definitions central to open science and explore some concrete examples of the benefits to researchers, the pace and quality of science, and the public. Wednesday afternoon (1:00–2:30 pm, Room 237) brings the Astrophysics and Open Science session that includes a panel of members of the NASA Astrophysics Division, the Science Mission Directorate Science Data Office, the Transform to Open Science (TOPS) mission, and the NSF to speak to NASA and NSF efforts to enable Open Science and answer queries about the same.
Be sure to stop by some of the related exhibitor booths to talk more Open Science! TOPS and Science Mission Directorate representatives will be at the NASA booth (#702), while ADS can be found at the Center for Astrophysics | Harvard & Smithsonian booth (#315). Lastly, the AAS Journal Data editors are hoping you’ll stop by our new Data Help Desk (#822) to talk open science, data archiving, and everything else in between.
The post AAS Publishing at AAS 243 in New Orleans appeared first on AAS Nova.
]]>
Astrobites introduces the Rainbow Village, a new initiative to bring together astronomers of color at the upcoming AAS meeting in New Orleans.
The post The Rainbow Village at AAS: A Gathering Place for People of Color in Astronomy appeared first on AAS Nova.
]]>Editor’s Note: Astrobites is a graduate-student-run organization that digests astrophysical literature for undergraduate students. As part of the partnership between the AAS and astrobites, we occasionally repost astrobites content here at AAS Nova. We hope you enjoy this post from astrobites; the original can be viewed at astrobites.org.
Written and edited by Rainbow Village partners Arianna Long, Nicole Cabrera Salazar, Ashley Walker and Junellie Gonzalez Quiles.
Are you a person of color or an ally to people of color in astronomy and related fields? Have you wanted to connect with other people of color at the American Astronomical Society (AAS) meetings but found it difficult to do so? Have you wanted a space throughout the entire meeting to connect with other folks and receive support and resources for your career? If so, you are not alone!
This January, we are launching The Rainbow Village at #AAS243, an initiative born out of the need to provide a permanent space throughout the AAS meeting where people of color can gather, support each other, and obtain access to organizations that are directly serving people of color in astronomy.
The Rainbow Village in Context

Fred Hampton speaking at a rally in Chicago in 1969. [Wikipedia]

Following this historical precedent, Dra. Nicole Cabrera Salazar, an astronomer and STEM equity advocate at Movement Consulting, came up with the new initiative of the Rainbow Village at AAS. The Rainbow Village was created with the similar intention of bringing people of color from different demographics to gather, meet, and support each other. It will be a place to form meaningful connections and obtain direct access to resources about how to navigate the field of astronomy as a person of color.
The Rainbow Village is a collaboration of four organizations who have partnered to provide this space at AAS:
- AAS Committee on the Status of Minorities in Astronomy (CSMA): A committee of the AAS dedicated to enhancing the participation of underrepresented minorities in astronomy at all levels of experience.
- #BlackinAstro: A community and grassroots organization formed to celebrate and amplify Black scientists and engineers within the space community.
- VanguardSTEM: An online platform and empowered community devoted to connecting and uplifting emerging and established women of color, girls of color, and non-binary people of color in STEM.
- League of Underrepresented Minoritized Astronomers (LUMA): A peer mentoring community for Black, Indigenous, and Latinx women of color in their graduate degrees or beyond in their careers in astronomy, physics, and related fields.

Logos of all four organizations that have partnered to create the Rainbow Village at AAS.
Each organization will provide resources for people of color to succeed in their careers while highlighting their meaningful contributions to creating a safe and inclusive place in the field of astronomy.
How can I participate in the Rainbow Village at AAS?
The Rainbow Village is a furnished booth and will be located next to the AAS Pavilion at the New Orleans Convention Center Exhibit Hall. The space is designed for folks to relax between sessions, connect with each other, share and celebrate AAS presentations, and grow together through exploratory salon-style discussions. We will have a variety of scheduled and ongoing programming, including:
- A Community Calendar: Giving a talk? Presenting your first poster? We will have a digital and physical calendar of events that showcase our community members. Tell us about yours so we can cheer you on as your astro siblings, cousins, and fam!
- Community Discussions: Join us for daily salon-style discussions on topics that are important to our community (e.g., radical mentorship, activism, climate justice). These will be group discussions led by our own community members. Stay tuned to learn more about the topic schedule!
- Walls of Support: How are you navigating self-care while conferencing? What words of kindness would you give to yourself the first time you attended an AAS meeting? You can share these and other tips/affirmations in written form on the Rainbow Village walls.
I am not a person of color, but I would love to get involved. How can I help?
We will be advertising AAS meeting talks, posters, and events led by people of color at the Rainbow Village and on social media with the hashtags #AAS243 and #RainbowVillage. We would love for folks to signal boost and make sure to attend those events. If you will be present in person at the January 2024 meeting and would like to volunteer, please fill out this form.
Please also stop by our booth in the Exhibit Hall to listen to our community discussions and offer resources for people of color. We would love to have you!
Starting in December, Astrobites has released a series of articles highlighting the representatives of the Rainbow Village and their respective organizations. Please stay tuned to learn more about these organizations and get updates on the programming available for all throughout the AAS meeting in New Orleans this January 2024!

Artwork by Arianna Long.
Original Astrobite edited by Sahil Hedge.
The post The Rainbow Village at AAS: A Gathering Place for People of Color in Astronomy appeared first on AAS Nova.
]]>
Astrobites reports on the use of high-resolution spectroscopy to trace the origins of a metal-poor star in the Milky Way halo.
The post Dusting for Spectral Fingerprints to Determine the Origins of Stars in the Milky Way Halo appeared first on AAS Nova.
]]>Editor’s Note: Astrobites is a graduate-student-run organization that digests astrophysical literature for undergraduate students. As part of the partnership between the AAS and astrobites, we occasionally repost astrobites content here at AAS Nova. We hope you enjoy this post from astrobites; the original can be viewed at astrobites.org.
Title: SPLUS J142445.34-254247.1: An r-process-enhanced, Actinide-Boost, Extremely Metal-Poor Star Observed with GHOST
Authors: Vinicius M. Placco et al.
First Author’s Institution: NSF’s National Optical-Infrared Astronomy Research Laboratory (NOIRLab)
Status: Published in ApJ
Have you ever looked at the periodic table and wondered where all the elements come from? Nearly all of the hydrogen, helium, and some of the lithium present in the universe formed in the first three minutes after the Big Bang. Beyond that, most of the elements (those that are heavier than helium are called metals by astronomers) were created in nuclear reactions that take place in the heart of stars. Up through iron, the formation processes happened systematically, where heavier elements were formed from the fusion of lighter elements. Beyond iron, about half of the elements are created by a slow and gradual process of capturing neutrons (called the s process, with s for slow).
Elements beyond iron are created in extreme events, such as stellar explosions (see Figure 1 for an overview). Such cataclysmic events cause neutrons to rapidly bombard atomic nuclei, forming heavier elements. This rapid capture of neutrons is called the r process (with r for rapid). There is a constant exchange of elements between the stars and the gas surrounding them. This eventually leads to the formation of more stars that are enriched in metals, setting up different generations of stars.
Figure 1: The astronomer’s periodic table indicates the elements’ astrophysical origin. [NASA’s Goddard Space Flight Center]
If we obtain high-resolution spectroscopy of a star and map the abundances of all its elements, it would paint a picture of the events that led to its formation. In today’s article, the authors try to understand how stars were formed in the halo of the Milky Way by recreating the formation scenario based on the fingerprints in the high-resolution spectrum obtained from a Milky Way halo star called SPLUS J142445.34–254247.1, or SPLUS J1424−2542 for short.
Recreating the Formation Scenario
The star’s chemical abundances are determined from absorption features in its spectrum. If a particular element is present, it will absorb the starlight passing through the cold gas at a characteristic wavelength, and the extent of absorption can be used to determine how much of the element is present in the star. Looking at the elemental abundances of SPLUS J1424−2542, the star showed signs of being poor in iron (atomic number Z = 26) but being enhanced in elements with atomic numbers 26 < Z < 38 compared to the standard values measured from the Sun. This indicates the star formed from a gas cloud polluted by two distinct populations of stars in a multi-enriched process.
The abundances of the heavier elements indicate that the primary process involved in the formation is the r process. This is not uncommon for old stars in the galactic halo. The s-process elements are formed from the death of low-mass stars, which would not have occurred when such old stars were formed in the halo. Most elements in halo stars are created through the r process, even those typically formed by the s process. However, the authors found that certain elements, such as strontium, do not agree with the predicted values from either the r process or s process (Figure 2). Other elements, such as barium, are overproduced, indicating contributions from both s and r processes. The team also found an overabundance of thorium, which could indicate a possible contribution from a separate r-process event. Thus, this star is metal poor with enhanced heavy elements produced by r-process events.
Figure 2: Observed abundances (red circles) with the expected values from the r process (blue line) and s process (yellow line). Most points lie on the blue line, indicating a more significant contribution from the r process. [Placco et al. 2023]
Mysterious Circumstances Prevail
The authors derived the star’s kinematic properties (such as orbital dynamics, velocities, etc.), which are displayed in Figure 3. They found that the proposed formation scenario and the derived kinematics do not connect the star with any known structure in the Milky Way. This highlights that a distinct star formation mechanism may occur in the galactic halo. We must continue studying similar stars with high-resolution spectroscopy to help us understand the formation of old stars in the Milky Way halo.
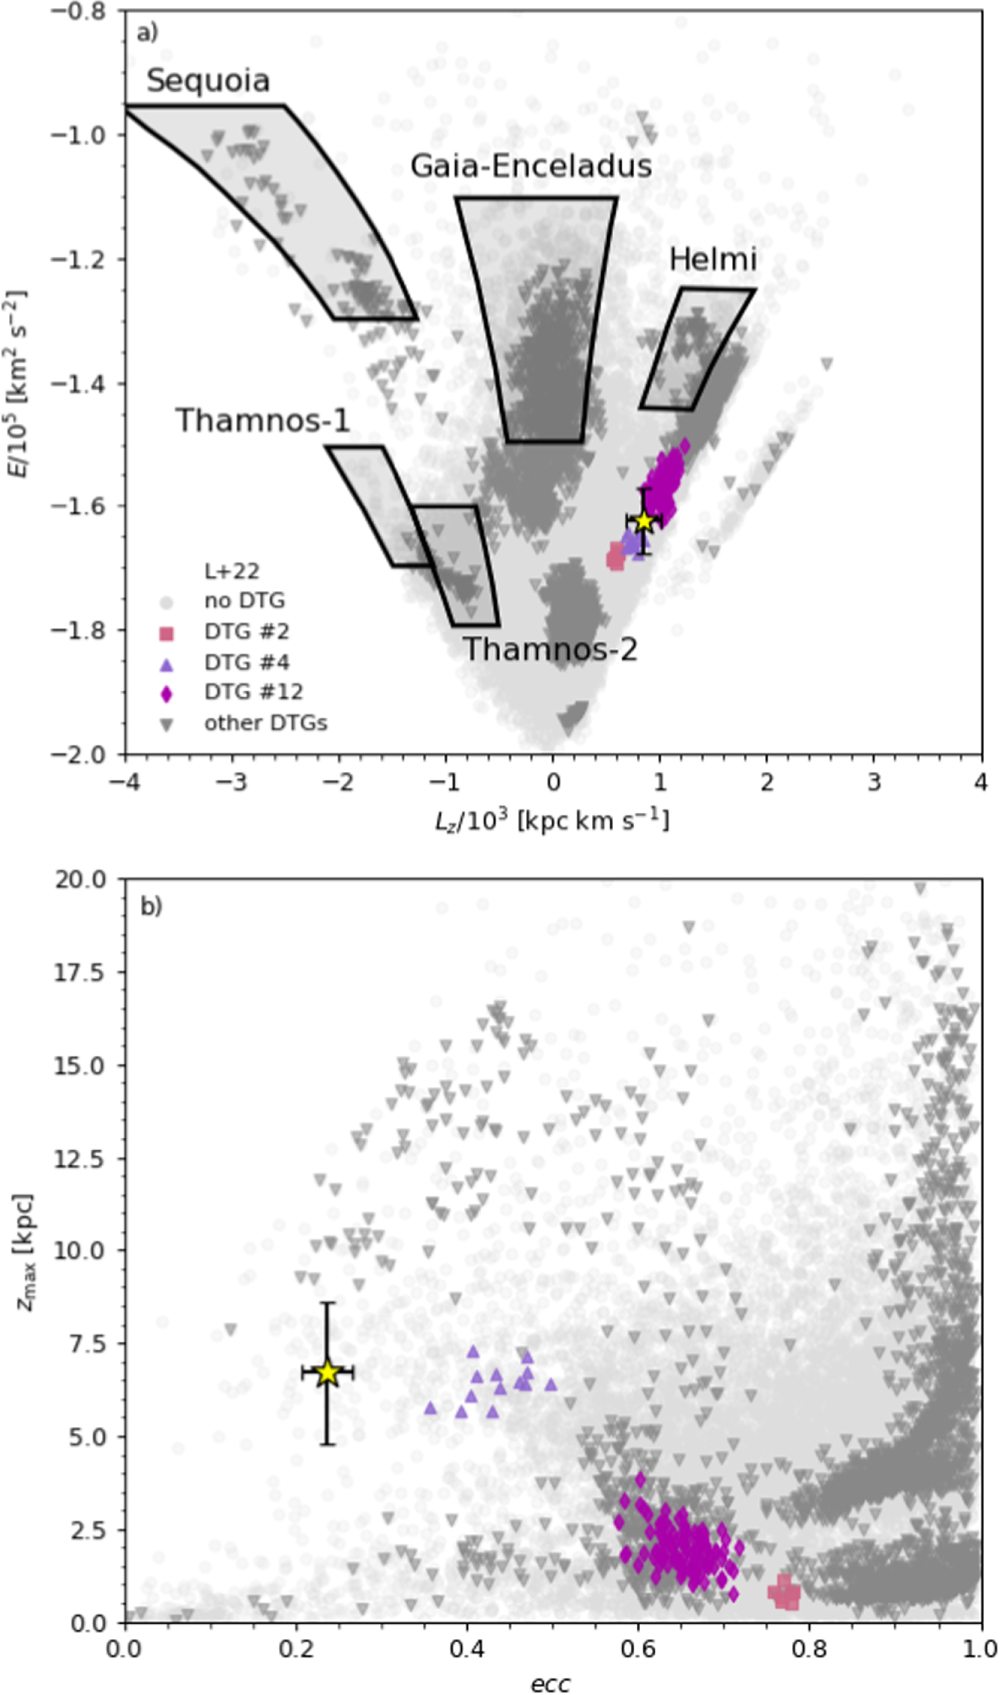
Figure 3: The yellow star indicates the star studied in this article. The upper panel shows it does not fall into the expected Milky Way streams. The bottom panel shows that it has distinct properties from other stars in a similar position on the upper panel. [Placco et al. 2023]
About the author, Archana Aravindan:
I am a PhD candidate at the University of California, Riverside, where I study black hole activity in small galaxies. When I am not looking through some incredible telescopes, you can usually find me reading, thinking about policy, or learning a cool language!
The post Dusting for Spectral Fingerprints to Determine the Origins of Stars in the Milky Way Halo appeared first on AAS Nova.
]]>
Check out the top astronomy stories we covered on AAS Nova in 2023!
The post Looking Back on Astronomy in 2023 with AAS Nova appeared first on AAS Nova.
]]>This was a year of superlatives in astronomy — researchers studied the brightest known gamma-ray burst, modeled the strongest material in the universe, and announced the finding of the first compelling evidence for the gravitational wave background. As 2023 draws to a close, let’s take a look back at some of the amazing science we covered on AAS Nova this year. Here are the top 10 most-read posts of 2023:
10. Focusing on the Brightest Gamma-ray Burst of All Time

An X-ray image of GRB 221009A’s emission scattering off of dust. [Adapted from Williams et al. 2023]
Artist’s impression of a neutron star, the core of a massive star that has exploded as a supernova. [ESO/L. Calçada; CC BY 4.0]
9. How to Model the Strongest Material in the Universe
The crystalline crust of a neutron star is the strongest material in the universe, and its extreme strength and density pose a challenge for modelers. Using a smoothed-particle hydrodynamics code tuned to include material strength, Irina Sagert and collaborators modeled waves in a neutron star’s crust. These waves might explain some properties of neutron star X-ray flares, and they may have an impact on the gravitational waves produced as neutron stars spiral toward a collision.
8. A New Way to Constrain Dark Energy

This ultraviolet mosaic of our galactic neighbor, the Andromeda Galaxy, is constructed from observations by NASA’s Swift Observatory. [NASA/Swift/Stefan Immler (GSFC) and Erin Grand (UMCP)]

Illustration of TRAPPIST-1 and its seven rocky planets. [NASA/JPL-Caltech/R. Hurt (IPAC)]
7. Monthly Roundup: TRAPPIST-1 Through the Eyes of JWST
In the first entry in the new Monthly Roundup series, we examined five research articles that tackled recent JWST observations of the TRAPPIST-1 system. The M-dwarf star TRAPPIST-1 became a household name when seven Earth-size planets were discovered in orbit around it. This large number of Earth-like, potentially habitable planets — as many as four of the seven may lie in the star’s habitable zone — makes TRAPPIST-1 a tempting target for atmospheric characterization, which is a challenge even for JWST’s gigantic mirror and sensitive instruments. The articles describe studies of JWST spectra of the innermost two planets, modeling of the possible atmospheres of the outer planets, and an exploration into whether we’d be able to detect life on these planets at all, if it exists.

The classical Cepheid RS Puppis as seen by the Hubble Space Telescope. [NASA, ESA, and the Hubble Heritage Team (STScI/AURA)-Hubble/Europe Collaboration, H. Bond (STScI and Pennsylvania State University)]
6. First Look at Extragalactic Cepheid Variable Stars with JWST
Cepheid variable stars provide a powerful way to measure the distances to other galaxies. These stars vary in brightness in a predictable way, and how quickly their brightness varies is linked to their intrinsic luminosity. This method has been used to measure the rate of expansion of our universe, but the result disagrees with the value measured through other means, raising a long-standing problem dubbed the “Hubble tension.” Researchers plan to re-observe the Cepheid variable stars previously observed with the Hubble Space Telescope, in the hopes that JWST’s superior infrared capabilities can ease this tension — an effort that will take years. Wenlong Yuan and collaborators got a sneak preview of JWST’s abilities when the telescope observed a galaxy containing multiple Cepheids.
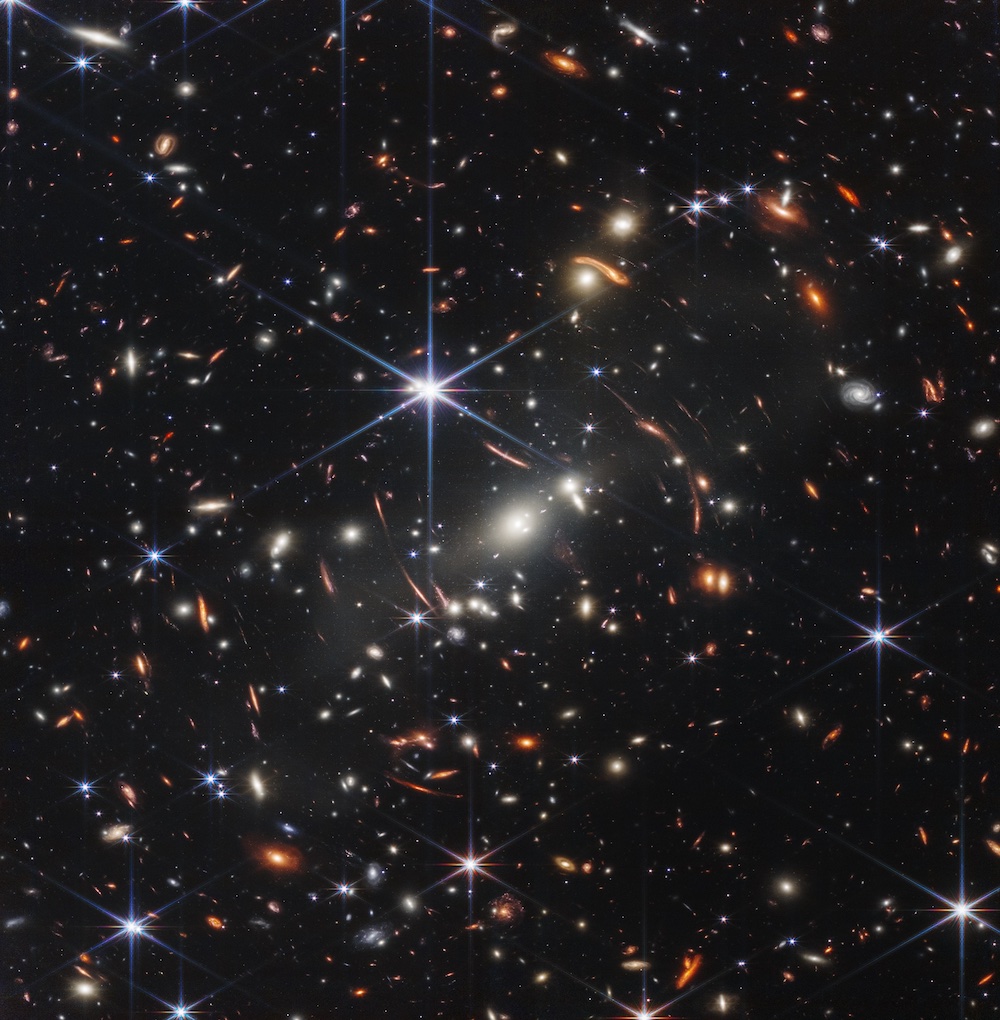
JWST image of the galaxy cluster SMACS J0723.3-7327. [NASA, ESA, CSA, STScI]
5. Update on JWST Observations of Galaxy Cluster SMACS 0723
The first JWST image seen by the public was of the spectacular galaxy cluster SMACS J0723.3–7327 (SMACS 0723). In the months following, astronomers studied the image from every possible angle, examining the structure of the cluster itself as well as the faint, distant galaxies whose light was curved into our line of sight by the cluster. This article introduced five research articles that advanced our understanding of the SMACS 0723 field, including weighing the galaxy cluster, investigating individual star clusters billions of light-years away, and measuring the chemical makeup of distant galaxies.

The dusty ejecta of Wolf–Rayet stars makes for fantastic images. These stars will eventually explode as supernovae. [NASA, ESA, CSA, STScI, Webb ERO Production Team]
4. A Cosmic Dust Factory Ramps Up Production
Have you ever wondered where all the dust in the universe comes from? Megan Peatt’s team investigated the dust production in a rare binary system composed of a Wolf–Rayet star — a massive star that has lost its entire hydrogen envelope, leaving behind a scorching hot core wreathed in shells of gas — and an O-type star rotating so fast that it’s losing its grip on its atmosphere. Each time these stars get close, the collision of the Wolf–Rayet star’s fierce stellar winds with the O star’s decretion disk produces dust. The stars are scheduled for their next close approach in 2024, and astronomers have seized the opportunity to collect infrared measurements of the pair that reveal the amount and type of dust being created as production ramps up.
Locations of pulsars (blue stars) in the NANOGrav pulsar timing array relative to the location of the Sun (yellow star). Some pulsar locations are approximate. Click to enlarge. [NANOGrav]
3. First Compelling Evidence for the Gravitational Wave Background
Using a closely monitored collection of rapidly spinning stellar remnants called pulsars, multiple international collaborations including the North American Nanohertz Observatory for Gravitational Waves, or NANOGrav, announced their discovery of compelling evidence for the long-sought-after gravitational wave background. This background signal, which is too low in frequency to be detected by gravitational wave observatories on Earth, is thought to be the rumblings of supermassive black hole binaries. The exact source of the gravitational wave background remains undecided, though, and more observations and modeling are needed to rule out the possibility that this background signal is the result of new physics.
2. Sandy, Briny Water on Mars Has a Better Chance of Remaining Liquid

The “dragon scale” texture seen in this Mars Reconnaissance Orbiter image of Mars’s surface is the result of water interacting with bedrock, forming clay-containing rock. [NASA/JPL-Caltech/UArizona]

The first image of the supermassive black hole at the center of our galaxy, constructed from data from the Event Horizon Telescope. [EHT Collaboration; CC BY 4.0]
1. Black Holes as the Source of Dark Energy
The most-read article on AAS Nova in 2023 linked two hot topics in astronomy: black holes and dark energy. Duncan Farrah and collaborators found that the supermassive black holes at the centers of galaxies across the universe are growing too quickly than could be accounted for by their galaxies’ supplies of gas and dust. Instead, Farrah’s team proposed that the growth of these black holes is linked to the expansion of the universe — a property belonging to a theorized type of black hole filled with vacuum energy. The expansion-linked growth of these black holes produces outward pressure that accelerates the expansion of the universe or, in other words, produces dark energy.
Thank you for joining us for another year of great science — we can’t wait to see the discoveries that 2024 will bring!
The post Looking Back on Astronomy in 2023 with AAS Nova appeared first on AAS Nova.
]]>
A gas cloud near the galactic center, headed for destruction in 2036, may have been ejected during a recent stellar merger.
The post Selections from 2023: A Dusty, Elongated Gas Cloud in the Galactic Center appeared first on AAS Nova.
]]>Editor’s Note: In these last two weeks of 2023, we’ll be looking at a few selections that we haven’t yet discussed on AAS Nova from among the most-downloaded articles published in AAS journals this year. The usual posting schedule will resume in January.
The Swansong of the Galactic Center Source X7: An Extreme Example of Tidal Evolution near the Supermassive Black Hole
Published February 2023
Main takeaway:

X7’s thermal dust emission from 2002 to 2021. Click to enlarge. [Ciurlo et al. 2023]
Why it’s interesting:
The neighborhood surrounding a supermassive black hole is an exciting place: tightly packed stars undergo collisions or near misses, and some even get tidally shredded by the black hole itself. This dynamic environment changes considerably on short timescales, and not just in the astronomical sense — the stars closest to the Milky Way’s central supermassive black hole take scarcely longer than a decade to complete their orbits. Unlike other dusty objects in its neighborhood, like the “G” objects labeled in the header image above, X7 doesn’t appear to be bound to a star and instead looks to be a 50-Earth-mass blob of dusty gas roaming the galactic center.
More details on X7 and its possible age and origin:
The rapid stretching of X7 over the past two decades suggests that the cloud is unlikely to remain intact as it nears the Milky Way’s supermassive black hole. This sets an expiration date for the cloud of 2036, when it will make its closest approach, and it also sets a maximum age for the cloud of around 200 years, given its orbital period. X7 is likely the result of a recent event, then, and the similarity between the orbits of the tip of the X7 gas cloud and a dusty stellar source called G3 raises the intriguing possibility that X7 was ejected when G3 was created in a stellar merger.
Citation
Anna Ciurlo et al 2023 ApJ 944 136. doi:10.3847/1538-4357/acb344
The post Selections from 2023: A Dusty, Elongated Gas Cloud in the Galactic Center appeared first on AAS Nova.
]]>
A massive study of solar flares allowed researchers to assess whether nanoflares are solely responsible for heating the solar corona.
The post Selections from 2023: Do Waves or Nanoflares Heat the Solar Corona? appeared first on AAS Nova.
]]>Editor’s Note: In these last two weeks of 2023, we’ll be looking at a few selections that we haven’t yet discussed on AAS Nova from among the most-downloaded articles published in AAS journals this year. The usual posting schedule will resume in January.
Coronal Heating as Determined by the Solar Flare Frequency Distribution Obtained by Aggregating Case Studies
Published May 2023
Main takeaway:
With the help of numerous undergraduate physics students, a team led by James Paul Mason (University of Colorado at Boulder and Johns Hopkins University) analyzed an enormous sample of solar flares to determine the flare frequency distribution — the number of flares as a function of flare energy — and assess the importance of nanoflares as a way of heating the Sun’s outer atmosphere. This analysis showed that nanoflares cannot be the only source of heat, and plasma waves must play an important role as well.
Why it’s interesting:
The outer layer of the Sun’s atmosphere, called the corona, is extremely sparse and extremely hot. How exactly the solar corona reaches its million-degree temperature is a matter of great interest, as the corona is the site of significant solar activity and the source of the solar wind. The investigation has closed in on two main mechanisms that convert magnetic energy to heat: tiny solar flares called nanoflares and plasma waves called Alfvén waves. Nanoflares are fleeting bursts of high-energy electromagnetic radiation, and Alfvén waves are oscillations in which energy is transferred back and forth between ions and magnetic fields. Neither of these critical mechanisms can be observed directly.
How the flare frequency distribution helps settle the score:
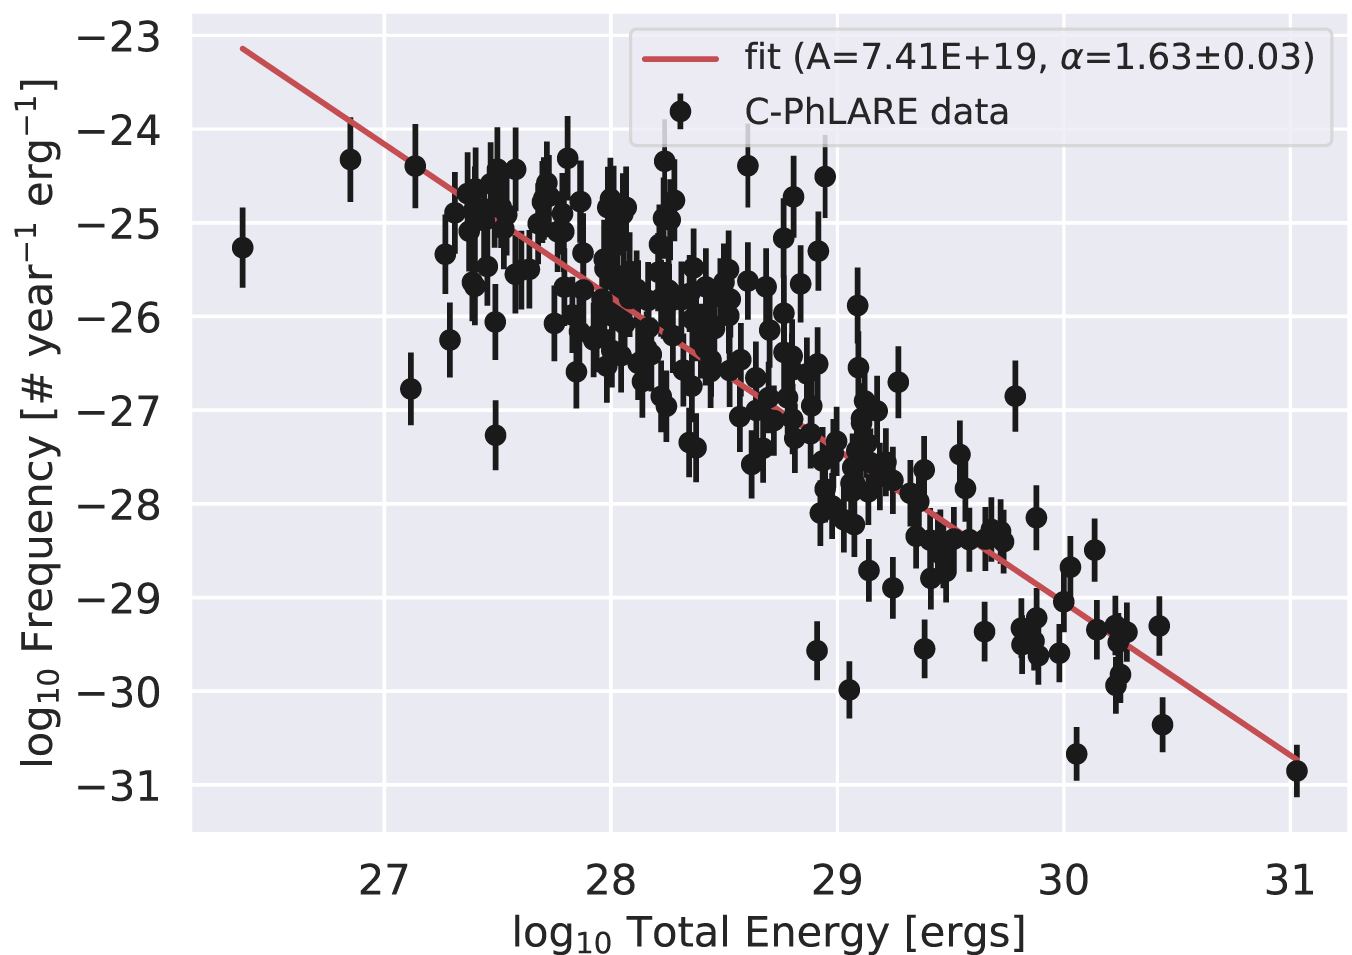
The resulting flare frequency distribution and measured slope. [Mason et al. 2023]
Citation
James Paul Mason et al 2023 ApJ 948 71. doi:10.3847/1538-4357/accc89
The post Selections from 2023: Do Waves or Nanoflares Heat the Solar Corona? appeared first on AAS Nova.
]]>
Researchers have discovered and characterized the smallest and coolest radio-emitting sub-stellar object — a brown dwarf with spectral type T8.
The post Selections from 2023: The Coolest Sub-stellar Source of Radio Waves appeared first on AAS Nova.
]]>Editor’s Note: In these last two weeks of 2023, we’ll be looking at a few selections that we haven’t yet discussed on AAS Nova from among the most-downloaded articles published in AAS journals this year. The usual posting schedule will resume in January.
Periodic Radio Emission from the T8 Dwarf WISE J062309.94–045624.6
Published July 2023
Main takeaway:
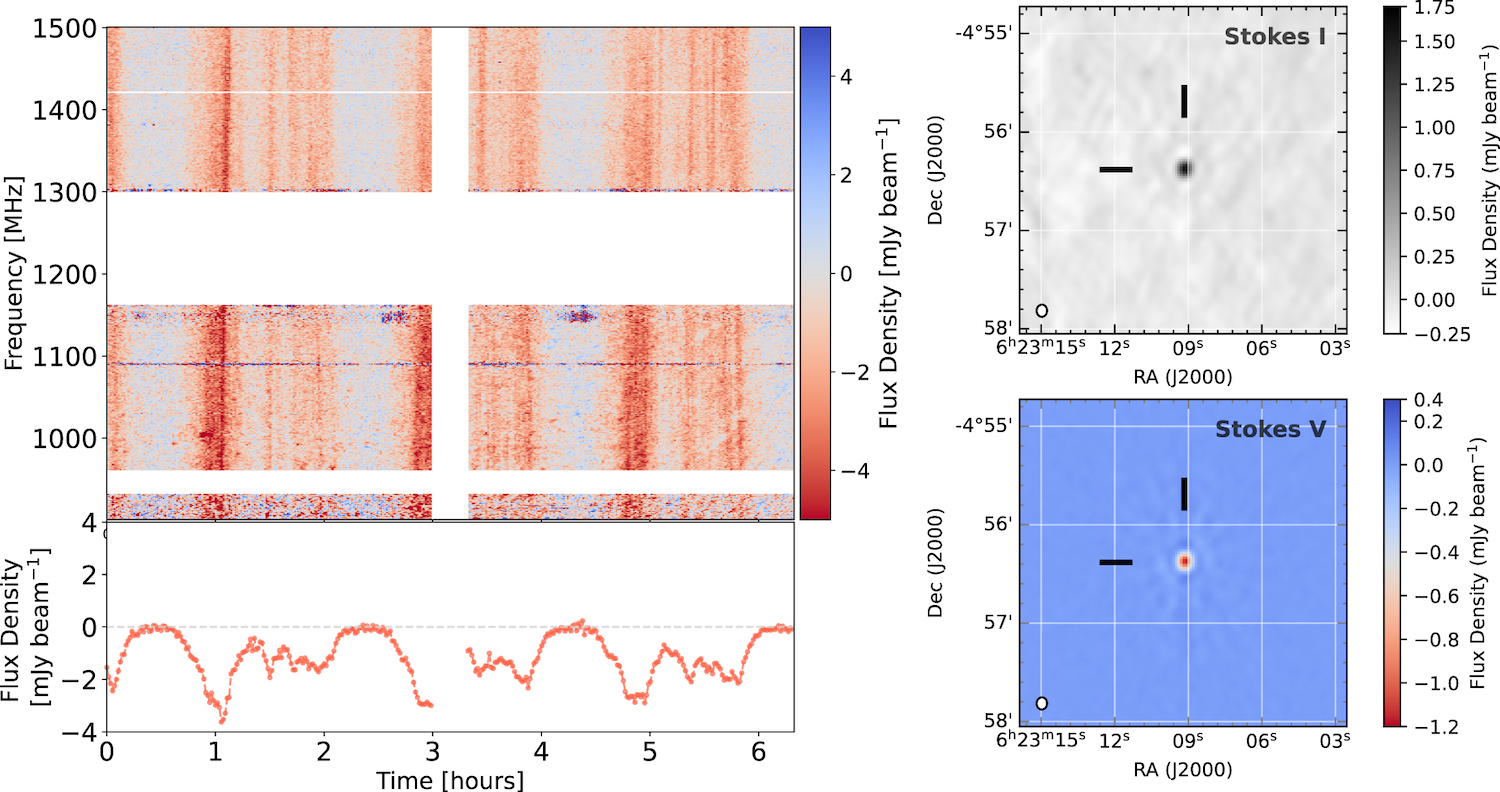
Observations of WISE J062309.94–045624.6 from the MeerKAT array. Click to enlarge. [Rose et al. 2023]
Why it’s interesting:
One of the many questions about brown dwarfs, which sit in the gap between the smallest stars and the largest planets, is the nature of their magnetic fields. The magnetic fields of stars and sub-stellar objects can be probed through their radio emission. Magnetic fields threaded through extremely hot coronal gas help to power radio emission from stars, but brown dwarfs are too cool to produce radio emission this way. Instead, their rapid rotation helps to generate currents that in turn create aurora-like radio emission.
Why more brown dwarf radio emissions are likely to be detected:
Brown dwarfs are faint at radio wavelengths, but their radio emission is expected to be strongly circularly polarized, making them stand out in surveys of circularly polarized radiation. WISE J062309.94–045624.6 was discovered through a search for strongly circularly polarized radio waves, and future searches with the exquisitely sensitive Square Kilometre Array (currently being constructed) should uncover even more — and even cooler — sources.
Citation
Kovi Rose et al 2023 ApJL 951 L43. doi:10.3847/2041-8213/ace188
The post Selections from 2023: The Coolest Sub-stellar Source of Radio Waves appeared first on AAS Nova.
]]>
On some exoplanets, a narrow region where it's permanently dawn or dusk may be the only place that's habitable. The amount of water on these planets plays a surprising role in whether it stays that way.
The post Selections from 2023: Living on the Edge of Night and Day appeared first on AAS Nova.
]]>Editor’s Note: In these last two weeks of 2023, we’ll be looking at a few selections that we haven’t yet discussed on AAS Nova from among the most-downloaded articles published in AAS journals this year. The usual posting schedule will resume in January.
Terminator Habitability: The Case for Limited Water Availability on M-dwarf Planets
Published March 2023
Main takeaway:
Ana Lobo (University of California, Irvine) and collaborators use global climate models to show that the abundance of water on a planet orbiting an M-dwarf star can determine the fraction of the planet’s surface that maintains habitable temperatures. The study focuses on whether temperatures along the terminator, the line that separates day and night, can remain habitable when daytime temperatures on a tidally locked planet become too hot. Perhaps counterintuitively, planets with more water can have less habitable area in this zone.
Why it’s interesting:
M dwarfs are the smallest, coolest, and most common type of star in our universe. Their cool temperatures result in close-in habitable zones, making for easy detection and characterization; rather than waiting for a once-annual transit of an Earth-like planet around a Sun-like star, habitable-zone M-dwarf planets zip around in days or weeks. However, many if not all of these planets are tidally locked, orbiting with one side permanently facing the host star and one side in permanent shadow. While both the day and night sides of these planets are unlikely to have habitable temperatures, the terminator could be livable.
Surface temperatures for aquaplanets (simulation names beginning with “Aq”) and land planets (names starting with “L”). The sub-stellar point is at the center of each image. Click to enlarge. [Lobo et al. 2023]
Why water plays an important role:
On a water-poor tidally locked planet, daytime temperatures can be extremely hot, and nighttime temperatures can be below freezing, leaving just the terminator at a comfortable temperature. Even when water-poor planets are close enough to their host stars that daytime temperatures are too hot to sustain life, there isn’t enough transport of the blazing daytime heat around the planet to render the terminator inhospitable. When more water is splashed in, resulting in an “aquaplanet,” the energy transport increases, extending the uninhabitable region to the terminator.
Citation
Ana H. Lobo et al 2023 ApJ 945 161. doi:10.3847/1538-4357/aca970
The post Selections from 2023: Living on the Edge of Night and Day appeared first on AAS Nova.
]]>
More than 3 billion objects have been catalogued in the Dark Energy Camera Plane Survey, which this year released its second batch of data.
The post Selections from 2023: Surveying the Galactic Plane appeared first on AAS Nova.
]]>Editor’s Note: In these last two weeks of 2023, we’ll be looking at a few selections that we haven’t yet discussed on AAS Nova from among the most-downloaded articles published in AAS journals this year. The usual posting schedule will resume in January.
The Dark Energy Camera Plane Survey 2 (DECaPS2): More Sky, Less Bias, and Better Uncertainties
Published January 2023
Main takeaway:
Map of the source density from DECaPS2. Click to enlarge. [Saydjari et al. 2023]
Why it’s interesting:
Situated as we are within the plane of the Milky Way, it’s difficult to study objects within the disk of our galaxy — the galactic plane is crowded with stars and clouded with dust and gas. However, most of the objects in our galaxy lie within this plane, so it’s critical to design surveys to investigate this rich environment. In addition to cataloging billions of objects, the team behind DECaPS developed techniques to identify the faint nebulosity that suffuses the galactic disk and complicates our characterization of objects within it.
What’s next for nebulosity:
Knowing the distribution of faint filamentary gas clouds in our galaxy is important for any study of galactic plane objects, since dust makes objects appear redder than they are, and, if unaccounted for, can skew our understanding of these objects’ properties. Looking ahead, the DECaPS team hopes to use their knowledge of nebulosity to infer the three-dimensional structure of gas and dust in the Milky Way.
Citation
Andrew K. Saydjari et al 2023 ApJS 264 28. doi:10.3847/1538-4365/aca594
The post Selections from 2023: Surveying the Galactic Plane appeared first on AAS Nova.
]]>
Though the Andromeda Galaxy has been photographed countless times, a team of amateur astronomers has found that it still holds some mysteries.
The post Selections from 2023: A Mysterious Nebula Near Andromeda appeared first on AAS Nova.
]]>Editor’s Note: In these last two weeks of 2023, we’ll be looking at a few selections that we haven’t yet discussed on AAS Nova from among the most-downloaded articles published in AAS journals this year. The usual posting schedule will resume in January.
Discovery of Extensive [O III] Emission Near M31
Published January 2023
Main takeaway:
The discovery image showing the nebulous feature to the left of Andromeda. [Adapted from Drechsler et al. 2023]
Why it’s interesting:
The Andromeda Galaxy is one of the nearest galaxies to the Milky Way, and its proximity and gorgeous spiral structure make it a common target for astrophotographers. Despite the attention paid to this galaxy, the new feature has escaped our attention until now. While the wispy nebula is visible at 500.7 nanometers, it doesn’t show up when an H-alpha filter is used. The object’s faint emission, present in only a narrow wavelength range, likely explains why it’s escaped notice until now.
On its nebulous nature:
The nature of this feature, as well as its origins and whether it’s associated with the Milky Way or Andromeda, remains unknown. Possibilities within the Milky Way include a supernova remnant or a planetary nebula — the ghostly, glowing atmosphere shed by a low- to intermediate-mass star that has ceased to fuse hydrogen in its core — but both of these options lack supporting data, such as the presence of radio or ultraviolet emission from a supernova remnant. Another possibility is that the feature formed through the gravitational interaction between Andromeda and the Milky Way or another galaxy that has been torn apart.
Citation
Marcel Drechsler et al 2023 Res. Notes AAS 7 1. doi:10.3847/2515-5172/acaf7e
The post Selections from 2023: A Mysterious Nebula Near Andromeda appeared first on AAS Nova.
]]>
In April 2019, the Event Horizon Telescope collaboration released the first image of a supermassive black hole. This image was far from the last, and new algorithms have brought the data into sharper focus.
The post Selections from 2023: Sharpening Our Images of a Supermassive Black Hole appeared first on AAS Nova.
]]>Editor’s Note: In these last two weeks of 2023, we’ll be looking at a few selections that we haven’t yet discussed on AAS Nova from among the most-downloaded articles published in AAS journals this year. The usual posting schedule will resume in January.
The Image of the M87 Black Hole Reconstructed with PRIMO
Published April 2023
Main takeaway:
Comparison of a black hole image released by the Event Horizon Telescope collaboration (left) with the results from PRIMO (middle and right). [Medeiros et al. 2023]
Why it’s interesting:
In April 2019, the Event Horizon Telescope collaboration released the first images of a black hole, constructed from data taken at observatories across the planet. The images allowed researchers to study the properties of the black hole and test our theories of gravity. While these first black hole images were a huge triumph, the work didn’t stop there: researchers continued to develop new algorithms to be applied to the complex interferometric data from the Event Horizon Telescope. And while initial analyses of the Event Horizon Telescope data were careful to be model agnostic — that is, not assuming anything about the black hole’s shape or properties — the excellent agreement between the images and our theory-based expectations allowed researchers to adjust their analysis methods to produce more precise results.
What’s special about PRIMO:
The Event Horizon Telescope consists of telescopes across multiple continents, but even with these powerful observatories working in concert, the data set is still considered “sparse,” interferometrically speaking. This presents a challenge for modelers that PRIMO, which refers to principal-component interferometric modeling, meets by filling in the gaps with simulations. PRIMO is trained on a database of more than 30,000 simulated images of accreting supermassive black holes, and this specialized training set enables the creation of images with resolution up to the nominal resolution of the Event Horizon Telescope.
Citation
Lia Medeiros et al 2023 ApJL 947 L7. doi:10.3847/2041-8213/acc32d
The post Selections from 2023: Sharpening Our Images of a Supermassive Black Hole appeared first on AAS Nova.
]]>
Astronomers were pretty sure that WASP-39 b's atmosphere was filled with carbon monoxide. Now, thanks to innovative use of a technique that hadn't previously been used on JWST data, they've found it.
The post JWST: The World’s Most Sophisticated Carbon Monoxide Detector appeared first on AAS Nova.
]]>As we approach the second anniversary of JWST’s triumphant liftoff and migration into deep space, astronomers are starting to get a handle on how to approach the data it beams back. The unprecedented precision and stability of its images and spectra necessitated the invention of new analysis tools and motivated reexaminations of old ones. Recently, a team of astronomers made significant progress in this effort: using methods usually reserved for large ground-based telescopes, they successfully detected carbon monoxide in an exoplanet’s atmosphere.
One Positive, One Inconclusive
About one year ago, a large collaboration of astronomers published the first analyses of several observations taken with JWST’s Near Infrared Spectrograph of a planet named WASP-39 b. This world, a scorchingly hot Jupiter-sized planet that lives just 11 stellar radii from its host star, was an early target for exoplanet astronomers looking to characterize atmospheres subjected to extreme conditions. One of these observations revealed carbon monoxide (CO) floating in the atmosphere. Another, which focused on a smaller wavelength range, did not see the same statistically significant signal.
This was a puzzling mismatch, and an unfortunate one: the abundance of CO is a key ingredient in models that predict how far away a planet was born from its star, and without a detection in both wavelength ranges, any attempt to constrain that distance would be forced to accept large uncertainties. Thus motivated to check the data again, a team led by Emma Esparza-Borges (Institute of Astrophysics of the Canary Islands) decided to take a new angle of attack to extract this faint, but suspected, signal.
Cross-Correlation
The team’s key insight was that they could pretend that JWST was actually a high-resolution ground-based spectrograph. Historically, the techniques used to analyze an exoplanet’s atmosphere depended on the facility at which the data were taken. Ground-based spectrographs can have much higher resolutions than their space-based counterparts, meaning they can more cleanly resolve narrow spectral features. To determine which molecules are present using a ground-based instrument, astronomers usually construct high-resolution “templates” of different species, then compare these templates to the actual data to see if, and where, they line up the best. This technique is known as cross-correlation, and it has been a workhorse technique for extracting atmosphere compositions for many years.
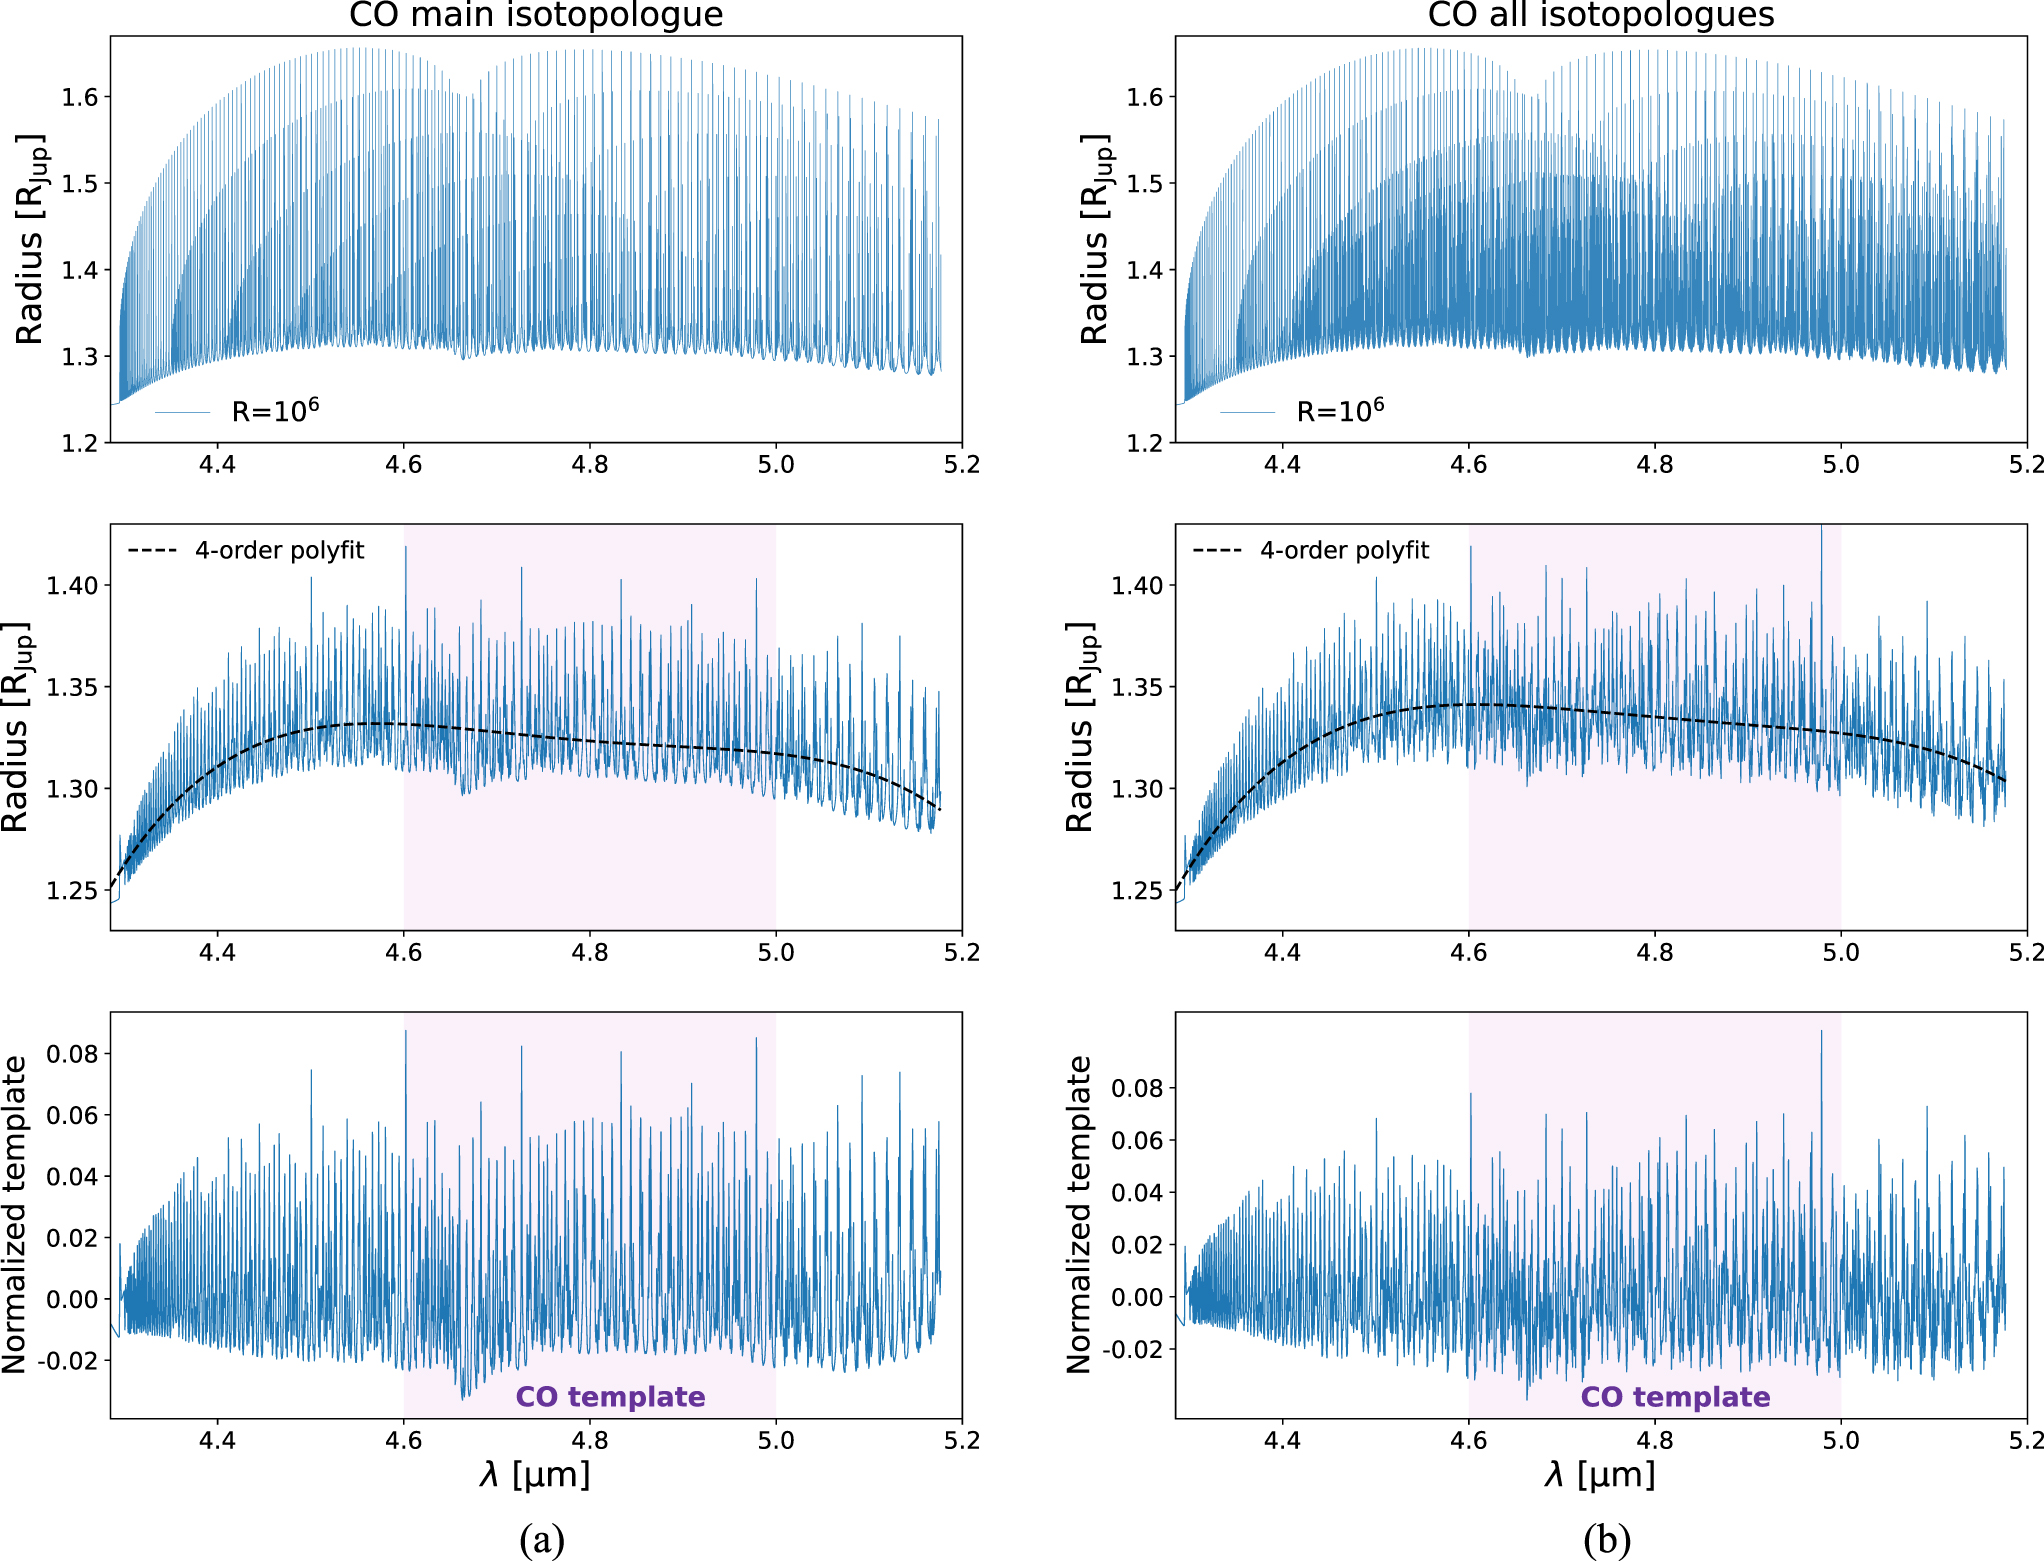
Steps detailing the construction of CO templates that the team then compared to the data. Click to enlarge. [Esparza-Borges et al. 2023]
Luckily, JWST is extremely stable: even after staring at a target for many hours, it is unlikely to have drifted by more than a fraction of a pixel, and the temperature is unlikely to have changed by more than a fraction of a fraction of a degree. Realizing this, Esparza-Borges and colleagues decided to take cross-correlation for a spin on JWST data for the first time.
Alarm Triggered
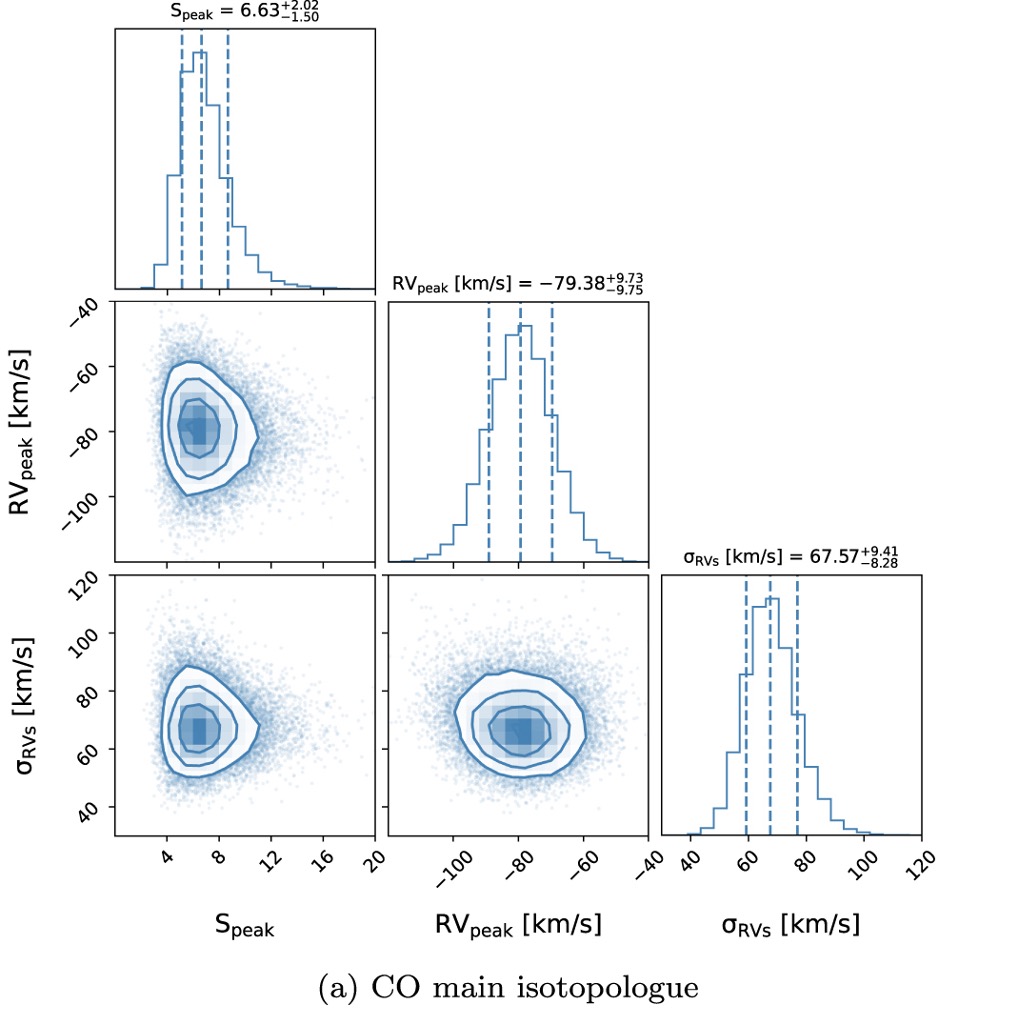
A selection of the final fits to the data. [Adapted from Esparza-Borges et al. 2023]
Citation
“Detection of Carbon Monoxide in the Atmosphere of WASP-39b Applying Standard Cross-correlation Techniques to JWST NIRSpec G395H Data,” Emma Esparza-Borges et al 2023 ApJL 955 L19. doi:10.3847/2041-8213/acf27b
The post JWST: The World’s Most Sophisticated Carbon Monoxide Detector appeared first on AAS Nova.
]]>
Four research articles take on small-scale phenomena in coronal plumes, the question of magnetic reconnection, red-winged flares, and solar wind forecasts.
The post Monthly Roundup: The Sun, Space Weather, and Solar Flares appeared first on AAS Nova.
]]>Editor’s Note: The Monthly Roundup is a new series that takes a broad view of one astronomical topic each month, exploring it through the lens of 3-5 recent research articles. The first post in this series, published in November, presented JWST observations of the TRAPPIST-1 system.
As we collect more and more high-resolution data of our home star, we find new phenomena that require explanation. This month, we’ll take a look at four research articles that examine different aspects of the Sun, from fine structures to strange flares.
Throwing Turbulence into the Mix
Solar flares are eruptions of high-energy radiation, occurring as frequently as several times a day during the most active part of the solar cycle. Flares are thought to be powered by magnetic reconnection, in which the local solar magnetic field springs into a new configuration and releases magnetic energy. While this model has been hugely successful in explaining various features of solar flares, increasingly precise data have enabled researchers to examine flares more closely, and adjustments to this model may be required to explain the variety of solar flare characteristics across large and small spatial scales.
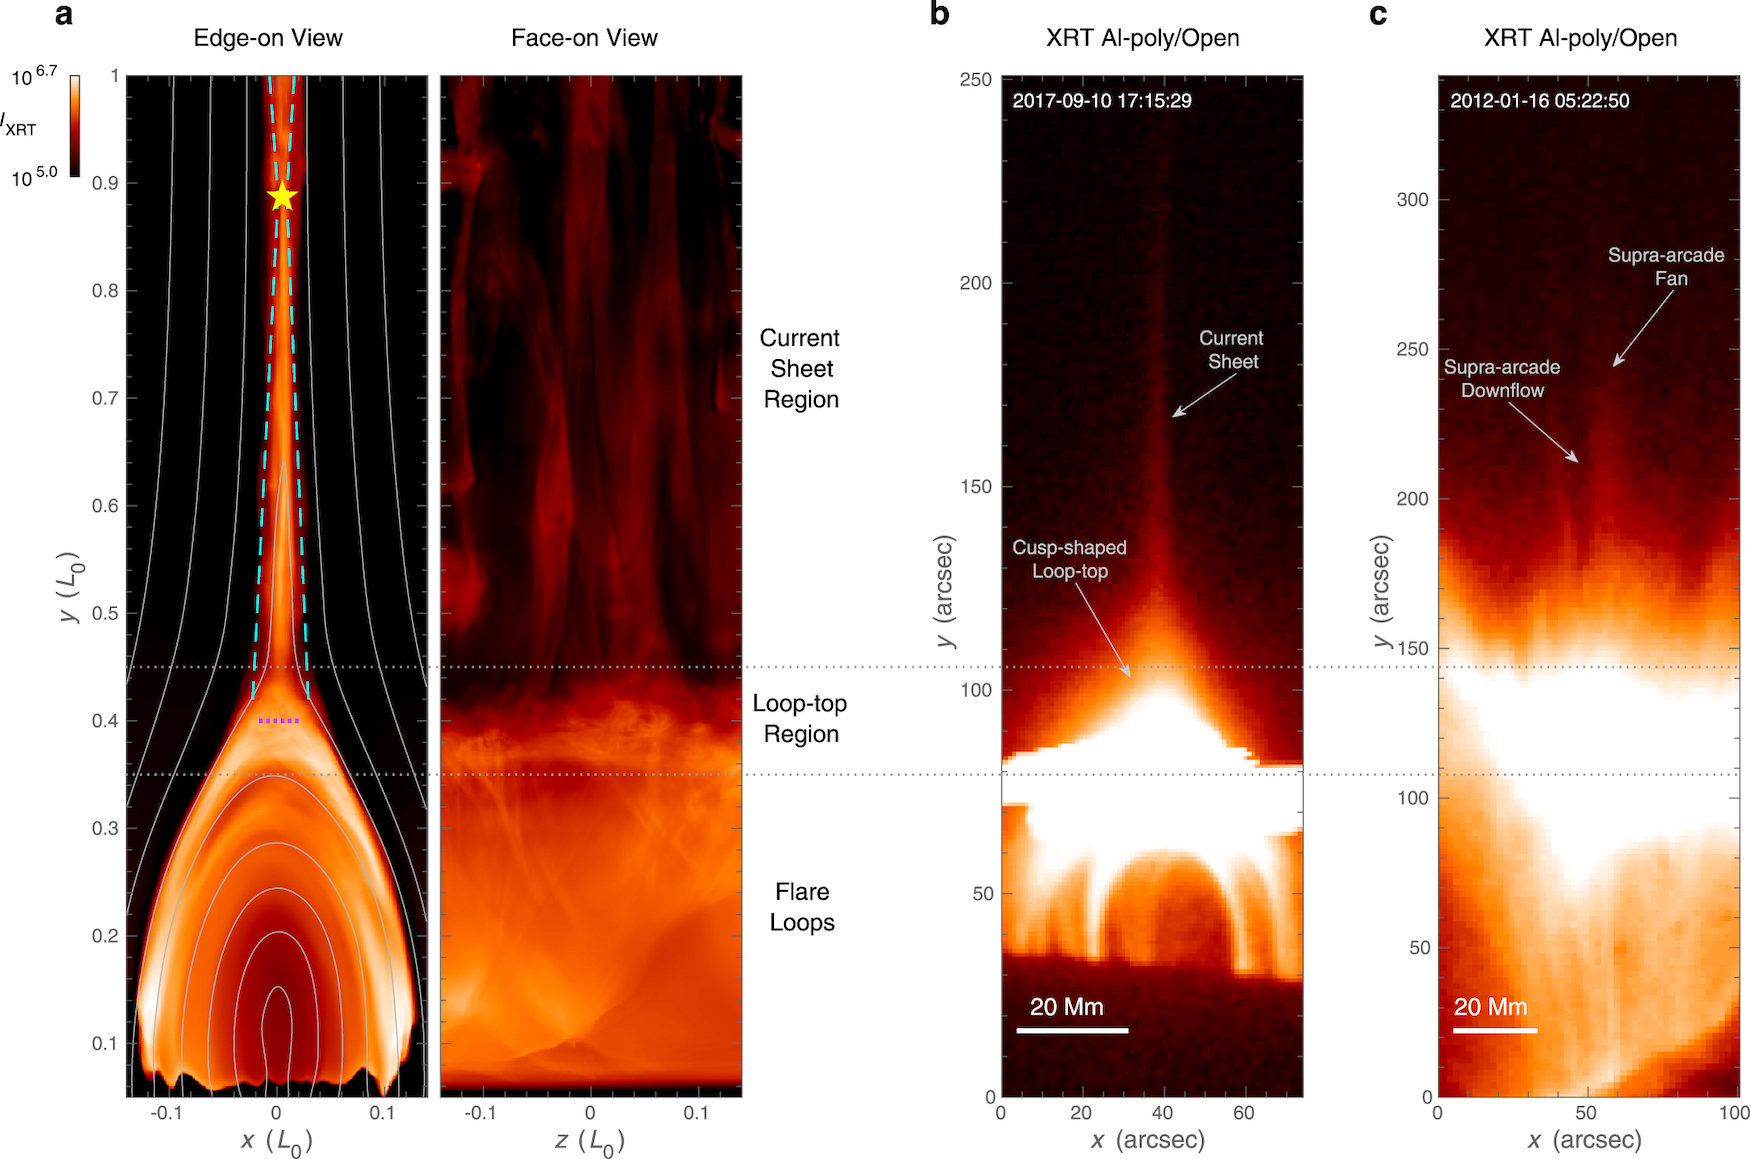
Comparison of synthesized X-ray Telescope (XRT) images (a) and observations (b and c). Click to enlarge. [Wang et al. 2023]
This 19.3-nanometer image, taken by the Solar Dynamics Observatory on December 11, 2023, shows at the center of the Sun’s disk the remnant of a large coronal hole. [NASA/SDO and the AIA, EVE, and HMI science teams]
Structure Within a Coronal Hole
R. J. Morton and R. Cunningham, both of Northumbria University, examined the small-scale structures seen in observations of a coronal hole by the Solar Dynamics Observatory spacecraft. Coronal holes are most apparent when viewing the Sun at extreme-ultraviolet and X-ray wavelengths, which showcase the Sun’s extremely hot and rarefied upper atmosphere, or corona.
Coronal holes aren’t really holes, but instead areas where the Sun’s magnetic field lines extend into space rather than looping back to the surface. The outstretched magnetic field lines carry plasma out into the solar system, leaving a depleted region of less dense, cooler plasma behind. The cooler plasma emits less radiation and appears as a dark “hole” in the Sun’s bright atmosphere.
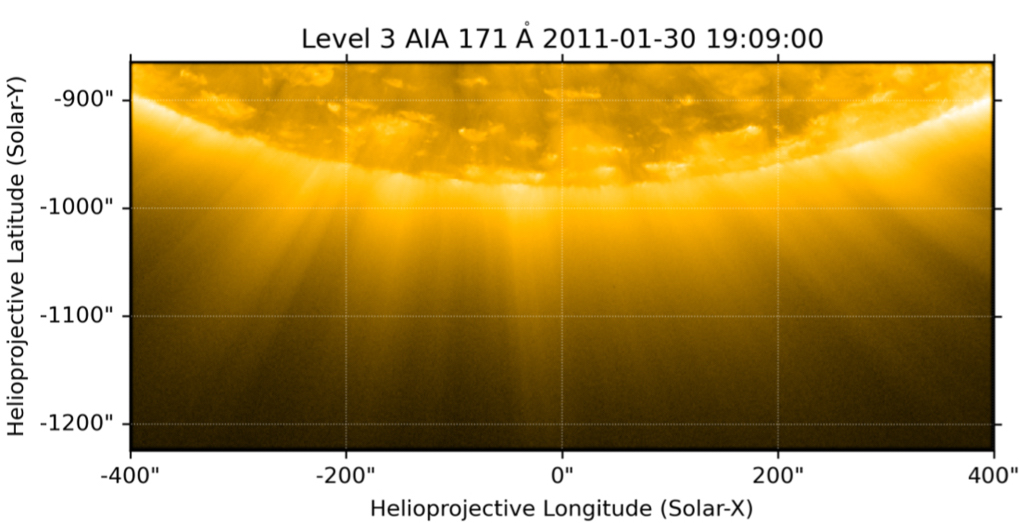
Example of plumes associated with a polar coronal hole. [Adapted from Morton and Cunningham 2023]
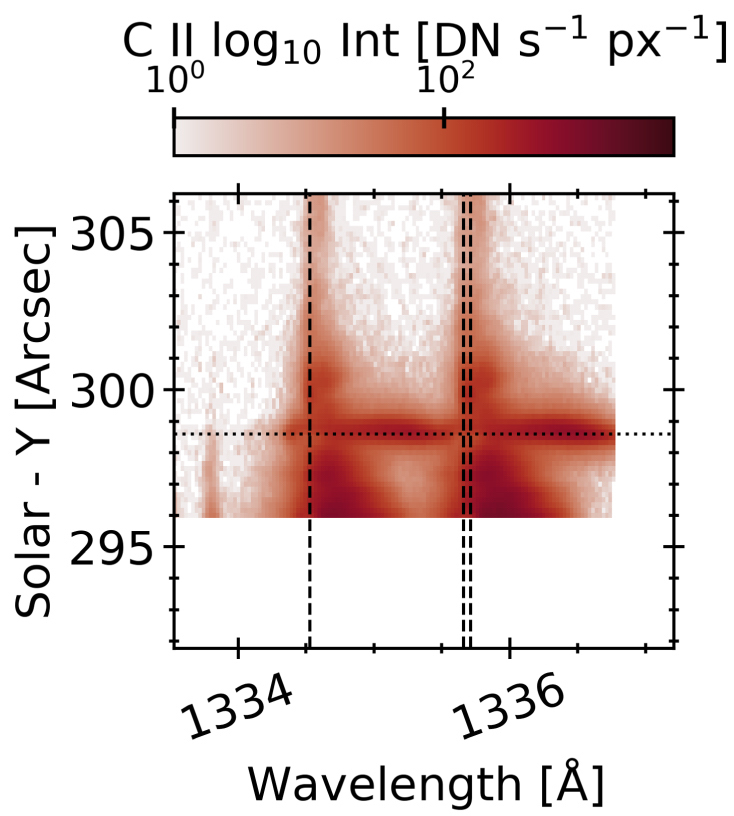
Example of the red wings on CII emission lines. The region of interest is marked by the horizontal dashed line. [Adapted from Xu et al. 2023]
Red Wings of a Solar Flare
In March 2022, researchers witnessed a solar flare with some unusual properties. Like many solar flares, this event exhibited two flare ribbons — bright, linear features that appear in the chromosphere, the region between the Sun’s surface and its corona — but it also had an unexpected compact bright region near the ribbons. A team led by Yan Xu (New Jersey Institute of Technology) reported on their investigation of this feature, analyzing images and spectra from several spacecraft. Spectra of the compact emission region show that its emission lines are not symmetrical, but rather have a “wing” that extends in the red (longer-wavelength) direction.
Modeling of these lopsided spectral lines suggested that they were produced by gas plunging downward at 160 kilometers per second — far faster than expected for a typical solar flare. But what could cause the plasma to race downward? Xu’s team suggests that this is an extreme example of a chromospheric condensation, in which plasma in the chromosphere flows downward, propelled by energy output higher in the atmosphere. Though velocities as high as those seen here aren’t unheard of, their rarity and the fact that models of chromospheric condensations struggle to produce such high speeds pose a challenge for future works.
And Now, for Our Space Weather Forecast…
Jihyeon Son (Kyung Hee University) and collaborators applied machine-learning techniques to one of the most pressing problems in solar physics: how to forecast space weather. Space weather refers to the ever-changing plasma environment in our solar system, from the gentle solar wind to powerful coronal mass ejections. By using models to forecast the plasma environment near Earth, researchers explore how conditions near the Sun correlate with conditions near Earth, test their theories of how plasma and magnetic fields behave, and, ultimately, provide a way to predict when damaging space weather will reach us.
Son’s team used a deep-learning model to predict the speed of the solar wind at Earth from extreme-ultraviolet images of the Sun and past measurements of the solar wind speed. Deep learning is a subset of machine learning that uses computing techniques that imitate the way the human brain learns. The team’s model used two neural networks: one to address the extreme-ultraviolet image inputs, and one to handle the past values of the solar wind speed. The two networks are then linked to give a prediction of the solar wind speed at Earth for the next three days.
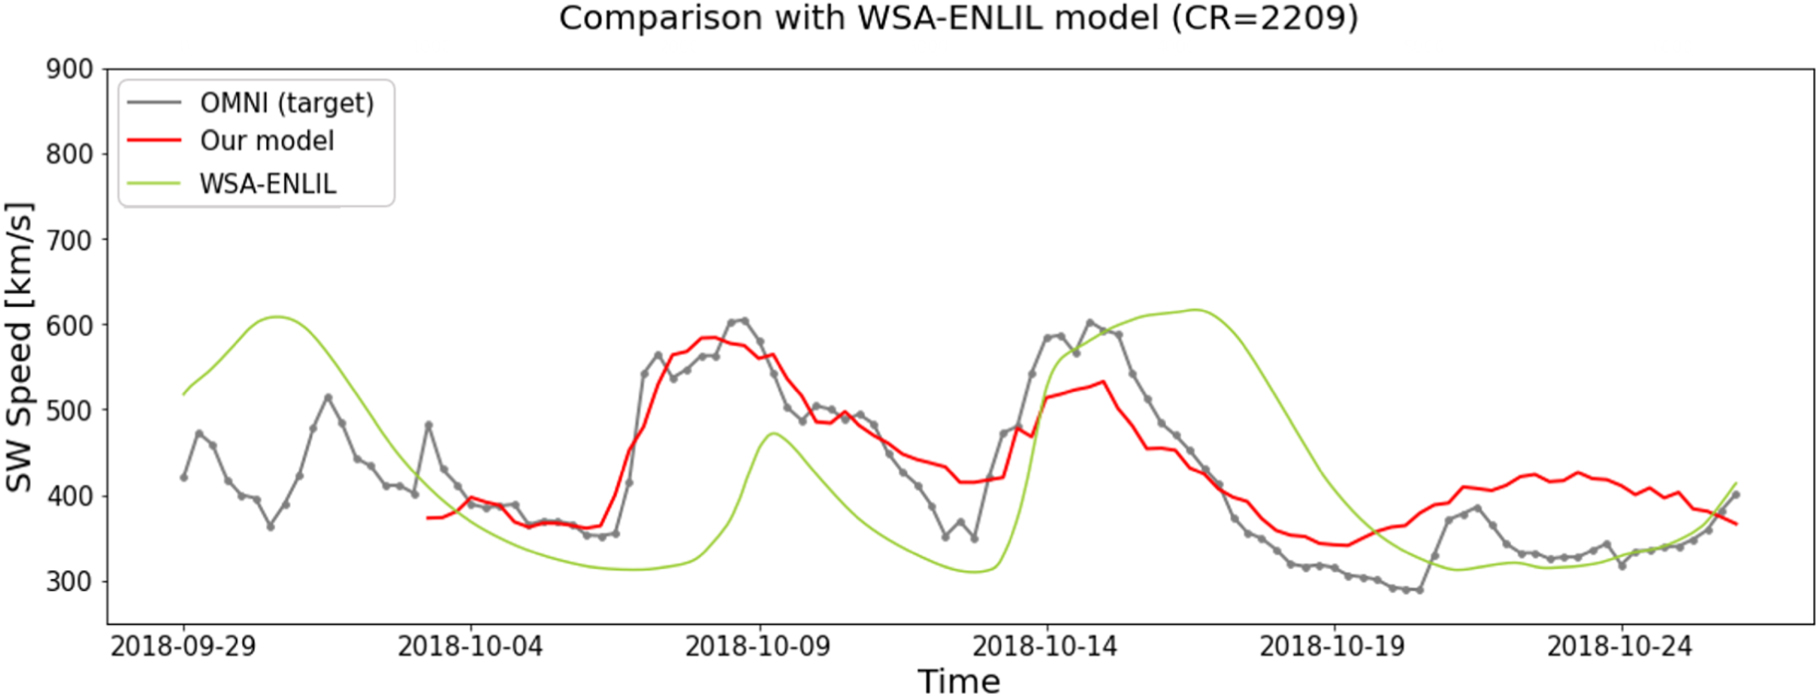
Predictions of the model used in this work (red line) compared to the output from the model used by the Space Weather Prediction Center (green line) and the actual solar wind speed (gray line). Click to enlarge. [Son et al. 2023]
Citation
“Three-Dimensional Turbulent Reconnection Within the Solar Flare Current Sheet,” Yulei Wang et al 2023 ApJL 954 L36. doi:10.3847/2041-8213/acf19d
“The Fine-Scale Structure of Polar Coronal Holes,” R. J. Morton and R. Cunningham 2023 ApJ 954 90. doi:10.3847/1538-4357/acea7c
“Extreme Red-Wing Enhancements of UV Lines During the 2022 March 30 X1.3 Solar Flare,” Yan Xu et al 2023 ApJ 958 67. doi:10.3847/1538-4357/acf8c6
“Three-Day Forecasting of Solar Wind Speed Using SDO/AIA Extreme-Ultraviolet Images by a Deep-Learning Model,” Jihyeon Son et al 2023 ApJS 267 45. doi:10.3847/1538-4365/ace59a
The post Monthly Roundup: The Sun, Space Weather, and Solar Flares appeared first on AAS Nova.
]]>
Astrobites reports on the differences between planets orbiting M dwarfs in single-planet and multi-planet systems.
The post Siblings or Only Children: M-dwarf Planets appeared first on AAS Nova.
]]>Editor’s Note: Astrobites is a graduate-student-run organization that digests astrophysical literature for undergraduate students. As part of the partnership between the AAS and astrobites, we occasionally repost astrobites content here at AAS Nova. We hope you enjoy this post from astrobites; the original can be viewed at astrobites.org.
Title: A Comparison of the Composition of Planets in Single-planet and Multiplanet Systems Orbiting M dwarfs
Authors: Romy Rodríguez Martínez et al.
First Author’s Institution: The Ohio State University
Status: Published in AJ
The most common type of star in the universe is the M dwarf, making up ~70% of all stars. Because M dwarfs are so common, and because we know exoplanets are common, it is only natural that we have found many exoplanets orbiting M-dwarf stars. In fact, Astrobites covered seminal articles on the occurrence rate of planets around M dwarfs and their compositions; read them here and here. But with all these planets, we can take our knowledge one step further and begin to ask deeper questions. For example, in M-dwarf planetary systems, how do single-planet systems (only child) and multi-planet systems (siblings) compare?
A new study seeks to answer this question, focusing on three key parameters: planet bulk density, planet core mass fraction, and host-star metallicity. In particular, the authors wish to investigate whether siblings and only-child systems are two outcomes of the same formation process, or if they truly form differently. In other words, are they from the same population, or are they two distinct populations of planets?
Bulk Density
First, bulk density, or the average density of the planet as a whole. We know that Earth is made up of many different materials (rocks, water, gases, etc.) and each one of these has its own density. But for exoplanets, we cannot explore the details of different materials and so instead we measure bulk density by simply taking the total mass of the planet and dividing by the total volume (assuming the planet is a sphere). The authors compute bulk density for a sample of planets around M dwarfs, computing this quantity for both the single-planet systems and all the planets in multi-planet systems.
Next they apply a statistical test (the Kolmogorov–Smirnov test) to determine if the two sets of planets are truly distinct populations or are consistent with one population (see Figure 1 top panel). The result overwhelmingly shows that these are two different populations. However, the authors caution that this result may be biased. Many of the single-planet systems in the sample are giant planets, which are naturally lower density than smaller planets are because they have higher gas fractions. Removing the gas giants from the sample and re-running the test, the authors find that actually the siblings and only-child planets are consistent with coming from the same population (see Figure 1 bottom panel).
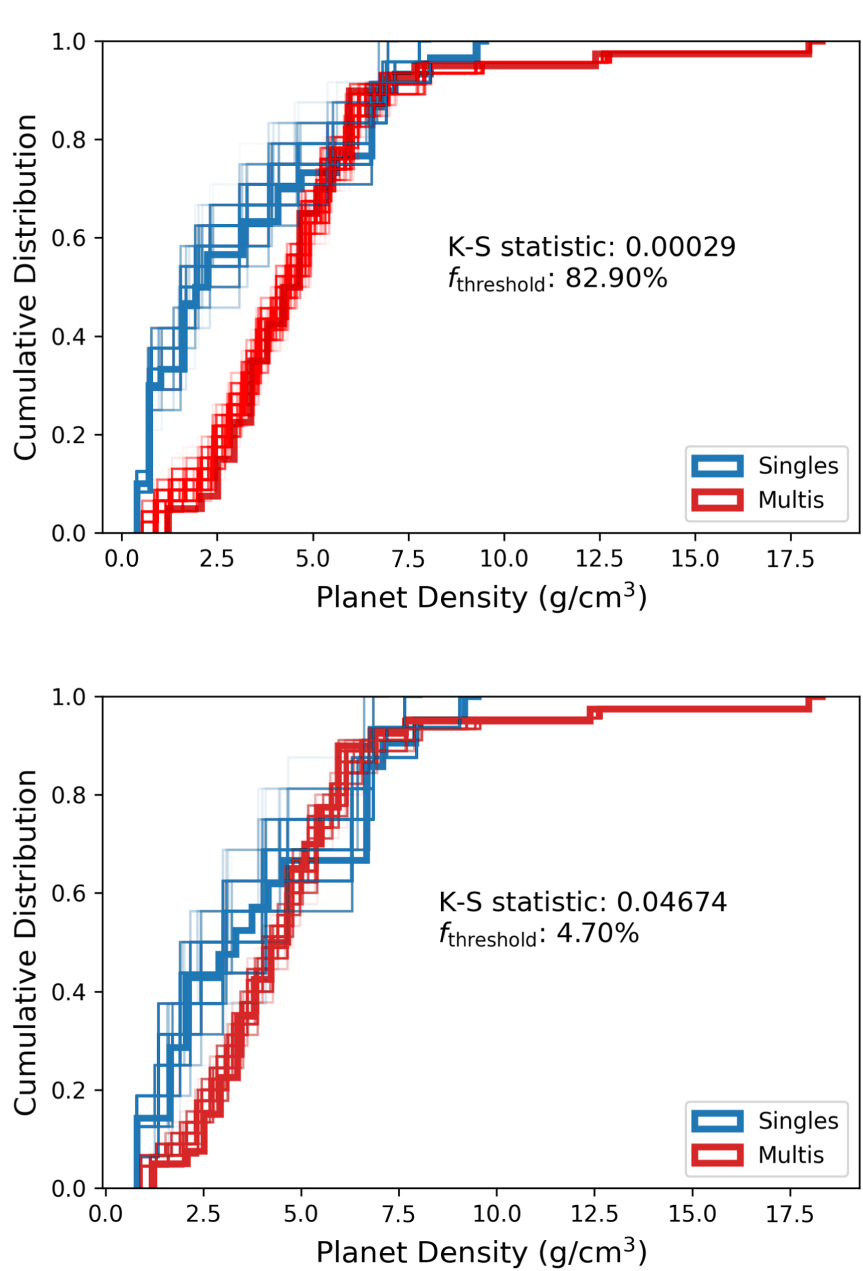
Figure 1: Top: The results of the statistical test when including all planets to determine if the two populations are distinct. The gap between the single and multis suggests they are indeed two populations. Bottom: The same as the top panel but for the sample that excludes giant planets. Here the finding of two populations is less statistically significant. [Adapted from Martínez et al. 2023]
Core Mass
Next, planet core mass. The mass of a planet is generally meant to include everything that makes up the planet. However, the core mass is just that, the mass of the core of the planet alone. Core masses are valuable pieces of information because it is thought that the size of the core, which is the first to form, can determine how big the planet eventually grows to be. Bigger cores are better at gravitationally attracting material, including gas, to grow the planet. While we cannot directly measure the core mass of a planet, we can use models that are tuned to Earth’s parameters to estimate planet core mass based on a few things we can measure, like mass and radius. Now taking only the planets that are likely to be rocky and again splitting by single versus multi-planet systems, the authors find that planets in single-planet systems have, on average, larger core masses than those in multi-planet systems. They further test if core mass correlates with orbital period but find no correlation.
Metallicity
Lastly, the authors explore the host star, particularly its metallicity, or the percentage of the star’s composition that is made up of “metals” (astronomers define “metal” as anything heavier than helium!). Host star metallicity is thought to correlate with the kinds of planets and number of planets in the system, the thinking being that since planets form out of the same disk of material as the host star, if there are more heavy materials in that disk (which would appear as higher metallicity in the host star) then there is more opportunity to make more and bigger planets. The authors here find that host stars of single planets are more metal rich than those hosts of multi-planet systems. This is counterintuitive, but the authors hypothesize this could be because more metal-rich stars might produce more and bigger planets, which may gravitationally interact in the early days of the system and fling out all but one planet. On the other hand, metal-poor stars cannot build big planets and instead build small planets that are dynamically “quiet.”
In all, the authors find that single- and multi-planet M-dwarf systems are likely two distinct populations. This could have large implications for how we understand the formation and evolution of planetary systems.
Original astrobite edited by Mark Popinchalk.
About the author, Jack Lubin:
Jack received his PhD in astrophysics from UC Irvine and is now a postdoc at UCLA. His research focuses on exoplanet detection and characterization, primarily using the radial-velocity method. He enjoys communicating science and encourages everyone to be an observer of the world around them.
The post Siblings or Only Children: M-dwarf Planets appeared first on AAS Nova.
]]>
The first phase of a survey designed to discover faint X-ray sources in our galaxy is complete, resulting in the discovery of hundreds of new sources.
The post Featured Image: Surveying the Milky Way’s Faint X-ray Sources appeared first on AAS Nova.
]]>
The plane of the Milky Way through the eyes of the Swift Observatory. Click to see a high-resolution version. [O’Connor et al. 2023]
Citation
“The Swift Deep Galactic Plane Survey (DGPS) Phase I Catalog,” B. O’Connor et al 2023 ApJS 269 49. doi:10.3847/1538-4365/ad0228
The post Featured Image: Surveying the Milky Way’s Faint X-ray Sources appeared first on AAS Nova.
]]>
An investigation of a young neutron star in an X-ray binary system has led researchers to propose a new model that explains its complicated X-ray behavior.
The post Seventeen Days of X-rays with Circinus X-1 appeared first on AAS Nova.
]]>New high-cadence observations of Circinus X-1, a binary system containing an extremely young neutron star, have led researchers to propose a unified model for the system’s complicated X-ray emission.
A Young Neutron Star
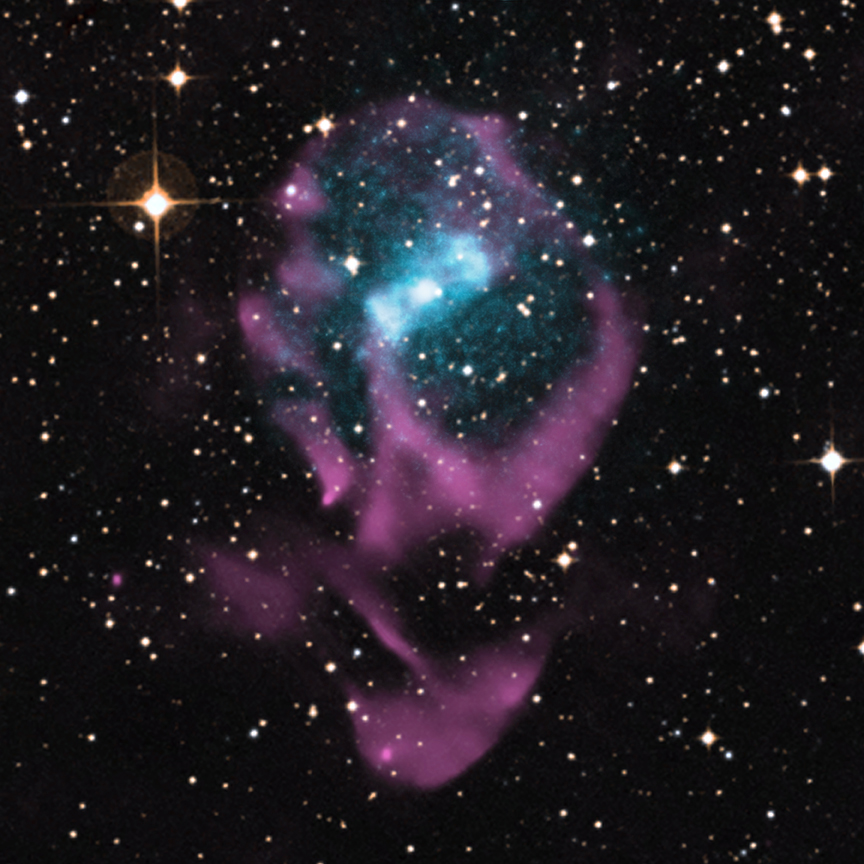
A composite X-ray, optical, and radio image of Circinus X-1 that shows the surrounding supernova remnant. [X-ray: NASA/CXC/Univ. of Wisconsin-Madison/S.Heinz et al; Optical: DSS; Radio: CSIRO/ATNF/ATCA]
As the neutron star steals material from its binary companion, it results in long-term, orders-of-magnitude changes in the system’s X-ray flux, fleeting bursts, and changes over the course of each orbit. To understand the complex changes that take place in this system over each orbit, a research team led by Mayu Tominaga (Japan Aerospace Exploration Agency and The University of Tokyo) turned to high-cadence X-ray monitoring.
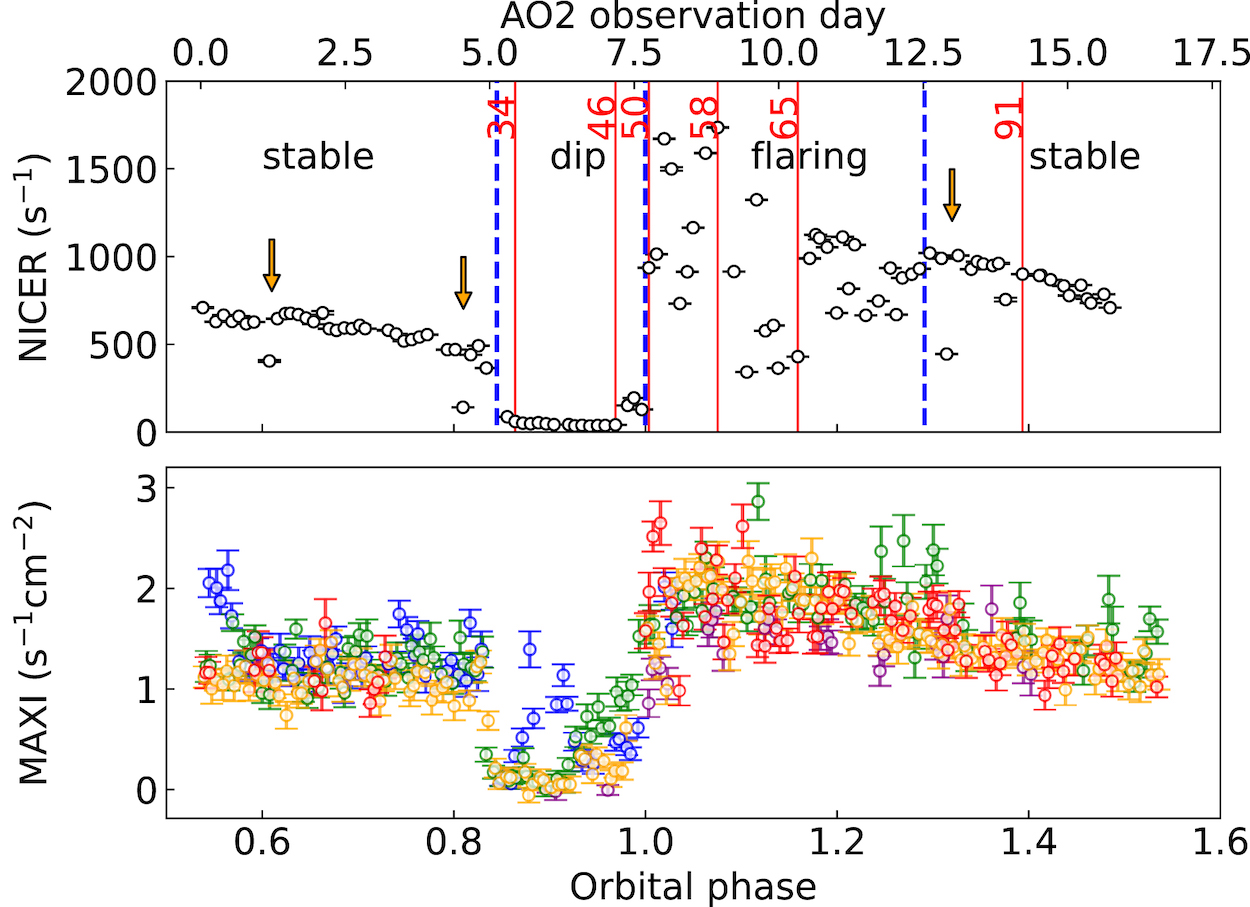
The new high-cadence NICER observations (top panel) show the same phases as the previous lower-cadence data from the Monitor of All-sky X-ray Image (MAXI; bottom panel). Click to enlarge. [Tominaga et al. 2023]
High-Cadence Monitoring
Using the Neutron Star Interior Composition Explorer (NICER), a sensitive X-ray telescope on the International Space Station, Tominaga’s team observed Circinus X-1 roughly every four hours for an entire orbital period, 16.6 days. The object’s light curve over this time shows three distinct phases: stable, dipping, and flaring.
To link these phases to the properties of the binary system, the team modeled spectra from each phase. At first glance, the three phases have completely different spectra, but the team was able to unite the seemingly disparate spectra under a single model in which an accretion disk, emitting light across the electromagnetic spectrum, is periodically blocked by a cloud of neutral gas. Surrounding this whole system is ionized gas.
A Unified Model
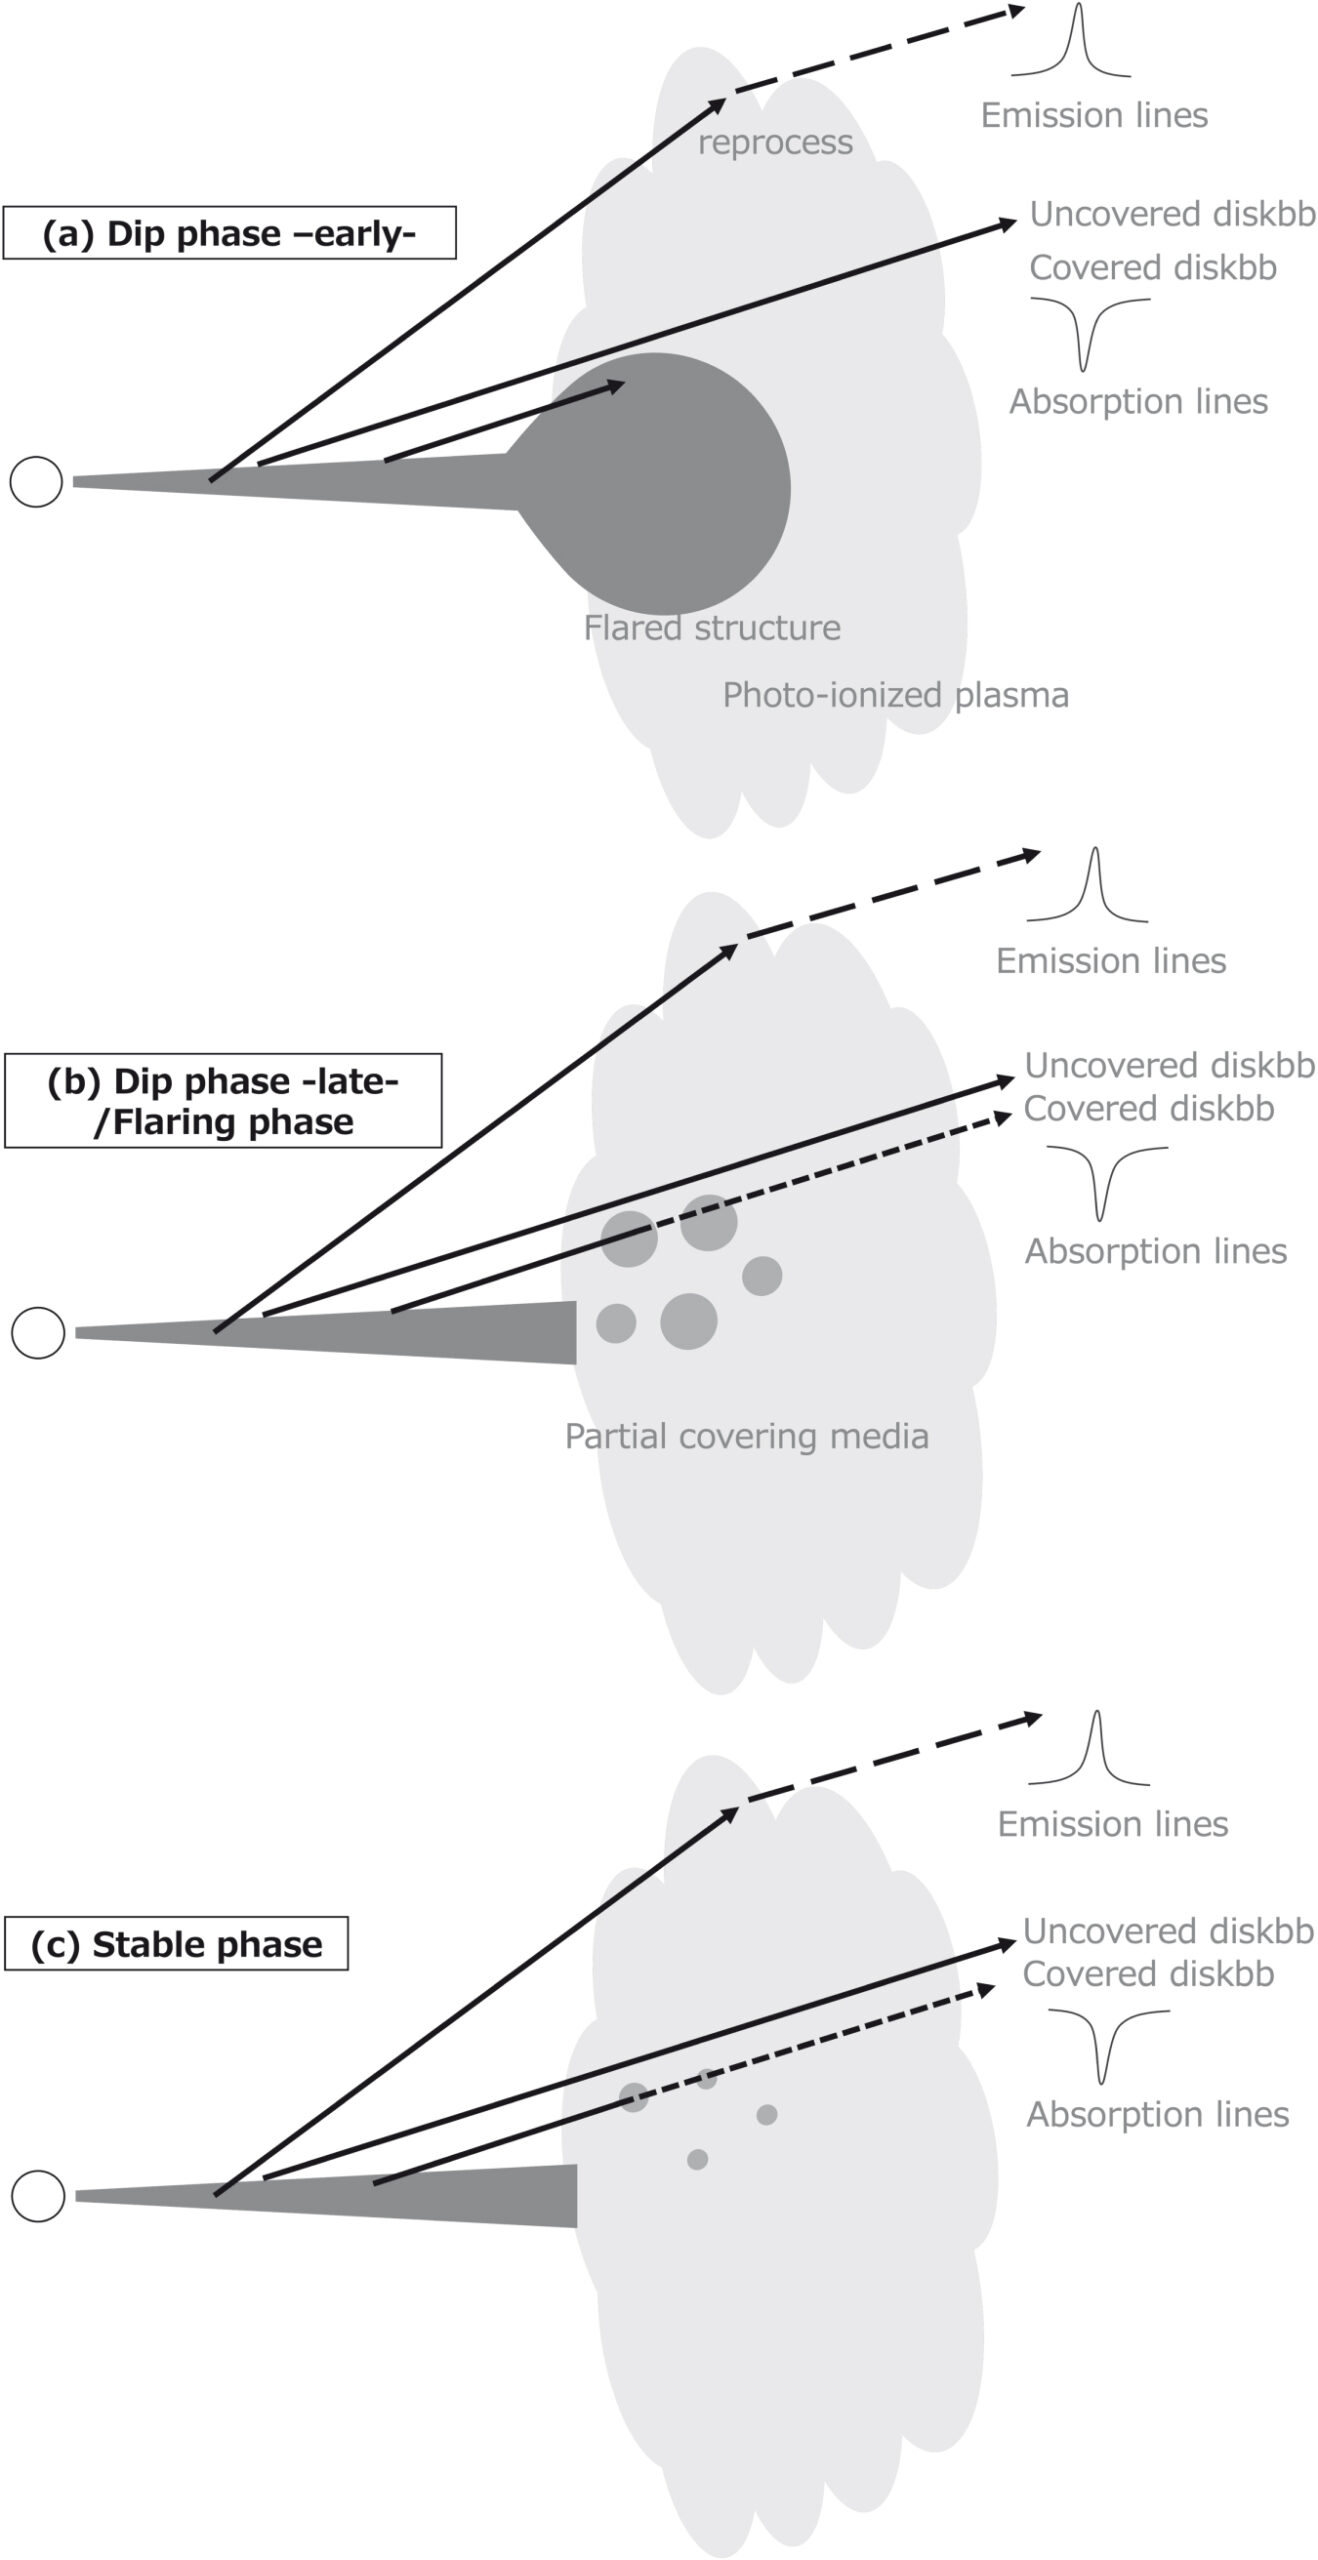
Diagram of the model proposed by the authors. Here, “diskbb” is the blackbody emission from the accretion disk. Click to enlarge. [Tominaga et al. 2023]
This picture of how the system’s emission is moderated over the course of its orbit explains nearly all of the NICER spectra of Circinus X-1. Tominaga and collaborators hope that this simple model can be used to explain short- and long-term behaviors of the system in other parts of the electromagnetic spectrum as well.
Citation
“X-ray Spectral Variations of Circinus X-1 Observed with NICER Throughout an Entire Orbital Cycle,” Mayu Tominaga et al 2023 ApJ 958 52. doi:10.3847/1538-4357/ad0034
The post Seventeen Days of X-rays with Circinus X-1 appeared first on AAS Nova.
]]>
Between stellar-mass and supermassive black holes lie elusive intermediate-mass black holes. New radio data give insight into the nature of the promising intermediate-mass black hole candidate CXO J1338+04.
The post A Radio Investigation of an Intermediate-Mass Black Hole Candidate appeared first on AAS Nova.
]]>A chance observation during a survey of active galactic nuclei opened a new window onto an ultra-luminous X-ray source that may be an intermediate-mass black hole.
Looking for the Missing Black Hole Pieces
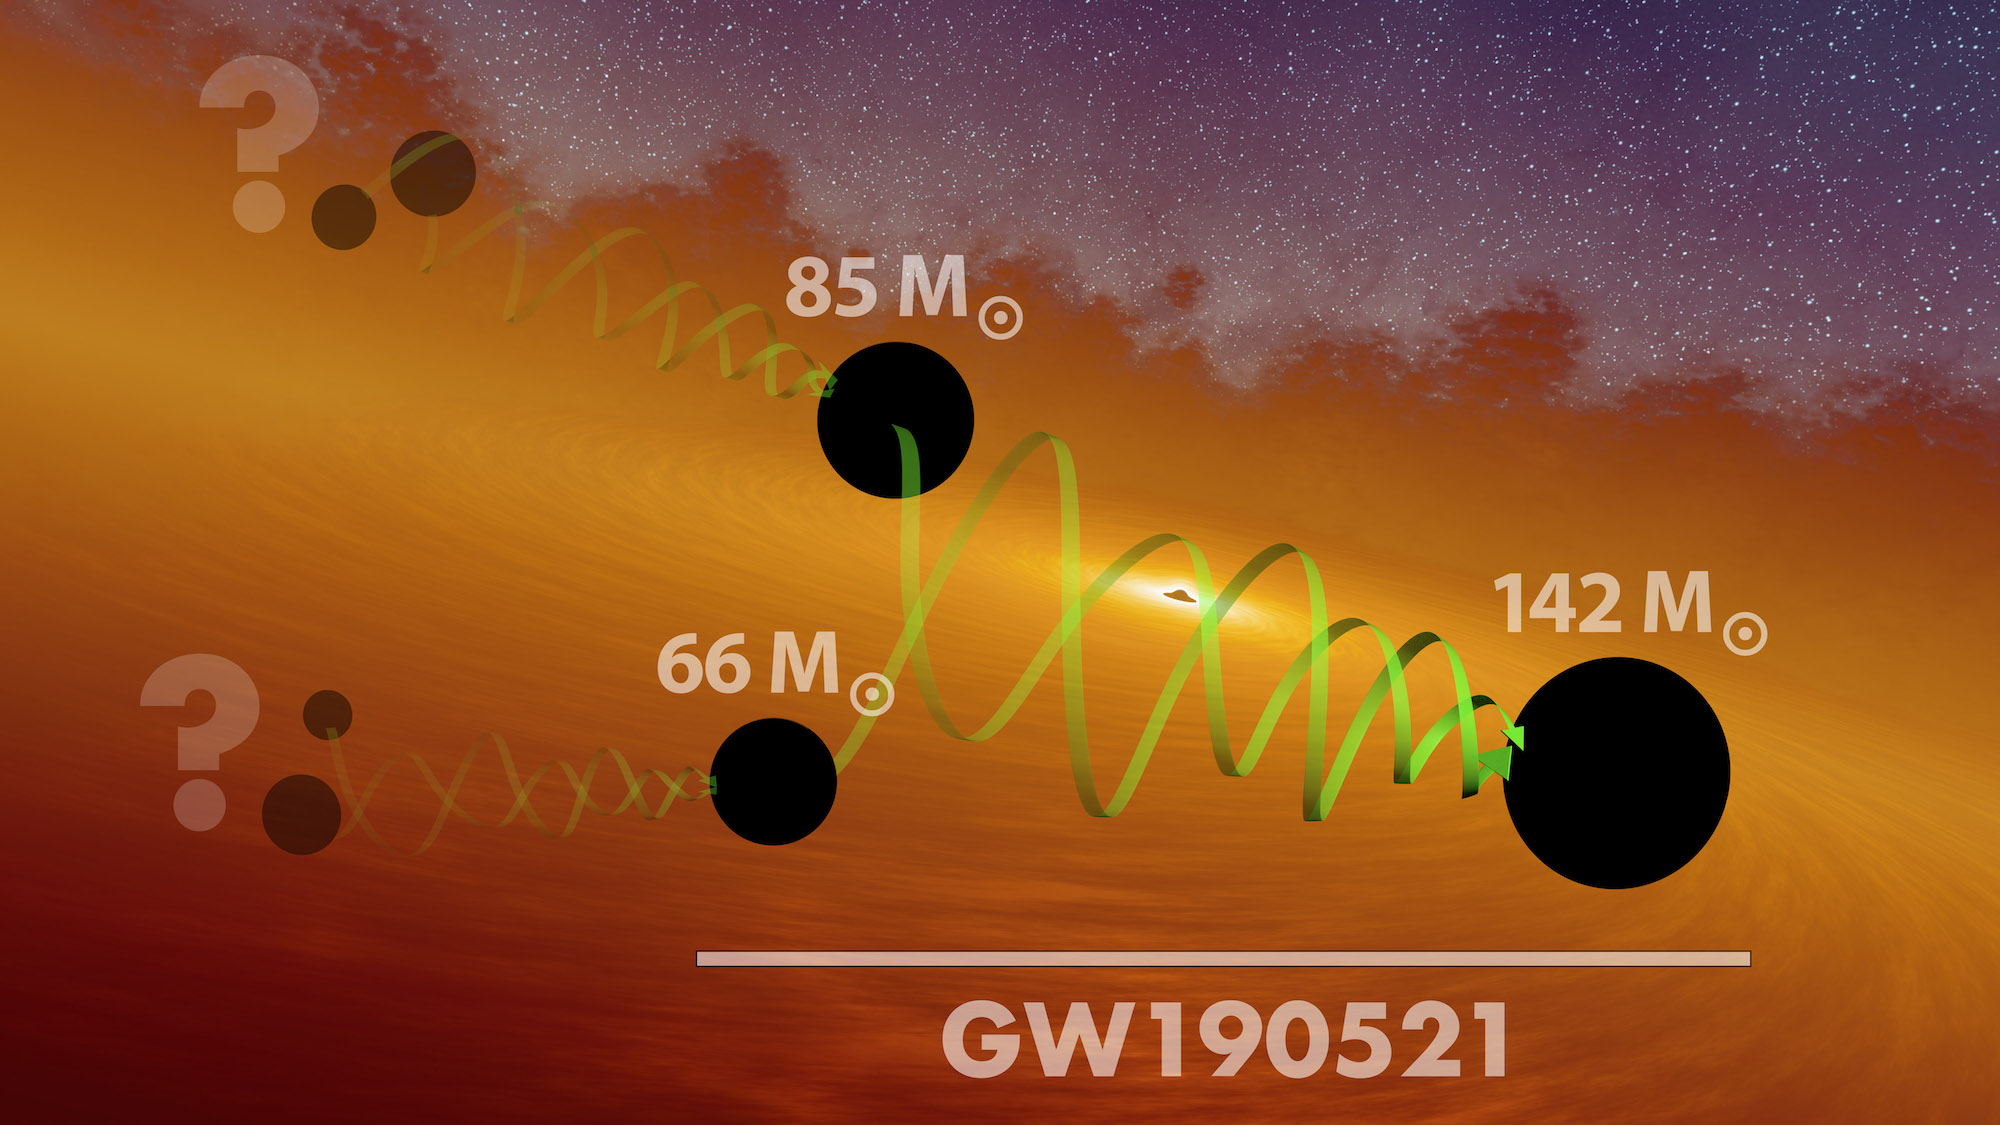
The Laser Interferometer Gravitational-Wave Observatory (LIGO) announced in 2020 the detection of a merger that resulted in a 142-solar-mass black hole, the largest merger product detected by LIGO to date. [LIGO/Caltech/MIT/R. Hurt (IPAC)]
Intermediate-mass black holes likely announce themselves the same way that stellar-mass and supermassive black holes do: by shining brightly across the electromagnetic spectrum when they consume material from their surroundings. Bright X-ray emission may have exposed the location of an intermediate-mass black hole in the outskirts of the galaxy NGC 5252. The source, named CXO J133815.6+043255, or CXO J1338+04 for short, is thought to be surrounded by swirling metal-poor gas. This hints that CXO J1338+04 could have been the central black hole of a metal-poor dwarf galaxy that merged with NGC 5252.
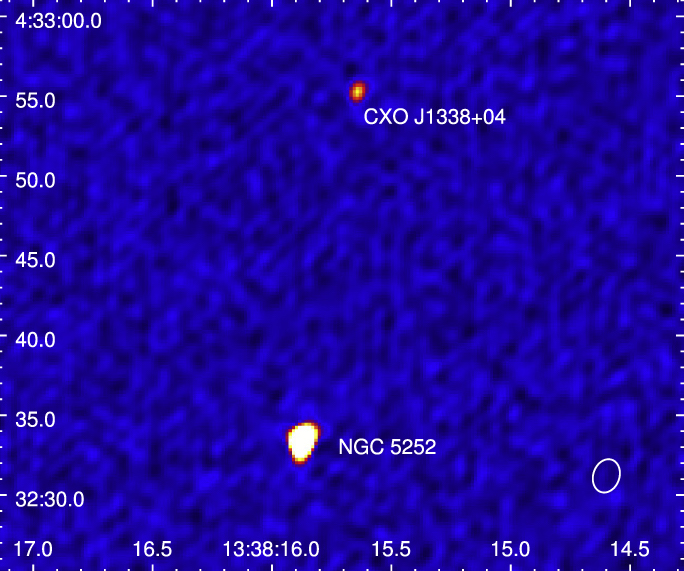
Radio image showing CXO J1338+04’s location relative to the center of NGC 5252. [Adapted from Smith et al. 2023]
A Long-Wavelength Look at CXO J1338+04
Recently, Krista Lynne Smith (Texas A&M University and Southern Methodist University) and collaborators used the Very Large Array to observe the nucleus of NGC 5252 as part of their study of nearby active galactic nuclei: luminous galactic centers powered by accreting supermassive black holes. By chance, their field of view encompassed CXO J1338+04, which shines brightly at the 22 gigahertz frequency of their observations.
Combining their new data with archival radio observations at lower frequencies, Smith’s team measured the slope of CXO J1338+04’s spectral energy distribution and found it to be consistent with expectations for an outflowing jet that could arise from an accreting black hole. The team noted that the observed spectral slope could also match that of a star-forming region, but they find that unlikely, especially since previous studies found active galactic nucleus–like optical emission lines that are hard to explain with star formation.
Further Support
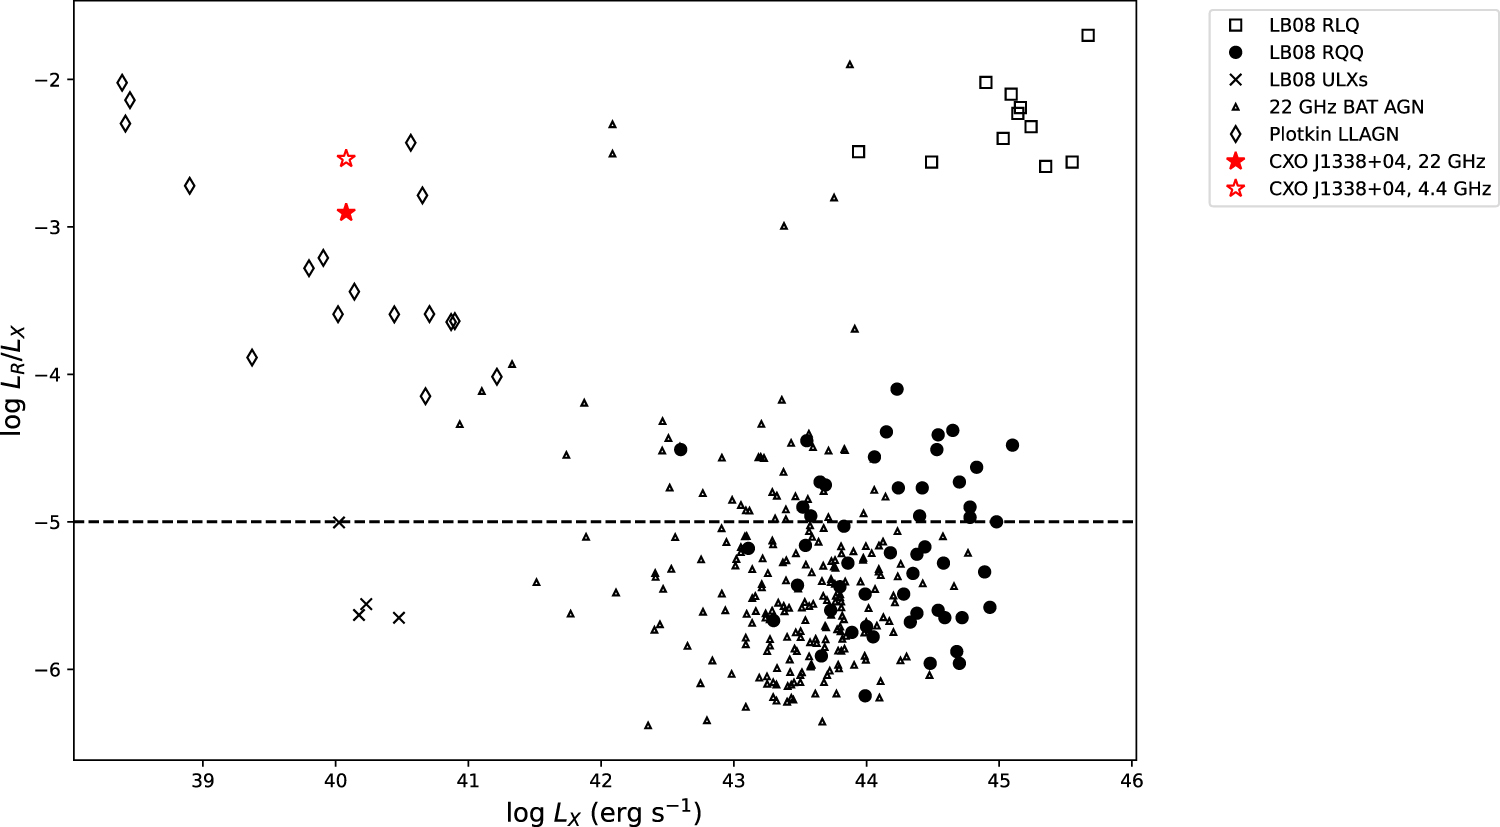
Ratio of radio and X-ray luminosities at two frequencies (red stars) for CXO J1338+04 compared to radio-loud quasars, radio-quiet quasars, and other active galactic nuclei and ultra-luminous X-ray sources. Click to enlarge. [Smith et al. 2023]
Taken together, CXO J1338+04’s spectral slope and radio emission match what’s expected for an accreting intermediate-mass black hole, supporting its inclusion on the small but steadily growing list of promising intermediate-mass black hole candidates.
Citation
“The Nature of the IMBH Candidate CXO J133815.6+043255: High-Frequency Radio Emission,” Krista Lynne Smith et al 2023 ApJ 956 3. doi:10.3847/1538-4357/acf4f8
The post A Radio Investigation of an Intermediate-Mass Black Hole Candidate appeared first on AAS Nova.
]]>
Astrobites reports on the far-out possibility of using continuous gravitational waves from faraway pulsars to learn about the inside of the Sun.
The post Forget X-ray Vision: Using Gravitational Waves to Peer Inside the Sun appeared first on AAS Nova.
]]>Editor’s Note: Astrobites is a graduate-student-run organization that digests astrophysical literature for undergraduate students. As part of the partnership between the AAS and astrobites, we occasionally repost astrobites content here at AAS Nova. We hope you enjoy this post from astrobites; the original can be viewed at astrobites.org.
Title: Probing the Solar Interior with Lensed Gravitational Waves from Known Pulsars
Authors: Ryuichi Takahashi
First Author’s Institution: Hirosaki University
Status: Published in ApJ
Forget X-ray vision — how about gravitational wave vision? In today’s article, a team of researchers examine the possibility of using gravitational waves from distant pulsars to learn about our own Sun. Much like the terrestrial seismologists and geologists who peer into Earth by listening carefully to the ways waves are distorted as they travel through its many layers, these imagined future gravitational heliophysicists would use the subtle distortions of gravitational waves that have passed through the Sun to learn about its inner contents.
Multi-messenger Seismology?
The idea of using the interaction between waves and normal matter to peer under the surface of otherwise opaque objects has a longstanding history in physics. Think for example of the idea of seismic tomography, one of the main tools used by seismologists and geologists to understand the makeup of Earth’s interior. As powerful shock waves move through Earth’s interior after seismic events like earthquakes, they come into contact with regions of material that may differ in their composition, density, temperature, and so on. Depending on the wave frequencies and the properties of the materials with which the waves come into contact, these waves will reflect, refract, diffract, or be otherwise altered from their initial waveform. Measuring the properties of these waves when they make contact with the surface again at different points around the world can thus tell us a great deal about what they may have encountered on their journey through the depths.
Similarly, when electromagnetic waves (light) encounter solid objects, they can undergo a number of interactions: certain wavelengths will be scattered or absorbed, and others may pass directly through an object. This is, roughly speaking, how X-ray imaging works: certain high-frequency electromagnetic rays can easily pass directly through your soft skin, but they will be reflected upon encountering denser material like bones, allowing us to reconstruct images of the interior of our own bodies without the need for invasive surgeries (thanks, science!).
Today’s article examines the feasibility of doing similar reconstructions but with waves of a different kind: gravitational waves. Gravitational waves, which have been discussed at length in previous Astrobites, are a hot topic right now within the astrophysics community given that the technology to directly detect their subtle presence has only come to maturity within the past decade or so. This is because gravitational waves, which are produced by the asymmetric motion of massive objects like black holes in binary orbits, produce extremely subtle effects here on Earth due in part to the weakness of the gravitational force and in part to the large distances the waves have typically traversed to reach us. Now that we are measuring these faint signals with regularity in ground-based gravitational wave detectors like LIGO, VIRGO, and KAGRA, interest has been growing in finding more and more exotic ways to use this brand new window into the universe to uncover its many secrets.
To understand the particularly out-there idea behind today’s article, we need to introduce at least one further concept: gravitational lensing. Gravitational lensing occurs when particles (or waves) travel close to a massive source and as a result have their trajectories altered. When a massive source (like a galaxy cluster) sits more or less directly between Earth and some distant object (like an individual galaxy), this deflection can act like a lens, focusing the light from the background galaxy towards Earth to make the galaxy appear bigger, brighter, or even more emoji-like. Additionally, as waves of any kind travel past such a lens, they will appear to take longer to reach the other side than they would have if there were no massive source. This effect is known as gravitational time delay, and it can sometimes manifest in ways not too dissimilar from the way in which light appears to “slow down” when passing through dense mediums like water. Gravitational lensing can cause all sorts of waves including gravitational waves to undergo many distorting effects similar to light traveling through media of varying densities or seismic waves traveling through Earth’s interior.
Taking all of these effects into account, we can begin to see why the idea of using gravitational waves to probe the interior of the Sun isn’t so far-fetched. While electromagnetic waves cannot typically pass into and out of the Sun due to their interactions with dense solar material, gravitational waves from a source behind the Sun would pass through easily, only experiencing distortion due to the aforementioned lensing effects caused by the varying density of the Sun along the line of sight between detectors on Earth and the source of the gravitational waves. While this idea has been explored before, today’s authors attempted a comprehensive analysis of what these distortions might look like for a set of real sources and examined how feasible it would actually be to detect them in present or future gravitational wave observatories. So can it be done? As it turns out, with some upgraded detectors, a dash of new millisecond (very fast-spinning) pulsar discoveries, and a bit of luck — it can!
Looking for Magic Millimeter Mountains
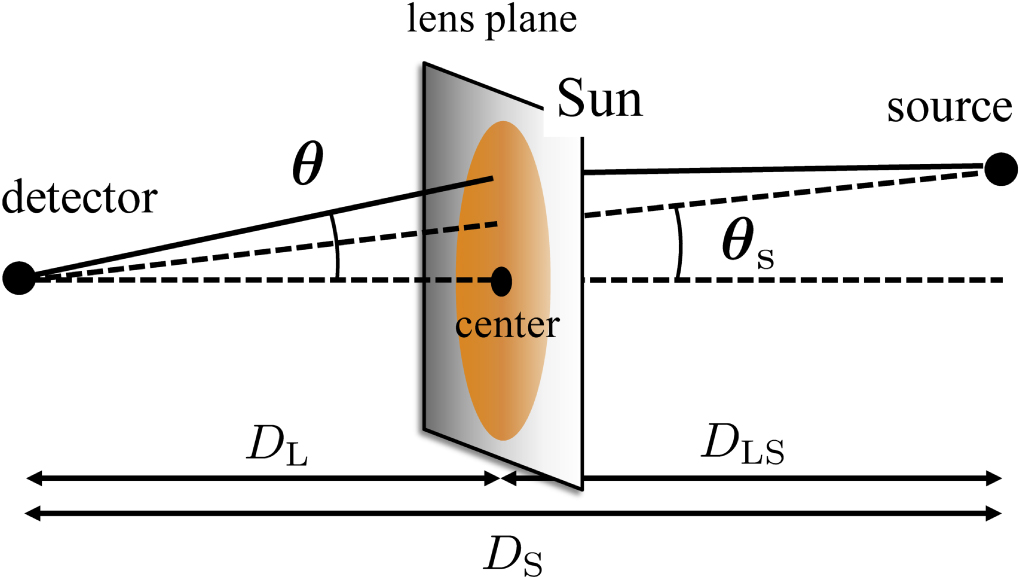
Figure 1: Depiction of the arrangement of an Earth-based gravitational wave detector and an object that emits continuous gravitational waves that is of interest to the authors of today’s article. When gravitational waves from the source have to pass directly through the Sun to reach Earth, they can be deflected from their original path and distorted in ways similar to how light is distorted when passing through a traditional lens. [Takahashi et al. 2023]
The authors of today’s article employ mathematical formulas (that are not too dissimilar from what one would see in an introductory optics course!) to calculate the amount of deflection, convergence, and time delay experienced by gravitational waves passing behind the face of the Sun at various angles relative to its center. Further wave-optics calculations are employed to find the corresponding amplification factors and phase offsets that waves of different frequencies would experience at these various angles. Their results are clearly shown in Figure 2: as each candidate pulsar (labeled by the different colored lines) appears to pass behind the face of the Sun, its corresponding gravitational wave signal will be amplified and offset in phase in complicated ways determined in part by the frequency of each gravitational wave and how closely the signal gets to passing directly behind the center of the Sun. By understanding how strong these effects are for continuous waves with different frequencies and amplitudes, the authors can begin to assess what it will take to detect them.
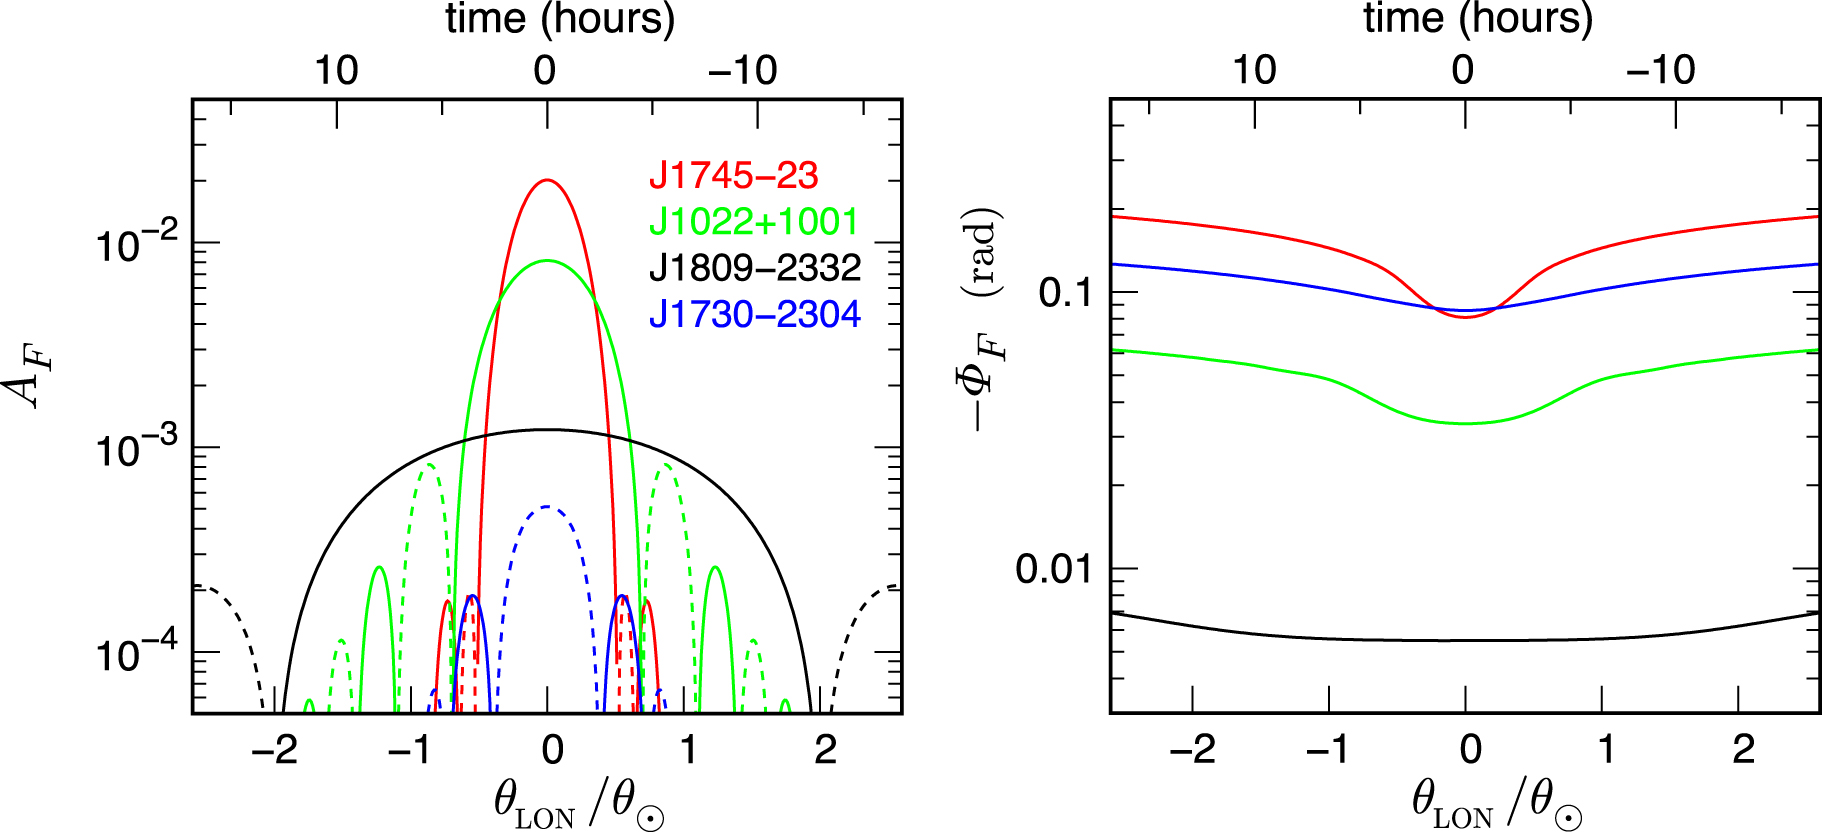
Figure 2: Models for the amplification (left) and phase offset (right) of a potential continuous wave signal as their line of sight appears to pass behind the Sun from four pulsars that are known to be eclipsed in this way once each year. [Takahashi et al. 2023]
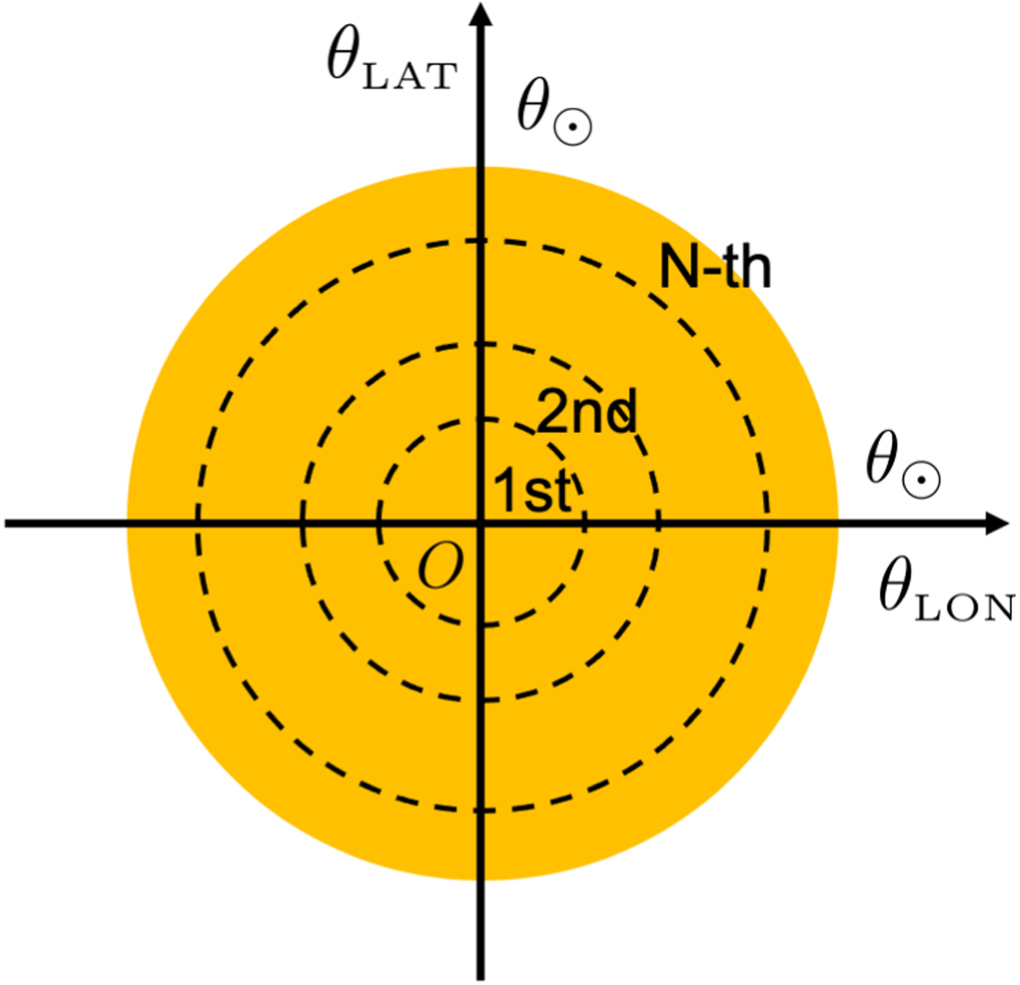
Figure 3: Estimates of the solar density profile will have to be made at different chosen slices called “annuli” (depicted here as the numbered concentric circles). Choices for how to pick these annuli affect how accurately their densities can be recovered for a given continuous wave pass. [Takahashi et al. 2023]
Unfortunately, accurately measuring the solar density at several different solar depths is even trickier, as the accuracy of each measurement depends on a variety of factors including how many total layers of the Sun one attempts to measure and how one sets the distance between each layer (Figure 3). For one year of continuous wave observation of the three best pulsar candidates, the signal-to-noise ratio needed to accurately measure the solar density at two different layers is found to be ~104, which is an order of magnitude higher than is even expected from the next-generation gravitational wave detectors Cosmic Explorer and the Einstein Telescope. To measure densities across 6 or 10 different layers of the Sun’s interior, the signal-to-noise ratio requirements grow to ~106 and ~107, respectively (Figure 4), well beyond the capabilities of planned detectors unless more rapidly spinning pulsars passing behind the Sun can be found and loudly heard in these future detectors.
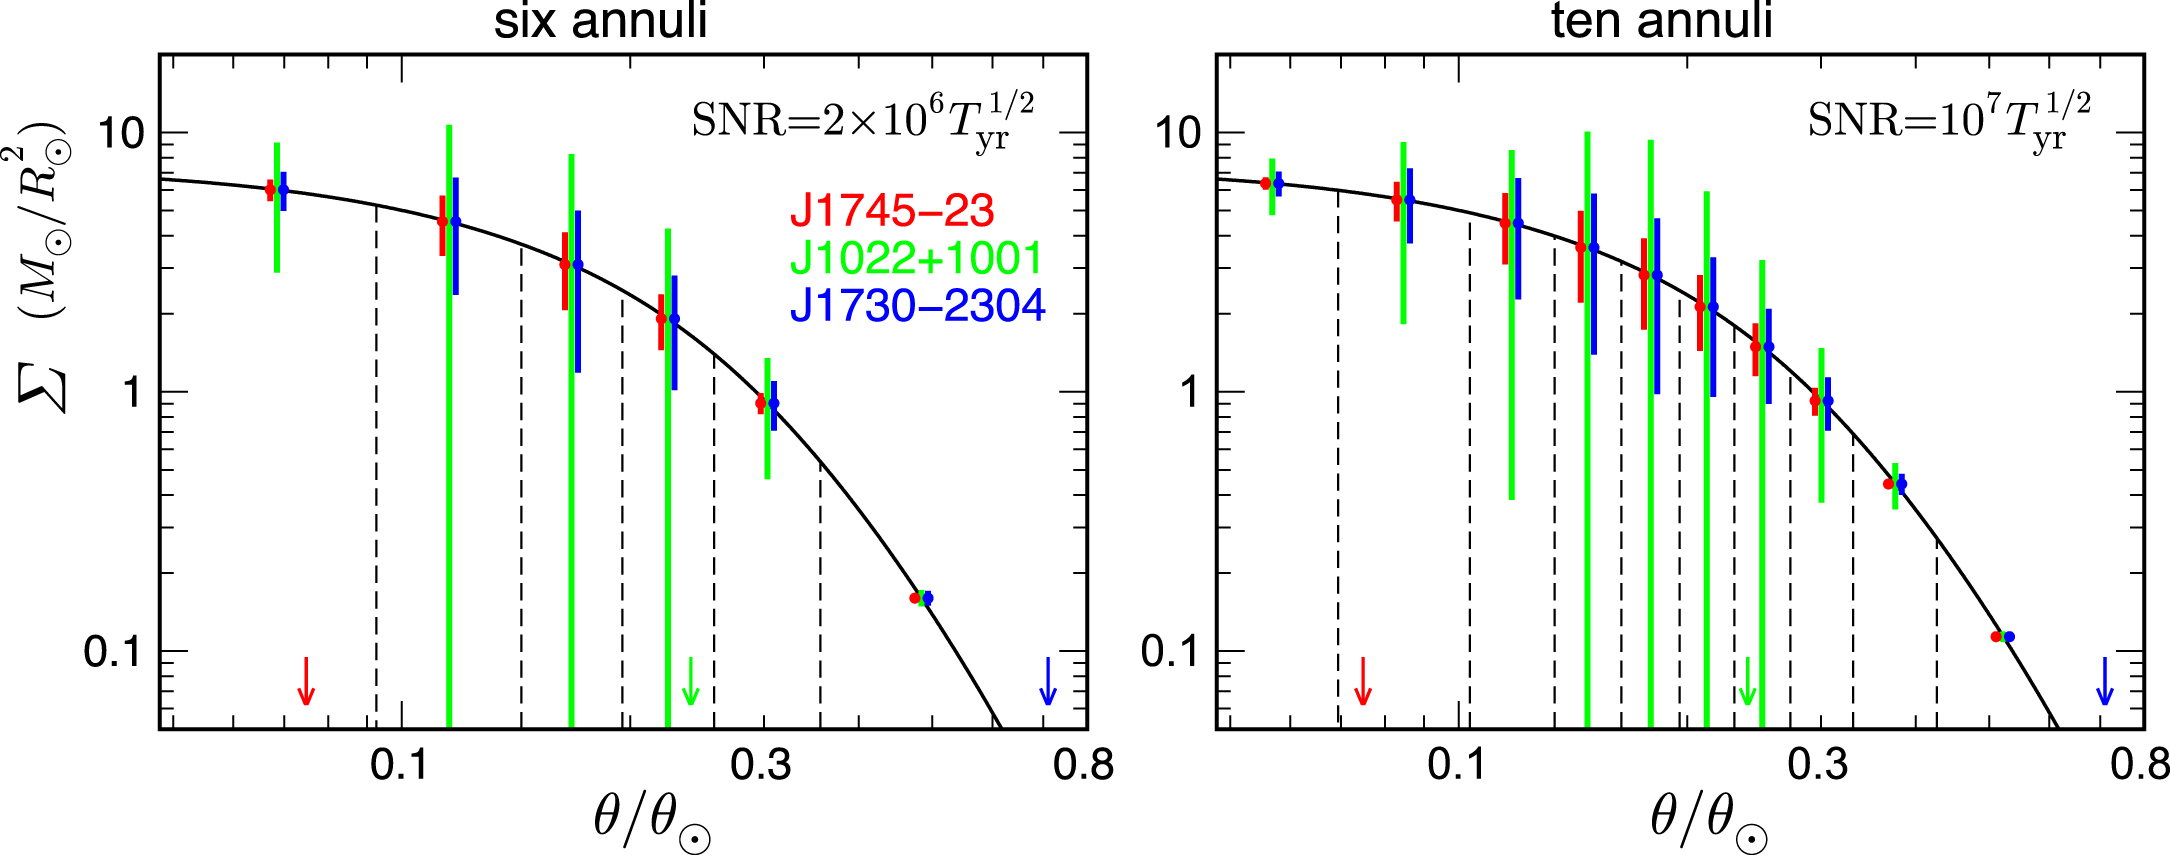
Figure 4: This plot depicts the uncertainty in solar density measurements at various solar depths using the expected lensing signatures of three known pulsars as they pass behind the Sun. The solid black line depicts the expected solar density as a function of solar radius (measured here as the angular position on the face of the Sun relative to its center). In the case where one attempts to measure six distinct densities with a very high signal-to-noise ratio of 106 over one year of observation (left plot), uncertainties can become fairly low close to or far away from the Sun’s center. To achieve similar uncertainties across 10 annuli, a comparative signal-to-noise ratio of 107 is necessary. [Takahashi et al. 2023]
Prospects for Gravitational Wave Vision
In recent years, combining gravitational waves with gravitational lensing has been proposed as a way to learn all sorts of new things about our universe, from constraints on the Hubble constant to independent measurements of the masses of distant stars. While it may take many more years for this sort of analysis to mature to a point where it can give us useful information about the Sun’s density profile, the fact that it may be possible at all is remarkable. For many decades the detection of gravitational waves was thought to be impossible. Now, not only are we detecting them with regularity, but we are finding all sorts of new ways to learn about our universe with each passing day — and that’s something to be excited about, even if you won’t be seeing gravitational wave vision goggles in stores anytime soon!
Original astrobite edited by Jessie Thwaites.
About the author, Lucas Brown:
I’m a current master’s student at Tufts University interested in cosmology, relativity, and gravitational physics. I am currently doing research on the stochastic gravitational wave background and pulsar timing arrays. Outside of physics I love playing piano, climbing, and spending time with my dog.
The post Forget X-ray Vision: Using Gravitational Waves to Peer Inside the Sun appeared first on AAS Nova.
]]>
Can impact-tilted dark matter halos explain why so many spiral galaxies have warped disks?
The post Dark Halos and Warped Disks appeared first on AAS Nova.
]]>Galaxies are embedded within halos of dark matter, the invisible matter thought to make up 85% of the mass of our universe. New research investigates how a tilt in a galaxy’s dark matter halo can affect its stellar halo and stellar disk.
Nestled in a Halo of Dark Matter

Illustration of the components of the Milky Way’s halo. [NASA, ESA, and and A. Feild (STScI)]
While the goings-on in our galaxy’s dark matter halo might seem far removed from life in the thin stellar disk, research by Jiwon Jesse Han (Center for Astrophysics | Harvard & Smithsonian) and collaborators has explored the connection between the two. In a recent article, Han’s team examined the alignment between galaxies’ stellar disks and the inner regions of their dark matter halos and probed what it might mean if the two are misaligned.
Tilting Halos with Ancient Mergers
Using the TNG50 cosmological simulation — part of the IllustrisTNG suite of cosmological simulations — Han’s team selected synthetic galaxies that are similar to the Milky Way and our neighboring galaxy, Andromeda. The simulated galaxies have masses similar to the Milky Way’s present-day mass, a disk-like appearance, and don’t have any other massive galaxies within 500 kiloparsecs (1.6 million light-years).

Dark halo tilt angle versus stellar halo tilt angle, derived from Milky Way–like galaxies in the TNG50 simulation. The measured Milky Way stellar halo tilt is marked with the pink shaded area. The plot to the right shows the most likely tilt angle for the Milky Way’s dark halo. Click to enlarge. [Han et al. 2023]
The Milky Way’s stellar halo is currently tilted relative to its stellar disk at an angle of about 20–30 degrees. Given the parallel behavior of dark halos and stellar halos, this implies that the Milky Way’s inner dark halo is tilted relative to its stellar disk at about 20 degrees. What effect does a tilted dark halo have?
Warped Disks and the Milky Way

Dark halo tilt angle and disk warp amplitude as a function of time for a simulated Milky Way–like galaxy. [Han et al. 2023]
The effects of the tilted dark matter halo were felt in the thin stellar disk, as well: a few billion years post merger, a warp appeared in the previously flat disk. This warp lessened slightly over time but persisted until the present day in the simulation.
Like the simulated galaxy studied here, the Milky Way experienced a merger billions of years ago and today sports a warped disk. Based on the results of the simulation, Han’s team proposed that halo-tilting mergers induce the long-lasting warps in galactic disks seen in more than half of all spiral galaxies today.
Citation
“Tilted Dark Halos Are Common and Long-Lived, and Can Warp Galactic Disks,” Jiwon Jesse Han et al 2023 ApJL 957 L24. doi:10.3847/2041-8213/ad0641
The post Dark Halos and Warped Disks appeared first on AAS Nova.
]]>
A recently discovered exoplanet required immense patience to uncover, both from an international team of astronomers and from a plucky suitcase-sized satellite.
The post Patience Rewarded with a Planet appeared first on AAS Nova.
]]>Astronomers have collectively cataloged more than 5,000 planets beyond our Sun, a feat borne from the immense efforts of thousands of scientists. However, not all of these discoveries required the same amount of perseverance: while some planets neatly fell out of abundant high-quality data, other worlds required intensive analysis and years of additional study to earn their places in our archives. A recently discovered planet named TOI-2010 b falls firmly into the latter of these categories.
TESS and the Struggles of Single-Transit Planets
The majority of exoplanets discovered so far were initially flagged by space-based telescopes looking for the repeating dips in starlight caused by circling, intermittently photobombing planets. One of the most productive of these telescopes is NASA’s Transiting Exoplanet Survey Satellite, or TESS, which stares are one chunk of the sky for about a month before moving on to observe a new patch. This is a productive strategy that has netted thousands of exoplanet candidates across the whole sky, but it also lets some planets fall through the cracks. Astronomers need to observe more than one transit of a planet to nail down its period, and many of the most interesting cold planets take longer than a month to complete a lap around their star. Often, TESS catches only one transit of these worlds before it proceeds to the next area of the sky, leaving astronomers in a maddening predicament: they know an interesting planet is there, but they have no idea when it will transit again.
A number of astronomers have taken up the challenge of chasing down these “single-transit” planets, and recently a team led by Christopher Mann (University of Montréal) achieved a significant victory: the discovery and characterization of a Jupiter-like planet with a 141-day period.
Introducing: TOI-2010 b

Left: The first recorded transit of TOI-2010 b as seen by TESS. Right: Another TESS transit, caught after NEOSat refined the orbital period and late into the team’s analysis. Click to enlarge. [Mann et al. 2023]
Enter the Near-Earth Object Surveillance Satellite (NEOSat), a suitcase-sized telescope launched and operated by the Canadian Space Agency and the Department of National Defence/Defence Research and Development Canada. In December of 2021, this satellite aimed its 15-cm telescope at TOI-2010 and didn’t look away for six straight days. It caught another transit of TOI-2010 b right near the middle of the predicted window, and in doing so ended the years of initial characterization. Astronomers finally had all of the parameters they needed to follow up the planet sometime in the future.

The radial velocity measurements of TOI-2010, which reveal the tell-tale pattern of a circling planet. Click to enlarge. [Mann et al. 2023]
Citation
“Giant Outer Transiting Exoplanet Mass (GOT ‘EM) Survey. III. Recovery and Confirmation of a Temperate, Mildly Eccentric, Single-transit Jupiter Orbiting TOI-2010,” Christopher R. Mann et al 2023 AJ 166 239. doi:10.3847/1538-3881/ad00bc
The post Patience Rewarded with a Planet appeared first on AAS Nova.
]]>
Researchers have taken another look at a peculiar brown dwarf, highlighting the challenges of studying these cool, cloudy objects.
The post Investigation of a Nearby, Cold, and Young Brown Dwarf appeared first on AAS Nova.
]]>Somewhere in between stars, which sustain hydrogen fusion in their cores, and giant gaseous planets, which do not, lies an intermediate class of cool, cloudy objects called brown dwarfs. A new look at a nearby brown dwarf shows how challenging it can be to classify these objects.
Neither Star nor Planet

The green object at the center of this image is the first ultra-cool brown dwarf discovered by NASA’s Wide-field Infrared Survey Explorer. [NASA/JPL-Caltech/UCLA]
Finding and classifying Y-type brown dwarfs has its own challenges, though. Part of the challenge comes from the fact that even objects assigned the same spectral type show significant differences. To understand whether these variations are due to metallicity, formation mechanism, or other factors, researchers must amass a sample of these hard-to-find objects.
Under Spectral Scrutiny
Enter CWISE J105512.11+544328.3, or W1055+5443 for short. Researchers initially assigned this object a spectral class of T8 — slightly more massive and warmer than a Y-type brown dwarf — but an updated distance measurement placed it closer to Earth, implying a lower luminosity and nudging its spectral type down to Y0. To confirm this spectral-type assignment and learn more about this nearby brown dwarf, Grady Robbins (University of Florida) and collaborators analyzed archival photometry from the Spitzer Space Telescope and collected new spectra using the Keck II telescope.

W1055+5443 (blue star) compared to other brown dwarfs for which Spitzer data exist. [Robbins et al. 2023]
Unusual Properties
As brown dwarfs age, they cool and contract. This means that brown dwarfs that are young tend to have earlier spectral types (M and L) and lower surface gravity, and brown dwarfs that are old tend to have later spectral types (T and Y) and higher surface gravity. Based on its spectral type, W1055+5443 should be an old brown dwarf with high surface gravity, but modeling suggests that its surface gravity is low — is this object unexpectedly young?

Near-infrared spectrum of W1055+5443 from the Keck II telescope. [Robbins et al. 2023]
The authors note that these estimates are preliminary and await further investigation. Spectroscopy from JWST would allow researchers to pin down whether the object belongs to the Crius 197 moving group, determine its metallicity, and investigate its unusual spectral features, and longer-wavelength photometry would provide an accurate estimate of its temperature.
Citation
“CWISE J105512.11+544328.3: A Nearby Y Dwarf Spectroscopically Confirmed with Keck/NIRES,” Grady Robbins et al 2023 ApJ 958 94. doi:10.3847/1538-4357/ad0043
The post Investigation of a Nearby, Cold, and Young Brown Dwarf appeared first on AAS Nova.
]]>
Astrobites reports on the assumptions used in photoionization models that affect our understanding of ionized gas clouds surrounding hot stars.
The post Let’s Be Real: A Call for Physically Realistic Assumptions appeared first on AAS Nova.
]]>Editor’s Note: Astrobites is a graduate-student-run organization that digests astrophysical literature for undergraduate students. As part of the partnership between the AAS and astrobites, we occasionally repost astrobites content here at AAS Nova. We hope you enjoy this post from astrobites; the original can be viewed at astrobites.org.
Title: Spatially-Resolved Temperature and Density Structures of Nearby HII Regions
Authors: Yifei Jin et al.
First Author’s Institution: Australian National University
Status: Published in ApJ
Despite playing a fundamental role in shaping the emission-line spectra of HII regions, the assumptions about electron temperature and density that are used in most photoionization codes are oversimplified and quite far from reality. In today’s article, the authors analyzed the detailed electron temperature and density structures of four HII regions to show — spoiler alert! — that the prevailing assumptions are not physically realistic.
For Real
Photoionization, a key process in astrophysics, is the physical mechanism that converts electrically neutral atoms (or molecules) into ions through interactions with energetic photons. This phenomenon plays a crucial role in determining the characteristics of HII regions, where intense ultraviolet photons from massive stars lead to the ionization of the surrounding hydrogen gas.
Much of our knowledge about objects in the universe comes from spectroscopy (here is Astrobites’s Guide to Spectroscopy and Spectral Lines). The spectra of HII regions are dominated by emission lines that trace the characteristics of the emitting gas. Among the physical quantities influencing the emission-line spectra of HII regions are the electron temperature and density. These parameters serve as crucial diagnostics for determining the metallicities of the interstellar medium.
Reality Check
Figure 1: Diagram illustrating an idealized or simplified spherical HII region. [AAS Nova/Kerry Hensley]
- the nature of the central star
- the physical conditions of the ionized nebula
- the chemical abundances that characterize the nebula
Photoionization codes tend to underestimate the complexity of the internal nebular structures of HII regions by assuming an isothermal condition (constant temperature) or a uniform electron density distribution across the extent of these regions. Additionally, in most models, the nebular geometry is assumed to be spherically symmetric, a simplification that often does not align with the real objects — as is evident if you compare the HII-region diagram in Figure 1 with the images from observations of the four HII regions studied in the article in Figure 2!
What’s Real vs. The Models
The authors of today’s article utilized integral field unit data from the Wide-Field Spectrograph (WiFeS) on the Australian National University 2.3-meter telescope to analyze the detailed temperature and density structures of four HII regions in the Magellanic Clouds (Figure 2). Integral field unit instruments enable simultaneous imaging and spectroscopy observations, generating a spatially resolved data product called a data cube that contains spectral information at each spatial pixel (spaxel). This article represents the first investigation into the nebular internal structures with a sample of extragalactic HII regions using integral field unit data with a high spatial resolution.
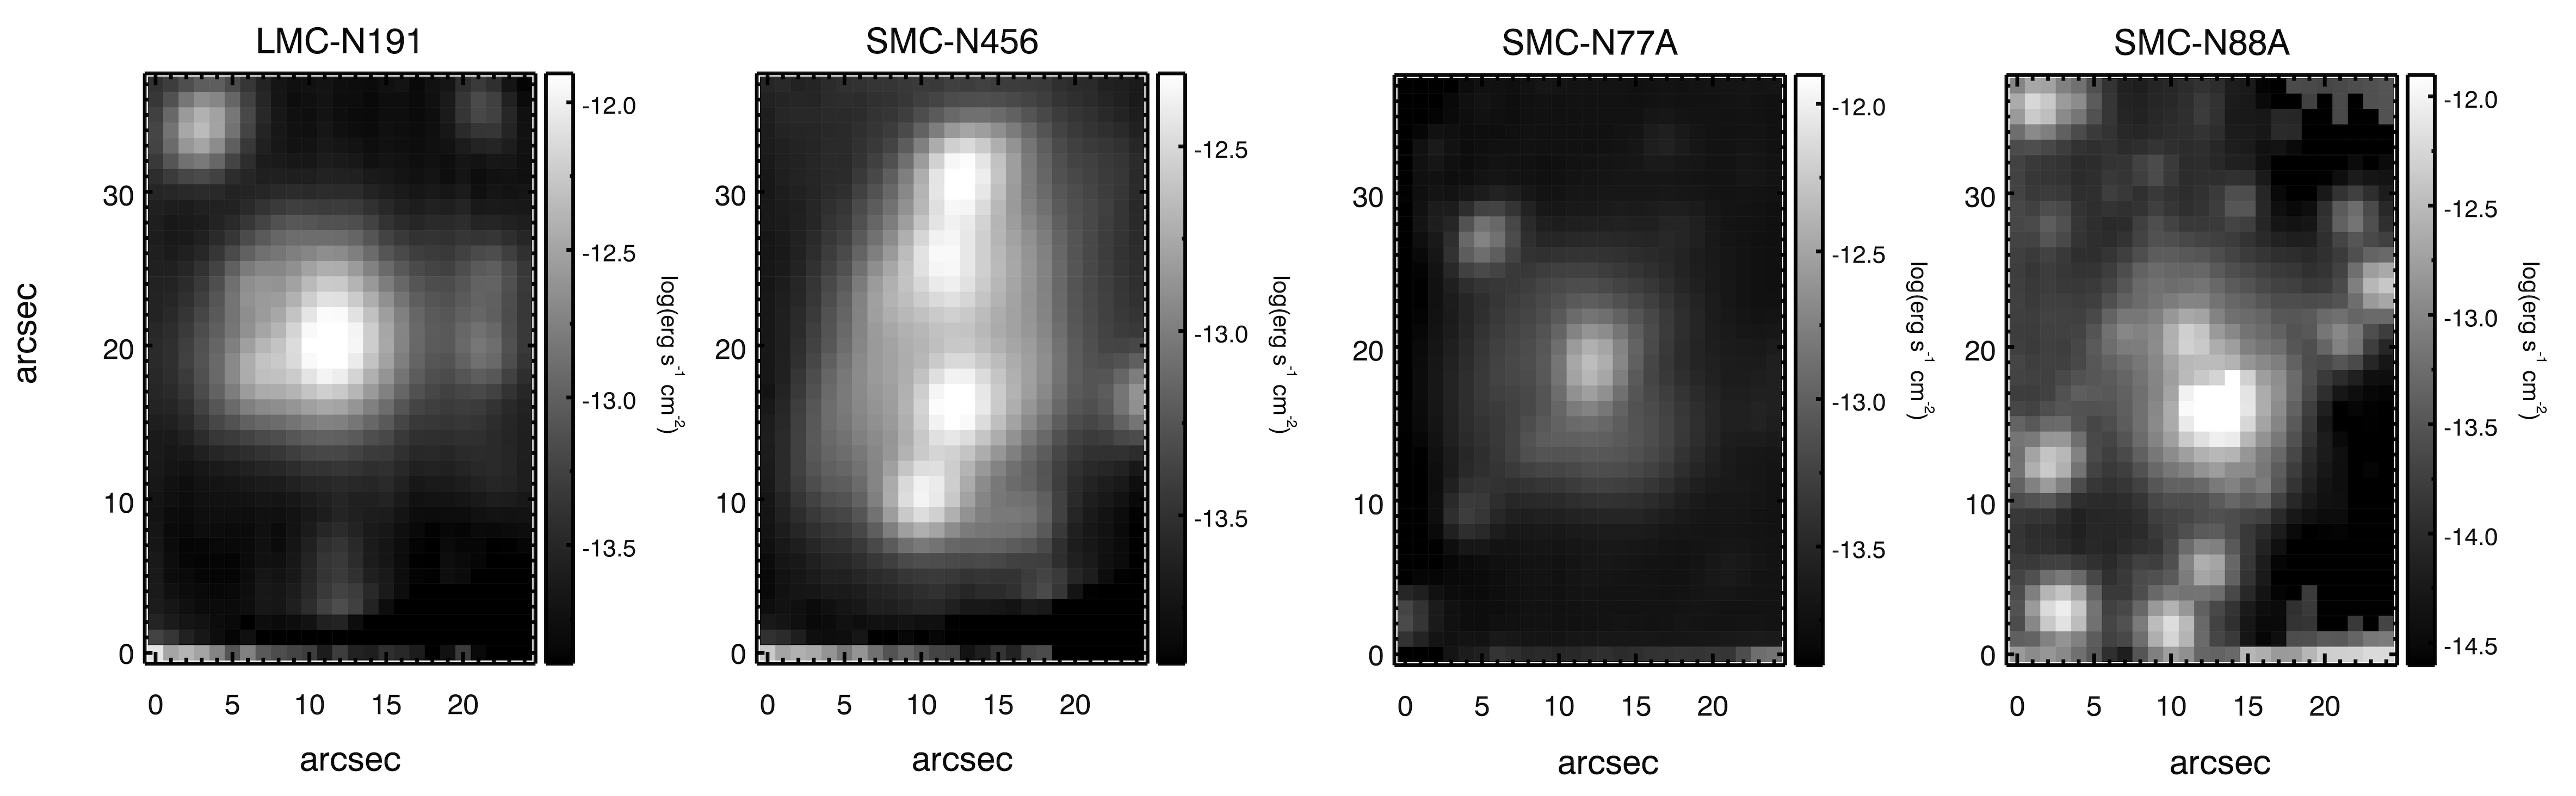
Figure 2: Integrated-flux (in erg s-1 cm-2) images of the four HII regions with relative positions (in arcseconds), showcasing the different nebular morphologies. [Adapted from Jin et al. 2023]
Figure 3 compares the radial profiles of the temperature- and density-sensitive line ratios between the observed and modeled values derived from the best-fit models (those with minimal χ2 values) for all four HII regions. The models predict that the density-sensitive [O II] and [S II] line ratios increase (top row) and remain flat (bottom row), respectively, with the distance from the center of the nebula. On the other hand, the observational data show a decreasing trend for [O II] line ratios, while [S II] ratios increase. Meanwhile, the observed radial profiles of the temperature-sensitive [O III] line ratios are flat (middle row) for all four regions, but the models predict decreasing profiles. These discrepancies suggest that none of the simple HII-region models is able to reproduce the observed electron temperature and density structures.
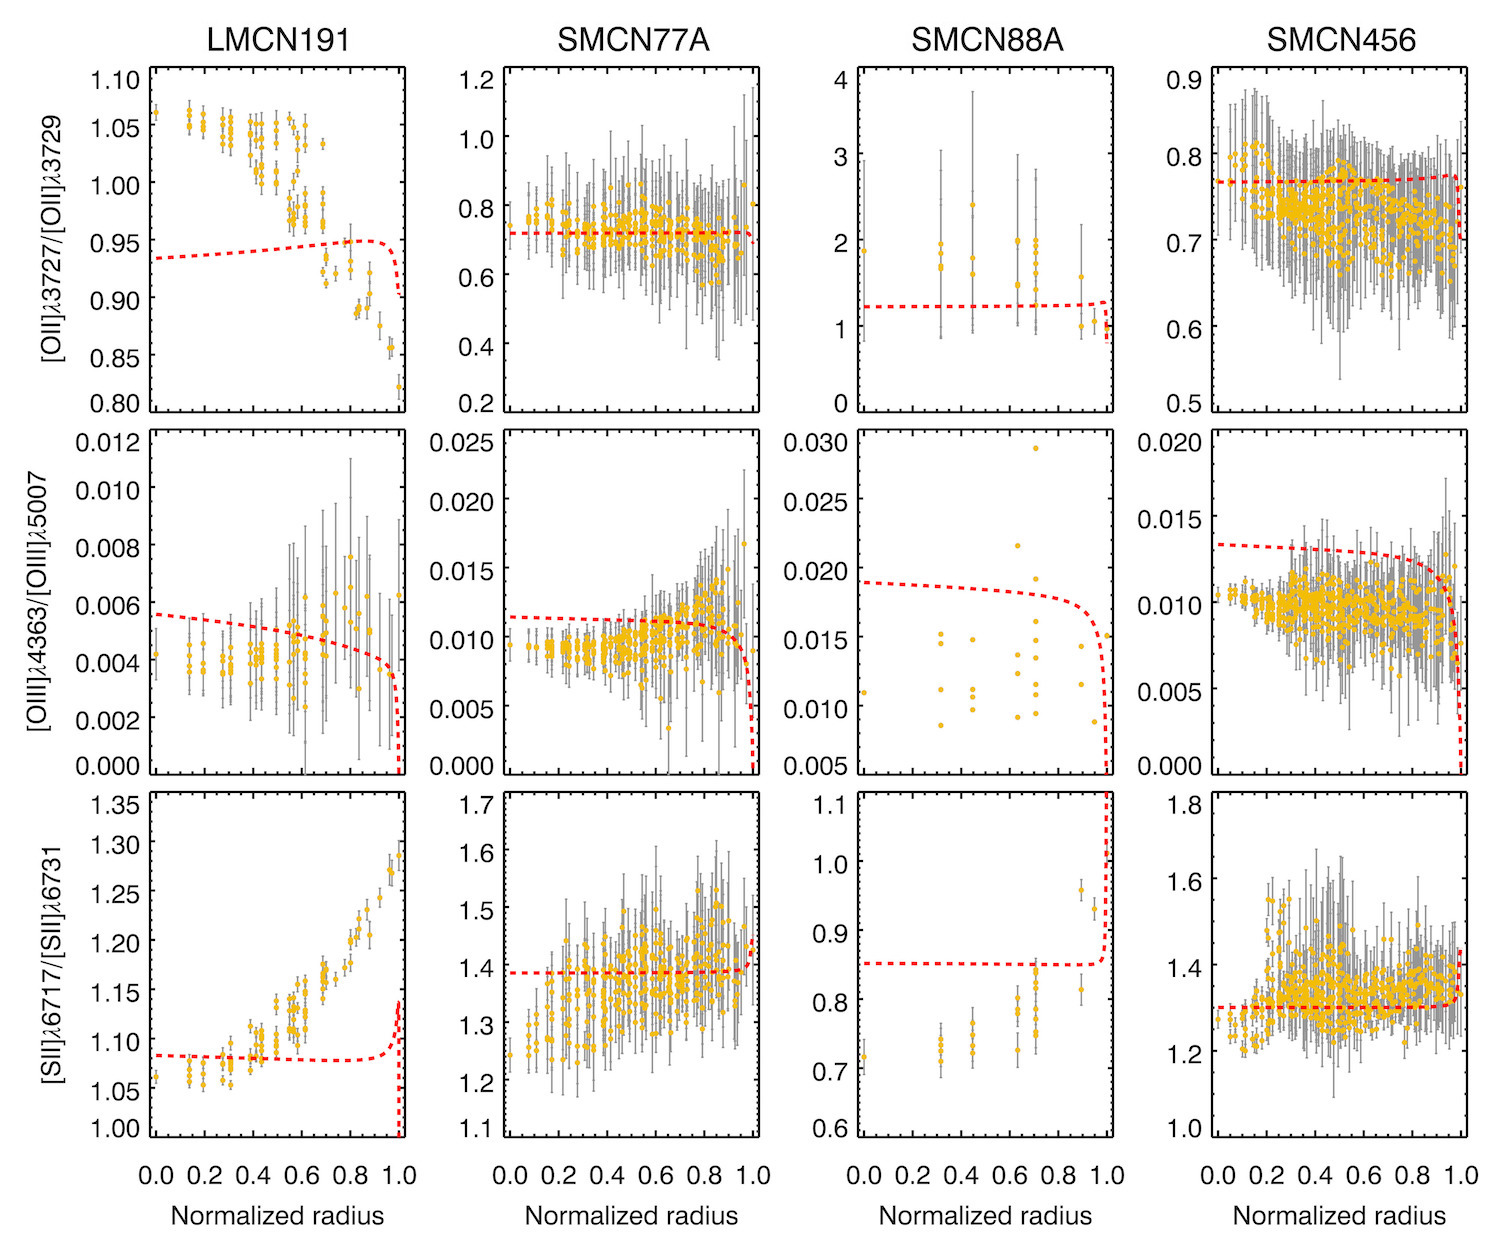
Figure 3: The [O II], [O III], and [S II] line ratios as functions of normalized radius of the nebula with 0.0 being the center of the nebula. The yellow points represent the values from the observational data and the red dashed lines show the modeled radial distribution. [Adapted from Jin et al. 2023]
Let’s Be Real
Real HII regions exhibit notable radial variations in electron temperatures and densities, challenging the isothermal and/or constant density assumptions in photoionization codes. Codes like MAPPINGS V require assumptions about the shape of HII regions as input. Today’s authors have demonstrated in their article the pressing need to model realistic HII regions for accurate nebula modeling, emphasizing the importance of considering the arbitrary geometries inherent in these regions. As our understanding advances, the demand for a more realistic modeling approach grows. Ongoing developments in three-dimensional photoionization codes with Monte Carlo radiative transfer techniques (for more reading about the basic principle of this technique, this page is a good start) hold the promise of a new era in astrophysical simulations, providing a more physically realistic portrayal of these fascinating objects!
Original astrobite edited by Roel Lefever.
About the author, Janette Suherli:
Janette is a PhD student at University of Manitoba in Winnipeg (Winterpeg!), Canada. Her research focuses on the utilization of integral field spectroscopy for the studies of supernova remnants and their compact objects in the optical. She grew up in Indonesia where it is summer all year round! Before pursuing her PhD in astrophysics, Janette worked as a data analyst for a big Indonesian tech company, combating credit card fraud.
The post Let’s Be Real: A Call for Physically Realistic Assumptions appeared first on AAS Nova.
]]>
A new catalog of solar flares aims to understand why some flares are accompanied by massive explosions of plasma and others are not.
The post Featured Image: Solar Flares in Focus appeared first on AAS Nova.
]]>Solar flares, like the one photographed by the Solar Dynamics Observatory and shown above, are flashes of solar radiation powered by magnetic reconnection. Many solar flares are accompanied by immense eruptions of magnetized plasma called coronal mass ejections. In a recent research article, Maria Kazachenko (University of Colorado Boulder and National Solar Observatory) explored why some solar flares, called eruptive flares, come with a coronal mass ejection, while others, called confined flares, do not. Kazachenko analyzed 480 solar flares, from middle-of-the-pack C-class flares to the most energetic X-class flares, cataloging the thermodynamic and magnetic properties of each flare and noting whether it was eruptive or confined. Confined flares tend to arise from active regions — areas of the solar surface with strong magnetic fields — that are larger and more strongly magnetic, and a smaller fraction of the active region’s magnetic field undergoes magnetic reconnection during a confined flare. For the first time, Kazachenko showed that magnetic reconnection happens more rapidly in confined flares than eruptive flares. To learn more about the properties of confined and eruptive flares, be sure to check out the full research article linked below
Citation
“A Database of Magnetic and Thermodynamic Properties of Confined and Eruptive Solar Flares,” Maria D. Kazachenko 2023 ApJ 958 104. doi:10.3847/1538-4357/ad004e
The post Featured Image: Solar Flares in Focus appeared first on AAS Nova.
]]>
How precise will our measurements of neutron star sizes be when future gravitational wave observatories come online?
The post Sizing Up Neutron Stars with Gravitational Waves appeared first on AAS Nova.
]]>Gravitational waves from colliding neutron stars have improved our understanding of the interiors of these fantastically compressed objects and helped us measure their radii. How much more precisely will we be able to measure neutron stars with future gravitational wave observatories?
Measuring a Neutron Star

This image from the Hubble Space Telescope shows a neutron star. It was estimated to be no more than 28 kilometers (16.8 miles) across and have a temperature of 1,200,000℉ (670,000℃). [Fred Walter (State University of New York at Stony Brook) and NASA/ESA; CC BY 4.0]
Already, observations of gravitational waves from colliding neutron stars have helped us hone our estimates of the neutron star equation of state. A 1.4-solar-mass neutron star — around the lower limit of a neutron star’s mass — will have a radius between 10.5 and 13 kilometers. Researchers suspect that future gravitational wave observations will narrow this range further, and new work explores how precisely we’ll be able to measure neutron stars in the future.
Computing Collisions
To probe this question, Daniel Finstad (University of Washington; University of California, Berkeley; Lawrence Berkeley National Laboratory) and collaborators Laurel White and Duncan Brown (both Syracuse University) simulated the gravitational waves produced by many pairs of colliding neutron stars.

Soft, medium, and stiff equations of state (blue, orange, and green lines, respectively), as well as the full set of equations of state used in the analysis. [Finstad et al. 2023]
Upcoming Observations
With a suite of simulations in hand, Finstad’s team modeled what future gravitational wave observatories would detect if faced with these synthetic signals. They considered future upgrades to the Laser Interferometer Gravitational-Wave Observatory (LIGO) and Virgo detectors that would bring them up to their maximum sensitivity as well as the proposed Cosmic Explorer, which would have arms 10 times as long as LIGO’s and therefore be more sensitive.

Number of years needed for LIGO–Virgo to observe enough mergers to measure the neutron star equation of state to a precision of 2%. Results are shown for stiff, medium, and soft equations of state (green, orange, and blue, respectively), as well as for different values for the neutron star merger rate, shown with the timescales at the top. [Finstad et al. 2023]
Citation
“Prospects for a Precise Equation of State Measurement from Advanced LIGO and Cosmic Explorer,” Daniel Finstad et al 2023 ApJ 955 45. doi:10.3847/1538-4357/acf12f
The post Sizing Up Neutron Stars with Gravitational Waves appeared first on AAS Nova.
]]>
Five articles provide perspectives on the TRAPPIST-1 planetary system, from JWST's first search for the innermost planets' atmospheres to the prospect of detecting life, should it exist.
The post Monthly Roundup: TRAPPIST-1 Through the Eyes of JWST appeared first on AAS Nova.
]]>Editor’s Note: Welcome to the first post of the new Monthly Roundup series! Each month, we’ll be providing a broader view of one astronomical topic by exploring it through the lens of 3-5 recent research articles.

The closely spaced rocky planets of the TRAPPIST-1 system inspired scientists and non-scientists alike. [NASA/JPL]
The large number of Earth-like and potentially habitable planets, all orbiting their host star with periods of less than three weeks, and at “only” 41 light-years from Earth, make the TRAPPIST-1 system a prime target for atmospheric characterization. Now, JWST has turned its gigantic golden eye toward this promising system, giving researchers new data to scrutinize and new challenges to overcome.
Through (Atmospheres) Thick and Thin
First up, the innermost of the TRAPPIST-1 planets. Previous observations show that none of the planets have clear (i.e., cloudless) atmospheres made of hydrogen, but we’ve yet to rule out other atmospheres, including those rich in familiar gases like carbon dioxide (CO2), nitrogen, or oxygen.
Jegug Ih (University of Maryland) and collaborators attempted to place constraints on the presence of an atmosphere enveloping TRAPPIST-1 b by analyzing observations taken at 15 microns (1 micron = 10-6 meter) as the planet ducked behind the star. The team modeled these secondary eclipse observations (the primary eclipse happens when the planet passes in front of the star) to extract information about the planet’s atmosphere.

Eclipse spectra of atmospheric models of TRAPPIST-1 b consistent with the JWST observations to within one sigma. Click to enlarge. [Adapted from Ih et al. 2023]
Considering instead the possibility that TRAPPIST-1 b has no atmosphere, Ih and collaborators used the JWST observations to constrain the composition of the planet’s surface. Bare rock is most likely, containing metals and volcanic rocks. Expect to hear more about this planet’s atmosphere and surface soon: additional secondary eclipse observations were performed at a slightly shorter wavelength of 12.8 microns in July 2023.
Stellar Interference

Two transit observations (panels a and b) with best-fit stellar contamination models (black lines). Atmospheric modeling of contamination-corrected data (panels c and d). Click to enlarge. [Lim et al. 2023]
To extract information about the planet’s atmosphere from these contaminated spectra, Lim and coauthors used model fitting to account for the starspots and faculae before modeling the planet’s atmospheric spectrum. Using this method, the team could rule out hydrogen-rich, cloudless atmospheres, but they couldn’t draw any conclusions about other atmospheric compositions. The authors noted how important this issue will be going forward, and they called for more observations and better modeling of the surfaces of cool stars, emphasizing one of the tenets of exoplanet science: Know thy star, know thy planet.
Reconsidering TRAPPIST-1 c
Moving farther out from the star, a team led by Andrew Lincowski (University of Washington) analyzed JWST secondary eclipse observations of TRAPPIST-1 c. Previous analysis of these observations suggested that the planet lacks an atmosphere or has a thin atmosphere mainly containing oxygen. Using atmospheric models, Lincowski and collaborators explored a wider range of atmospheric compositions than previous work. Their possible atmospheres included a steam atmosphere, created by water loss from the hot planet — its equilibrium temperature is nearly 400K (260℉ or 127℃) — and a Venus-like CO2 atmosphere that might arise after all the water is lost.

Modeled spectra (lines) and eclipse depths (circles) at 15 microns compared to the observed eclipse depth (black circle). Click to enlarge. [Lincowski et al. 2023]
As the Inner Planets, So Too the Outer Planets?
Although detailed modeling has found pockets of parameter space in which atmospheres on the two innermost planets of the TRAPPIST-1 system are possible, we still can’t rule out the possibility that these planets have no atmospheres. If TRAPPIST-1 b and c are bare rocks, does that mean the other five planets in the system lack atmospheres, too? Answering this question requires understanding what happened before TRAPPIST-1 settled onto the main sequence, when the star pummeled its planets with atmosphere-eroding high-energy radiation. Joshua Krissansen-Totton (University of Washington) modeled the evolution of the atmospheres and interiors of TRAPPIST-1 b and c to understand which properties, including the amount of high-energy radiation from their host star, result in the two planets being airless. These properties are then applied to other planets in the system to see if they could hang onto their atmospheres until today.

The probability of TRAPPIST-1 e (top) and f (bottom) having atmospheres is largely unaffected by the inner planets being airless. [Krissansen-Totton 2023]
Life May Find a Way — but Do We Have a Way to Find It?
A pressing, million-dollar question: If one or more planets in the TRAPPIST-1 system were to host life, would JWST even be able to detect it? Victoria Meadows (University of Washington) and collaborators explored that question, using photochemical models to determine whether JWST is sensitive enough to detect the spectral signatures of molecules that indicate the presence of life, called biosignatures.
Meadows’s team modeled spectra of TRAPPIST-1 d and e, both of which may lie within the star’s narrow habitable zone. They investigated two atmospheric compositions: one resembling modern-day Earth and one similar to Earth during the Archean Eon — an ancient period during which Earth’s atmosphere was rich in methane and poor in oxygen.

Example of a simulated transmission spectrum and data. Click to enlarge. [Meadows et al. 2023]
Citation
“Constraining the Thickness of TRAPPIST-1 b’s Atmosphere from Its JWST Secondary Eclipse Observation at 15 μm,” Jegug Ih et al 2023 ApJL 952 L4. doi:10.3847/2041-8213/ace03b
“Atmospheric Reconnaissance of TRAPPIST-1 b with JWST/NIRISS: Evidence for Strong Stellar Contamination in the Transmission Spectra,” Olivia Lim et al 2023 ApJL 955 L22. doi:10.3847/2041-8213/acf7c4
“Potential Atmospheric Compositions of TRAPPIST-1 c Constrained by JWST/MIRI Observations at 15 μm,” Andrew P. Lincowski et al 2023 ApJL 955 L7. doi:10.3847/2041-8213/acee02
“Implications of Atmospheric Nondetections for Trappist-1 Inner Planets on Atmospheric Retention Prospects for Outer Planets,” Joshua Krissansen-Totton 2023 ApJL 951 L39. doi:10.3847/2041-8213/acdc26
“The Feasibility of Detecting Biosignatures in the TRAPPIST-1 Planetary System with JWST,” Victoria S. Meadows et al 2023 Planet. Sci. J. 4 192. doi:10.3847/PSJ/acf488
The post Monthly Roundup: TRAPPIST-1 Through the Eyes of JWST appeared first on AAS Nova.
]]>
With the help of citizen scientists, astronomers have uncovered evidence that three previously observed sources are actually rare brown dwarf binaries.
The post Two-for-One, Three Times: New Candidate Brown Dwarf Binaries appeared first on AAS Nova.
]]>In astronomy, seeing isn’t always believing, and extra checks are required to make sure we don’t fool ourselves into oversimplifying nature. With the help of citizen scientists, a team of astronomers recently illustrated the value of such thoroughness and demonstrated that three previously observed fuzzy blobs may actually be rare, close-in pairs of brown dwarfs.
Point Sources Confusion

A comparison of the size of planets, brown dwarfs, and stars. Click to enlarge. [NASA/JPL-Caltech]
This means that what looks like one small, fuzzy blob can actually be two stars packed tightly together, both so far away from Earth that their images are blurred together into one. In rare but exciting cases, these blobs don’t correspond to stars at all, and instead are actually images of one or more brown dwarfs. These objects have masses that fall between stars and planets, and a more complete understanding of their formation would enable better models of both their bigger and smaller cousins. Binaries, or pairs of these objects orbiting each other, are especially useful since long-term radial velocity studies can reveal the masses of each constituent. Astronomers know of only a handful of brown dwarf binaries, so each discovery of a new pair, or even evidence that a given blob might be a pair, is cause for excitement.
WISE Citizens

The WISE telescope prior to its launch in 2009 from Vandenberg Air Force Base, California. WISE was placed in hibernation in 2011 but reawakened in 2013 to hunt for near-earth objects. [NASA/JPL-Caltech]
Bravo and collaborators used the in Chile to collect the spectrum of each target, then compared these to spectra of previously confirmed brown dwarfs. In a happy surprise, none of the “templates” fit their new data very well. These objects were strange: at some wavelengths, they looked like a certain type of large brown dwarf, while at others, they looked like a much smaller and cooler variant.

Data and best-fitting models for one of the three candidates. The top panel shows the data (black) and best-fitting model (red) assuming the spectrum is composed of only one brown dwarf. The bottom panel shows how the same data are better matched by a model that allows for a pair of objects. Click to enlarge. [Adapted from Bravo et al. 2023]
Citation
“An Investigation of New Brown Dwarf Spectral Binary Candidates From the Backyard Worlds: Planet 9 Citizen Science Initiative,” Alexia Bravo et al 2023 AJ 166 226. doi:10.3847/1538-3881/acffc1
The post Two-for-One, Three Times: New Candidate Brown Dwarf Binaries appeared first on AAS Nova.
]]>
Tidal stripping may explain why a tiny galaxy hosts a black hole nearly as massive as the Milky Way's central supermassive black hole.
The post An Explanation for the Overmassive Black Hole in the Dwarf Galaxy Leo I appeared first on AAS Nova.
]]>Leo I is a distant dwarf galaxy that appears to host a supermassive black hole 100 times more massive than expected for a galaxy of its size. Could tidal stripping explain this galaxy’s black hole–stellar mass mismatch?
An Anomalously Large Black Hole

The dwarf galaxy Leo I. [Sloan Digital Sky Survey; CC BY 4.0]
Leo I is remarkable not just because it’s the Milky Way’s most distant satellite, but also because this 80-million-solar-mass galaxy appears to harbor a 3-million-solar-mass black hole — a black hole nearly as massive as the Milky Way’s central supermassive black hole but in a galaxy more than 10,000 times less massive. To explain this discrepancy, researchers have proposed that Leo I was once a much larger galaxy that has had its stars stolen by passing too close to the Milky Way.
Simulating Stellar Stripping
Fabio Pacucci (Center for Astrophysics | Harvard & Smithsonian; Black Hole Initiative) and collaborators used analytical and dynamical models to explore how Leo I’s past journeys close to the Milky Way might have robbed the smaller galaxy of its stars. Using a simple analytical model, the team estimated that Leo I could have lost 32–57% of its stars after one close passage, though losses up to 78% are possible based on precise observations by the star-mapping Gaia spacecraft.

Stellar mass (top panel) and distance between Leo I and the Milky Way (bottom panel) over time. [Pacucci et al. 2023]
Possible, but Probable?
Pacucci’s team notes that this scenario, though possible, may be unlikely for two reasons. First, it requires Leo I to pass very close to the Milky Way on two occasions, at the limit of what is permitted by Gaia observations. Second, Leo I’s metal content — the abundance of elements heavier than helium — matches what we’d expect for a galaxy of its size; a galaxy that used to be more massive should be more metal rich.

Modeled locations of Leo I’s stars today (green circles) and black hole over the past 8 billion years (purple line). You can see an animation of this figure here. [Adapted from Pacucci et al. 2023]
In-depth statistical modeling delving into the likelihood of this scenario awaits future work, and observations may yet dredge up evidence of Leo I’s stellar streams. If future work supports the team’s hypothesis, another possibility waits in the wings: that Leo I will someday relinquish all of its stars to the Milky Way and become a wandering black hole.
Citation
“Extreme Tidal Stripping May Explain the Overmassive Black Hole in Leo I: A Proof of Concept,” Fabio Pacucci et al 2023 ApJL 956 L37. doi:10.3847/2041-8213/acff5e
The post An Explanation for the Overmassive Black Hole in the Dwarf Galaxy Leo I appeared first on AAS Nova.
]]>
Could supernova shocks be the source of charged particles accelerated up to quadrillions of electronvolts?
The post Setting the Speed Limit for Shock-Accelerated Cosmic Rays appeared first on AAS Nova.
]]>Across the universe, charged particles are accelerated to nearly the speed of light, attaining energies of quadrillions of electronvolts or more. Within the Milky Way, supernovae have long been considered a likely source of these mind-bogglingly fast particles, called cosmic rays, but new research suggests that supernovae can only accelerate particles up to such high energies for a brief time.
Searching for Galactic PeVatrons
Sources of cosmic rays in the petaelectronvolt (PeV) range — that’s one quadrillion electronvolts, or the energy of a proton traveling at more than 99.9999999999% of the speed of light — are called PeVatrons. The hunt for PeVatrons in the Milky Way has closed in on supernovae, whose expanding shocks provide a way to accelerate particles up to high velocities. But whether supernova shocks can actually accelerate particles up to PeV energies is up for debate. Answering this question is key to understanding where particle acceleration happens in our universe.
Shocks, in expanding supernova remnants or elsewhere, are thought to accelerate particles through a process called diffusive shock acceleration. In this process, charged particles bounce back and forth across a shock as it moves, reflected by fluctuations in the magnetic field. The particles gain energy with each bounce until they escape the shock and zoom away. In the case of supernovae, it’s not yet clear if the magnetic field strength is high enough to hold on to particles until they reach PeV energies.
Setting a Particle Speed Limit
Spectra of protons accelerated by a shock moving into uniform material (top row) and material with a wind-like distribution (bottom row). Results are shown for the cases of diffusing (left column) and escaping (right column) particles driving the increase in the magnetic field. Click to enlarge. [Diesing 2023]
Diesing’s modeling accounted for the complex interactions between the shock, the particles being accelerated, and the magnetic field. As particles are accelerated, they play a role in shaping the shock itself: the motion of charged particles as they diffuse back and forth across the shock and finally escape it changes the magnetic field, producing fluctuations that boost the magnetic field strength. The increase in the magnetic field strength should allow the shock to hold on to particles longer, accelerating them to higher energies — but is it enough to get particles up to the PeV range?

Predicted maximum energy of accelerated cosmic rays as a function of the supernova remnant’s age. 1 PeV = 106 GeV. Click to enlarge. [Diesing 2023]
Unlikely Accelerators
Diesing’s calculations show that supernova remnants can only produce particles at PeV energies when the shock velocity is higher than 10,000 km/s or when the material into which the shock expands is dense. These high velocities are attainable by young supernova remnants, but not by the supernova remnants we know of in our galaxy, all of which are centuries old.
This suggests that a small number of supernovae can act as PeVatrons for a short time. To complicate the search for PeVatrons in our galaxy, Diesing found that even supernovae that are no longer producing PeV-energy cosmic rays can still generate high-energy gamma rays, which are often taken as evidence of a PeVatron.
Citation
“The Maximum Energy of Shock-Accelerated Cosmic Rays,” Rebecca Diesing 2023 ApJ 958 3. doi:10.3847/1538-4357/ad00b1
The post Setting the Speed Limit for Shock-Accelerated Cosmic Rays appeared first on AAS Nova.
]]>
Astrobites reports on how to identify merging galaxies and investigate the importance of these collisions over cosmic time.
The post A Cosmic Game of LEGO appeared first on AAS Nova.
]]>Editor’s Note: Astrobites is a graduate-student-run organization that digests astrophysical literature for undergraduate students. As part of the partnership between the AAS and astrobites, we occasionally repost astrobites content here at AAS Nova. We hope you enjoy this post from astrobites; the original can be viewed at astrobites.org.
Title: Revisiting Galaxy Evolution in Morphology in the COSMOS field (COSMOS-ReGEM): I. Merging Galaxies
Authors: Jian Ren et al.
First Author’s Institution: Chinese Academy of Sciences
Status: Published in ApJ
Galaxies are a bit like LEGO. At least, if you simplify down one of the fundamental theories of Lambda-CDM cosmology, our current best model of the universe, what you could say is that all structures in the universe today formed from the merging of smaller structures, much like building up a LEGO masterpiece. So, to build a massive galaxy like our own Milky Way, you need to merge lots of smaller galaxies together first (e.g., see this bite). One day, our galaxy will collide with our nearest neighbour, the Andromeda Galaxy, to form an even more massive galaxy. If you wind back the clock of our universe, what this simple, fundamental idea predicts is that galaxy collisions were more frequent back in the early universe. However, this has been a difficult prediction to prove as it requires observations much deeper into the universe.
Whilst it might seem easy to identify these colossal collisions with nearby galaxies, this gets very difficult for more distant galaxies, i.e., galaxies in the early universe (since distant = higher redshift = longer lookback time). At these distances, we need better instruments and bigger telescopes to resolve enough detail and collect enough light to really identify these more distant and therefore fainter mergers. The authors of today’s article have used observations of the Cosmic Evolution Survey (COSMOS) field — an area of the sky that has been extensively observed by multiple cutting-edge telescopes — to identify merging galaxies and investigate their properties.
How to Spot a Merger
There are a variety of different methods to identify merging galaxies. If you have sufficient spatial resolution, meaning you can see the extent of a galaxy rather than just a point source, you often see the evidence just by eye. In the featured image above, you can see a beautiful example of a local merger. These are called the Mice Galaxies, or NGC 4676. This merger is close enough for us to see it in action — the two galactic nuclei are clearly distinguishable, and we can even see a bridge connecting the two, as well as bright tidal tails of stars and gas streaming away from the collision. The authors of today’s article identified similar features in the COSMOS field. Some examples of these features are shown in Figure 1. In total, they identified 3,594 galaxies out of 33,605 galaxies as mergers by visually inspecting the images and searching for these clues.
Figure 1: Examples of some merging galaxies visually identified in this article. Each square is a different pair of merging galaxies. Each pair is at a different redshift, z, and stellar mass. [Ren et al. 2023]
Sometimes, however, even this method is too difficult. Redshifts can be hard to obtain (e.g., see this bite) and sometimes distances are just too great to even resolve galaxy pairs. For this reason, today’s authors used their impressively huge sample of mergers, pairs, and non-interacting galaxies to investigate some alternative methods that could be useful for a higher-redshift sample. They find that two parameters in particular, M20 and A0, are especially good at identifying mergers. M20 is a measure of how the brightness is spread across a galaxy, and A0 measures the asymmetry of the outskirts of a galaxy. The images of merging galaxies typically have much higher M20 and A0 values than the images of non-merging galaxies. This makes some sense — merging galaxies should show much less structure and symmetry since these collisions are violent and chaotic.
Mergers Across Cosmic Time
Figure 2: How the merger fraction, which is calculated according to the visually identified mergers (blue points) and the number of pairs (black points), varies as a function of redshift, z. Estimates from other works are also shown. Click to enlarge. [Adapted from Ren et al. 2023]
Future efforts by the next generation of cutting-edge telescopes, as already begun by JWST, will help to extend this investigation to higher and higher redshifts. Seeing back earlier in time will paint a picture of galaxy mergers at the beginning of the universe, where the cosmic game of LEGO was likely even more intense and chaotic.
Original astrobite edited by Storm Colloms.
About the author, Lucie Rowland:
I’m a first-year PhD student at Leiden Observatory in the Netherlands, studying massive, star forming galaxies in the early universe with ALMA and JWST. It’s a really exciting time to be interested in astronomy, so I hope to make groundbreaking new research more accessible!
The post A Cosmic Game of LEGO appeared first on AAS Nova.
]]>
Researchers analyze solar images to understand how umbral oscillations travel upward and outward from sunspot centers.
The post Featured Image: Watching Waves in Sunspot Centers appeared first on AAS Nova.
]]>Sunspots are dark, relatively cool regions of the Sun where magnetic flux pokes through the Sun’s surface. Sunspots have a two-toned appearance consisting of one or more dark regions, or umbrae (from Latin for “shade”), surrounded by a slightly lighter region called a penumbra. Over the past several decades, scientists have observed oscillations in sunspot umbrae with periods of 3 and 5 minutes. The causes of these oscillations aren’t yet known, though researchers generally agree that their source lies deeper in the Sun’s interior. To learn more about umbral oscillations, a team led by Wei Wu (Chinese Academy of Sciences and University of Chinese Academy of Sciences) analyzed images of sunspots, including the sunspot with four umbrae pictured above. Wu’s team found that the oscillations of umbrae within a shared penumbra are loosely correlated, suggesting that the waves travel horizontally from umbra to umbra, and stronger correlations might indicate a shared source. The team also analyzed observations of the chromosphere and corona above the sunspots and found that sunspot oscillations can, in some cases, travel upward through the Sun’s atmosphere. To learn more about the study of umbral oscillations, be sure to check out the full article linked below.
Citation
“Propagation Properties of Sunspots Umbral Oscillations in Horizontal and Vertical Directions,” Wei Wu et al 2023 ApJ 958 10. doi:10.3847/1538-4357/acf457
The post Featured Image: Watching Waves in Sunspot Centers appeared first on AAS Nova.
]]>
A new theory explains why tidal disruption events are only rarely accompanied by powerful jets.
The post Why Are Jets from Disrupted Stars So Rare? appeared first on AAS Nova.
]]>When a star wanders too close to a supermassive black hole, the powerful tidal forces can rip the star apart. Tidal disruption events can produce powerful jets, but only sometimes — what determines whether a shredded star produces a jet?
A Star Disrupted

Illustration of shredded stellar material from a tidal disruption event. [Still image from an animation by NASA’s Goddard Space Flight Center/Chris Smith (USRA/GESTAR)]
Now, researchers have proposed a unified theory that may explain the variety of jet behaviors from tidal disruption events.
Aligning with a New Theory of Jet Production
In a recent research article, Odelia Teboul (The Hebrew University) and Brian Metzger (Columbia University and Flatiron Institute) proposed a new theory for why tidal disruption events are only rarely accompanied by jets. Teboul and Metzger suggested that only stars whose orbits are aligned with the black hole’s spin will produce jets when they are disrupted. Assuming that the stars in the dense neighborhood surrounding the supermassive black hole have orbits randomly oriented relative to the black hole’s spin, this means that only a tiny fraction of tidal disruption events should produce jets at the time of the event — just as we observe.

Diagram illustrating a misaligned tidal disruption event producing a jet. [Teboul and Metzger 2023]
Escape of the Jet Emission

Model fit to observations of the tidal disruption event Swift J1644+57. [Teboul and Metzger 2023]
Teboul and Metzger found that faint, delayed jets should be much more common than bright, prompt jets, which is exactly what observations show. So perhaps jetted tidal disruption events aren’t as rare as previously thought — the majority of them are just late to the party.
Citation
“A Unified Theory of Jetted Tidal Disruption Events: From Promptly Escaping Relativistic to Delayed Transrelativistic Jets,” Odelia Teboul and Brian D. Metzger 2023 ApJL 957 L9. doi:10.3847/2041-8213/ad0037
The post Why Are Jets from Disrupted Stars So Rare? appeared first on AAS Nova.
]]>
Researchers search for massive white dwarfs that once resided in the nearest open star cluster to Earth.
The post Tracking Down an Escaped White Dwarf appeared first on AAS Nova.
]]>Studying the highest-mass white dwarfs is key to drawing the line between stars that explode as supernovae and stars that live out their days as white dwarfs. It’s easiest to determine the ages and masses of white dwarfs in star clusters, but many clusters seem to be missing their white dwarfs — can researchers track down a massive white dwarf that once belonged to a nearby cluster?
Kicked Out of a Cluster
Many stars are born in star clusters, but they may not remain there; just as children leave home, so too do stars depart their natal clusters — though children aren’t usually ejected via gravitational interactions. Researchers suspect that gravitational kicks may explain why many star clusters are missing their white dwarfs, the exposed cores of low- to intermediate-mass stars.
The main stellar evolution pathways. It’s not yet clear exactly which stars explode as supernovae and which become white dwarfs. Click to enlarge. [ESA]
A Search for High-Mass White Dwarfs
To probe the line between stars that become supernovae and stars that become white dwarfs, David Miller (University of British Columbia) and collaborators conducted a search for high-mass white dwarfs associated with the nearby Hyades star cluster. Using precise position and velocity data from the Gaia spacecraft, the team identified stars moving in the same direction as the cluster and traveling on a path that places the star within the cluster during the cluster’s lifetime.

Color–magnitude diagram showing the full sample of white-dwarf candidates with the three leading candidates labeled. Click to enlarge. [Miller et al. 2023]
Placing Constraints

Best-fit synthetic spectrum (black line) with synthetic photometry (red circles) and data (blue error bars). Click to enlarge. [Adapted from Miller et al. 2023]
Model fitting indicates that the white dwarf has been cooling for 556 million years. With the age of the Hyades cluster still uncertain, though, Miller’s team could only loosely constrain the progenitor star’s mass to >7.5 solar masses and its lifetime to <40 million years. The existence of this massive white dwarf can instead be used to constrain the cluster’s age, limiting it to <606 million years.
Miller and coauthors note that there’s nothing exceptional about the Hyades cluster except its proximity; this suggests that similarly massive white dwarfs may be more common than expected, waiting to be discovered.
Citation
“An Extremely Massive White Dwarf Escaped from the Hyades Star Cluster,” David R. Miller et al 2023 ApJL 956 L41. doi:10.3847/2041-8213/acffc4
The post Tracking Down an Escaped White Dwarf appeared first on AAS Nova.
]]>
A red point-source in the early universe is revealed to be a massive active galactic nucleus that contributes a third of its galaxy's total mass. How did it grow so large so quickly?
The post Making Sense of a Massive Black Hole in the Early Universe appeared first on AAS Nova.
]]>JWST has uncovered a population of point-like red objects in the early universe that may be active black holes shrouded in dust. Recent follow-up observations of one of these objects suggest that it’s an active supermassive black hole that’s disproportionately large compared to the galaxy it inhabits.
Supermassive Black Holes in the Making

The collapse of a primordial gas cloud into a black hole is a possible way to make supermassive black hole seeds in the 104–105-solar-mass range. [NASA/CXC/M. Weiss; CC BY 4.0]
Both scenarios have challenges: it’s not clear how stellar-mass black holes could sustain the accretion rate necessary to transform into supermassive black holes, and we don’t yet have direct evidence for the formation of massive black hole seeds. To learn more about how supermassive black holes come to be, researchers need to amass observations of these objects in the early universe.
Red Source Revealed
Vasily Kokorev (Kapteyn Astronomical Institute) and collaborators followed up on observations of a reddish point source made through the JWST Ultradeep NIRSpec and NIRCam ObserVations before the Epoch of Reionization (UNCOVER) program. Spectra of the source, named UNCOVER ID 20466, reveal it to be at a redshift of z = 8.5, placing it about 600 million years after the Big Bang.

Two-dimensional spectrum (top) and one-dimensional extracted spectrum (bottom) of the source investigated in this study. Click to enlarge. [Adapted from Kokorev et al. 2023]
How Large Is the Seed?

Observed black hole masses and ages (symbols) and the black hole masses achievable as a function of time for accretion at the Eddington rate onto a 100-solar-mass seed (red line) and a 104-solar-mass seed (gray line). Click to enlarge. [Kokorev et al. 2023]
Kokorev’s team favors a scenario in which the black hole was seeded by the collapse of a primordial gas cloud into a 104-solar-mass black hole. In this scenario, the black hole can reach its observed mass in the allotted time without surpassing the Eddington limit, the theoretical maximum accretion rate. This also tends to create black holes that are large compared to their host galaxy.
It’s also possible for the black hole’s seed to be smaller, 100 solar masses or so, if it can accrete at super-Eddington rates for hundreds of millions of years — but exactly how that might happen is unclear, especially without the galaxy’s stellar mass growing in tandem. As JWST reveals more of the high-redshift universe, we’ll gain a better understanding of how black hole seeds are sown and sprouted.
Citation
“UNCOVER: A NIRSpec Identification of a Broad-Line AGN at z = 8.50,” Vasily Kokorev et al 2023 ApJL 957 L7. doi:10.3847/2041-8213/ad037a
The post Making Sense of a Massive Black Hole in the Early Universe appeared first on AAS Nova.
]]>
Modelers attempt to overcome the challenges posed by simulating the ultra-dense, ultra-strong crusts of neutron stars.
The post How to Model the Strongest Material in the Universe appeared first on AAS Nova.
]]>The strongest material in the universe isn’t graphene or spider silk or diamonds — it’s the crystalline crust of a dead star’s core. New research explores how to adapt our fluid dynamics models to simulate this exotic material.
A Material Unlike Any Other
Nearly all of the visible matter in our universe is in the form of plasma, which researchers excel at simulating with fluid dynamics models. Solid objects often require a different modeling treatment, since solids have a property that plasmas lack: material strength, or the ability to resist cracking or deformation. Material strength is a critical property for the crusts of neutron stars, which are made of ions arranged in a crystal lattice. Neutron star crust is the strongest material in the universe, and a teaspoon of this superlative matter would weigh 5 tons if brought to Earth’s surface.
This immense strength means that neutron star crusts can’t be modeled with typical fluid dynamics models that don’t take material strength into account. In a recent research article, Irina Sagert (Los Alamos National Laboratory) and collaborators tackle the problem of modeling neutron star crusts with fluid dynamics models, allowing us to study this extreme material with greater accuracy.
Making a Solid Model
Sagert’s team used a smoothed-particle hydrodynamics code called FleCSPH to model waves in a neutron star’s crust. These waves are thought to explain some of the features observed in X-ray flares from neutron stars, and they might affect the gravitational-wave signal produced when neutron stars spiral toward a collision. While previous studies have used smoothed-particle hydrodynamics to explore the behavior of neutron stars, these simulations treated the stars as fluid through and through, including their solid crusts, which made probing these waves impossible. Sagert’s team’s model includes a solid crust atop a fluid core.

Snapshots of the colliding rubber rings. The color scale shows the particle velocity. Click to enlarge. [Sagert et al. 2023]
Challenges and Paths Forward

Model of a toroidal oscillation in a neutron star’s crust. [Sagert et al. 2023]
- The crust makes up just a tiny fraction of a neutron star’s total volume, so most of the computational power goes toward simulating the star’s fluid interior rather than its crust.
- In the simplest case, in which the neutron star has no magnetic field, there should be no friction between the crust and the core. Because of the way a smoothed-particle hydrodynamics model performs its calculations, though, there will always be some effective friction between the crust and the core in simulations.
- Despite its extreme density and strength, neutron star crust shares something in common with gelatin: it’s much more resistant to being compressed on all sides than it is to being torn apart by shearing. This property means that small numerical fluctuations in the crust’s density can grow large unless suppressed.
The team explored several way of overcoming these challenges, and the resulting model output showed promising agreement with analytical models. The quest to model neutron star crusts isn’t yet over, but Sagert and collaborators see a clear path ahead. Incorporating relativistic physics will open the door to accurate modeling of neutron star mergers and allow researchers to study neutron star collisions and enormous X-ray flares from cracking neutron star crusts more precisely than ever before.
Citation
“Modeling Solids in Nuclear Astrophysics with Smoothed Particle Hydrodynamics,” I. Sagert et al 2023 ApJS 267 47. doi:10.3847/1538-4365/acdc94
The post How to Model the Strongest Material in the Universe appeared first on AAS Nova.
]]>
Astrobites reports on whether Jupiter-like exoplanets are responsible for defining the edges of multiple-planet systems.
The post What Shapes the Edge of a Planetary System? appeared first on AAS Nova.
]]>Editor’s Note: Astrobites is a graduate-student-run organization that digests astrophysical literature for undergraduate students. As part of the partnership between the AAS and astrobites, we occasionally repost astrobites content here at AAS Nova. We hope you enjoy this post from astrobites; the original can be viewed at astrobites.org.
Title: Can Cold Jupiters Sculpt the Edge-of-the-multis?
Authors: Nicole Sobski and Sarah Millholland
Authors’ Institutions: Wellesley College and Massachusetts Institute of Technology
Status: Published in ApJ
The Kepler mission revealed thousands of transiting exoplanets. Through this unique data set, we have come to understand much more about exoplanet demographics and the occurrence rates of different kinds of planets. In particular, we now understand that the most common type of planetary system is what we refer to as a “compact multi-planetary system.” That is to say, a system of multiple small planets (less than 4 Earth radii each) where each planet orbits in similar, short timespans (usually less than about 50 days). Studies of the full Kepler data set show that these “compact multis” are ubiquitous across the galaxy. Furthermore, these systems are shown to have a high rate of intra-system uniformity, sometimes called “peas-in-a-pod” architecture. Planets within a compact multi often have similar radii and similar spacing in their orbital periods.
But in a system of multiple transiting exoplanets of such uniformity, what causes the system to “end”? That is, what causes the pod to be filled up with peas? A new study looks into one possible force that may “sculpt” the edge of a compact multi-planet system: cold Jupiters. A cold Jupiter is a planet that has the mass of our own solar system’s Jupiter and is widely separated from its host star. The authors explore if and how the existence of a cold Jupiter at wide separation from an inner compact multi arrangement might determine how the pod gets filled with peas.
To test this, the authors needed a data set of known compact multis. They turned to the Kepler data set and selected the systems with at least four transiting planets. This left them with 279 planets in 64 systems. Next, they compiled the previously measured masses of these planets; only 60 of 279 had masses, so for the remainder they used a well-described mass–radius relationship to estimate planet masses. Planet mass is a crucial input for this study as mass is the primary parameter needed for dynamical studies, which inherently rely on gravitational forces.
To determine if and how a cold Jupiter could sculpt the edge of the inner compact system, the authors devised a dynamical study. Dynamical studies test how planets interact with each other through their gravitational influence on one another; often a researcher will test to see if a certain configuration of planets is stable or if it is unstable. In an unstable system, some or all of the planets get gravitationally kicked out of the system. Using a simulation software called the Stability of Planetary Orbital Configurations Klassifier (SPOCK), which takes in a list of planet masses and a few basic orbital parameters, the authors were able to compute the stability of the system over a specified time span. The authors added a simulated cold Jupiter (with parameters drawn from random distributions) to a planetary system with real planet masses and orbits and then determined the system’s stability over 1 billion years. For each of the 64 systems in the sample, they performed this test 10,000 times, noting the probability that the system was stable or not over that time span.
Each test resulted in one of three outcomes: unstable, fully stable, or metastable. Within the context of this study, metastable meant that the system was stable in about half of the simulations. Unstable simulations mean that the system will be ripped apart by gravitational interactions. The injected cold Jupiters that result in unstable configurations are not considered plausible edge-sculptors, then, because we do see planets in these systems; if the presence of a cold Jupiter made the system unstable, we wouldn’t see planets in the system. Next, the stable simulations represent injected cold Jupiters that had no effect on the inner system. These cold Jupiters exist at too wide a separation from the inner system for gravity to play a role in sculpting the edge of the pea pod. Therefore, these planets were also not considered plausible edge-sculptors. The metastable simulations, in which the odds of the system falling apart were between 30% and 70% (above 70% was considered fully stable), are the most interesting. These simulations correspond to systems in which the injected cold Jupiter had a real effect on the inner compact system and could potentially sculpt the edge of the inner compact system, as shown in Figure 1.
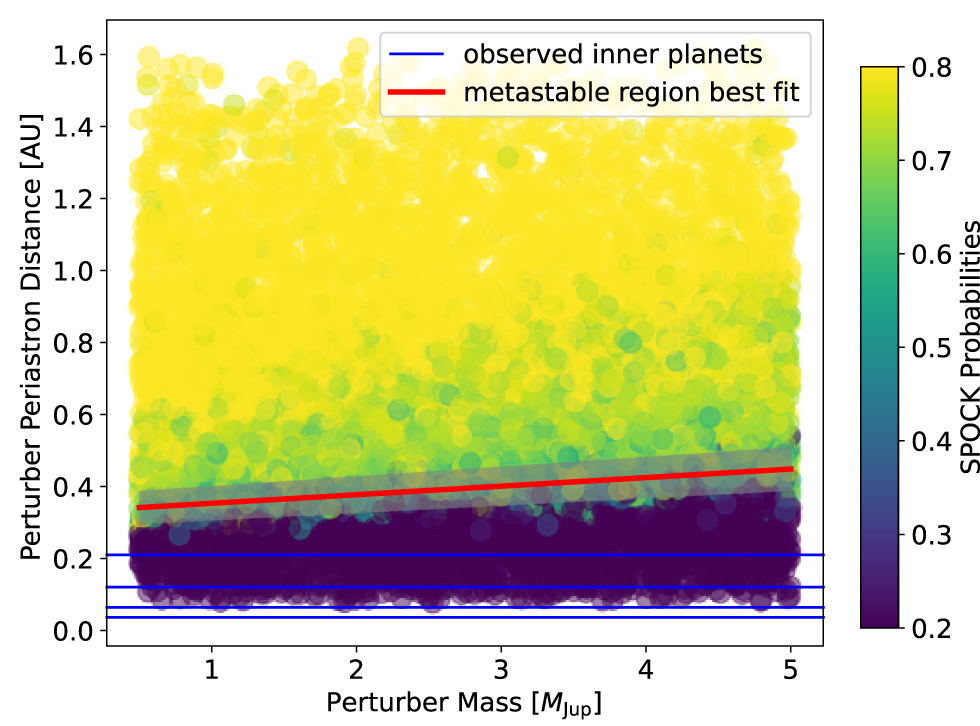
Figure 1: An example of the results of the main dynamical experiment for one multi-planet system. Each point is one of the 10,000 simulations where a cold Jupiter with randomized orbital parameters (y axis) and mass (x axis) is injected into the dynamical simulation along with the real planets. The dots are color coded by the probability of a stable configuration after 1 billion years: purple is unlikely to be stable, yellow is very likely stable. The metastable region is defined by the shading and red line. Because this particular system has a very small metastable region, it is highly unlikely that any cold Jupiter, if it exists, would play the role of the “edge sculptor.” [Adapted from Sobski & Millholland 2023]
Therefore, the authors conclude that cold Jupiters likely do not help sculpt the edge of compact multi-planet systems. If they could, we would have found them in real data; since we don’t find them in real data, they must not exist in the compact multis studied here. Even though this experiment led to the rejection of the original hypothesis, it is nevertheless a fascinating result that tells us a bit more about the way exoplanet systems may form and evolve.
Original astrobite edited by Lindsay DeMarchi.
About the author, Jack Lubin:
Jack received his PhD in astrophysics from UC Irvine and is now a postdoc at UCLA. His research focuses on exoplanet detection and characterization, primarily using the radial-velocity method. He enjoys communicating science and encourages everyone to be an observer of the world around them.
The post What Shapes the Edge of a Planetary System? appeared first on AAS Nova.
]]>
A distinctive pulsar wind nebula shaped like an outstretched hand is seen in polarized X-rays for the first time.
The post Featured Image: The Cosmic Hand in Polarized Light appeared first on AAS Nova.
]]>Some 16,000 light-years from Earth, a ghostly hand glows with X-ray light. The distinctive “Cosmic Hand” is a pulsar wind nebula: an X-ray-emitting cloud powered by charged-particle winds from the spinning remnant of a massive star that exploded as a supernova. In X-ray images, the Cosmic Hand has a thumb and three fingers formed by brighter ridges of emission and a delicate wrist illuminated by the pulsar’s powerful jet. Recently, a team led by Roger Romani (Stanford University) used the Imaging X-ray Polarimetry Explorer (IXPE) to make the first observations of polarized X-ray light from the Cosmic Hand. The images above show the degree of polarization detected and the direction of the derived magnetic field (left image, white and yellow bars atop an X-ray image from the Chandra X-ray Observatory) and the 2–8-kiloelectronvolt brightness (right image, greyscale). The new measurements show that the polarization generally follows the structure of the nebula, especially the thumb and the arched region surrounding the jet. To learn more about the structure and magnetic fields of this pulsar wind nebula, be sure to check out the full article linked below.
Citation
“The Polarized Cosmic Hand: IXPE Observations of PSR B1509−58/MSH 15−52,” Roger W. Romani et al 2023 ApJ 957 23. doi:10.3847/1538-4357/acfa02
The post Featured Image: The Cosmic Hand in Polarized Light appeared first on AAS Nova.
]]>
In order to get its present-day orbit, Enceladus must have felt the need for speed in its recent past.
The post Enceladus, Previous Speedster appeared first on AAS Nova.
]]>Enceladus, one of Saturn’s moons, is currently being tugged around and heated up by another moon named Dione. How the two ended up in this arrangement is a mystery, since to get there, Enceladus must have avoided getting caught up in a resonance with another moon named Tethys. A recent article offers a possible explanation: Enceladus may have blitzed over to its current position in a short-lived burst of speed.

Enceladus, as seen by the Cassini mission in 2015. [NASA/JPL-Caltech/Space Science Institute]
Dynamic Moons
We typically imagine that moons circle their host planets with clockwork regularity, meaning that they precisely trace out the same path at the same speed for all time. However, true reality cannot be described by a system composed of rigid gears. Instead, moons very slowly change their orbits, wandering around to different separations, eccentricities, and inclinations. Through simulations of their motions over millions of years, astronomers can reveal that what initially looks dull and regular is actually just a snapshot of rich, dynamical behaviors.
Predicting these motions is a challenging task since moons are motivated to wander by forces that are difficult to model. Moons are not homogenous, inflexible solid spheres, meaning they can “squish” and “relax” repeatedly as they get tugged around. This squishing, referred to as tidal interactions, saps energy from the moons’ orbits by converting it to heat that warms up the rock and ice of each moon. Describing this behavior relies on knowing quantities that are difficult to measure, such as the composition and interior structure of the planet and each moon.
Obstacle to Dione

An illustration of how Encleadus’s speed affects its response to a resonance. When moving faster (right panel), Enceladus mostly skips over the resonance and remains at a lower inclination compared to the inclination it would have reached had it been moving slower (left panel). Click to enlarge. [Ćuk and El Moutamid 2023]
But how did the pair of moons reach this configuration? By asserting a guess about the parameters that govern the system’s tidal parameters, astronomers can simulate the motion of the moons over millions of years, then check how well their arrangement matches the present day. This was the technique used by Matija Ćuk (SETI Institute) and Maryame El Moutamid (Cornell University) in their recent article that revealed an interesting conclusion: to have reached its current resonance with Dione, Enceladus must have crossed through a region of parameter space where it risked getting trapped into a resonance with a different moon, Tethys.

Dione, whose radius is roughly equal to the distance between Boston and Baltimore. This image was taken with the Cassini spacecraft’s narrow-angle camera on 22 June 2017. [NASA/JPL-Caltech/Space Science Institute]
Spurt of Speed
The fact that we see Enceladus in a low-inclination resonance with Dione today implies that it must have blitzed through this other resonance, drifting so quickly that it managed to skate through unaffected. It could not have kept up this speed for long, however, otherwise it would have been swallowed by Saturn by now. Instead, Ćuk and El Moutamid posit that Enceladus must have experienced a short-lived burst of tidal evolution, a time in which it managed to hop over a resonance with Tethys only to get stuck in one with Dione.
Exactly what caused this burst is unclear, as are the effects of complicated resonances with the fluid interior of Saturn itself. Even so, just by knowing this burst happened, astronomers can another chapter to add to the complex history of this fascinating, watery moon.
Citation
“A Past Episode of Rapid Tidal Evolution of Enceladus?” Matija Ćuk and Maryame El Moutamid 2023 Planet. Sci. J. 4 119. doi:10.3847/PSJ/acde80
The post Enceladus, Previous Speedster appeared first on AAS Nova.
]]>
Joining a galaxy cluster can fundamentally change a galaxy's properties. New research looks at how galaxy clusters affect star formation beyond the local universe.
The post Living in a Galaxy Cluster Slows Down Star Formation appeared first on AAS Nova.
]]>Living in a crowded cluster neighborhood can have a big impact on a galaxy. New research looks to galaxies beyond the local universe to test how living in a galaxy cluster affects galaxies’ stellar populations.
Cluster Influence

Spiral galaxy Messier 83 is alight with pink and blue star forming regions. Observations suggest that cluster membership can slow a galaxy’s star formation. [NASA, ESA, and the Hubble Heritage Team (STScI/AURA); Acknowledgement: W. Blair (STScI/Johns Hopkins University) and R. O’Connell (University of Virginia)]
That’s what happens in the local universe — does the same story hold for galaxies farther away?
A Higher-Redshift Investigation
Keunho Kim (University of Cincinnati) and collaborators used observations of galaxy clusters spanning 5 billion years of the universe’s history to test this finding farther back in time. The team analyzed South Pole Telescope and Atacama Cosmology Telescope observations of 105 galaxy clusters at redshifts 0.26 < z < 1.13 (about 5.4–10.7 billion years after the Big Bang).

Left: Diagram showing the orbit of a galaxy as it falls in to a cluster. Right: Corresponding locations on the position–velocity plot. Click to enlarge. [Kim et al. 2023]
Slowing Down Star Formation

Demonstration of how stellar populations become older as time since infall increases. This result holds for galaxies of all luminosities studied. [Kim et al. 2023]
If the average age of a galaxy’s stars increases with time spent in a cluster, this means that living in a galaxy cluster suppresses star formation — just as was found for local galaxies. This result holds regardless of the luminosity of the galaxy or its redshift, giving us clues about the process responsible for stopping star formation. Given the time frames involved, Kim and collaborators suggest that the process responsible for quenching star formation proceeds slowly, such as the removal of the circumgalactic medium that would normally replenish a galaxy’s star-forming fuel.
Citation
“A Gradual Decline of Star Formation since Cluster Infall: New Kinematic Insights into Environmental Quenching at 0.3 < z < 1.1,” Keunho J. Kim et al 2023 ApJ 955 32. doi:10.3847/1538-4357/acecff
The post Living in a Galaxy Cluster Slows Down Star Formation appeared first on AAS Nova.
]]>
Astrobites reports on how modeling molecular clouds can help us understand how these cosmic nurseries form stars.
The post Today in (Astro) Shop Class: How to Build a Molecular Cloud appeared first on AAS Nova.
]]>Editor’s Note: Astrobites is a graduate-student-run organization that digests astrophysical literature for undergraduate students. As part of the partnership between the AAS and astrobites, we occasionally repost astrobites content here at AAS Nova. We hope you enjoy this post from astrobites; the original can be viewed at astrobites.org.
Title: The Global Structure of Molecular Clouds: I. Trends with Mass and Star Formation Rate
Authors: Nia Imara and John C. Forbes
First Author’s Institution: University of California, Santa Cruz
Status: Published in ApJ
Molecular clouds are stellar nurseries, the birthplace of stars in our universe. These clouds are made up of cold molecular hydrogen, H2, which can clump together and collapse to form stars. Despite being such a vital part of the universe, the physics behind molecular clouds still needs to be better understood. Observations of molecular clouds provide limited information about their three-dimensional structure, making it challenging to study what exactly it is about these clouds that enable them to form stars.
Creating models that resemble molecular clouds is an excellent way to understand them in great detail. Comparing the models to actual observations enables us to tweak the model so that it matches all the observational properties of the object, thus letting us use the properties of the model to study the properties of the actual object.
So, how does one go about building a model of a molecular cloud? A good place to start would be to see how these structures look through a telescope. Observations indicate that most molecular clouds have an elongated shape with more gas concentrated near a central axis. The next step would be to pick a geometrical shape that best resembles the observations, preferably well studied and having well-defined properties. Even though our first instinct is to model the clouds as a sphere (because everything can be assumed to be a sphere!), the authors of today’s article take a more reasonable approach and model the molecular clouds as a cylinder.
Rolling in the Deep (Space)
The next step in building a good model would be to justify why this model is the closest to the molecular cloud. The comparison between the model adopted and an actual molecular cloud is highlighted in Figure 1.
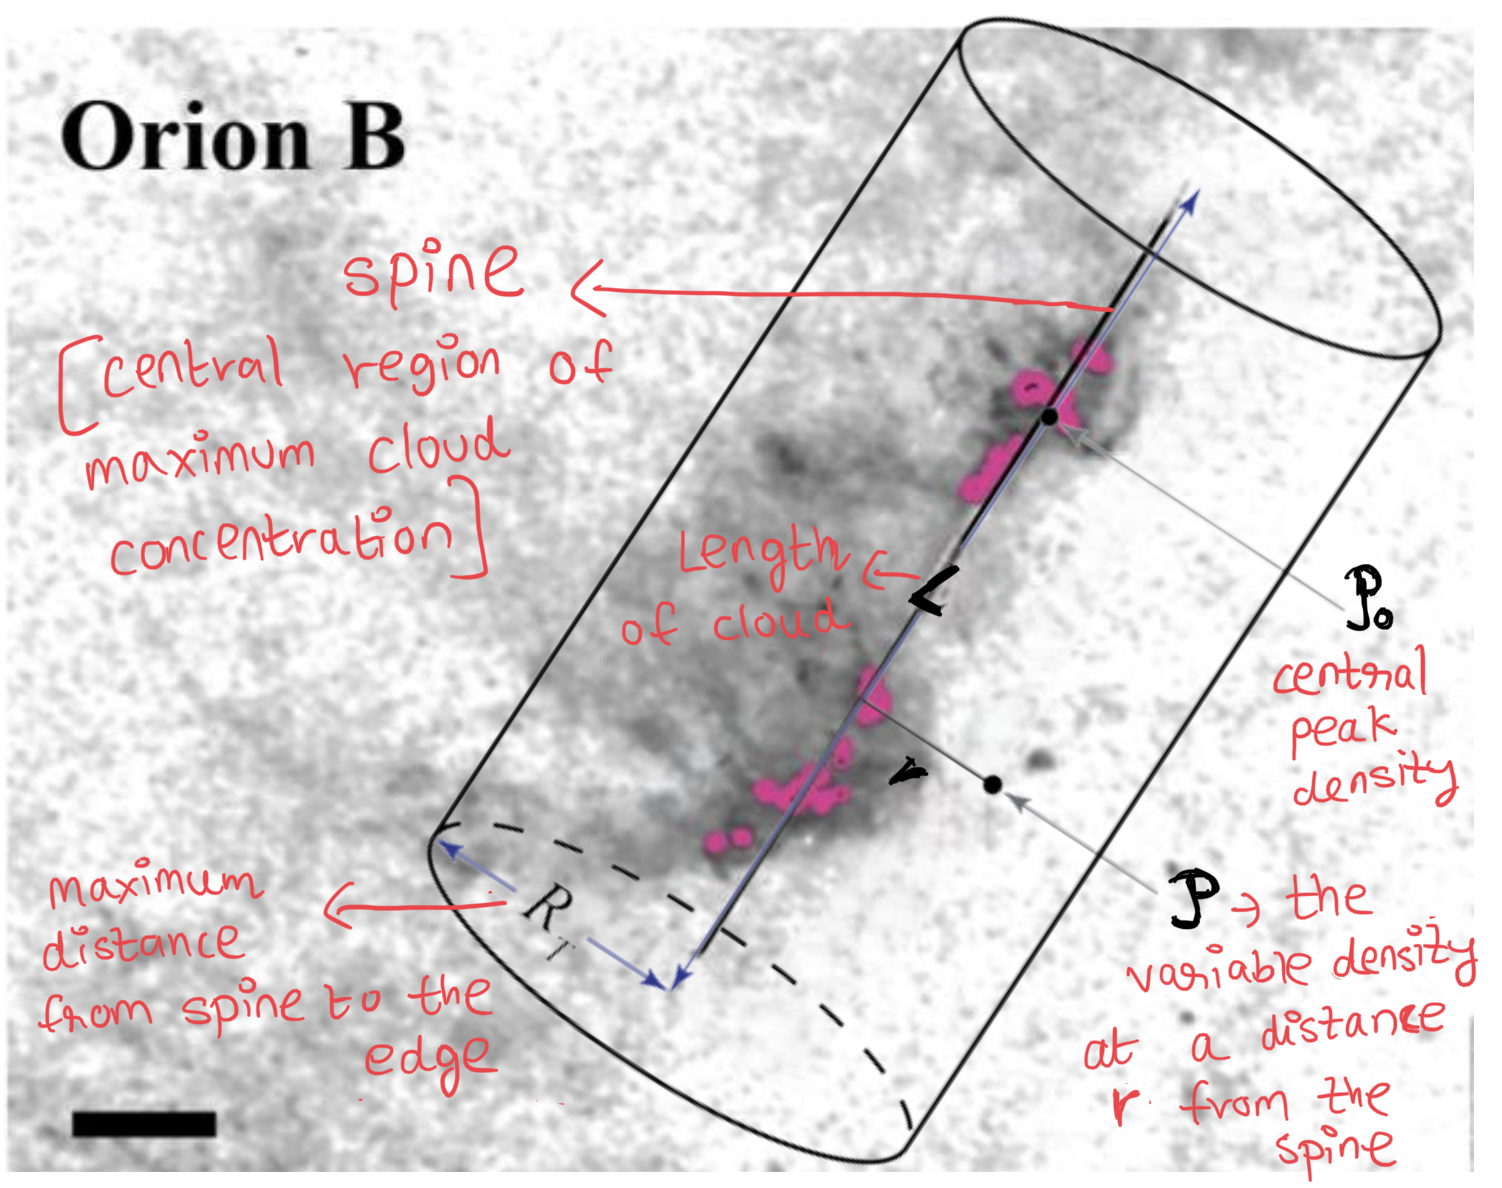
Figure 1: The cylindrical model plotted on top of the observed extinction map of a molecular cloud, with the various parameters defined in red. The pink signifies regions of high extinction. [Imara & Forbes 2023 with annotations by Archana Aravindan]
How do you know if the model you’ve built is a good one? You test to see how well it replicates the properties of a real molecular cloud! To do this, the authors collected high-resolution observations of a sample of molecular clouds. Density is an important term that needs to be compared to observations, but density measurements are hard to obtain directly from the 2D projections of the clouds. A good approximation would be to get maps of dust extinction, which can be used as a proxy for density. There are well-established relations in place that relate dust extinction to surface density, so the authors use these relations to test their models.
Does the Model Have It All?!
The authors determined that all the clouds in their sample could be represented well by the cylindrical model. They also noted some significant correlations between the model parameters and the observed cloud properties (Figure 2). Clouds with the highest central densities have the lowest mass and star formation rates. High density coincides with high star formation rates since the denser the gas, the higher the chances for stars to form. However, the fact that such clouds have a low total mass seems counterintuitive. The authors determine that the mass of the cloud depends on both the distance along the spine and the perpendicular distance from it. They also find that dense clouds have short depletion times: the time needed to convert all the available molecular gas into stars at the current star formation rate. This gives us a correlation between the structure of the clouds and the timescales on which they would form stars.
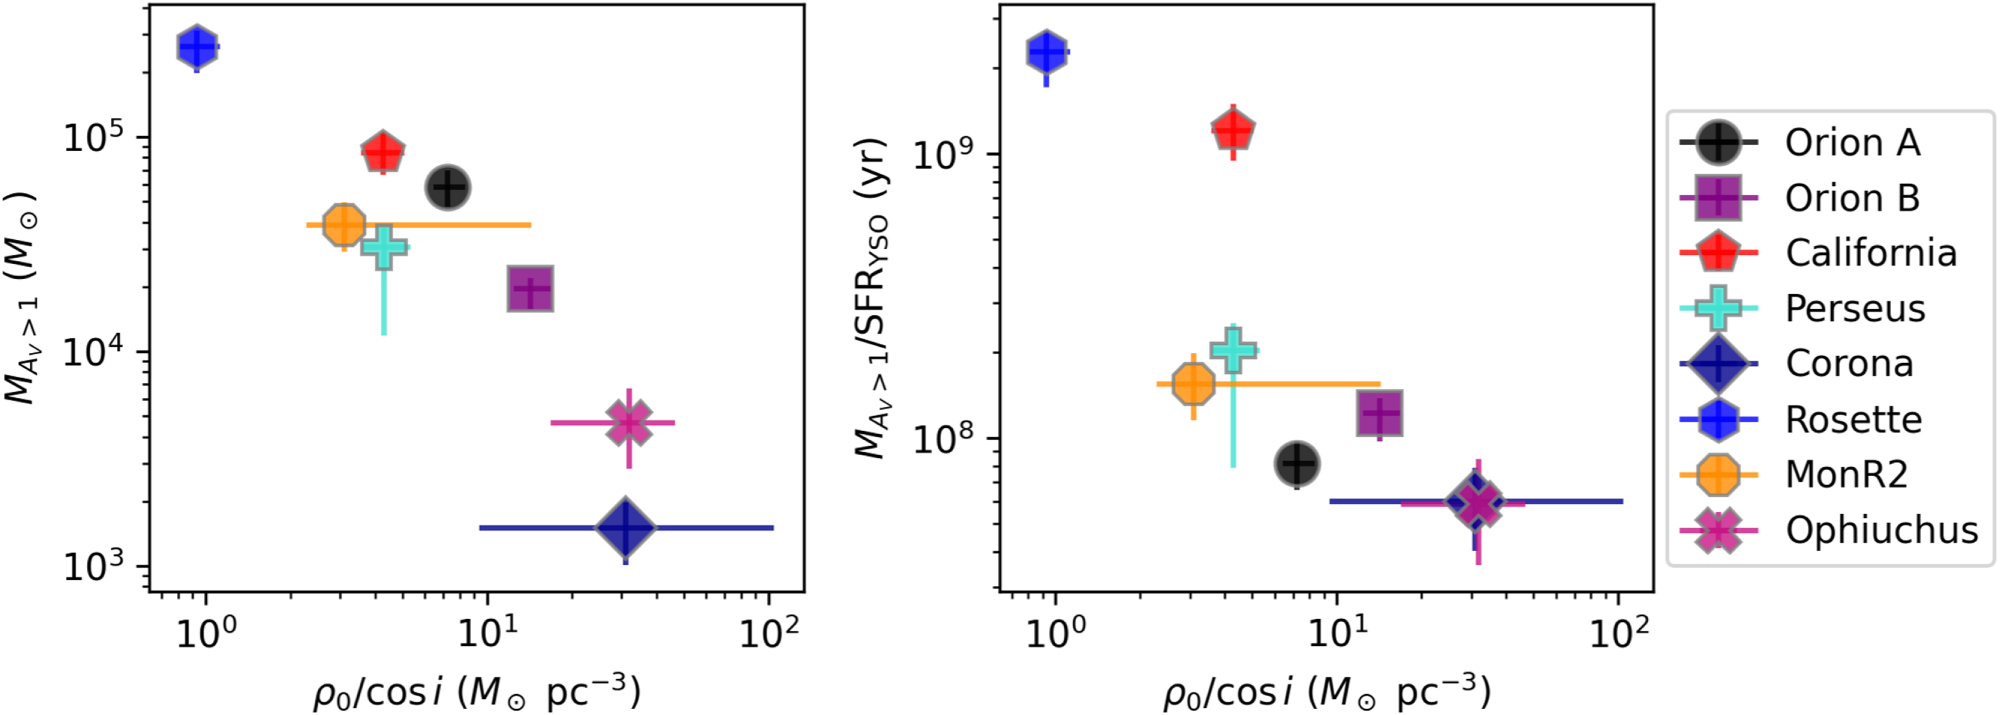
Figure 2: The correlation between the mass (left) and depletion times (right, indicated as Mass/Star formation rate) on the y axis with the density (given as ρo/cos i to account for the inclination of the cloud) on the x axis for the observed sample of molecular clouds. As the density increases, both the mass of the cloud and the depletion times decrease. [Imara & Forbes 2023]
Original astrobite edited by William Balmer.
About the author, Archana Aravindan:
I am a third-year PhD student at the University of California, Riverside, where I study black hole activity in small galaxies. When I am not looking through some incredible telescopes, you can usually find me reading, thinking about policy, or learning a cool language!
The post Today in (Astro) Shop Class: How to Build a Molecular Cloud appeared first on AAS Nova.
]]>
Colliding sunspots can produce solar flares, but not all collisions are accompanied by these outbursts. New simulations explore what it takes to make a solar flare.
The post Setting Sunspots on a Collision Course appeared first on AAS Nova.
]]>Solar flares are bursts of high-energy radiation that are associated with sunspots. New research uses models to study what happens when sunspots collide and under what conditions these collisions cause solar flares.

The color scale in this image shows the strength of the radial magnetic field, with outward-pointing fields in white and inward-pointing fields in black. There is a large sunspot on the left side of the image. [NASA/SDO]
Critical Spots for Research
Sunspots are relatively cool areas of the Sun’s disk (3000–4000K as compared to the 5800K surface) where the solar magnetic field rises above the surface. Sunspots often come in pairs, with one found where magnetic field lines emerge from the solar surface and the other where the field lines plunge back in. When the inward- and outward-pointing magnetic fields of two sunspots meet, the release of magnetic energy can power solar flares and other explosive events.
Not all sunspot collisions produce solar flares, though, and understanding why is a goal of solar physics research. Now, researchers have used fluid dynamics simulations to understand the complex magnetic environment surrounding clashing sunspots.

Simulation snapshot showing the magnetic field configuration 14 seconds before the peak of the flare. [Adapted from Rempel et al. 2023]
When Sunspots Collide
Using the three-dimensional MURaM hydrodynamics model, Matthias Rempel (National Center for Atmospheric Research) and collaborators placed sunspots on a collision course, varying the speed of the sunspots and their distance apart to understand how these factors affect the production of solar flares. They started the sunspots at 25,000 kilometers apart, and the programmed trajectories brought the spots as close as 8,500 kilometers. As the sunspots approached and moved past each other, the moving spot broke apart in a process called collisional shearing. This shearing process also occurs in real sunspots, and it may be important to the creation of solar flares.
All of the collisions heated up the solar atmosphere above the sunspots, but only certain simulations resulted in solar flares and ejections of plasma from the solar atmosphere. The higher the velocities of the sunspots and the closer they got together, the more energy was produced, with the distance of closest approach being the biggest determinant of whether or not a solar flare occurred. The team also found that when solar flares did happen, they made good use of the available magnetic energy; 40–50% of the built-up magnetic energy was released in the flares.
Drawing a Line on the Sun

Magnetic fields during the initial state (top left) and closest encounters (remaining panels). The orange lines show the polarity inversion lines. Click to enlarge. [Rempel et al. 2023]
The simulated solar flares in this study reached energies corresponding to M-class flares, the second most energetic class of solar flares. Rempel’s team suspects that by cranking up the magnetic flux to the values seen in highly active sunspots, even more powerful flares are possible.
Citation
“Comprehensive Radiative MHD Simulations of Eruptive Flares Above Collisional Polarity Inversion Lines,” Matthias Rempel et al 2023 ApJ 955 105. doi:10.3847/1538-4357/aced4d
The post Setting Sunspots on a Collision Course appeared first on AAS Nova.
]]>
Galaxies seem to have less matter than we think they should, but new research suggests it's not missing — just hiding in the form of hot circumgalactic gas.
The post FOUND: Missing Matter appeared first on AAS Nova.
]]>Galaxies seem to have less matter than they should. Has the missing matter been found at last in the form of hot, sparse gas?
The Troubling Matter of Normal Matter

The space surrounding a galaxy isn’t empty. Instead, it’s filled with tenuous circumgalactic gas invisible to optical telescopes. [NASA, ESA, CXC, SSC, and STScI; CC BY 4.0]
Researchers suspect that the matter isn’t really “missing” but is instead “hidden,” present in a form that’s hard to observe. Recently, a major breakthrough happened when researchers zoomed out from the luminous, starry disks of galaxies to study the tenuous gas of the circumgalactic medium. There, they found immense reservoirs of cool (~104K) gas accounting for as much as 50% of the lost matter. In a recent article, researchers have turned up the heat on the search, seeking out a second, hotter (~106K) component of the circumgalactic medium.

A diagram (not to scale!) of the observing setup. X-rays emitted by the quasar pass through the circumgalactic medium of a foreground galaxy. [AAS Nova/Kerry Hensley]
A Critical Alignment
A team led by Fabrizio Nicastro (Italian National Institute for Astrophysics) aimed to track down the remaining missing matter by observing the light from quasars as it passes through galaxies in the foreground. Quasars are the luminous centers of distant galaxies that are powered by supermassive black holes consuming matter. Superheated disks surrounding these active black holes emit enormous amounts of X-rays. As these X-rays travel from the quasar to our telescopes, they can be intercepted by galaxies along their path. If the sought-after hot gas is present in the surroundings of these galaxies, it’ll make itself known by absorbing some of the quasars’ X-ray light.
Nicastro and collaborators analyzed X-ray spectra of three quasars whose lines of sight pass through the circumgalactic medium of a foreground galaxy. None of the individual quasar spectra showed definitive signs of the elusive hot circumgalactic gas, but a signal emerged when the team combined observations of all three quasars. Using several different fitting methods and ways of combining the data, the team detected a signal at a significance ranging from 4.2 to 6.8 sigma.
Missing Mass Found

Example of an X-ray absorption line identified after stacking the observations from all three quasars. [Adapted from Nicastro et al. 2023]
The discovery of this supply of hot circumgalactic gas has significance beyond solving the missing matter problem: the newfound detection of hot gas can also tell us about how galaxies have exchanged gas with the circumgalactic medium throughout their lives.
Citation
“X-ray Detection of the Galaxy’s Missing Baryons in the Circumgalactic Medium of L* Galaxies,” Fabrizio Nicastro et al 2023 ApJL 955 L21. doi:10.3847/2041-8213/acec70
The post FOUND: Missing Matter appeared first on AAS Nova.
]]>
A rare binary system containing hot stars with powerful winds makes dust when the stars approach each other every 13 years.
The post A Cosmic Dust Factory Ramps Up Production appeared first on AAS Nova.
]]>The universe is a surprisingly dusty place. New research takes a look at a rare system where massive stars make dust in their powerful winds.
Stardust Gets Its Start
Cosmic dust is typically born in the atmospheres of evolved stars, where it’s cool enough for carbon and silicon to condense into solid grains. A more dramatic example of dust creation can be seen in the binary system WR 137, where the clashing stellar winds of two massive stars create dust every time the stars approach each other.
The dusty ejecta of Wolf–Rayet stars makes for fantastic images. These stars will eventually explode as supernovae. [NASA, ESA, CSA, STScI, Webb ERO Production Team]
As these stars draw near each other every 13 years, the Wolf–Rayet star’s intense stellar winds (at 4.5 million miles per hour!) pummel the O star’s disk, creating a perfect environment for making dust.

Infrared light curves of WR 137 showing four brightness increases due to dust production. Click to enlarge. [Peatt et al. 2023]
When Stellar Winds Collide
Past observations show an increase in WR 137’s infrared brightness every 13 years. Because dust grains absorb light of many wavelengths and re-emit it in the infrared, this periodic increase in infrared light suggests that there is a periodic increase in dust formation as well. The next flurry of dust formation should happen in 2024, so a team led by Megan Peatt (Embry-Riddle Aeronautical University) seized the opportunity to observe the system at infrared wavelengths using the Stratospheric Observatory For Infrared Astronomy (SOFIA), which has now been decommissioned.
The observations, made in July 2021, February 2022, and May 2022, show a steady increase in infrared emission, marking the increase in dust production as the stars approach each other. In addition to the characteristic spectral lines from the Wolf–Rayet star’s powerful winds, the team also identified a weak emission line around 6.3–6.4 microns (1 micron = 10-6 meter). This feature grew stronger as the system brightened, suggesting that it’s linked to the formation of dust.
Signs of Dust Composition?

Vertically offset spectra showing the slight migration of the 6.2-micron feature. Click to enlarge. [Peatt et al. 2023]
This might happen because as the stars draw close, the carbon-rich, hydrogen-poor wind of the Wolf–Rayet star collides and mixes with the hydrogen-rich disk around the O star. As dust production begins, there are ample hydrogen atoms to be wrapped into dust molecules, but as it continues, the proportion of wind material to disk material rises, meaning fewer hydrogen atoms are available. The team emphasizes that this result is speculative, and we’ll need more observations of WR 137 to understand how it makes dust. Hopefully, we’ll learn more about this cosmic dust factory as it nears peak production in 2024!
Citation
“FORCASTing the Spectroscopic Dust Properties of the WC+O Binary WR 137 with SOFIA,” Megan J. Peatt et al 2023 ApJ 956 109. doi:10.3847/1538-4357/acf201
The post A Cosmic Dust Factory Ramps Up Production appeared first on AAS Nova.
]]>
Astrobites reports on a way to use an unlucky star to learn about a pair of supermassive black holes.
The post Three’s a Crowd for Stars Around Supermassive Black Hole Binaries appeared first on AAS Nova.
]]>Editor’s Note: Astrobites is a graduate-student-run organization that digests astrophysical literature for undergraduate students. As part of the partnership between the AAS and astrobites, we occasionally repost astrobites content here at AAS Nova. We hope you enjoy this post from astrobites; the original can be viewed at astrobites.org.
Title: Uncovering Hidden Massive Black Hole Companions with Tidal Disruption Events
Authors: Brenna Mockler et al.
First Author’s Institution: The Observatories of the Carnegie Institution for Science & Department of Physics and Astronomy at the University of California, Los Angeles
Status: Published in ApJ
Two Is Company
Today, astronomers believe that nearly every galaxy hosts a supermassive black hole at its center. In addition, galaxies are thought to grow through mergers, in a process known as hierarchical growth. Essentially, smaller galaxies smash together to form a larger galaxy, and this process repeats many times as the universe evolves. When two galaxies hosting supermassive black holes merge, the black holes should sink to the center of the new galaxy rather rapidly, where they could start orbiting each other as a supermassive black hole binary. These binaries are therefore a natural consequence of this picture of hierarchical galaxy evolution and should be a relatively common occurrence in the universe.
However, finding supermassive black hole binaries has been rather difficult with current instrumentation and technology. A supermassive black hole makes itself known when it accretes gas from its surroundings, becoming a luminous active galactic nucleus. As two accreting black holes get closer and closer together, our telescopes become incapable of resolving them as two individual active galactic nuclei. There are other ways to infer that a binary exists when the black holes are close together, but these methods can be tricky — either the signals could also be produced by some other astrophysical phenomenon, or they take decades to confirm. The next generation of gravitational wave detectors, like the Laser Interferometer Space Antenna, will surely help, but we’d still like to be able to look for supermassive black hole binaries in the next decade or more before these detectors are built!
Introducing the Star of the Show
One of the best ways to observe something we can’t see is by looking for its interactions with things we can see. Today’s authors study the interplay of a supermassive black hole binary with stars in the centers of galaxies, highlighting this as a potential way to uncover these binaries. To start, let’s consider just a single supermassive black hole and throw a star at it. Most of the time, this star will orbit the black hole, just like our planets orbit the Sun. However, in some cases, when the orbit is eccentric enough, the star can get just a bit too close to the supermassive black hole, leading to the star’s demise. This measure of “too close” is set by the distance at which the star’s self-gravity can no longer hold itself together against the tidal forces of the black hole, and the star gets ripped to shreds. We call this phenomenon a tidal disruption event, and these events release a huge amount of energy from a previously quiet black hole.
Okay, but how do we get stars onto these elliptical orbits so that they’re disrupted? And how often does this happen? Many research articles have investigated these questions (check out some of the many Astrobites written on tidal disruption events), both from a theoretical and observational perspective. It turns out that one way to get stars onto these highly elliptical orbits is to scatter them off of other stars (through a process called two-body relaxation). This process is relatively rare; both theory and observations agree that the rate for tidal disruption events around single black holes is somewhere around one every 104–105 years (per galaxy).
But what happens when we deposit these stars around a supermassive black hole binary? The authors of today’s article investigate this very question. In particular, they investigate the interaction of stars around the smaller of the two black holes (see Figure 1 for a schematic of this set up).
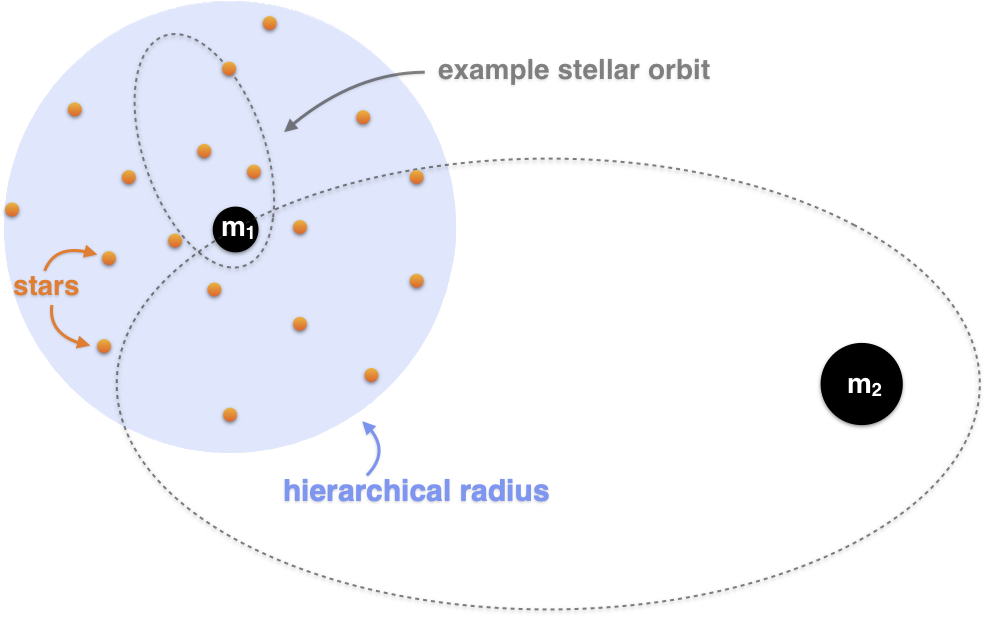
Figure 1: Cartoon schematic of the setup considered in today’s article. We have two supermassive black holes with masses m1 and m2, with m1 < m2. The authors investigate stellar orbits around the smaller black hole (m1). [Mockler et al. 2023]
And Now Three’s a Crowd
To explore the effects of a binary supermassive black holes on the rate of tidal disruption events, the authors perform dynamical simulations of the three-body problem we just set up above. They focus in particular on the effects of the eccentric Kozai–Lidov (EKL) mechanism, which is a dynamical effect in a three-body system that allows the eccentricity and inclination of the outer binary (i.e., the star and the lower-mass black hole) to oscillate. EKL oscillations can lead to extreme eccentricities, which is a great way to make tidal disruption events happen! To explore the effects of EKL on the system, the authors test different combinations of binary masses and stellar density profiles. There’s a large range of possible parameters in this problem, so they limit their tests to those in which the timescale for the EKL mechanism is the shortest dynamical timescale (which leads to EKL being the dominant mechanism driving the system’s evolution).
The simulations revealed that there should be a burst of tidal disruption events lasting 1–100 million years, depending on the exact simulation parameters. During this time period, the tidal disruption event rates greatly exceed that expected from two-body relaxation, which is what sets the rates of these events in single supermassive black hole systems. However, if the stars near the black hole are not replenished after this period, either from star formation near the galactic nucleus or some dynamical effects, then the rates of EKL-driven tidal disruption events drop to less than those of two-body relaxation. This is highlighted in Figure 2, which shows the EKL-driven tidal disruption event rate as a function of time in these dynamical simulations. So, our best hope for catching tidal disruption events around the smaller black hole in a binary pair is relatively quickly after it enters the binary.
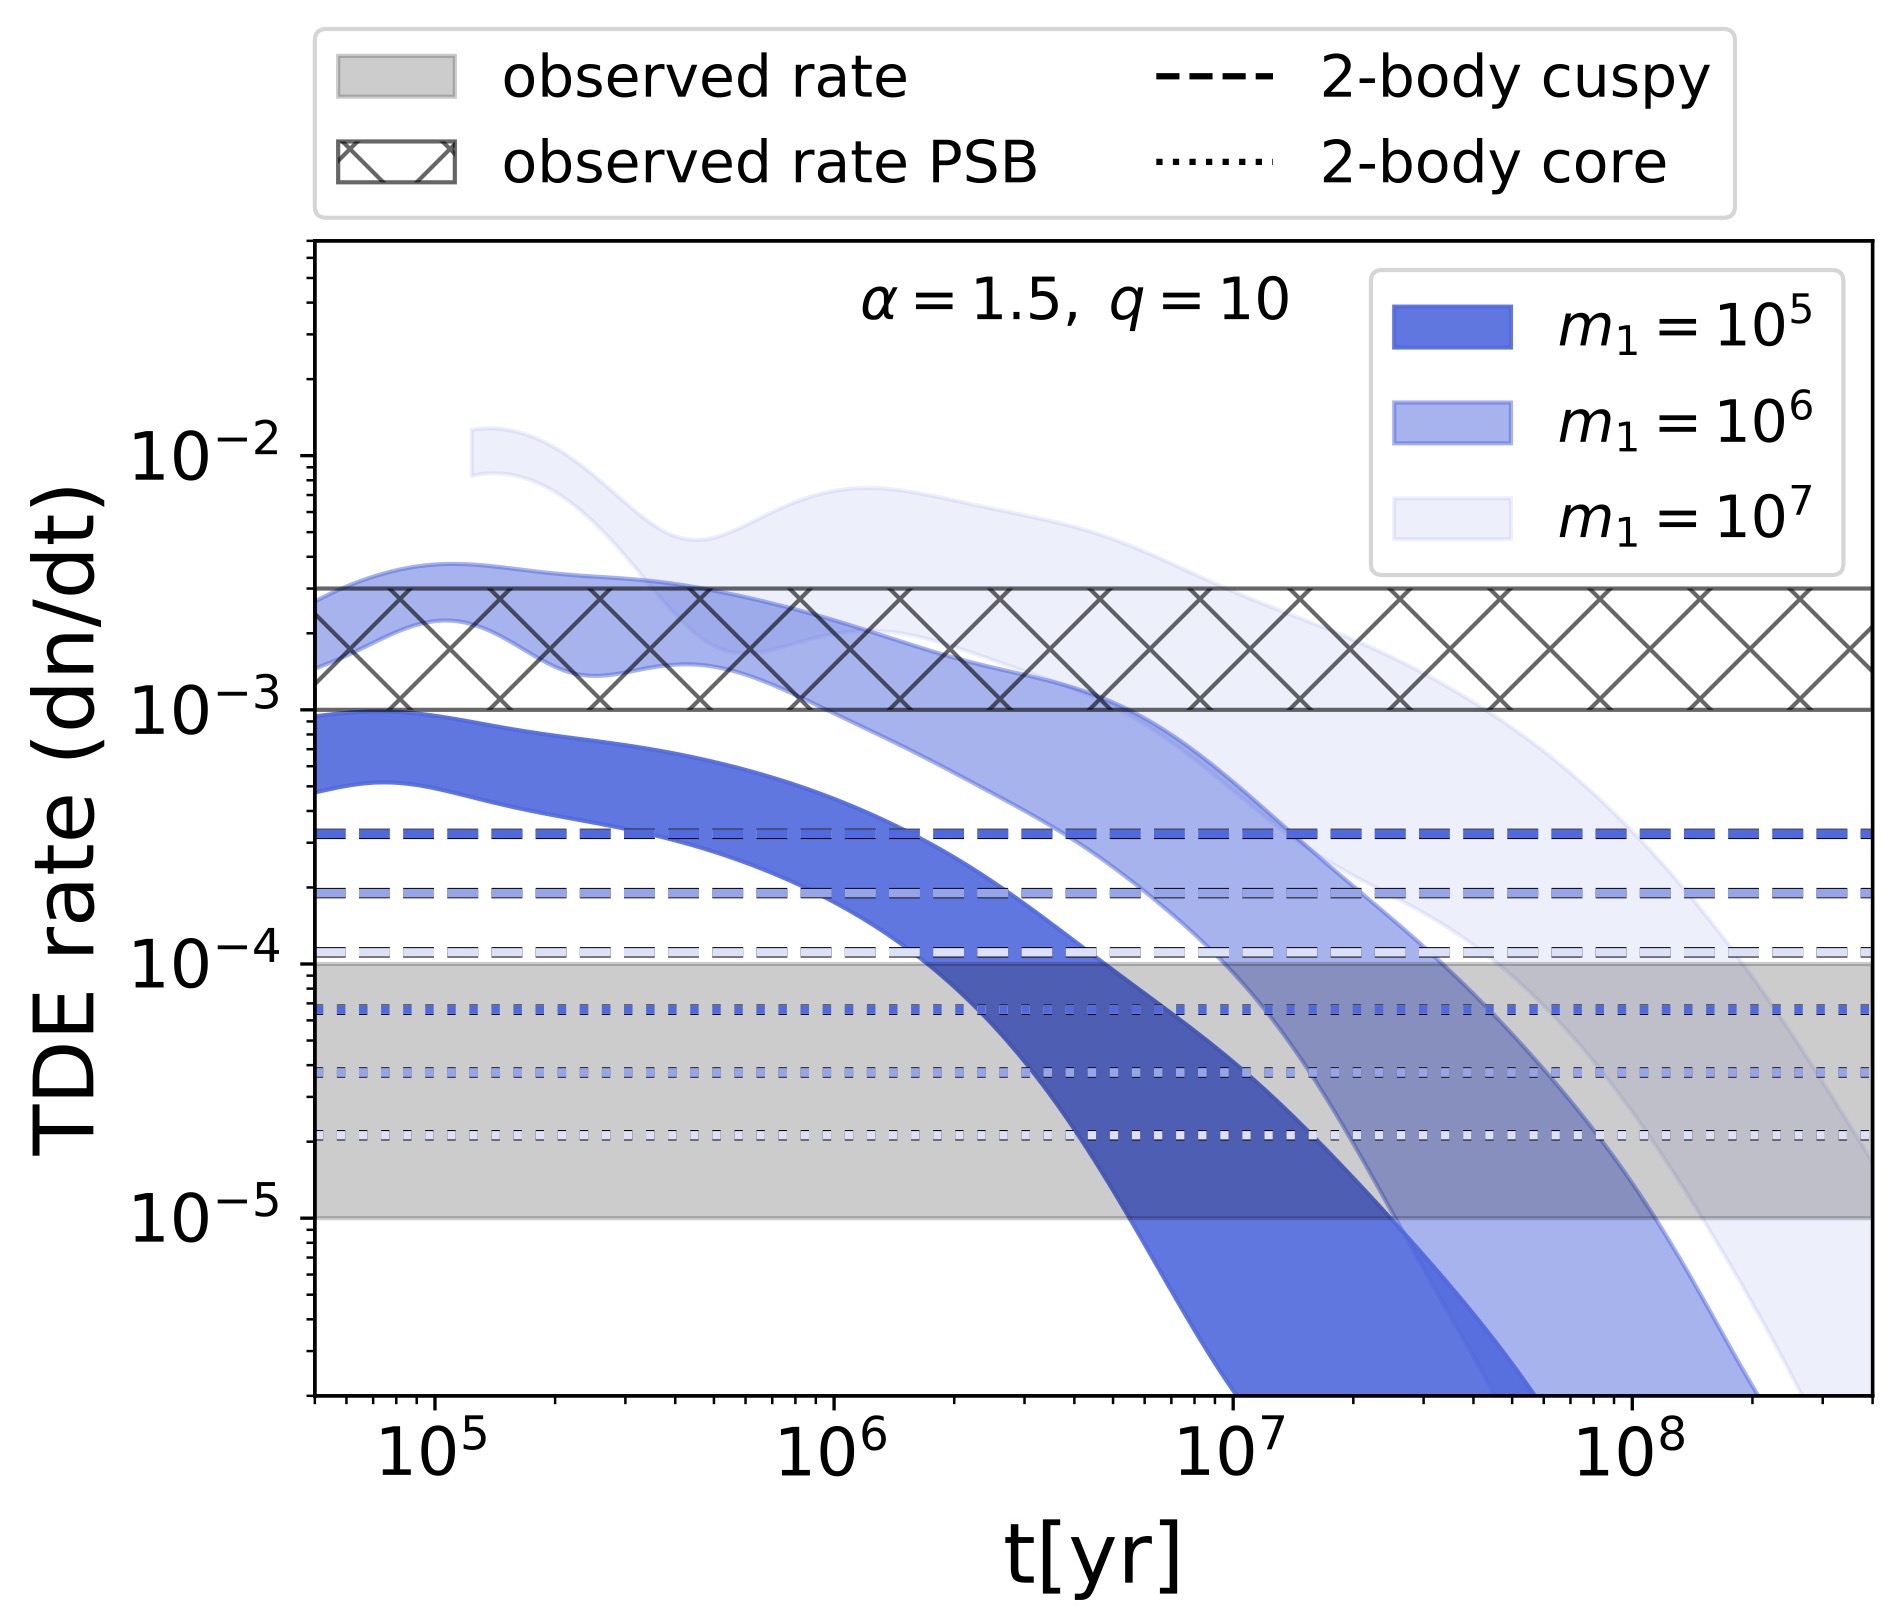
Figure 2: Rate of tidal disruption events occurring around the smaller supermassive black hole as a function of time in the simulations. The shaded blue regions represent different masses of the smaller supermassive black hole, each of which is 10 times less massive than the larger supermassive black hole. The shaded grey region shows the observed rate of optically selected tidal disruption events, and the grey hashed region denotes the rate of tidal disruption events in “post-starburst” (PSB) galaxies (galaxies seen about a few millions of years after a recent burst of star formation, which is often driven by a merger). Finally, the dashed and dotted lines show the rates of tidal disruption events from two-body relaxation (i.e., ordinary tidal disruption events around a single supermassive black hole). The simulations show a burst of tidal disruption events relative to the two-body relaxation rate for the first 1–100 million years. [Adapted from Mockler et al. 2023]
Finding Supermassive Black Hole Binaries with Tidal Disruption Events
To end, the authors leave us with a potential way to search for supermassive black hole binaries using these tidal disruption events. This method relies upon the fact that the two black holes in the binary will dominate two different observable properties. On one hand, the gravitational potential of the galactic nucleus where these two black holes reside will be dominated by the larger of the two black holes, meaning that host galaxy properties that scale with the galaxy’s central black hole mass will be set by this larger black hole. On the other hand, the light curve from a given tidal disruption event is set by the mass of the black hole that the star is accreting onto, which in this case is the smaller black hole. This means that if we see a tidal disruption event that seems to be coming from a small black hole, but it’s actually happening in a galaxy that’s far too big to host such a black hole, then there’s strong evidence that this could be a supermassive black hole binary system! And so, while three may be a crowd, this unlucky star will actually shed some light on its black hole companions as it leaves the party.
Original astrobite edited by Mark Dodici.
About the author, Megan Masterson:
I’m a 3rd-year PhD student at MIT studying transient accretion events around supermassive black holes, including tidal disruption events and changing-look active galactic nuclei. I primarily use X-ray observations to observe the inner accretion flow of these transients, but I am also interested in multi-wavelength follow-up to get the full picture of these fascinating systems. In my free time, I enjoy hiking and watching soccer.
The post Three’s a Crowd for Stars Around Supermassive Black Hole Binaries appeared first on AAS Nova.
]]>
Globular clusters help researchers disentangle the formation history of an unusually diffuse galaxy.
The post Featured Image: Reading a Galaxy’s History from Its Globular Clusters appeared first on AAS Nova.
]]>Ultra-diffuse galaxies are as large as the Milky Way but contain only a smattering of stars and gas, scarcely enough to fill a dwarf galaxy. Observations suggest that these oddly faint galaxies are common, leaving astronomers puzzling over how they form. To disentangle the history of the ultra-diffuse galaxy UGC 9050-Dw1, Catherine Fielder (Steward Observatory) and collaborators tracked down its globular clusters: spherical collections of hundreds of thousands of stars that can hold clues to a galaxy’s star formation and merger history. The team identified 52 globular clusters (cyan circles) in new observations from the Hubble Space Telescope, shown above. This is an exceptionally large number of globular clusters for a galaxy of UGC 9050-Dw1’s brightness; 20% of the galaxy’s light comes from globular clusters! The clusters are all roughly the same color, which suggests that they are composed of stars of the same age and metallicity. This hints that UGC 9050-Dw1’s globular clusters formed in a single burst of star formation, which could have been triggered by a merger. Fielder and collaborators favor the merger of dwarf galaxies as an explanation for UGC 9050-Dw1’s unusual properties, adding yet another possible formation mechanism for ultra-diffuse galaxies to the list. To learn more, be sure to check out the full research article linked below.
Citation
“The Disturbed and Globular-Cluster-Rich Ultradiffuse Galaxy UGC 9050-Dw1,” Catherine E. Fielder et al 2023 ApJL 954 L39. doi:10.3847/2041-8213/acf0c3
The post Featured Image: Reading a Galaxy’s History from Its Globular Clusters appeared first on AAS Nova.
]]>
Galaxies in the early universe were mostly pure hydrogen. How, then, did one end up with so much metal just a billion years after the Big Bang?
The post Metal Before It Was Cool: Super-Enrichment in the Early Universe appeared first on AAS Nova.
]]>Astronomers have long known that the universe has grown more metallic over time: in its younger, purer days, it was composed almost entirely of hydrogen and helium. Recently, however, researchers discovered a galaxy that was notably ahead of the trend and had already amassed a high metal content only a billion years after the Big Bang.
Building Starstuff
Nearly all of the atoms heavier than helium began their lives in a star, the forges of the cosmos responsible for crushing primordial materials into the rich array of elements we see today. These forges run day and night, constantly churning through the universe’s finite supply of hydrogen and helium. Consequently, the overall budget of hydrogen goes down over time, while the proportion of heavier elements (which astronomers call “metals,” regardless of their actual metallic properties) grows. When astronomers look back in time and observe the high-redshift universe, they expect to find mostly pure hydrogen and helium, unpolluted by the starstuff that makes up rocks and people and telescopes.
This prediction usually stands up to observations, and when looking at galaxies with redshifts beyond z = 4 (those born in the first roughly 1.5 billion years after the Big Bang), researchers most often observe clouds of gas with barely any metals. However, a collaboration led by Jianghao Huyan, University of South Carolina, recently discovered a surprising contradiction to this harmonious agreement: their observations of hazy galaxy at z = 4.7 revealed a metal fraction more than two orders of magnitude above the prediction for such a young source.
Mystery Metals

Zoomed-in regions of the measured spectrum centered on different metal absorption lines. The red curve represents the best-fitting model spectrum, while the black histogram is shows their data. [Huyan et al. 2023]
They found that the galaxy possessed a substantial amount of carbon, oxygen, magnesium, and other heavy elements. In fact, just 1.2 billion years after the Big Bang, this galaxy already had a higher relative amount of carbon and oxygen than our own Sun that was born many billions of years later. This was a startling find: models of early galaxy formation expect a significantly smaller fraction of metals, even when accounting for the large uncertainties about the behavior of theorized-but-not-yet-seen first-generation stars.

Previous measurements and predictions of galaxy metallicity as a function of redshift. The galaxy in question here is marked as the pink triangle that lies far above the model curve. Click to enlarge. [Huyan et al. 2023]
Citation
“Discovery of Super-enriched Gas ∼1 Gyr after the Big Bang,” Jianghao Huyan et al 2023 ApJL 954 L19. doi:10.3847/2041-8213/aceefe
The post Metal Before It Was Cool: Super-Enrichment in the Early Universe appeared first on AAS Nova.
]]>
If dark matter and normal matter could interact, it could ease the emerging tension between measurements of how smooth or clumpy the distribution of matter is in our universe.
The post Could Interacting Dark Matter Solve a Problem with Our Models of the Universe? appeared first on AAS Nova.
]]>Dark matter, which makes up 85% of the matter in the universe, is thought to interact with normal matter only through gravity. If dark matter and normal matter could interact through collisions, what would that mean for our models of the universe?

Measurements of S8 made from the fluctuations in the cosmic microwave background radiation (top) and the distribution of nearby galaxies (bottom) do not agree. [Top: ESA and the Planck Collaboration; Bottom: M. Blanton and the Sloan Digital Sky Survey]
Clumpiness in Conflict
Our best cosmological model, called lambda-CDM, describes a universe dominated by dark energy, dark matter, and normal matter, in that order. Lambda-CDM has weathered many challenges, but a couple of nagging disagreements have prompted some researchers to propose tweaks or outright rewrites of this leading theory of cosmology.
The first and most famous issue is the Hubble tension: the disagreement between different methods of measuring the expansion rate of the universe. The second issue, and the subject of today’s article, has to do with how clumpy or uniform matter is in our universe. The “clumpiness” parameter, called S8, measured in the nearby universe from observations of galaxy clusters is smaller than what we measure in the distant universe from the cosmic microwave background radiation — the oldest light in the universe, hearkening back to just 380,000 years after the Big Bang. In an attempt to relieve this tension, researchers have explored the effects of loosening one of our fundamental assumptions about dark matter.
Dark Matter Can Have a Little Interaction, as a Treat
In the lambda-CDM model, dark matter is only capable of interacting with normal matter through gravity. This means that dark matter can’t bump into normal matter; a dark-matter particle cruising through your body would have no effect at all. In a recent research article, a team led by Adam He (University of Southern California) suggested that tweaking this property of dark matter could solve our problems with the S8 tension.

Posterior distributions resulting from different data combinations under the interacting dark matter (IDM) model. [He et al. 2023]
A Preference for Interacting Dark Matter?
When the team looped in data from the Planck spacecraft, which measured the cosmic microwave background radiation, and the Dark Energy Survey, which has mapped the locations of hundreds of millions of galaxies, they found that the data actually slightly lean toward a scenario in which dark matter and normal matter lightly interact.

Commissioning images from the Euclid space telescope. [ESA/Euclid/Euclid Consortium/NASA; CC BY-SA 3.0 IGO]
Citation
“S8 Tension in the Context of Dark Matter–Baryon Scattering,” Adam He et al 2023 ApJL 954 L8. doi:10.3847/2041-8213/acdb63
The post Could Interacting Dark Matter Solve a Problem with Our Models of the Universe? appeared first on AAS Nova.
]]>
Astrobites reports on a new study of the Dragonfly pulsar wind nebula — a possible source of particles with energies up to a quadrillion electronvolts!
The post Looking for a Dragonfly in the Sky appeared first on AAS Nova.
]]>Editor’s Note: Astrobites is a graduate-student-run organization that digests astrophysical literature for undergraduate students. As part of the partnership between the AAS and astrobites, we occasionally repost astrobites content here at AAS Nova. We hope you enjoy this post from astrobites; the original can be viewed at astrobites.org.
Title: Hard X-ray Observation and Multiwavelength Study of the PeVatron Candidate Pulsar Wind Nebula “Dragonfly”
Authors: Jooyun Woo et al.
First Author’s Institution: Columbia Astrophysics Laboratory
Status: Published in ApJ
Pulsar Wind Nebulae: Little Space Animals
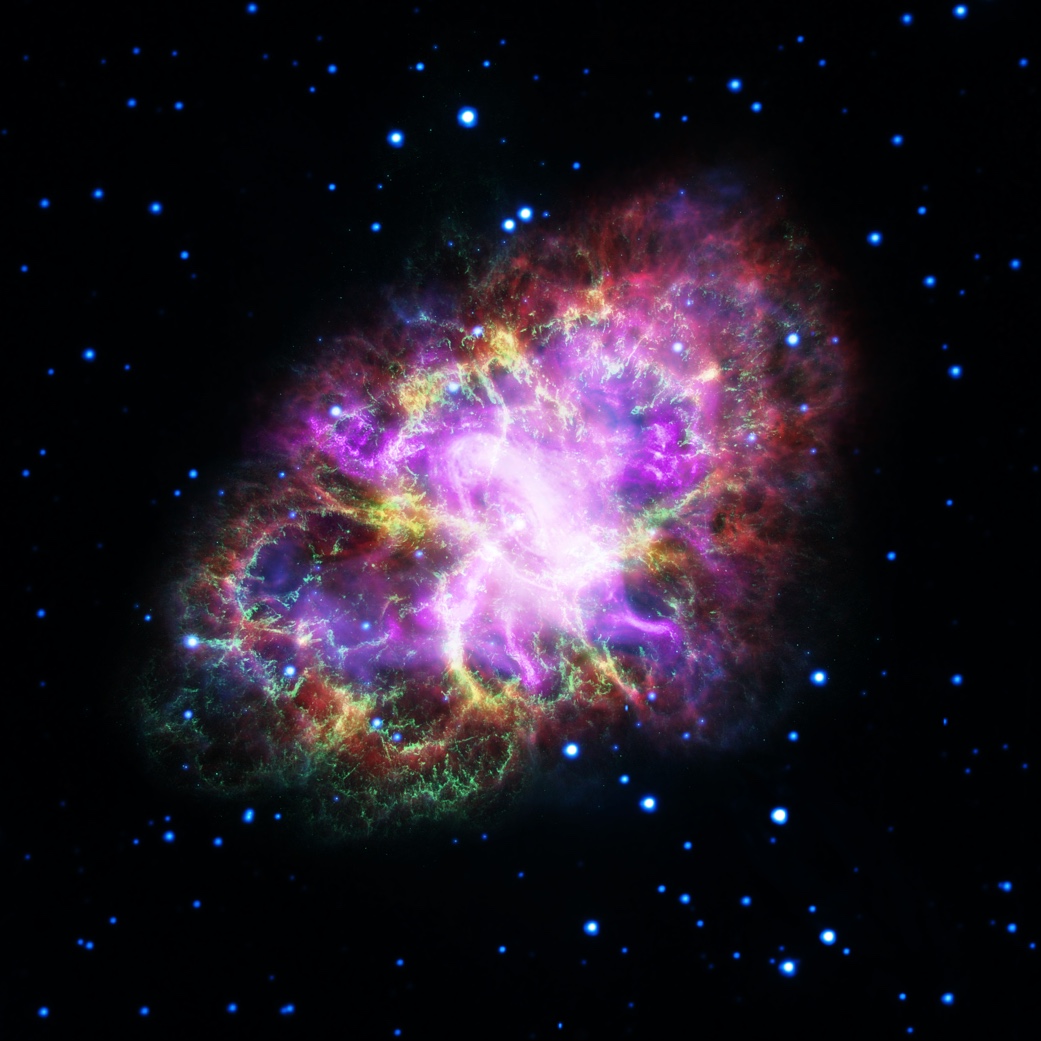
Figure 1: A multi-wavelength view of the Crab Nebula that shows the X-rays from the pulsar wind nebula (pinkish-white region at the center). [NASA, ESA, NRAO/AUI/NSF and G. Dubner (University of Buenos Aires)]
The Crab Nebula isn’t the only pulsar wind nebula with a fun nickname; in fact, most of these nebulae and their associated supernova remnants are named after animals that they (very) vaguely resemble. There’s the Mouse, the Goose, and the Kookaburra, just to name a few — and of course, the topic of today’s article, the Dragonfly (see Figure 2). Besides slightly resembling animals, pulsar wind nebulae are also thought to produce the highest-energy particles we detect on Earth. A new catalog of the highest-energy gamma-rays ever seen (see this bite) either links or tentatively associates many of these energetic systems with pulsars or pulsar wind nebulae.
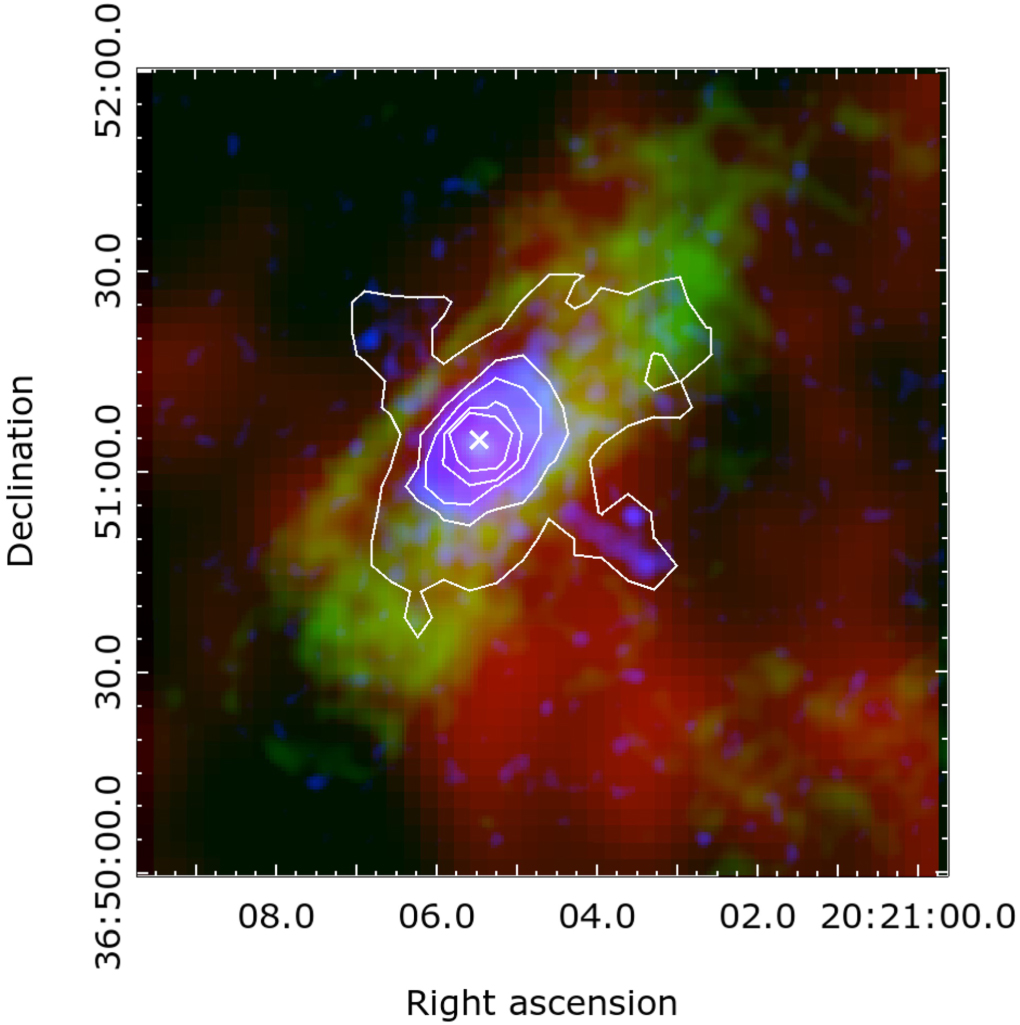
Figure 2: Radio (colour) and X-ray (contours) image of the Dragonfly pulsar wind nebula. Doesn’t it sort of look like a dragonfly? [Jin et al. 2023]
Looking for the Dragonfly with All Sorts of Different (Wavelength) Eyes!
The authors of today’s article investigate the Dragonfly with multiple different telescopes that detect light across the electromagnetic spectrum to get a full picture of what’s going on with the particles accelerated in and around the nebula. The authors model the multi-wavelength emission to try to figure out if the Dragonfly is capable of accelerating particles (electrons, protons, and other things) up to petaelectronvolt (PeV; that’s a quadrillion electronvolts!) energies that then interact to make gamma rays, which would classify it as a PeVatron (a name that aptly describes any astronomical source that can accelerate particles up to PeV energies). We detect the highest-energy charged cosmic rays up to PeV energies, but we haven’t seen too many sources that emit gamma rays at these energies due to instrumental limitations and other things like photon absorption. Since cosmic rays (usually protons) get deviated in their travels to Earth by the swirling magnetic fields of the Milky Way, we need to search for neutral particles of similar energies, like photons (i.e., gamma rays) to find PeVatrons, since they trace a straight line back from the particle to its source.
Using model fitting, the authors can create and evolve a pulsar and pulsar wind nebula to match the observed data, which gives them information like the nebular age, the expected shape of the nebula’s emission, and whether or not it can be a PeVatron, among many other interesting clues that help narrow down what’s going on with the particles and material in this system.
In particular, one interesting thing the authors notice is that the shape of the Dragonfly is long and asymmetric in soft X-ray wavelengths (and potentially in other wavelengths, but it’s hard to say due to much coarser angular resolution; see Figure 3b). Usually we’d expect to see a more spherical shape, so the explanation for this could be that the pulsar that’s powering the nebula is zooming through space at an unusually high speed or, more likely, that the nebula lives within a supernova remnant that hasn’t been seen yet. The interaction of particles from the pulsar wind nebula with the supernova remnant can cause some funky shapes to appear in the surrounding material. The authors suggest that looking at the Dragonfly with a long exposure in radio wavelengths might be able to pick up signs of a supernova remnant that are overwhelmed in other wavelengths by the bright pulsar wind nebula to confirm this scenario.
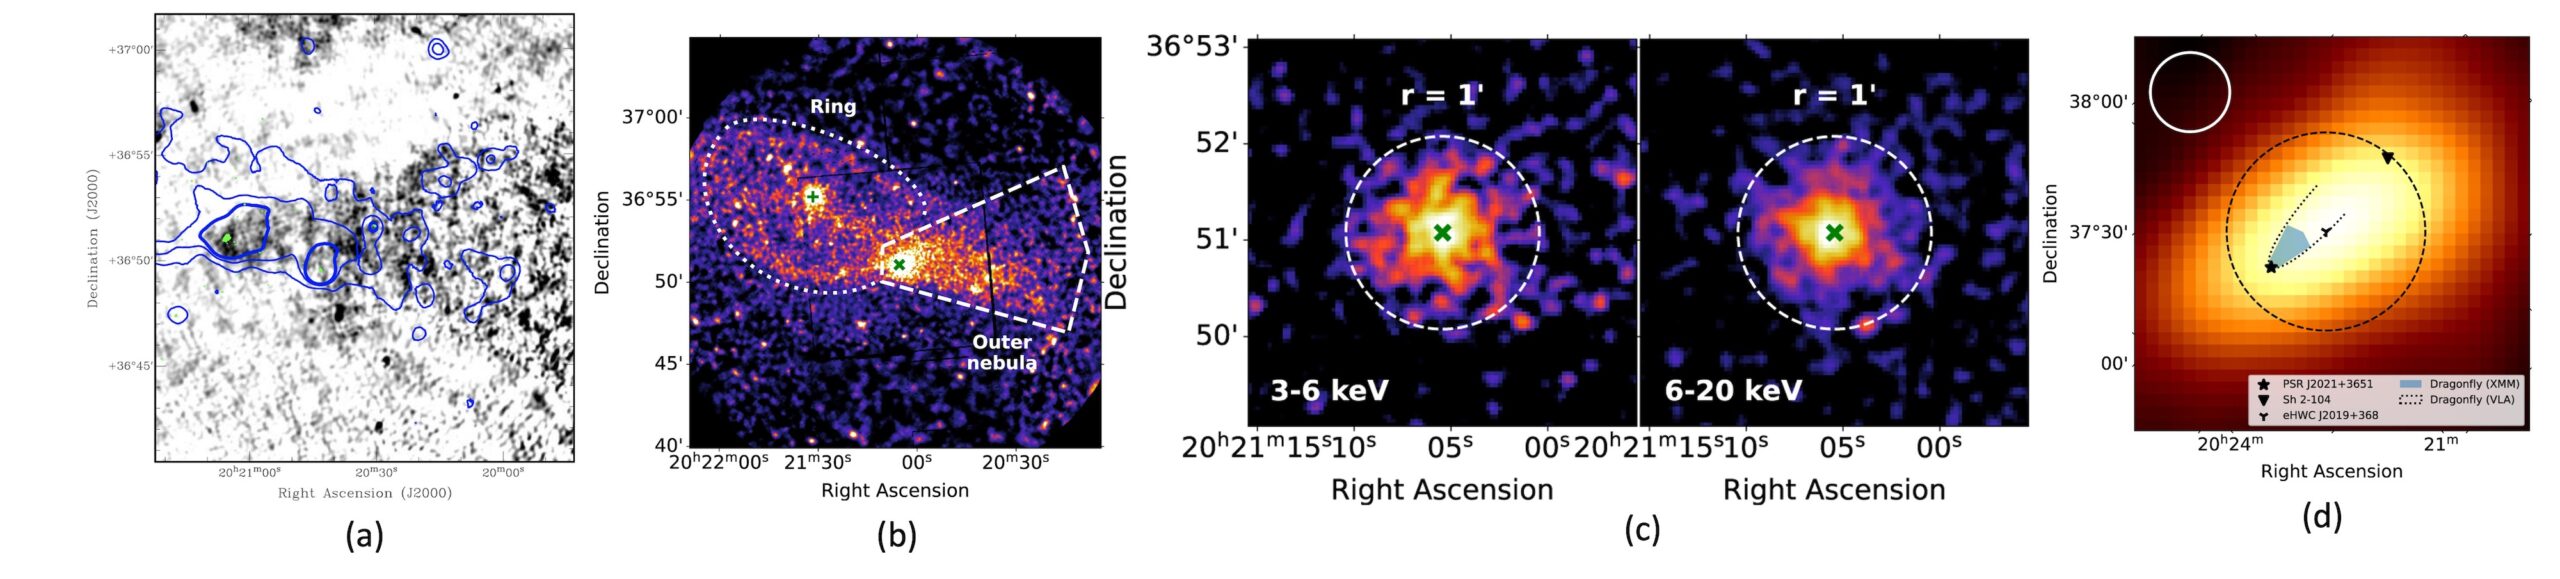
Figure 3: The observed shape of the Dragonfly in a) radio, b) soft X-ray, c) hard X-ray, and d) very-high-energy gamma rays with X-ray contours in blue. The star or X in each figure marks the pulsar location. [Adapted from Woo et al. 2023]
Maybe a PeVatron? We’ll Have to Wait and See!
There’s still more work to do to figure out if we can actually see gamma rays at energies beyond a PeV from the Dragonfly and to figure out how particles are being transported around the nebula to get the weird asymmetric shape that today’s authors observed. More observations using existing radio, X-ray, and other instruments as well as future ultra-high-energy gamma-ray telescopes (like SWGO and CTAO-South) can help answer these questions and help us get an even more full picture of the Dragonfly.
Original astrobite edited by Lucie Rowland.
About the author, Samantha Wong:
I’m a graduate student at McGill University, where I study high energy astrophysics. This includes studying all sorts of extreme environments in the universe like active galactic nuclei, pulsars, and supernova remnants with the VERITAS gamma-ray telescope.
The post Looking for a Dragonfly in the Sky appeared first on AAS Nova.
]]>
Machine learning is increasingly popular in many fields of science, including astrophysics. Today's post takes a look at how machine-learning techniques have been used in three research areas.
The post Spotlight on Machine Learning in Astrophysics appeared first on AAS Nova.
]]>To meet the challenges posed by our growing collection of data, researchers have devised increasingly sophisticated computing techniques. Today, we’re taking a look at three ways machine-learning techniques have been applied to astrophysical data.
Machine Learning in the Spotlight
Machine learning is a term that describes a collection of techniques in which computers explore data and develop their own algorithms. In astrophysics research, this often takes the form of training computers on a set of known inputs and outputs before introducing data from outside the training set and allowing the computer to derive outputs for those data. For example, researchers could train an algorithm using a set of stellar spectra coupled with known properties of those stars (e.g., spectral type, age, metallicity) and then use the resulting algorithm to classify other stars based on their spectra.
Machine learning and other artificial intelligence techniques are increasingly popular in many fields of science. Here we take a brief look at three recent research articles that describe how machine learning can help us model planet-forming disks, compare observations from different telescopes, and detect fleeting cosmic events.
A Rapid Disk Predictor
A team led by Shunyuan Mao (毛顺元) from the University of Victoria used an artificial neural network to model the interactions between planets and the disks of gas and dust they form in. Planet-forming disks show a wide variety of structures, such as rings and spiral arms, that appear to be linked to the presence, movement, and growth of young planets. By modeling these features, researchers can determine the properties of the planets embedded in protoplanetary disks, but the process can take hours of computing time. Luckily, machine learning appears to offer an easier, faster way to model these disks.

One example of PPDONet’s performance, showing the actual (blue) and predicted (red) density profile of a gap in a disk. [Mao et al. 2023]
Matching Images Between Spacecraft
Researchers wanting to predict solar flares, coronal mass ejections, and other forms of solar activity often base their predictions on images of the Sun taken at extreme-ultraviolet wavelengths. Thanks to spacecraft like the Solar Dynamics Observatory (SDO) and the Solar and Heliospheric Observatory (SOHO), we have decades of solar images to work with, but the differences between telescopes can make it challenging to combine data from different sources into a single prediction — when different observations have different fields of view, spatial and temporal resolution, and noise levels, it’s hard to compare apples to apples.

Demonstration of the different fields of view and spatial resolution of SOHO (left) and SDO (right). [Chatterjee et al. 2023]
A Faster Way to Track Down Transients

Example of the transient search process. The template image (left) is subtracted from the search image (center), resulting in a difference image (right) that clearly shows a transient source. Click to enlarge. [Adapted from Acero-Cuellar et al. 2023]
Using data from the Dark Energy Survey, Acero-Cuellar’s team constructed two neural networks to test the possibility of eliminating the difference image altogether. Using one neural network that was trained to use all three images and one that was trained to use all but the difference image, the team found that eliminating the difference image does reduce the network’s ability to identify transients, but only slightly — the accuracy dropped from 96% to 91%. While these neural networks are time-consuming to train, especially when the difference image is not used, putting them into practice requires only a few seconds. This demonstrates the potential for neural networks to eliminate a time-consuming step while retaining a high level of accuracy, which could help us handle the enormous amount of data produced by current and upcoming surveys.
Citation
“PPDONet: Deep Operator Networks for Fast Prediction of Steady-state Solutions in Disk–Planet Systems,” Shunyuan Mao et al 2023 ApJL 950 L12. doi:10.3847/2041-8213/acd77f
“Homogenizing SOHO/EIT and SDO/AIA 171 Å Images: A Deep-learning Approach,” Subhamoy Chatterjee et al 2023 ApJS 268 33. doi:10.3847/1538-4365/ace9d7
“What’s the Difference? The Potential for Convolutional Neural Networks for Transient Detection without Template Subtraction,” Tatiana Acero-Cuellar et al 2023 AJ 166 115. doi:10.3847/1538-3881/ace9d8
The post Spotlight on Machine Learning in Astrophysics appeared first on AAS Nova.
]]>
Day 4 of the meeting brought an overview of Hubble observations of the giant planets and a debate about the presence of liquid water beneath Mars's south polar deposits.
The post DPS–EPSC 2023: Day 4 appeared first on AAS Nova.
]]>Editor’s Note: This week we’ll be writing updates on selected events at the 55th Division for Planetary Sciences (DPS) meeting, held jointly with the Europlanet Science Congress (EPSC) in San Antonio, Texas, and online. The usual posting schedule for AAS Nova will resume on October 9th.
Table of Contents:
- Alexander Prize Lecture: Results from Monitoring the Giant Planets with Hubble (Amy Simon)
- Round Table Discussion: The Search for Liquid Water beneath the Martian South Polar Layered Deposits (Roberto Orosei, David Stillman, Ali Bramson, and Jack Holt)
Alexander Prize Lecture: Results from Monitoring the Giant Planets with Hubble (Amy Simon)
The Claudia J. Alexander Prize is awarded to a mid-career planetary scientist “who has made and continues to make outstanding contributions that have significantly advanced our knowledge of planetary systems, including our solar system.” This year’s award went to Amy Simon (NASA Goddard Space Flight Center), who described in today’s plenary lecture an ongoing Hubble Space Telescope program to monitor the four giant planets in our solar system.

Illustration of the inconsistent observing history of the giant planets. Click to enlarge. [Slide by Amy Simon]
The solution? The Outer Planet Atmospheres Legacy (OPAL) program, which began in 2014 and continues to monitor each of the four giant planets on an annual basis using the Hubble Space Telescope. Each year, Hubble monitors the four planets through two planetary rotations, and the data become immediately available to the public, with the global maps having a dedicated page on the Hubble archive. These observations have allowed us to study storms on Saturn, Saturn’s color changes and changes to its north polar hexagon, the evolution of polar hazes on Uranus, the emergence of new dark spots on Neptune, and much more.

Infrared images of the outer planets from JWST. Click to enlarge. [Slide by Amy Simon]
Round Table Discussion: The Search for Liquid Water Beneath the Martian South Polar Layered Deposits (Roberto Orosei, David Stillman, Ali Bramson, and Jack Holt)
The final plenary session of the meeting was a discussion of an ongoing debate in the planetary science community: whether radar observations show the presence of liquid water beneath Mars’s south polar ice cap. Numerous research articles have argued both sides of the issue, and today four scientists presented their arguments before opening the floor to discussion.
First, a quick primer on the technique used to make the contested measurements. The supposed detection of liquid water was made using radar subsurface sounding, which can peer beneath the surface of a planet. The radar signal is reflected when the electric permittivity (related to how a material responds when exposed to an electric field) changes, such as where a layer of rock meets a layer of ice. How long it takes the signal to return and the brightness of the return signal can be used to map the layers below the surface.
Roberto Orosei (Italian National Institute of Astrophysics) and David Stillman (Southwest Research Institute) presented their evidence for the presence of liquid water first. They noted that the larger the contrast in permittivity of two materials, the stronger the radar reflection will be at their interface. Water or brine (a mixture of water and salts) has a permittivity around 80, while dry materials like rock have permittivities in the 3–15 range. Mixing water into other materials, such as Martian surface material or regolith, also causes a sharp increase in permittivity.

Example subsurface radar echo. [From slide by Roberto Orosei]
Orosei and Stillman addressed four common rebuttals of their argument:
- It is too cold beneath the polar deposits for water or brines to be liquid … but brines can be liquid down to 197K, which could be cool enough for them to be liquid in the extreme cold beneath the polar cap, according to the weakening of the radar signal that suggests temperatures below 230K.
- Geologic evidence doesn’t support the presence of a body of water, and the bright radar reflections don’t overlap with the expected locations of lakes … but our data don’t have fine enough vertical resolution to truly determine where lakes should be located beneath the glacier, and the surface features are consistent with what we see above subglacial lakes on Earth.
- Other materials like clays, saline ices, hematite, and smectites can have equally bright radar reflections … but measurements of the permittivities of some of these materials at cold, Mars-like temperatures are too low to explain the bright reflections, and you’d need an unreasonably large amount of hematite to create a similar radar echo. Radar echoes from dense basalts are a possibility.
- The echoes could be an electromagnetic artifact … but looking at raw data or frequency-dependent behavior should rule out this possibility, and the team doesn’t claim that every single bright radar echo is evidence of water.
Next, Ali Bramson (Purdue University) and Jack Holt (University of Arizona Lunar and Planetary Laboratory) took to the stage to present their arguments. First, Bramson outlined how much heat it would take (in the form of geothermal energy radiating out of Mars’s surface) for liquid water to be present beneath the north polar region. The expected heat flux is 10–30 milliwatts per square meter, which could bring temperatures up to 170K, but liquid water with a melting point of 273K would require at least 200 milliwatts per square meter. Even with salts mixed in to the ice, the melting point hovers around 200K, which still requires an increased amount of heating. Bramson and collaborators investigated possible ways to increase the geothermal heat flux, settling on magmatic activity within the past few hundred thousand years as a possibility. However, past magmatic activity is likely to be ancient, and most signs of “recent” volcanism are located near Mars’s equator, not its poles.
Holt introduced multiple different objections to the liquid water hypothesis, starting with the lack of geological evidence. Subglacial lakes on Earth are overlain by layers that have “drawn down” over time as layers above the lake undergo melting, but there’s no evidence of this drawing down on Mars. Similarly, there are no springs present due to flowing water. Holt pointed out that there are many bright radar echoes in the south polar layered deposits, some of which are located close to the edge where the ground is less insulated and temperatures are far too cold for even fully saturated brines to be liquid. Past research has also suggested that if the entirety of Mars were covered with layered deposits as seen at the south pole, much of the planet would have similarly bright radar echoes without the need for liquid.

SHARAD observation of a weak radar echo using new technique. [Slide by Jack Holt]
The post DPS–EPSC 2023: Day 4 appeared first on AAS Nova.
]]>
On day 3, presenters tackled machine-learning challenges, icy planets and moons were scrutinized, and solar system images from JWST stole the show.
The post DPS–EPSC 2023: Day 3 appeared first on AAS Nova.
]]>Editor’s Note: This week we’ll be writing updates on selected events at the 55th Division for Planetary Sciences (DPS) meeting, held jointly with the Europlanet Science Congress (EPSC) in San Antonio, Texas, and online. The usual posting schedule for AAS Nova will resume on October 9th.
Table of Contents:
- New Solar System Discoveries from the JWST (Stefanie Milam, Lee Fletcher, and Anna Carolina Souza-Feliciano)
- Arm in Arm: Allies in Adversity (Robert Salcido Jr.)
- Press Conference (Lynnae Quick, Jon Zink, Pietro Matteoni, and Gordon Kai Hou Yip)
New Solar System Discoveries from the JWST (by Ben Cassese)
Though JWST was initially conceived to tackle questions involving galaxies, cosmology, and the grand scale of our universe, it has proved a wonderful tool for the planetary sciences as well. One of the plenary sessions on Wednesday was dedicated to advances in our understanding of the solar system enabled by this new observatory, and it was split between three speakers.
First up was Stefanie Milam, the JWST Deputy Project Scientist for Planetary Science, who gave an overview of the investigations already underway with the latest flagship space telescope. Beyond our solar system, JWST has broken records in nearly every subfield of astronomy: it discovered and confirmed the most distant galaxy known to date, revealed an entirely new type of object in the Trapezium Cluster, and imaged rings of protoplanetary disks that had previously gone unseen in the glare of their host stars. Closer to home, it has collected the most detailed spectra of comets ever recorded, detected water vapor around a main belt comet for the first time, and provided never-before-seen views of the planets and their moons. These solar system observations are particularly impressive from a technical standpoint, since they required the ungainly assembly of mirrors and sunshades to move rapidly in order to stay focused on objects as they (and it) move around the Sun. As recently as a decade ago, the JWST science team was told that the telescope would not be able to observe something as bright, extended, and fast as Mars. Thanks to the advocacy of the scientists, the ingenuity of the engineers, and the skill of the project managers, JWST has already out-performed these assumed limitations.

Images of the giant planets taken with JWST. [Slide by Lee Fletcher]

Spectra of Sedna, Gonggong, and Quaoar collected by JWST. [Slide by Ana Carolina de Souza Feliciano]
Arm in Arm: Allies in Adversity (Robert Salcido Jr.) (by Kerry Hensley)
In the final plenary presentation of the day, the Executive Director for the Pride Center San Antonio, Robert Salcido Jr., described the challenges facing the LGBTQ+ community of San Antonio, where the DPS–EPSC conference is being held. The Pride Center serves as a hub for the community and offers free counseling, case management, and group therapy, filling a need for mental health services.

Comparison of Kaiser adverse childhood experience scale results for American adults and LGBTQ+ adults in San Antonio. Click to enlarge. [Slide by Robert Salcido Jr.]
Additionally, the survey revealed ongoing challenges faced by the LGBTQ+ community in San Antonio, especially in healthcare settings; 1 in 10 of the adults surveyed didn’t know where to access affordable or appropriate healthcare, and that number rose to 1 in 4 for transgender respondents. These responses underscored the need for better healthcare — both physical and mental — and was used to inform the structure of the clinical practice at the Pride Center.
Zooming out to look at Texas as a whole, Salcido notes that the state is a “hotbed” for attacks against the LGBTQ+ community. In 2023, about 600 bills were filed statewide that aimed to restrict the rights of people who identify as LGBTQ+, especially when it comes to gender-affirming care. Compare this to 2013, when just 20 bills were filed, none of which passed. In 2021, this rose to 76 filed bills, one of which passed, and in the most recent legislative session, 141 bills were filed. These bills targeted the use of puberty blockers for trans kids, banned trans athletes from competing at the collegiate level, and banned drag shows, to name just a few. In other words, bills are being filed in Texas that seek to exclude transgender people from everyday life — despite the fact that a recent survey from the Trevor Project found that 71% of Texans support the LGBTQ+ community.
Salcido ended his talk by prompting the audience to think about what it means to be an ally in your profession, for your friends, and for your family. Ally isn’t just a noun, it’s also a verb, and action is important — but it may not look the same for everyone. What’s important is showing up in support of communities to which you don’t belong: advocating for LGBTQ+ people, standing against oppression, acknowledging one’s own prejudices, and working to understand what matters to people within the community.
Press Conference (Briefing video) (by Kerry Hensley)
Lynnae Quick (NASA Goddard Space Flight Center) started off the press conference with a presentation on icy ocean exoplanets. Previous research has suggested that Earth-sized terrestrial exoplanets are likely to be ice covered and have subsurface oceans. If these frosty worlds are heated, either through tidal stresses or the decay of radioactive materials, they could be a promising place to look for life beyond Earth. In a new study, Quick and collaborators investigated 17 Earth-sized exoplanets thought to be icy worlds with subsurface ocean. The list of planets includes well-known planets like the outer planets of the TRAPPIST-1 system as well as Proxima Centauri b. Quick’s team constrained the tidal and radiogenic heating rates of these planets, many of which had heating rates greater than Europa and Io. Since Europa and Io are both thought to have subsurface oceans, this suggests that these planets have subsurface oceans as well.

Ice shell thicknesses of some of the exoplanets observed in this study compared to Earth and Europa. Click to enlarge. [Slide by Lynnae Quick]
Jon Zink (California Institute of Technology) took a wide view of planet formation, beginning with the formation of the Milky Way 13 billion years ago. Even as our galaxy was forming from a cloud of gas, planets were forming, too, and the different stages of galaxy formation may have left an imprint on planets forming at each stage. In the first stage, our galaxy formed a thick disk of stars as core-collapse supernovae exploded, spewing gas rich in alpha elements (e.g., oxygen, silicon, and neon; these elements are important for terrestrial planet formation — Earth is 75% silicon and oxygen) into space. Next, a merger with another galaxy created the galactic halo. After that, the solar system formed and a thin disk of stars was created. Around this time, Type Ia supernovae, which arise in binary systems containing a white dwarf, created an abundance of iron, which is thought to provide the seeds for giant planet formation.

Super-Earth and sub-Neptune exoplanets are less common around stars with large galactic oscillation amplitudes. Click to enlarge. [Slide by Jon Zink]
Pietro Matteoni (Freie Universität Berlin) brought things back to our solar system with a close look at one of the best places to search for life beyond Earth: Jupiter’s moon Europa. Europa has an ice shell, a subsurface ocean, a rocky interior, and a metallic core. Europa is thought to produce plumes of water that carry material from beneath the crust and distribute it on the moon’s surface. However, given the thickness of Europa’s ice shell — likely on the order of kilometers — it’s unlikely that these plumes are carrying material directly from the subsurface ocean. Instead, shallow pockets of water within the ice are probably the source.

Aerial view of the two regions studied. Click to enlarge. [From slide by Pietro Matteoni]
Gordon Kai Hou Yip (University College London) addressed a pressing question: how can artificial intelligence help us answer questions about exoplanet science? Yip is the Principal Investigator of the Ariel Data Challenge, an event that entices machine learning experts to apply their skills to pressing questions in exoplanet science — in particular, how to relate a planet’s spectrum to its atmospheric properties. This is a critical question given the shift in exoplanet research from finding planets to characterizing them, and many upcoming telescopes — like the European Space Agency’s Ariel mission that is slated to launch in 2029 — will return an immense amount of data that we don’t fully know how to handle yet. Enter machine learning: a set of computing techniques in which computers discover their own algorithms, usually being trained on a “known” set of inputs and outputs before applying the algorithms to new inputs.
Yip suggests that solving these problems will require input from experts in many fields, but it can be challenging to bring people with different areas of expertise together; thanks to field-specific jargon, these researchers aren’t even speaking the same language. The Ariel Data Challenge partners with machine-learning conferences and so far has engaged more than 300 researchers around the world. Researchers form teams and develop machine-learning techniques in an attempt to predict atmospheric properties of exoplanets from spectroscopic data. Based on the results of these challenges, Yip’s team has several takeaways: 1) machine-learning models don’t like surprises, and they don’t perform well when given data that’s outside the bounds of the known parameter space — but that’s exactly where upcoming exoplanet missions will take us; 2) money is important to researchers (the winners of the challenge get a monetary prize), but passion for machine learning and the science of exoplanets is a bigger draw for the challenge participants; and 3) physicists are required to win the game — all the winning teams partnered with researchers who had a background in physics. So don’t worry too much about machines replacing astrophysicists — we’re still critical to making exoplanet investigations a success!
The post DPS–EPSC 2023: Day 3 appeared first on AAS Nova.
]]>
Plenary lectures on the second day of the joint AAS Division for Planetary Sciences and Europlanet Science Congress meeting brought insights into small solar system bodies, an asteroid redirection test, and the connection between comets and meteor showers.
The post DPS–EPSC 2023: Day 2 appeared first on AAS Nova.
]]>Editor’s Note: This week we’ll be writing updates on selected events at the 55th Division for Planetary Sciences (DPS) meeting, held jointly with the Europlanet Science Congress (EPSC) in San Antonio, Texas, and online. The usual posting schedule for AAS Nova will resume on October 9th.
Table of Contents:
- Kuiper Prize Lecture: Some Problems and Challenges in the Origin and Evolution of Icy Satellites and Dwarf Planets (William McKinnon)
- Urey Prize Lecture: Exploring Asteroids and Comets with Meteor Science (Quanzhi Ye)
- The Double Asteroid Redirection Test (DART): One Year After Impact (Cristina Thomas)
- Planetary Defense: DART & LICIACube (Elisabetta Dotto)
Kuiper Prize Lecture: Some Problems and Challenges in the Origin and Evolution of Icy Satellites and Dwarf Planets (William McKinnon)

Our best view of Pluto and Charon as of 1994, taken with the Hubble Space Telescope. [Dr. R. Albrecht, ESA/ESO Space Telescope European Coordinating Facility; NASA; CC BY 4.0]
The post-Voyager era brought about the beginning of a lengthy quest to get a mission to Pluto off the ground. That mission, New Horizons, eventually launched in 2006 and flew past Pluto in 2015, the observations exceeding McKinnon’s expectations “by an order of magnitude.” The second major milestone of the mission, a flyby of the Kuiper Belt object Arrokoth, was perhaps even more astounding, giving us the first look at a nearly pristine primordial object left over from the formation of the solar system.
In addition to major missions like New Horizons, the 21st century brought new models to explain how our solar system came to be as it is: the Nice model, which describes how the migration of the giant planets generated structures like the Kuiper Belt and triggered events like the Late Heavy Bombardment; the streaming instability/pebble accretion models, which explain how tiny grains might bulk up into planetesimals and eventually planets; and the great isotopic dichotomy, in which the growth of Jupiter’s core opened a gap in the disk of material in which the planets formed, restricting movement of material across this gap.

Collecting material from the icy satellites of the outer solar system is a missing piece in our sample return collection. Click to enlarge. [Slide by William McKinnon]
Urey Prize Lecture: Exploring Asteroids and Comets with Meteor Science (Quanzhi Ye)
The 2023 Harold C. Urey Prize, awarded annually to an early-career planetary scientist in recognition of their outstanding achievements, went to Quanzhi Ye (University of Maryland) for his studies of asteroids and comets. Humans have kept track of comets and meteor showers for millennia, as evidenced by drawings from more than two thousand years ago. The connection between meteor showers and comets was realized in the 1800s, and as we’ve discovered more and more meteor showers, we’ve needed to develop sophisticated mathematical methods to connect these events to the comets that created them.

Graphic demonstrating how the lack of a meteor shower associated with D/Lexell helped researchers track down the comet’s current location. [Slide by Quanzhi Ye]
Studying the meteors themselves as they streak through Earth’s atmosphere can also help us learn about the objects they came from. For example, the altitude at which a chunk of material becomes luminous as it travels through the atmosphere is related to its material strength; meteorites that become luminous high up have low material strength and tend to come from comets, while those that become luminous lower down have high material strength and tend to come from asteroids. Ultimately, researchers have a wealth of dynamical, compositional, and physical measurements that can be used to study meteor parent bodies, and an expanding global network of telescopes used for meteor studies will provide new opportunities for study as well.
The Double Asteroid Redirection Test (DART): One Year After Impact (Cristina Thomas)
Cristina Thomas (Northern Arizona University) described what we’ve learned from the DART mission in the year since impact. The DART mission’s target was a binary asteroid system consisting of Didymos, which is less than a kilometer in diameter, and its small companion Dimorphos, which is just 150 meters across. The goal of the mission was to crash a spacecraft into Dimorphos, change the orbital period of the binary, measure the change in the orbital period, and then characterize the impact and the impact site. These results can tell us how useful crashing a spacecraft into an oncoming asteroid would be as a planetary defense strategy.

Observations showing how Dimorphos’s orbital period changed as a result of the impact. Click to enlarge. [Slide by Cristina Thomas]
Our studies of the impact of the DART mission are far from over; Thomas notes that there will be another observing campaign in 2024 to study the ongoing evolution of Dimorphos’s orbit, and the European Space Agency’s Hera mission will study the aftermath further. This mission, slated for launch in 2024 and arrival in 2026, will perform a detailed study of Dimorphos, helping us to understand the details of the asteroid-impact technique for planetary defense as well as allowing us to investigate a binary asteroid system.
Planetary Defense: DART & LICIACube (Elisabetta Dotto)

An image of the ejecta plumes from the DART impact. Didymos and Dimorphos are oversaturated in this image, allowing the fainter plumes to be visible. [Slide by Elisabetta Dotto]
The post DPS–EPSC 2023: Day 2 appeared first on AAS Nova.
]]>
We're tuning in to this year's joint meeting of the AAS Division for Planetary Sciences and the Europlanet Science Congress. Check out our summary of plenary sessions and press conferences on Day 1!
The post DPS–EPSC 2023: Day 1 appeared first on AAS Nova.
]]>Editor’s Note: This week we’ll be writing updates on selected events at the 55th Division for Planetary Sciences (DPS) meeting, held jointly with the Europlanet Science Congress (EPSC) in San Antonio, Texas, and online. The usual posting schedule for AAS Nova will resume on October 9th.
Table of Contents:
- Farinella Prize Lecture (Federica Spoto and Diego Turrini)
- BepiColombo en Route to Mercury: Mission Overview and First Results: (Johannes Benkhoff and Anna Mililo)
- Press Conference (Anicia Arredondo, Sonia Fornasier, and Adeene Denton)
Farinella Prize Lecture (Federica Spoto and Diego Turrini) (by Ben Cassese)
The week of science kicked off with a plenary session that was split between award winners and explorers of our innermost planet, Mercury.
First up was Federica Spoto of the Minor Planet Center in Cambridge, Massachusetts. She was one of the two recipients of the 2023 Farinella Prize, an award given to younger planetary scientists active in areas of research that captivated Italian scientist Paolo Farinella before his tragic premature death in 2000. Her presentation detailed recent advances in the last decade in the Minor Planet Center’s ability to disseminate alerts about asteroids about to strike Earth.

The seven asteroids discovered prior to their impact with Earth. [Slide by Federica Spoto]
Up next was the other winner of this year’s Farinella Prize, Diego Turrini of the National Institute for Astrophysics – Turin Astrophysical Observatory. Turrini presented on the recent advances in our understanding of small impactors and the cumulative effects of their tiny craters. Excitingly, this included insights not only from within our own solar system, but also from observations of other, distant solar systems as they form. With the help of the ALMA observatory’s unprecedented sensitivity to dust emission around faraway stars, we are beginning to empirically measure the properties of colliding protoplanets in laboratories beyond our own backyard.
BepiColombo en Route to Mercury: Mission Overview and First Results: (Johannes Benkhoff and Anna Mililo) (by Ben Cassese)
The session concluded with a two-part talk delivered by Johannes Benkhoff and Anna Mililo on the BepiColombo mission to Mercury. Benkhoff was the lead off hitter, and he took his time on the plenary stage to give an overview of the joint European–Japanese mission to the innermost planet. This included a description of the complex, three-part spacecraft, and assembly that consists of a solar-electric powered cruise stage and two separate orbiters that will eventually circle Mercury upon their arrival in December 2025. The whole craft has been operating as expected since its launch in 2018, and it has completed six of the nine required flybys needed to maneuver inwards through the solar system before its final orbital insertion.

BepiColombo’s view of Mercury during its first flyby prior to eventual orbit insertion. [ESA/BepiColombo/MTM]
Press Conference (Recording available here) (by Kerry Hensley)
Anicia Arredondo (Southwest Research Institute) kicked off the first press conference of DPS–EPSC with a discussion of new findings about asteroid (16) Psyche. Psyche is a 170-mile-diameter asteroid in the asteroid belt between Mars and Jupiter, and our observations indicate that Psyche is 30–60% iron by volume. This suggests that the asteroid was once the core of a small planet like Earth or Mars that experienced a massive collision during its formation, losing its rocky mantle and leaving only the metal core behind. A NASA mission to the asteroid, also named Psyche, is slated to launch on 12 October 2023, reaching the asteroid in 2029 and embarking on 26 months in orbit around this metallic world. The mission will allow us to study how planets form in an entirely new way, and in preparation for its arrival, researchers are using all available means to study Psyche.

Spectra of Psyche showing the difference in features seen with the Spitzer Space Telescope (top) and SOFIA (bottom). Click to enlarge. [Slide by Anicia Arredondo]
Sonia Fornasier (LESIA-Université Paris Cité) discussed photometry of Phobos, the larger of Mars’s two small moons. The origins of Mars’s moons (the other moon is named Deimos) has long been debated, with two leading theories: 1) the moons are captured asteroids, which explains their reddish colors that match that of other asteroids, or 2) the moons formed where they are, in orbit around Mars, in the aftermath of a giant collision, which explains their nearly circular orbits. Neither theory fits all the available data — it’s not clear how captured asteroids would fall into such circular orbits, and Phobos and Deimos are spectrally dissimilar from Mars. Luckily, the Japanese Space Agency’s Martian Moons eXploration (MMX) mission will help solve this riddle, returning samples from two distinct regions on Phobos’s surface.

Phobos’s reflectance properties place it in the realm of asteroids rich in carbonaceous material. Click to enlarge. [Slide by Sonia Fornasier]
Adeene Denton (University of Arizona) wrapped up the session with a look at Pluto and its moon, Charon. The Pluto–Charon system is interesting because of how large Charon is relative to Pluto; Charon is larger compared to Pluto than the Moon is to Earth, and the center of mass of the system lies outside Pluto. One possibility for how the system came to be as it is today is through a giant collision, which is also how the Earth–Moon system is thought to have formed. Things are a little different 40 au from the Sun, though, as objects tend to be less massive and move more slowly. This means that the effects of material strength — the ability of a material to resist deformation — are important in determining the outcome of a collision.

Comparison of model snapshots when material strength is neglected (left) and included (right). Click to enlarge. [Slide by Adeene Denton]
The post DPS–EPSC 2023: Day 1 appeared first on AAS Nova.
]]>
The gravitational waves emitted by stellar-mass black holes merging with one member of a supermassive black hole binary might be a prominent target for upcoming observatories like LISA.
The post Could We Detect the Merger of Stellar-Mass and Supermassive Black Holes? appeared first on AAS Nova.
]]>We’ve detected gravitational waves from mergers of compact objects like stellar-mass black holes, and we’ve found promising evidence for the spacetime disturbances from binary supermassive black holes. But what about when these two mass scales meet — could we detect the merger of a stellar-mass black hole with a supermassive black hole?
Stellar-Mass and Supermassive
Many galaxies host a central supermassive black hole, which may have the opportunity to consume stellar-mass black holes from its surroundings. Based on theoretical calculations, it’s likely fairly rare for a stellar-mass black hole to merge with a supermassive black hole, with each galaxy experiencing just a few dozen of these events every billion years.
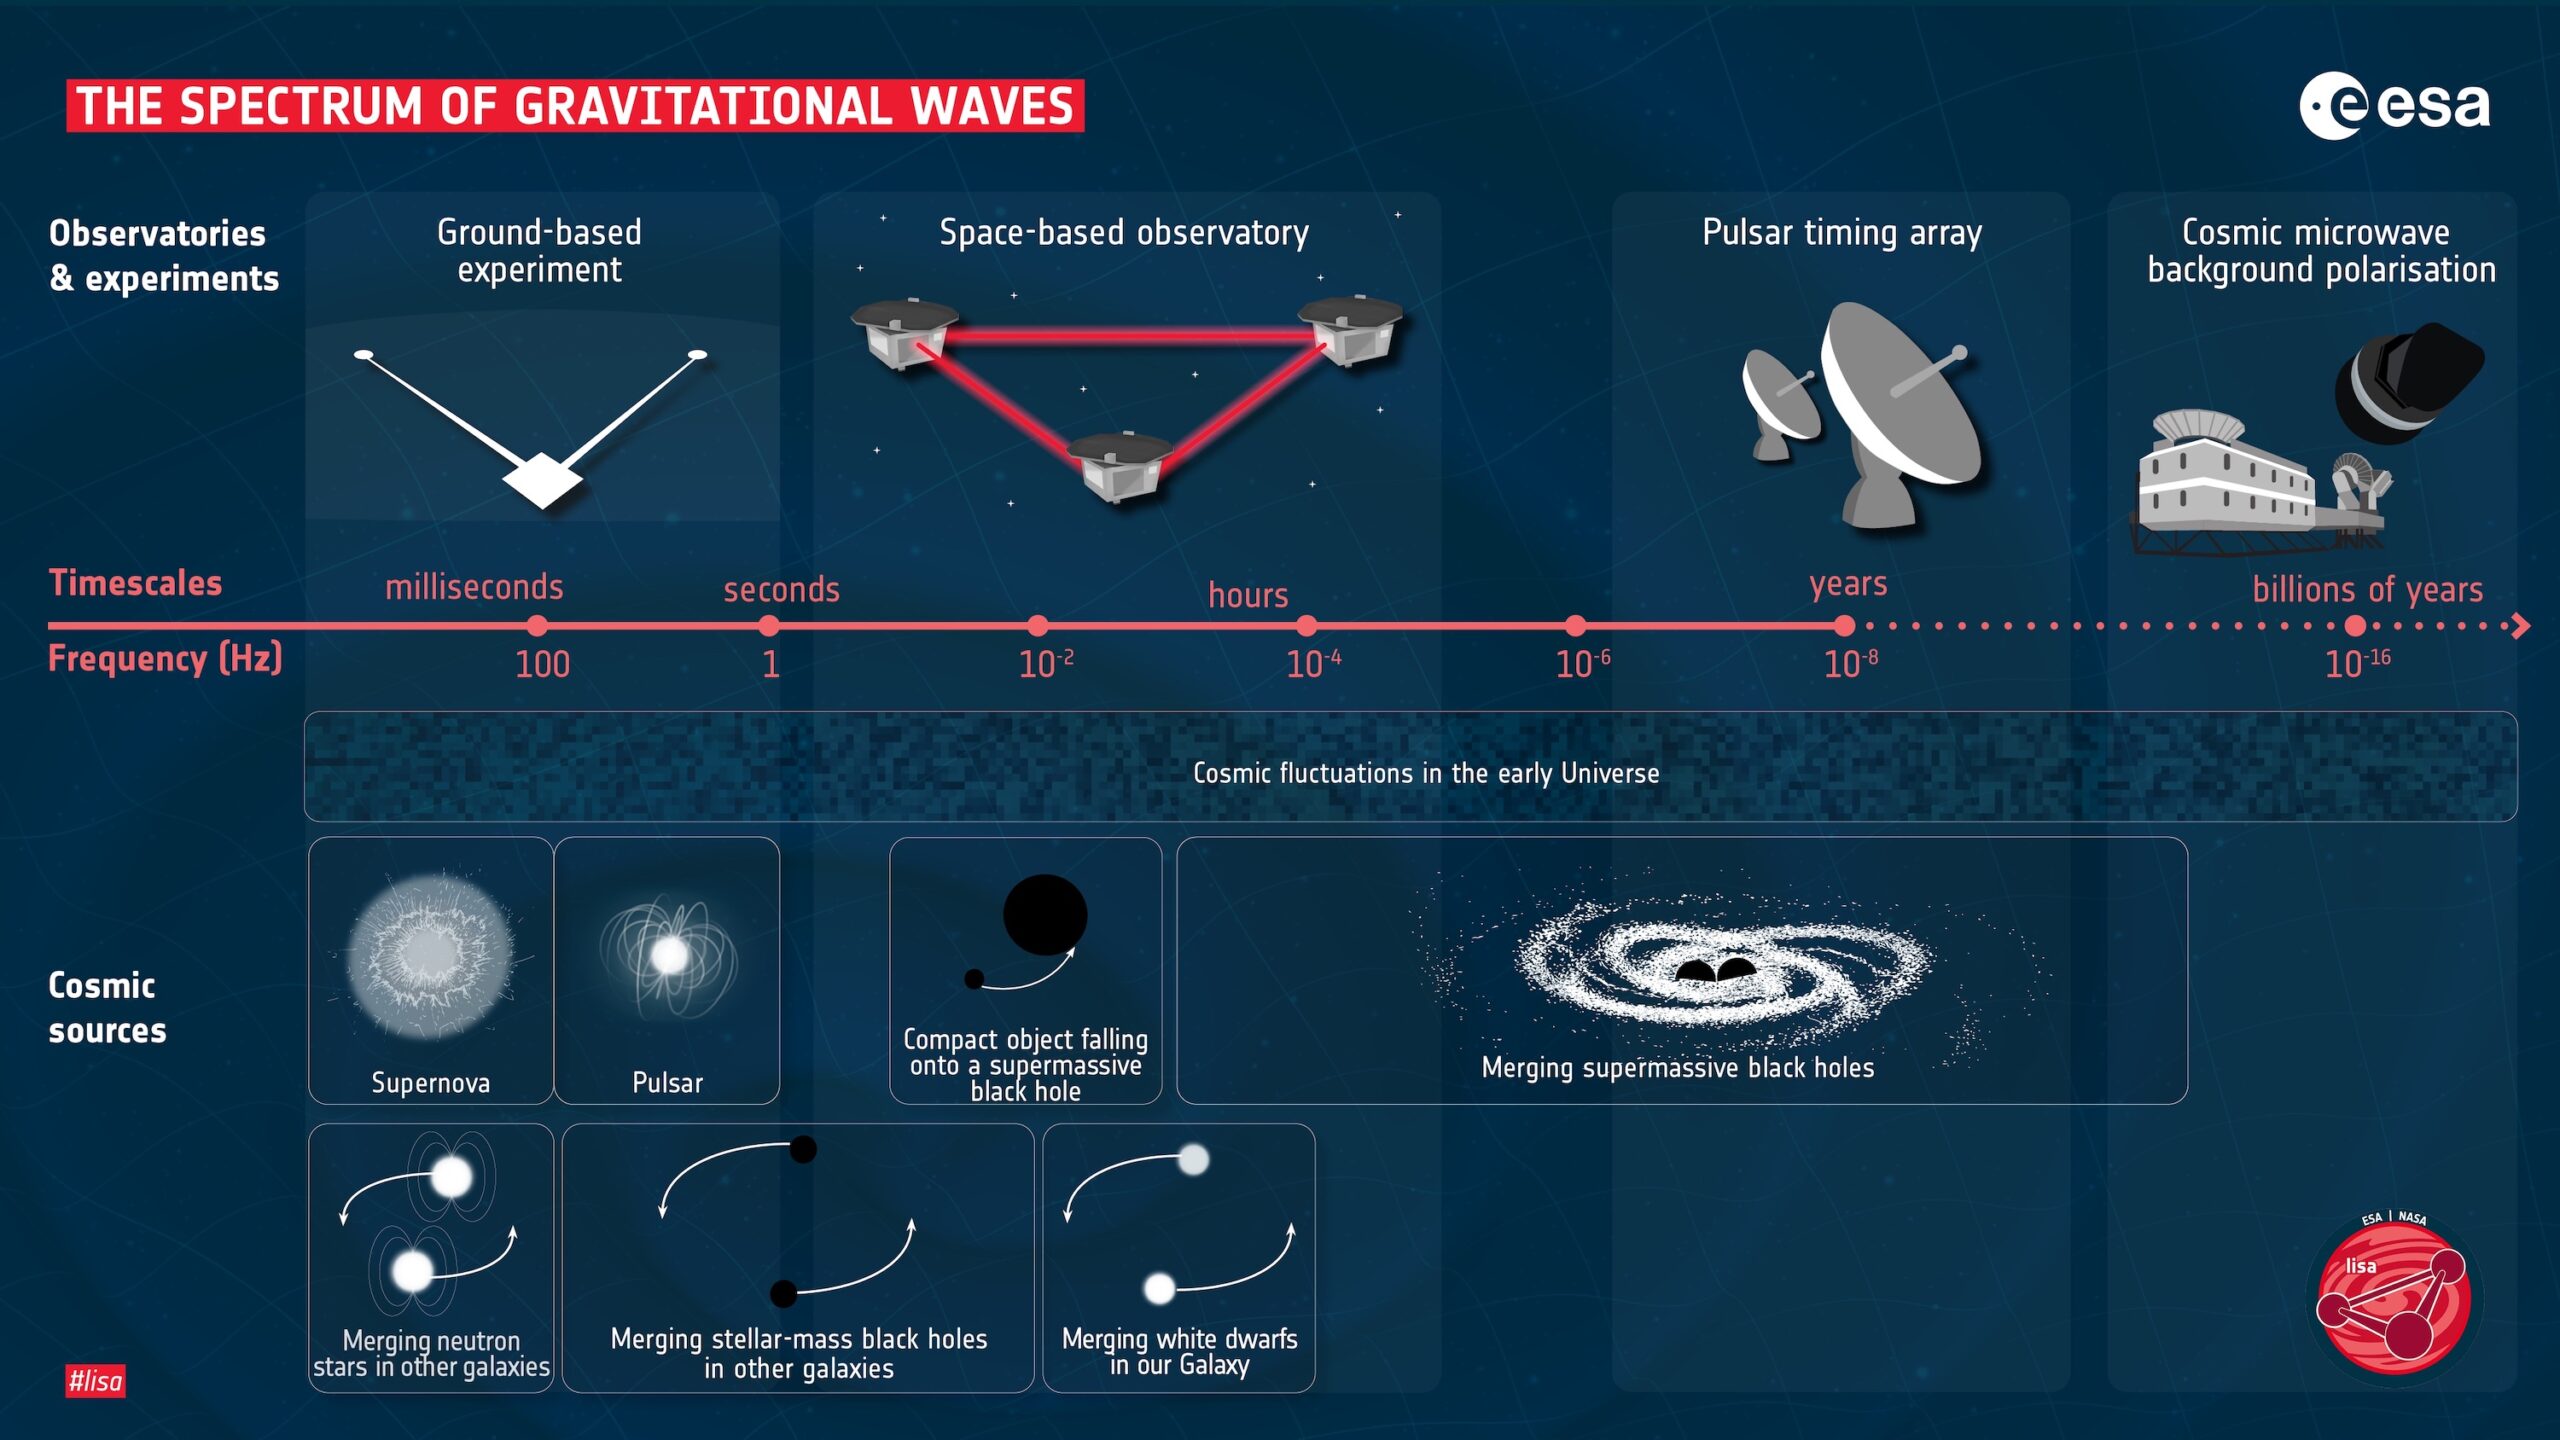
Infographic showing the typical frequency ranges of the gravitational waves produced by different sources. Click to enlarge. [ESA]
Simulating Gravitational Waves
Smadar Naoz (University of California, Los Angeles) and Zoltán Haiman (Columbia University) simulated the gravitational waves that would result from a stellar-mass black hole spiraling in to merge with one member of a supermassive black hole binary. This type of merger is called an extreme-mass-ratio inspiral. First, Naoz and Haiman estimated the number of extreme-mass-ratio inspirals as a function of the mass of the black holes in the binary system. Perhaps counterintuitively, stellar-mass black holes are much more likely to merge with the less massive black hole in a binary system, thanks to gravitational perturbations.
Predicted gravitational wave amplitude as a function of frequency for resolved (purple lines) and unresolved (grey lines) systems, compared to LISA’s estimated sensitivity. Click to enlarge. [Naoz & Haiman 2023]
Observing gravitational waves from a stellar-mass black hole as it spirals toward a supermassive black hole can help us understand many aspects of how supermassive black holes grow and merge. In particular, these observations may help us put a number on how many companions a supermassive black hole is likely to have; do these behemoths mostly fly solo, or are pairs, triples, or quartets more likely? Hopefully, it’s just a matter of time before LISA is in place in its berth in space — the planned launch date is 2037 — and ready to open a new window onto gravitational waves.
Citation
“The Enhanced Population of Extreme Mass-Ratio Inspirals in the LISA Band from Supermassive Black Hole Binaries,” Smadar Naoz and Zoltán Haiman 2023 ApJL 955 L27. doi:10.3847/2041-8213/acf8c9
The post Could We Detect the Merger of Stellar-Mass and Supermassive Black Holes? appeared first on AAS Nova.
]]>
The New Horizons spacecraft flew by the Kuiper Belt object Arrokoth more than four years ago. Today, this fascinating, lumpy, bi-lobed object still holds plenty of mysteries.
The post How Did Arrokoth Get Its Mounds? appeared first on AAS Nova.
]]>Large mounds abound on the surface of the Kuiper Belt object Arrokoth. Using images from the New Horizons flyby, researchers have pieced together a story of how these features came to be.
A Close Look at a Distant Object
New Horizons image of Arrokoth, with its two distinct lobes and several other prominent features labeled. [Stern et al. 2023]
Arrokoth consists of two separate bodies, or lobes, that fused together at some point in the past. Though the two lobes, named Wenu and Weeyo, appear spherical from the flyby images, observations taken from farther away suggest that they’re actually rather flat, more like walnuts or pancakes. (You can explore Arrokoth’s shape using an interactive three-dimensional model here.) In addition to being curiously flattened, the larger lobe is covered with a series of interlocking mounds, raising even more questions about how this oddly shaped object was assembled in the cold, dark outskirts of our solar system.
Mapping Mounds
Alan Stern (Southwest Research Institute) and collaborators analyzed two New Horizons images of Arrokoth to assess the origins of the mounds. In total, the team identified 12 mounds on the larger lobe, Wenu. The mounds are roughly the same size and color and have similar ratios of length to width, suggesting that they share a common origin. Using computer simulations, Stern’s team explored two scenarios that could account for Wenu’s lumpy appearance: 1) multiple objects about 3 kilometers wide colliding with a larger object, and 2) a rotating cloud of many 5-kilometer-wide objects gently collapsing to form a single object.
Comparison of the final model output for the second scenario (left) and the structure of Wenu (right). Click to enlarge. [Stern et al. 2023]
As Wenu, So Weeyo?
New Horizons images of Arrokoth (left column) and resultant maps created in this study (right). Mound regions have labels beginning with “t”. Click to enlarge. [Stern et al. 2023]
With no missions to the Kuiper Belt currently planned, our best hope of learning more about Arrokoth is by studying similar objects targeted in upcoming missions: the trojan asteroids in Jupiter’s orbit, which will be visited by NASA’s Lucy mission, and a comet approaching Earth’s orbit, visited by the European Space Agency’s Comet Interceptor.
Citation
“The Properties and Origin of Kuiper Belt Object Arrokoth’s Large Mounds,” S. A. Stern et al 2023 Planet. Sci. J. 4 176. doi:10.3847/PSJ/acf317
The post How Did Arrokoth Get Its Mounds? appeared first on AAS Nova.
]]>
SN 2023ixf, which was discovered in May 2023 in the Pinwheel Galaxy, is the nearest extragalactic supernova observed in almost a decade. What did early data tell us about the event?
The post Getting to Know the Supernova Next Door: SN 2023ixf appeared first on AAS Nova.
]]>It’s not every day that a supernova happens in our backyard! Earlier this year, astronomers discovered a supernova in the galaxy Messier 101, which is relatively close at just 21 million light-years away. The explosion, dubbed SN 2023ixf, is the nearest known supernova in recent years.
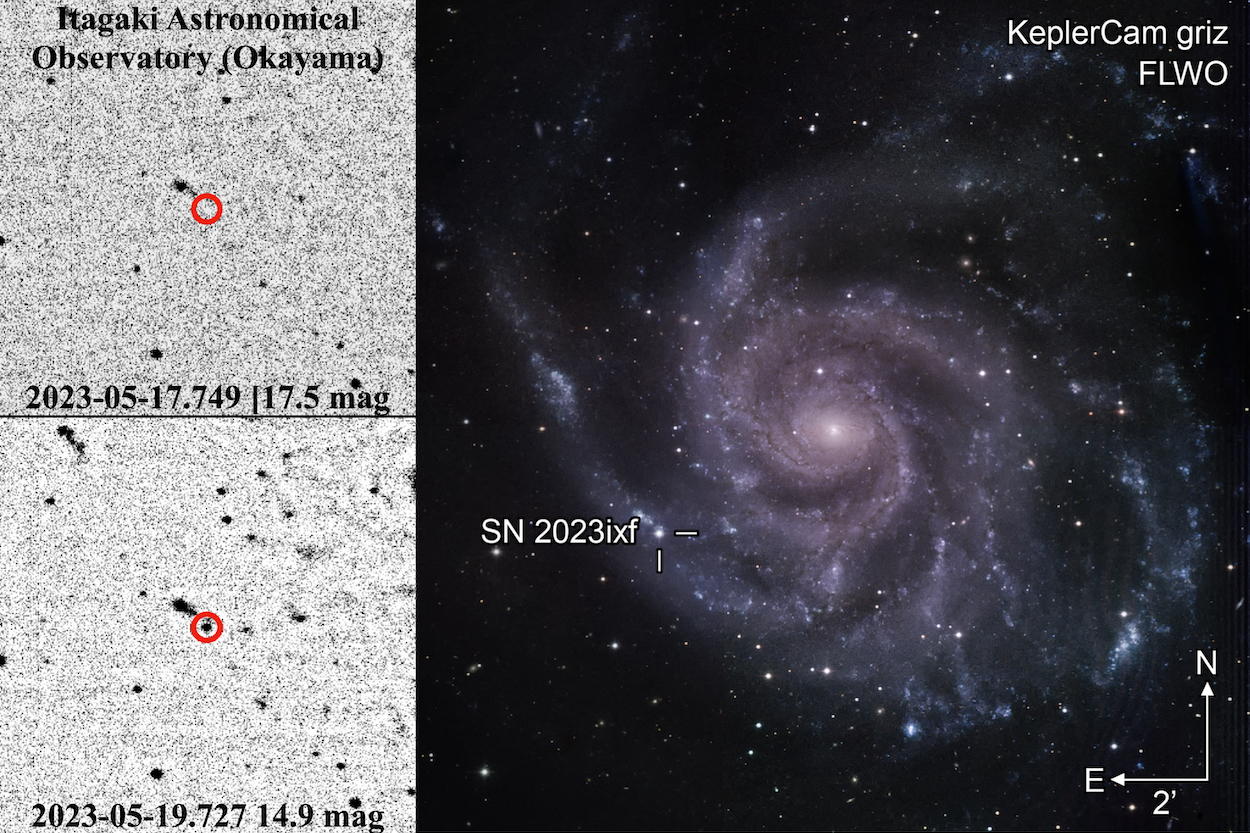
Discovery image (bottom left) and last image in which SN 2023ixf is not visible (top left), as seen from Koichi Itagaki’s observatory. The right-hand image shows SN 2023ixf’s location within Messier 101. [Hiramatsu et al. 2023]
A Supernova Next Door
Using a 0.35-meter telescope, amateur astronomer and prolific supernova sleuth Koichi Itagaki spotted a rapidly brightening newcomer on the outskirts of a spiral galaxy on 19 May 2023. After announcing the discovery of supernova SN 2023ixf on the Transient Name Server, the race was on. Telescopes across Earth and in space pointed toward Messier 101, also known as the Pinwheel Galaxy, to monitor the rise and fall of the newfound supernova. The behavior of the supernova’s light curve in the early days after discovery gives us critical information about the exploding star and its surroundings. What did we learn about SN 2023ixf in these early days?
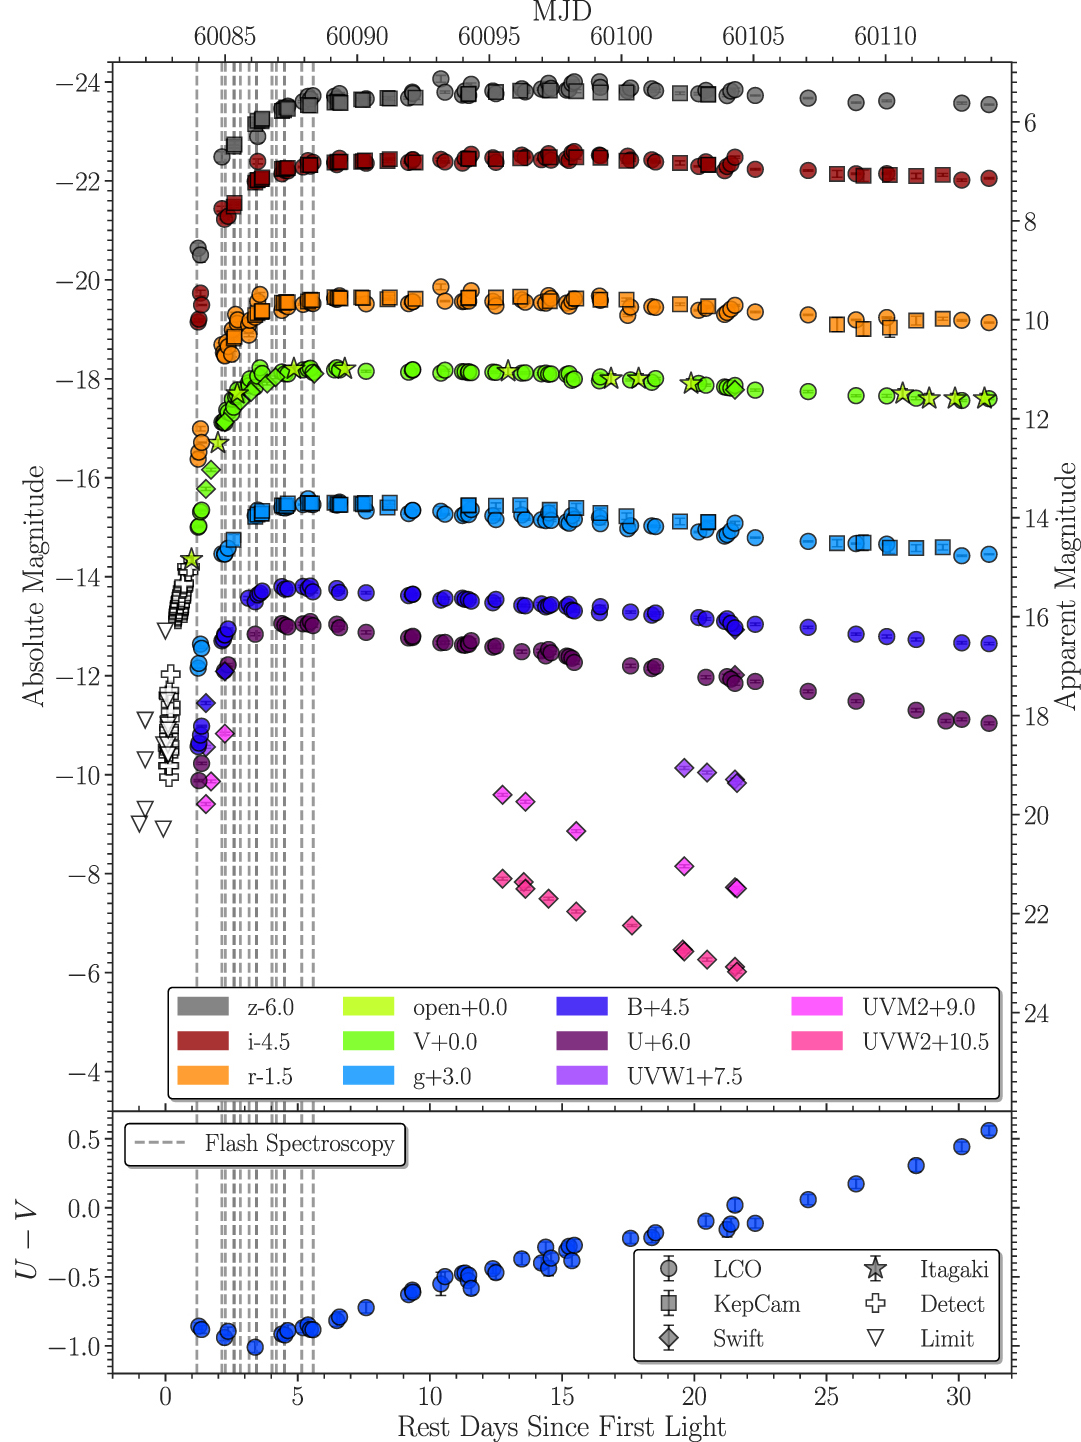
Light curves for SN 2023ixf showing the evolution of the supernova’s brightness at wavelengths between infrared and ultraviolet in the first month after detection. The bottom panel shows how the color changed over time; the supernova became bluer as it brightened and redder as it faded. Click to enlarge. [Adapted from Hiramatsu et al. 2023]
In the Days After Discovery
In a recent publication, a team led by Daichi Hiramatsu (Center for Astrophysics ∣ Harvard & Smithsonian; NSF AI Institute for Artificial Intelligence and Fundamental Interactions) outlined their observations made in the month after the supernova’s discovery. Analyzing light curves and spectra from multiple telescopes, Hiramatsu’s team found that the supernova rose from obscurity to its eye-catching peak brightness in just five days before declining more gently, fading by 0.03 magnitude each day. Its spectra showed numerous bright emission lines that mark the interaction of the expanding supernova shock with gas surrounding the star.
These light curves and spectra paint a picture of a massive star collapsing as its core nuclear fusion dried up, the star’s outer layers rebounding off its condensed core in an explosion that outshone its home galaxy — a core-collapse supernova. The data also hint at something unusual: there was so much gas packed into a dense shell around the star that it delayed the escape of the shock wave that emerged from the center of the star.
The team used models to investigate the origin of this dense circumstellar material, exploring scenarios in which 1) a strong, steady stellar wind carried material away from the star before the explosion or 2) random outbursts or eruptions preceded the eventual supernova. The team found that the observations were compatible with either scenario, and in both cases, the star likely lost up to a solar mass of material in its last 1–2 years — showing that the final years of the star’s life were anything but calm.
Moving Forward by Looking Back
Astronomers will likely study SN 2023ixf for years to come. Of particular importance will be identifying and characterizing the progenitor star; ideally, we’d be able to monitor supernova progenitor stars in the years or decades before they explode to link their properties before the explosion to what happens in the aftermath. Usually, our investigations of supernova progenitor stars go in the opposite direction: we detect a supernova and then go looking through our increasingly large treasure trove of data to find the star it came from.
Already, several searches for SN 2023ixf’s progenitor star have been published. Multiple teams, using different data sets and analysis methods, have independently identified the same red supergiant as the most likely progenitor for the explosion. To clinch the candidate as the source of the supernova, we’ll have to wait to see if the fading glare of the explosion reveals that the star has disappeared. To learn more about SN 2023ixf, its possible progenitor star, and ongoing investigations of this rare nearby supernova, check out the complete list of AAS journals articles regarding SN 2023ixf here.
Citation
“From Discovery to the First Month of the Type II Supernova 2023ixf: High and Variable Mass Loss in the Final Year before Explosion,” Daichi Hiramatsu et al 2023 ApJL 955 L8. doi:10.3847/2041-8213/acf299
The post Getting to Know the Supernova Next Door: SN 2023ixf appeared first on AAS Nova.
]]>
Astrobites reports on a way to find giant planets so close to their host stars that they're usually obscured by the star's glare.
The post Spotting Close-In Giant Planets with Spectroscopy appeared first on AAS Nova.
]]>Editor’s Note: Astrobites is a graduate-student-run organization that digests astrophysical literature for undergraduate students. As part of the partnership between the AAS and astrobites, we occasionally repost astrobites content here at AAS Nova. We hope you enjoy this post from astrobites; the original can be viewed at astrobites.org.
Title: Detecting Exoplanets Closer to Stars with Moderate Spectral Resolution Integral-Field Spectroscopy
Authors: Shubh Agrawal et al.
First Author’s Institution: California Institute of Technology
Status: Published in AJ
Thus far, the vast majority of known exoplanets have been discovered indirectly, using techniques such as the transit or radial velocity methods, which allow us to infer the presence of planets based on their effects on their host stars. However, to fully characterize an exoplanet, we need to observe it directly. As you might guess, picking out the light coming from a planet, as opposed to the star it’s orbiting, is no small feat given how bright stars are compared to planets. Astronomers have come up with lots of tricks over the years to improve imaging techniques, from using coronagraphs to block out some of the star light to designing adaptive optics that correct for atmospheric effects and employing complex signal-processing algorithms. However, direct imaging is still typically restricted to observing planets that are massive, bright, and live quite far from their host stars. The relative brightness and physical separation from the star make these planets much easier to see than the smaller, closer planets whose signals are overpowered by starlight.
But today’s authors have a plan to directly observe planets orbiting closer to their host stars than ever before! Their idea hinges on using spectroscopy to better differentiate between planets and their host stars.
The new detection method involves a technique called integral field spectroscopy (IFS), in which a field of view is split into a grid, with a spectrum taken for each cell in the grid (Figure 1). The idea behind using IFS for finding planets depends on differentiating between the spectral features of planets and stars to identify which grid cells are sampling the planet’s light. For example, the planet might have features like water or carbon monoxide, whereas the star has a more complex spectrum with many features blended together.
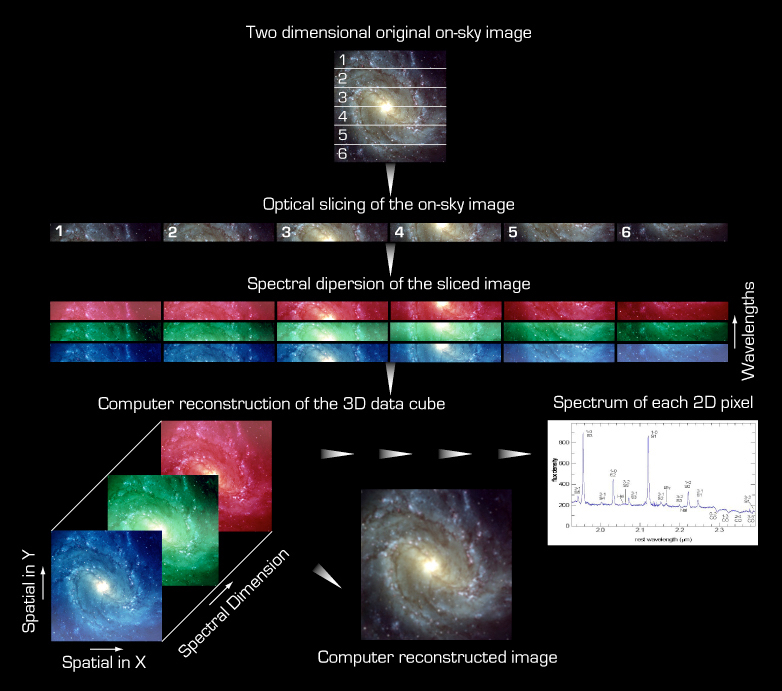
Figure 1: Diagram describing integral field spectroscopy, where an image is split into smaller cells, each with its own spectrum. [ESO; CC BY 4.0]
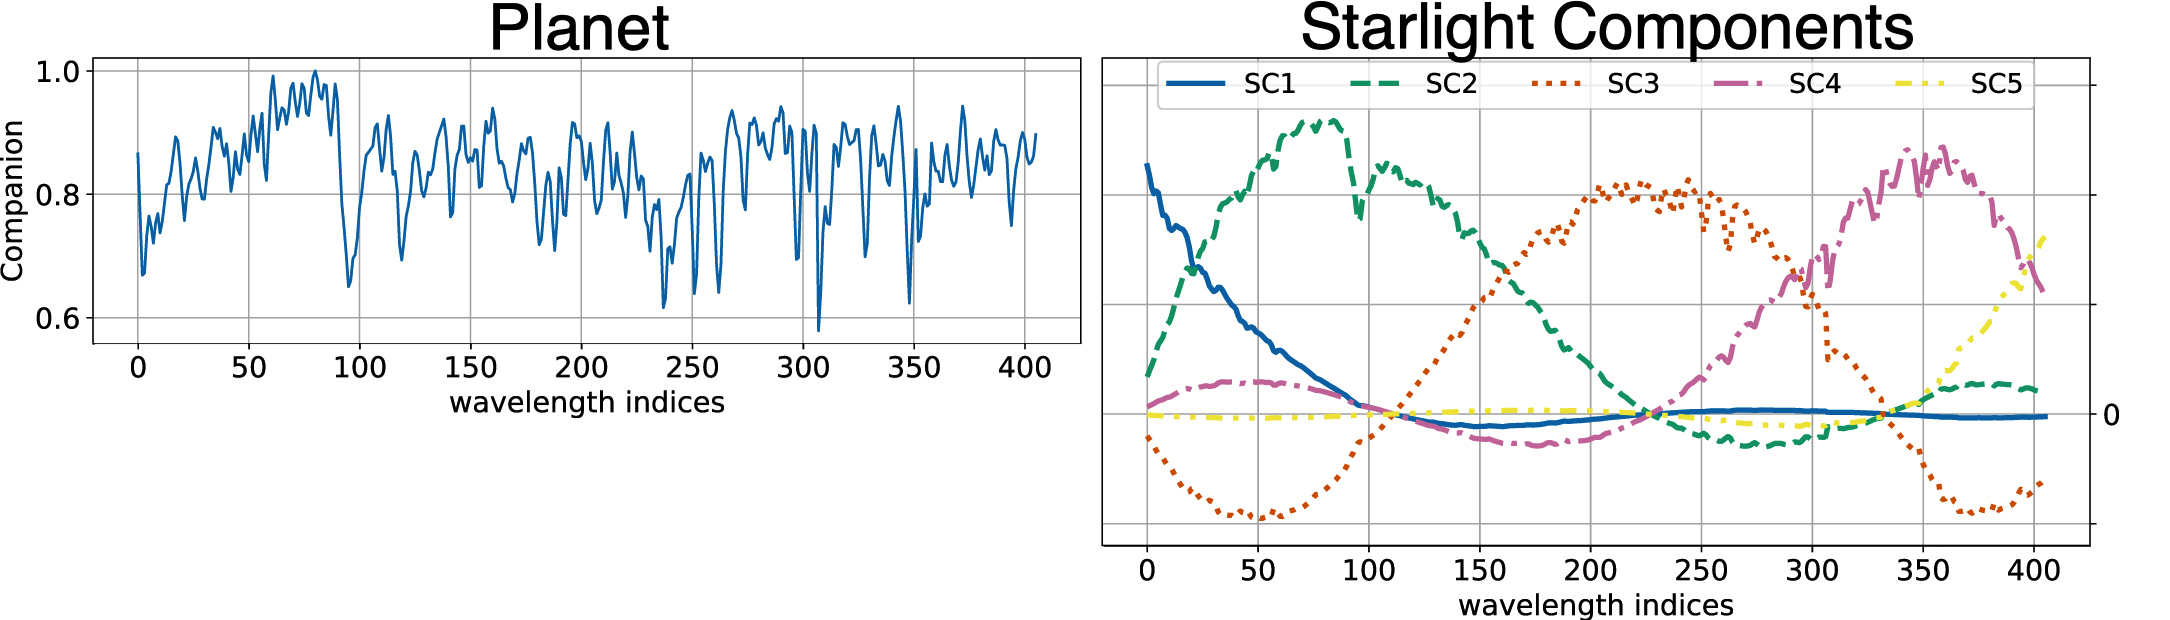
Figure 2: The left panel shows a model spectrum for the planet, and the right panel shows a few of the many components that are used to model starlight. [Adapted from Agrawal et al. 2023]
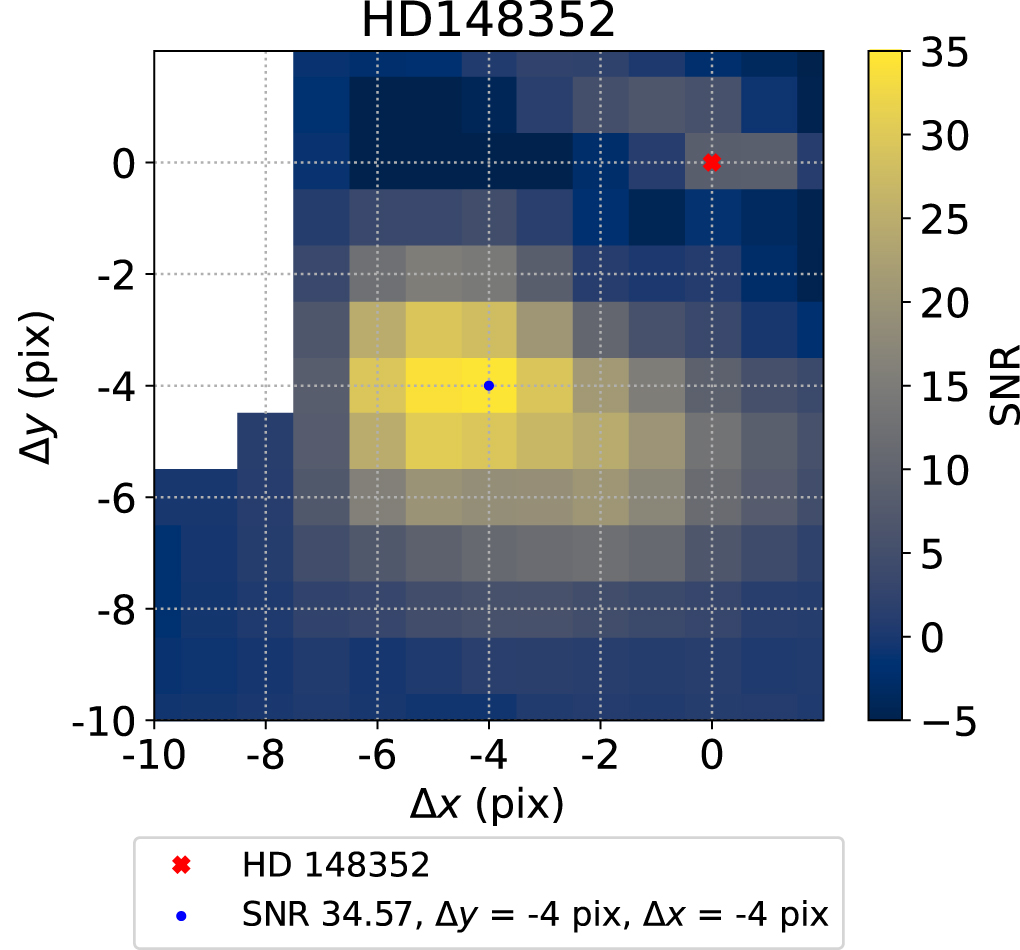
Figure 3: The resulting detection map for one of the test-case stars. The star is the larger bright area in the middle, and the M-dwarf companion is the small bright area marked by the red cross. [Agrawal et al. 2023]
Based on the success of the IFS test, the authors conclude that IFS planet detection could be a really powerful way to find closer-in planets, especially given the IFS instruments on JWST and the capabilities of future Extremely Large Telescopes. Probing these close-in planets is especially important as radial velocity surveys have indicated that there should be quite a few Jupiter-mass planets within a few astronomical units of their host stars, but existing imaging techniques aren’t able to resolve those small separations. Finally, the authors show that their approach to modeling the planet and star light at the same time helps to retain more information about the planet’s atmosphere, and it could be a really promising method for measuring compositions and studying habitability in the coming years!
Original astrobite edited by Jack Lubin.
About the author, Isabella Trierweiler:
I’m a fifth-year grad student at UCLA. I’m interested in planet formation, and I study the compositions of exoplanets using polluted white dwarfs. In my free time, I like knitting, playing train games, and growing various fruit trees.
The post Spotting Close-In Giant Planets with Spectroscopy appeared first on AAS Nova.
]]>
Researchers have identified the optical counterpart to an X-ray binary system, giving us clues about the nature of this extreme star system.
The post Featured Image: A Rare X-ray Binary in a Starburst Galaxy appeared first on AAS Nova.
]]>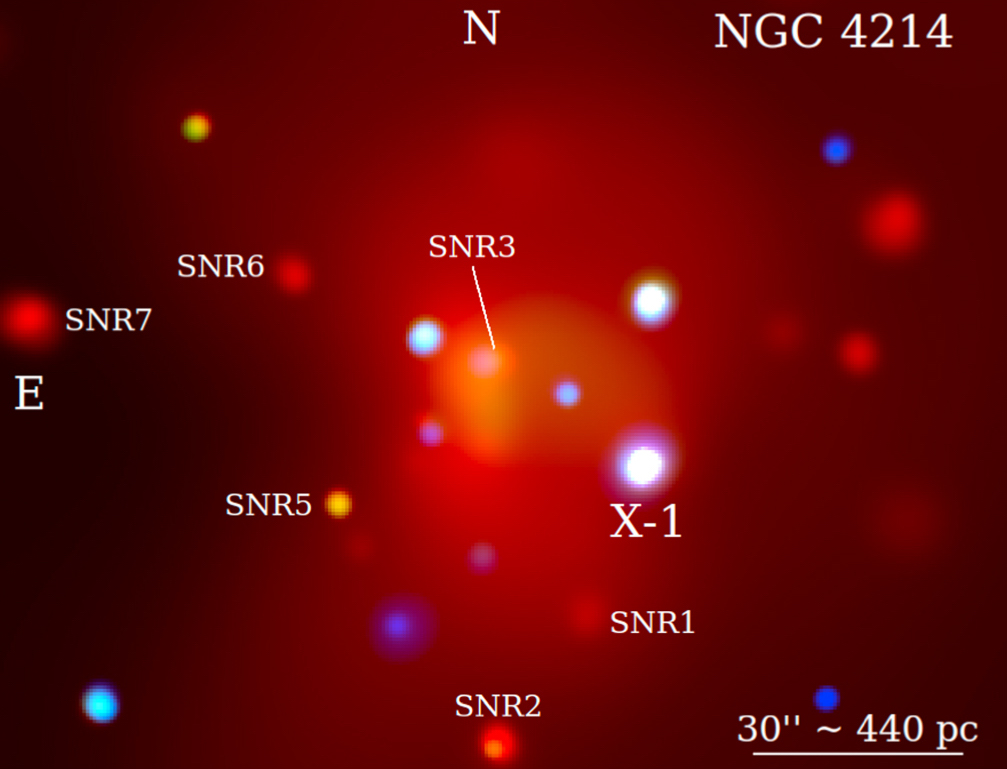
An X-ray view of the dwarf starburst galaxy NGC 4214 created from Chandra X-ray Observatory Data. [Adapted from Lin et al. 2023]
Citation
“On the Short-period Eclipsing High-mass X-Ray Binary in NGC 4214,” Zikun Lin et al 2023 ApJ 954 46. doi:10.3847/1538-4357/ace770
The post Featured Image: A Rare X-ray Binary in a Starburst Galaxy appeared first on AAS Nova.
]]>
If you wanted to know what's in the air of a lava planet, it wouldn't be a good idea to go visit in person. Luckily, astronomers don't have to.
The post A Forge Without Iron appeared first on AAS Nova.
]]>Imagine standing on a small rock, surrounded on all sides by a sea of boiling lava. Above you, an enormous star looms across most of the sky. Take a deep breath in: what do you smell, what’s in the air? While no humans have yet been in this situation, astronomers are making progress towards answering this question using instruments back here on Earth.
Worlds Beyond Imaginings
Ours is an era of wonder, one in which we are just beginning to discover planets beyond our own solar system and just beginning to realize how strange these worlds can be. Exoplanet astronomers have confirmed that over the years, science fiction writers largely underestimated the universe: included in the menagerie of the first discovered 5,000 planets are worlds with not one, or two, but three stars; planets that are fluffier than cotton candy; and planets where the clouds are made of rock. Each of these worlds offers the chance to contextualize our own home and to study how our galaxy creates and maintains planets.
One extreme and somewhat famous exoplanet discovered back in 2004 is named 55 Cancri e. In some ways, this world might remind us of our own. It’s a little bigger than Earth (it has a radius about twice as large), and it’s also likely rocky, with a bulk density a little higher than the terrestrial value. The comparisons to our home world abruptly end, however, when we consider where the planet is: it nearly skims the surface of its host star, whipping around it on an orbit that takes only about 17 hours. It is so close that were you to stand on the surface of the planet, the star would dominate your view of the sky. Also, you’d likely be standing in lava, since the ambient temperature is high enough to melt the upper crust.
Astronomers have been understandably fascinated with this molten world, and over the past 20 years numerous groups have labored to characterize it. Unfortunately, it is difficult to measure something as small as a planet from 41 light-years away — current estimates of the surface pressure range from a near-Earth-like 1.4 bar all the way to the pressures felt more than a mile undersea. Even so, progress has been made, and the latest step came recently from the first analysis of 55 Cancri e’s emission spectrum using a high-resolution instrument.
New Observations
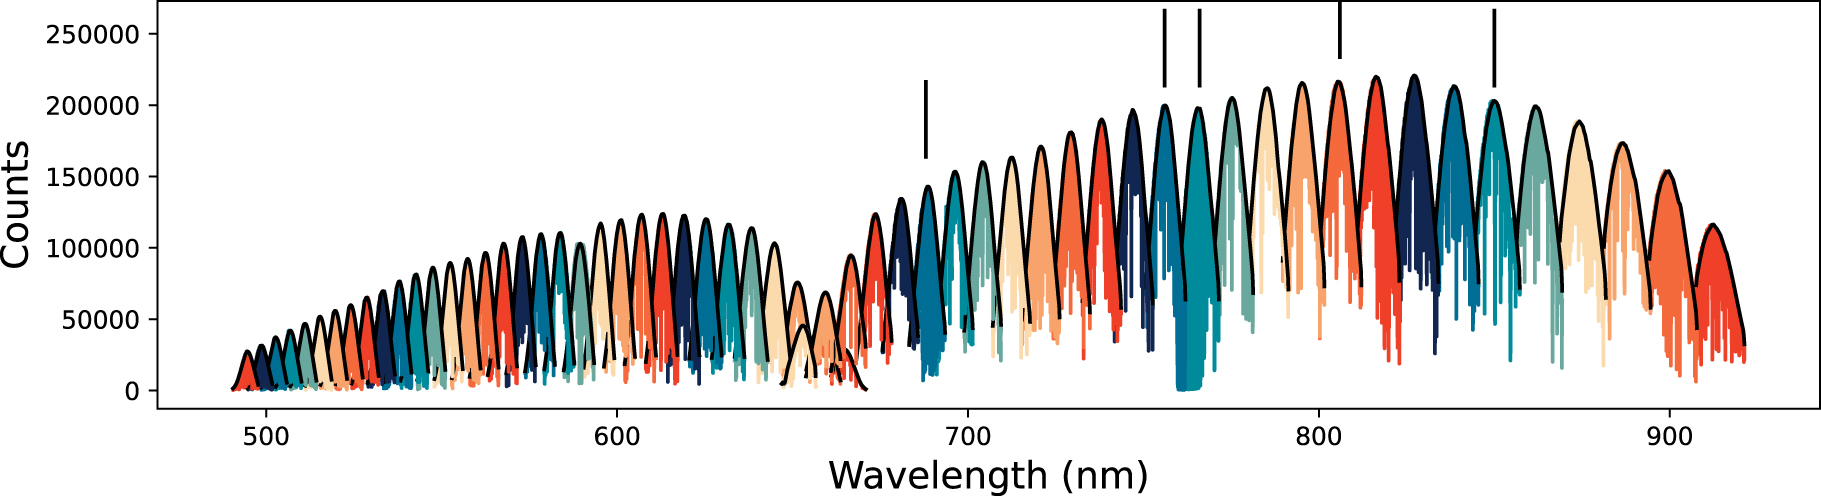
One of the high-res spectra collected by MAROON-X of 55 Cancri. The black lines mark the borders between different echelle orders. [Rasmussen et al. 2023]
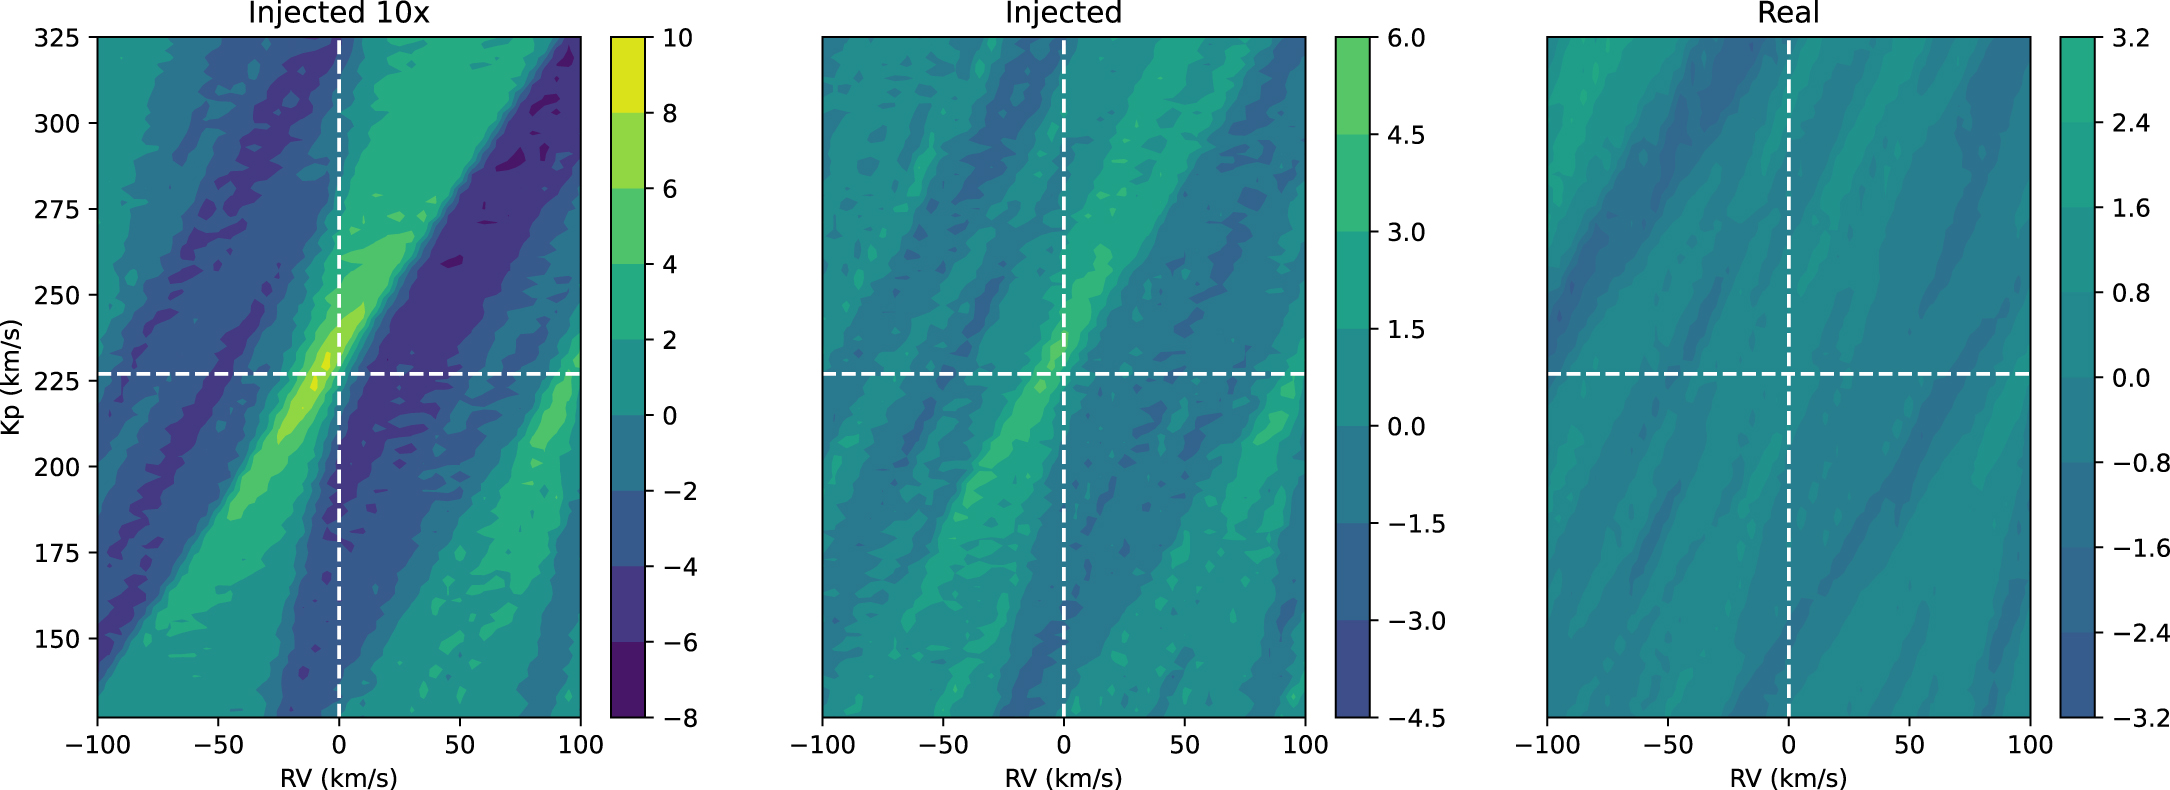
The actual data (right), an injection of what an iron signature was expected to look like (middle), and an injection of an iron signal 10x stronger than expected (left). Only a very weak signal was recovered in the real data, which implies that there is very little iron present. [Rasmussen et al. 2023]
Citation
“A Nondetection of Iron in the First High-resolution Emission Study of the Lava Planet 55 Cnc e,” Kaitlin C. Rasmussen et al. 2023 AJ 166 155. doi:10.3847/1538-3881/acf28e
The post A Forge Without Iron appeared first on AAS Nova.
]]>
Researchers take a wide view of an unusual repeating fast radio burst to decode the burst's dispersed signal.
The post A Fast Radio Burst Reveals Foreground Galaxy Clusters appeared first on AAS Nova.
]]>The repeating fast radio burst FRB 20190520B traveled through an unusually large amount of matter on its journey to Earth. Could unidentified galaxy clusters in the billions of light-years that separate us from the burst’s source explain why?
An Astrophysical Mystery
Fast radio bursts are among the most mysterious events in the universe. Most of these powerful, milliseconds-long radio blips occur just once, each burst an astronomical flash in the pan that leaves researchers puzzling over its origin. In rare cases, fast radio bursts repeat, giving us a clue that at least some sources of these mysterious bursts survive the event.
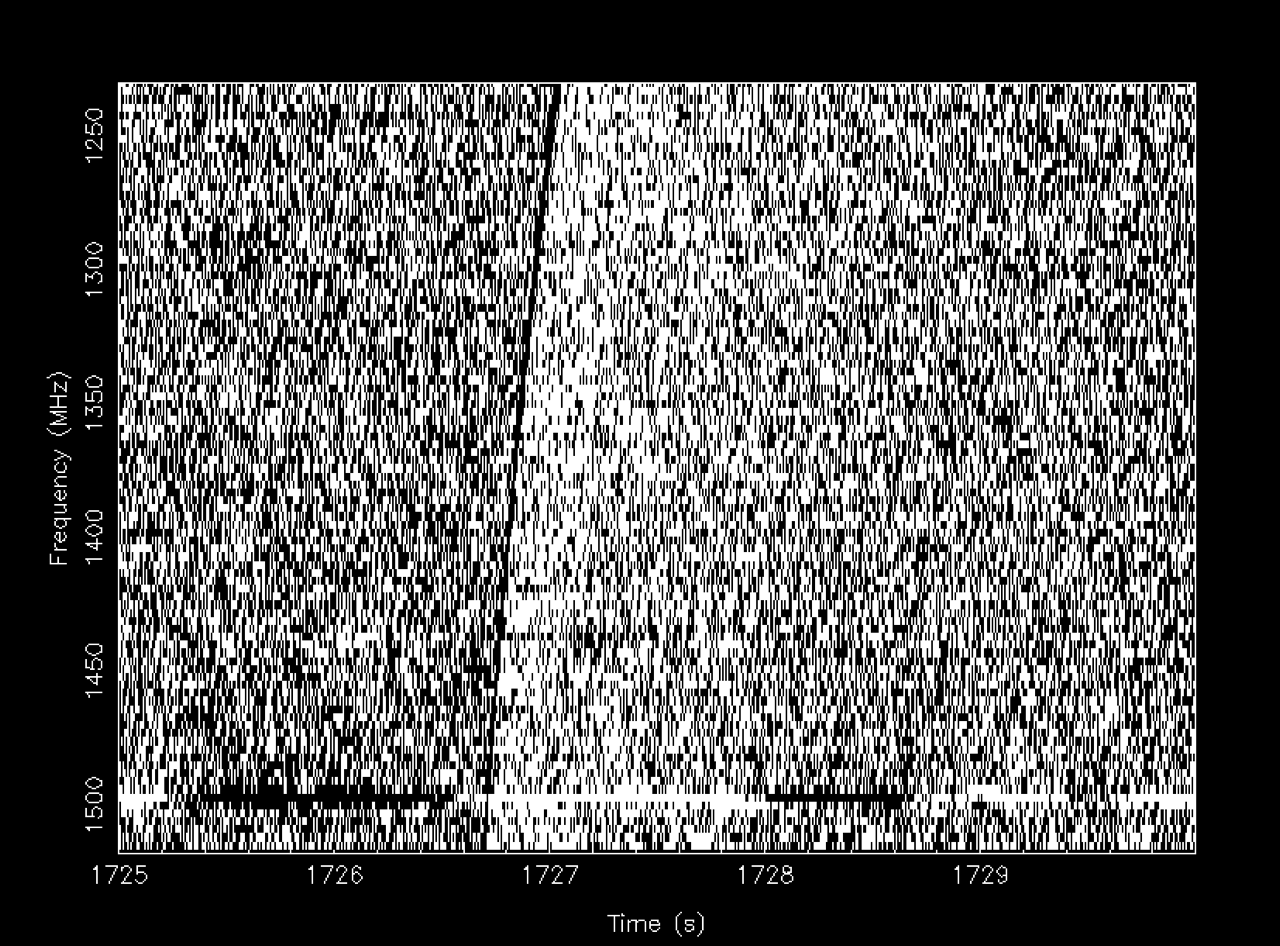
The signal from the first fast radio burst ever detected. The highest frequencies arrive first, and the lower frequencies follow. [Wikipedia user Psr1909; CC BY-SA 4.0]

The matter that delays the arrival of the lowest-frequency radio waves in a burst — free-roaming electrons are the best at holding up low-frequency waves — can be located anywhere along the burst’s path: in the immediate vicinity of the source, in the source’s host galaxy, in intergalactic space, or in our own galaxy. To disentangle the contributions from these different regions, researchers must take a wide view of the situation.
Surveying a Superlative Burst
The dispersion measure of the repeating fast radio burst FRB 20190520B is more than twice as large as expected given its distance. This unusually high value caught the attention of a team led by Khee-Gan Lee (Kavli Institute for the Physics and Mathematics of the Universe), which is carrying out the Fast Radio Burst (FRB) Line-of-sight Ionization Measurement From Lightcone AAOmega Mapping survey, or FLIMFLAM. This survey aims to map the distribution of luminous matter in the universe by searching for galaxy groups that are revealed by fast radio bursts.
Snapshot of an interactive figure showing the locations of the newly identified galaxy clusters relative to FRB 20190520B’s location. Click to enlarge. You can interact with this figure here. [Lee et al. 2023]
A Revised Estimate
Based on FRB 20190520B’s extremely high dispersion measure, previous research estimated its host galaxy’s dispersion to be the highest of any known fast radio burst, a fact that has been difficult to reconcile with other observations of the galaxy. Now, with the new estimate of the foreground galaxies’ contribution, FRB 20190520B’s host galaxy has been assigned a more moderate value that aligns with its observational properties. This study demonstrates that even when focusing closely on a single fast radio burst, it’s still important to zoom out and consider the big picture!
Citation
“The FRB 20190520B Sight Line Intersects Foreground Galaxy Clusters,” Khee-Gan Lee et al 2023 ApJL 954 L7. doi:10.3847/2041-8213/acefb5
The post A Fast Radio Burst Reveals Foreground Galaxy Clusters appeared first on AAS Nova.
]]>
Astrobites reports on the prospect of using JWST to detect prebiosignatures: the molecules that indicate not life itself, but the possibility that life might someday form.
The post Signs of (Pre-)Life: Can JWST Detect Conditions for the Formation of Earth-Like Life on Distant Planets? appeared first on AAS Nova.
]]>Editor’s Note: Astrobites is a graduate-student-run organization that digests astrophysical literature for undergraduate students. As part of the partnership between the AAS and astrobites, we occasionally repost astrobites content here at AAS Nova. We hope you enjoy this post from astrobites; the original can be viewed at astrobites.org.
Title: Prebiosignature Molecules Can Be Detected in Temperate Exoplanet Atmospheres with JWST
Authors: A. B. Claringbold et al.
First Author’s Institution: University of Cambridge
Status: Published in AJ
The search for life in the universe has always been a driving force for interest in and development of astronomy and the space sciences. Far from tales of little green men and aliens on Mars, today’s scientific investigations into extraterrestrial life usually involve trying to find the traces that life leaves behind in the light that we receive from the stars. This could be evidence of alien transmissions, structures, technology, or intelligence — “technosignatures” — or evidence of molecules or other indicators of the existence of life, regardless of its intelligence — “biosignatures.”
Given many arguments and discussions about the rarity of life in the cosmos, however, many consider it prudent to search not only for these signatures but also for prebiosignatures — molecules in planetary atmospheres that correspond not to the current existence of life, but to the conditions in which life (organic chemistry, in particular) arose on Earth. These include molecules created by volcanism, ultraviolet radiation, or even lightning. Given what we currently understand about how proteins and RNA came to be on our planet, searching for signs of these molecules may help us find the precursors for life elsewhere in the universe.
The authors of today’s article wish to test the sensitivity of JWST to detecting traces of these prebiosignature molecules in the atmospheres of various kinds of exoplanets. To do this, they use atmospheric models to simulate what the transmission spectra of different exoplanets would look like and test whether JWST’s instruments can recover the prebiosignatures from within the simulated data.
Molecular Mission
The authors focused their analysis on a selection of prebiosignature atmospheric molecules informed by a series of origin scenarios for life. The particular molecules chosen were hydrogen cyanide (HCN), sulfur dioxide (SO2), hydrogen sulfide (H2S), cyanoacetylene (HC3N), carbon monoxide (CO), methane (CH4), acetylene (C2H2), ammonia (NH3), nitric oxide (NO), and formaldehyde (CH2O).
In order to detect these molecules in the atmospheres of distant planets, scientists use a technique called transmission spectroscopy. Essentially, when a planet crosses in front of its star (or “transits”) from our point of view, some light from the host star passes through the planet’s atmosphere. Specific wavelengths of this light are absorbed by molecules in the atmosphere, leaving a telltale “fingerprint” of said molecules’ existence in the spectrum of light we observe. All the molecules chosen happen to have spectral signatures in the infrared, which JWST’s instruments can measure.
Wonderful Worlds
To carry out their investigation, the authors first simulated transmission spectra for a particular set of planets, using models of different types of atmospheres as a background. For the best possible chance of atmospheric detection and characterization, the authors elected to model planets whose atmospheres are rich in hydrogen and helium, have a low mean molecular weight, and are orbiting a smaller star.
Specifically, the authors modeled five different types of possible worlds (Table 1 and Figure 1): a “Hycean” world (an ocean planet with a hydrogen atmosphere), an “ultrareduced volcanic” world (active volcanism with hydrogen- and nitrogen-rich outgassing), a “post-impact” world (a planet recently impacted by another planetary body) at two different times after the collision, a super-Earth planet with a thin hydrogen envelope, and a model that simulates the early conditions on Earth, based on TRAPPIST-1e. This final model is not a light, hydrogen-rich atmosphere, but it’s an important one to study given the history of life’s evolution on our planet. All planets are assumed to be orbiting an M-dwarf star for consistency.

Table 1: Ratios of molecules in each atmospheric model. [Claringbold et al. 2023]

Figure 1: Simulated transmission spectra for each atmospheric model tested, with important spectral lines labeled. [Claringbold et al. 2023]
Rousing Results
The authors find that for the model Hycean world, all prebiosignatures are detectable with JWST’s instruments. The hydrogen-rich super-Earth also has very good detectability, despite having the atmosphere with the smallest scale height (the “higher” the atmosphere extends, the more light passes through its molecules, and thus the stronger the signal received on Earth). The ultrareduced volcanic world, while it has a large scale height like the Hycean world, generally has worse detection thresholds due to strongly absorbing CH4 and HCN in its atmosphere. The post-impact planets have the highest scale height, and thus are the best suited for detection, with low thresholds for the prebiosignature molecules. Finally, prebiosignatures in the early Earth model were very difficult to detect with a low number of transits — while some molecules became detectable within 5–10 transits, others require somewhere between 40 and 100, which might be prohibitively long.
Given the models and method of analysis used, the authors note that these results are optimistic at best and may not correspond to real observational thresholds. Features such as clouds and atmospheric haze can increase the detectability threshold for different spectral features by hundreds or thousands of times, possibly rendering them undetectable.
Furthermore, a realistic retrieval method (where there is uncertainty in the atmospheric composition or planetary properties of the exoplanet being observed) may affect the detected abundances of trace molecules. That being said, the authors’ attempts to simulate such an analysis show that the primary prebiosignatures are still well detected within an order of magnitude of the previous results.
The key conclusion of this article is that in the case of light atmospheres and optimal target planets/systems, the detection of prebiosignatures and exploration of the origin of life is well within the capabilities of JWST. As such, a wealth of data on planetary atmospheres is absolutely within the capabilities of the telescope, and detections of said molecules could very well make the news in the years to come.
Original astrobite edited by William Balmer.
About the author, Aldo Panfichi:
Hello! I’m currently finishing up my Master’s degree in Physics at the Pontificia Universidad Católica del Peru in Lima, Peru, writing a thesis project related to asteroids. I previously got my BSc in Astronomy and Astrophysics at the University of Chicago. In my free time, I like spending time with my friends (and my dogs!), going swimming in the summer, and cozying up inside in the winter, playing games or reading science fiction.
The post Signs of (Pre-)Life: Can JWST Detect Conditions for the Formation of Earth-Like Life on Distant Planets? appeared first on AAS Nova.
]]>