The post 48,000 trips a day: UrbanSpectra’s cycling analysis for the City of Sydney first appeared on Jake Coppinger.
]]>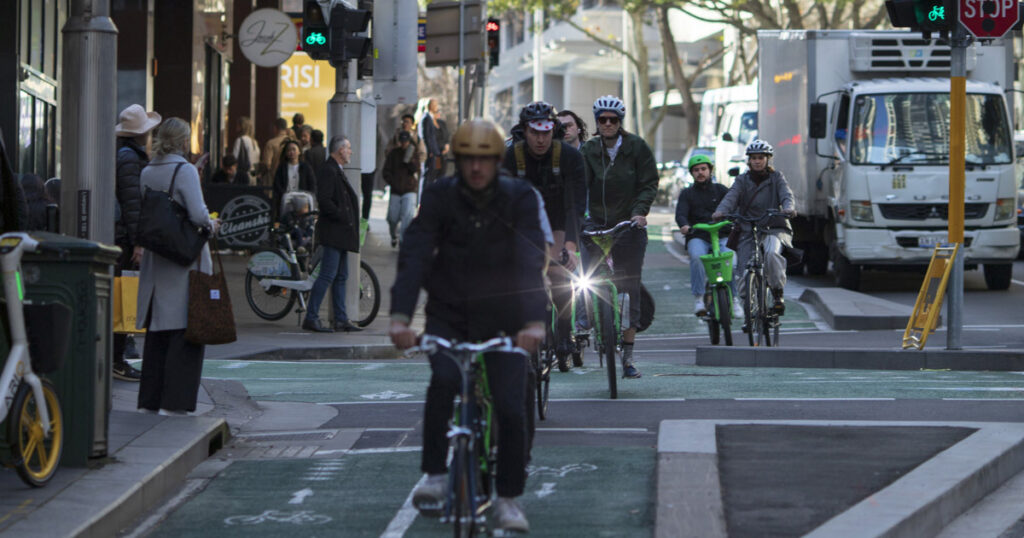
I’m pleased to share the completion of a recent commercial engagement by UrbanSpectra Pty Ltd for the City of Sydney: cityofsydney.nsw.gov.au/research-reports/daily-cycling-trips-city-of-sydney[1][2][3]
How many cycling trips are there in the City of Sydney? It’s a simple question without a simple answer: any estimate requires assumptions, approximations and inferences. What counts as a trip? How long is a trip? What about commuter trips into or out of the council area? What about the weather or season?
This work has also been republished at urbanspectra.com/report/2026/07/quantifying-cycling-trips-in-the-city-of-sydney/.
How It Works
The City provided UrbanSpectra with a brief to develop a credible estimate of cycling activity within the LGA. The City wanted a methodology prioritising clarity, transparency and explainability. I responded with a proposal drawing on my literature review, software development experience, and understanding of cycling policy.
I implemented a deterministic activity estimation algorithm – based on prior Transport for London[4] work, and in alignment with Austroads guidance – through iterative development and review with City of Sydney staff. The code draws on multiple sets of count data, collected by humans and automatic counters, to estimate cycling activity across different areas and infrastructure types.[3]: §5.1
I proactively engaged with organisations including Transport for NSW, Transport for London, and UNSW to seek feedback and procure data. Thank you very much to the staff at these institutions for your time and assistance.
The Finding
The report estimates 48,000 daily cycling trips within the City of Sydney Local Government Area (LGA) on a fair-weather weekday in March 2026. This sits within the range of other indicators, such as TfNSW Household Travel Survey (HTS) estimates, prior machine learning model predictions, and share bike data. The Lord Mayor, Clover Moore, has since cited the figures.[5]
Share bike trips in the City of Sydney have also increased substantially, with a weekday-only average of over 20,000 trips per day from at least March to May 2026. For broader context, NSW Transport Minister John Graham has said “Sydney is increasingly becoming a cycling city”, noting it is the second highest user of Lime bikes in the world, behind London.[6]
Open Data and Reproducibility
Where possible, the report uses clear and accessible language to be readable by anyone. The analysis outputs are reproducible by the public, using the provided open-source (AGPLv3) software code and Creative Commons-licensed input data.[3]: §8.1 Limitations to this methodology are candidly described, and all assumptions are documented. The materials are published by the City[2] (as a PDF) and republished (as HTML) by UrbanSpectra.[3]
This analysis was made possible by the City’s recent investment in a network of high-accuracy automated counters, and long-standing program of twice-yearly manual counts detailing turn movements at hundreds of intersections (since 2010[3]: §4.1.1.2 ). To the individuals who carried out these counts, whether on street corners or through video far from Sydney: thank you for your labour in creating this data.
Evaluation and interpretation of this analysis should appreciate its constraints. While I have made every effort to ensure accurate citations and outputs, this analysis has not been through academic peer review. Please forward any corrections, comments, or further research by email.
What’s Next?
The significant volume of newly-available data will support ongoing analyses, including any future efforts to quantify the economic benefits of cycling infrastructure investment.
It was a pleasure to collaborate iteratively with Sarah Brickhill and Fiona Campbell[7] on this project.
Jake’s passion for walking and cycling was clear throughout the project, and, combined with his excellent technical capabilities, made for an exceptional piece of work. His attention to detail was incredible, and he very much went above and beyond in delivering the work. I am very happy with the quality of the outputs Jake provided and the value for money that they represented. Jake’s working style is also very collaborative and transparent.
— Sarah Brickhill, Manager of Transport Planning, City of Sydney, Reference letter, 24 August 2026[8]
If you have an interesting challenge in the urban analytics, transport planning or active transport space and would like to collaborate – let’s chat: jake@urbanspectra.com.
This post has been reviewed with the client before publication.
Links
- ↑ “Daily cycling trips in the City of Sydney local area”. cityofsydney.nsw.gov.au. City of Sydney. 2026-09-28.
- ↑ 2.0 2.1 Jake Coppinger (July 2026). Quantifying Cycling Trips in the City of Sydney (PDF). cityofsydney.nsw.gov.au (Report). UrbanSpectra Pty Ltd. Sydney, Australia: City of Sydney.
- ↑ 3.0 3.1 3.2 3.3 3.4 Jake Coppinger (July 2026). Quantifying Cycling Trips in the City of Sydney (HTML). urbanspectra.com (Report). UrbanSpectra Pty Ltd. Sydney, Australia: City of Sydney.
- ↑ “Cycling use estimates: methodology note” (PDF). Transport for London. 2025-05-17. Archived (PDF) from the original on 2025-07-30.
- ↑ Clover Moore [@clovermoore]; (2026-09-05). “What happens after we build a cycleway? Less traffic. More people. Better streets” – via Instagram.
- ↑ Aston Brown (2026-03-19). “Sydney’s inner west has the conditions for a cycling boom, but riders say the network falls short”. ABC News.
“Sydney is increasingly becoming a cycling city. We’ve got record numbers on new cycleways and we’re now the second highest users of Lime bikes in the world behind London,” Mr Graham said.
- ↑ “Singing the praises of an unsung City of Sydney hero”. news.cityofsydney.nsw.gov.au. City of Sydney. 2023-08-17.
- ↑ Brickhill, Sarah (2026-08-24). “Reference for UrbanSpectra”. Letter to Jake Coppinger. X133485.
The post 48,000 trips a day: UrbanSpectra’s cycling analysis for the City of Sydney first appeared on Jake Coppinger.
]]>The post Unpublished WestConnex zombie project docs demand ministerial intervention first appeared on Jake Coppinger.
]]>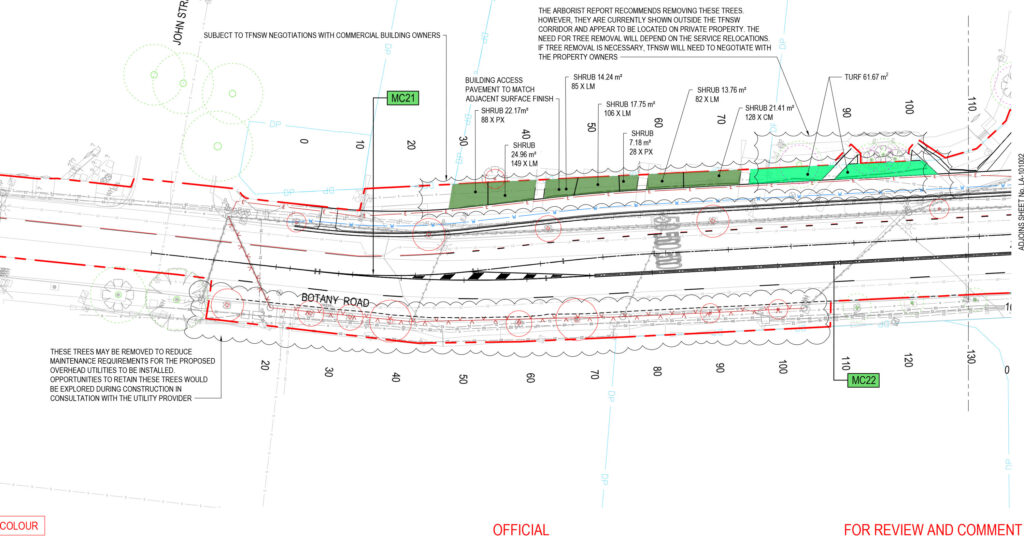
On Tuesday last week, Transport for NSW (TfNSW) closed feedback[1] on the Botany Road and McEvoy Street intersection upgrade, a multi-million dollar project to widen an inner-Sydney 4-lane road, just 400 metres from the Waterloo Metro station[a]. With transit-washing features like a bus lane away from the CBD during morning peak hour, perhaps your read about it in the Declan Bowring’s ABC article this morning[3] – with some cracking quotes from Eamon Waterford, Jamie van Geldermalsen (WalkSydney), Jennifer Kent, and Clover Moore: “It’s so disappointing the government is pursuing a road-widening project under the guise of bus improvement.” Botany Road needs bus lanes on both sides – without widening the road.
If you made one of perhaps ~127 submissions[4]: view-source: line 382 col 141050 to oppose this WestConnex zombie project[5], desecrating every Government policy you can point at, you’ll know you weren’t asked about trees. That’s because TfNSW appears to have deleted the question “I’m worried about tree impacts” less than 2 weeks before the form launched.[1]: props.pageProps.initialState.survey.surveyPage[9] It seems like TfNSW is worried about tree impacts too.
But the 9 trees – and additional 7 TfNSW murmured “may be trimmed”[6] but really “may require pruning or removal“[7]: p.38 – are the least of this project’s problems. While TfNSW promised your feedback would “inform the next stage of design”[1] the “100% DETAILED DESIGN” plans were actually issued over 9 months ago[7]: PDF pp. 216-258 and the detailed design contract ended 2 days after the end of the (publicly known) feedback period.[8]: web So much for TfNSW[9] (or Austroads[10]) consultation policy: not a single member of the public made a submission with a complete understanding of the project.[b]
So, dear reader – to inform your much needed submission to the Minister for Roads Jenny Aitchison and “share all relevant information to help the community’s understanding”[9] – given TfNSW GIPA staff previously described me as a “community advocate regarding the transport network” who has “contributed towards community consultation on issues of importance to members of the public”[11] – here’s an in depth analysis of the 258 pages of unpublished documents.[12] Read on to understand how TfNSW will try to rationalise this project in their upcoming Review of Environmental Factors “still being finalised”.[13]
This is a project that Deanne Forrest told a conference in July would go to market by Q3 of calendar year 2026[14], of which a February NSW Government report claimed “completion expected in 2026”[15], that NSW Government Planning currently claims is already under construction[16], that DPHI would waste millions on because someone is absurdly pretending it supports 10,000 homes which is 600 more[17] than the current ‘Woollahra train station rezoning’, which drew the uncharacteristically blistering attack “I am concerned the Network Operations Team responsible for this project appear to be operating in isolation from broader State Government objectives” from Clover Moore, and which has modelling predicting the road-widening “component” “impact” makes congestion worse.[c] Modelling documents detailing this must be in the public interest. TfNSW should have published it before asking what you thought – even the Epping Bridge consultation included the modelling.[18][d]
I’m not surprised they wanted to keep this modelling a secret. It predicts-and-provides more space for cars, with traffic survey data for this intersection taken before the Metro was even open.[12]: p.19 (PDF 25) In case you weren’t already aware, Network Operations have unchecked power over every traffic signal approval and every traffic signal timing in the state.[e]
Much like the partly-dead[23][f] Western Distributor (WD) vehicle capacity upgrade and the TfNSW Pyrmont-Ultimo Transport Plan – at “cross purposes”[28] to each other – “Transport for NSW is at odds with its own vision”. Bicycle NSW wrote about that WD project that “There’s a fundamental disconnect inside Transport for NSW … However, a powerful but fossilised group continues with the car-first mantra.”[29] If you accidentally subscribed to the feedback form twice, even the message you see is “it appears you have already subscribed. Contact westerndistributor@transport.nsw.gov.au if there are any issues.”[30] (per the public source code).
In the mighty ABC-printed words of a previous Minister for Planning, Minister for Transport and Roads, and Minister for Infrastructure – there are “two clans” in TfNSW, one “very people-focused, then there were those who were almost vehicle-focused”.[31] This project is as “vehicle-focused” as you get, with a side of transit-washing. The other quotes by this Minister were even more concerning. To be extremely clear, I’m making no suggestion of corruption regarding this project or any individuals involved. $20m is crumbs against “$62.3 billion for roads” over the next 4 years.[32]: 2:38 [g]
Go to drinks with any transport professionals (or enthusiasts) in Sydney, and it’s a matter of time until you hear a variation of ‘we just need to wait for these dinosaurs to retire’[h]. Waiting is not a strategy – we have waited an awfully long time: “Many senior officers are due to retire within the next 18 months and it is possible that things might then change for the better.” (~1971, papers of George Clarke, re. the DMR).
Less than a year ago, the Herald reported nearly half of TfNSW staff are reluctant to speak up about tough issues, which may “range from alleged corruption or malpractice to workplace matters”. More than three-fifths of staff felt burnt out.[33] There are so many dedicated staff in TfNSW, who do their best to implement excellent TfNSW policy, while navigating layoff after layoff and reorg after reorg – in workplace conditions that have landed even the most battle-hardened engineers on mental healthcare leave – who deserve so much better than this. TfNSW staff deliver world-class stuff when given the resources and institutional support of their leaders.
Professional engineers, heed Murray: “If something does not seem right, speak up”.[32] Every “city agency has its malcontents and its idealists and its malcontent-idealists”.[34]: p.1582 If things are not improving – get your tips safely[35] to the ABC or Aston Brown, who prints bangers like “You’ve got very powerful roads bureaucrats inside Transport for NSW that think big roads are the solution to every problem” (from staff who have spent over two decades inside the beast… and years at Transurban), and “In an internal email from January 2025, obtained under freedom of information laws, a traffic management director at Transport for NSW, Shane Schneider, said the department was not acting on any request for a 30km/h zone in Sydney’s CBD because of the government’s opposition to reducing speeds.” in The Guardian.[36] I hope it’s clear I have adherence to good policy and the public interest at heart.
It’s time to let the Minister know what you think.
Thank you to Eamon Waterford, Jamie van Geldermalsen and Jennifer Kent for your comments on this project in the ABC.[3] Thank you Better Streets[37], WalkSydney[38], No WestConnex (NoWPT)[39], Alexandria Residents’ Action Group[40], Friends of Erskineville[41] for campaigning against this, including folks across transit advocacy and housing supply side reform circles – who recognise road widening for cars is a terrible way to support more density. For anyone with a platform – nsw.gov.au/nsw-government/ministers/minister-for-roads-regional-transport is the call to action. Even a sentence or two is enough.
Can’t be bothered to read this post? I get it, the length is nuts. Treat the table of contents as the article, and click through if you want. I wrote this whole thing, unpaid, at reputational risk, and don’t even live near the proposal – because it’s important and advocates (and staff) are sick of this pattern from TfNSW. Any errors are my own, and this was hastily assembled to inform you – please email me if you spot any errors (and don’t be surprised if this page changes). Policy analysts, journalists, and search engines – this one’s for you.
Overview: how did we get here, and how does this modelling work?
As I detailed in my opening-shot 3 weeks ago (Just one more lane: TfNSW revives WestConnex zombie Alexandria to Moore Park road project) TfNSW have been thinking about this road widening for a very long time – since they were the DMR. It’s the intersection of both the Southern Arterial Route (~13,000 words, 168 references) and the Alexandria to Moore Park Project (~3,500 words, 80 references).
And this TfNSW-proposed project is a shocker. The project page says the bus lane is AM only because it was found to have “lower impacts on the wider road network than would occur in the afternoon peak”. Wouldn’t want to bother some private cars with a bus lane!
TfNSW requested ‘feedback’ for two weeks, with zero documents to rationalise it, saying the feedback would inform designs while modelling and detailed plans were finished months beforehand. It was clear some modelling must exist, given phrases like “57 vehicles would be spread across the alternative routes during the AM peak hour…”.[6] Eventually Clover published a letter naming a Transport Impact Assessment (TIA)[42] and off went my GIPA.
This post has as much as I could figure out from these documents[7] before the ‘new’, non-public, consultation end date of Friday 9 October.[13] You will also notice a terrific ABC article by Declan Bowring, published this morning.
What’s wrong with this modelling?
What is a Transport Impact Assessment (TIA), and why is this one no good? If you own land and want to build something big that might affect others, you have to file a Development Application (DA), and sometimes look at how it might affect nearby traffic patterns (the Impact). This TIA is to assess the government’s own proposal, to analyse the impacts of a transport infrastructure proposal. It’s important to remember the study does not propose the changes so is limited in suggesting alternatives; additionally the nature of a TfNSW-commissioned study to approve its own work comes with other hazards of course.
This TIA appears to have been started a while ago, before the Waterloo Metro opened, with haphazard dates on which traffic was surveyed between 2022 and 2025. Perhaps because it began some time ago, it uses an outdated TfNSW traffic forecasting model (STMv3.91 using TZP22), and the project doesn’t meet current TfNSW policy at all.
There are some concerning features of the modelling. In cases where future traffic volumes are negative (predicted to drop), it sets these growth rates to 0% – to take “a conservative approach” – where “conservative” means more likely to support the road widening.
It does some strange maths – like taking the number of cars at intersections from before the metro opened, taking TfNSW’s (outdated) yearly forecasts of increased car volumes, and apparently multiplying to arrive at how many cars will arrive at each intersection 10 years in the future. The dates are hard to keep track of – TZP22 data for growth factors “estimated by taking the difference between the 2021 and 2041 forecast years” (20 years), then 10-year and annual average growth percentages “vs. base” reported (and anything negative becomes 0). But some intersections have a 2021 base scenario, some have a 2022 one, and some have the May 2024 physical layout.[4]: 20 Remember we’re in 2026 and if it gets built in 2027, that means we’d be (2027-2022)/10 = 5 years into the estimated 10 year growth rates – and chances are that hasn’t actually happened.
Why not one more lane?
The just one more lane‘ mentality often parodied, and for good reason. It’s called “predict-and-provide” transport modelling, and the path is such a well-trodden fallacy that NSW Government policy[22][43] no longer allows it. Assume vehicle numbers will go up to argue more road capacity is needed, build more road capacity, then lo and behold – the predictions come true (requiring more roads to fix it, of course: “These improvements at McEvoy Street and Botany Road will help to ease traffic gridlock‘ that is already taking a toll on Waterloo and Alexandria as a result of WestConnex.“[44])
But when you don’t build, as Clover’s letter pointed out regarding the predictions of WestConnex-caused carmageddon[42], the predictions don’t come true – forgetting for a minute the foregone conclusion of why build a road… if it requires you to build another one to fix it. There are software packages in which you punch in such demand numbers and out comes a letter ranking – like a school report card – the weaponised technocratic method to argue something must be done. How could one argue against a calculator, especially when the numbers are secret – and better things to do with your time like me writing this page?
But like predicting growth rates of water flow, and the nature of water filling a pipe – filling a road to more than 100% capacity just is not possible (or more precisely, queues form and downstream intersections have lower demands). This is the sleight of hand of modelling road intersections independently – if one upstream intersection output limits the input of another intersection, the model wouldn’t know. Enough constrained inputs – and you end up with the Sydney CBD. You can’t have too much traffic if you can’t get a car in to cause it, and to state the not-obvious-enough: it’s challenging to get too much traffic on a bus lane (or two if necessary), and… you can’t have too much car traffic on our pedestrianised George Street.
Streets, and transportation, are for people
The problem with dismally predicting the future is forgetting our streets are malleable, and our government is elected with agency. In the clearest case, the predicted 255 cars/hour on Raglan Street between 8:45am-9:45am would be impossible in 2032 if we closed the road to cars! This is exactly what we now know TfNSW requested on Raglan Street just months ago, but was not popular.[45] Closing McEvoy and Botany is obviously extreme – but there’s no reason we can’t have a 24-hour bus lane along them both (TfNSW could always explain why they couldn’t). We must not forget the goal of big transport projects is not to move as many cars as possible, it’s to move people. Movement for the sake of it isn’t always necessary: there’s no need to decentralise Sisyphus down the hill and spend billions on wider roads (or high speed rail) to roll it back up, a downstairs coffee shop in an apartment only creates elevator traffic, and just existing on George Street or Strøget is a wonderful way to spend an afternoon.
Seeking feedback from the community without telling them enough about a project isn’t just rude, it’s against policy. This project’s modelling – let alone the existence of it – wasn’t made available to the public. Neither was the fact that a Review of Environmental Factors (REF) is being prepared. How the TIA and REF interact is anyone’s guess. Perhaps we should be grateful the public was asked for feedback at all.
Personally, I don’t want to be consulted only for TfNSW to ignore me – I want TfNSW to follow their own damn (good) policy. More consultation isn’t the solution here. This is why policy exists – for it to be followed when we’ve collectively agreed beforehand what needs to be done.
This long document outlines why it misses the mark. If it feels like you’ve read it all before, you have. I’m getting tired of it – and others have been repeating these points for a lifetime before I started.
Issues with the proposed project or modelling
The place of a TIA is stated earlier – this is an external analysis of a TfNSW proposal, so likely has limited range to suggest alternatives.
The TfNSW proposal is not in line with TfNSW policies
The proposal is inconsistent with a range of NSW Government policies and strategy objectives that seek to reduce car dependence, increase walking, cycling and public transport, create safer and more attractive places, and support sustainable urban growth.[42]
In the current TfNSW Connecting NSW strategy[43], one of the 6 priorities is “Reimagine road space to drive model shift”. It states:
In the past we have invested in additional capacity. While this approach can provide short-term relief, in the absence of providing attractive alternatives to driving, we often see the congestion return. We need to reimagine how we think about and use road space.[43]: p.26
Most critically, it states (emphasis mine):
We will rebalance road investment, from providing additional capacity for general traffic (such as through road widening), to reallocating of existing road space for public transport and active transport alternatives. More space for buses can lead to fewer vehicles moving more people.
The reallocation of road space will be required for high quality, frequent, turn-up-and-go bus services which can support the delivery of more diverse, ‘missing middle’ housing in areas closer to existing infrastructure, services and jobs.[43]: p.27
How does the TIA respond to this priority “Reimagine road space to drive mode shift”? It doesn’t – it only claims to address “Restore reliability and build resilience”:
The proposed bus lane is expected to increase bus reliability and is aligned with the priority “restore reliability and build confidence”.[12]: p.12
It then responds to this with “The proposed bus lane is expected to increase bus reliability and is aligned with the priority “restore reliability and build confidence”.”[12]: p.12 I think it’s quite clear the right turn ban has very little to do with bus priority measures.
The South East Sydney Transport Strategy (Transport, 2020) “envisions that “People travelling to, from and within South East Sydney choose walking, cycling and public transport” and identifies rapid bus infrastructure on Botany Road as part of its desired transport future.”[12]: p.12 [i]
The TIA finds TfNSW’s proposal does not consider or prioritise people walking or cycling first
The Existing performance and operations section assesses “Vehicle delay and intersection capacity”, “Bus on-time running” and “Road user safety”.[12]: p.12 Performance of the intersection for people walking or cycling is not assessed.[12]: p.12
Walking space on every single footpath adjacent to traffic on Botany Road and McEvoy Street is at Walking space LOS F – the lowest possible rating, even while “disregarding frequent obstacles such as street trees, lighting poles, bus stops, rubbish bins, and other utilities”.[12]: p.7
The signal wait times aren’t much better: even though “controlled crossings are spaced closely on McEvoy Street”, the “long traffic signal cycles yield a rating of D for the Austroads pedestrian crossing delay or detour level of service on the two blocks of McEvoy Street adjacent to Site 3” (Botany Road / McEvoy Street, aka TCS 45, 1940-11-25).[12]: p.8 On Botany Road the “Controlled crossings are spaced far apart”, resulting in a rating of “LOS E- for crossing delay or detour”.[12]: p.8
Cycling isn’t any better: “Dedicated cycling infrastructure is not provided on either Botany Road or McEvoy Street”.[12]: p.9 The TIA does appear to recognise the existing footpaths are too narrow to safely be designated as shared paths:
Cycling is not permitted on the adjoining footpaths for people over the age of 15 and should not be permitted within the existing road space allocation as the adjoining road related areas are not consistently wider than four metres, the minimum width for a shared path stipulated by Transport’s Cycleway Design Toolbox.[12]: p.9
The TIA finds TfNSW may be overstating project safety benefits
Of the four proposed changes, the TIA identifies two are likely to modify crash risk[12]: p.65 (PDF 71) ; there are 5 mechanisms within these two changes[12]: p.65 (PDF 71) , and only 1 of the 5 conditions is included in the Austroads Road Safety Engineering Risk Assessment Part 6: Crash Reduction Factors (AP-T151-10).[12]: p.65 (PDF 71)
The Austroads’ Road Safety Engineering Risk Assessment Part 6: Crash Reduction Factors (AP-T151-10), where adding a right-turn lane is described as “intersection – right turn lane”, estimates a reduction in crashes by 30-35% in an urban signalised intersection, but confidence in this estimate is low.[12]: p.65 (PDF 71)
The TIA notes evidence from North America reports of a statistically significant association between increased crossing distance and increased pedestrian casualty risk after controlling for pedestrian and vehicle volumes.[47]
The TIA notes that superseded RTA guidance[48] states that fully protected right turns are likely to significantly reduce crashes between opposing vehicles turning and marginally reduce crashes with people walking. The TIA finds:
However, the more recent Austroads guidance does not adopt these estimates as the evidence for these estimates (which is not presented in the superseded RTA guidance) is not strong enough to quantify their effect based on crash type.[12]: p.65 (PDF 71)
It then concludes:
In sum, there is not enough scientific evidence to confidently quantify the expected impact of the Proposal on crash risk at the site. It is probable that the Proposal will reduce the risk of vehicle-vehicle crashes by some degree, but it is unclear what impact the Proposal will have on the safety of people walking, who are currently the only road user type represented in trauma at Site 3.[12]: p.65 (PDF 71)
I expect TfNSW may call on the Pedestrian Protection Program (PPP) findings to draw safety conclusions.[49][50][51][52], with statistical analysis by Monash University[53]
I am not aware of any substantive critique of this analysis – but the analysis did find at some intersections:
Further, it was revealed that delay treatments are more effective than adding arrows to control traffic movements. This is a positive finding given that changing the signal phasing to provide a timed delay for pedestrians to cross is easier to implement and less costly than changing the infrastructure to add turn arrows.
The project is not aligned with City of Sydney policy
The proposal is inconsistent with City of Sydney policies and strategy objectives that seek to reduce car dependence, increase walking, cycling and public transport, create safer and more attractive places, and support sustainable urban growth.[42]
While the project includes a southbound, away-from-city, AM-peak bus lane and road widening, it could narrowly be interpreted as aligned with the City’s strategy to Reallocate Street Space[12]: p.6 (PDF 12) :
The Access Strategy and Action Plan Continuing the Vision (CoS, 2023) explains the City of Sydney’s approach and commitments to managing access and transport to support environmental, social and economic outcomes.
The proposed bus lane is aligned with Strategy B Reallocate Street Space, a principle of which is to reallocate street space to space-efficient users including public transport.[12]: p.6 (PDF 12)
To be clear, Strategy B: Reallocate street space in the Access Strategy includes in principle B1 “We will work to provide street space for the most economically important and space-efficient users, especially people walking, cycling and on public transport.”[54]: p.17
In a cruel twist, the City’s Access Strategy republishes a map from Transport’s 2021 Tech Central Place-Based Transport Strategy[55][j] – labelling Botany Road with “Time-sensitive opportunities to reallocate road space”, specifically “2026 (post opening of Western Harbour Tunnel)”.[55]: p.29 [54]: p.18 [k]
Adding McEvoy St turn bans to increase private vehicle capacity along a road without a single bus route, and widening a road – then adding a bus lane away from the city during morning peak hour – is not reallocation!
The traffic forecasting model doesn’t even include local streets, for diverted cars
The Traffic Forecasting Model (STFM) used (STMv3.91, TZP22) does not include local roads. Local government is responsible for around 90% of the NSW road network by length.[56] The TIA predicted redistribution of trips from arterial roads to local roads. “more localised trips which may not be fully represented in STFM due to the simplified network representation.”[12]: p.44
To address this concern, the TIA recommends local roads are studied by TfNSW before the project is initiated, and monitored for impacts.[12]: p.63 I fear such impacts might be interpreted like Sydney Metro C&SW CoA D12[57] (and perhaps around every Metro West station captured by CoA E126 and E124) as ‘measuring and preserving the Level of Service. We know what sort of projects that leads to – you’re reading about it now.
The project does not even consider implementing safer speeds
More broadly, cities which have achieved Vision Zero[58][59] do not seek to maximise private vehicle road capacity by implementing turn bans and such, but – in the words of previous NSW Road Transport Minister Andrew Constance in a 2019 Norway visit – approached road safety in a “very different way”.[58]: web
There is excruciatingly clear evidence that reducing urban speed limits increases road safety, among many other benefits. I note that:
- the current speed limit is 50 km/h
- The Alexandria to Moore Park project proposed to increase speed limits to 60 km/h.[60]
- In August 2018, the City of Sydney was urging the state government to implement a 40 km/h speed limit across the A2MP project.[61]
- TfNSW stated in April 2020 they would initiate a review to reduce the speed limit to 40 km/h after the opening of the New M5 and St Peters Interchange (WestConnex) “to support the government’s commitment to Vision Zero.”[62]: 47 (PDF 56) – yet the WestConnex M8 opened in July 2020.[63]
- the speed limit changes in November 2024 that included “St Peters and Alexandria” excluded the state roads making up A2MP.[64]
- As of current OpenStreetMap data, the speed limit on McEvoy Street[65] and Botany Road[66] here is 50km/h.
The TfNSW-commissioned modelling uses outdated predict-and-provide methodology
Fundamentally, the Transport Impact Assessment is technically flawed, and not aligned with current TfNSW guidance. It must be noted TfNSW commissioned this modelling, it was likely conducted some time ago under older guidance, and it mentions a 2025-10-13 discussion between Arup and Transport resulting in agreement for intersections to be modelled in isolation.[12]: p.25
The TfNSW Transport Modelling Guidelines define ‘Predict and Provide’ traffic modelling as modelling “which extrapolates historical trends and allocates capacity to meet the projected demand.”[22]: p.175 This is exactly how the intersections have been modelled: “To estimate future traffic volumes, growth factors have been assumed” from the (outdated) base scenario, calculated from (outdated) forecasts, and then increased in cases where negative traffic demand is expected.[12]: p.41
According to the 2025 Guidelines, “Vision and Validate” model states that if the answer to the question “Does the project fit the broader strategic vision for the city?” is no – the proponent should go back to the “Start”.[22]: p.34 To illustrate the contrast, the outstanding example Project Objective in the 2025 Transport Modelling Guidelines is to “increase public transport mode share to the CBD in the AM peak hour”.[22]: p.34 The irony is not lost on me that this example goal of current best practice is literally in the opposite direction to the bus lane in this project.
A fudge factor of a “2% annual growth rate” is added on top of the vehicle growth volume for pedestrian volumes, to “account for any additional pedestrians that may travel through the intersection due to development in the surrounding area.”[12]: p.42 I don’t know about you, but I see a lot more people walking out of the Waterloo Metro station than cars.
The feature which appears to most increase private vehicle intersection capacity – the right hand turn ban – routes traffic onto local streets. The strategic traffic model doesn’t even include local streets, and microanalytical simulation is explicitly not suitable for “studies with alternative paths, diversion via “rat-runs”, or downstream bottlenecks that influence arrivals.”[22]: p.175 Microanalytical simulation is not suitable when there is “multi-intersection coordination”, for which “whole corridor evaluations are required”.[22]: p.175 TfNSW keeps SCATS signal phasing secret, but I expect it is highly unlikely signals along both arterials are ‘divorced’ (to use outdated SCATS terminology) and therefore not coordinated. The C in SCATS stands for coordinated, and this typically increases private vehicle capacity.[l]
TfNSW model outputs predict increasing vehicle growth
The current Connecting NSW strategy states “we need to stabilise traffic growth in our cities and suburbs”.[43]: p.26 The very first measure, or performance indicator, of achieving “Reimagine road space to drive mode shift” is a reduction in “Private vehicle kilometres travelled in urban areas”.[43]: p.38
Meanwhile, the TIA states “To estimate future traffic volumes, growth factors have been assumed”.[12]: p.41 (PDF 47)
The modelling ensures it won’t achieve a reduction in “Private vehicle kilometres travelled in urban areas”, as “A conservative approach has been taken and all growth rates have been floored at zero.” That is, in any case where the (at least 4-year-old) Strategic Traffic Forecasting Model[m] predicted negative vehicle volume growth – it is changed to be 0!
At one point, Raglan Street wouldn’t had no cars
To illustrate the futility of assuming continuously increasing vehicle volume demands at intersections – only 7 months ago there was a proposal to ban cars on Raglan Street (at Henderson/Botany/TCS 47).[68]
No alternative is modelled that doesn’t involve road widening
To “better understand the impact of the individual components of the Proposal” the TIA also models two alternative options, along with the ‘do nothing’ scenario (Future base) and the Proposal.
The Road widening is present in every single option (apart from ‘do nothing’). The Bus Lane is only present in the Proposal.
| ‘do nothing’ (“Future base”) | Option 2 | Option 1 | Proposal | ||
|---|---|---|---|---|---|
| Changes in scenario | None | Road widening, bus stop relocation | Road widening, right turn ban, bus stop relocation | Road widening, right turn ban, AM southbound bus lane, bus stop relocation | |
| 2022 AM peak DoS | 0.98[12]: p.22 | – | – | – | |
| 2022 AM peak LoS | D[12]: p.22 | – | – | ||
| 2022 PM peak DoS | 0.91[12]: p.23 | – | – | ||
| 2022 PM peak LoS | D[12]: p.23 | – | – | ||
| 2032 AM peak intersection DoS | 0.836[12]: PDF 128 (diff -0.144 vs 2022?) | 0.88[12]: p.67 (diff +0.044 vs ‘do nothing’) | 0.69[12]: p.67 (diff -0.19 vs op.2) | 0.68[12]: p.67 (diff -0.01 vs. op.1) | |
| 2032 AM peak intersection LoS | D[12]: p.1 (or D[12]: PDF 128 ) | D[12]: p.67 | C[12]: p.67 | C[12]: p.67 | |
| 2032 PM peak intersection DoS | 0.898[12]: PDF 128 (diff -0.012 vs 2022?, +0.062 vs AM) | 0.86[12]: p.67 (diff -0.02 vs AM) | 0.69[12]: p.67 [n] (=AM) | 0.69[12]: p.67 (=op1… diff +0.01 vs AM) | |
| 2032 PM peak intersection LoS | D[12]: PDF 128 | D[12]: p.67 | C[12]: p.67 [n] | C[12]: p.67 | |
| Pedestrian LoS | F[12]: p.7 (lowest) | ||||
| Detour LoS | crossing McEvoy St: Wyndham – Botany[o] | D+[12]: p.8 | |||
| Detour LoS | crossing McEvoy St: Botany – George[o] | D-[12]: p.8 | |||
| Detour LoS | crossing Botany: Henderson/Raglan – Buckland/Wellington[o] | E-[12]: p.8 | |||
| Detour LoS | crossing Botany: Buckland/Wellington – McEvoy[o] | E-[12]: p.8 | |||
| Detour LoS | crossing Botany: McEvoy – Mandible[o] | E-[12]: p.8 | |||
| Detour LoS | crossing Botany: Mandible – Bourke/O’Riordan[o] | E-[12]: p.8 | |||
| Mean crossing delay (s)[p] | Crossing McEvoy St: Wyndham – Botany | 59.5[12]: p.8 | |||
| Mean crossing delay (s)[p] | crossing McEvoy St: Botany – George | 43.5[12]: p.8 | |||
| Mean crossing delay (s)[p] | crossing Botany: Henderson/Raglan – Buckland/Wellington | 57.8[12]: p.8 | |||
| Mean crossing delay (s)[p] | crossing Botany: Buckland/Wellington – McEvoy | 59.0[12]: p.8 | |||
| Mean crossing delay (s)[p] | crossing Botany: McEvoy – Mandible | 55[12]: p.8 | |||
| Mean crossing delay (s)[p] | crossing Botany: Mandible – Bourke/O’Riordan | 52.3[12]: p.8 | |||
| Protected cycleway intersection LoS? | None | None | None | None |
See page numbers for per-approach values.
I wish to direct your attention to how little the modelled outputs change with the proposed road widening.
Inexplicably, the modelled 2032 AM-peak Degree of Saturation suggests more private vehicle congestion in the AM peak if the road is widened, than if nothing is done at all (‘do nothing’ 0.836[12]: PDF 128 , option 2 0.88[12]: p.67 ). Am I getting that right – what’s going on there?
Note for Option 1 in the PM peak, “the only sensitivity test is against Option 2 where the right-turn ban is removed.”[12]: p.67
Is a 24 hour bus lane without widening feasible?
After speaking with “a few people familiar with this part of the network and the project”, Ben Wood (board member of the Transport Professionals Association) raised concern that more ambitious reallocation would unacceptably impact private vehicle congestion. After discussion, I think the strongest point raised was potential delays for southbound buses turning right onto McEvoy.[69]
While there are southbound buses that need to turn right onto McEvoy Street, only 2 of 30 bus services in peak hour[4]: p. 10; §Table 5 , of the “four bus routes” considered in the analysis[4]: 10 , are southbound & right turning[4]: p. 30; §Figure 23 I expect (and hope) for bus volumes on all legs of this intersection to increase.
Unfortunately, given the tight ‘feedback’ timeline I haven’t had the chance to suggest or draw up or evaluate alternative design proposals – but there is absolutely nuance in how best to reallocate road space for public and active transport.
If vehicle volumes are suitably modelled (perhaps not microscopic, isolated intersection[12]: 62 and fixed-demand, and in alignment with evaluating policy-aligned proposals), perhaps further interventions may be required to reduce southbound private-vehicle volumes to ensure turning buses are not delayed. To reduce southbound private vehicle demands, the reversion of Botany Road to two-way operation through Redfern, as previously requested by the City of Sydney (and even the Redfern-Waterloo Authority)[70][71][72][73][74][75][70], would have significant benefits. Given the need for increased people moving capacity, I do not see why there should not be a bus lane all the way up and down the Southern Arterial Route from the (destroyed) Allen Street pedestrian crossing – as suggested by Hassell in 2020[76] and TfNSW in 2024.[77]
TfNSW wrote in the community notification the project “allows us to improve bus reliability with lower impacts on the wider road network … while continuing to investigate broader bus priority opportunities”.[78] Unfortunately, the word “opportunities” is too often wielded to do nothing a all. If this project is indeed the “first stage” of changes, it it greatly concerning other parts of A2MP Stage 1 are more likely than bus lanes. It must be noted bus lanes were considered outside the scope of the A2MP Stage 1 REF.[62]: pp.40,41 (PDF 49,50) There is little visibility of what comes next for the corridor.[69]: web
I do not accept preserving, or increasing private vehicle capacity, is the best way to service new density.[69]: web I do not accept the project does not attempt to preserve or increase private vehicle capacity.[69]: web
I await further evidence of the safety impacts of dedicated right turn lanes on pedestrian safety, considering the guidance cited in the TIA.[12]: p65;§7.4 Road Safety
The AM peak is when a bus lane is needed least on Botany Road
The first objective given on the project website is for ‘efficient bus services’[6] – so does this project deliver this goal optimally?
“Buses travelling in a southbound direction through the corridor exhibit a much higher OTR [On Time Running] proportion”[12]: p.31 , however this may be due to some services (306,310) having a Redfern start location.[12]: p.31 The On Time Running percentage of buses drops when running in both directions[12]: p.31 , suggesting a northbound bus lane is required.
Between 53% and 82% of northbound bus services in the AM peak are not on time[12]: p.31 , yet no northbound bus lane is proposed. This suggests not only is a northbound bus lane required here – but also earlier in the route of such services.
In the AM peak, the OTR proportion for southbound services decreases by 15% from stops 1-3[q], and in a northbound direction the OTR drops by 18%[r]. That is, in the AM peak – when TfNSW is proposing a southbound bus lane – a greater percentage of northbound buses are getting delayed than southbound buses.
On time running is lower in the PM peak than the AM peak[12]: p.31 , while a bus lane is only proposed in the southbound direction. Examining services which “all travel north/south along the length of the corridor”:
| Peak | Direction | Start OTR | End OTR | Change in OTR |
|---|---|---|---|---|
| AM | Northbound | 35% | 29% | -6% |
| AM | Southbound | 89% | 86% | -3% |
| PM | Northbound | 30% | 18% | -12% |
| PM | Southbound | 83% | 81% | -2% |
The worst bus delays appear to be northbound northbound, but analysis was out of scope
Why does the 30% to 18% OTR for NB1-NB4 in the PM peak for routes 306/309/310 not get a single mention? It notices “Similarly, in the PM peak, we see a reduction from 83% to 81%.”[12]: p.33 , but it doesn’t say anything like – perhaps because “Given this study is focused on the potential inclusion of southbound bus lanes, all subsequent analysis will focus on southbound bus stop and routes” – that “In the PM peak, we see a reduction from 30% to 18%, a 12% reduction in on time running between 3 stops.”? 60% of northbound buses in the PM peak become late when using Botany Road – yet TfNSW does not even consider the need for a northbound bus lane. The “most noticeable change is for route 306 in the PM peak”, which progresses from 88% on time to 83% on time – 5% more late running services – over just 2 stops.[12]: p.34
The TIA finds the most variable bus is the famed 370 – but no delays are quantified
The change in On Time Running numbers do not include the famously late 370 bus, which “shows the most variability, with a significant proportion of early services in the AM peak, and high proportion of both early and late services in the PM peak (with just 59% OTR)”.[12]: p.34
This is because the 370 only uses one stop on Botany Road, SB_3 201714 – Yudi Gunyi School, Botany Rd, WATERLOO.[12]: p.33
The amount of delay that the most-variable bus service suffers on this street is not calculated or shown. If the TIA cannot measure the amount of delay suffered by a bus running along a corridor, because it only stops once on the corridor[12]: p.35 , then the TIA is not viable.
Northbound bus delays are not analysed in detail
After finding that AM peak northbound buses are getting delayed more than southbound ones:
Given this study is focused on the potential inclusion of southbound bus lanes, all subsequent analysis will focus on southbound bus stop and routes.[12]: p.33
No graphs of On Time Rates for northbound buses are shown, even though the largest change in On Time Rate is the northbound PM services. There is a “4.2.4.3 Southbound OTR by route” heading, but no “Northbound OTR by route” heading.
No bus delays on McEvoy Street are modelled
The project – recognisable as part of the Alexandria to Moore Park Corridor – at no point recognises that there is no bus route that uses McEvoy Street both east and west of Botany Road.[12]: p.30 How could a bus lane be required on McEvoy Street if there are no bus routes that run late – because there are none?! If TfNSW holds SP2 land reservations ready to widen McEvoy Street in desperation to increase the capacity of this street – why are there no bus routes and bus lanes?
Perhaps there’s a good reason why there are no bus routes that use McEvoy Street, perhaps from Alison Road to Euston Road and beyond. I don’t know of one.
I note that while consideration was requested,[62]: 40 (PDF 49) dedicated bus lanes and “Reallocation of road space for public transport priority at key intersections along the corridor” were considered outside the scope of Stage 1 the Alexandria to Moore Park project. The Submissions Report stated road space reallocation would instead be considered as part of planning for “new major transport projects” such as the Waterloo Metro station or Eastern Transit Corridor.[62]: 41 (PDF 50) The report pointed out “There is no bus route that travels along the full extent east-west extent of the proposal area.”[62]: 40 (PDF 49)
The modelling uses outdated traffic volume data, mostly before the Metro opened
It is challenging to figure out exactly what data was captured when. See the timeline for more items. The oldest data of all surveyed sites is for the project site.
| Intersection | Survey date |
|---|---|
| Botany Road / McEvoy Street | 2022-11-23[12]: p.20 |
| Botany Road / Bourke Street | 2024-05-21[12]: p.26 |
| Botany Road / Buckland Street | 2024-11-03 to 2024-11-05[12]: p.17 |
| Botany Road / Raglan Street | 2024-05-21[12]: p.25 |
| Botany Road / Mandible Street | 2025-08-07[12]: p.24 |
Issues with project governance
The detailed design contract blew out to 3x the cost and more than 3.5x the duration
The Detailed Design of Botany Road and McEvoy Street Intersection Upgrade contract was originally scheduled to run from 2024-03-06 to 2024-12-04[8], a duration of 273 days.
The earliest Internet Archive capture (2026-03-12) of the detailed design contract page shows an Amended Contract Duration of 2026-03-31, and estimated (detailed design) cost of $740,754.30.[79]
At the time of writing, the Amended Contract Duration has a value of 2026-10-30 with an estimated cost of $2,195,737.97.[8] This is 695 days since the original contract end date of 2024-12-04, and 968 since the original contract start date of 2024-03-06. This represents an extension of the contract duration from 273 days to 968 days. It also represents a change in detailed design cost from $740,754.30 to $2,195,737.97, an increase in $1,454,983.67.
Put another way, the detailed design has taken more than 3.5 times longer than originally planned, and nearly 3 times as expensive as originally estimated. Some plans are also labelled revision 24.
I’m unsure if this is normal, but it hints suggestions plenty of churn behind the scenes.
It is not mentioned plans are prepared for the Easing Sydney’s Congestion team
The (secret) 100% detailed design was “PREPARED FOR: EASING SYDNEY’S CONGESTION SYDNEY PROJECT DELIVERY INFRASTRUCTURE AND PLACE”.[7]
As of 2026-09-27, the TfNSW Easing Sydney’s Congestion project page, which claims it has not been updated since 2026-04-01, makes no mention of the project[80] and neither does the project page.[6]
This project/department is well-known for their prior hits, like the Pinch Point Program[81] and increasing road capacity at Pitt Street and the Great Western Highway. My eagle-eyed readers will recognise that Pitt Street and the Great Western Highway is the second trial site of the ‘Manly AI camera’ – this time with the ability to detect vehicles.[82][83][84][85][86][87][88][s]
Another suggestion this project is related to the Pinch Point Program is the TIA states TfNSW identified the intersection as a key pinch point in Sydney’s road network[12]: p.2 [12]: p.1 I have not found such a statement in any public documents.
The Pinch Point Program is misaligned with current TfNSW policy
TfNSW states all Pinch Point Programs aim to[81]:
- Improve the operational efficiency of Sydney’s road transport network
- Improve traffic flow and maximise use of road space
- Help ease traffic congestion and improve the consistency of travel times for motorists, particularly during peak hours
- Result in the better management of responses to incidents and planned events
- Improve access of information to motorists while they are travelling on our road network
These aims are not in line with the Connecting NSW strategy, Movement and Place or the Road User Space Allocation Policy (RUSAP).
TfNSW has acknowledged Pinch Point Projects induce demand
A secret TfNSW report, studying the effects of Pinch Point Projects on traffic congestion, found the congestion “change is not stationary over time” which “may be due to the induced demand effect”.[89]: 16
SCATS data has been used to evaluate how infrastructure delivered under the “Pinch Point Program”[90] increased vehicle traffic flow and reduced congestion.
SCATS collects and stores a high volume of network efficiency operation data during normal SCATS operation, which is “readily available”.[89]: 10 This data was used to construct the Fundamental diagram of traffic flow to evaluate if an intervention increased the flow of vehicle traffic and a reduction in congestion.[89]: 11
Issues with the project page and feedback process
The project page includes a Project documents section without any documents
As of 2026-10-06, the Project Documents section on the website does not show any documents.
In response to my GIPA 26T-0120 (FOI request) requesting details of the Epping Bridge traffic modelling, the staff member found:
…disclosure of the associated traffic modelling considerations, analysis and discussion would inform the public of the underlying data that was used to support agency decision-making…[11]
The feedback form claims it would “inform the next stage of design” but TfNSW held 100% detailed designs
Some of the 100% detailed project designs are dated 2025-12-12 and 2024-09-25.[7]
As of 2026-10-03, there is no mention of any traffic modelling documents on the project page.
There is also no mention that TfNSW is preparing the “The Review of Environmental Factors (REF)”, which “will include the assessments and supporting technical information relevant to the proposal”. The REF is currently being finalised.[13] There is no public mention a REF is being created, and I was not aware one was being prepared prior to this email.
The form does not ask if respondents support the road widening
As of 2026-09-28, the “Botany Road Feedback Form”[t] included the following questions[4][u]
- I wish to subscribe to construction updates (Boolean yes/no, mandatory)
- Please provide your email address so we can keep you updated
- Email, mandatory
- Pick what best applies to you (multiselect[v])
- I live nearby / I drive here / I work nearby / I get the bus / I own a business or property nearby / I ride or walk past / Other (Other (please specify))
- What areas are most relevant to you? (multi checkbox)
- Botany Bus Lane / Botany Bus Stop Relocation / Botany & McEvoy Intersection Upgrade / Right-Turn ban from McEvoy onto Botany / Tree Removal or Environmental Concerns / Construction Concerns / Parking Issues / Other
- Looking at the proposal, what is your opinion on the following elements?
- The bus lane
- Definitely agree / Somewhat agree / Neither agree nor disagree / Somewhat disagree / Definitely disagree / Unsure
- The new right turn lane
- Definitely agree / Somewhat agree / Neither agree nor disagree / Somewhat disagree / Definitely disagree / Unsure
- Relocating the bus stop
- Definitely agree / Somewhat agree / Neither agree nor disagree / Somewhat disagree / Definitely disagree / Unsure
- The right turn ban from McEvoy
- Definitely agree / Somewhat agree / Neither agree nor disagree / Somewhat disagree / Definitely disagree / Unsure
- I wish the scope was bigger
- Definitely agree / Somewhat agree / Neither agree nor disagree / Somewhat disagree / Definitely disagree / Unsure
- The bus lane
- Please provide your feedback (textbox, max 2000 characters)
- Please provide your phone number so we can contact you directly as appropriate (textbox, max 12 characters, not mandatory)
Note that the form states “please provide your phone number” so TfNSW can contact respondents directly.
Multiple questions in the feedback form include considerable ambiguity
Let’s say you want the bus lane in the northbound direction, but don’t want the road to be widened. Let’s try and fill in the form together!
How would you answer “what is your opinion on” “The bus lane”? Definitely agree or definitely disagree?
Good thing there’s an opinion question on “I wish the scope was bigger”. How would you answer that? How would the “roads-focused” “clan”[92] interpret it?
Survey question “I’m worried about tree impacts” was deleted from the form
The TfNSW survey source code even shows the question “I’m worried about tree impacts” was perhaps deleted from the survey at 2026-09-02T13:51:34+10:00[1]: props.pageProps.initialState.survey.surveyPage[9] , with “Relocating the bus stop”[1]: props.pageProps.initialState.survey.statements.1667719 and “I wish the scope was bigger”[1]: props.pageProps.initialState.survey.statements.1667720 added the same second and updated 3 seconds apart about 8 minutes later.
Looks like TfNSW were worried about tree impacts too!
The project page / form do not mention the A2MP stage 1 REF, or if a REF is being prepared
My last blog post assumed this project would not require consultation, given this project was included in the A2MP scope, and that A2MP Stage 1 was approved and is still “in progress”.[5]
Initially I was planning to critique the project page and the feedback form not mentioning the A2MP Stage 1 REF approval at all – but now I also critique the project page does not once state feedback will contribute to – or that there are even plans for – a Review of Environmental Factors (REF) for the ‘Botany Road Project’[13].
The feedback form did not state this – it stated feedback would “inform the next stage of design”[1], and as discussed under the designated section – 100% designs existed months ago.
Issues with TfNSW transparency
Apart from the obvious points made in the introduction:
TfNSW have not published Strategic Travel Model details in 14 years
The growth rates underpinning the entire modelling are the outputs of a TfNSW model. The published outputs haven’t been updated since 2012.[93] Yet they’re available on request you say – I wrote to the listed email address on the website asking for a copy of the technical documents: “The email address you entered couldn’t be found”.
Why isn’t this open data? A reminder that data available on request, perhaps with a query of ‘what will you use this for’, is not open data.
TfNSW have not released SCATS-derived signal phasing or volume data relating to the project
Why shouldn’t the public have access to government data about traffic signal operation? As printed by Declan Bowring in the ABC
“I think signal timing data should be as public as a public train network timetable,” Mr Coppinger said.”[94]
Did you know in 2009 RailCorp threatened software developers with legal action over breaches of Crown copyright, because they made an electronic train network timetable, and the government had “concerns over the potential inaccuracy of timetable data on the apps”! By 2012 Gladys said “Obviously if we do embark on that in the future we want to make sure the organisation we are dealing with is going to respect the integrity of the data we are providing them and is going to make sure that they are used in a good way that’s going to help people.”[95] There’s even a paper on this – how have I not come across this![96]
I’ve written plenty on signal timing data, so I won’t repeat myself. Don’t worry, you’ll have some very interesting things to read soon.
- 2025-09-24: Green Lights More Often: The Secret 2018 Study of Sydney’s Traffic Signals
- 2025-05-15: No Signal for Pedestrian Safety: TfNSW Refuses Signal Data During National Road Safety Week
- 2024-08-22: Why Did the Chicken Catch the Metro? Because It Was Faster Than Crossing the Road…
- 2025-07-01: Preliminary Analysis of Better Intersections Data
- 2023-07-10: Shining a Light on the Traffic Signals of Sydney
- 2023-06-12: Mapping pedestrian traffic light timing in Sydney, Australia
- 2022-12-19: Sydney CBD is bringing back pedestrian “beg buttons”
On politics, and housing
I want to make it clear I don’t oppose this project in an underhand way to oppose new housing[97]: web – like some perhaps oppose sewage network upgrades[98][99] – I oppose it because reallocating road space can support more housing.[43][100][101] I show up for more homes – including in my neighbourhood – while keeping space for constructive critique and improved design, especially in the space between buildings.
In fact, it appears a strategic way to oppose housing is to commission private car LoS-focused modelling not unlike this modelling. This has been effectively weaponised to argue more than 3,600 homes further east means carmageddon.[102] If you want to fight new housing take note: assume people will drive, keep your SIDRA files and data under wraps while wailing about vehicle Levels of Service, and voila: closed source computer model says no.
Density dumping, often on the worst state roads, is unfortunately the path of least political backlash.[97]: web Thalis said the state plan for Woollahra “needs to be much much better”[103]: 2:40 [w] – and you know what, it probably could be. While the plan legalises tall buildings to fund a new train station about 3km from Australia’s largest city with an ambition recently unheard of, TfNSW writes “a key challenge” to building walking and cycling infrastructure is “Road width constraints and on-street parking may limit potential upgrades.“[104][104]: 6 Backlash to a forest of towers, yet TfNSW considers on street parking a challenge for cycleways and footpaths – are you kidding me?! It seems TfNSW buried the PBN well: “Based on the strategic cycleway corridors planned by Transport, no future strategic corridors have been identified for Woollahra”.[104]: p. 30 [x]
But someone in TfNSW also wrote “…the provision of homes in Edgecliff and Woollahra results in a net reduction in vehicle kilometres travelled by car across the GMA, when compared to a base case where this growth might have taken place in locations further away from public transport and amenities. This is illustrative of the potential benefits of transport oriented development as opposed to ‘organic’ growth in areas less well served by existing public transport and amenities.“[104]: p. 97 – and they’re right! We need denser cities and reduced vehicle kilometres travelled.
This is how we reduce VKT and emissions, this is how we increase walking per Vivendi’s modelling[109], this is how we get out of the doom loop of widening/building 76.5 km of “magnificent” new roads in south-west Sydney[110], this is how we ensure a compact city – and I haven’t even mentioned housing supply. We can’t afford to keep spending billions on freeways to the greenest of koala habitat greenfields to satisfy the midcentury decentralisation dreams[111][112] of planning academics who would be the last to leave Sydney – I wouldn’t want to leave either. Decentralisation is cities for other people.
We should not blindly follow the car-obsessed, “roads-focused” TfNSW “clan” and their road widening agenda. If TfNSW won’t get with the program, DPHI should ignore them – if they haven’t figured this out already.[113] We must be ambitious in our road space reallocation for bus lanes and active transport – for climate, for housing, for fiscal prudence, for road safety, for equity.
Appendix
How many responses did TfNSW receive?
The source code also showed “responsesCount” was (timestamps in GMT unless stated): (right click > view source -> Cmd/Ctrl+F):
- 111 by 2026-09-25 02:54:04 GMT
- 115 as of 2026-09-25 15:58[y]
- 120 by 20260927022613
- 127 by 20260928020446[4]
- 129 by 2026-09-28 10:07 Sydney time.[y]
- 133 by ~2026-09-28 22:53 Sydney time.[y]
Note the feedback form closed at some time on the 29th, while I received a letter on 2026-10-02 that feedback may be received until 2026-10-09.[13]
Documents
Proper citations are included under References.
- Project page – Botany Road and McEvoy Street intersection and bus corridor improvements[6]
- Policies / guidelines
- Connecting NSW[43]
- TfNSW Transport Modelling Guidelines[22]
- TfNSW Stakeholder and community engagement guidelines[9]
- Tech Central Camperdown-Ultimo Place-based Transport Strategy (2021)[55]
- Austroads Guide to Project Delivery Part 2 – Planning and Control[10]
- City of Sydney Access Strategy and Action Plan – Continuing the Vision[54]
- Assorted information
- Infrastructure Opportunities Plan – Greater Sydney (PDF, February 2026)[15]
- NSW Department of Planning – Accelerated Infrastructure Fund (Website)[16][z]
- NSW Government Transport Infrastructure Industry Portal[114]
- Minor Projects presentation (Deanne Forrest)[14]
- Secretary Josh Murray opening address[32]
- Detailed design contract (Buy.nsw).[8]
- Other media
- Woollahra Rezoning Fiasco? (The Sydneyist)[103]
- TfNSW Reply to Jake Coppinger, 2026-10-02[13]
- Prior blog post by Jake Coppinger: Just one more lane: TfNSW revives WestConnex zombie Alexandria to Moore Park road project [5]
- Notice of decision, GIPA 26T-0120 (Epping Bridge).[11]
Clover Moore’s letter
The following 3-page letter was published on Facebook and Instagram.[42] I republish the OCRed text here, on an easily indexable and crawlable site, for the benefit of search engines.
—
The Rt. Hon. The Lord Mayor of Sydney
CLOVER MOORE AO
10 September 2026
The Hon. Jenny Aitchison MP
Minister for Roads
52 Martin Place
Sydney NSW 2000
Dear Minister
Botany Road Bus Lane and McEvoy Street Intersection Upgrade
I write about the NSW Government’s proposed Botany Road Bus Lane and McEvoy Street Intersection Upgrade. I am deeply concerned about this proposal and how it will impact traffic, transport and amenity in south Waterloo.
A history of overestimating traffic demand
In 2017, Roads and Maritime Services (RMS) put forward the Alexandria to Moore Park Road Connectivity Upgrade proposal to widen Euston Road, McEvoy Street, Lachlan Street, Dacey Avenue and Anzac Parade. The proposal was in response to RMS predictions that traffic on the corridor would increase by 50% or more by 2021.
On the City of Sydney and community’s urging, the NSW Government wisely did not proceed with this proposal. This avoided untold social, health and amenity impacts on Alexandria and Waterloo, as it would have severed the neighbourhood with a six lane highway.
The traffic volumes have decreased in the 10 years since RMS’s original predictions.
The modelling approaches used for such projects are not fit for purpose in inner-City locations that are well served by public transport, people walk more, and where the City has been building alternative options through our successful cycling network.
The Transport Impact Assessment for this latest proposal for Botany Road makes no compelling case for investment in the project, which would have significant impacts on amenity and safety in the local area.
Could you please reconsider this project in light of the evidence that increasing road capacity can induce additional traffic demand, in an area where the priority should be enhancing pedestrian amenity rather than further diminishing it?
Questionable improvements to bus services
While presented as a bus improvement project, the changes proposed primarily benefit private vehicles through increasing the road capacity. This will encourage more drivers to use this route while doing little to improve bus priority in the peak direction. You will be aware that the proposal is that the southbound bus lane would operate only in the morning – that is, in the counter peak direction – and operate as an additional travel lane for the remainder of the time.
Further, the Transport Impact Assessment does not provide an adequate assessment of current bus performance and issues, and fails to show how the proposal will improve bus services against Transport for NSW’s (T/NSW) key customer requirements of reliability and travel times.
I ask that you please get TfNSW to provide a robust justification for how this project responds to any counter-peak bus service problems of reliability and travel time.
Diverting regional traffic into local streets
The proposed turn bans will divert traffic from state roads into local streets, increasing traffic volumes and reducing safety and amenity in residential neighbourhoods. Local streets are for local access, and we have worked hard in our area to create safe, liveable streets where people want to walk, cycle and spend time. People living in the City are extremely sensitive to their streets being used as a ‘relief valve’ for the state road network.
I am strongly opposed to the assumption that local streets can be used to enable greater capacity on the state road network and ask that you consider the impact on the local community.
Compromising pedestrians for more traffic
The proposal includes road widening at several locations in Botany Road, significantly narrowing verges and footpaths near the McEvoy intersection. The wider roads, longer pedestrian crossing distances and wide radius corners will increase vehicle speeds and put people walking at higher risk. While the City supports real prioritisation of buses, this project does not offer any tangible priority for peak period bus customers, and should not come at the expense of footpath and trees.
I ask that you work with the City to look at how we can facilitate movement without increasing traffic capacity or compromising residential and pedestrian amenity.
Poor strategic alignment
The proposal is inconsistent with a range of NSW Government and City of Sydney policies and strategy objectives that seek to reduce car dependence, increase walking, cycling and public transport, create safer and more attractive places, and support sustainable urban growth.
It is also at odds with the NSW Government’s vision for enhanced liveability and placemaking in the renewal of Waterloo South and the significant investment in enhanced public transport through the delivery of the Waterloo Metro.
I am concerned the Network Operations Team responsible for this project appear to be operating in isolation from broader State Government objectives.
The City’s own vision for the Botany Road Enterprise Area is for a high-quality public space along Botany Road to support people accessing much denser employment and commercial uses, rather than increased traffic volumes.
I request an urgent meeting to discuss the above issues.
I have also written to the Minister for Transport on this matter.
Yours sincerely
Clover Moore AO
Lord Mayor of Sydney
Timeline
Note: This timeline is incomplete. All dates in this page are in ISO8601 for easy searching / ordering.
- 1940: MRDP Part 1 (unpublished)[115]
- 1961-08: De Leuw Cather (DLC) Geometric Design Study[116]
- This report proposed a new “east-west” route, similar to the 1974 Midwestern Expressway,[117]: II – 22 (PDF 87) to take pressure off the proposed (and unbuilt) Ultimo Interchange (in Glebe).
- 1974: Sydney Area Transportation Study (SATS)
- Recommended “Dacey Avenue/Lachlan Street/McEvoy Street/Copeland Street/Swanson Street” route be developed to a “major regional road standard with six traffic lanes” from Anzac Parade to King Street, Newtown, as work to be done 1975-2000.[117]: II 41 (PDF 106)
- Also recommended a “Midwestern Highway”, a “major artery” including a segment from Alexandria to Anzac Parade, from Johnston’s Creek Route, with 4 through lanes of expressway standard, suggested phased opening from 1991 to 2000, utilising Erskineville Road, Swanson, Copeland, Fountain, McEvoy and Lachlan Streets and Dacey Avenue.[117]: II – 22 (PDF 87) )
- 1981: Recommendation for existing arterial routes, including Botany Road and Mitchell Road/McEvoy Street, be “reinforced” in preference to the development of new freeway systems.[118][119]: 2
- 1981-04: Recommendation a route following O’Dea Avenue and Allen Street (via Short Street Reserve) to link with McEvoy Street/Euston Road, as preferred to upgrading McEvoy Street to an arterial road.[120]: 7/2 (McEvoy Street was considered a major barrier for access to Waterloo Oval.[120]: 7/2 )
- 1987-02: Pyrmont – Alexandria traffic management proposal EIS (Southern Arterial Route Stages 1-3): Wyndham Street Residents’ Alternative included “…To maximise efficiency at the Botany Road/McEvoy Street intersection, the proposed widening of McEvoy Street between Wyndham Street and Botany Road”[119]: 112
- 2004-11-05: GSTC Masterplan (for CSPC) External State Arterial Road (RTA) study, including an east-west relief route from Botany Road to Bourke Street to relieve pressure due to Green Square generated traffic on the Botany Road / Bourke Street intersection., considered to be a critical element of the proposed Green Square Town Centre road system.[121]: p.32
- 2016-12: Matt O’Sullivan scoop on upcoming Duncan Gay-backed project for “traffic funnelled from the WestConnex motorway”. “Mr Gay accused Sydney lord mayor Clover Moore of approving thousands of high-rise apartments in the inner south “with little thought about the impacts to the local road network and the families…”.[122]
- 2019-07-08: A2MP scaled back temporarily.[123][124]
- 2022-11-23 (Wednesday) The traffic survey at Botany Road / McEvoy Street.[12]: p.20 . This is 1,391 days before public announcement of the current project, or about 3.8 years.
- 2024-05-21 (Tuesday): A traffic survey was undertaken at Botany Road / Bourke Street / O’Riordan Street (TCS 346)[12]: p.25 and SCATS data[12]: p.26
- 2024-05-21: (Tuesday): Traffic survey[12]: p.14 (PDF 20) and SCATS data for Botany/Raglan (TCS 47).[12]: p.15 (PDF 21)
- 2024-08: Waterloo Metro opening, as noted in the report.[12]: p.13
- 2026-08-27: TIA version B date.[12]
- 2026-07-27T16:29:55+10:00: Feedback form created.[1]: props.pageProps.initialState.survey.createdAt
- 2026-09-02T13:39:20+10:00: Creation of survey question “I’m worried about tree impacts”.[1]: props.pageProps.initialState.survey.surveyPage[9]
- 2026-09-02T13:51:34+10:00: “Updating” of survey question “I’m worried about tree impacts”; perhaps deletion (the question is currently recorded with
"deleted": true,.[1]: props.pageProps.initialState.survey.surveyPage[9] ), creation of survey question “Relocating the bus stop”[1]: props.pageProps.initialState.survey.statements.1667719 and “I wish the scope was bigger” [1]: props.pageProps.initialState.survey.statements.1667720 - 2026-09-08T16:26:50+10:00: Most recent feedback form update as of 2026-09-25.[1]: props.pageProps.initialState.survey.updatedAt;props.pageProps.initialState.survey.modifiedAt [aa]
- 2026-09-09 12:46+10:00: yoursay.transport.nsw.gov.au/botany-bus-improvements published.[ab]
- 2026-09-28/2026-09-29: Closing of feedback form[4]
- 2026-09-30: End date of detailed design contract.[8]
- 2026-10-09: Closing of (privately announced) feedback period[13]
- 2026 “Q3”: McEvoy Street and Botany Road, Waterloo Intersection Improvements “Detailed Design – confirmed”[114]
- 2026 “Q4” – 2027 “Q3”: “Construction Procurement – confirmed”[114]
- 2027 “Q3” – 2029 “Q1”: “Construction – confirmed”[114]
- 2026-09-14: Public project announcement.[126]
- botany-rd-and-mcevoy-st-map.jpeg[127]
- 2028: “Estimated completion”: NSW Government Accelerated Infrastructure Fund website.[16]
Traffic signal cycle times
Considering how secretive Network Operations is about signal timing data – I highlight relevant data from the TIA for the record:
- Traffic signal cycle times
- TCS 45 (McEvoy/Botany) “the average cycle time was 119 seconds during the AM peak hour and 118 seconds during the PM peak hour.”[12]: p.21 (PDF 27)
- TCS 346 (Botany / Bourke) “average cycle time was 107 seconds during the AM peak hour and 98 seconds during the PM peak hour.”[12]: p.27 (PDF 33)
- TCS 47: “average cycle time was 114 seconds during the AM peak hour and 111 seconds during the PM peak hour.”[12]: p.15 (PDF 21)
- At TCS47, “On Tuesday 21 May 2024, the average cycle time was 114 seconds during the AM peak hour and 111 seconds during the PM peak hour.”[12]: p.15
- Phase B (Botany Rd southbound + south-east green for cars, north/south pedestrian green) ran in approximately 67% of cycles during both the AM and PM peak hours, all other phases were called in 100% of cycles.[12]: p.15 The inclusion of phase B is driven by pedestrian demand on the western side of the intersection”.[12]: p.16
- While the report notes neighbouring intersections are 40-50m from TCS 346 (Botany / Bourke), it mentions a 2025-10-13 discussion between Arup and Transport resulted in agreement for intersections to be modelled in isolation.[12]: p.25
Notes
- ↑ 100 seconds from Central.[2]
- ↑ Only one business operator adjacent to the works who I visited on the 14th had even heard about the project.
- ↑ The modelled 2032 AM-peak Degree of Saturation suggests more private vehicle congestion in the AM peak if the road is widened, than if nothing is done at all: ‘do nothing’ 2032 TCS 45 DoS 0.836[12]: PDF 128 , option 2 2032 TCS 45 DoS 0.88[12]: p.67 . Am I getting that right – what’s going on there?
- ↑ And made (unpublished) input and parameter “adjustments” resulting in updated modelling predicting an 82.7% higher network speed (AM peak) and 57% drop in average network delay (PM peak) compared to the previous modelling, after I critiqued it. Closed source model says yes!
- ↑ Is it possible for any transport modelling in the state to disagree with Network Operations, when TfNSW keeps government traffic signal phasing and volume data secret[19][20][21], and signal modelling requires “Review by TfNSW Net Ops” at two stages?[22]: Figure 39;p.187
- ↑ Note: The Western Distributor Network project page was deleted[24], which linked to the Harris Street Bus Relocation ‘Have Your Say’ Project Notification (and map)[25], which is no longer accessible on the new project page.[26] Benefits of the project were removed from an older version of the project page[27] and are not shown on the current page.[26]
- ↑ I can’t find this number in writing anywhere, so I’m unclear exactly what it represents. Perhaps sums of the 2026-27 Infrastructure Statement, plus part of the $23bn in TfNSW operational budget which is not broken down.
- ↑ Often expressed in more mortal terms depending on how many drinks, though I find this distasteful.
- ↑ At least we haven’t got the “economic” scenario – in the sense of ‘protecting’ industrially-zoned land “from land use change that would see residential development”, involving “Extension of the Botany Road / Wyndham Street one-way pair to Mascot (via O’Riordan Street / Botany Road)” as part of the “Transport Network Assumptions” and still resulting in “Increasingly slow and unreliable travel on the road network”.[46]
- ↑ TfNSW has deleted this from its website.
- ↑ One cannot miss that Parramatta Road/Broadway was mapped a time-sensitive opportunity to reallocate after the WestConnex M4-M5 Link.
- ↑ I note reducing LK values can result in reduced pedestrian wait times to prioritise pedestrians outside of (or “beyond”) peak periods.[67]
- ↑ (STMv3.91 using TZP22)
- ↑ 14.0 14.1 “As the bus lane is proposed to operate in the AM peak only, Option 1 is identical to the Proposal in the PM peak.”
- ↑ 15.0 15.1 15.2 15.3 15.4 15.5 “Cross delay or detour level of service (LOS) can be calculated for people walking using Austroads’ the framework set out in Austroads’ Level of Service Metrics (for Network Operations Planning) AP-R475-15.”
- ↑ 16.0 16.1 16.2 16.3 16.4 16.5 “mean of crossing delay at both bounding intersections, which is individually calculated as half the AM peak period signal cycle duration, assuming pedestrian green is not automatically introduced”
- ↑ 89-74[12]: p.31
- ↑ 47-29[12]: p.31
- ↑ Put AI in a press release about traffic signals and everyone loses their minds!
- ↑ Referred to as “consultation” in the Subscription Form[91]
- ↑ Note the
ehq-contentsecuritypolicy-1eqm62gCSS class disables copying of these question titles, so I had to go into the code or OCR them. - ↑ The easiest way to get these options was literally to go into the NextJS
__NEXT_DATA__payload andmapsome object properties. - ↑ I also note his critique of the east (8:45 )
- ↑ Good thing the Principal Bicycle Network is no longer TfNSW policy – perhaps the PBN is buried so well current staff can’t even identify corridors from it. If so, TSP.503.010.5944 on page 1345 of SO52 1660RO might help – but it’s probably faster to hit transport-active-transport.carto.com/api/v2/sql?q=SELECT+*+FROM+pbn_active_transport&format=GeoJSON if you don’t get an HTTP 403. Getting a ~7 year old bike path map out of TfNSW seems nearly as hard as getting SCATS signal phasing data out. I was wrong in footnote 2 of my Henderson Road submission: cars won’t be getting signal timing data before humans[68]: footnote 2 – the AI agents will.[105][106][107][108]
- ↑ 25.0 25.1 25.2 Own work – I hit the page rate limit on archive.org.
- ↑ From pipeline-table-latest.json:
{
  "name": "McEvoy Street and Botany Road, Waterloo Intersection Improvements",
  "id": "p0087961",
  "sort": 204,
  "section": "Minor Projects",
  "program": "Minor Projects",
  "category": "Estimated Total Project Cost",
  "deliveryType": "TBA",
  "parent": null, "subProjects": [], "dollarSigns": 1,
  "stages": [
      { "id": 3, "name": "Concept Design and/or Env ass", "confirmed": true, "startYear": 2026, "startQuarter": 2, "endYear": 2026, "endQuarter": 3, "code": 4 },
      { "id": 5, "name": "Detailed Design", "confirmed": true, "startYear": 2026, "startQuarter": 3, "endYear": 2026, "endQuarter": 4, "code": 8 },
      { "id": 6, "name": "Construction Procurement", "confirmed": true, "startYear": 2026, "startQuarter": 4, "endYear": 2027, "endQuarter": 3, "code": 10 },
      { "id": 7, "name": "Construction", "confirmed": true, "startYear": 2027, "startQuarter": 3, "endYear": 2029, "endQuarter": 1, "code": 12 }
  ]
},
See also: (pipeline-table-latest.json (2026-03-25)):
> jq '.' pipeline-table-latest.json | grep --ignore-case "intersection" "name": "Manns Road Upgrade, Stockyard Place to Narara Creek Road Priority Intersection Upgrades", "name": "Newcastle Link Road/Minmi Road intersection upgrade ", "name": "Pacific Highway, Raymond Terrace to Karuah intersection improvements" "name": "Australia Avenue intersection upgrade", "name": "Great Western Hwy and Parker St Intersection upgrade, Penrith", - ↑ Other fields with intermediate updates, on 2026-09-02 and from 10am on 2026-09-08.
- ↑ Or 5 days ago to select folks[125]
References
- ↑ 1.00 1.01 1.02 1.03 1.04 1.05 1.06 1.07 1.08 1.09 1.10 1.11 1.12 “View source: Botany Road Feedback Form”. yoursay.transport.nsw.gov.au. Transport for NSW. 2026-09-08 [created 2026-07-27T16:29:55+10:00; updated 2026-09-08T10:14:54+10:00]. Retrieved 2026-09-25.
- ↑ Jake Coppinger (2024-08-22). “Why Did the Chicken Catch the Metro? Because It Was Faster Than Crossing the Road…”.
- ↑ 3.0 3.1 Decland Bowring (2026-10-07). “Transport for NSW’s proposed southbound AM peak bus lane draws ire of Sydney’s Lord Mayor”. ABC News.
- ↑ 4.0 4.1 4.2 4.3 4.4 4.5 4.6 4.7 “Botany Road Feedback Form”. Transport for NSW. __NEXT_DATA__.props.pageProps.initialState.survey.survey.responsesCount. Archived from the original on 2026-09-28. Retrieved 2026-09-28.
“responsesCount”: 127
Access timestamp 20260928020446 (2026-09-28 02:04:46 GMT - ↑ 5.0 5.1 5.2 Jake Coppinger (2026-09-15). “Just one more lane: TfNSW revives WestConnex zombie Alexandria to Moore Park road project”. jakecoppinger.com.
- ↑ 6.0 6.1 6.2 6.3 6.4 “Botany Road and McEvoy Street intersection and bus corridor improvements”. Transport for NSW. 2026-09-14. Archived from the original on 2026-09-14. Retrieved 2026-09-27.
- ↑ 7.0 7.1 7.2 7.3 7.4 Arup (2025-12-12). ACCELERATED INFRASTRUCTURE FUND 3 MCEVOY STREET AND BOTANY ROAD INTERSECTION UPGRADE 100% DETAILED DESIGN WORK PACKAGE 1 WG01.001 – 528 – MCEVOY STREET MCEVOY STREET AND BOTANY ROAD INTERSECTION UPGRADE – WORK PACKAGE 1 (Report). B. Transport for NSW. Drawing set No: DS2024/00132. DRG No. AIF3MEBRDD-ARUP-NWW-GN-DRG-000001, EDMS No. SF2023/226283. (TIA PDF p.225)
Note: I am not interested in critiquing individual technical staff – it was commissioned by TfNSW. - ↑ 8.0 8.1 8.2 8.3 8.4 “Detailed Design of Botany Road and McEvoy Street Intersection Upgrade – RMS.23.0000139276.1817”. buy.nsw.gov.au. NSW Government. Retrieved 2026-09-27.
- ↑ 9.0 9.1 9.2 “Stakeholder and community engagement guidelines” (PDF). Transport for NSW. January 2023.
We strive to share all relevant information to help the community’s understanding …
“Community engagement”. Transport for NSW. n.d.
We report engagement outcomes in a clear and timely way and explain how stakeholder input is being used or why it was not usedEnvironmental impact assessment documents are generally placed on public exhibition during the planning phase of our projects. The community and stakeholders are invited to review these reports and provide comments in writing.
- ↑ 10.0 10.1 Raw Brown; Paul Robinson; Peter Letts; Colin Mackay; Elisa Casey (January 2014) [October 2007]. Guide to Project Delivery Part 2 – Planning and Control (PDF) (Report). Austroads. p. 23 (PDF 29). ISBN 978-1-925037-39-5. AGPD02-14.
It is important to make boundaries clear to the community i.e. what areas are open to negotiation/discussion, and what matters have already been ‘locked in’…
- ↑ 11.0 11.1 11.2 Melissa Armstrong (2025-08-28). “Notice of decision on your access application under the Government Information (Public Access) Act 2009 (GIPA Act) (26T-0120)” (PDF). Letter to Jake Coppinger.
4.7 I have applied moderate weight to this consideration in favour of disclosure, noting that there is interest generally in infrastructure projects that affect local communities in NSW. In the case of the Epping Bridge Project, disclosure of the associated traffic modelling considerations, analysis and discussion would inform the public of the underlying data that was used to support agency decision-making (being the concept design of the new Epping Bridge) as seen in the Traffic Impact Assessment.
Personal factors of the application
4.8 Under section 55 of the GIPA Act, I can also take into account any personal factors of your application. I have considered that you are a community advocate regarding the transport network and that you have contributed towards community consultation on issues of importance to members of the public.
- ↑ 12.000 12.001 12.002 12.003 12.004 12.005 12.006 12.007 12.008 12.009 12.010 12.011 12.012 12.013 12.014 12.015 12.016 12.017 12.018 12.019 12.020 12.021 12.022 12.023 12.024 12.025 12.026 12.027 12.028 12.029 12.030 12.031 12.032 12.033 12.034 12.035 12.036 12.037 12.038 12.039 12.040 12.041 12.042 12.043 12.044 12.045 12.046 12.047 12.048 12.049 12.050 12.051 12.052 12.053 12.054 12.055 12.056 12.057 12.058 12.059 12.060 12.061 12.062 12.063 12.064 12.065 12.066 12.067 12.068 12.069 12.070 12.071 12.072 12.073 12.074 12.075 12.076 12.077 12.078 12.079 12.080 12.081 12.082 12.083 12.084 12.085 12.086 12.087 12.088 12.089 12.090 12.091 12.092 12.093 12.094 12.095 12.096 12.097 12.098 12.099 12.100 12.101 12.102 12.103 Arup (2026-08-27) [2026-07-31]. Botany Road bus lane and McEvoy Street intersection upgrade (Report). B. 299844-00.
Revision A (Description Consolidation of transport impact assessment reports).
Revision B (Description Review of TIA).
Pages 2-6 (PDF) dated 2026-07-31, remainder 2026-08-27.
Note: I am not interested in critiquing individual technical staff – it was commissioned by TfNSW. - ↑ 13.0 13.1 13.2 13.3 13.4 13.5 13.6 Botany Road Project Team (2026-10-02). “RE: Automatic reply: Informal request: Botany / McEvoy traffic modelling documents”. Letter to Jake Coppinger.
“The project’s traffic modelling and associated technical documents are currently not available to the public. The Review of Environmental Factors (REF) for the project will be published at a later stage and will include the assessments and supporting technical information relevant to the proposal. As the REF is still being finalised, they are not currently being made available as part of the feedback process.
In relation to your other questions, feedback received during consultation, including questions, is not addressed individually as it is received. Rather, all feedback is consolidated and provided to the project team for consideration. This feedback will be considered as part of the development of the REF.
I note that you may still wish to provide feedback on the proposal. While the online survey has now closed, you may still submit your opinion piece or any other comments for inclusion in this process. If you wish to do so, please provide your feedback by Friday 9 October.” - ↑ 14.0 14.1 Deanne Forrest, Executive Director, Sydney & Active Transport Hub (2026-07-27). Minor Projects. ICC Pyrmont Theatre: NSW Government Transport Infrastructure Industry Portal – via Vimeo.
From 33:36:
Slide text: What is coming to Market
* Intersection upgrade Princes Hwy / Waratah St – Q3 2026
* Intersection upgrade McEvoy St / Botany Rd * Q3 2026
* Safety Barrier Program – Target Q3, 2026
* Appin Rd / St Johns Rd intersection main works – Q4 2026
Speech: For an example, these are a just a few of the minor projects that I’ve got coming to the market over the next 6 months. So we have the intersection of Princes Highway and Waratah Street. McEvoy Street and Botany Street is also another intersection upgrade. We’ve got a safety barrier program, which is looking at wire rope barrier across Sydney, but we’ve got a rolling program that we’re starting to implement. And St Johns Rd intersection, that’s the main works, we actually also have a small package coming out as well on Appin Road very shortly as well, so we’ve got a bit of different work. With these coming to market we are also looking at how we design a number of our packages, so we will come back to industry, especially our design consultants, we’re looking at developing a 400 series design specification to be able to put the right level of effort into design for these projects. So we’re acknowledging that our processes and our current specs are not really fit for some of our smaller projects, so we are looking at working with industry on how to make those more efficient for us and yourselves in delivering these projects. - ↑ 15.0 15.1 Transport for NSW is delivering intersection upgrades at McEvoy Street and Botany Road in Waterloo to support 10,000 dwellings, with planning and design underway and completion expected in 2026. The project is funded through the Accelerated Infrastructure Fund Round 3 – Tranche 2, with a total cost of $18 million.
Infrastructure Opportunities Plan – Greater Sydney (PDF) (Report). NSW Department of Planning, Housing and Infrastructure. 2026-02-26. Archived (PDF) from the original on 2026-02-26.
Transport for NSW is delivering intersection upgrades at McEvoy Street and Botany Road in Waterloo to support 10,000 dwellings, with planning and design underway. The project is funded through the Accelerated Infrastructure Fund Round 3 – Tranche 2, with a total cost of $18 million. Infrastructure Opportunities Plan – Greater Sydney (PDF) (Report). NSW Department of Planning, Housing and Infrastructure. 2026-02-26. Retrieved 2026-09-27.
Go on, run the diff on each version’spdftotextoutput. - ↑ 16.0 16.1 16.2 “Accelerated Infrastructure Fund”. NSW Department of Planning, Housing and Infrastructure. Archived from the original on 2026-09-09. Retrieved 2026-09-27.
Project: McEvoy Street and Botany Road, Waterloo intersection improvements
Delivery agency: TfNSW
Round: 3 – tranche 2
Project scope: Improvment [sic] work at McEvoy Street and Botany Road.
Current stage: Construction
Estimated completion: 2028
Local government area: City of Sydney
Grant funding: $13,500,000.00
Funds released to date: $13,500,000.00
Total project cost: $18,000,000.00
Co-contribution: $4,500,000.00
Total dwellings supported: 10,000
Project type: Roads
- ↑ “Edgecliff-Woollahra”. planning.nsw.gov.au. NSW Department of Planning, Housing and Infrastructure. Retrieved 2026-09-27.
The draft proposal will enable: approximately 9,400 new homes …
- ↑ Jake Coppinger (2024-10-09). “Better Streets submission to the Epping Bridge Project”. jakecoppinger.com.
- ↑ Howard Collins (2025-08-25). “Re: Request for Public Access of SCATS Signal Phasing Data across one weekday for all NSW signals” (PDF). Letter to Jake Coppinger. Transport for NSW.
- ↑ Jake Coppinger (2025-05-15). “No Signal for Pedestrian Safety: TfNSW Refuses Signal Data During National Road Safety Week”. jakecoppinger.com.
- ↑ Yvonne (2025-09-20). “Why won’t Transport for NSW share SCATS Traffic Signal Phasing Data?”. WalkSydney.
- ↑ 22.0 22.1 22.2 22.3 22.4 22.5 22.6 22.7 Navreet Virdi (October 2025) [November 2024]. Transport Modelling Guidelines (PDF) (Report). TfNSW. TS 05461.
- ↑ “Western Distributor Road Network Improvement Project – Update following project review” (PDF). Transport for NSW. March 2026. Archived from the original (PDF) on 2026-03-18.
Following an analysis of traffic patterns and further stakeholder engagement changes have been made.
What’s changing?
• The Pyrmont Bridge Road and Bank Street intersection upgrade will not proceed. As a result, the 501-bus route and access to Bank Street from the Pyrmont Bridge Road off-ramp will remain unchanged.
• The proposed Darling Harbour weave ramp will also not proceed.
• The remaining work at the Allen Street and Harris Street intersection will continue. These improvements will support reliable access to the new Sydney Fish Market, particularly during periods of congestion on the Pyrmont Bridge Road off-ramp. - ↑ “The Western Distributor Network”. 2024-03-18. Archived from the original on 2025-09-25. Retrieved 2026-03-18.
- ↑ “Have your say – Harris Street bus stop relocation Western Distributor Network Improvements” (PDF). Transport for NSW. October 2023. Archived from the original (PDF) on 2024-01-19. Retrieved 2026-03-18.
- ↑ 26.0 26.1 “Western Distributor Road Network Improvements”. Transport for NSW. 2026-03-17. Retrieved 2026-03-18.
- ↑ “Western Distributor Road Network Improvements (Archive)”. 2023-11-06. Archived from the original on 18 November 2023. Retrieved 18 March 2026.
- ↑ Sarah Bickford; Peter McLean (2023-11-21). “Re: Pyrmont-Ultimo Transport Plan” (PDF). Letter to Pyrmont Peninsula team, Trudi Mares. p. 3.
Concern 3: PTUP and the Western Distributor ‘improvements’ are at cross purposes
- ↑ “Motorway mangles Pyrmont”. BicycleNSW. 2023-11-23.
- ↑ https://yoursay.transport.nsw.gov.au/botany-bus-improvements/surveys/botanyroad_subscribe1, line 259, column 140324
- ↑ Brown, Aston; Bowring, Declan (2026-02-09). “Cyclists slam ‘nightmare’ shared path at new Sydney Fish Market”. ABC News. Archived from the original on 2026-02-08.
Former Liberal transport minister Rob Stokes said the project’s final design reflected “very ingrained views” inside some quarters of government that backed road traffic over pedestrians and cyclists.
Mr Stokes said “two clans” existed within Transport for NSW.
“There were those who were very people-focused, then there were those who were almost vehicle-focused,” he said.
“I think a lot of the decisions that had gone into the cycle infrastructure around the fish market had been made by the latter group.”
Mr Stokes also described “very powerful vested interests” — due to a revolving door between government and the private sector — that prioritised large road and rail projects over active transport infrastructure. - ↑ 32.0 32.1 32.2 Josh Murray (2026-07-27). Secretary Josh Murray opening address (09:50). ICC Pyrmont Theatre: InMotion 2026 – via Vimeo.
If you work with Transport you’re also expected though to meet the standards in our statement of our business ethics. Please, if something does not look right, speak up. If you see a conflict, declare it. If you’re asked to cut a corner, refuse.
Via industry.transport.nsw.gov.au/tfnsw/tiip/inmotion-2026 - ↑ O’Sullivan, Matt (2025-10-27). “Public servants reveal reluctance to speak up at scandal-hit transport agency”. The Sydney Morning Herald. Archived from the original on 2025-11-13.
- ↑ Robert A. Caro (September 1974). “Chapter 43. Late Arrival”. The Power Broker: Robert Moses and the Fall of New York (PDF). p. 1582. ISBN 0-394-72024-5.
But still, the most significant fact about the series was that it ran at all. Investigative reporters quickly become aware of a phenomenon of their profession: information so hard to come by when they are preparing to write their first story in a new field suddenly becomes plentiful as soon as that first story has appeared in print. Every city agency has its malcontents and its idealists and its malcontent-idealists —officials and aides and clerks and secretaries unhappy with the philosophy by which it is being run or the payoffs that are being made within it—who have been just waiting, for years, for the appearance of some forum in which their feelings can be expressed. When they realize that there is one at last—when they see that first story— they cannot get their information to its writer fast enough. Scores of city employees—men and women angry for personal or philosophical reasons at the inside workings of the Moses empire—and hundreds if not thousands of city residents whose homes or neighborhoods had been destroyed for his Title I projects, and who then had watched vainly for years for the projects to be built, had been looking for such a forum. They had been desperate for one. They had almost given up their hopes of finding one.
- ↑ “Confidential Tips”. ABC News.
- ↑ Aston Brown (2026-07-05). “Reducing speed limits in cities can save lives. Why is Australia still reluctant?”. The Guardian.
- ↑ “Just one more lane won’t solve it”. Better Streets. 2026-09-20.
- ↑ Jamie van Geldermalsen (2026-09-28). “Opposing the widening of Botany Road, Alexandria”. Letter to. WalkSydney.
- ↑ “Untitled Facebook post”. 2026-09-15.
The WestConnex ‘just one more lane will fix it’ crew are still in charge at TfNSW. Worth making a submission by Monday 28 September.
- ↑ “‘Bus Improvement’ Project – McEvoy St & Botany Rd”. Alexandria Residents Action Group. 2026-09-20.
- ↑ Friends of Erskineville (2026-09-16). “Untitled Facebook post”. Facebook.
- ↑ 42.0 42.1 42.2 42.3 42.4 Clover Moore (2026-09-10). “Botany Road Bus Lane and McEvoy Street Intersection Upgrade”. Letter to Jenny Aitchison. City of Sydney. Clover Moore [@clovermoore]; (2026-09-05). “We know Botany Road needs work, but this is a step backwards” – via Instagram. (images 7-9)
- ↑ 43.0 43.1 43.2 43.3 43.4 43.5 43.6 43.7 Connecting NSW Strategy – Priorities for Transport (Report). Transport for NSW. October 2026. ISBN 978-1-923242-23-4. TS216.
- ↑ The Premier; Minister for Planning and Public Spaces (2023-07-23). “NSW Government investing $40.9 million to fast-track critical infrastructure in high growth communities” (Press release). Archived from the original on 2026-01-17.
“These improvements at McEvoy Street and Botany Road will help to ease traffic gridlock that is already taking a toll on Waterloo and Alexandria as a result of WestConnex.
- ↑ “Engagement report – South Eveleigh to Waterloo Metro walking and cycling improvements” (PDF). City of Sydney. March 2026. p. 7 (PDF 8).
The bus only section was included at the request of Transport for NSW, in part to enable longer pedestrian crossing times at the intersection with Botany Road.
- ↑ SGS Economics and Planning (August 2020). “Future Transport 2056: South East Sydney Transport Strategy” (PDF). Transport for NSW. p. 29. Archived (PDF) from the original on 2025-11-08. Retrieved 2025-09-03.
- ↑ National Cooperative Highway Research Program. 2008. Pedestrian safety prediction methodology. https://highways.dot.gov/safety/data-analysis- tools/rsdp/rsdp-tools/pedestrian-safety-prediction-methodology
- ↑ RTA’s superseded Accident Reduction Guide, DCA codes 202-206
- ↑ “Evaluation of the NSW Pedestrian Protection Program Summary Report” (PDF). Transport for NSW. September 2023.
- ↑ Prabhakharan, P; Sterling, K; Baker, J (2022). Evaluation of the NSW pedestrian protection program (PDF). Australasian Road Safety Conference. Christchurch, New Zealand. p. 545. doi:10.33492/ARSC-2022 (inactive 20 November 2025). ISBN 9780648184850. Archived from the original (PDF) on 2024-10-28.
- ↑ Prabhakharan, P; Stephan, K; Lawrence, B; Newstead, S (2023). NSW Pedestrian Protection Program: improving pedestrian safety at signalised intersections (PDF). Australasian Road Safety Conference. Cairns, Queensland, Australia. doi:10.33492/ARSC-2023 (inactive 20 November 2025). Archived from the original (PDF) on 2024-06-06.
- ↑ Jonah Chiarenza; Annisha Borah; Mary Geschwindt; Larissa Ireland; Yu Jin Kim; Noah Levine; Hoamy Tran (June 2023). “Improving Pedestrian Safety on Urban Arterials: Learning from Australasia” (PDF). US Department of Transportation. p. 43.
- ↑ Newstead, Stuart; Stephan, Karen; Lawrence, Brendan (2022). “Statistical analysis to support the NSW Pedestrian Protection Program Evaluation”. Monash University.
- ↑ 54.0 54.1 54.2 Access Strategy and Action Plan Continuing the Vision (PDF) (Report). Final. City of Sydney. November 2023.
- ↑ 55.0 55.1 55.2 “Tech Central Camperdown-Ultimo Place-based Transport Strategy” (PDF). October 2021.
- ↑ “Roads and Transport”. Local Government NSW. n.d.
- ↑ “Block 1 Report – Sydney Metro C&SW – Traffic and Interchange Monitoring” (PDF). AECOM. August 11, 2023. p. 28. Archived (PDF) from the original on 2025-09-24.
- ↑ 58.0 58.1 Julie Power (2020-01-13). “Oslo cut road deaths to one in 2019. Can Sydney do the same?”. Sydney Morning Herald. Archived from the original on 2024-06-15.
- ↑ Aitor Hernández-Morales (2025-08-02). “Helsinki just went a full year without a single traffic death”. Politico. Archived from the original on 2025-09-13.
- ↑ Alex Greenwich (2018-03-07) [2017-03-06]. “Alexandria to Moore Park (Private Members’ Statement, 6 March 2017, Legislative Assembly, NSW Parliament)”.
- ↑ “August 2018 Sydney City News” (PDF). City of Sydney. Archived (PDF) from the original on 2019-06-19.
- ↑ 62.0 62.1 62.2 62.3 62.4 Alexandria to Moore Park Stage 1 Submissions Report (PDF) (Report). Transport for NSW. April 2020. Archived (PDF) from the original on 2025-10-14.
- ↑ McCallum, Jake (3 June 2020). “WestConnex: motorists first look inside M8 tunnels, opening date revealed”. The Daily Telegraph. Retrieved 4 June 2020.
- ↑ “Speed limits – Sydney Region – 28 November 2024”. Transport for NSW. 28 November 2024. Archived from the original on 2025-12-20. Retrieved 2026-03-18.
- ↑ “Way: McEvoy Street (440882189)”. OpenStreetMap. Retrieved 2026-10-06.
- ↑ “Way: Botany Road (252129991)”. OpenStreetMap. Retrieved 2026-10-06.
- ↑ David Ballm, Director Network Operations (September 2026). Traffic Lights for Pedestrians – City of Sydney LGA as a case study in Urban Mobility Transformation. Signals NZ User Group (SNUG). p. 16.
Operations – Divorce isn’t always Bad!
Even in dense CBD networks with intersections only 50 metres apart, reducing LK values can allow corridors to operate independently and respond to local demand. This creates opportunities to prioritise pedestrians beyond peak periods, rather than optimising signals primarily for a few hours each day.
“2026-09-17 SNUG-2026 Programme (2026-SNUG Workshop 2026 Wednesday 23rd – Friday 25th September 2026)” (PDF). snug.org.nz. Signals NZ User Group (SNUG). September 2026. p. 3. Archived (PDF) from the original on 2026-10-03.14:45, 15:15, 30 min, Sydney CBD Urban Transformation, Dave Ballm
- ↑ 68.0 68.1 Jake Coppinger (2026-03-04). “Better Streets Submission for Walking and Cycling Improvements between South Eveleigh and Waterloo Metro (Henderson Road)”. jakecoppinger.com.
- ↑ 69.0 69.1 69.2 69.3 Ben Wood (2026-10-08). “Untitled LinkedIn post”. LinkedIn.
When I first heard about this proposal I was also disappointed. Viewed purely as a bus improvement project, its hard to call this progress. But is that the right lens, or are there other needs it solves that we need to be cognisant of? I spoke to a few people familiar with this part of the network and the project, and looked at the data, including GTFS. It has challenged my initial assumptions, and reinforced how complex decisions about improving our network are.
- ↑ 70.0 70.1 Elizabeth Rush, Senior Transport Planner; Andrew Thomas, Acting Director City Strategy and Design (2010-06-16). “Information Relevant To Item 9.2 – Newtown Erskineville Camperdown and Darlington Pedestrian Cycling Traffic Calming Plan at the Planning Development and Transport Committee” (PDF). Letter to Lord Mayor and Councillors. City of Sydney. Archived (PDF) from the original on 2019-04-05. Retrieved 2025-11-07.
- ↑ Cattell Cooper (April 2021). “Botany Road Corridor – Transport and Traffic” (PDF). City of Sydney. Archived (PDF) from the original on 2025-10-29.
- ↑ Tonkin Zulaikha Greer Architects (March 23, 2021). “Botany Road Corridor Urban Design Study”. Zulaikha Greer Architects (for City of Sydney). Archived from the original on 2022-03-27. Retrieved 2026-03-03.
- ↑ Redfern Waterloo Authority (February 2006). “Draft Redfern-Waterloo Built Environment Plan (Stage One)”. REDWatch. Archived from the original on 2025-04-05.
- ↑ “Redfern Waterloo Authority Draft Employment and Enterprise Plan Submission by the City of Sydney” (PDF). City of Sydney. 2006-03-20. p. 6.
- ↑ Trevor Davies (December 2006). “The divisions over Regent Street changes: Council and RWA support it, RTA is against it”. South Sydney Herald. Archived from the original on 2025-04-28.
- ↑ Hassell (July 2020). Pyrmont Penninsula Place Strategy (PDF) (Report). Volume II Strategic Framework) (Draft for public exhibition) Part B. p.34 (2.7 Direction 7). 014942.
5. Investigation of a new street-based public transport link (eg bus or light rail) along Harris Street, providing connectivity along the Innovation Corridor (from the Bays to Central/Redfern
- ↑ Pyrmont-Ultimo Transport Plan May 2024 (PDF) (Report). Transport for NSW. May 2024. p.41 (PDF 47); §5.1.5. ISBN 978-1-922875-95-2.
S29: Determine medium-term bus plan in the Precinct and investigate new bus routes within the Precinct, including services linking to the new Metro station. Potential routes include a rapid bus route to the Parramatta Road corridor via RPA Hospital and through Glebe and Forest Lodge along Bridge Road and Pyrmont Bridge Road and a rapid bus route connecting Pyrmont to Redfern and South Eveleigh via Harris Street. Investigate bus priority on Pyrmont Bridge Road and Harris Street for these future rapid bus routes
- ↑ 78.0 78.1 “Botany Road and McEvoy Street (September 2026 community notification)” (PDF). Transport for NSW. September 2026. Archived (PDF) from the original on 2026-10-01. Note: The “September 2026 community notification (PDF, 1.74 MB)” (…2026-09.pdf), states the project team “would be happy to hear from the community with any questions”, and that the public may contact the team via projects@transport.nsw.gov.au. This notification, published publicly for the first time at “2026-09-01T15:00:32+1000″, states “Please contact us by Monday 28 September“. I do not accept this notification was widely available.
- ↑ “Detailed Design of Botany Road and McEvoy Street Intersection Upgrade – RMS.23.0000139276.1817”. buy.nsw.gov.au. NSW Government. RMS.23.0000139276.1817. Archived from the original on 2026-03-12. Retrieved 2026-03-12.
- ↑ “Easing Sydney’s Congestion”. transport.nsw.gov.au. Transport for NSW. 2026-04-01. Retrieved 2026-09-27.
- ↑ 81.0 81.1 “Pinch Point Programs – Easing Sydney’s Congestion Program Office”. transport.nsw.gov.au. Transport for NSW. 2023-02-06. Retrieved 2026-09-27.
- ↑ Minister for Roads (2025-11-28). “Wait less, walk safer: AI trial slashes risk at major pedestrian crossing by more than 30 per cent”. New South Wales Government. Archived from the original on 2025-12-05.
- ↑ Donna Davis MP (2025-12-05). “Untitled Facebook post”. facebook. Archived from the original on 2025-12-05.
- ↑ “Have Your Say – Proposed intersection improvements along the Great Western Highway at Pitt Street and Marsden Street, Parramatta” (PDF). Roads & Maritime NSW. August 2017. Archived (PDF) from the original on 2024-05-20.
- ↑ “Pitt Street to Marsden Street, Parramatta”. Transport for NSW. Archived from the original on 2024-04-25.
- ↑ “Project update – Intersection improvements along the Great Western Highway at Pitt Street and Marsden Street, Parramatta” (PDF). Transport for NSW. November 2017. Archived (PDF) from the original on 2024-05-17.
- ↑ “Great Western Highway at Pitt Street and Marsden Street, Parramatta” (PDF). Transport for NSW. July 2018. Archived (PDF) from the original on 2025-12-05.
- ↑ “Great Western Highway lane changes and T-Way bus stop relocation, Parramatta from Sunday 18 May 2025” (PDF). Transport for NSW. May 2025. Archived (PDF) from the original on 2025-05-15.
- ↑ 89.0 89.1 89.2 Roy Wilson (Australian Centre for Commercial Mathematics); Gordon Farrelly (RMS); Christian Chong-White (RMS) (August 2014). Methods For Assessing Traffic Flow Improvement Using SCATS Data. AITPM. Archived from the original on 2026-04-19.
- ↑ “Pinch Point Programs – Easing Sydney’s Congestion Program Office”. Transport for NSW. 2023-02-06.
- ↑ 91.0 91.1 “Botany Road Subscription Form”. Transport for NSW. Retrieved 2026-10-03.
Hello,
Our consultation on this project has closed.
Providing your details means that our engagement team can contact you with updates via email.
Kind Regards,
Botany Road Project Team - ↑ Brown, Aston; Bowring, Declan (2026-02-09). “Cyclists slam ‘nightmare’ shared path at new Sydney Fish Market”. ABC News. Archived from the original on 2026-02-08.
- ↑ “Strategic Travel Model Standard Outputs”. Transport for NSW. 2012-02-01.
To obtain a copy of the STM technical documents, please contact us at TPA@transport.nsw.gov.au
Current version
Strategic Travel Model Standard Outputs 2012 - ↑ Declan Bowring (2023-09-23). “Better Intersections website gathers data on long pedestrian wait times in Sydney”. ABC News.
- ↑ Andrew Botros (n.d.). “Why Sydney’s transport apps took years, not days”.
- ↑ Maria Katsonis; Andrew Botros (2015-03-04). “Digital Government: A Primer and Professional Perspectives”. Australian Journal of Public Administration. 74 (1): 48.
Year 2009 was challenging for the open data movement in New South Wales. RailCorp, a controlled entity of Transport for NSW (TfNSW, a statutory authority), threatened a number of software developers with legal action over breaches of Crown copyright when the developers used train timetable data from RailCorp’s public website in their own apps (Moses 2009a).
RailCorp cited concerns over the accuracy of third-party timetable information, and stated that licences to use the timetable data were unavailable while RailCorp developed its own mobile development strategy (Braue 2009). No such strategy ensued. The software developers appealed to the premier of New South Wales directly, who brokered a trial data feed under strict contractual terms for the developers (Moses 2009b). Access to static timetables was granted, but the real-time locations of trains and buses were withheld. - ↑ 97.0 97.1 Elizabeth Farrelly (2023-05-20). “IT’S NOT ABOUT SUPPLY, STUPID”. Substack.
- ↑ Heath Aston (2016-12-18). “Raw sewage released near Bondi as decades of government dithering runs on”. Sydney Morning Herald.
There has also been concern that an upgraded sewerage system could trigger a demand for denser development in those exclusive suburbs. … If the decrepit system was plugged into Bondi’s deep ocean outfall, the theory went, Woollahra and Waverley councils could be ordered to allow higher, denser development in suburbs where most houses still had gardens and a backyard. In other words, the discharge of four million litres of raw effluent from a cliff in their neighbourhood had a silver lining for those residents not wanting to see change.
- ↑ Michael McGowan (2023-12-11). “Minister reveals why Sydney’s eastern suburbs were spared housing density push”. Sydney Morning Herald.
There are parts of Sydney’s east that are currently limited in additional growth because of limited sewer and water infrastructure. Edgecliff as just one example is one of those.
- ↑
…Congestion is best managed in our cities using other policies, such as road-user charging, and the effective provision of public transport, which also becomes cheaper at higher densities.
Brendan Coates; Joey Moloney; Matthew Bowes (November 2025). “More Homes, Better Cities: Letting more people live where they want” (PDF). Grattan Institute. p. 34. Archived (PDF) from the original on 2026-03-01. - ↑
Initiatives like transit lanes, bus priority lanes, and bus rapid transit can make buses faster and more reliable, and so entice onto public transport many people who would otherwise drive. Such measures can restrict road space and risk worsening traffic for remaining cars, but they usually allow a higher total number of people to travel.
“Building more homes where infrastructure costs less” (PDF). NSW Productivity Commission. August 2023. p. 28 (PDF). Retrieved 2026-03-03.{{cite web}}:|archive-url=requires|archive-date=(help) - ↑ SCT Consultants (2026-07-03). Edgecliff-Woollahra Precinct State-led Rezoning Traffic and transport review – Scenario 3 (rev 1.0) (PDF) (Report). Woollahra Council. Archived from the original (PDF) on 2026-09-08.
- ↑ 103.0 103.1 Presenter Elizabeth Farrelly; guests Andrew Andersons, Philip Thalis, Sarah Dixson (2026-09-24). “Woollahra Rezoning Fiasco?”. The Sydneyist. Sydney. Eastside Radio 89.7FM. Retrieved 2026-09-26.
- ↑ 104.0 104.1 104.2 104.3 Edgecliff-Woollahra State-led Rezoning Transport Management and Accessibility Plan (PDF) (Report). Transport for NSW. August 2026.
- ↑ Manish Anand. “Release – “HCLTech and Transport for NSW to explore AI-powered traffic insights for India”“ (PDF). hcltech.com. Letter to National Stock Exchange of India.
- ↑ “NSW pushes for more trade and investment with India” (Press release). NSW Government. 2026-09-01.
Earlier, the Premier and Treasurer witnessed the signing of an agreement between Transport for NSW’s Sydney Coordinated Adaptive Traffic System (SCATS) and HCLTech to explore using AI to make NSW-developed traffic technology easier to use across India’s diverse language markets. SCATS is already used around the world and the partnership creates an opportunity to sell more NSW-owned technology into India, generating revenue that can be reinvested in transport back home.
- ↑ Novin Wijesundara (2026-10-03). “Last week I presented at SNUG (Signals New Zealand User Group) to councils and traffic authorities from across New Zealand, on Phoenix, the Agentic AI system we’re building within SCATS…” LinkedIn. Archived from the original on 2026-10-03.
Additional archives: archive.today.
“Last week I presented at SNUG (Signals New Zealand User Group) to councils and traffic authorities from across New Zealand, on Phoenix, the Agentic AI system we’re building within SCATS (Sydney Coordinated Adaptive Traffic System) at Transport for NSW.
Phoenix turns natural language into SQL, so traffic engineers, councils and network operations officers can ask questions of the traffic network in natural language and get answers in seconds, with no manual querying required.
This gives government agencies a clearer view of their road network, helping them optimise signalised intersections and corridors, plan infrastructure and improve safety of all road users.” - ↑ Novin Wijesundara (2026-09-24). Unified data model, APIs and AI agents – Turning SCATS data into an asset anyone can use (SCATS Phoenix Project). Wellington: Signals NZ User Group (SNUG). p. 4 §speaker notes.
Frame it as ‘four design choices we made’. WHAT and WHY, not HOW. Example line:
‘We deliberately kept it open and cloud-agnostic — because we’re building a product we can put anywhere our clients need it.’
Plant the commercial seed here: ‘single point of access’ is the thing we can sell.
“2026-09-17 SNUG-2026 Programme (2026-SNUG Workshop 2026 Wednesday 23rd – Friday 25th September 2026)” (PDF). snug.org.nz. Signals NZ User Group (SNUG). September 2026. p. 2. Archived (PDF) from the original on 2026-10-03.11:25, 15 min SCATS Presentation – Unified Data Model, APIs & AI Agents – Turning SCATS into an asset anyone can use, Novin Wijesundara
- ↑ Yvonne Poon; Josephine Roper; Jamie Van Geldermalsen; Tegan Mitchell. “Putting our best foot forward – A checklist for walkable density” (PDF). Committee for Sydney. p. 6.
If these factors aren’t in place, densification is the next once-in-a-generation chance to retrofit these – with the ability to reshape street patterns, create new through-block links and change land-use.
{{cite web}}: Missing|author4=(help); More than one of|author1=and|author=specified (help) - ↑ Minister for Roads. “The magnificent seven: Plan for widening of the seven key road arteries in Sydney’s expanding south west revealed” (Press release). NSW Government.
The expanded South West Sydney Roads – Planning Project aims to ease traffic congestion, improve road safety, and support ongoing housing and job growth in Sydney’s Greater Macarthur and South West regions.
Business cases and planning investigations will be prepared for the seven priority corridors, which together comprise some 76.5 km of roads that carry more than 100,000 vehicles daily. - ↑ Design for living – post-war. Cinesound. 1946. Cinesound Review No. 672.
- ↑ Tom Zubrycki, Margaret Barry (1981). Waterloo.
We didn’t plan and we got bottlenecks of traffic congestion … Here’s what we could do now. Plan satellite towns on the fringe of the big ones. Sydney for instance.
- ↑ “State Environmental Planning Policy Amendment (Concurrences and Consultations) 2026 under the Environmental Planning and Assessment Act 1979” (PDF). Department of Planning, Housing and Infrastructure. 2026-06-19. pp. 35, 44, 46.
Section 5.14 Matters for consideration – Omit “, the requirements of TfNSW concerning” from section 5.14(b). … Section 2.122(3) – Omit “TfNSW” wherever occurring. Insert instead “Development Coordination Authority”. … Schedule 3 Traffic-generating development to be referred to TfNSW—Chapter 2 – Omit the schedule.
- ↑ 114.0 114.1 114.2 114.3 “Transport Infrastructure Industry Portal”. NSW Government. July 2026. Retrieved 2026-09-27. “State Budget pipeline now live: minor projects added for first time”. industry.transport.nsw.gov.au. NSW Government. 2026-07-23. Retrieved 2026-09-27.
Projects added to the pipeline (under $20m) – McEvoy Street and Botany Road, Waterloo Intersection Improvements
- ↑ Main Road Development Plan for Sydney Metropolis and County of Cumberland – Part 1 Investigations Relating to the Present and Future Extent and Pattern of the Metropolis. Department of Main Roads NSW. 1940.
- ↑ De Leuw Cather (August 1961). Report on Geometric Design Study: Sydney Area Expressways.
- ↑ 117.0 117.1 117.2 Sydney Area Transportation Study – Volume 3 – Passenger Transport Systems. 1974. Archived from the original on 2024-04-26.
- ↑ South Sydney Municipal traffic study: final report. Pak-Poy & Kneebone Consulting Group. 1981.
- ↑ 119.0 119.1 MacDonald Wagner (February 1987). Pyrmont-Alexandria Traffic Management Proposal – Environmental Impact Statement. Macdonald Wagner for Department of Main Roads. ISBN 0730545490.
- ↑ 120.0 120.1 South Sydney Committee of the Australian Assistance Plan (April 1981). Traffic and Transport in South Sydney.
- ↑ “GREEN SQUARE TOWN CENTRE DRAFT MASTERPLAN AND LOCAL ENVIRONMENTAL PLAN AND RELATED MATTERS – INFORMATION REPORT” (PDF). City of Sydney. 2004-11-05. GSTC2.DOC005.
- ↑ Matt O’Sullivan (2016-12-06). “WestConnex spawns major upgrade to congested road corridor in inner Sydney”. The Sydney Morning Herald.
- ↑ Matt O’Sullivan (2019-07-08). “Sydney CBD bypass plans to be scaled back to allay residents’ concerns”. Sydney Morning Herald.
- ↑ David Levinson (2018-11-13). “Traffic connector, community disconnector: increased traffic and pedestrians don’t mix”. Foreground. Archived from the original on 12 March 2026.
- ↑ “Botany Road”. yoursay.transport.nsw.gov.au. Transport for NSW. 2026-09-09. Retrieved 2026-09-25.
Page published: 09 Sep 2026, 12:46 PM
- ↑ “Botany Road and McEvoy Street intersection and bus corridor improvements”. Transport for NSW. 2026-09-14. Archived from the original on 2026-09-14. Retrieved 2026-09-14.
- ↑ “botany-rd-and-mcevoy-st-map.jpeg”. Transport for NSW. Archived from the original on 2026-09-14.


The post Unpublished WestConnex zombie project docs demand ministerial intervention first appeared on Jake Coppinger.
]]>The post Just one more lane: TfNSW revives WestConnex zombie Alexandria to Moore Park road project first appeared on Jake Coppinger.
]]>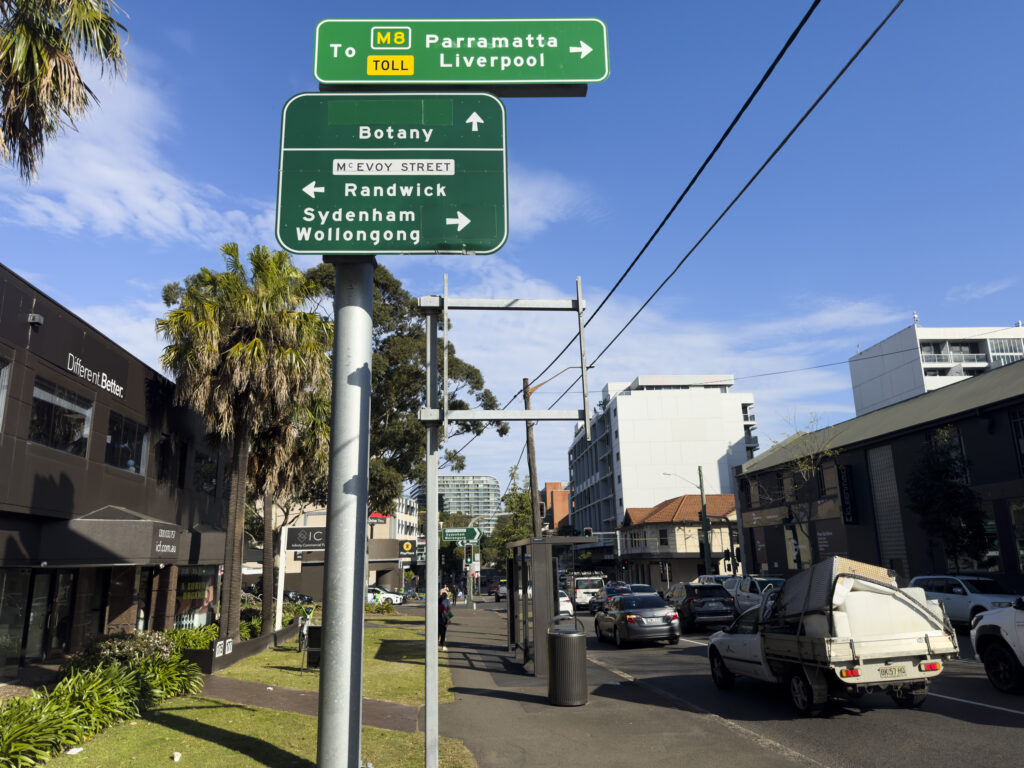
You read that right – just yesterday[a] TfNSW announced a proposal[3] to widen an inner Sydney road and demolish footpaths and trees (map[4]). In the year 2026. We desperately need more homes, we need more bus lanes, we need to ‘fix’ traffic – but this should be done by reallocating road space – per TfNSW’s great policy. The TfNSW fever dream of ”just one more lane” of urban road capacity will induce more vehicles, and will not ‘fix’ traffic.[5]
Some historical context: this is the intersection of both the Southern Arterial Route (~13,000 words, 168 references) and the Alexandria to Moore Park Project (~3,500 words, 80 references).[b] Let’s not pretend this is about buses – this is a smokescreen for a classic road widening project. The southbound AM peak bus lane is proposed precisely because that’s when there’s less southbound car traffic – because most folks are heading into the city for work. The word for this, is misdirection.
The project page includes a “Project documents” heading yet TfNSW couldn’t find any documents to put there. Would you get away with spending $22 million of taxpayer money without providing a decent reason? The time for attributing to stupidity is long gone: $22 million to build more lanes without a PM peak bus lane out of the CBD – is malice.
Where’s the evidence? Perhaps some bus delay data? Modelling of a bus lane all the way from that pedestrian crossing TfNSW ripped out at Harris St and Pyrmont Bridge Road[7][8][c][d] all the way down to Green Square – or am I dreaming? Imagine TfNSW openly releasing signal phasing, let alone vehicle volumes – the stuff of fantasy! Does anyone seriously believe the point of spending $22m is an AM peak-only bus lane away from the CBD? Is suffixing “…and bus corridor improvements” on a project really going to sneak this past the Ministers? This wouldn’t be the first time.[12][13][14][15][16]
What transport study found “57 vehicles would be spread across the alternative routes during the AM peak hour…“[3][e] I’ve made an informal[17] request to TfNSW for any transport studies or impact assessments – given a GIPA[f] wouldn’t arrive in time before the ‘feedback’ deadline. Join my blog mailing list if you want those cold hard PDFs as soon as I get them.
Make no mistake; this is a horrifying WestConnex project. ‘Improving’ this intersection was “Major design feature 4” in the November 2019 Alexandria to Moore Park Stage 1 REF[19]: 6 : 44 (PDF 62) , with the aim of “Improving intersection capacity”[19]: 5 (for cars). A2MP Stage 1 was carried out under WestConnex planning condition E40 b iii[g] and A2MP Stage 1 sits under the TfNSW Network Integrations team.[25]: 39 (PDF 41) Worse than a WestConnex project, the Government offloaded soaring spending onto the TfNSW Network Integration Program (the taxpayer)[h] – according to none other than the NSW Audit office in their scathing assessment.[26] Integration meaning getting cars in and out of WestConnex; this team was previously the WestConnex Enabling works.[26]: p. 12 (PDF 16) Who exactly is behind the now-dead WD weave[25]: 36 (PDF 38) and this project? My call out to Journalists: it seems that not even a painful reorg can fix this cyclic pattern – start digging here.
Where are we talking about? 400 metres from the Waterloo Metro station, one block from Waterloo renewal project and spitting distance from high density Green Square.[i] Only a dinosaur of a road engineer would seriously believe adding more car lanes here is the best way to support 10,000 homes.[31]
The Southern Arterial has already left a scar through Redfern / Waterloo. Do we really need to deepen the wound?
TfNSW wrote they considered alternatives to a right turn ban – by demolishing private houses and felling even more trees.[3]: §Right turn removal [j][k] This reminds me of the 1980s argument against alternatives for the Southern Arterial threatening housing destruction.[34]: p. 107 [l] Presenting diabolical alternatives to rationalise action is some Department of Main Roads-era rubbish.
Ron Hoenig supported this ‘upgrade’ when it got on the AIF books in 2023, claiming increasing this intersection capacity (for cars) would ease traffic induced by WestConnex (“These improvements at McEvoy Street and Botany Road will help to ease traffic gridlock that is already taking a toll on Waterloo and Alexandria as a result of WestConnex.”[35]). One more lane will fix it! It’s a mystery why he supports this now, given he opposed the Alexandria to Moore Park project (A2MP) in the past[36][37] – along with Matt Thistlethwaite[38], Alex Greenwich[39][40][41], Marjorie O’Neill[42], Jenny Leong[40], “mobilised” councillors across Randwick, Waverley and Woollahra[36], Clover Moore[36], and News Corp.[38][36][43]
It seems TfNSW picked good timing. The CEO of the Kinchela Boys Home Aboriginal Corporation, at the very corner of this project is apparently away until next week, and the staff there hadn’t heard of this (nor any business owners I chatted to, except the newsagent).[44] With only 2 weeks of “feedback” – the word “consultation” doesn’t appear once on the project page[3] feedback form[45] or on the project timeline – it seems this project is already approved and a fait accompli.
And why would it need consultation or approval anyway? A2MP Stage 1 was approved and is still “in progress” as of yesterday.[46] While A2MP plans were “scaled back” in 2019[47][48], the December 2016[49] and June 2017 Community Updates[50] remain the “Ultimate Concept Design”, for which the “staged process will now allow additional review”.[51]: 82 (PDF 91) There’s no sign TfNSW is giving up road widening further east (outside the childcare centre[52]), and potentially private property demolition. Remember when Graham had to stop TfNSW from demolishing 200 homes on Parramatta Road just 2 years ago?[53]
What do we have to do to stop TfNSW continuing with these insane urban road widening projects? This corridor has been on the books for at least half a century (perhaps originating from the mythical unreleased 1940 MRDP Part 1[54][55][56]: 2 [57][58][59][m] and De Leuw Cather from August 1961[66][n]). The DMR has a long memory (1986[o]), but Wikipedia has a longer one. How do those dinosaurs in the “vehicle-focused” “clan”[68] outlive every TfNSW reorg? I don’t want to be consulted; I want the department to follow their own damn (good) policy.
Is the word reallocation that hard to comprehend? Do we really need another TfNSW strategy[69] to tell themselves what to do[p] Or another Grattan[71] or NSW Productivity Commission report[72]? Ministers, anyone pushing this agenda are playing you for fools.
Policy thinktanks, urbanist advocacy organisations, local resident and community groups, supply-side reformers: I am calling on you to kill this road widening project for good. Increasing private vehicle capacity – “providing a more efficient connection for drivers travelling through the area.”[3]: §Right turn removal [q] – through car-focused modelling is not the way to service more housing.[73] If a bus lane is needed (it is) – paint the damn lane red and save the $22 million (~$20k/metre[4]).[r] We need “dedicated bus lanes” for “bus priority”[75] and “active transport links”[75][76][77]
There’s a consultation feedback form, but once you’ve angrily filled that out – let the Ministers responsible know how you feel: John Graham and Jenny Aitchison.
Note: if you spot any errors, please let me know – I whipped up this blog post on the afternoon/evening of 2026-09-14. I include quotes and page numbers (including PDF page numbers) for your verifiability.
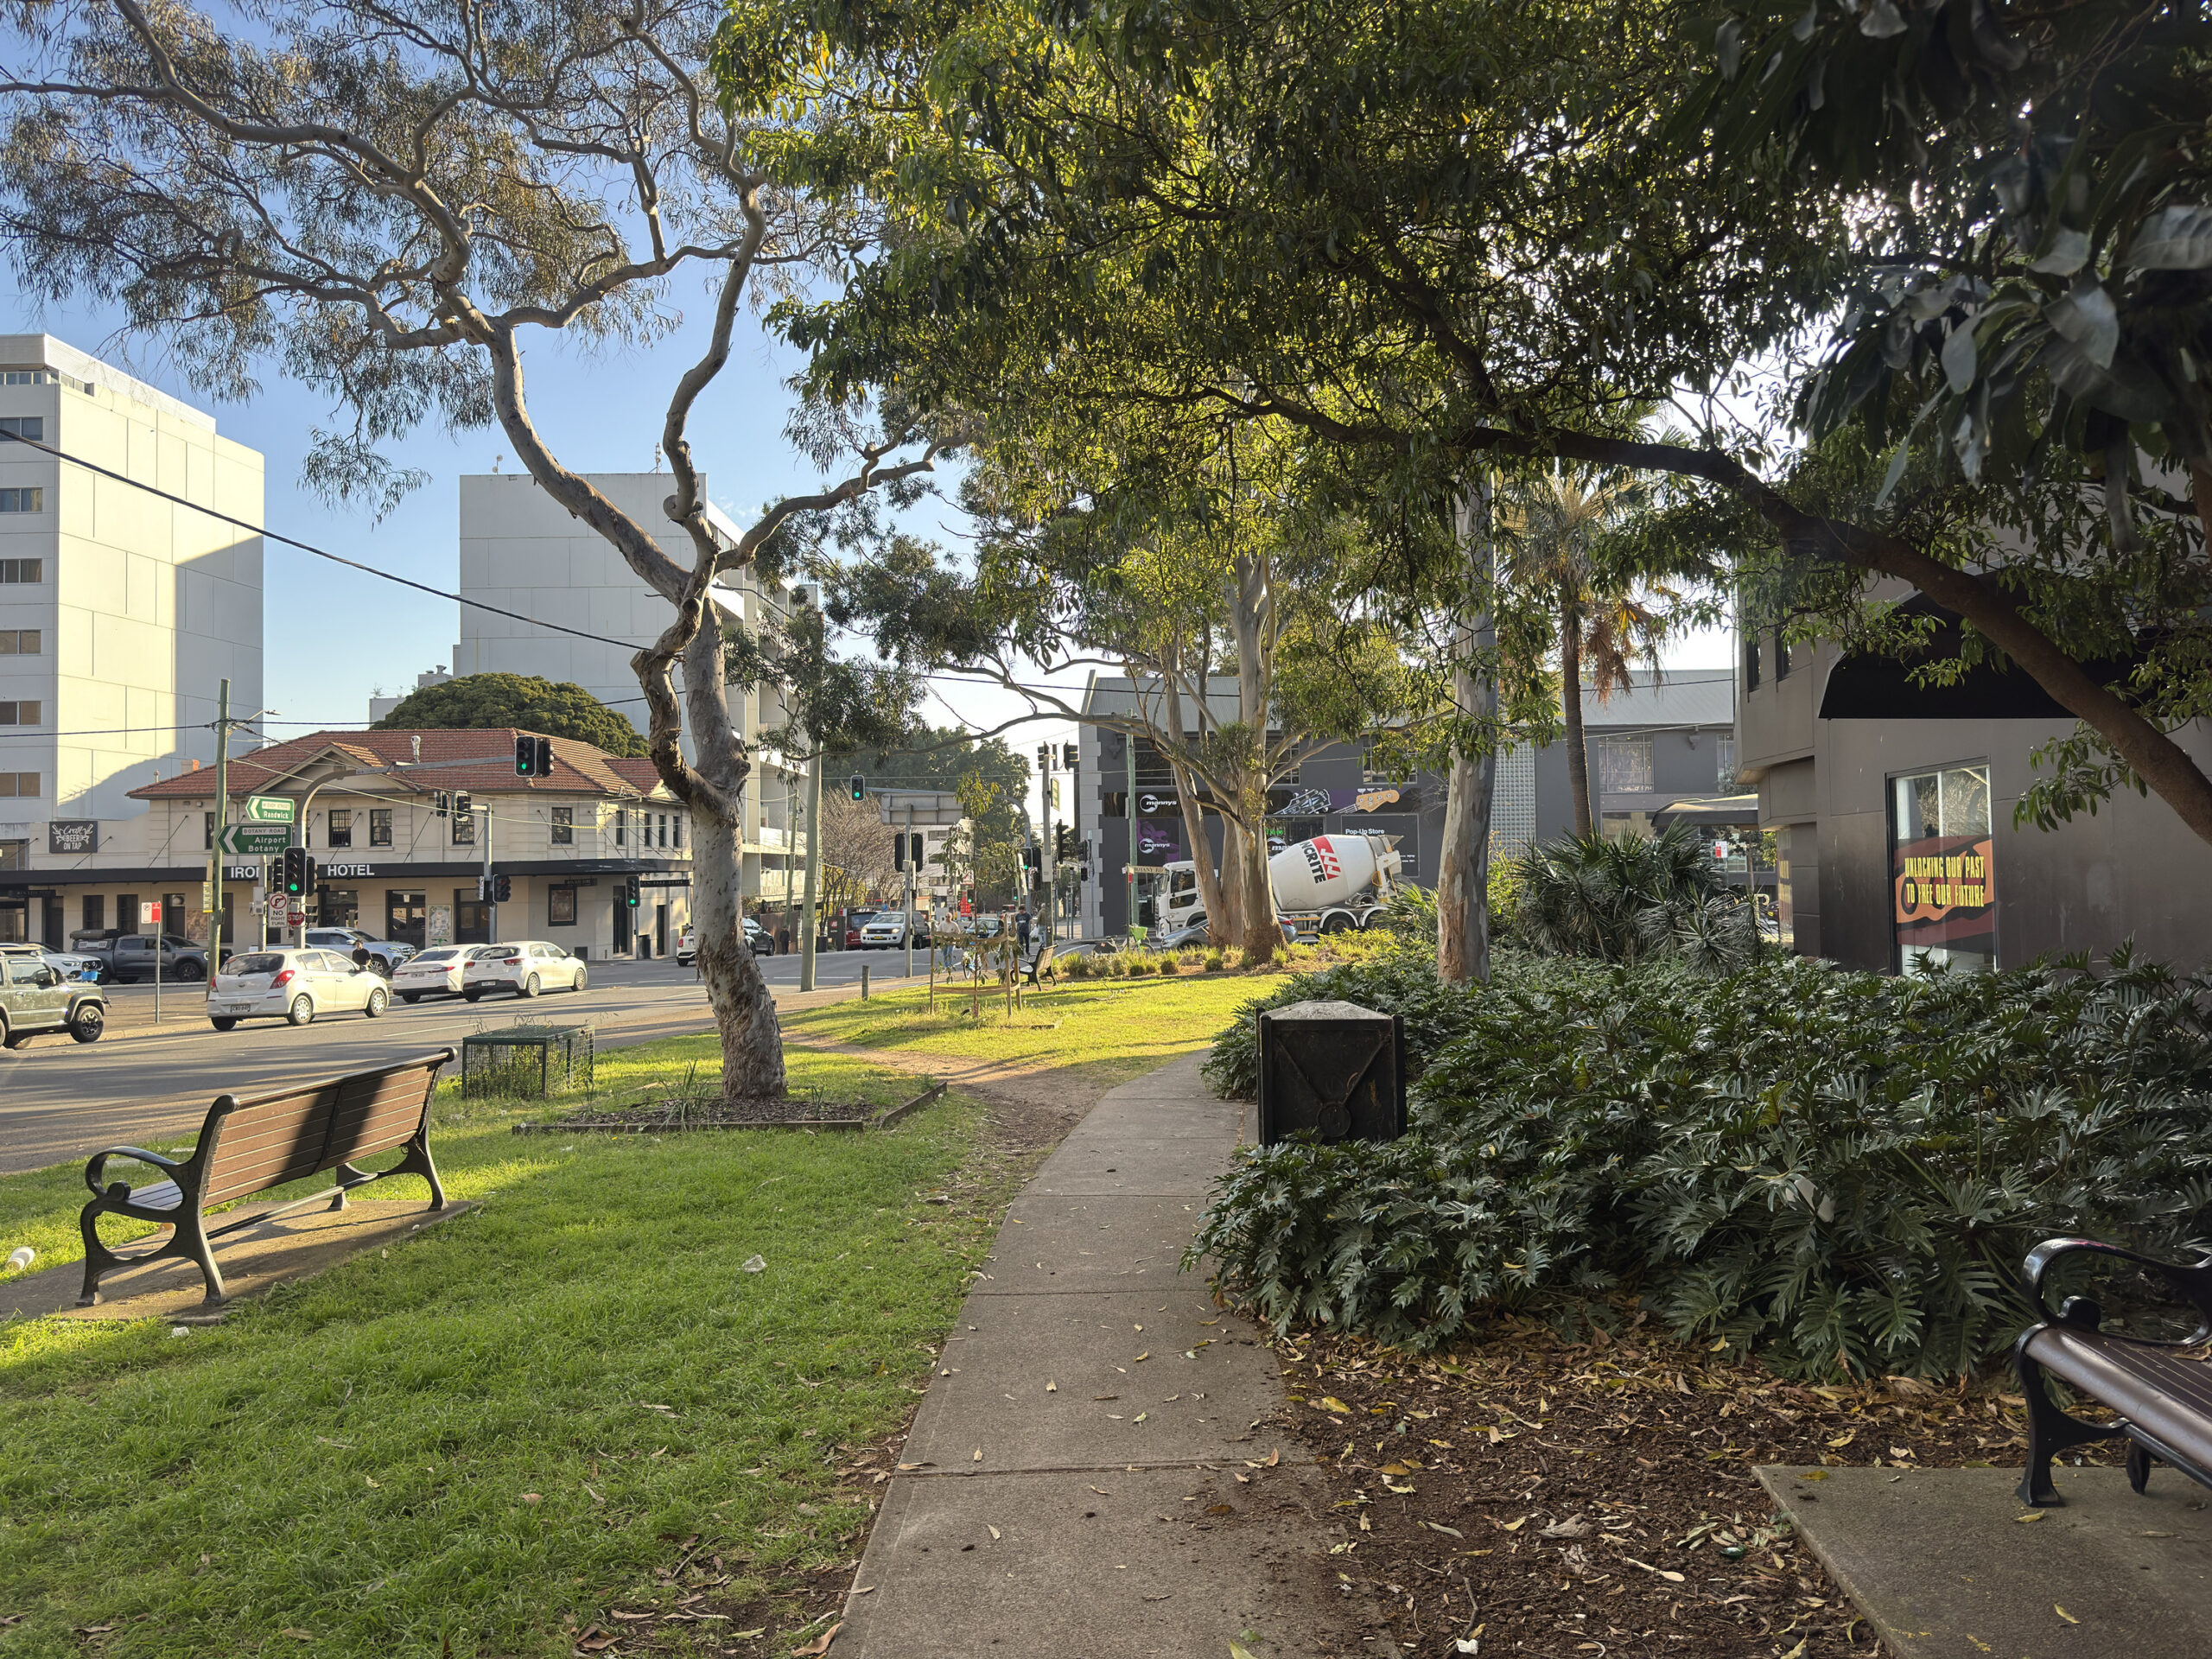
Enjoy it while it lasts. Gone by next year. Photographed 2026-09-14.
One more lane will fix it. Looking north along Botany Road at McEvoy Street. Photographed 2026-09-14.
Notes
- ↑ Or 6 days ago to select folks[1], perhaps with a mailing list created 2026-07-27T16:29:55+10:00 and updated 2026-09-08T10:14:54+10:00.[2]
- ↑ Perhaps you wonder what drives someone to write 13,000 words about this seemingly long-dead adjacent road project? You’re not the first.[6] It’s too good to print – yet.
- ↑ To save motorists a potential 8 seconds in the AM peak[9]: 83, 84 , according to the modelling.
- ↑ And for a northbound bus lane, good thing we widened a 50km/h inner-Sydney slip lane[10][11] – at St Paul’s Place right between two of Australia’s busiest train stations – “Making a bad road more awful” (Bicycle NSW). Ostensibly, one of the two project goals was “improving safety”. I trust that is true, DORAS & M&P policies were followed, and physical and temporal road user space is being prioritised for public and active transport before private vehicles – on a 2-star AusRAP road. I’m not aware of any community consultation: the community notice was published up to 12 days before construction – if one searches for TfNSW community notices on New Years Day.
- ↑ May reduce pressure? Get out of here! Who does TfNSW think they’re fooling here, advocates figured out this line decades ago.
“Improving the Botany Road and McEvoy Street intersection may also reduce pressure along alternative routes such as Henderson Road and Mitchell Road by providing a more efficient connection for drivers travelling through the area.”[3] - ↑ I’ve dropped $441 on a GIPA before, and I’ll … do it again![18]
- ↑ Keen readers will also note this covered a “Road Network Performance Review Plan” including “Euston Road, between Sydney Park Road and Botany Road” (E40 B iii)[20] – did anyone spot how quietly that[21] was uploaded? With “review date” 2025-10, doc 2026-06, (per sitemap.xml?page=1) 2026-07-08, TfNSW page updated 2026-02 – what am I supposed to make of that? Good thing Parramatta Road doesn’t need bus lanes apparently.[21]: p. 81 (PDF 91) Has John Graham been ignored: does this read like property acquisition is still on the cards? “Property acquisition … could increase cost, delivery timeframes and viability for some projects.”[21]: p. 129 (PDF 143) Almost as impressive is the robots meta content including noindex, nofollow, noarchive, nosnippet, noimageindex on the page linking to the Rozelle Interchange and Western Harbour Tunnel Enabling Works Design and Construction Deed[22], dated 24 November 2023[22]: PDF 4 , created in 2024 (according to the file metadata) and published about two weeks ago.[23][24]
- ↑ “funded outside the $16.812 billion budget” for WestConnex with the removal from the budget not “supported by robust analysis and justification”[25]: 2 (PDF 6)
- ↑ It’s a miracle Green Square turned out how it is.[27]: pp. 31-33 [28][29][30]
- ↑ “We investigated alternatives to a right turn ban from McEvoy Street into Botany Road including providing a dedicated right turn lane. This option required significant private property acquisition as well as impacts to trees and parking and was not progressed.”[3]: §Right turn removal
- ↑ And amusingly, impacts on car parking[3]: §Right turn removal like elsewhere: 10k homes to 34 stories, but apparently removing a few car parks is just too hard![32]: p. 30 [33]: pp. 6,67 Someone else must have written “…the provision of homes in Edgecliff and Woollahra results in a net reduction in vehicle kilometres travelled by car across the GMA, when compared to a base case where this growth might have taken place in locations further away from public transport and amenities. This is illustrative of the potential benefits of transport oriented development as opposed to ‘organic’ growth in areas less well served by existing public transport and amenities.“[32]: p. 97
- ↑ “…high capacity limited access route would cause severe severance effects in the community and in particular would affect the Aboriginal housing area in Chippendale as a result of the need to cross the railway on a new alignment”[34]: p. 107
- ↑ Still not as mythical[60] as the PBN! Transport for NSW applied for privilege on 15 documents[61][62] (under SO52(5) at the time[63]). 24 non-privileged spreadsheets[64] and 638 non-privileged documents were released and are accessible to the public.[65] The Parliament of NSW website index you have likely already read, dear eagle-eyed reader, omits these 638 documents. Let historians note one version of the Non-privileged – Excel document[65] states 25 items but actually has 24 rows: row with count 21 is skipped.
Perhaps TfNSW could just give Bicycle NSW the PBN geospatial files[60] and save me the effort of trawling through 2356 pages of internal emails and documents? I’ve got better things to do. - ↑ It’s uncanny how well the 1961 DLC report predicted the location of the Rozelle interchange.[66]: Plate 16
- ↑ “The DMR has a long memory and has at last talked the government around to the plans it has always had its heart set on” – Stephen Harris, Senior Lecturer in Town Planning, UNSW, 1986.[67]
- ↑ Or worse, ask volunteers to tell them to follow their own strategy: “…when a government agency writes 100 pages “discussing” a problem its own existing policy already solved on paper three years ago, is that a discussion — or a very long way of not implementing something?””[70]
- ↑ “While we understand this change may result in reduced connectivity for some road users, it will reduce congestion and queuing through the intersection and improve travel time reliability for all road users. Improving the Botany Road and McEvoy Street intersection may also reduce pressure along alternative routes such as Henderson Road and Mitchell Road by providing a more efficient connection for drivers travelling through the area.”[3]: §Right turn removal
- ↑ At least the dollars come with a bus lane, unlike Fifteenth Avenue.[74]
References
- ↑ “Botany Road”. yoursay.transport.nsw.gov.au. Transport for NSW. 2026-09-09.
Page published: 09 Sep 2026, 12:46 PM
- ↑ Source of https://yoursay.transport.nsw.gov.au/botany-bus-improvements/surveys/botanyroad_subscribe1
- ↑ 3.0 3.1 3.2 3.3 3.4 3.5 3.6 3.7 3.8 “Botany Road and McEvoy Street intersection and bus corridor improvements”. Transport for NSW. 2026-09-14. Archived from the original on 2026-09-14. Retrieved 2026-09-14.
- ↑ 4.0 4.1 “botany-rd-and-mcevoy-st-map.jpeg”. Transport for NSW. Archived from the original on 2026-09-14.
- ↑ Rod Fraser (1964). Examination of Aspects of Metropolitan Planning Significance in the De Leuw Cather Company’s Report on Geometric Design Study. Sydney Urban Expressways (Report). Sydney: Cumberland County Council.
David Ball (February 1996). “The Road to Nowhere? Urban Freeway Planning in Sydney to 1977 and in the Present Day (Urban Research Program Working Paper No.51)”. p. 16. Archived from the original on 2026-03-02.
Nick Yetzotis (2026-05-12). “Notice of decision on your access application under the Government Information (Public Access) Act 2009 (GIPA Act)”. Letter to Jake Coppinger. 26T-1774. - ↑ hornetfig (2026-02-05). “Untitled r/sydney comment”. Reddit.
Why it has a 12,000 word Wikipedia article started only last year, written effectively by one author – the blog author and linked to only in the Sydney roads infoblock is a ~mystery~.
- ↑ “Harris Street pedestrian crossing removal” (PDF). Transport for NSW. November 2023. Archived (PDF) from the original on 2025-09-25.
- ↑ “Road network upgrades to boost safety for Western Distributor”. Transport for NSW. 2022-09-21. Archived from the original on 2022-09-30.
- ↑ “Western Distributor Network Improvements Review of Environmental Factors” (PDF). Transport for NSW.
- ↑ “Community Notice: Intersection Improvements at Regent Street and Cleveland Street, Chippendale from Monday 13 January” (PDF). Transport for NSW. January 2025. Archived (PDF) from the original on 2025-11-17.
- ↑ “(Untitled Facebook Post)”. BikeSydney. 2025-05-28. Archived from the original on 2025-09-03.
- ↑ Daniel Lo Surdo (2025-09-22). “Former transport minister was misled over ‘massive’ safety promise, secret emails reveal”. The Sydney Morning Herald.
- ↑ Jake Coppinger (2025-05-27). “Not enough funding for Sydney Park Junction – Addendum REF to cut scope”.
- ↑ Jake Coppinger (2024-09-09). “Another broken WestConnex promise: secret Sydney Park Junction design changes”.
- ↑ Jake Coppinger (2024-11-26). “Sydney Park Junction: TfNSW Won’t Commit to Original Scope Despite Ministerial Intervention”.
- ↑ Daniel Lo Surdo (2025-05-27). “The transport minister made a safety promise. Four days later, it was torn apart”. The Sydney Morning Herald.
- ↑ “Government Information (Public Access) Act 2009”. Transport for NSW. n.d.
- ↑ Jake Coppinger (2025-09-24). “Green Lights More Often: The Secret 2018 Study of Sydney’s Traffic Signals”.
- ↑ 19.0 19.1 Jacobs Group; Roads & Maritime Services (November 2019). Alexandria to Moore Park Project Stage 1 Review of Environmental Factors (PDF) (Report). Transport for NSW. ISBN 978-1-922338-18-1. Archived (PDF) from the original on 2025-10-14.
- ↑ Roads and Maritime Services (2018-08-20). “WestConnex M8 (New M5) Conditions of Approval – WestConnex Stage 2 – New M5 SSI 6788” (PDF). Linkt. p. 69.
- ↑ 21.0 21.1 21.2 M4 East 5 Year Road Network Performance Review Plan (PDF) (Report). Transport for NSW. June 2026.
- ↑ 22.0 22.1 “Rozelle Interchange and Western Harbour Tunnel Enabling Works Design and Construction Deed Second Deed of Amendment” (PDF). 2023-11-24. AUS\TCZ\692423830.19. Archived (PDF) from the original on 2026-09-09. “Government Information (Public Access) Act 2009 Explanatory Table Rozelle Interchange and Western Harbour Tunnel Enabling Works Design and Construction Deed Second Deed of Amendment” (PDF). transport.nsw.gov.au. n.d. 692811057.06.
- ↑ “Rozelle Interchange and Western Harbour Tunnel Enabling Works Design and Construction Deed Second Deed of Amendment”. transport.nsw.gov.au. Transport for NSW. 2026-09-01. Archived from the original on 2026-09-09.
- ↑ “sitemap.xml?page=6”. transport.nsw.gov.au. Transport for NSW. 2026-09-01. Archived from the original on 2026-09-09. Retrieved 2026-09-09. (2026-09-01T17:39:56+10:00)
- ↑ 25.0 25.1 25.2 “WestConnex: changes since 2014” (PDF). Audit Office of NSW. 2021-06-17.
- ↑ 26.0 26.1 WestConnex: changes since 2014 (PDF) (Report). NSW Audit Office. 2021-06-17. Archived (PDF) from the original on 2026-02-11.
- ↑ “GREEN SQUARE TOWN CENTRE DRAFT MASTERPLAN AND LOCAL ENVIRONMENTAL PLAN AND RELATED MATTERS – INFORMATION REPORT” (PDF). City of Sydney. 2004-11-05. Archived (PDF) from the original on 2026-09-14.
- ↑ South Sydney City Council (2003). South Sydney Section 94 Contributions Plan 2003. The Green Square Town Centre (GSTC) Masterplan claimed the South Sydney Section 94 Contributions Plan 2003 (South Sydney Council) included $5,140,000 for such an New East-West Relief Route.
- ↑ “ITEM 7. ZETLAND AREA TRAFFIC STUDY – STATUS REPORT (2029696)” (PDF). City of Sydney. 2005-04-01. pp. 12, 14, 17. Archived (PDF) from the original on 2026-09-14.
- ↑ Maunsell Australia Pty Ltd (2003). Zetland Area Traffic Study (Report).
- ↑ “Accelerated Infrastructure Fund”. NSW Department of Planning, Housing and Infrastructure. 5 May 2025. Archived from the original on 2026-03-12. Retrieved 2026-03-12.
Improvment (sic) work at McEvoy Street and Botany Road.
- ↑ 32.0 32.1 Edgecliff-Woollahra State-led Rezoning Transport Management and Accessibility Plan (PDF) (Report). Transport for NSW. August 2026.
- ↑ Strategic Cycleway Corridor Program Eastern Harbour City (Report). Transport for NSW.
- ↑ 34.0 34.1 MacDonald Wagner (February 1987). Pyrmont-Alexandria Traffic Management Proposal – Environmental Impact Statement. ISBN 0730545490.
- ↑ The Premier; Minister for Planning and Public Spaces (2023-07-23). “NSW Government investing $40.9 million to fast-track critical infrastructure in high growth communities” (Press release). Archived from the original on 2026-01-17.
- ↑ 36.0 36.1 36.2 36.3 “WestConnex traffic ‘nightmare’ headed to Sydney’s east under the A2MP plan”. The Daily Telegraph. 2017-12-12.
- ↑ RON HOENIG. “Legislative Assembly Hansard – 16 February 2017”. Parliament of NSW.
- ↑ 38.0 38.1 Marie Hogg (2018-03-13). “Moore Park trees could face the axe for WestConnex connection”. The Daily Telegraph.
- ↑ Alex Greenwich (2018-03-07) [2017-03-06]. “Alexandria to Moore Park (Private Members’ Statement, 6 March 2017, Legislative Assembly, NSW Parliament)”.
- ↑ 40.0 40.1 Matt O’Sullivan (2016-12-06). “WestConnex spawns major upgrade to congested road corridor in inner Sydney”. The Sydney Morning Herald.
- ↑ Alex Greenwich (2016-12-07). “Alexandria to Moore Park Connectivity Upgrade” (PDF). Letter to Duncan Gay. Archived (PDF) from the original on 2024-08-12.
- ↑ Duncan Horscroft (2018-06-25). “All Roads Could Lead to Off-ramp Chaos”. The Beast. Archived from the original on 2024-07-22.
- ↑ Nigel Gladstone (2017-11-08). “Alexandria Roads a ‘cancerous mess’“. The Daily Telegraph.
- ↑ Doorknocking, 2026-09-14.
- ↑ Botany Road Project Team (2026-09-14). “Botany Road Feedback Form”. yoursay.transport.nsw.gov.au. Transport for NSW.
Hello, Submitting feedback on Transport projects helps to inform the project team of your concerns. Our engagement team will provide a summary report to inform the next stage of design, using this feedback. With this in mind, please answer the following as best you can. Kind Regards, Botany Road Project Team
- ↑ “Project finder (filter by Alexandria to Moore Park Project)”. Transport for NSW. 28 April 2017. Archived from the original on 2026-09-14. Retrieved 2026-09-14.
- ↑ Matt O’Sullivan (2019-07-08). “Sydney CBD bypass plans to be scaled back to allay residents’ concerns”. Sydney Morning Herald.
- ↑ David Levinson (2018-11-13). “Traffic connector, community disconnector: increased traffic and pedestrians don’t mix”. Foreground. Archived from the original on 12 March 2026.
- ↑ Roads & Maritime Services (December 2016). “Alexandria to Moore Park Connectivity Upgrade” (PDF). Archived (PDF) from the original on 2025-10-14.
- ↑ “Alexandria to Moore Park Connectivity Upgrade – Display of the preliminary concept design” (PDF). Roads and Maritime Services. June 2017. RMS 17.278.
- ↑ Alexandria to Moore Park Stage 1 Submissions Report (PDF) (Report). Transport for NSW. April 2020. Archived (PDF) from the original on 2025-10-14.
- ↑ Ava Tan, Connor Hoang (2025-09-24). “224-234 Young Street, Waterloo Transport Impact Assessment”. ason group. p. 10 (PDF 14). Archived from the original on 2026-09-14.
The McEvoy Street/ Bourke Street/ Lachlan Street intersection upgrade is not included as part of the Stage 1 works, with the indicative future intersection layout and road alignment shown in Figure 10. TfNSW has not provided a timeframe for the compulsory acquisition process or road widening, and alignment works.
- ↑ Matt O’Sullivan; Christopher Harris (2024-02-09). “‘We just bought the place’: Homes, businesses were slated for demolition in Parramatta Rd expansion”. The Sydney Morning Herald.
- ↑ Main Road Development Plan for Sydney Metropolis and County of Cumberland – Part 1 Investigations Relating to the Present and Future Extent and Pattern of the Metropolis. Department of Main Roads NSW. 1940.
- ↑ Department of Main Roads NSW (1976). The Roadmakers – A History of Main Roads in New South Wales (PDF). The Department. p. 204. ISBN 0-7240-0439-4. Archived from the original (PDF) on 2024-04-26.
- ↑ E. R. Jefferay (1963). PLANNING AND DESIGN OF URBAN EXPRESSWAYS IN N.S.W. WITH PARTICULAR REFERENCE TO THE COUNTY OF CUMBERLAND (Report). Department of Main Roads.
- ↑ Hon. Justice Michael Barker President, WA State Administrative Tribunal (2007-05-04). How Planning and Environmental Law Has Shaped Our Cities (PDF). 2007 Planning Institute of Australia National Congress. p. 8. Archived (PDF) from the original on 2025-04-06. Retrieved 2025-10-26.
- ↑ “RTA Heritage and Conservation Register – Thematic History – Second Edition 2006” (PDF). Roads & Traffic Authority NSW. 2006. p. 45. Archived (PDF) from the original on 2024-05-06. Retrieved 2025-10-26.
- ↑ County of Cumberland Main Road Development Map (Map). Department of Main Roads NSW. 1945.
- ↑ 60.0 60.1 Sarah Bickford (2026-08-28). “What is the Principal Bicycle Network?”. Bicycle NSW. Archived from the original on 2026-08-30. Retrieved 2026-08-30.
- ↑ “Transport for NSW – Privileged Index Principal Bike Network Plan” (PDF). n.d. “Submissions of Transport for NSW Order for papers – Principal Bike Network Plan Strategy 3 June 2020” (PDF). n.d.
- ↑ “Return to order – Principal Bike Network Plan for Sydney – Return identifying documents received on Wednesday 24 June 2020 from the Secretary of the Department of Premier and Cabinet, which are considered to be privileged and should not be made public or tabled”. parliament.nsw.gov.au. Parliament of NSW. 2020-08-04 [2020-06-24]. 1661PRIV.
- ↑ “Standing Rules and Orders of the Legislative Council” (PDF). Parliament of NSW Legislative Council. 2004-05-05. p. 15 (PDF 23). Archived from the original (PDF) on 2025-12-01.
- ↑ “Non-privileged – Excel” (PDF). files.parliament.nsw.gov.au. Parliament of NSW. n.d. (RO1660)
- ↑ 65.0 65.1 Non-privileged – Standing Order 52 – Index of Documents: Principal Bike Network. Parliament of NSW. “Return to order – Principal Bike Network Plan for Sydney – Documents received on Wednesday 24 June 2020 from the Secretary of the Department of Premier and Cabinet, together with an indexed list of documents”. 2020-08-04 [2020-06-24]. 1660RO. State Archives NSW (2020-08-04). Box NRS-18551-21-378. A000029437 (AC0892805). Western Sydney Records Centre: Museums of History NSW. State Archives NSW (2020-08-04). Box NRS-18551-21-379. A000029436 (AC0892806). Western Sydney Records Centre: Museums of History NSW.
- ↑ 66.0 66.1 De Leuw Cather (August 1961). Report on Geometric Design Study: Sydney Area Expressways.
- ↑ Stephen Harris (1986-08-17). Stop Them Resurrecting Askin’s Freeways – Background Issues and Concerns (Report). Inner Sydney Regional Transport Group. p. ii.; Stephen Harris (1986-08-17). Notes from Address. Inner Sydney Regional Transport Group Public Meeting.
- ↑ Brown, Aston; Bowring, Declan (2026-02-09). “Cyclists slam ‘nightmare’ shared path at new Sydney Fish Market”. ABC News. Archived from the original on 2026-02-08.
- ↑
Transport for NSW (October 2025). “Connecting NSW Strategy – Priorities for Transport” (PDF). New South Wales Government. p. 27. Archived (PDF) from the original on 2025-11-01. Retrieved 2025-11-02.
We will rebalance road investment, from providing additional capacity for general traffic (such as through road widening), to reallocating of existing road space for public transport and active transport alternatives. More space for buses can lead to fewer vehicles moving more people. The reallocation of road space will be required for high quality, frequent, turn-up-and-go bus services which can support the delivery of more diverse, ‘missing middle’ housing in areas closer to existing infrastructure, services and jobs.
- ↑ WalkSydney (2026-06-28). “When is a discussion paper not a discussion paper? TfNSW “Have your say on Walkable NSW by 30 June”“. Substack.
- ↑ …Congestion is best managed in our cities using other policies, such as road-user charging, and the effective provision of public transport, which also becomes cheaper at higher densities. Brendan Coates; Joey Moloney; Matthew Bowes (November 2025). “More Homes, Better Cities: Letting more people live where they want” (PDF). Grattan Institute.
- ↑ Initiatives like transit lanes, bus priority lanes, and bus rapid transit can make buses faster and more reliable, and so entice onto public transport many people who would otherwise drive. Such measures can restrict road space and risk worsening traffic for remaining cars, but they usually allow a higher total number of people to travel. “Building more homes where infrastructure costs less” (PDF). NSW Productivity Commission. August 2023. p. 28. Retrieved 2025-12-03.
- ↑ SCT Consultants (2026-07-03). Edgecliff-Woollahra Precinct State-led Rezoning Traffic and transport review – Scenario 3 (rev 1.0) (PDF) (Report). Woollahra Council. Archived from the original (PDF) on 2026-09-08.
- ↑ Aston Brown (2026-07-20). “Government urged to rethink $1.4b Western Sydney airport road upgrade”. ABC News.
- ↑ 75.0 75.1 “Submission Guide: 13,000 homes at Westmead South!”. Sydney YIMBY. 2026-09-10.
Some changes to the plan we’d love to see: (1) Active transport links: Dedicated bikeways or quietways, particularly along Hawkesbury Road, Good/Pye Street, Houison/Hassall Street, Amos Street, and Austral Avenue (as recommended by supporting studies). (2) Bus priority: Hawkesbury Road is nominated as a potential future bus corridor, however the PTS only plans for a maximum of 4 buses per hour. Dedicated bus lanes would help make the most of the public transport investment here.
- ↑ Infrastructure Australia (n.d.). “Greater Sydney cycling network improvements”. Australian Government.
Next Steps: Proponent to identify and analyse potential investment options (Stage 2 of Infrastructure Australia’s Assessment Framework). In identifying and analysing options, the proponent should continue to develop a program delivery and prioritisation approach. This should ensure there is an integrated program and pipeline of prioritised cycleways that is informed by program outcomes, land-use planning developments, demand in strategic corridors, delivery capacity and funding mechanisms.
- ↑ UrbanSpectra Pty Ltd (July 2026). Quantifying Cycling Trips in the City of Sydney (Report). City of Sydney Council.
The post Just one more lane: TfNSW revives WestConnex zombie Alexandria to Moore Park road project first appeared on Jake Coppinger.
]]>The post Updates to Australian Cycleway Stats first appeared on Jake Coppinger.
]]>These are not great metrics, but are useful heuristics – including for verifying and comparing claims of density and network length metrics per council (a pertinent topic!) with deterministic, open source calculations on human-verified consensus-based data (OpenStreetMap – which I contribute to almost daily).
A better metric, perhaps the most important, is cycling access using safe streets and cycleways – and one I am deeply passionate about. Affordable homes where people want to live need safe access to destinations people want to visit (without burning oil). Measuring this metric is important – almost as important as increasing it.
UrbanSpectra is open to work for evaluating, modelling, visualising and communicating urban data – and has an exciting product in development. If your private or public organisation is looking for rigorous analysis or tools using such data, or is interested in an early demo of this product – get in touch!
UrbanSpectra‘s capability statement is published at urbanspectra.com/capability-statement/
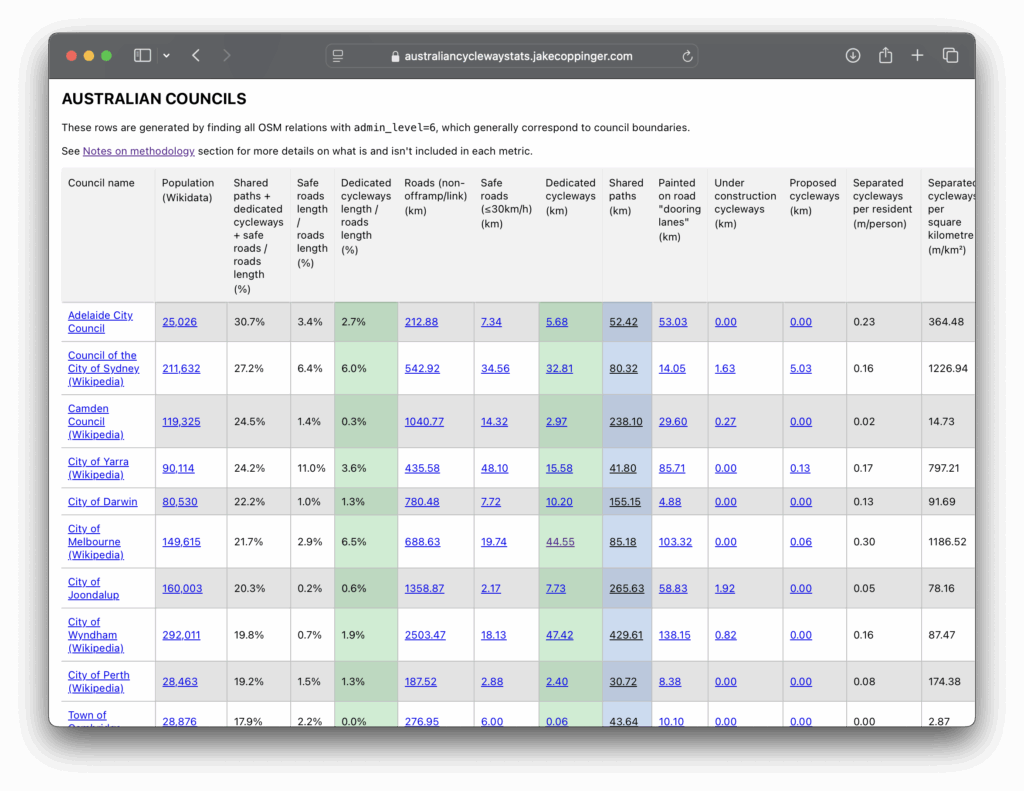
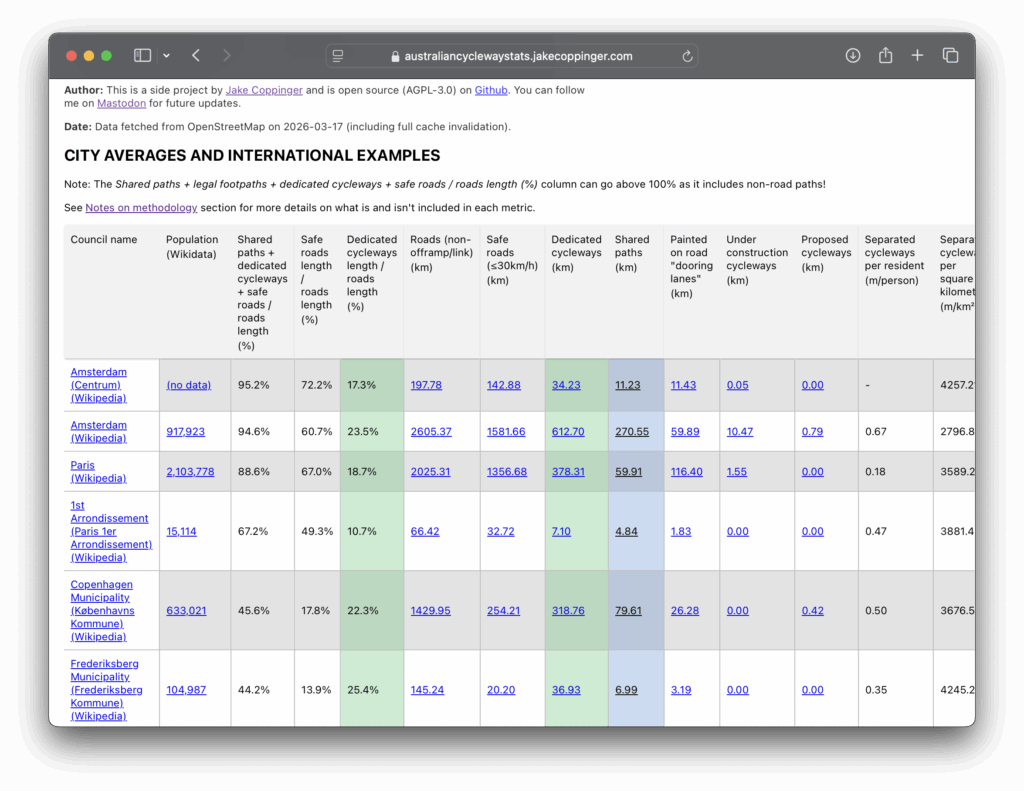
The post Updates to Australian Cycleway Stats first appeared on Jake Coppinger.
]]>The post Better Streets Submission for Walking and Cycling Improvements between South Eveleigh and Waterloo Metro (Henderson Road) first appeared on Jake Coppinger.
]]>It’s a long one – TLDR; we support it! I hope the citations may be of enduring value for the context and history of these intersections (if you’re a Wikipedia editor, contact me if you’d like the Wikitext to save rewriting references). It was originally published on the Better Streets website, and was submitted as a PDF.
I sought open review from Better Streets members and it was approved by Better Streets leadership. Thanks very much to all the very talented reviewers (from diverse professional backgrounds) for their valuable input, advice, and review.
Better Streets strongly supports the proposed concept design for walking and cycling improvements between South Eveleigh and Waterloo Metro.[1][2] Planting new street trees, widening the footpath, and providing a dedicated bus stop platform outside the Waterloo Metro station will greatly benefit the local community, visitors, commuters, and future residents.
The implementation of a separated cycleway along Henderson Road will complete the essential missing link from the existing Henderson Road cycleway to George Street. This link will measurably improve safety and access for people cycling between Erskineville, Waterloo Metro Station, and the George Street Cycleway.
The proposed walking and cycling improvements between South Eveleigh and Waterloo Metro will improve bus prioritisation, improve safety, and provide a critical connection for people riding bikes.
This submission details opportunities for improving the experience and safety of people walking and riding, by:
- Improving bus reliability to make public transport more convenient
- Reducing traffic signal delays for people walking and riding
- Streetscape improvements for the Botany Road shopping street; and
- Suggestions for walking and cycling prioritisation on SP2 land
Together, these improvements will begin to repair decades of damage caused by a dangerous, high-traffic arterial corridor, and will improve the well-being of the community, economy, and environment.
Better Streets is a national registered charity and Australia’s peak body advocating for safer, healthier, and more sustainable streets.[3] It is made up of a coalition of over 130 member organisations.[4][5][6] It is volunteer-driven, does not receive government funding, and is funded by membership and donations from the public.[7] This submission was informed and reviewed by a number of transport professionals within Better Streets.
Quick position summary
Better Streets is supportive of measures that improve the experience of people walking, cycling, and resting on streets, including widening footpaths, building safe separated cycleways, bus priority measures, planting more trees, and reducing private car parking on public road space to encourage mode shift. We encourage shorter waiting times at signalised intersections for people walking and riding, and support 30km/h speed limits on local streets.[8][9] We oppose measures to increase private vehicle road capacity in built-up areas.
Bus prioritisation
Better Streets supports the bus prioritisation measures on Raglan Street east of Botany Road. Such measures could reduce traffic intrusion into the existing and proposed residential neighbourhoods along Raglan Street and in Waterloo. Improving the on-time running of buses will encourage people to use public transport, and will enable new housing without debilitating vehicle traffic.
We support the footpath extensions and an appropriate floating bus stop treatment as implemented on the newly completed Oxford Street cycleway.
Streetscape improvements should proceed regardless of bus priority improvements
The streetscape improvements should proceed regardless of the bus prioritisation improvements. It would be a huge loss for the community, environment, and Transport for NSW (TfNSW) / City of Sydney (CoS) to not improve the streetscape.
The bus improvements were not included in the Chatswood to Sydenham Metro (EIS Technical Paper 1[10], CoS-commissioned 2021 Cattell Cooper Report[11]: 44, 45, 46 , Get NSW Active 2023-24 description[12], or action C5 of the Waterloo Station Interchange Access Plan[13], so we assume this is an improvement based on considerations of the Road User Space Allocation Policy (RUSAP) as bolstered by the Connecting NSW strategy.[14] Alternative explanations for its inclusion could be that it addresses a regression regarding Condition D12 of the Sydney Metro City & Southwest (C&SW) Conditions of Approval (CoA)[15], frees up temporal capacity at the traffic signal TCS47 (aka. WLO01 or S.ID 54) to permit the project through the TCS approval gauntlet[16], or – could advertently impede project implementation.[a]
Shorter traffic signal cycle times improve bus operations
Improving signal phasing by lowering traffic signal cycle times would significantly reduce delays for people walking and riding bikes. Such changes would also improve bus reliability and shorten trips.
According to the TfNSW study on the broad 2018 Sydney CBD traffic signal cycle time changes, reducing the maximum traffic signal cycle time by 20 seconds had a neutral to positive impact on bus operations[17] and “no measurable impacts on traffic operations”.[18]: (A) (vii)
The study observed “Buses continued to operate normally”[19][20], on most streets they ran faster, and on one street they arrived an average of 3.6 minutes earlier[21][20]: 5 – so much faster bus drivers were apparently unable to drive slowly enough to meet the old timetable. Only one of the streets analysed had slower buses (with less than 50 seconds average delays behind the timetable).
This evidence can help address the recurring concerns about traffic signal timing negatively impacting bus operations, and whether delays could impact commercial operation arrangements.[c]
In any case, from first principles – if buses are provided with a dedicated lane, and no split failures at signals occur in the bus lane (i.e. as long as there isn’t a line of 10 buses trying to get through!), more frequent green lights would benefit buses and people walking and riding a bike.
Road space should be reallocated as necessary to ensure buses operate more efficiently. Implementing a dedicated bus lane along the paired one way roads – Harris Street, Regent Street, and Botany Road southbound; Henderson Road, Wyndham Street, Gibbons Street, Regent Street, Cleveland Street, Abercrombie Street, and Wattle Street northbound (known as the Southern Arterial Route) – would increase the people-moving capacity of the road and support the delivery of much needed housing supply of all types.[14][35][36]
Southern Arterial Route
Better Streets does not support extending the Southern Arterial Route[37] paired one-way roads (or increasing private vehicle traffic capacity in this corridor) to Green Square or further south – either as part of the development of the Henderson Road Cycleway or in the future.[38][d][e][f] Each of these roads should be two-way, including the future O’Riordan Street realignment at Green Square station.[g]
The Henderson Road Cycleway directly intersects with the Southern Arterial Route at two intersections. Henderson Road functions as the current terminus of the “Claytons” freeway.[45]
These two intersections have strategic and historical significance – as the proposed terminus in the (rejected) 1987 “Wyndham Street Residents’ Alternative”[46]: 102 , the terminus of the Stage 2 works in 1992, and subsequent abandonment of Stage 3 in 1993. Long signal cycle times have been documented at these intersections.[47][48][49]: 8 The implementation of Stage 2 created so much traffic congestion that it led people to support Stage 3 on the grounds that it would abolish the bottleneck at Henderson Road.[39]: 1 The 1993 Citizen’s Advocate Report stated “Ideally we need a solution to the problems of Stage 2 which does not involve the evils of Stage 3.”[39]: 1
“It’s crazy to bring more traffic into the city” (Margaret Barry, 1988).[50] We trust times have changed since 1993.[e]
Safety
Streetscape improvements will improve safety for people walking and riding bikes
Better Streets does not support outdated and pedestrian-hostile measures such as widened traffic lanes or pedestrian fencing, and opposes the installation of such measures in conjunction with streetscape works for this project. Adding a separated cycleway and widening footpaths will improve the safety of people walking and riding (vulnerable road users). Better Streets notes part of Henderson Road makes up a 2-star AusRAP segment.[51][h]
The opening of Stage 2 of the Southern Arterial route in 1992 turned Henderson Road into an extremely dangerous corridor.[51][52][49] “Mike”, who lived on a busy corner of Wyndham ran “a kind of unofficial St John’s Ambulance station from his house”, coming out to look after the victims lying on the road. He said in 1993 “Since I’ve lived here I’ve lost 5 blankets.. and saved two lives.”. In December 1992 a car crashed into his house. Mike stated “They are crucifying the people who live here”.[39]: 9
If it is to be redeveloped, SP2 zoned land on the west side of Botany Road (south of Henderson Road) should be utilised for cycling or walking infrastructure to serve new housing, not to add private vehicle lanes or parking outside a metro station.[i]
Better Streets also encourages future consideration of making Railway Parade one-way between Erskineville Road/Swanson Street and Sydney Lane, as Raglan Street east of Botany Road will effectively become a modal filter. This would unlock space for a separated cycleway rather than a shared path, reducing conflicts with pedestrians.
Remove heavy and hazardous vehicles from residential streets
Dangerous traffic should not travel adjacent to or interact with residents and people walking and cycling in a dense urban area. Redirecting appropriate heavy and hazardous traffic into underground tunnels would deliver significant safety and amenity benefits. “Realising the benefits of WestConnex and Sydney Gateway … will be important to reducing heavy vehicle traffic on the Botany Road Corridor”.[11]: 29
Now that WestConnex has been built, heavy or hazardous freight traffic should be diverted to underground tunnels and away from residential areas and vulnerable road users.
Botany Road, Regent Street and Gibbons Street are classified as Dangerous goods corridors[53], necessitating use of Henderson Road – which is adjacent to the proposed Henderson Road cycleway and residential buildings, where people live, walk to school, and work. Heavy vehicles in local streets result in oversized intersections, which encourage fast vehicle movements just outside a metro station and high-rise housing.
The policy to permit hazardous freight traffic to operate near people on residential streets rather than distanced in fire-suppressed tunnels was identified as a problem by the Inner Sydney Regional Transport Group in 1986, by residents in 1993, and re-confirmed by Cattell Cooper consultants in 2021. This is in line with the 1993 RTA finding that “the societal impact of a tunnel incident involving dangerous goods was preferable to a dangerous goods incident on the alternate route which ran past schools and hospitals”[11]: 29 [54], which led to the M5 East tunnel being designed to permit use by vehicles carrying dangerous goods.
“New Zealand and Australia are established world leaders in the use of FFFSs [fixed firefighting systems] road tunnels” (US Federal Highway Administration)[55] Austroads notes “The current specifications adopted for Australasian tunnels are of world class standards, and “In almost all cases, the performance of Australasian tunnels exceeded the performance of international tunnels.”[56] “Large bulk quantities of dangerous industrial chemicals moving at high speed with commuter traffic through city streets create the potential for major disaster (Inner Sydney Regional Transport Group, 1986).[57]: 4
When I put it to her that the Southern Arterial was the preferred truck route rather than South Dowling because you couldn’t transport dangerous/noxious goods that way because of the tunnels and what would happen if there was an accident in the tunnels, her reply was: “so it’s all right if it happens outside our homes rather than in their tunnels, so it’s our problem not theirs. What kind of logic is that?” – Carol, of Wyndham Street (1993).[39]: 8
Removal of the one-way pair will support road space reallocation to public and active transport
Better Streets supports increasing the road corridor people-moving capacity through the reallocation of road space and provision of public and active transport. This is not a radical view – it is (excellent) TfNSW policy[14] and supported by the Grattan Institute.[35]
We note the proposal does not reallocate any road space for general vehicle traffic travelling westbound on Henderson to northbound on Wyndham. Removal of the one-way pair would offer the opportunity to reconfigure and reduce the private vehicle traffic lanes on Henderson Road.[11]: 44
We support the long-standing[58][59][60][61][62] and more recently proposed[11][63] conversion of Botany Road north of Raglan Street from one-way to two-way operation.
The Henderson Road cycleway will connect South Eveleigh to Waterloo and beyond, repairing the severance identified before the Alexandria Goods Yards were even developed.[57]: 20, 21 The Botany Road “shopping centre” / “shopping arcades” (or “Waterloo shopping centre” – described as the intersection of Regent/Botany/Raglan/Henderson) has been struggling since 1992[39]: 17 [49]: 3 as predicted.[64] Walkable and bikeable streets are good for business.[65]
Implementing a cycleway along Henderson Road does not appear to, and should not, preclude future traffic-calming, transit or safety improvements on Botany Road.
Traffic signal operation
Traffic signals and signal phases have an impact on the economy and the experience of people walking and cycling. Any plans to improve the environment around Henderson Road should prioritise the Level of Service (LoS) for people walking and cycling.
We encourage TfNSW Network Operations to use the minimum possible cycle time to prioritise the Level of Service for people walking and cycling.
We are unaware of any mechanism for the City of Sydney to influence traffic signal cycle times and to ensure pedestrian and cyclist LoS is prioritised.[18] The effects of this post-installation control are visible in the experience of Green Square[29], an otherwise notable urban infill precinct which may see future comparison with Nordhavn.
For future stages, we urge the traffic modelling and analysis to focus on the LoS for people walking and riding. This is as per TfNSW’s mandatory RUSAP, which states temporal allocation should consider pedestrians before cars (and all other modes)[66][j]
Statements such as “Roads and Maritime Services (RMS) [TfNSW predecessor] is responsible for traffic signals and by their operation they generally give priority to motor vehicles over pedestrians” (unanimously approved City of Sydney motion[18]: (A) (iv) ) is of great concern and demonstrates parts of the organisation did not consider people walking as important as people driving.
Sydney Metro Condition of Approval interpretation may contradict RUSAP
Better Streets is concerned a Sydney Metro Condition of Approval contradicts the Road User Space Allocation Policy (RUSAP)[66], constraining improvements at intersections in this project. Condition D12 states:
D12: Traffic on local roads around each station must be monitored 12 months before the CSSI commences operation and for a period of no less than 12 months after commencement of operation. If monitoring indicates unacceptable traffic intrusion on local roads/streets as a result of operation of the CSSI beyond those that could reasonably be predicted in the EIS and/or Interchange Access Plan(s) in Condition E92, appropriate traffic management measures to mitigate the monitored impacts must be implemented following consultation with the Sydney Coordination Office and Relevant Road Authorities.[15]
This requirement was interpreted in the Block 1 Report[67] as measuring and preserving the Level of Service metric of vehicles at nearby intersections (including TCS47 and TCS55) at the expense of other modes.
A possible (and greatly concerning) interpretation is that Condition D12 locks in prioritisation of general vehicle traffic (rather than preventing ‘traffic intrusion’) – against TfNSW’s own policy – over all other modes at many intersections in this project. It is unclear whether this condition extends to 12 months after the completion of the Bankstown link conversion.
It would be absurd if this condition provides cover for the “vehicle-focused” “clan” within TfNSW[68] around every C&SW Metro station (and every Metro West station captured by CoA E126 and E124) – especially in the context of abysmal CoA compliance for active[69][70][71] and public transport reparations[72] in major road projects.
Better signal timing would improve temporal allocation of road space
The TfNSW Network (SCATS) Operations team must adopt its own Road User Space Allocation Policy which outlines the allocation of “physical and temporal road user space”, and where the priority of people walking and cycling is considered before general traffic. This policy is mandatory[66] though only sometimes followed.[73]
As fewer individual vehicles will need to be accommodated, we expect the bus-only segment at Raglan Street would free up temporal capacity at Botany Road and Henderson Road (TCS 47), with little-to-no concern of split failures of buses. In line with best practice road space reallocation from general vehicle lanes, TfNSW should reallocate any spare temporal capacity to pedestrians and cyclists through reducing cycle times.
TfNSW does not publish minimum possible traffic cycle times – or as-run cycle times. The gap between minimum and actual cycle times are a quantitative indicator of the government’s prioritisation of active/public transport versus general vehicle traffic.
In contrast with physical road space reallocation, traffic signal cycle times are a trivially revertible, zero-cost, continuous variable – rather than quite literally set-in-concrete discrete step function of physical capacity (the curb!). If SCATS is capable, this could be changed slowly rather than as an immediate step function. Such adjustments are well known to software engineers as “progressive rollouts” as a technique to avoid disruption. Such changes, like physical changes, dial up and down road capacity and therefore demand[k] (and is a proven measure to improve pedestrian safety at intersections[76] to get back on track for Vision Zero).
By design, SCATS ‘predicts and provides’ temporal road space to accommodate as much unconstrained private vehicle traffic as it can[18] up to the cycle time limit (in the absence of demand pricing and ambitious road user charging reform[77][78][79]). The RUSAP review noted “…temporal considerations of road space allocation are rarely discussed in the road space allocation conversation.”[73]: 21 – all this damning review could do was point a finger at the topic: it wasn’t even able to level criticism at signal timing due to the lack of transparency. This would be like stating ‘public authorities are rarely discussed in the power structure conversation’ in a history of New York – an oversight (and understatement) so damning it’s effectively admitting blindness (without even touching on the concerning possibility state control could re-route through TCS approvals[16] in the post Traffic Committee delegation era[80][81][82][83]).
If SCATS cannot “support the NSW Government’s “movement and place” policy” or RUSAP there should be “a review of the Sydney Coordinated Adaptive Traffic System to support the NSW Government’s “movement and place” policy in relation to improvements or alternatives to better serve pedestrians.” (unanimously approved CoS motion by Philip Thalis, Australian Institute of Architects 2024 Gold Medallist [18]: (B) (iii) ) SCATS customers are surely watching if it can rise to the challenge. If it can implement NSW Government Policy – we are awaiting evidence.[32]
Better Streets (and other groups) continue to advocate for traffic signal operation transparency and open signal phasing data to monitor this progress.
East-west private vehicle capacity
Pitt St & McEvoy Street should not be opened for private vehicle traffic
Better Streets supports the proposed bus-priority works to prevent private vehicle traffic intrusion into residential areas, and supports the continued closure for private vehicles at Pitt Street & McEvoy Street to similar effect.[d]
The original proposal to open McEvoy to Pitt Street for private vehicles[84]: 873 (PDF 59), 905 (91) was a major issue raised by residents.[85] Better Streets is aware of community concern this proposal represents an opportunity for this intersection to be re-evaluated.[86][a]
After hearing community feedback[87] (and “in a community win”[88]) the Department of Planning and Environment “decided to extend Pitt Street but keep it closed to traffic at McEvoy Street, to make it safer and easier for local residents to walk and cycle.”[87][89][90][91] Keeping Pitt Street South closed for private vehicles and allowing flexibility to achieve tall building design outcomes are “key features of the latest plan for Waterloo South following community feedback.”[87]
A2MP must not be justified by bus priority works
Better Streets rejects any future suggestions that east-west bus priority works on Raglan Street would necessitate works to increase private vehicle capacity at McEvoy Street & Botany Road[92]: 13 or complete the Alexandria to Moore Park (A2MP) Project.[93][94] A2MP construction would require the “bulldozing” of homes and businesses from Alexandria to Waterloo.[95]
The A2MP project is currently “In progress” according to the TfNSW website.[96] “The effects of the [A2MP] upgrade on the Botany Road corridor upstream in the north-south direction are currently unknown.”[53] “TfNSW has not provided a timeframe for the compulsory acquisition process or road widening, and alignment works.” (September, 2025)[97]
The Infrastructure Opportunities Plan – released 6 days ago – includes $18 million for “Improvment (sic) work at McEvoy Street and Botany Road”, with “planning and design underway” for completion this year.[92][98] Increasing capacity for dangerous freight traffic towards dense Waterloo neighbourhoods and Henderson Road is bad policy and suggests “vehicle-focused” “very powerful vested interests”.[68] Those funds could have gone to reopening a (flat) Glebe Island Bridge[99] – once again, this is ‘freeways by stealth’.[100] The dedicated left-turn bay from McEvoy Street into Botany Road should be reallocated to footpaths and parklands.[53]
Such destruction would squarely fall on the legacy of WestConnex Network Integration works[101], the “vehicle-focused” “clan” within Transport for NSW[68][d] and the long and horrifying history of proposed resumption, demolition and widening of the arterial route along the McEvoy Street corridor from Sydney Park Road to Moore Park (1951[103] (1945/1948[104][105][106]), 1958[107], 1961-1969[108], 1967-1968[109][110][111], 1971[112], 1980[113][114], 1981[115][46]: 2 , 1987[46]: 112 , 1998[116], 2007[61], 2017[117], 2023[94]) – and not due to a short bus-only street or a ~2m wide cycleway.
“The DMR has a long memory and has at last talked the government around to the plans it has always had its heart set on” (Stephen Harris, Senior Lecturer in Town Planning, UNSW, 1986).[40][e] “All the pieces are sitting in someone’s desk. It is time they came out.”[100]
Notes
- ↑ 1.0 1.1 Extract of text from poster located at Cope & Raglan Street, above a REDWatch poster (viewed 2026-03-03). No author is stated on this poster.
WARNING: Proposed new local traffic restrictions
Council proposes to BAN ALL CARS from this section of Raglan Street
All 4 existing traffic lanes would be removed, leaving only a cycleway and 2 bus-only lanes
Walking and cycling improvements are all achievable without cutting local car access from this key East-West link to Alexandria/Erskineville from Redfern/Waterloo
“Consultation” details are on City of Sydney’s website - ↑ Along with – apparently – commercial considerations in the age of SCATS Cit-e SPaT. At this rate, cars will be getting signal timing data before humans.[22] Signal timing data should be published “so that the data is available to anyone who is interested”[23]: 7 – this is public government data owned, created by, and about NSW. It’s not challenging for TfNSW to publish the output of something like
$RegionList = 'EPP','SIL'; foreach ($i in $RegionList) { & "C:\Program Files (x86)\SCATS\History Viewer\ScatsHistoryViewer.exe" -console -offline -region $i -from "20260101" -tpf "07:00:00" -tpt "23:00:00" -sites "all" -s -out "C:\Users\USERNAME\folder\statistics.csv" -append }[24][25]: 66 [26]: “There is nothing particularly tricky happening here” (WA Main Roads[27]). In the words of the Utah DOT in the Q&A after showcasing use ofscatshistoryviewer.exe, “Our revenue in government is how much the public trusts us. We try to be as transparent as we can and if there’s any data that’s not personal, we give it to the public.”[28][25] Public trust in NSW signal operation is not good.[29][30][31][32] The CoS 30/45 second max wait time targets[33] cannot be evaluated (and likely will not be achieved) without open signal phasing data. - ↑ Additionally, one sensitivity of open traffic signal timing data[b] is the perceived risk of private bus operators initiating legal action in the case of missed on time running targets.[34]
- ↑ 4.0 4.1 4.2 The recent characterisation by an ex-NSW Transport Minister of a “vehicle-focused” “clan” in TfNSW (ABC[68]) is greatly concerning.[102] We hope implementation of a bus-only street and cycleway would not become a reason to increase additional capacity for general traffic on other streets.
- ↑ 5.0 5.1 5.2 The Citizen’s Advocate for the proposed Stage 3 of the Southern Arterial Route claimed in 1993 that “some RTA personnel” have confidence that “not enough people care enough for there to be any danger of their plans not being realised.”[39]: 6
- ↑ “The DMR has a long memory” (Stephen Harris, Senior Lecturer in Town Planning, University of NSW, 1986).[40]
- ↑ The Green Square Over Station Development is also known by “Site 1”[41] / “Transport Place”[42] / RTA Tower[43]: 11 , and 2A Bourke Road (SP2 zoned) will be used for the realignment.[44][43]
- ↑ NSW is working towards the national target of 80% of all road travel in the state being taken on State Roads rated 3 or more stars by 2030.[51]
- ↑ This SP2 road reservation may also require resumption of parts of the properties of 60, 128, 130, 132, 134-136, 144, 158, 168, 170, 172-184, and 186-202 Botany Road (non-exhaustive list of Sydney LEP 2012 lots intersecting with Botany Road SP2 zoning)
- ↑ LoS for people walking and riding was not discussed in Block 1-4 reports for Sydney Metro C&SW Traffic and Interchange Monitoring. It only included SIDRA simulation outputs, typically LoS E at TCS47 for example (see “Sydney Metro Conditions of Approval in relation to these signals” section)
- ↑ Seeking causality is important[74] and it appears this relationship has been intentionally misstated in the recent past by our state transport agency – in the service of increasing inner-city road capacity amid claims of George Street-inflicted chaos: “The reduction in demand within the city centre would be negated by the reduction in capacity”[75]: 72
References
- ↑ “Have your say on walking and cycling improvements between South Eveleigh and Waterloo Metro”. City of Sydney. Archived from the original on 2026-03-02. Retrieved 2026-03-03.
- ↑ “Concept design – South Eveleigh to Waterloo Metro walking and cycling improvements” (PDF). City of Sydney Council. Archived (PDF) from the original on 2026-03-02.
- ↑ “Better Streets Australia”. Better Streets.
- ↑ “Better Streets Board for 2025–26”. Better Streets. 2025-11-25.
- ↑ “Coalition partners”. Better Streets.
- ↑ “Coalition Members”. Better Streets.
- ↑ “Membership”. Better Streets.
- ↑ “Better Streets Safe Speeds position paper”. Better Streets.
- ↑ “POSITION PAPER – Safe Speeds” (PDF). Better Streets. February 2026.
- ↑ A new on-road cycle route would be provided along Raglan Street and Henderson Street, between George Street to the east and the shared path through the Vice Chancellors Oval to the west. This would provide direct access past the station entrance, connecting existing cycle route facilities to the east and west of the station.
Jacobs (May 2016). “CHATSWOOD TO SYDENHAM ENVIRONMENTAL IMPACT STATEMENT – TECHNICAL PAPER 1: TRAFFIC AND TRANSPORT” (PDF). Sydney Metro. p. 210. Archived (PDF) from the original on 2025-07-25. - ↑ 11.0 11.1 11.2 11.3 11.4 Cattell Cooper (April 2021). “Botany Road Corridor – Transport and Traffic” (PDF). City of Sydney. Archived (PDF) from the original on 2025-10-29.
- ↑ “Get NSW Active 2023-24 Project List – Tranches 1 & 2” (PDF). Transport for NSW. p. 2. Archived (PDF) from the original on 2025-12-09. Henderson Rd and Raglan St cycleway – Separated Bike Path Design – $580,000 (Funding Amount) – A separated cycleway link between Henderson Rd cycleway and George St cycleway at Waterloo Metro station.
- ↑ “Investigate extending the cycling connection on Henderson Road to the George Street cycleway” – Timing (start to finish) 2021-2030
“Interchange Access Plan” (PDF). Sydney Metro. July 2021. p. 50. Archived (PDF) from the original on 2024-06-30. Retrieved 2026-03-03. - ↑ 14.0 14.1 14.2
We will rebalance road investment, from providing additional capacity for general traffic (such as through road widening), to reallocating of existing road space for public transport and active transport alternatives. More space for buses can lead to fewer vehicles moving more people.
The reallocation of road space will be required for high quality, frequent, turn-up-and-go bus services which can support the delivery of more diverse, ‘missing middle’ housing in areas closer to existing infrastructure, services and jobs.
Transport for NSW (October 2025). “Connecting NSW Strategy – Priorities for Transport” (PDF). New South Wales Government. p. 27. Archived (PDF) from the original on 2025-11-01. Retrieved 2026-03-03. - ↑ 15.0 15.1 “Sydney Metro City & Southwest Chatswood to Sydenham Conditions of Approval” (PDF). NSW Government. p. 32. Archived (PDF) from the original on 2025-09-24.
- ↑ 16.0 16.1 “Installation of Traffic Control Signals (ILC-ITS-TP0-003)” (PDF). Transport for NSW. March 2015. Archived (PDF) from the original on 2025-09-12.
- ↑ Jake Coppinger (2025-09-24). “Green Lights More Often: The Secret 2018 Study of Sydney’s Traffic Signals”. jakecoppinger.com.
- ↑ 18.0 18.1 18.2 18.3 18.4 Philip Thalis (2018-09-17). “Pedestrian Signals (Item 12.4, S129265)”. City of Sydney. Archived from the original on 2019-06-18.
- ↑ Transport for NSW. ““Improved pedestrian accessibility in the CBD”, Briefing: Minister for Transport and Infrastructure, Minister for Roads, Maritime and Freight, FOR INFORMATION” (PDF). files.jakecoppinger.com. p. 7.
- ↑ 20.0 20.1 Transport for NSW. “25T-1151 – ITEM 3 – Info for Release – Presentation” (PDF). files.jakecoppinger.com.
- ↑ Transport for NSW. “Doc B – Bus Travel times” (PDF). files.jakecoppinger.com. p. 273.
- ↑ Roy Brown (SCATS Director Technology and Product, Transport for NSW) (2025-10-15). “2025-10-15: SCATS traffic signal extracts from panel discussion at Highways AU”. Jake Coppinger.
- ↑ Rajnath Bissessar; Masoud Ramezani. “Signal Phase and Timing (SPaT) Data Policy Considerations” (PDF). ITS Canada. Archived (PDF) from the original on 2025-08-12.
- ↑ “Real-Time Traffic Signal System Performance Measurement Phase II: Data And Functionality Enhancement, Large Scale Deployment, Connected And Autonomous Vehicles Integration” (PDF). NJDOT Technology Transfer. NJDOT Research Showcase: NJDOT Bureau of Research, Innovation & Information Transfer. p. 23. Archived (PDF) from the original on 2025-10-16.
- ↑ 25.0 25.1 “Everything You’ve Ever Wanted To Know About ATSPMs: Harnessing The Power Of Automated Signal Performance Metrics For Your Agency” (PDF). The Eastern Transportation Coalition. 2022-11-09. Archived (PDF) from the original on 2025-09-24.
- ↑ Peter J. Jin, Ph.D.; Tianya Zhang; Thomas M. Brennan JR., Ph.D., P.E.; Mohammad Jalayer, Ph.D. (May 2022). REAL-TIME TRAFFIC SIGNAL SYSTEM PERFORMANCE MEASUREMENT PHASE II: DATA AND FUNCTIONALITY ENHANCEMENT, LARGE SCALE DEPLOYMENT, CONNECTED AND AUTONOMOUS VEHICLES INTEGRATION FINAL REPORT VOLUME II (PDF) (Report). New Jersey Department of Transportation (NJDOT) and Federal Highway Administration (FHWA). pp. 58, 59, 60, 61. Archived (PDF) from the original on 2025-03-22.
- ↑ Jake Coppinger; Tegan Mitchell (President of WalkSydney); Sara Stace (President of Better Streets) (2025-08-04). “Request for Public Access of SCATS Signal Phasing Data across one weekday for all NSW signals” (PDF). walksydney.org. Letter to Josh Murray, Howard Collins. p. 3.
- ↑ “Everything You’ve Ever Wanted to Know About ATSPMs: Harnessing the Power of Automated Signal Performance Metrics for Your Agency – November 9, 2022 (Question and Answer Summary)” (PDF). The Eastern Transportation Coalition. 2022-11-09. Archived (PDF) from the original on 2025-09-24.
- ↑ 29.0 29.1 “Green Square signals fail active transport”. Bicycle NSW. 2024-07-05.
- ↑
…Following decades of road rules and policies that put cars at the centre of urban life, cities across the globe have spent much of the past 20 years attempting to give pedestrians a greater influence on the street….
…The push for improved walking spaces came to a head in 2023 when Sydney software engineer Jake Coppinger began crowdsourcing a survey of the worst pedestrian wait times at local intersections…
Anthony Segaert (2025-01-31). “The change to our traffic lights that could make you happier”. The Sydney Morning Herald. Archived from the original on 2025-12-26. - ↑ “I hope having public data will give advocates an opportunity to help make Sydney a better place to walk and cycle,” Mr Coppinger said.
…”I think signal timing data should be as public as a public train network timetable,” Mr Coppinger said…
Declan Bowring (2023-09-25). “Better Intersections website gathers data on long pedestrian wait times in Sydney”. ABC News. Archived from the original on 2025-11-24. - ↑ Principle A2: … We will advocate for improving pedestrian priority at
signals including: a maximum wait time of 45 seconds and a target of 30 second at all signals…
‘A City for Walking’ Strategy and Action Plan – Continuing the Vision (PDF) (Report). City of Sydney. 2024-07-05. p. 21. Archived (PDF) from the original on 2024-07-09. Retrieved 2026-03-03. - ↑ TransportCamp. Sydney. 2025.
- ↑ 35.0 35.1
…Congestion is best managed in our cities using other policies, such as road-user charging, and the effective provision of public transport, which also becomes cheaper at higher densities.
Brendan Coates; Joey Moloney; Matthew Bowes (November 2025). “More Homes, Better Cities: Letting more people live where they want” (PDF). Grattan Institute. p. 34. Archived (PDF) from the original on 2026-03-01. - ↑
Initiatives like transit lanes, bus priority lanes, and bus rapid transit can make buses faster and more reliable, and so entice onto public transport many people who would otherwise drive. Such measures can restrict road space and risk worsening traffic for remaining cars, but they usually allow a higher total number of people to travel.
“Building more homes where infrastructure costs less” (PDF). NSW Productivity Commission. August 2023. p. 28. Retrieved 2026-03-03. |archive-url=https://web.archive.org/web/20260214114101/https://www.productivity.nsw.gov.au/sites/default/files/2023-08/202308_NSW-Productivity-Commission_Building-more-homes-where-infrastructure-costs-less_accessible-v2.pdf - ↑ Jake Coppinger (2026-02-04). “Have you heard of the Southern Arterial Route?”. jakecoppinger.com.
- ↑
“Extension of the Botany Road / Wyndham Street one-way pair to Mascot (via O’Riordan Street / Botany Road)” is part of the “Transport Network Assumptions”
SGS Economics and Planning (August 2020). “Future Transport 2056: South East Sydney Transport Strategy” (PDF). Transport for NSW. p. 29. Archived (PDF) from the original on 2025-11-08. Retrieved 2026-03-03. - ↑ 39.0 39.1 39.2 39.3 39.4 39.5 Hall Greenland (1993-06-30). “Citizen’s Response to the proposed Stage 3 of the Southern Arterial (Citizen’s Advocate Report)” (PDF).; “3.2.3 Commercial transport (freight) Botany west transport study summary report on community”. City of Sydney Archives.
- ↑ 40.0 40.1 Stephen Harris (1986-08-17). Stop Them Resurrecting Askin’s Freeways – Background Issues and Concerns (Report). Inner Sydney Regional Transport Group. p. ii.; Stephen Harris (1986-08-17). Notes from Address. Inner Sydney Regional Transport Group Public Meeting.
- ↑ Frank Sartor (2006-12-22). “South Sydney Local Environmental Plan 1998 (Amendment No 17) – Green Square Town Centre” (PDF). City of Sydney. p. 14. Archived (PDF) from the original on 2024-06-26.
- ↑ City of Sydney; McGregor Coxall (2013-03-25). “Town Centre Public Domain Strategy” (PDF). p. 57. Archived (PDF) from the original on 2024-04-05.
- ↑ 43.0 43.1 “DEVELOPMENT APPLICATION: 1 O’RIORDAN STREET ALEXANDRIA” (PDF). City of Sydney. 2009-11-17. pp. 1, 7, 10, 11, 13, 20, 28, 29. Archived from the original (PDF) on 2019-04-04.
- ↑
Additionally the Planning Proposal will zone the site at 2A Bourke Road, Zone SP2 Road, as this lot is required for the realignment of O’Riordan Street, regional traffic management and will facilitate redevelopment of the Green Square Railway Station site at 312-318 Botany Road. The lot is identified in the Land Acquisitions Map.
“Planning Proposal: Green Square Town Centre LEP 2010” (PDF). City of Sydney Council. March 2012. pp. 23, 81. Archived (PDF) from the original on 2026-01-14. - ↑
“The southern arterial route from Darling Harbour to the south-west, opposed by the elected City Council, is a “Claytons” freeway, cutting a swathe through Pyrmont, Ultimo and Redfern and Waterloo, and causing major environmental problems and destroying historic buildings.”
Clover Moore (1988-03-03). “What the candidates said – Election Highlight: Transport”. The Sydney Morning Herald. p. 11. Archived from the original on 2025-12-12. - ↑ 46.0 46.1 46.2 MacDonald Wagner (February 1987). Pyrmont-Alexandria Traffic Management Proposal – Environmental Impact Statement. Macdonald Wagner for Department of Main Roads. ISBN 0730545490.
- ↑ Jake Coppinger (2024-08-22). “Why Did the Chicken Catch the Metro? Because It Was Faster Than Crossing the Road…”. jakecoppinger.com.
- ↑ Because of the twin pair arterial roads and the station location, to get to ATP pedestrians will need to cross three streets (Raglan or Henderson, Botany Road and Wyndham Street). On a 120-second cycle, it will take up to 6 minutes waiting to “cross the road”. This is not a pedestrian friendly precinct for many who will live or arrive at the Metro Quarter.
Geoffrey Turnbull (REDWatch). “RE: Submission on Waterloo Metro Quarter State Significant Precinct Planning Controls and State Significant Development Applications SSD 18_9393”. Letter to The Department of Planning. p. 6. Archived from the original on 2026-03-03. - ↑ 49.0 49.1 49.2
The intersection of Regent St and Henderson Rd with the dog leg turn into Gibbons St is considered to be a nightmare intersection both for pedestrians crossing, and traffic conflicting. (pg. 2)
Altogether fifteen people made comments concerned with the Henderson Rd intersection. Eight people in favour of the road in agreement with the road mentioned it as a problem to be solved and another five people opposed to Stage 3 commented on the dangers or the delays at this crossroads. Several more commented on the issue of east west traffic conflict with the Southern Arterial. (pg. 8)
Stage two has created problems (heading): Two commented that traffic has increased in Raglan St – “too much traffic, noise, pollution and speeding, especially trucks from Henderson Rd and Botany Rd – someone is going to get killed soon” (pg. 10)
The Public Practice (1993). Southern Arterial Stage 3 EIS Summary of Public Comments (PDF).; “3.2.3 Commercial transport (freight) Botany west transport study summary report on community”. City of Sydney Archives. - ↑ Catherine Lumby (1988-09-15). “Road Plan Will Divide Redfern”. The Eastern Herald (The Sydney Morning Herald). p. 3. Archived from the original on 2025-10-26.; “Road Plan Will Divide Redfern” (OCR Text). Archived from the original on 2025-10-26.
- ↑ 51.0 51.1 51.2 “NSW AusRAP map (Road Name ‘0000170-BOTANY RD’ Section 2)”. Transport for NSW. 2016-11-03. Retrieved 2026-03-03.
- ↑
Waterloo was also one of the poorest suburbs in Sydney and had a large number of elderly residents, many of them public housing tenants, whose lives would be endangered by increased pollution and traffic, he [Jack Carnegie] said.
Steven Long (1992-05-28). “Road ‘will cut Redfern in two’“. The Eastern Herald (The Sydney Morning Herald). Archived from the original on 2025-10-26.; “Road ‘will cut Redfern in two’“ (OCR Text). Archived from the original on 2025-10-26. - ↑ 53.0 53.1 53.2 “Transport, Heritage, Environment and Planning Committee – Post Exhibition – Planning Proposal – Botany Road Precinct – Sydney Local Environmental Plan 2012 and Sydney Development Control Plan 2012 Amendment” (PDF). City of Sydney Council. June 20, 2022. p. 140 (PDF pg. 7).
- ↑ Riskcorp (November 1993). Review of Dangerous Goods Transportation Through Tunnels for the Proposed M5 East Motorway (Report).
- ↑ Ernst, Steve L.; Bergeson, William; Harelson, Steve; Williams, Dan; Bilson, Matt (2018-09-01). “Tunnel Fire Protection Using Fixed Firefighting Systems: Advanced Practices from Australia and New Zealand”. United States Federal Highway Administration.
- ↑ Bruce Dandie (2019-06-13). Dangerous Goods in Tunnels: Literature Review (Report). Austroads. p. 19. ISBN 978-1-925671-87-2.
- ↑ 57.0 57.1 “The proposal to create a one-way pair system will divide South Sydney: … the proposed Department of Housing development on Alexandria Goods Yards will be isolated from all services and the rest of the community.” (pg. 20,21)
Deborah Carbon (May 1986). Submission to the ‘Roads 2000’ Task Force Inquiry (Report). PO Box A.555 Sydney South 2000: Inner Sydney Regional Transport Group. - ↑ Redfern Waterloo Authority (February 2006). “Draft Redfern-Waterloo Built Environment Plan (Stage One)”. REDWatch. Archived from the original on 2025-04-05.
- ↑ “Redfern Waterloo Authority Draft Employment and Enterprise Plan Submission by the City of Sydney” (PDF). City of Sydney. 2006-03-20. p. 6.
- ↑ Trevor Davies (December 2006). “The divisions over Regent Street changes: Council and RWA support it, RTA is against it”. South Sydney Herald. Archived from the original on 2025-04-28.
- ↑ 61.0 61.1
The arterial network is under the care and control of the RTA which has future
plans to complete the Southern Arterial route. This should improve north-south
traffic capacity in the Redfern West Precinct.
The RTA also has future plans to widen McEvoy-Lachlan Street which should improve the east-west traffic capacity for the Redfern East Precinct and the developing Green Square area. However the timing of these road upgrade projects is uncertain.
(RECOMMENDATION F): the Chief Executive Officer write to the RTA seeking to return Regent, Gibbons and Chalmers Streets to two-way traffic flow and ask the RTA to consider the various state road issues raised by residents.
“REDFERN EAST AND REDFERN WEST LOCAL AREA TRAFFIC MANAGEMENT SCHEME REVIEWS (PLANNING POLICY SUB-COMMITTEE)” (PDF). City of Sydney. 2007-04-30. p. 4. Archived (PDF) from the original on 2025-10-30. - ↑ Elizabeth Rush, Senior Transport Planner; Andrew Thomas, Acting Director City Strategy and Design (2010-06-16). “Information Relevant To Item 9.2 – Newtown Erskineville Camperdown and Darlington Pedestrian Cycling Traffic Calming Plan at the Planning Development and Transport Committee” (PDF). Letter to Lord Mayor and Councillors. City of Sydney. p. 2. Archived (PDF) from the original on 2019-04-05. Retrieved 2026-03-03.
- ↑ Tonkin Zulaikha Greer Architects (March 23, 2021). “Botany Road Corridor Urban Design Study”. Zulaikha Greer Architects (for City of Sydney). Archived from the original on 2022-03-27. Retrieved 2026-03-03.
- ↑ “Route opposed (News in brief)”. The Eastern Herald (The Sydney Morning Herald). 1987-03-12. p. 3. Archived from the original on 2025-10-26.; “Route opposed (News in brief)” (OCR Text). Archived from the original on 2025-10-26.
- ↑ AECOM; Committee for Sydney (November 2024). Walkable and bikeable streets are good for business (PDF) (Report). Committee for Sydney. Archived (PDF) from the original on 2025-12-17.
- ↑ 66.0 66.1 66.2 …This policy sets out the mandatory principles and requirements Transport staff must follow when allocating physical and temporal road user space safely and equitably to support the movement of people and goods and place objectives…
…Transport must: … allocate road user space based on the network vision and road functions, considering all road users in order of: 1. walking, 2. cycling … 6. general traffic…
…Transport must: … adhere to these principles ahead of any guidance that seeks to ‘protect or maintain private vehicle level of service…
Transport for NSW (July 2024). “Road User Space Allocation Policy” (PDF). Archived (PDF) from the original on 2024-07-25. - ↑ “Block 1 Report – Sydney Metro C&SW – Traffic and Interchange Monitoring” (PDF). AECOM. August 11, 2023. p. 28. Archived (PDF) from the original on 2025-09-24.
- ↑ 68.0 68.1 68.2 68.3 Aston Brown; Declan Bowring (2026-02-09). “Cyclists slam ‘nightmare’ shared path at new Sydney Fish Market”. ABC News.
- ↑ Jake Coppinger (2024-09-09). “Another broken WestConnex promise: secret Sydney Park Junction design changes”. jakecoppinger.com.
- ↑ Jake Coppinger (2024-11-26). “Sydney Park Junction: TfNSW Won’t Commit to Original Scope Despite Ministerial Intervention”. jakecoppinger.com.
- ↑ “Not enough funding for Sydney Park Junction – Addendum REF to cut scope”. jakecoppinger.com. 2025-05-27.
- ↑ Jacob Saulwick (2019-04-15). “‘Clearly in breach’: WestConnex public transport conditions not met”. The Sydney Morning Herald. Archived from the original on 2025-03-07.
- ↑ 73.0 73.1 Transport for NSW (December 2023). “Road User Space Allocation Policy Implementation Review Report” (PDF). Archived (PDF) from the original on 2025-09-11.
- ↑ David M. Levinson (2026-02-19). “Seeking causality in transport research”. Transportation Research Today. doi:10.1016/j.trt.2026.100001.
- ↑ Mark Russell; Henrik Malker (11 November 2014). “Sydney City Centre Capacity Improvement Plan Review of Environmental Factors Volume 2 – Appendices” (PDF). Transport for NSW. ISBN 978-1-925217-60-5. Archived from the original (PDF) on 2015-03-20.
- ↑ Josef Whitfield (2025). Pedestrian Wait-Time Reduction: A Vast Improvement to the Pedestrian Experience on a Shoestring Budget. Transport Planning and Modelling (TPM) Conference. Transport for Greater Manchester (TfGM). Archived from the original on 2025-09-25.
- ↑ Terrill, M.; Moran, G.; Ha, J. (October 2019). Why it’s time for congestion charging: Better ways to manage busy urban roads (PDF) (Report). Grattan Institute. ISBN 978-0-9876359-6-9. Archived (PDF) from the original on 2025-03-21.
- ↑ Marion Terrill; James Ha (2019-10-14). “Why congestion charging is fairer than you might think”. The Grattan Institute. doi:10.64628/AA.wrjuh7nxm. Archived from the original on 2025-04-30.
- ↑ Transurban (2026-02-19). “1H26 Results” (PDF). p. 11. Archived (PDF) from the original on 2026-02-20.
- ↑ “The problem with Local Traffic Committees”. Bicycle NSW. 2023-09-14. Archived from the original on 2026-03-03.
- ↑ “Big changes for local transport planning”. Bicycle NSW. 2025-08-23. Archived from the original on 2026-03-03. Retrieved 2026-03-03.
- ↑ “The Authorisation & Delegation Instrument – (ii) What has changed?” (PDF). Transport for NSW. August 2025. Archived (PDF) from the original on 2026-03-03.
- ↑ Navreet Virdi (October 2025). “Transport Modelling Guidelines”. Transport for NSW. p. 187. Archived from the original on 2025-11-21.
- ↑ NSW Government Department of Planning Industry & Environment (April 2020). “Planning Proposal Report – Waterloo Estate (South) – Land and Housing Corporation (Attachment B2)” (PDF). Archived (PDF) from the original on 2026-03-03.
- ↑ Geoffrey Turnbull (June 2022). “REDWatch Submission on Planning Proposal Waterloo Estate (South) PP-2021-3265 (SUB-1701)” (PDF). p. 16 (PDF pg. 375). Archived (PDF) from the original on 2025-04-15.
- ↑
Text of sign advertising 2026-03-05 community meeting:
If motor vehicles cannot use Raglan St as proposed above, traffic will be diverted to Wellington St, requiring a re-evaluation of whether Pitt St should be opened to McEvoy St. Council and the Consortium have been invited to discuss this and other bike, bus, pedestrian and traffic issues with the community.
REDWatch (n.d.). Planning Roads, Cycleways and People Movement in Waterloo (title of A4 sign). Cope & Raglan Street. - ↑ 87.0 87.1 87.2 “Community feedback shapes future of Waterloo South”. Department of Planning and Environment. 2022-08-05. Archived from the original on 2026-03-03.
- ↑ Geoff Turnbull (2022-08-02). “Waterloo Estate will be developed”. The South Sydney Herald. Archived from the original on 2024-10-30.
- ↑ NSW Department of Planning, Industry and Environment (January 2022). “Waterloo South planning proposal – Summary of community information sessions”. redwatch.org. Archived from the original on 2026-02-08.
- ↑ “Streets and traffic flow – Waterloo south”. 2023-05-04. Archived from the original on 2026-03-03. Retrieved 2026-03-03.
- ↑ In direct response to public submissions where concerns were raised around the proposed opening of the Pitt Street extension to McEvoy Street, Bitzios Consulting was re-engaged to prepare an addendum updated transport assessment. This assessment investigated the impacts that would likely result on the traffic network within the precinct if the proposed Pitt Street extension did not allow vehicular movements on to or from McEvoy Street.
The work found that alternative access and egress routes are available and not opening Pitt Street would be appropriate. This change was supported by Transport for NSW.
“Waterloo South Post Exhibition Report & Proposal Amendments Guide”. n.d. Archived from the original on 2026-01-18. Retrieved 2026-03-03. - ↑ 92.0 92.1
Transport for NSW is delivering intersection upgrades at McEvoy Street and Botany Road in Waterloo to support 10,000 dwellings, with planning and design underway and completion expected in 2026. The project is funded through the Accelerated Infrastructure Fund Round 3 – Tranche 2, with a total cost of $18 million.
Infrastructure Opportunities Plan – Greater Sydney (PDF) (Report). NSW Department of Planning, Housing and Infrastructure. 2026-02-26. Archived (PDF) from the original on 2026-02-26. - ↑ David M Levinson (2018-11-12). “The Alexandria – Moore Park Disconnector”. WalkSydney.
- ↑ 94.0 94.1 Transport for NSW (2023-01-31). “Alexandria to Moore Park Project”. Archived from the original on 2025-10-14. Retrieved 2026-03-03.
- ↑ Nigel Gladstone (2017-11-08). “Alexandria Roads a ‘cancerous mess’“. The Daily Telegraph. Archived from the original on 2026-03-03.
- ↑ “Project finder (filter by Alexandria to Moore Park Project)”. Transport for NSW. Archived from the original on 2026-03-02. Retrieved 2026-03-03.
- ↑ Ava Tan, Connor Hoang (2025-09-24). “224-234 Young Street, Waterloo Transport Impact Assessment”. ason group.
- ↑ Member for Heffron, Ron Hoenig (2023): “These improvements at McEvoy Street and Botany Road will help to ease traffic gridlock that is already taking a toll on Waterloo and Alexandria as a result of WestConnex.” “We need to future-proof this intersection in order to get more housing supply where it makes sense.”
Chris Minns; Paul Scully (2023-07-23). “NSW Government investing $40.9 million to fast-track critical infrastructure in high growth communities” (Press release). NSW Government. Archived from the original on 2026-01-17. - ↑ “Reopen the Glebe Island Bridge”. Kobi Shetty. Archived from the original on 2026-01-22.
- ↑ 100.0 100.1
“Glebe Island Bridge… there is concern about the impact of the new bridge.”
“Alderman Margaret Barry said there was no question that the Department of Main Roads had picked up again the freeway plans of the Askin Government which were abandoned by the Wran Government in 1976.”
“They’re not being called freeways and they are not being built in one strip,” Alderman Barry said. “We are getting different names. We have the Eastern Distributor, the Glebe Island Arterial, the Western Distributor, the Harbour tunnel and the paired routes of the Southern Road from Pyrmont to the Princes Highway at St Peters. It’s going up in little bits almost entirely on the routes proposed by the Askin Government or a few streets removed. It is freeways by stealth.”
Alderman Ross Bonthorne (Lib) said Sydney’s road plans were a jigsaw. “It’s a new highway game, better than Trivial Pursuit,” he said. “All the pieces are sitting in someone’s desk. It is time they came out.”
Michael Grealy (1986-05-22). “‘Freeways by stealth’ charge”. Sydney Morning Herald. p. 4. Archived from the original on 2025-10-26.; “‘Freeways by stealth’ charge” (OCR Text). The Sydney Morning Herald. 1986-05-22. Archived from the original on 2025-10-26. - ↑ Audit Office of New South Wales (2021-06-17). “NSW Auditor-General’s Report to Parliament – WestConnex: changes since 2014 – Appendix two – Network integration works” (PDF). p. 6. Archived (PDF) from the original on 2024-08-06. Audit Office of New South Wales (2021-06-17). “WestConnex: changes since 2014”. p. 39. (PDF page 6) Alexandria to Moore Park – Stage 1 – To address increased traffic flows from St Peters Interchange to the east (and vice versa) for M8 generated traffic until M4/M5 link opens. – E40 b) iii)
- ↑ Matt O’Sullivan (2025-10-27). “Public servants reveal reluctance to speak up at scandal-hit transport agency”. The Sydney Morning Herald. Archived from the original on 2025-11-13.
- ↑ Cumberland County Council (1951). “County of Cumberland planning scheme … a representation of the … ordinance 27 June 1951 [cartographic material] / compiled by Cumberland County Council”. State Library of New South Wales.
- ↑
Few practitioners in Sydney would be aware that the early investigations underpinning the 1951 Plan were in fact undertaken more than a decade earlier by the then Department of Main Roads.
Philip Brogan (Maunsell Australia); Brian Watters (RTA) (2002). “Developer Contributions and the Containment of Urban Expansion in Sydney” (PDF). p. 6. Archived (PDF) from the original on 2023-03-10. - ↑
Prior to this bodies such as the Department of Main Roads had already given consideration to issues affecting the development of the regional area. For example, that Department’s 1945 report – ‘The County of Cumberland Main Road Development Plan’ – was apparently incorporated with little alteration into the Cumberland County Council’s plan in 1948.
Hon. Justice Michael Barker President, WA State Administrative Tribunal (2007-05-04). How Planning and Environmental Law Has Shaped Our Cities (PDF). 2007 Planning Institute of Australia National Congress. p. 8. Archived (PDF) from the original on 2025-04-06. - ↑
The results of these investigations were detailed in the Department’s comprehensive report, issued in 1945 and entitled “The County of Cumberland Main Road Development Plan”…
…The Metropolitan Plan of the Cumberland County Council was not greatly different in general extent and with reference to general land use, from the outline plans prepared by the Department. Consequently, the Department’s road planning required little alteration before being incorporated in the Council’s plan.
Department of Main Roads NSW (1976). “The Roadmakers – A History of Main Roads in New South Wales” (PDF). p. 204 (PDF pg. 223). ISBN 0 7240 0439 4. Archived from the original (PDF) on 2024-04-26. - ↑ “City of Sydney Planning Scheme, 1958”. City of Sydney Archives. 1958-12-15.
- ↑ “Waterloo Park. Proposed Acquisition of portion by Dept of Main Roads for widening of McEvoy Evoy [sic] St, 14th August 1961 and 25th June 1969”. City of Sydney Archives. 1961–1969.
- ↑ “Government plan: Plan of realignment in accordance with the provisions of the Main Roads Act 1924”. City of Sydney Archives. 1967–1968.
- ↑ “Government plan: Proposed widening of part of McEvoy St – Sheet 1 of 2 – Waterloo [Land bound by Elizabeth St, Kensington Ln, McEvoy St, Kensington St, McEvoy St, Morshead St & Hunter St] [M-CRS99]”. City of Sydney Archives. 1967–1968.
- ↑ “Government plan: Plan of realignment in accordance with the provisions of the Main Roads Act 1924 as amended in connection with the proposed widening of McEvoy St – Waterloo [Land bound by McEvoy St, Moorehead St & Young St] [M-CRS99]”. City of Sydney Archives. 1967–1968.
- ↑ “Government plan: Plan of realignment in accordance with the provisions of the Main Roads Act 1924”. City of Sydney Archives. 1970–1971.
- ↑ “Government plan: Proposed widening of part of McEvoy St – Alexandria [Land bound by Bowden St, Fountain St, McEvoy St & Stokes Ave] [M-CRS99]”. City of Sydney. 1972–1974.
- ↑ “Notification of Approval of Governor to Plan of a Proposal for Realignment under Division I of Part Vb of the Main Roads Act, 1924, at Waterloo in the Municipality of South Sydney”. Government Gazette of the State of New South Wales. National Library of Australia. 1980-10-31. p. 5675.
- ↑ Pak-Poy & Kneebone (1981). South Sydney Municipal traffic study: final report. City of Sydney Archives.
- ↑ “SOUTH SYDNEY LOCAL ENVIRONMENTAL PLAN 1998 (AS AMENDED)” (PDF). City of Sydney. February 1998. Archived (PDF) from the original on 2026-03-03.
- ↑ “Alexandria to Moore Park Connectivity Upgrade, community update June 2017” (PDF). Roads and Maritime Services. June 2017. Archived from the original (PDF) on 2017-06-24.
The post Better Streets Submission for Walking and Cycling Improvements between South Eveleigh and Waterloo Metro (Henderson Road) first appeared on Jake Coppinger.
]]>The post Introducing the Cooks River Catchment Map for the Cooks River Alliance first appeared on Jake Coppinger.
]]>I’m pleased to share the completion of a recent commercial engagement by UrbanSpectra in collaboration with the Cooks River Alliance: the Cooks River Catchment Map.
The Cooks River Catchment Map is a user-friendly interactive map, designed to maximise the visibility, accessibility and accountability of improvements in the Cooks River catchment.
This easy-to-use catchment map effectively creates a 24/7 planning and reporting mechanism, increasing visibility for the public and providing information, accountability and tracking for decision makers.
The Cooks River Alliance is a partnership between organisations in the Cooks River Catchment, including Bayside Council, Canterbury-Bankstown Council, Inner West Council, Strathfield Council and Sydney Water.
The map is published at ourbackyardriver.com.au, and includes a table displaying the status of projects taking place in the catchment.
UrbanSpectra is a studio building data-driven mapping and urban analysis software for cities with a vision, founded by Jake Coppinger. UrbanSpectra brings a digital-native approach to understanding and improving cities, with great respect for direct observation and community engagement.

Table of contents
The Map
Drawing on examples like the Los Angeles River Revitalization program, the Cooks River Catchment Map is designed to be a tool for the public and decision makers to understand and advocate for a healthier river.
The map was built by UrbanSpectra, however editorial control of what is displayed on the map (and ongoing updates) remains under the care of the Cooks River Alliance.
The Cooks River Alliance aims to address the complex environmental problems of the Cooks River Catchment. The river runs through some of the most heavily urbanised and industrialised areas in Australia, but much of the catchment takes in popular walking trails and cycle paths, parks and facilities and significant native flora and fauna.
The map enables users to quickly see all proposed, under construction or completed projects across the entire catchment at one click. The features on the map remain an ever-improving work in progress, with continued updates and additions by the Cooks River Alliance as new projects are completed or data becomes available.
If you have feedback on the map, the Cooks River Alliance would love to hear from you – please contact them at info@cooksriver.org.au.
Community Efforts
The condition of the river has improved considerably in recent years, in large part due to persistent efforts by local community groups and stakeholders.
The map pinpoints bushcare sites under the care of the well-known Mudcrabs, a local community group caring for the Cooks River, regularly restoring bushland and removing rubbish. The map highlights bushcare sites by the Wolli Creek Preservation Society, a wholly volunteer organisation caring for the bush since the 90s (which also saved the Wolli Creek Valley from the proposed surface M5 expressway along the Wolli Valley past Turrella). The map points to the Cooks River Paddle Trail, which assists canoe and kayak enthusiasts to explore the river – and whose volunteers have removed at least 1.2 tonnes of litter.
Showcasing the information and efforts of work by local community groups is a critical function of the map, which links to these organisations and helps users learn about nearby efforts they could join.
The map also visualises the extent of the sheet steel piling along the river, which has been a significant focus of the community and was extensively discussed at the recent forum hosted by the Cooks River Catchment Community Collective in November 2025.
Council Projects
There are lots of great projects happening in the Cooks River catchment, by a number of distinct councils and organisations. Varied projects include park upgrades, new boat ramps, new footpaths, cycleways and lighting improvements. All the data on the map is also displayed in a tabular format on the about page for easy stakeholder reference.
Engineering
UrbanSpectra undertook product and software development for the map, working closely with the Cooks River Alliance through regular check-ins and a structured evaluation of potential solutions and platforms before build. CRA staff tested the map and admin tools in blitz-review sessions, and the team kept a shared feedback register to prioritise fixes before launch.
A significant challenge in the initial brief was empowering non-technical Cooks River Alliance staff to create and continuously update map layers, including the ability to import data from external sources (such as council documents) which are typically published as non-georeferenced raster images.
UrbanSpectra developed an innovative solution to enable CRA staff to georeference maps in documents using a browser-based tool without any software installation required, integrating with the existing CRA data storage to load data into the map – all without the need for any technical geospatial or GIS expertise.
A map is only useful if it is accurate and up to date. Along with existing data held by the Alliance, the Cooks River Catchment Map enables CRA staff to ingest features directly from OpenStreetMap, as well as georeferencing documents as they become available and from their own and other sources. This enables up-to-date layers from community and government map contributors, such as proposed and under-construction cycling infrastructure. The flexibility of running queries on OpenStreetMap data supports unlimited flexibility for future features and layers.
The project was originally only required to investigate and evaluate options for a draft map solution and a beta version, however thanks to initial prototyping and the flexibility of the solution it has evolved into a functional production-ready map.
UrbanSpectra approached the project in an iterative manner, with early prototypes and spikes to align stakeholders amid a wide-open project brief to identify necessary functionality. UrbanSpectra assisted with branding and defining the scope of the project.
Initial prototypes leveraged familiar interfaces for the team like spreadsheets and Airtable before developing a more flexible custom backend – which takes non-technical users step-by-step through the process of georeferencing maps and adding data to the map. UrbanSpectra also delivered detailed technical and user training documentation.
From a technical perspective, Jake Coppinger led all aspects of the solution design and delivery, including:
- Product co-design and scoping with the Cooks River Alliance team
- Project management and delivery oversight, using an incremental approach with a rapidly improving deliverable and tight feedback loop.
- Full-stack software development, from the frontend design, serverless backend with authentication, hosting and ingestion of data from external sources.
- Graphic design
- Technical and user training documentation
The result is a reliable, easy-to-use (and easy-to-maintain) custom map built on industry-standard technologies, with comprehensive documentation and extensive flexibility for future feature development.
What’s Next?
If you have an interesting challenge in the urban analytics, planning or community consultation space and would like to collaborate – let’s chat: jake@urbanspectra.com
While currently developing software, UrbanSpectra is available for new projects.
UrbanSpectra founder Jake Coppinger writes about policy advocacy and open-source projects on his personal blog at jakecoppinger.com.
This blog post has been reviewed with the client before publication.


The post Introducing the Cooks River Catchment Map for the Cooks River Alliance first appeared on Jake Coppinger.
]]>The post Have you heard of the Southern Arterial Route? first appeared on Jake Coppinger.
]]>Have you heard of the Southern Arterial Route in Sydney? I hadn’t either – but you won’t be able to unsee the scar through Ultimo, Chippendale, Redfern and Waterloo. Here’s a ~12,000-word Wikipedia article with 153 references – with page numbers, for every sentence – to bring you and your search engine up to speed: https://en.wikipedia.org/wiki/Southern_Arterial_Route?useskin=vector
Only a few years after the Erskineville Uprising of 1985 there were substantial protests against this urban arterial road. Clover Moore opposed it in her 1988 campaign for the Bligh electorate and described it as a “Claytons freeway” – 38 years ago. 150 people attended a meeting to fight against it, and there were direct action protests after the opening, with 60 demonstrators in the street blocking Redfern traffic for an hour. “Guerilla acts hit the DMR” said the headlines. There were at least 36 Sydney Morning Herald articles on the development. It’s hard to oppose something if you don’t know the name of it.
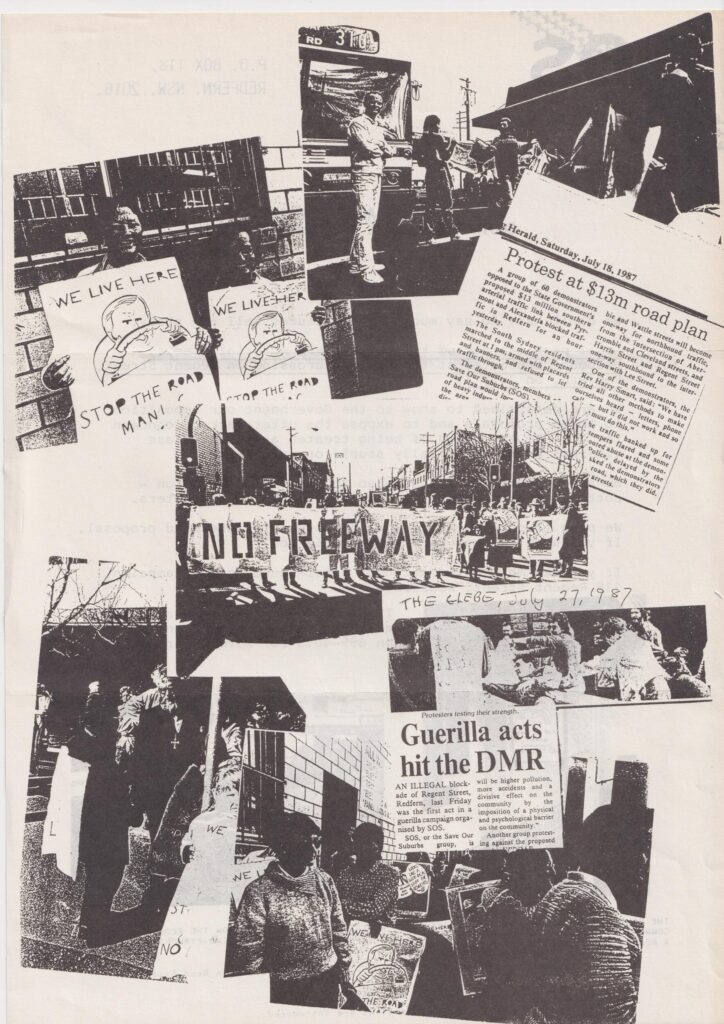
After the partial opening in 1992 there was a “dramatic increase in traffic”. The traffic was so heavy residents’ walls cracked and caused structural damage to several homes. Noise interfered with conversations inside homes and disturbed sleep of residents. Crossing the street became difficult “in particular for children, the aged, disabled and mentally ill”. Residents moved out due to high lead levels in the blood of their daughter. The supermarket suffered a 30% decline. A resident was told their house value dropped by $50,000 in 1993 dollars (when the median Sydney house price was ~$188,000). The principal of the Alexandria Public School (Alexandria Park Community School) stated he was “not game” to have his pupils tested for lead levels in their blood – “if they’re high over in Balmain, there’s no way they aren’t going to be as high here”.
There were so many car crashes “Mike”, who lived on a busy corner of Wyndham, ran “a kind of unofficial St John’s Ambulance station from his house” – coming out to look after the victims lying on the road. He said “Since I’ve lived here I’ve lost 5 blankets.. and saved two lives.” – before a car crashed into his own house. Mike stated “They are crucifying the people who live here”.
The Southern Arterial Route should not be extended (as assumed in Future Transport 2056). “if people count, Stage 3 of the Southern Arterial will not be built” (Citizen’s Report for proposed Stage 3, 1993). It should be at least partially reverted, per the 2021 Botany Road Corridor Urban Design Study (or perhaps even more ambitiously). The Citizen’s Report for the unbuilt stage 3 continued “on the same grounds, Stage 2 will be undone or significantly modified.”
Reviewers considered the draft neutrally written. In the spirit of Wikipedia, I hope you may agree the facts speak for themselves.
After two rounds of peer review through Wikipedia’s Articles for Creation review process (it was initially light on secondary references), my draft received a B-Class quality rating, placing in the top 4% of accepted articles. Personal compliments are not permitted on Wikipedia; review feedback included the article “…is, to say the least, very well documented”.
But now – this page is yours! If you spot any errors, notice something I missed, or find something I didn’t, hit that edit button! (you don’t need an account and your IP address isn’t even shown) It hopefully won’t remain only my writing for long. In the AI era, Wikipedia has never been more valuable. Thanks so much to the pseudo-anonymous editors who reviewed it and have made corrections.
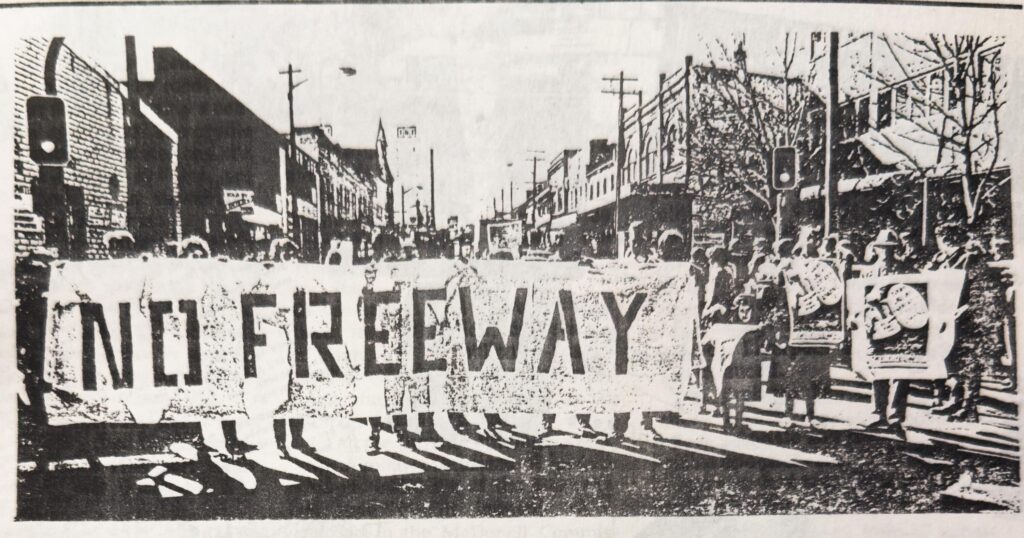
This route threads the histories of the Green Bans and Wran’s 1977, Clover’s 1988 political campaign and the Darling Harbour opening that year, Anzac Bridge, the growth of Green Square and ongoing story of urban renewal in Waterloo.
Construction of the Southern Arterial potentially made traffic worse than doing nothing at all. The “Wyndham Street Residents’ Alternative” proposal, dismissed in the 1987 EIS but approximately matching the as-built design today, performs “significantly worse” (for cars) than if it was never implemented at all (according to the traffic modelling). The implementation of Stage 2 created such congestion that it drove people to support Stage 3 on the grounds that it would abolish the bottleneck at Henderson Road/Raglan Street/Wyndham Street. At this intersection it can be faster to catch the metro from Central to Waterloo than walk across this road, due to traffic signals timing. (Why Did the Chicken Catch the Metro? Because It Was Faster Than Crossing the Road…”, 2024)
More recently there have been proposals to partially revert the damage. Improvement seems politically or organisationally challenging – even the Redfern Waterloo Authority, created by “the most draconian and arrogant bill” Clover had ever seen and the “most draconian” agency she had encountered, was not able to wrestle the Roads & Traffic Authority to improve the street. The Citizen’s Advocate for the proposed Stage 3 claimed in 1993 that “some RTA personnel” have confidence that “not enough people care enough for there to be any danger of their plans not being realised.” I hope times have changed.
Keep the Southern Arterial in mind when you are late to uni and seemingly wait forever at the Broadway traffic lights, as you queue outside Radio Taco, as you risk your life crossing Cleveland Street mid-block amid missing crossings (or just give up visiting businesses on the other side), as you exit ABC’s headquarters looking up to the UTS pedestrian overpass, as you awkwardly balance on your bike waiting to cross from Mary Ann St to the Kelly Street cycleway, as you emerge from a carpark labyrinth in an uphill slog on Allen Street and face a (new) fence on Ultimo St, take a breather late at night on the Abercrombie Hotel balcony overlooking over that strange triangle island (perhaps during a dystopian city concept album), and when you pass the vacant shop fronts on Regent Street and Botany Road.
The proposal for this high-traffic, one-way pair urban vehicle arterial along urban shopping streets (a stroad) seems to have resurfaced every few years since at least 1969. It was resuscitated after the Wran government’s 1977 sell-off of road reservations put to rest terrifying plans to raze vast tracts of inner city housing to build surface expressways, Robert Moses-style. It appears the city council pushed for the arterial as an alternative to stave off these horrifying expressway plans (see 1974). As plans for road widening requiring “extensive property resumption” the council pushed a one-way scheme instead (1983). Eventually the DMR moved forward (1987) with such proposals, and there was opposition from a (perhaps transformed) council (1988).
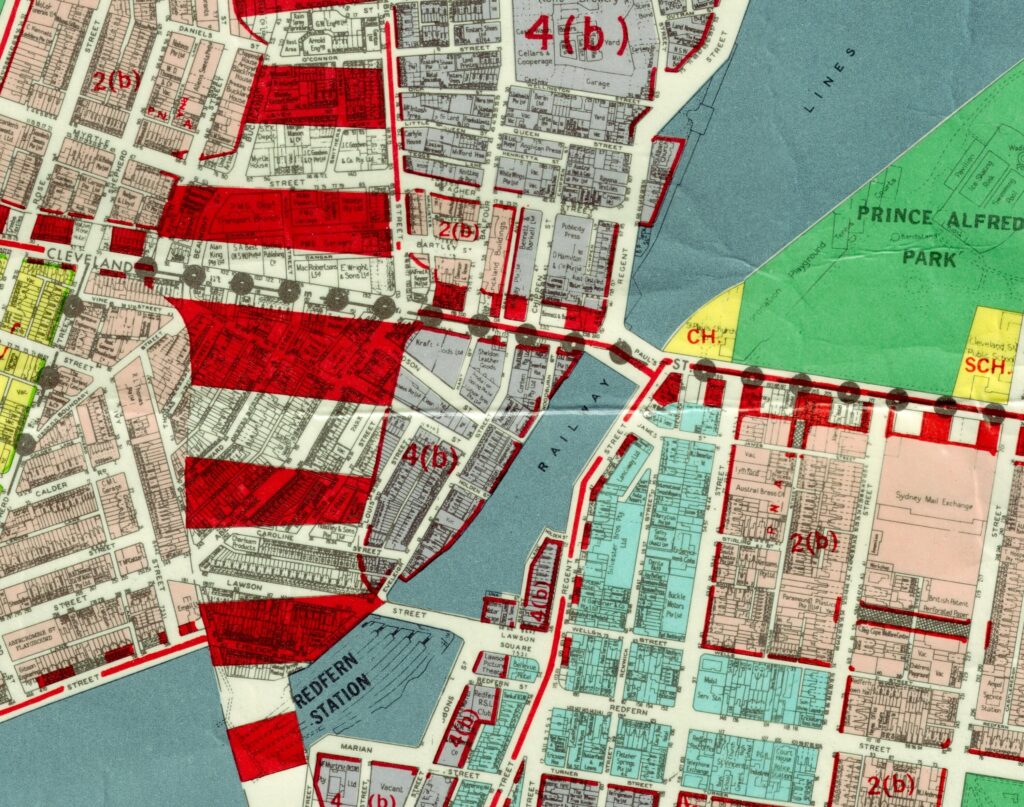
The Pyrmont-Alexandria Traffic Management Proposal Environmental Impact Statement (EIS) was approved in 1987 “amid controversy” (SMH), seemingly intentionally the least worst option against an alternate elevated expressway callously struck through the heart of Redfern (The Public Transport Option was dismissed as “Diversion of car drivers and passengers to the existing rail network is not considered likely”) and because “neither rail or bus public transport satisfies the objectives of the Proposal”.
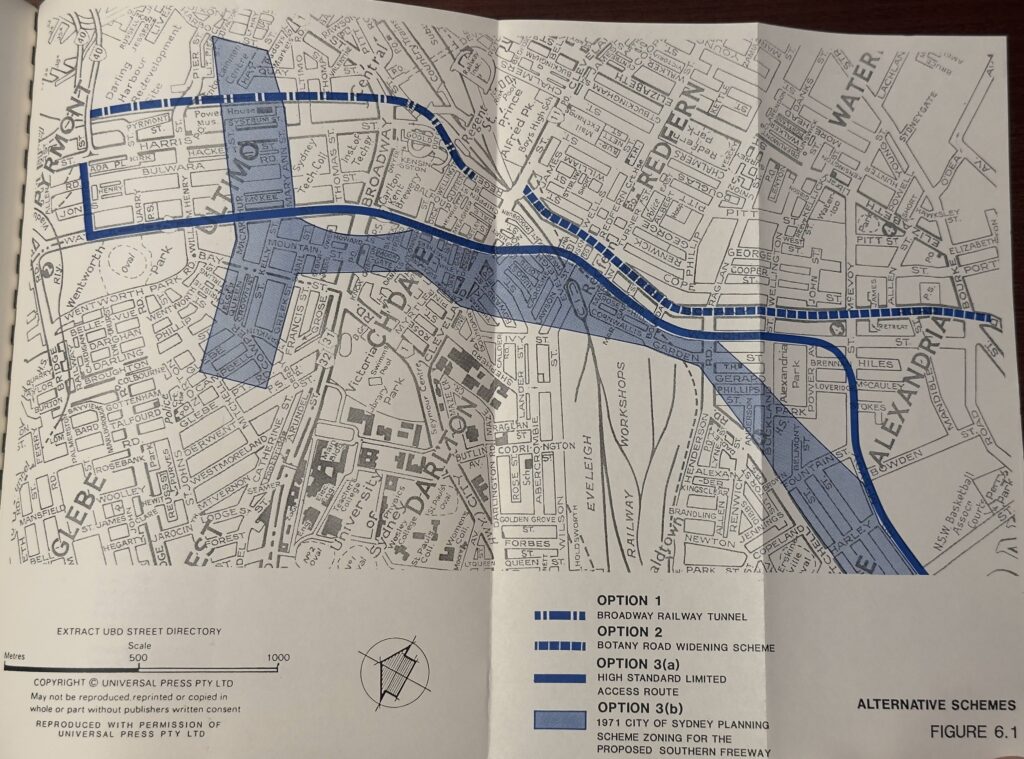
The immensely unpopular project was never completed and seems to have lurked just under the surface in the state roads department ever since. The unstoppable force of road building met an immovable object in the 1990s recession (with the official reason being uncertainty of the M5 exit blocking traffic modelling for the EIS) – only to re-emerge in a 2003-2006 gasp for air (I don’t know what happened in 2006 – let me know or even better, edit the page).
Plans to expand this arterial perhaps still lurk in the deep. There are lukewarm public documents published within the last 6 years which assume extension of this urban high-vehicle-capacity arterial. The unbuilt Stage 3 extension of the Southern Arterial was predicted to cut average delays by only 12 seconds, from 24 to 12 seconds (and rising from 12 to 25 seconds by 2005). Such numbers remind me of the modelling to increase vehicle capacity at Epping Bridge, causing induced demand.
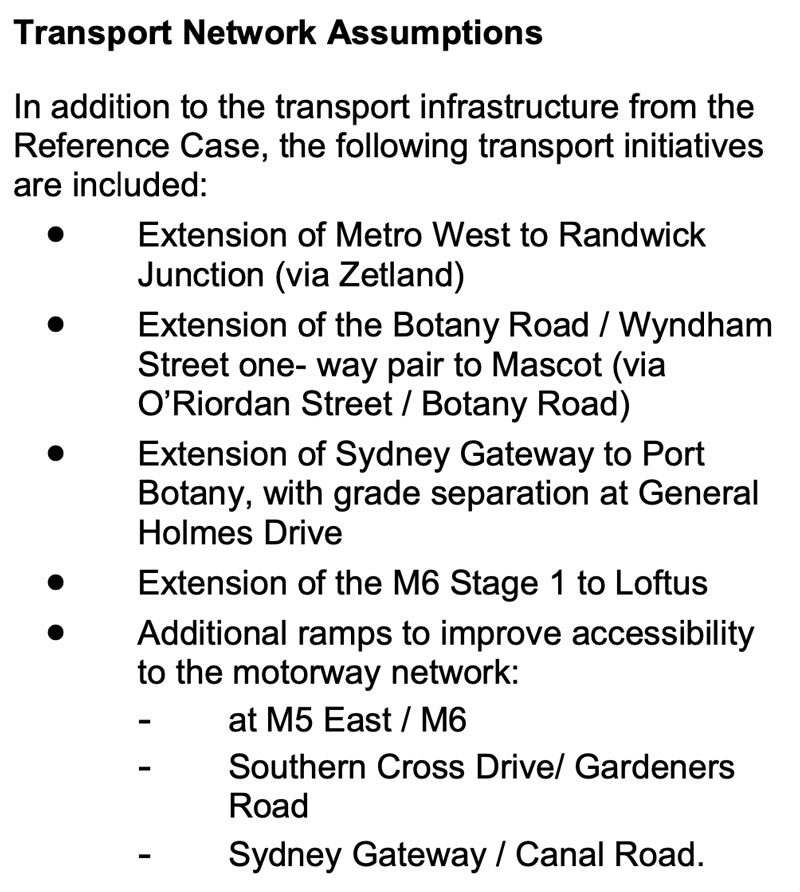
As recently as 2023 the state government removed a pedestrian crossing at Allen Street and Harris Street against their policy – to save motorists an estimated 8 seconds in the AM-peak (according to the modelling). In January 2025 even more slip lanes were added at Cleveland Street and Regent Street with unclear consultation, but in 1987 this wasn’t just an intersection: “A focus on city views” was emphasised on a drawing titled St. Paul’s Place. The polluted confluence of the Cleveland Street and Regent Street traffic sewers was a public square/place, but this non-place still has a name. This urban arterial has flown under the radar for far too long.
Wyndham Street residents – cling to your zebra crossings! The Southern Arterial does, after all, take in one of only two ‘unimproved’ surface AusRAP 2-star segments in the City of Sydney (the other one, City Road and Newtown’s King Street, will be a “traffic nirvana” any day now). History is not over.
On the sunny side, there are also proposals floating out there to partially revert the damage and turn the Regent Street stroad back into lively shopping street – and improve the amenity for the substantial density of new housing being constructed nearby. Further north, perhaps the long-overdue removal of the Wentworth Park greyhound track and new homes nearby will spur a rethink of Wattle Street. Currently this road cuts residents off from their hard-won parkland (so dangerous the adjacent school needs an overpass). Perhaps it’s time for road-space reallocation for buses (and active transport) with safer speed limits, now we have a parallel heavy rail, metro, a second airport, no more Port Jackson freight, and of course – WestConnex.
The least we owe the residents of Redfern and Waterloo is to improve the safety and amenity of this street.
You might like to check out the Sydney Morning Herald Archives site. For a very reasonable fee you get time-limited search access to some fascinating history, and the results are still accessible for free afterwards. The (newly renovated) State Library is a wonderful place – I’d like to spend more time there. I’ve learned a lot about Sydney’s planning and transport history and why things are the way they are. I was originally going to publish this last year, but terrible events occurred so I postponed.
Wikipedia is wonderful – it’s like OpenStreetMap but an encyclopaedia.
https://en.wikipedia.org/wiki/Southern_Arterial_Route?useskin=vector
After four weeks of talking to people and reviewing the evidence, my chief
conclusion is simply this: if people count, Stage 3 of the Southern Arterial will not be built. Further, on the same grounds, Stage 2 will be undone or significantly modified.This inclusion of Stage 2 is important for the reason that abandonment of Stage 3 alone will not solve the traffic problems in this area. The implementation of Stage 2 to the Henderson Road/Raglan Street intersection has, for example, created such ugly congestion, especially in Wyndham Street, that it drives people to supporting Stage 3 on the grounds that it will at least abolish this awful bottleneck. Stage 3 (in its unimplemented form) can appear as the lesser of two evils. Ideally we need a solution to the problems of Stage 2 which does not involve the evils of Stage 3.
Hall Greenland (1993-06-30). “Citizen’s Response to the proposed Stage 3 of the Southern Arterial (Citizen’s Advocate Report)”.
The post Have you heard of the Southern Arterial Route? first appeared on Jake Coppinger.
]]>The post Why Won’t the Media Report Accurately on Road Deaths? first appeared on Jake Coppinger.
]]>This post was #3 on Reddit r/sydney, and is on r/australia.
On Tuesday, a man in his 30s riding a Lime e-bike, motor-limited to 25km/h, was struck[1][2][a] by a 28-year-old man driving a garbage truck at Little Regent Street and Broadway, Ultimo – and died at the scene.[3][4][5][6] This is a legal e-bike – and the man was just a few hundred metres from Sydney’s Central Station – so why did the man die? Why aren’t the media calling for safety improvements to Broadway – an 8 to 9 lane dual-carriageway TfNSW-controlled state road without any bike lanes, just a few hundred metres from the Sydney CBD and Central Station, and on the doorstep of the Tech Central precinct hosting some of Australia’s most successful tech companies?[7]
Not a single one of the articles, from SMH (news[8] or editorial[9]), ABC News[10], The Guardian[11], AAP[2], 9 News[12], Pedestrian[13], Sunrise[14], 7 News live blog[5], News.com.au[4], The Daily Telegraph[1], Sky News[15], The Daily Mail[16], or The Nightly[17], mentions that there is no protected bike lane on George Street / Parramatta Road / Broadway, or that the man who died was on a legal, 25km/h limited Gen4 Lime e-bike.
In fact, most of these articles give the impression that the rider was on an illegal or high-powered e-bike travelling at high speed. Safe cities which have achieved Vision Zero (yes, they exist[18][19]) do not ban e-bikes – they make streets safer so that people aren’t killed by motor vehicles. Of the 205 pedestrian deaths recorded across Australia in the year ending 31 July 2025[20], WalkSydney is aware of two that are confirmed to have been caused by people using e-mobility devices.[21]
Wednesday’s Sydney Morning Herald editorial[9] titled “We need to rethink the use of e-bikes, especially by children”[b] went so far as to say “even drivers” need to be protected from e-bikes, and that “delivery drivers who rely on these machines must follow road rules” – no mention of the mass of the vehicle involved or that Little Regent Street is one-way southbound at that intersection[22] (SMH even deleted the exact location of the crash from the first article version at 10:45am – in print you wouldn’t know what street it was on). While Everybody Limes[23], gig economy delivery riders are in one of the most vulnerable economic positions in our society.[c] Too often it feels like media coverage depicts delivery riders as villains, singling them out for special treatment. In Australia we pride ourselves on a safe workplace environment as a given.
Where are the bike lanes? Why is funding for safe cycling and walking infrastructure ~0.2% of total NSW transport funding? (has any journalist even written[d] what percentage it is?) Why isn’t it 20% as recommended by the UN[25], as per recommendation 16 of the Parliament of NSW inquiry into “Use of e-scooters, e-bikes and related mobility options”[26] which the NSW Government “Support in principle”?[27] Why was the federal $100m active transport fund at least 10x oversubscribed[28], and ~74% of Get NSW Active grants rejected?[c] Where is the focus on Western Sydney access inequality?[30][31][32] Why is TfNSW so resistant[32] to road space reallocation on state roads (when supported by councils[33], their own strategy[34] and supported by that Grattan report[35][36])? Why does Paul Nicolaou publicly argue against safer 30km/h speed limits on high streets[37][38] when a previous Business Sydney report stated[39] it would be beneficial for businesses? (even 2GB agrees 30km/h is “going to be safer”[40]) Where is the TfNSW PRUAIP[41][42] post-Westconnex or PUTP C6[43][44]? In other words, where is the detailed journalism? I write this with the utmost respect for the craft, of reporters who are “in their late twenties or early thirties”[45], are “young enough to breathe that kind of air”[45] and go up against “unmovable forces”[45] (as surely the “Boulevard of broken dreams”[46][47] and traffic signal prioritisation are[48]) – but this isn’t it.
In my downtime, I have been maintaining a detailed list of every pedestrian and cyclist fatality in NSW in 2025 (with 292 references and counting), because even our beloved ABC “inaccurately suggested that e-scooters and e-bikes played a significant part in the rise in pedestrian deaths”, when “the fatalities were in fact the riders of e-scooters” (ABC Correction[49]). I am not a journalist, and this is not my job. It has been harrowing sitting down each morning to read the TfNSW “NSW Road Toll [sic] – Daily” report – which TfNSW removes access to daily – and NSW Police news reports – which seemingly disappear after some months. These systems make it almost impossible to keep a contemporary record of crashes and road trauma using official statistics and Police information. Quite frankly, I wish an actual journalist did this instead of me – I am exhausted.
This man and anyone else in his position deserved to get to his destination safely, and to his family for the holidays. The NSW Government wants walking and bike riding to be the preferred way to make short trips and a viable, safe and efficient option for longer trips.[50] So why isn’t it, and why aren’t we talking about that? Not only has our state government failed to make Parramatta Road / Broadway safe for anyone outside a car, and perhaps most inner city state roads (Oxford Street excluded), but the media has also failed to call this out. The least we owe this man is to address the root cause. In ‘world cities’ like London, Paris, Helsinki, Oslo and Copenhagen people even can even ride safely without helmets thanks to safe streets and protected separated cycleways.
I’m not interested in laying blame on involved individuals; I want to support systemic change so people walking or riding safe bicycles aren’t killed on our local streets – so that I or someone I care about won’t die on this street one day.
I dare you to go for a bike ride down Broadway (or Parramatta Road, or Cleveland Street[c], or King Street (Newtown), or Victoria Road, or the Southern Arterial Route) and tell me e-bikes are the problem.
Journalists: please seek advice, background or quotes from Bicycle NSW, Better Streets, WalkSydney, or the Committee for Sydney on stories about road safety. They will be more than happy to assist you with best-practice, policy-informed, evidence-backed commentary.
Accuracy and language
If you have any concerns, feedback, corrections or additions regarding this post, please contact me at jake@jakecoppinger.com. I have disabled comments. While I am not a journalist, I have made every effort to use accurate, factually correct and appropriate language, and have followed Australian and international road safety communication guidelines.[51][52][53][54][55][56] Any corrections or suggestions on language are much appreciated.
Review of media coverage of the death
Note: See full list of every pedestrian, cyclist and personal mobility device road deaths in NSW in 2025 here: https://jakecoppinger.com/2025/11/list-of-pedestrian-cyclist-and-personal-mobility-device-road-deaths-in-nsw-in-2025/
News that this death was a person on an e-bike appeared to reach the NSW Premier Chris Minns while he was live, mid-interview[e], on 2GB radio (see transcript below). This was to announce a pre-planned and reasonable proposal to reduce the maximum power of legally purchased e-bikes in NSW to 250 watts, in line with European standard EN-15194[58] and other Australian states.[57] This import rule change was reported by ABC News on the 27th of November.[58]
The media then proceeded to link, without presenting evidence, this death of an e-bike rider (on a legal, 25km/h limited Lime bike) to the proposal to reduce the maximum power of legally purchased e-bikes in NSW.
While “It is unclear how fast the rider and garbage truck were travelling in Tuesday’s incident.” (an earlier, now deleted sentence from a Sydney Morning Herald article[8]) and “We don’t know the circumstances of that crash”[57], the title of several news articles made possibly misleading inferences about this death of a person riding a legal e-bike:
- Speed limits urged after e-bike rider dies in crash (AAP News)[2]
- NSW Premier Chris Minns considers reducing e-bike speed limits after fatal Sydney crash (9News)[12]
- E-bike laws: Chris Minns announces 250-watt limit after rider killed in Sydney’s CBD after collision with garbage truck (webpage title / previous article title), ‘Terrible’: Minns announces 250-watt e-bike limit after rider killed in Sydney CBD (early home page title[59]), E-bike power limits to be halved after rider dies in Sydney crash (article and home page title as of 2025-12-02 17:51) – Sydney Morning Herald[8]
- NSW considering plan to halve power and top speed of ebikes as rider dies in collision with garbage truck (The Guardian)[11]
- NSW Premier Chris Minns flags new e-bike regulations after man killed in ‘terrible’ collision with garbage truck in Sydney (Sky News)[15]
A Lime e-bike (appearing to be a Gen4) was at the scene with the front wheel separated from the front fork.[2] The bike was taken away from the scene on a truck.[11] Gen4 Lime e-bikes have a maximum continued power rating of 350W and have a power assist speed limiter at 25km/h.[60]
Sunrise (Liam Tapper) stated the person on the bike was “potentially a delivery driver”[c] and “…a man believed to be in his 30s, a delivery driver, …”. The Police press release does not mention this, and with the exception of an image caption on The Nightly, no other news outlets reported this.[14]
NSW Police Press Release
The NSW Police press release is dated 07:13:46am.[3] It states the crash occurred at “about 6am”. While light on details, it is factual and uses accurate and appropriate language, as one would expect.
Daily Telegraph
First article
The Daily Telegraph published an article titled “Man dies after being struck by garbage truck while riding an e-bike in Sydney’s inner city” at 7:10am, by authors William Tyson and Rory Williams.[1]
Second article
The Daily Telegraph published a second article at 6:35am on the day after the crash[61] (authors Eliza Barr, James O’Doherty, Josh Hanrahan, Amy Jackson, Jordan Miller). This article was published on the front page, and titled “Cycle of Madness”, “Fresh calls to curb out-of-control e-bikes”. [62]
The Daily Telegraph reported the death alongside comments from Harold Scruby, who called for banning under 17-year-olds from riding e-bikes, while the man who died was in his 30s. It included “Calls for tougher rules came as a Lime bike rider was killed after being hit by a garbage truck in the CBD.”[61](this was not an illegal or unsafe e-bike). It also included “In the wake of the death, Pedestrian Council of Australia CEO Harold Scruby called for under 17-year-olds to be banned from riding e-bikes.” (however, this death was of a man in his 30s). The Daily Telegraph states “It’s understood the garbage truck had been collecting bins on Little Regent St before pulling out onto George St, where it collided with an e-bike rider.”[61]. Little Regent Street is a one-way street southbound at the intersection of George Street (Broadway).[22] It includes “…calls for tougher rules to keep riders and motorists have been sounded, after a Lime bike rider was killed in a CBD crash.” The exclusion of the word “safe” in that byline appears to be a typo. Motor vehicles cause the overwhelming majority of road deaths and serious injuries in Australia and internationally.
Sydney Morning Herald
Breaking news article
Digital (2025-12-02)
The Sydney Morning Herald (Jessica McSweeney) published an article on the crash, titled “E-bike rider killed in Sydney’s CBD after collision with garbage truck” at 8:19am.[8] At 10:45am the article was updated , titled “E-bike power limits to be halved after rider dies in Sydney crash” (as of the `20251202062725` snapshot) to remove most details about the crash, appearing to link the death to the e-bike power limits announcement, and removing the sentence “It is unclear how fast the rider and garbage truck were travelling in Tuesday’s incident.” The only remaining mentions of the crash in the 14 paragraphs are “The announcement was made just hours after an e-bike rider in his 30s was killed in a collision with a garbage truck in Ultimo on Tuesday.” and “After Tuesday’s fatal crash between the e-bike rider and a 28-year-old garbage-truck driver, police said it was believed the rider was not wearing a helmet. A report will be prepared for the coroner.”
The current Sydney Morning Herald article as of 2025-12-02 17:51 shows an unrelated photo of teenagers safely riding in a bike lane on an unnamed (unrelated) street. It does not even mention the street the crash was on, let alone identifying systemic issues which may have contributed to the crash.
Print (2025-12-03)
The 2025-12-03 Sydney Morning Herald print article was titled “Power cuts ahead for the state’s easy riders” and displayed at the top of the front page. The photo is captioned “”Fat tyre” e-bikes on the streets of Kurnell, Photo: Janie Barrett”. The subtitle is “Maximum e-bike speeds will be slashed from 60 to 30km/h under new laws to make the streets safer”, prompting the reader to turn to page 4 (no article text is displayed on the front page). Note that Chris Minns’ 2GB interview did not state a 30km/h limit, but implied bikes with 250W would likely not make it up to 60km/h.[57]
On page 4, the article is the first on the page (top left). It is titled “E-bike power to be halved after fatality”. It included the Harold Scruby quote.
Editorial article (2025-12-03)
Wednesday’s Sydney Morning Herald editorial[9] was titled “We need to rethink the use of e-bikes, especially by children”. The title in the SMH source code, perhaps a prior print or A/B tested title, is “E-bikes in NSW: As Chris Minns cuts maximum power and speed, we still need to think about the children who ride them”.
In print, this editorial appeared on page 18, under Opinion, and was titled “Rethink e-bike use, especially for children”.
I include criticism of this article in the initial section.
Opinion Article (2025-12-03)
On Thursday, the Sydney Morning Herald published an opinion article titled “An e-bike for Christmas? That would be a big fat no” at 5am. (author Alexandra Smith, State Political Editor).[63]. It states:
“On Tuesday, Premier Chris Minns promised he would bring NSW in line with the rest of the country and halve the maximum battery power from 500 watts to 250 watts and reduce the top speed to 30km/h. He made the comment just after an adult e-bike rider was killed by a garbage truck in Ultimo.”[3]
Breaking news article (2025-12-04)
On Thursday, the Sydney Morning Herald published a breaking news article titled “Man critical after being knocked off e-bike” (author Jack Gramenz).[64]
Knocked off by what? According to the Northern Beaches Advocate, “multiple Triple Zero (000) calls were made to report a man riding an e-bike had been hit by a four-tonne (4t) delivery truck”.[65] Why is four-tonne truck not in the title, or in the first paragraph?
“The white 2022 Hino 300 delivery truck was driven by a man in his 20s, and was in the kerbside lane travelling at approximately 60 km/h down Newport Hill, when it has impacted a Dirodi Rover e-bike ridden by a 55-year-old man. The significant force of the impact ripped the rear wheel from the e-bike. The truck is then believed to have gone over the e-bike, with the rider going under the wheels.”[65]
Why is the title not something like “Man driving four-tonne truck strikes bike rider on 6 lane road”? This could have been any bike rider on this road; this could have been me. Barrenjoey Road at Grandview Pde is a 6 lane (dual-carriageway) 60km/h road with no separated cycleway and there is no viable alternative route for cyclists[f] travelling to/from the entire Palm Beach peninsula. From personal experience on a non-electric bike (3 months ago) this road is terrifying to cycle on.
As of midday Friday (5th December) the man remains in a critical condition in intensive care.[65]
The article includes “Premier Chris Minns on Tuesday announced plans to halve the power limit on bikes sold in NSW to 250 watts, hours after a rider in his 30s was killed in a collision with a garbage truck.”[64]
Weekend Opinion Article (2025-12-06)
On Saturday, the Sydney Morning Herald published an opinion article titled “That $4000 e-bike for your teenager almost killed me (but worry most for your kid)”[66][g] (author Malcolm Knox). While raising reasonable and important concerns around gig-economy delivery app policies, and risks of illegal or high-powered e-bikes (which, as I have mentioned, is absolutely irrelevant to the fatality on Tuesday), this article also included othering of e-bike riders and unverified assumptions. Unhelpful and unnecessary comments such as:
“[safety] Concern for helmetless teens doubling or tripling on a $4000 gift from their parents does not come automatically.”
Why does the presence of a helmet[h], or two people on a bike[i], or the price of the bike, or the wealth of the parents qualify the journalist’s empathy? Is the death of someone not worthy of empathy or compassion if their bike costs $4000? Of the 205 pedestrian deaths recorded across Australia in the year ending 31 July 2025[20], WalkSydney is aware of two that are confirmed to have been caused by people using e-mobility devices.[21] Concern over “nearly getting bowled over” is reasonable, but this insensitivity was not necessary. I expect this from the dregs of the Facebook comments section, not from the good people at the Sydney Morning Herald – and certainly not from a two-time Walkley Award winning journalist.
“It’s important to distinguish between two kinds of e-bike riders. One is the adult food delivery rider… e-bikes are the conveyance of choice for your incoming pizza or pad thai. Riders, already exploited by the services that use them, are often the victims in incidents where car and truck drivers aren’t used to, or prepared to put up with, sharing the road … The other e-bike riders are children with parents wealthy enough to let them risk their lives on what are in effect ridiculously expensive unlicensed motorcycles.” (emphasis mine)
This is extremely reductive, to temper my language, to state there are only “two kinds” of e-bike riders – a “conveyance” for “your incoming pizza or pad thai” [sic] or children with “parents wealthy enough”. Have you not been to school drop off in the Inner West or on Bourke Street, or cycled around the city center or in Green Square? Or even just to the unbelievably cool showroom down at Omafiets? Have you not heard of people living with a disability who struggle to walk due to pain and use e-bikes as an accessibility device, of parents riding their kids to school – or I don’t know – a commuter? Stop othering people who ride e-bikes.
“Riders … are often the victims in incidents where car and truck drivers aren’t … prepared to put up with sharing the road.”
The Cambridge Dictionary defines “put up with” as “to accept or continue to accept an unpleasant situation or experience, or someone who behaves unpleasantly”.
If I rephrase this sentence using active voice, it comes out something like “Car and truck drivers often crash into people riding bicycles because they don’t accept the unpleasant situation of sharing the road with cyclists.”
I really hope the author is not excusing this behaviour as acceptable and to be tolerated. If not, perhaps condemnation of this mentality should be in the first paragraph. There are reams of papers on the dehumanization of cyclists.
“In New York, newly elected mayor Zohran Mamdani aims to regulate the unreasonable demands on food-delivery riders that prompt them to ride recklessly. We could do with similar protections. This week’s announcement followed the death of a man in his 30s when his e-bike collided with a garbage truck.”
We absolutely could do with more protections – but this week’s announcement had nothing to do with food-delivery rider reform, and as this post discusses elsewhere, the announcement was not in response to this fatality.
Sunrise said verbally the person was “potentially” a delivery driver (and wrote “believed to be a delivery driver”) in the video description.[14] While the SMH editorial included a hyperlink with the text “a delivery rider died”[9], the SMH article this text links to (ie. the breaking news article) does not mention delivery rider (in either the 8:19am or 10:45am version).[8] ABC[10], AAP[2] (who were present early enough to photograph the blue tent being erected) and The Guardian[11] either (very reasonably) did not consider it relevant if the man who died was a delivery driver, or did not consider it was confirmed. I do not consider it sufficiently established as fact to write (or imply) if this man was a delivery driver.
Perhaps as the author only identifies “two kinds” of e-bike rider, and the rider who died wasn’t a child with “parents wealthy enough”, they assumed this man was a delivery driver. We should expect better journalism, and at the very least basic fact checking from the highly-respected and “most widely read masthead in the country”.
(among other measures, Mamdani’s “Regulating Delivery Apps & Protecting Delivery Workers” policy platform includes “improve street infrastructure”[69] and “support street design strategies to improve cycling and e-bike safety”. To “create safer streets for deliveristas and all New Yorkers, the Mamdani administration will … Invest in and expand DOT’s e-bike programs, … Invest in and expand DOT’s innovative street designs to improve e-mobility and deliverista safety, such as: wider/additional bike lanes, passing zones, bicycle speed signal timing progressions (e.g. greenwaves), bike parking, and more.”[70])
Please also note: In between the Chris Minns announcement and this opinion article, on Thursday (2025-12-04) a man driving a four-tonne truck struck a man riding an e-bike in Mona Vale. The man was critically injured. Barrenjoey Road at Grandview Pde is a 6 lane (dual-carriageway) 60km/h road with no separated cycleway and there is no viable alternative route for cyclists[f] travelling to/from the entire Palm Beach peninsula. From personal experience on a non-electric bike (3 months ago) this road is terrifying to cycle on. As of midday Friday (5th December) the man remains in a critical condition in intensive care.[65]
Warning on illegal e-bikes (2025-12-07)
On Sunday, the Sydney Morning Herald published an article titled “Doctors urge parents to stop buying illegal e-bikes as children’s injuries double” (authors Jessica McSweeney and Mostafa Rachwani).[71]
This article was published after this blog post.
While it doesn’t discuss what percentage of walking or cycling fatalities are caused by motor vehicles (Motor vehicles cause the overwhelming majority of road deaths and serious injuries in Australia and internationally) or the lack of safe infrastructure for cycling, it does include this sentence I haven’t seen in any other article this week:
“Last Tuesday, Premier Chris Minns announced e-bike power limits would be lowered from 500 watts to 250 watts in NSW. The announcement came in the moments after a share-bike rider was fatally hit by a garbage truck at Haymarket. There is no suggestion the e-bike rider was speeding or riding an overpowered bike.” (emphasis mine)
I appreciate this addition.
Australian Associated Press
AAP News published an article at 10:25am (author Kat Wong)[2]. Changes AAP News made at 1:14pm include (view Internet Archive diff from above the loginwall):
- changing the title from “Speed limits urged after e-bike rider dies in crash” to “E-bike rider killed in crash as safety warning sounds”
- replacing the text “An e-bike rider has died after slamming into a garbage truck, fuelling calls to regulate the increasingly popular form of transport.” to “An e-bike rider is dead after being hit by a garbage truck as authorities sound the alarm on the increasingly popular form of transport.”
- Inserting as a third paragraph “A man in his 30s was not wearing a helmet when he attempted to cross the road on an e-bike.”
The Daily Mail
The Daily Mail published an article titled “Sydney CBD traffic grinds to a halt after e-bike rider dies in crash with garbage truck” at 7:49am (author Kylie Stevens).[16]
International road collision reporting guidelines state “Be mindful if reporting on traffic delays not to overshadow the greater harm, of loss of life or serious injury, which could trivialise road death.”[72][73]
The Guardian
Live blog
There were two entries in The Guardian’s Live blog. The first, dated 7:54am, was titled “Ebike rider dies after collision with garbage truck in Sydney CBD”.[74] The second was “Chris Minns says NSW considering ‘serious’ change to maximum power of ebikes amid safety concerns” at 8:59am (updated at 09.22am).[75]
Article
The Guardian published an article titled “NSW considering plan to halve power and top speed of ebikes as rider dies in collision with garbage truck” at 10:27am (authors Nick Visser and Daisy Dumas).[11] It stated “New South Wales is considering a plan to halve the maximum power and top speed of ebikes, after a rider died in a collision with a garbage truck in central Sydney.”
Sunrise (Seven Network)
The Sunrise segment spent a significant amount of time focusing on traffic disruption.[14] At least one live broadcast was around 10:08am.[j]
ABC News
ABC News published an article currently titled “E-bike rider killed in collision with garbage truck in Sydney CBD as NSW premier announces new legislation” (author Miriah Davis) at 12:18pm, and updated it at 1:34pm.[10]
This article did, however, describe “He [Chris Minns] described today’s incident as a “tragedy” but reiterated the changes had already been commissioned…” (emphasis mine).
The Nightly
The Nightly published an article currently titled “Ultimo: Traffic chaos after e-bike rider killed in garbage truck collision near Sydney’s Central Station” (author Amy Lee) at 2025-12-01T20:39:55.000Z, and modified at 2025-12-01T22:34:23.608Z.[17]
As with the Daily Mail article, the Nightly headline focused on the traffic impact before even mentioning the rider’s death.
7 News
7 News published a video segment titled “NSW pushes e-bike crackdown after fatal crash” at 7:16am on 2025-12-03.[76] The segment started “Calls for a crackdown on dangerous e-bikes are growing louder and louder by the minute aren’t they after yet another crash claimed a life of a rider in Sydney.”
Crash site on 2025-12-03
By the day after, there was not a single indication someone had died. No 30km/h Emergency Street (as studied by Meredith Glaser and Kevin J. Krizek[77][78] and presented at the USyd Festival of Urbanism in September[79]), no temporary traffic-calming tools, no road closure, no flowers[k].
Apart from a few people stopping and gesturing to their partners when crossing at the intersection, there was no sign anything had ever happened.
Broadway / Parramatta Road is unsafe
Note: This is far from a detailed or bullet-proof analysis. I hope a journalist might write one.
Parramatta Road has been dubbed the “boulevard of broken dreams”.[46][47] I am not aware of a detailed analysis of crashes along the corridor, however it lights up like a Christmas tree on road crash maps (https://crashmap.carto.au/nsw, https://crashdash.crowdlab.com.au/app) Along the roughly one-thousand metres of Broadway/George Street from City Road to Lee Street, CrowdLab’s CrashDash shows 33 crashes (10 minor, 22 serious, 1 fatal) in just 3 years (Jan 2022 – Dec 2024).
“Enhance active transport experience along and across Broadway” is a goal of the TfNSW Pyrmont-Ultimo Transport Plan May 2024[43]. “Action C6 is to “Investigate feasibility of cycleway connection along Broadway”.[43] The Committee for Sydney also recommends a bike lane along the street.[80], along with the stunning City of Sydney Access Strategy and Action Plan.[81] The authority for Parramatta Road is TfNSW (the NSW State Government).
While Broadway sits in the middle of the economic powerhouse of Australia, walking along it is also a harrowing experience for people walking. Huge numbers of people walking to multiple universities are squeezed onto narrow footpaths. Improving pedestrian connectivity and “prioritising pedestrian crossings” is action 4D of the Tech Central Economic Strategy.[82] I myself have felt unsafe on multiple occasions whilst walking as a pedestrian in the area and have noted and reported multiple near misses.
Sometime between 08:00 – 09:59 in Apr 2020[l] a “light truck” reversing in a southbound direction on Little Regent Street (at Broadway) seriously injured a pedestrian (crash id 1231369).[83] I have not found media reports on this, and as NSW Police press releases are deleted after some months I am unable to verify if there was a Police media release detailing the crash.
People walking along Broadway must wait multiple minutes to cross traffic signals at the Southern Arterial Route – another indicator of how our government prioritises cars over people walking.[m] Fences are installed[84] to stop people crossing mid-block, while in Hobart increasing the number of pedestrians crossing mid-block is considered a success metric indicating perceived safety.[85] Traffic cycle times are typically over 110 seconds (almost 2 minutes) along all of Broadway. Giving people more time or opportunities to cross at traffic lights can reduce unsafe crossing by 34% – we don’t need an expensive sensor to tell us this. “Any delays in excess of [30 seconds] are not just inconvenient; they are hazardous.”[86][87]
Just over 200 metres from the crash site, concerns were raised about pedestrian safety at the left-turn slip lane from Broadway into Wattle Street, Ultimo over at least 15 years or more. In the five years to June 2012, there were 32 reported crashes at the intersection of Wattle St and Parramatta Rd.[88]. The RTA added more pedestrian signals rather than remove the slip lane because “of the unacceptable congestion and delays” (for cars).[89]
Transcript of Chris Minns interview on 2GB, 2025-12-02
Segment titled “EXCLUSIVE – Speed limits coming for electric bikes”. This extract from the radio show does not state the start (wall clock) time of the segment.[57] It references a NSW Police press release, titled “Parents urged to only buy legal e-bikes this Christmas” and published 09:05:25am.[90] Transcribed using OpenAI Whisper Large v2 (offline), verified manually word-by-word. Punctuation is arbitrary.
Ben Fordham (Host)
Well there’s a warning for parents today. If you’re thinking of buying your kids an e-bike for Christmas, make sure it’s a legal one. Police are urging families to do their research and buy reputable e-bikes. The popularity of those ‘fat boy’ bikes has spiked over the past few years and that’s due to boost in numbers as well this Christmas.
And there’s a warning from police, there’s a growing number of dodgy e-bikes doing the rounds. The Police Assistant Commissioner Dave Driver says high-powered and illegal e-bikes are a big problem. He says what we want as Christmas approaches is that parents only purchase bikes that comply with New South Wales law. He’s told the Daily Telegraph we don’t want someone to make a mistake on an e-bike that they’ve never ridden before, we don’t want that mistake to cost them their life. So it’s a timely reminder as we make our way into Christmas because the cheaper alternatives can be unreliable when it comes to safety and they’re more likely to lead to fires when batteries are being charged.
And we understand the New South Wales Government is in fresh talks to introduce some new e-bike regulations, that’s what we’re being told. And the New South Wales Premier, Chris Minns, is live in the studio right now. Premier, good morning to you.
Chris Minns – Premier of NSW
Good morning, Ben.
Ben Fordham (Host)
Have you bought your kids an e-bike for Christmas?
Chris Minns – Premier of NSW
No, I haven’t. No, I haven’t. And I worry about them. I’ve driven, we spend a lot of time on the road in my job and I’ve seen some particularly young kids on bikes that are more like motorbikes. There’s very little pedalling going on. They seem to be keeping up with the traffic which means that they’re traveling at 50 or 60 kilometers an hour and I suspect that there’s the limiters have been removed but in some cases they’re legally sold e-bikes it’s just that we’ve got a far higher limit in New South Wales compared to every other jurisdiction in the country.
Ben Fordham (Host)
We went out to Maccas recently for Mac Happy Day and we were dining in and we were there with the kids and I noticed and I said to my wife Jodie at the time I went look at the bikes turning up at Maccas every three or four minutes another e-bike turning up, parking, going inside, getting their food, really young kids on them and they do move quick and don’t get me wrong – I’ve had a go on one riding around a park not far from my place there a lot of fun but I would be really worried if it was one of my kids on one of those unregulated bikes.
Chris Minns – Premier of NSW
Yeah that’s right and as a result we are contemplating a pretty serious change. New South Wales is the only state where you can legally purchase an e-bike with 500 watts of power and we want to make a change to reduce that to 250 watts. It’s a significant change but it means that the highest limit that you can travel at is between currently between 50 and 60 kilometres an hour. That’ll be reduced to 25 and 30 kilometres an hour using pedal power. Every other state, Queensland, Victoria, Western Australia, South Australia has removed, limited to that model, the 250 watt model. We think we need to do it in New South Wales too.
Ben Fordham (Host)
So our bikes are traveling faster, legally they’re allowed to than in other states at the moment.
Chris Minns – Premier of NSW
Yeah that’s right, I mean there’s two variations, there’s the hotted up ones where the limit has been removed and they can travel incredibly quickly, far faster than moving traffic. They’re currently illegal but even legally purchased, in some cases ‘fat bikes’ have a 500 watt limiter which means that they can go as fast as a car, and as a result people are going to get hurt.
Ben Fordham (Host)
This has just come through right now and it’s timely considering the conversation we’re having. This is New South Wales Police communicating to us that an e-bike rider has just died in a collision involving a garbage truck in Sydney CBD this morning. So that’s the one that I mentioned just after 6 a.m. We’re now being told that an e-bike is involved. Emergency services were called to the intersection of Little Regent Street and George Street, Ultimo. Following reports of a crash, officers from Surrey Hills have attended. They found an e-bike and a garbage truck has collided. The e-bike rider, a man in his 30s, was treated by paramedics but died at the scene. The driver of the truck, a 28-year-old man, taken to hospital. Police have established a crime scene. A report will be prepared for the coroner.
It just underlines the point. We don’t know the circumstances of that crash, but it underlines the dangers out there right Premier?
Chris Minns – Premier of NSW
Yeah I think that’s right I mean this is obviously terrible and your..your heart goes out to that man’s family on the eve of Christmas for this to happen. Um. I mean it underlines the point, these are…these can be very dangerous there’s young kids that are using them. We want to make sure that people are safe particularly during the holiday period.
I mean don’t get me wrong Ben, obviously we want children out of the house, we want them off electronic devices, we want them playing with their friends but if they’ve got hotted up bikes that are as quick as a motorbike it can be incredibly dangerous.
Ben Fordham (Host)
So will you be seeking support from your opposite number Kelly Sloan in the opposition and other crossbench MPs to say if we want to change this we need your help or are you just able to do it yourself as Premier?
Chris Minns – Premier of NSW
I’m told when it comes to this one we can do it via regulation, so it doesn’t require legislation.
Ben Fordham (Host)
When do you expect that you’d be able to do it?
Chris Minns – Premier of NSW
In the coming months. I mean there’s obviously…there’s obviously a situation where people have legally bought bikes in good faith thinking that they’re completely compliant and they were so we’ll have to grandfather the scheme in, but I don’t want perfection to be the enemy of the good here. We do need to make a change and we want to do it.
Ben Fordham (Host)
Premier Chris Mins is with us live in the studio. If you’d like to ask him a question, you can dial the number 131873.
I’ve got Jim who wants to ask you something. If you want to throw your headphones on Premier.
And Jim, you can go right ahead because Chris Mins is listening.
You want to ask a question about e-bikes, do you? Go right ahead.
Jim (caller)
Yeah, good morning, Premier. I’d like to know when is the government going to get fair dinkum and introduce registration and insurance for these things?
Chris Minns – Premier of NSW
Well, Jim, I think we got fair dinkum about five minutes ago. I mean, that’s a big change for New South Wales. It puts us in line with the other states and we think it’s a necessary change.
Registration and insurance is incredibly expensive and timely. I’d rather do this in a stepped way. At the moment, the last thing New South Wales needs is more regulation. If you speak to most people in the state, they’ll say to you, We have to fill in a form to basically do everything in New South Wales. To add another registration for riding a bike, it seems like a step too far for me, but that doesn’t mean we’re not doing anything. This is a big change that I’m announcing today.
(discussion on coal fired power station)
Footnotes
- ↑ AAP News changed their wording from the rider “…slamming into a garbage truck…” to “An e-bike rider is dead after being hit by a garbage truck…” at 2025-12-02 13:14[2]
- ↑ Note: The title in the SMH source code, perhaps a prior print or A/B tested title, is “E-bikes in NSW: As Chris Minns cuts maximum power and speed, we still need to think about the children who ride them”
- ↑ 3.0 3.1 3.2 3.3 As I stated on 2024-11-26[29]: “0.2% is so little that TfNSW denied Get NSW Active funding for over 74% of active transport projects that NSW councils requested this year (258 of 346). Our local communities are desperate for improvements in safety for pedestrians and cyclists – as tank-sized SUVs further take over our streets precariously close to vulnerable pedestrians at dangerous speeds and people attempt to follow the slivers of life-saving bike lanes (~0.8% of road network by length in Greater Sydney) so they don’t die on their trip to work (or your home with a food delivery – when I cycled through Chalmers St and Cleveland St on November 23rd 2020 as I did twice per day, fragments of the customer’s food were still remaining on the asphalt alongside pieces of crushed grey helmet. I will spare you the photo).”
- ↑ …His first look was not particularly searching or perceptive. He uncovered few facts not already in print somewhere else… (Caro, 1974)[24]
- ↑ Ben Fordham, 4m10s into snippet:[57] …This has just come through right now and it’s timely considering the conversation we’re having. This is New South Wales Police communicating to us that an e-bike rider has just died in a collision involving a garbage truck in Sydney CBD this morning. So that’s the one that I mentioned just after 6 a.m. We’re now being told that an e-bike is involved…
- ↑ 6.0 6.1 The Crescent Road hills are brutal, and getting across the 7 high speed lanes from Grandview Pde to Waterview St on any bike is the stuff of nightmares.
- ↑ Minor edits to this article were made 2025-12-06 14:59, without changing any of these criticised sentences.
- ↑ A social media comment: …If someone is killed from head trauma in a car accident, do we ask if they were wearing their driving helmet? Or if a pedestrian is hit, falls, and suffers a brain injury, do we ask if they were wearing a walking helmet?
Focusing on PPE is a distraction from the actual issue, a lack of safe cycling infrastructure, normalisation of dangerous driving, and a refusal to take responsibility for pedestrian and cyclist deaths because it might slightly impact cars…[67] - ↑ Two persons on a bike is legal if the bike has two seats[68]
- ↑ I watched a live cross in person and my photo is timestamped 10:08am.
- ↑ I laid a bouquet of flowers at the site of the death, against a wall out of the way, twice. They were removed both times, the second within 90 minutes.
- ↑ Date is not supplied in the stats[83]
- ↑ Committee for Sydney recommended “Test the rephasing of traffic lights along Parramatta Road to deliver greater prioritisation for north-south vehicle and pedestrian movement.”[80]
References
- ↑ 1.0 1.1 1.2 William Tyson; Rory Williams (2025-12-02). “Man dies after being struck by garbage truck while riding an e-bike in Sydney’s inner city”. Daily Telegraph. Retrieved 2025-12-02.
- ↑ 2.0 2.1 2.2 2.3 2.4 2.5 2.6 Kat Wong (2025-12-02). “Speed limits urged after e-bike rider dies in crash”. AAP News. Retrieved 2025-12-02.; Kat Wong (AAP) (2025-12-02). “Speed limits urged after e-bike rider dies in crash”. The Leader. Archived from the original on 2025-12-03. Retrieved 2025-12-02.; Kat Wong (AAP) (2025-12-02). “E-bike rider killed in crash as safety warning sounds”. Yahoo News. Retrieved 2025-12-02.; Kat Wong (AAP) (2025-12-02). “Speed limits urged after e-bike rider dies in crash”. The New Daily. Archived from the original on 2025-12-02.
- ↑ 3.0 3.1 3.2 “E-bike rider dies after crash with garbage truck – Ultimo”. NSW Police. 2025-12-02. Archived from the original on 2025-12-01.
- ↑ 4.0 4.1 Hannah Moore (2025-12-02). “E-bike rider killed in garbage truck crash in Sydney’s CBD”. News.com.au. Archived from the original on 2025-12-04. Retrieved 2025-12-04.
- ↑ 5.0 5.1 Molly Magennis (2025-12-02). “7NEWS live updates: Sydney CBD accident as e-bike rider dies after collision with garbage truck”. 7 News. Retrieved 2025-12-03.
- ↑ “Chris Minns says NSW considering ‘serious’ change to maximum power of ebikes amid safety concerns”. The Guardian. 2025-12-02. Archived from the original on 2025-12-01. Retrieved 2025-12-02.
- ↑ “Tech Central”. NSW Government. Retrieved 2025-12-03.
- ↑ 8.0 8.1 8.2 8.3 8.4 Jessica McSweeney (2025-12-02). “E-bike rider killed in Sydney’s CBD after collision with garbage truck”. The Sydney Morning Herald. Archived from the original on 2025-12-01. Retrieved 2025-12-02.
- ↑ 9.0 9.1 9.2 9.3 Note: Title in source code is “E-bikes in NSW: As Chris Minns cuts maximum power and speed, we still need to think about the children who ride them”
The Herald’s View (2025-12-03). “We need to rethink the use of e-bikes, especially by children”. Sydney Morning Herald. Archived from the original on 2025-12-03. Retrieved 2025-12-03. - ↑ 10.0 10.1 10.2 Miriah Davis (2025-12-02). “E-bike rider killed in collision with garbage truck in Sydney CBD as NSW premier announces new legislation”. ABC News. Archived from the original on 2025-12-03. Retrieved 2025-12-02.
- ↑ 11.0 11.1 11.2 11.3 11.4 Nick Visser (2025-12-02). “NSW considering plan to halve power and top speed of ebikes as rider dies in collision with garbage truck”. The Guardian. Archived from the original on 2025-12-04. Retrieved 2025-12-04.
- ↑ 12.0 12.1 Patrick Brischetto (2025-12-02). “NSW Premier Chris Minns considers reducing e-bike speed limits after fatal Sydney crash”. 9News. Archived from the original on 2025-12-04. Retrieved 2025-12-04.
- ↑ Matt Galea (2025-12-02). “Chris Minns Announces New E-Bike Regulations In NSW After Man Killed By Garbage Truck”. Pedestrian. Archived from the original on 2025-12-04. Retrieved 2025-12-04.
- ↑ 14.0 14.1 14.2 14.3 Liam Tapper (2025-12-02). “E-bike rider killed in Sydney CBD crash”. Sunrise. Retrieved 2025-12-02.
- ↑ 15.0 15.1 Laurence Karacsony (2025-12-02). “NSW Premier Chris Minns flags new e-bike regulations after man killed in ‘terrible’ collision with garbage truck in Sydney”. Sky News. Retrieved 2025-12-02.
- ↑ 16.0 16.1 Kylie Stevens (2025-12-02). “Sydney CBD traffic grinds to a halt after e-bike rider dies in crash with garbage truck”. Daily Mail. Archived from the original on 2025-12-04. Retrieved 2025-12-04.
- ↑ 17.0 17.1 Amy Lee (2025-12-02). “Ultimo: Traffic chaos after e-bike rider killed in garbage truck collision near Sydney’s Central Station”. The Nightly. Retrieved 2025-12-02.
- ↑ Julie Power (2020-01-13). “Oslo cut road deaths to one in 2019. Can Sydney do the same?”. Sydney Morning Herald. Archived from the original on 2024-06-15.
- ↑ Aitor Hernández-Morales (2025-08-02). “Helsinki just went a full year without a single traffic death”. Politico. Archived from the original on 2025-09-13.
- ↑ 20.0 20.1 Bureau of Infrastructure and Transport Research Economics. “Road Deaths Australia – July 2025” (PDF). Commonwealth of Australia. p. 4. Archived (PDF) from the original on 2025-08-18. Retrieved 2025-11-02.
- ↑ 21.0 21.1 Jamie van Geldermalsen (2025-10-29). “The ABC is wrong about e-bikes (again)”. WalkSydney.
- ↑ 22.0 22.1 “Way: Little Regent Street”. OpenStreetMap. Retrieved 2025-12-02.
- ↑
Nick Gascoine documents the life and times of e-bike empire, Lime. Proclaiming 1.5 million trips across Sydney alone, the neon green bike—and helmet—becomes the subject of a city in motion. Armed with his Canon R5, Nick archives seemingly every imaginable commute. From leisurely coastal cruises to pint-fuelled time trials, Everybody Limes.
Nick Gascoine (2025-11-28). “Exhibition: Everybody Limes”. Alchemy Studio: Hung Supply. Archived from the original on 2025-12-04. Retrieved 2025-12-04. - ↑ Robert A. Caro (September 1974). “Chapter 43. Late Arrival”. The Power Broker: Robert Moses and the Fall of New York (PDF). p. 1582. ISBN 0-394-72024-5.
- ↑
UNEP calls on countries to invest at least 20 per cent of their transport budgets in walking and cycling infrastructure to save lives, reverse pollution and reduce carbon emissions, which are rising at more than 10 per cent a year.
“Put ‘people, not cars’ first in transport systems, says UN environment chief”. United Nations. 2016-10-20. - ↑ “Use of e-scooters, e-bikes and related mobility options” (PDF). Parliament of New South Wales. February 2025.
- ↑
Recommendation 16
That the NSW Government, in allocating funds to active transport in the NSW Budget, ensure better alignment with the proportion of active transport trips taken and the United Nations recommendation for active transport to be allocated 20 per cent of transport budgets.
Response: Support in principle
“Parliamentary Inquiry into the use of e-scooters, e- bikes and related mobility options – Government Response” (PDF). NSW Government. May 2025. p. 27. - ↑ Catherine King (2025-11-12). “Alga Roads Conference in Bendigo (Speech)”. Bendigo: Ministers for Infrastructure, Transport, Regional Development, Communications, Sport and the Arts. Archived from the original on 2025-12-03. Retrieved 2025-12-03.
- ↑ Jake Coppinger (2024-11-26). “Sydney Park Junction: TfNSW Won’t Commit to Original Scope Despite Ministerial Intervention”.
- ↑ Joshua Clay; Ariana D’Alessio; Finn Dolan; Finley Hook; Tully Horneman; Enya Hua; Chantelle Posa; Faith Roche; Isabelle Rose; Brigid Burke; Kurt Iveson; Tingsen Xian. “Transport Equity 2770” (PDF). Together in 2770 Collective, Sydney Alliance, University of Sydney.
- ↑ “Busted Bus Stops”. Sweltering Cities.
- ↑ 32.0 32.1 Give up. Light Rail and Bus Rapid Transit today is too hard and the car brain has the absolute majority. The rapid network is now a 50+ stop local bus route running in shared traffic between Liverpool and Leppington to WSI on a 30 min frequency with a 40+ min journey time.
That BRT comes second (planned for the 2030s), always second.
The focus will be back on the roads and motorways when the transport designers deal with the heavy vehicle traffic to and from WSI in 2028 and ask Transurban for more unsolicited proposals to duplicate the rest of the M2.
Ask for a 24 hour bus lane down any state road and get sent to the wolves.
@kypros1992 (2025-11-09). “Western Sydney doesn’t deserve it”. - ↑
Answer to my question about why there is no proposed safe, separated cycleway on Elizabeth Street north of Central Station:
CoS staff “advised” – Elizabeth St, North of Central Station – Randall and Elizabeth originally was to go up Elizabeth to Campbell St to avoid shared path through Belmont Park. TfNSW did not agree to using Elizabeth St north of Eddy Avenue
Cycling Advisory Committee Meeting Minutes – 30 October 2025 – 10:00am – 11:00am. City of Sydney Council. p. 6. - ↑
We will rebalance road investment, from providing additional capacity for general traffic (such as through road widening), to reallocating of existing road space for public transport and active transport alternatives. More space for buses can lead to fewer vehicles moving more people.
The reallocation of road space will be required for high quality, frequent, turn-up-and-go bus services which can support the delivery of more diverse, ‘missing middle’ housing in areas closer to existing infrastructure, services and jobs.
Transport for NSW (October 2025). “Connecting NSW Strategy – Priorities for Transport” (PDF). New South Wales Government. p. 27. Archived (PDF) from the original on 2025-11-01. Retrieved 2025-11-02. - ↑ …Congestion is best managed in our cities using other policies, such as road-user charging, and the effective provision of public transport, which also becomes cheaper at higher densities. Brendan Coates; Joey Moloney; Matthew Bowes (November 2025). “More Homes, Better Cities: Letting more people live where they want” (PDF). Grattan Institute.
- ↑ Initiatives like transit lanes, bus priority lanes, and bus rapid transit can make buses faster and more reliable, and so entice onto public transport many people who would otherwise drive. Such measures can restrict road space and risk worsening traffic for remaining cars, but they usually allow a higher total number of people to travel. “Building more homes where infrastructure costs less” (PDF). NSW Productivity Commission. August 2023. p. 28. Retrieved 2025-12-03.
- ↑ Paul Nicolaou. “(Untitled LinkedIn post)”. Archived from the original on 2025-11-28. Retrieved 2025-12-03.
- ↑ Savannah Pocock (2025-11-25). “Sydney Business fears Greens MP Kobi Shetty’s reduced speed limit bill will halt the city”. Daily Telegraph. Archived from the original on 2025-11-25.
- ↑ “It is time to make the speed limit 30km per hour for the whole street so that it becomes safe for cyclists and pedestrian alike. At 30 the amenity killing noise finally becomes acceptable for outdoor dining, public space activation and encourages people spurs economic activity by encouraging people to linger longer to enjoy what the Street has to offer.”
“High time – the future of Oxford Street” (PDF). Business Sydney, Robertsday. November 2020. p. 12. Archived (PDF) from the original on 2024-07-05. - ↑
Quotes spoken by Clinton Maynard from the talkback radio segment at 15:23pm on 2GB Sydney:
- …Well we genuinely have a problem with the road toll going up year after year after years of going down. It doesn’t make a lot of sense because cars are safer than they’ve ever been. It can’t be the speed. Speed is 30% related to fatalities. But somebody’s still putting the foot down and contributing to that 30%… (note: Speed is not “30% related to fatalities”)
- …The road toll is going up. We know that. Stats show speed amounts for 30%, contributes to 30% of fatal accidents but fatigue is a big issue. Distraction is a factor. Are we going to ban fatigue? How’s that going to work? It’s not….
- …Road safety experts will tell you that there’s a lot less chance of being seriously injured or killed when cars are traveling at 30 than 50 or 60. Sure, but there’s also less chance you’re going to be seriously injured if a car is traveling at 20 kilometers an hour or 10 kilometers an hour. You’ve got to draw the line somewhere. 30 is too low…
- …It’s an absolutely bonkers idea cutting the speed limit to 30 and I cannot find any justification for it. Because sure it is going to be safer but it’s also going to be safer at 20 kilometers an hour so you’ve got to draw the line somewhere…
- ↑ “Parramatta Road Urban Amenity Improvements (PRUAIP)”. Transport for NSW. 2025-08-18. Retrieved 2025-12-03.
- ↑ “Parramatta Road Urban Amenity Improvement Program”. NSW Government Planning. Archived from the original on 2025-08-09. Retrieved 2025-12-03.
- ↑ 43.0 43.1 43.2
Under “5.2.1 Enhance active transport experience along and across Broadway”, “C6: Investigate feasibility of cycleway connection along Broadway”. Pg 61 states “Lead: Transport”, “Support: City of Sydney”.
“Pyrmont-Ultimo Transport Plan” (PDF). Transport for NSW. May 2024. pp. 50, 61. ISBN 978-1-922875-95-2. - ↑ marcyveslane (2023-11-27). “Up the PUTP”. Walk Sydney.
- ↑ 45.0 45.1 45.2 Robert A. Caro (September 1974). “Chapter 43. Late Arrival”. The Power Broker: Robert Moses and the Fall of New York (PDF). p. 1606. ISBN 0-394-72024-5.
- ↑ 46.0 46.1 Elias Visontay (2024-07-27). “‘Boulevard of broken dreams’: could Parramatta Road really become Sydney’s Champs-Élysées?”. The Guardian. Retrieved 2025-12-03.
- ↑ 47.0 47.1 Declan Bowring (2024-07-24). “Parramatta Road’s latest future plan to be revealed in roads minister’s speech at Committee for Sydney summit”. ABC News. Retrieved 2025-12-03.
- ↑ Jake Coppinger (2025-09-24). “Green Lights More Often: The Secret 2018 Study of Sydney’s Traffic Signals”.
- ↑ “Pedestrian Deaths (correction)”. ABC News. 2025-08-27. Archived from the original on 2025-11-02.
- ↑ “Active Transport”. Transport for NSW. Archived from the original on 2025-11-03. Retrieved 2025-11-02.
- ↑ “Using Appropriate Language in Road Safety Communication” (PDF). Australasian College Of Road Safety.
- ↑ Laura Laker. “Road Collision Reporting Guidelines”. Road Collision Reporting Guidelines, University of Westminster’s Active Travel Academy.
- ↑ Laura Laker. “What does the research tell us? Rationale for the Guidelines and references” (PDF). Road Collision Reporting Guidelines, University of Westminster’s Active Travel Academy.
- ↑ “Media guidelines for reporting road traffic incidents” (PDF). Injury Matters. Injury Matters, Road Trauma Support WA. 2022. p. 6. Archived (PDF) from the original on 2024-06-26. Retrieved 2025-11-02.
- ↑ “10 guidelines for reporting road trauma”. Road Trauma Support Group NSW. 2025-11-04.
- ↑ “When covering car-cyclist collisions”. National Public Radio. 2023-09-07.
- ↑ 57.0 57.1 57.2 57.3 57.4 Ben Fordham (2025-12-02). “EXCLUSIVE – Speed limits coming for electric bikes”. 2GB. Retrieved 2025-12-02.
- ↑ 58.0 58.1 Declan Bowring (2025-11-27). “Import rules crackdown to halt ‘overpowered’ e-bikes coming to Australia”. ABC News. Retrieved 2025-12-03.
- ↑ “SMH Homepage (‘Terrible’: Minns announces 250-watt e-bike limit after rider killed in Sydney CBD)”. Sydney Morning Herald. 2025-12-02. Archived from the original on 2025-12-01. Retrieved 2025-12-02.
- ↑ Lime. “Information Standard for the supply of e-micromobility vehicles under clause 6B of the Fair Trading Regulation 2019”. Retrieved 2025-12-02.
- ↑ 61.0 61.1 61.2 Eliza Barr; James O’Doherty; Josh Hanrahan; Amy Jackson; Jordan Miller (2025-12-03). “Chris Minns announces NSW to ban e-bikes with power output greater than 250 watts from 2026”. Daily Telegraph. Archived from the original on 2025-12-03. Retrieved 2025-12-03.
- ↑ “(Daily Telegraph front page 2025-11-03)”. Daily Telegraph. 2025-11-03.
{{cite web}}:|archive-url=requires|archive-date=(help) - ↑
Note: Title in the source code is Fat bike safety: An e-bike for Christmas? That would be a big fat no.
Alexandra Smith (2025-12-03). “An e-bike for Christmas? That would be a big fat no”. Sydney Morning Herald. Archived from the original on 2025-12-03. Retrieved 2025-12-03. - ↑ 64.0 64.1 Note: Possible prior title in source code: “E-bike accident Sydney northern beaches: Man in critical condition”
Jack Gramenz (2025-12-04). “Man critical after being knocked off e-bike”. Sydney Morning Herald. Retrieved 2025-12-08. - ↑ 65.0 65.1 65.2 65.3 “E-bike rider critically injured”. Northern Beaches Advocate. 2025-12-04. Archived from the original on 2025-12-04.
- ↑
Prior title in website source code: That $4000 e-bike for your teenager almost killed me (but worry most for your kid)
Malcolm Knox (2025-12-06). “That $4000 e-bike for your teenager almost killed me (but worry most for your kid)”. Sydney Morning Herald. Archived from the original on 2025-12-05. Retrieved 2025-12-06. - ↑ GLADisme (anonymous) (2025-12-05). “(Untitled comment on Reddit subreddit r/sydney)”. Reddit. Archived from the original on 2025-12-06. Retrieved 2025-12-06.
- ↑
(1) The rider of a bicycle must not carry more persons on the bicycle than the bicycle is designed to carry.
NSW Government. “ROAD RULES 2014 – REG 246 – Carrying people on a bicycle”. Australasian Legal Information Institute. - ↑ “Platform – Zohran for NYC”. Zohran for New York City. Archived from the original on 2025-12-05. Retrieved 2025-12-06.
- ↑ Zohran for New York City. “Regulating Delivery Apps & Protecting Delivery Workers”. Archived from the original on 2025-10-03. Retrieved 2025-12-06.
- ↑ Jessica McSweeney; Mostafa Rachwani (2025-12-07). “Doctors urge parents to stop buying illegal e-bikes as children’s injuries double”. Sydney Morning Herald. Archived from the original on 2025-12-06. Retrieved 2025-12-08.
- ↑ Laura Laker. “Road Collision Reporting Guidelines”. Road Collision Reporting Guidelines, University of Westminster’s Active Travel Academy.
- ↑ Laura Laker. “What does the research tell us? Rationale for the Guidelines and references” (PDF). Road Collision Reporting Guidelines, University of Westminster’s Active Travel Academy.
- ↑ “Ebike rider dies after collision with garbage truck in Sydney CBD”. The Guardian. 2025-12-02. Retrieved 2025-12-03.
- ↑ “Chris Minns says NSW considering ‘serious’ change to maximum power of ebikes amid safety concerns”. The Guardian. 2025-12-02. Retrieved 2025-12-03.
- ↑ 7 News (2025-12-03). “NSW pushes e-bike crackdown after fatal crash”. YouTube.
- ↑ “Emergency Streets”. Emergency Streets.
- ↑ Meredith Glaser; Kevin J. Krizek (2021). “Can street-focused emergency response measures trigger a transition to new transport systems? Exploring evidence and lessons from 55 US cities”. Transport Policy. 103: 146–155. doi:10.1016/j.tranpol.2021.01.015. ISSN 0967-070X.
- ↑ “ROADS TO REGENERATIVE URBANISM”. University of Sydney. 2025-09-16.
- ↑ 80.0 80.1 “Reclaiming Parramatta Road” (PDF). Committee for Sydney. November 2020.
- ↑ “Access Strategy and Action Plan: Continuing the Vision” (PDF). City of Sydney Council. November 2023.
- ↑ “Tech Central Economic Development Strategy”. NSW Government – Premier’s Department. September 2025. Archived from the original on 2025-09-25.
- ↑ 83.0 83.1 See rows with id 1231369 in
NSW Road Crash Data - 2020-2024 - CRASH.xlsxandNSW Road Crash Data - 2020-2024 - TRAFFIC UNIT.xlsx(loginwalled).
“NSW Crash Data”. Transport for NSW Open Data. Retrieved 2025-12-02. - ↑ “Way: 1363408037”. OpenStreetMap. Retrieved 2025-12-02.
- ↑ City of Hobart. “Transforming Collins Street trial – Monitoring & Evaluation Framework” (PDF). p. 3.
- ↑ Josef Whitfield (2025). Pedestrian Wait-Time Reduction: A Vast Improvement to the Pedestrian Experience on a Shoestring Budget. Transport Planning and Modelling (TPM) Conference. Transport for Greater Manchester (TfGM). Archived from the original on 2025-09-25.
- ↑ A Martin (TRL Limited) (February 2006). “FACTORS INFLUENCING PEDESTRIAN SAFETY: A LITERATURE REVIEW” (PDF). London Road Safety Unit, Transport for London. Archived (PDF) from the original on 2016-06-15.
- ↑ “LOCAL PEDESTRIAN, CYCLING AND TRAFFIC CALMING COMMITTEE 18 JULY 2012” (PDF). City of Sydney Council. 2012-07-18.
- ↑ “Council Report – Broadway Road Widening and Closure of Jones Street, Ultimo – 26 July 2010” (PDF). City of Sydney Council. 2010-07-26. p. 5.
- ↑ “Parents urged to only buy legal e-bikes this Christmas”. NSW Police. 2025-12-02. Retrieved 2025-12-03.
The post Why Won’t the Media Report Accurately on Road Deaths? first appeared on Jake Coppinger.
]]>The post List of pedestrian, cyclist and personal mobility device road deaths in NSW in 2025 first appeared on Jake Coppinger.
]]>This page is a list of pedestrian, cyclist and personal mobility device road deaths across New South Wales (Australia) in 2025, sourced from NSW Police press releases and daily government statistics. It is not guaranteed to be complete or up to date; BITRE monthly bulletins should be referenced for complete statistics (though preliminary and subject to revision).[2]
Recently there have been several misleading media articles (in reputable sources) regarding these deaths in Australia.[3] Some have “inaccurately suggested that e-scooters and e-bikes played a significant part in the rise in pedestrian deaths”, when “the fatalities were in fact the riders of e-scooters” (ABC Correction[4]). Of the 205 pedestrian deaths recorded across Australia in the year ending 31 July 2025[5], WalkSydney is aware of two that are confirmed to have been caused by people using e-mobility devices.[3] Meanwhile, an article last weekend victim-blamed[6] people riding bicycles without helmets for their deaths[7], comparing this behaviour to smoking and suggesting we portray them like those who drive a car while drunk – no mention of an international perspective or the most important step in the hierarchy of risk control measures when discussing PPE: elimination of risk.[8][9] Motor vehicles cause the overwhelming majority of road deaths and serious injuries in Australia and internationally.[10][11][12][13][14][15]: 7
The intention of this reference is to assist journalists, advocates and the wider public by providing a clear and concise list with links to police press releases and daily road fatality statistics. Currently, NSW Police press releases are deleted or disappear after some months, and daily road death statistics are also deleted daily. All urls have been saved to (or retrieved from) the Internet Archive, a non-profit, where possible. I believe a reference of this information is in the public interest. Unfortunately it is currently almost impossible for an individual to keep track of press releases of road deaths across all modes.
For the avoidance of any doubt, the intent of this page is not to highlight or blame individuals involved in crashes, but to highlight the prevalence of these crashes and their commonalities, and the need for systematic change to address this road safety ‘blind spot’.
If you have any concerns, feedback, corrections or additions, please contact me at jake@jakecoppinger.com. You can also make a pull request on the git repository (which contains the Wikitext source) to edit this page.

Image: NSW Road Fatalities 12-month moving total, 2020 to 2025-11-10. Published in the Daily report on the NSW Centre for Road Safety website – this one will quickly become outdated.
Overview
The Transport for NSW 2026 Road Safety Action Plan has a target of 50% reduction in deaths and 30% reduction in serious injuries by 2030[16], reiterated as the first strategic pillar in the October 2025 Connecting NSW Strategy.[17]: 11 Eliminating road trauma is the number one priority listed in the Connecting NSW Strategy.[17]: 5 The NSW Government has just started a review of the Road Safety Action Plan.[a]
By 11 November 2025, pedestrian fatalities in New South Wales had increased by over 52% year-on-year[b] (compared to 5% for driver fatalities[c]) and pedal cyclist fatalities have tripled[d] (2025 prelim to 2024 final, 12-month period ending 11 November).[18] Pedestrian road deaths in Australia have risen nearly 50% in the last four years (to July 2025).[19] In the combined 384 pages of the 2024-2025 TfNSW Annual Report there was one sentence on road fatalities.[20][21]
More than 1100 pedestrians are struck by motor vehicles on NSW roads each year.[22] Speed management is embedded within all 3 themes of the National Road Safety Strategy 2021-30[23] (and is a pillar of Vision Zero[24]).
In December 2025 a federal proposal to reduce default speed limits on poor-quality country roads was released for public comment after consideration for 7 years.[25] A paper by the federal Office of Road Safety argued a reduction in default speed limits from 100km/h to 80km/h on unsignposted roads would save 123 lives and prevent 4,182 serious injuries per year[26]: 11 and save the economy $2.697 billion per year.[26]: 67 More than 150 experts sent an open letter to government supporting the speed limit proposal. Only 11 days after consultation concluded, with about 11,000 submissions, the proposal was scrapped by state and federal transport ministers. The proposal attracted opposition from farmers, truckers and rural residents who said it would decrease productivity and rob them of valuable time with their families.[25]
If you are struck by a car at 50km/h there is just a 10% chance you will survive. Your chance of survival increases to 60% if the car is travelling at 40km/h, and to 90% if struck at 30km/h.[15] Wales cut local speed limits to 20mph (~30km/h), with a reduction in casualties of 26%[27] on local roads – and over 100 Australian academics have called on Australia to allow the same.[28]
Switching 50km/h speed limits to 30km/h would protect cyclists while barely affecting commutes.[29][30] Transport for NSW does not permit local councils to independently reduce speed limits to safe speeds on any streets, including local residential, high streets or outside schools.[31][32] While requests have been made[33], I am not aware of any 30km/h request being approved since Manly in 2020.[34]
Kobi Shetty introduced an ambitious 30km/h bill in NSW Parliament on the 13th of November 2025, endorsed by the Royal Australasian College of Surgeons, the Australasian College of Road Safety, the Little Blue Dinosaur Foundation, Safe Streets to School, 30Please, Better Streets, Bicycle NSW, WalkSydney, Road Sense Australia and Doctors for the Environment Australia.[35][36][37] Some commentators have misrepresented[38] statistics of crashes in which speed ‘is considered a factor’[39][40] (ie. ‘speeding’[41]) with the impact of speeds on fatalities (speed is not “30% related to fatalities”), the statistics of pedestrian fatalities occuring on streets with 50km/h speed limits[42], and misrepresented the non-linear safety benefits of reducing speeds from 50km/h to 30km/h.[38] After previously supporting 30km/h to improve safety and increase economic activity,[43] Business Sydney now oppose safer speed limits on residential streets, claiming they would cause “red tape and confusion”.[44][45]
Messaging and infrastructure also encourages cars to take a dominant position on the road.[46][47] While Australian advertising campaigns market truck-like utility vehicles as weapons[48][49][50] there are cities around the world which have already systematically reduced road deaths to zero.[51][52]. There will never be a helmet strong enough[53][54] to protect you from a person armed (Thinkerbell’s word choice[50][55][e]) with a 2 tonne truck. Recent data from Manly shows giving people more time or opportunities to cross at traffic lights can reduce unsafe crossing by 34%[57][58], however I am not aware of plans for wide-area improvements like in 2018[59] (or open data on signals[60]).
The NSW Government wants walking and bike riding to be the preferred way to make short trips and a viable, safe and efficient option for longer trips.[61]
List of pedestrian, cyclist and personal mobility device road deaths in NSW in 2025
The following table includes media reports for fatalities of people walking, riding bicycles or using personal mobility devices, or as recorded in daily NSW Centre for Road Safety statistics. This table was last updated on 2025-12-19.
As of 2025-11-16, 51 pedestrians and 11 pedal cyclists were killed in the calendar year to midnight (up to and including November 16th).[62] It is not possible to ensure completeness as past NSW Police press releases are currently deleted or disappear after some months and daily road toll statistics are deleted daily. There appear to be some fatalities with a Police press release[63] which are not captured in the daily road toll statistics[64][65], perhaps due to being outside a surveyed road reserve.[f]
| Date | Pedestrian Fatalities | Cyclist Fatalities | Other (including e-scooters) | References | Notes / media reports |
|---|---|---|---|---|---|
| 2025-01-08 | 1 | – | – | – | On 2025-01-06 a 34-year-old man driving a car struck an 87 year old man walking on Sherbrook Avenue, Hornsby. The man walking later died.[66][67][68] |
| 2025-01-14 | – | 1 | – | – | On 2025-01-14 a 23-year-old woman driving a car struck a 79-year-old woman[69] riding her bike on the Princes Highway at Waterfall. The 79-year-old woman later died.[70][71][72] |
| 2025-01-17 | 1 | – | – | – | On 2025-01-17 a woman in her 50s driving a car struck a 54-year-old man walking at the Princes Highway, Nowra. The man later died.[73][74][75] |
| 2025-01-18 | 1 | – | – | – | On 2025-01-18 a man driving a car struck a person walking, believed to be in their 50s, at Big River Way, Glenugie. The person walking died at the scene.[76][77] |
| 2025-02-05 | 1 | – | – | – | On 2025-02-05 a 25-year-old driving a motor vehicle struck an 80-year-old man walking at John Street, Cabramatta West. The man walking later died.[78] |
| 2025-02-06 | 1 | – | – | – | On 2025-02-06 a 19-year-old man driving a ute struck a man crossing the road at Boronia Road, Greenacre. The man walking died at the scene.[79][80] |
| 2025-03-01 | – | – | 1 | – | On 2025-02-28 a 44-year-old man driving a ute struck a 32-year-old woman riding an e-scooter at the intersection of Great Western Highway and Lee Street in Bowenfels (Lithgow). The woman riding the e-scooter died at the scene.[81][82] |
| 2025-03-18 | – | 1 | – | – | On 2025-03-18 a 68-year-old man driving a ute struck a 44-year-old man riding a bicycle at the Pacific Highway, Tuggerah. The man riding the bicycle later died.[83][84] |
| 2025-03-19 | 1 | – | – | – | On 2025-03-19 a 77-year-old man driving a car struck an 80-year old man walking at Croudace Bay Road, Valentine (Lake Macquarie). The man walking later died.[85] |
| 2025-03-27 | 1 | – | – | – | On 2025-03-27 a 37-year-old woman driving a car struck a 57-year-old man walking at Carlisle Avenue, Mount Druitt, who was carrying a one-year-old baby boy.[86] The man walking died at the scene. A short time later, a man believed to be the infant’s father arrived at a hospital carrying the child who was in a critical condition.[87][88] |
| 2025-03-28 | – | 1 | – | – | On 2025-03-28 a 37-year-old acting sergeant driving a NSW Police car struck a 48-year-old man riding an e-bike at Allen Street in Waterloo. The man riding the e-bike died at the scene.[89][90] A critical incident investigation was declared and a crime scene was established.[91][92] The police car appeared to have mounted the kerb and flattened a parking sign before crossing over a footpath.[93] |
| 2025-04-28 | 1 | – | – | – | On 2025-04-28 a 34-year-old man was found dead on the roadside on Watkins Avenue in Griffith. Police stated he may have been walking to work.[94] |
| 2025-04-14 | 1 | – | – | – | On 2025-04-13 a 28-year-old man driving a car struck a 40-year-old man walking at Shellharbour Road, Barrack Heights. The man walking died at the scene.[95] |
| 2025-04-30 | 1 | – | – | – | On 2025-04-29 a 28-year-old man driving a car struck a 60-year-old woman walking at King Georges Rd in Blakehurst. The woman walking died at the scene.[96][97] |
| 2025-05-11 | 1 | – | – | – | On 2025-05-11 a bus struck a man, believed to be in his 30s, walking at Edward Street (Sturt Highway) in Wagga Wagga. The man walking died at the scene.[98] |
| 2025-05-17 | – | – | 1 | – | On 2025-05-16 a 41-year-old man riding an e-scooter crashed onto the roadway at the intersection of Kanahooka Road and Brolga Street, Kanahooka, sustaining serious injuries, and was subsequently struck by a passing vehicle. He died at the scene.[99][100] |
| 2025-05-23 | 1 | – | – | – | On 2025-05-22 a 36-year-old man driving a vehicle struck a 95-year-old man walking at Elizabeth Drive, Liverpool. The man walking later died.[101][102][103] |
| 2025-06-05 | 1 | – | – | – | On 2025-06-03 a 75-year-old man driving a vehicle struck an 85-year-old man walking at Dee Why Parade, Dee Why, near Avon Road. The man walking later died.[104][105][106][107][108] |
| 2025-06-05 | 2 | – | – | – | On 2025-06-05 a 54-year-old woman was allegedly struck by a ute on Macquarie Avenue, Penrith. The driver of the ute allegedly drove away without stopping. The woman walking died at the scene.[109][110]
On 2025-06-05 a man walking, believed to be in his 40s, was struck by a light rail carriage.[111][112] An inspector from the Surry Hills Police Area Command stated it appeared the man was trying to cross over the track between two carriages.[113] |
| 2025-06-10 | 1 | – | – | – | On 2025-06-10 a 46-year-old man was struck by a car on Junction Road, Leumeah and later died. The Police were told a pedestrian was struck by a sedan while exiting another vehicle before the sedan left the scene. The alleged driver of the sedan was arrested.[114] |
| 2025-06-17 | 1 | – | – | – | On 2025-06-16 a 70-year-old man walking was struck by a ute at the intersection of Belmont Road and Canterbury Road, Glenfield. The man walking later died in hospital. The person driving the ute allegedly failed to stop.[115] |
| 2025-06-22 | 1 | – | – | – | On 2025-06-22 a 49-year-old man driving a ute struck a 98-year-old man walking at the intersection of Cessnock Road and Kilaben Street, Awaba, New South Wales. The man walking died at the scene.[116] |
| 2025-06-24 | 1 | – | – | – | On 2025-06-24 a 60-year-old man driving a truck struck a 22-year-old man near Beresfield on the M1 motorway on Tuesday night. The man walking died at the scene.[117][118] |
| 2025-07-06 | 1 | – | – | – | On 2025-07-06 a 60-year-old man was struck by a vehicle at Raftons Road, Bangalow. He died at the scene. The vehicle left the location prior to police arrival.[119] CCTV footage was released and police addressed the media on 2025-08-27 to appeal for information about the incident.[120][121][122] The fatality prompted Byron Shire Council to vote on a suite of safety measures for the location.[123] |
| 2025-07-06 | – | 1 | – | – | On 2025-07-06 a bus struck 58-year-old man Tim Miles riding his bicycle at Bradleys Head Road, Mosman. The man riding died at the scene.[124][125][126] |
| 2025-07-13 | 1 | – | – | – | On 2025-07-12 a 26-year-old man driving a car struck a boy walking, believed to be in his late teens, at Davies Road, Padstow Heights. The boy walking died at the scene.[127][128] The man driving the car allegedly drove through a red light.[129] |
| 2025-08-03 | 1 | – | – | – | On 2025-08-03 a 21-year-old man driving a car struck a man, believed to be in his 30s, at Medowie Road, Medowie. The man walking died at the scene.[130][131] |
| 2025-08-05 | 1 | – | – | – | On 2025-08-05 a 73-year-old man struck a 91-year-old man and a 70-year-old woman walking at Sproule Street, Lakemba. The 91-year-old man was taken to hospital in a critical condition, and had died by 2025-08-09. The 70-year-old woman was taken to hospital with minor injuries.[132][133] |
| 2025-08-12 | 1 | – | – | – | On 2025-08-11 a 51-year-old man[134] was struck by a car on Springwood Road, Yarramundi (about 10km south-west of Richmond). The man died at the scene. The vehicle driver failed to stop.[135][136] On 2025-11-10 a 39-year-old man was charged.[137] |
| 2025-08-29 | 1 | – | – | – | On 2025-08-28 a 67-year-old man was struck by a car, which allegedly failed to stop, on Village Circuit, Gregory Hills. The man later died.[138][139] |
| 2025-09-04 | 1 | – | – | – | On 2025-09-03 a 24-year-old man driving a car struck a 60-year-old woman walking at Taber Place, Bradbury. The woman walking later died.[140] A later NSW Press Release appears to contain an error on which day the incident occurred.[141] |
| 2025-09-06 | 1 | – | – | – | On 2025-09-06 a 46-year-old man driving a car struck a man, believed to be in his 40s, at M1 Princes Highway, Croom, about 8km west of Shellharbour. The man walking died at the scene.[142][143] |
| 2025-09-15 | 1 | – | – | – | On 2025-09-15 a 35-year-old driver of a vehicle struck a 5-year-old child and a five-month old infant girl in a carpark outside Minto Mall. The baby died and the school-aged girl was in a serious condition.[144] |
| 2025-09-22 | 1 | – | – | – | On 2025-09-22 a 19-year-old man driving a car struck a 60-year-old man at Peter Brock Drive, Oran Park. The man walking died at the scene. It was alleged the man who died was inspecting a car which had just been hit by another car.[145][146] |
| 2025-09-26 | – | 1 | – | – | On 2025-09-26 a 66-year-old man driving a street sweeper truck collided with a man riding a bike, believed to be in his 70s, at the intersection of Boonah street, Noorebah Avenue and Kooba Street, Griffith. The man riding the bicycle died at the scene.[147][148] |
| 2025-09-30 | 1 | – | – | – | On 2025-09-29 a 57-year-old man driving a SUV struck a 66-year-old woman riding a bicycle at Barnstaple Road, Five Dock. The woman cycling later died.[149] |
| 2025-10-01 | – | 1 | – | – | On 2025-09-30 a 46-year-old man fell from an e-bike on Sandringham Street, Sans Souci. He later died.[150] |
| 2025-10-09 | 1 | – | – | – | On 2025-10-08 a 19-year-old woman driving an SUV struck an 84-year-old woman walking at Park Road, Auburn. The woman walking later died.[151] |
| 2025-10-11 | – | 1 | – | – | On 2025-10-10, police were told a 63-year-old woman was riding a bicycle down a steep hill and crashed. The woman died at the scene.[152] |
| 2025-10-22 | 1 | – | – | – | On 2025-10-22, a 65-year-old man was struck by an “E-bike” on Settlers Walk, near Greenmeadows Crescent, Toongabbie. The man later died. The rider allegedly left the scene following the crash. Following inquiries, the alleged rider (a 45-year-old man) was arrested, and “has since been released without charge pending further inquiries”.[153] Settlers Walk is a shared path.[154][155] The legality of the e-bike or type (eg. legal/shared/illegal electric motorbike) has not been published. |
| 2025-10-28 | 1 | – | – | [64][65] (no change in pedestrian fatalities [f]) | On 2025-10-28 police were told a 55-year-old woman walking was struck by a four-wheel drive at a showground on Coldstream Street, Ulmarra – about 15km north of Grafton. The woman walking died at the scene. A 50-year-old man was arrested and charged.[63][156] The woman who died was walking her dogs prior to the incident and was a former police officer.[157] |
| 2025‑10‑29 | 1 | 0 | 0 | [65][158] | On 2025-10-29 a 38-year-old woman driving a van struck a man walking, believed to be aged in his 70s, at the intersection of Ewingsdale Road and Banksia Drive, Byron Bay. The man walking later died in hospital.[159][160] |
| 2025‑10‑30 | 1 | 0 | 0 | [158][161] | On 2025-10-30 a 42-year-old man driving a ute struck a 5-year-old girl riding a scooter on the footpath outside her school at Clower Avenue, Rouse Hill. The girl later died.[162][163][164] |
| 2025-11-02 | 1 | 0 | 0 | [161][165] | On 2025-10-31 a 67-year-old woman driving a car struck a 76-year-old woman at a home at Dry Dock Road, Tweed Heads. The woman walking died on 2025-11-01.[166] |
| 2025-11-06 | 1 | 0 | 0 | [167][168] | On 2025-11-06, a man driving a material transfer vehicle struck a 45-year-old man on a construction site on New England Highway, Tarro. The man standing died at the scene.[169][170] |
| 2025-11-10 | 2 | 0 | 0 | [168][171] | On 2025-11-09 a 27-year-old man driving a car struck an 80-year-old woman walking at Durham Street, Mount Druitt. The woman walking died a short time later.[172] |
| 2025-11-11 | 1 | 1 | 0 | [171][18] | On 2025-11-11 a 33-year-old man driving a truck allegedly struck a 50-year-old man walking at the intersection of Copeland Street and Elizabeth Drive, Liverpool. The man walking died at the scene.[173]
On 2025-11-08, a 51-year-old man and a 54-year-old man, who were riding bicycles in a group, collided at Kangaloon Road, East Kangaloon, about 4km northeast of Robertson. The 51-year-old man suffered minor injuries and a possible concussion. On 2025-11-11, police were notified that the 54-year-old man had died.[174] |
| 2025-11-12 | 1 | 0 | 0 | [18][175] | On 2025-11-10 a 63-year-old man driving a school bus struck 87-year-old man Tony Pesce walking at the intersection of Kingsway and Miranda Road, Miranda. The man walking was taken to hospital in a serious condition. Police were informed on 2025-11-12 that the man walking had died.[176][177] |
| 2025-11-16 | 2[g] | 0 | 0 | [175][62] | On 2025-11-13, Police were told a 91-year-old man driving a car struck a 92-year-old man walking at St Johns Avenue, Gordon. The 92-year-old man walking was taken to hospital in a serious condition. On 2025-11-14 Police were informed the 92-year old man had died.[178]
On 2025-11-14, Police will allege a 19-year-old man driving a BMW struck a Kia Carnival driven by a 48-year-old man, which then struck a 33-year-old woman walking at the entrance of the Hornsby railway station carpark[179] on George Street, Hornsby. The woman walking was 8 months pregnant and was taken to hospital in a critical condition. The woman walking, and her unborn child, died in hospital.[180][181][182] On 2025-11-16 a 23-year-old man was found unresponsive on the side of Old Kurrajong Road at Richmond. The man died at the scene. Inquiries indicate the man was struck by an vehicle that failed to stop after the crash.[183][184][185] |
| 2025-11-18 | 1 (missing 2025-11-17 – 1 fatality over 2 days) | 0 | 0 | [62][186] | |
| 2025-11-20 | (1 fatality over 2 days) | 0 | 0 | [186](archive.org outage)[187] | |
| 2025-11-26 | 1 | 0 | 0 | [188](missing data – 1 fatality over 2 days)[189] | |
| 2025-11-30 | 1 | 0 | 0 | [190][191] | |
| 2025-12-02 | -1[h] | 1 | 0 | [192][193] | On 2025-12-02 a 28-year-old man driving a garbage truck struck[194][195][i] a man in his 30s riding an e-bike at Little Regent Street and Broadway, Ultimo. The man riding the e-bike died at the scene.[196][197][198][199]
Full summary (critique) of media reporting on this death was published under the title “Why Won’t the Media Report Accurately on Road Deaths?”[1] |
| 2025-12-09 | 1 | 0 | 0 | [200][201] | On 2025-12-09 a 25-year-old man driving a Toyota ute struck a one-year-old girl on the property of a home at Lloyd George Grove, Tanilba Bay. The toddler was taken to hospital in a critical condition where she later died.[202] |
| 2025-12-15 | 1 | 0[j] | 0 | [203][204][j] | On 2025-12-14 a person driving a Toyota FJ Cruiser struck a 42-year-old man riding a bicycle at the intersection of the Pacific Highway and Awabakal Drive, Nords Wharf in Lake Macquarie. The man riding the bicycle was taken to hospital in a critical condition and died on 2025-12-15. The driver of the car failed to stop after the crash and left the scene.[205] |
| 2025-12-18 | 0 | 1 | 0 | [206][k][207] |
List of pedestrians, cyclists and personal mobility devices road injuries in NSW in 2025
Incidents with NSW Police press releases
This list was last updated on 2025-12-19. It is not possible to ensure completeness as past NSW Police press releases are currently deleted or disappear after some months.
- 2025-02-18: On 2025-02-18 a 35-year-old woman driving an SUV struck a 10-year-old boy at North Liverpool Road, Mount Pritchard. The boy was taken to hospital in a critical condition.[208][209]
- 2025-02-24: On 2025-02-24 a car struck a 63-year-old man riding a bicycle at the intersection of Sackville Street and Hamilton Road, Fairfield. The car left the scene following the crash. A 69-year-old woman was later arrested. The man riding the bicycle was taken to hospital in a critical condition.[210][211]
- 2025-04-14: A woman standing was hospitalised, and a man driving was killed, while the man was parking their car near the boat ramp at Manns Point in Greenwich. The car struck the woman and then entered the water.[212][213]
- 2025-04-23: On 2025-04-23 a person driving a grey 2012 Ford Falcon struck a 28-year-old woman at the traffic lights at Barrenjoey Road, Mona Vale, near Park Street. The woman walking was taken to hospital in a serious condition.[214]
- 2025-05-04: A woman, believed to be in her 20s, was struck by a car at Maxwells Avenue, Ashcroft. The car had left the scene. The woman was taken to hospital in a critical condition.[215][216]
- 2025-06-01: On 2025-06-01 a 34-year-old man driving a truck struck a 40-year-old man riding a bicycle at the intersection of Bourke Street and Rainford Street, Surry Hills. The man riding the bicycle was taken to hospital in a critical condition.[217][218]
- 2025-07-01: On 2025-07-01 a 45-year-old man driving a car struck a 58-year-old man walking at Cabramatta Road, Mount Pritchard. The man walking was found unconscious and was taken to hospital in a critical condition.[219][220]
- 2025-07-14: A person riding an e-bike was struck by a car at the intersection of Clinton and Dalton Streets, Orange. A 19-year-old woman was arrested and a car from the same location was seized for investigation.[221][222] The man riding the e-bike was taken to Orange Base Hospital in a serious but stable condition and has since been released.[223]
- 2025-07-14: A 29-year-old woman walking was struck by a car at the intersection of Woodville Road and Kirrang Avenue, Villawood. She was taken to hospital in a critical condition. Police were informed “that the woman was allegedly on a pedestrian crossing facing a green walk signal when she was struck by a blue Hyundai hatch back that had proceeded through a red traffic control signal.” The driver allegedly failed to stop. A 34-year-old man was later arrested.[224]
- 2025-07-19: On 2025-07-19 a 33-year-old man driving a car struck a 86-year-old man walking at Botany Road, Botany. The man walking was taken to hospital in a critical condition.[225][226]
- 2025-07-25: Police charged that on 2025-07-25 a 39-year-old male constable struck a 55-year-old woman walking in a carpark in Dubbo before driving from the scene.[227]
- 2025-08-07: On 2025-08-07 a 32-year-old man driving a car struck a 29-year-old man walking. Police were told the vehicle was allegedly performing burnouts. The man walking was taken to hospital in a critical condition.[228][229]
- 2025-09-03: On 2025-09-03 a 24-year-old man driving a car struck a women, believed to be in her 60s, at Taber Place, Bradbury. The woman walking was taken to hospital in a critical condition.[230][231]
- 2025-09-06: On 2025-09-06 police were told 37-year-old man driving a car crashed into another vehicle before continuing into a fence at Bourke Street, Dubbo, and then collided with an 87-year-old and 85-year-old woman. The 87-year-old pedestrian was found laying on the road with serious internal injuries and a hand injury. The 85-year-old woman had suffered a head injury. Both people walking were taken to hospital in a stable condition.[232][233][234]
- 2025-09-25: On 2025-09-25 a 56-year-old man driving a car struck a 61-year-old man crossing Victoria Road, Rozelle. The man walking was taken to hospital in a stable condition.[235][236]
- 2025-10-28: A 36-year-old man driving an A-Double truck struck a 12-year-old boy riding a bicycle at King Street, Warrawong.[237] ABC News reported that the truck was a B-Double and the boy was treated for injuries to his head, hand and pelvis before being airlifted to a hospital.[238]
- 2025-10-22: A 26-year-old woman riding an e-bike crashed into a stationary caravan on Cowper Street, Carrington. She was taken to hospital with life-threatening injuries.[239]
- 2025-11-05: On 2025-11-05 a 59-year-old woman driving an SUV struck a 24-year-old woman and a 47-year-old man on the footpath outside the entrance of Concord Hospital on Hospital Road, Concord. They were both seriously injured. They were both employees of Concord Hospital.[240]
- 2025-11-06: On 2025-11-06 police received reports of a car striking a 53-year-old male walking at the intersection of Endeavour Place and Solander Street, North Albury. The man walking suffered serious injuries to his leg and was taken to hospital. The car allegedly left the scene. On 2025-12-17 a 24-year-old man was arrested in Victoria on unrelated matters, extradicted to NSW on 2025-12-18 and changed with relevant offences.[241]
- 2025-11-07: On 2025-11-07, two people in their 20s or 30s driving an SUV and a sedan car crashed at the intersection of Bungaribee Road and Lock Street, Blacktown. One car mounted the kerb and struck three people standing. All three people standing were believed to be in their 20s and 30s. All people who were standing are in a critical condition.[242][243] On 2025-11-12, one of the car drivers was arrested and charged.[244]
- 2025-11-12: On 2025-11-12, police were told that a woman allegedly drove her car at a 14-year-old boy riding an e-bike at Elsdon Street, Redhead (Lake Macquarie). The 14-year-old boy jumped from the bike to avoid the impact, however the e-bike was dragged for approximately 30 metres and extensively damaged. The boy sustained minor lacerations and bruising. The woman driving the car allegedly left the scene, and was later arrested.[245]
- 2025-11-14: On 2025-11-14, a young person riding a moped struck a 3-year-old girl on a footpath at Popondetta Rd, Dharruk. At the time the child was in company with a 31-year-old woman who was uninjured. The young person riding the moped continued without stopping. The child was taken to hospital and treated for minor injuries. The moped was allegedly found abandoned at a reserve near Luxford Avenue, Whalan, and a 13-year-old boy was arrested nearby.[246]
- 2025-11-15: On 2025-11-15 a 27-year-old man[247] driving a car at the Walcha showground on Derby Street crashed through a fence and hit a mobile grandstand, striking a crowd of people. The driver may have been unconscious.[248] Thirteen people were injured. Police reported that one was injured critically and one man sustained serious injuries. 11 people were taken to hospital.[249][250]. The Guardian reported two people were in a critical condition and six had serious injuries.[251]
- 2025-11-16: Police were told on 2025-11-16 that men (56-year-old, 39-year-old and a teenage boy (15-year-old) become involved with an argument with the driver of a ute at Lakes Way at Darawank, 10 km from Forster. Police will allege that after the ute driver deliberately rammed the sedan, the two men in the sedan got out and the driver of the ute drove over them. Both the adult men who were run over were taken to hospital and as of 2025-11-17 are in a serious but stable condition. The 15-year-old boy was treated for facial injuries.[252]
- 2025-12-01: On 2025-12-01 a person driving a vehicle struck a 10-year-old boy riding an e-scooter at Broughton Street and Stanley Street, Concord. Police were informed the boy was on a crossing at this location.[253]
- At the junction of Broughton Street and Stanley Street there is a raised zebra crossing, and a (segregated) cycleway crossing next to it (OSM Map, Google Street View). Cycling or scooting across a bike lane crossing (ie. a green painted crossing) without dismounting (walking) is legal.
- The Burwood Policy Area Command used the post announcing the crash to remind “the public to exercise caution when using e-scooters and to ensure they are operated safely and legally”, to “obey road rules, and avoid high-risk areas”.[253]
- A new raised pedestrian and cyclist crossing was constructed on Broughton Street in early 2024.[254]
- 2025-12-04: On 2025-12-04 a man, in his 20s, driving a truck struck a man in his 50s riding an e-bike at Barrenjoey Road, Mona Vale. The man riding the e-bike was taken to hospital in a critical condition.[255] “multiple Triple Zero (000) calls were made to report a man riding an e-bike had been hit by a four-tonne (4t) delivery truck”[256]
- 2025-12-08: On 2025-12-08 a man driving a 48-year-old man was involved in a “minor crash” with two 15-year-old boys riding e-bikes at the intersection of New South Head Road and Newcastle Street, Rose Bay. All parties then allegedly became involved in a physical altercation where a number of bystanders intervened. NSW Ambulance paramedics treated the driver at the scene before he was taken to hospital for minor head injuries. One of the boys has been charged with destroy or damage property and common assault.[257]
- Further details of the crash are unclear. The Sydney Morning Herald reported “Police were called to Rose Bay following reports two 15-year-old boys on bikes had crashed into a car driven by a 48-year-old man, sparking a physical altercation with bystanders.”[258] Contradictory eyewitness accounts were published on an OnScene Bondi Community News Group post. One claimed “Near Parisi the car driver did not give the 1 meter distance from the bikes which lead to arguments with one of the two boys. The driver tried to run over one of the boys and he did even reverse into the bike which led to retaliation by the older boy”.[259]
- 2025-12-09: On 2025-12-09 a man driving a ute (believed to be in his 20s) struck a man (believed to be in his 40s) riding a bicycle at the intersection of Ramsgate Road and The Promenade, Sans Souci. The man riding the bicycle was treated for serious injuries before being taken to hospital in a critical condition.[260]
- 2025-12-10: On 2025-12-10 a 17-year-old boy driving a ute struck a 86-year-old man at Pioneer Drive, Blackbutt (Shellharbour). The man walking was struck while crossing a driveway, and was taken to hospital in a critical condition.[261]
Incidents reported in the media
Note: This section is not complete or up to date, and it is impossible to ensure completeness. Some geographical areas may be over-represented due to availability of local media reports in the absence of press releases. It is less complete than the above lists – Transport for NSW states that more than 1100 pedestrians are struck by motor vehicles on NSW roads each year.[22]
- 2025-01-27: On 2025-01-27 a person driving a car struck a 15-year-old boy at North Steyne, Manly, at The Corso. The person driving the car allegedly left the scene without stopping. The boy was taken to hospital in a stable condition.[262]
- 2025-03-27: On 2025-03-27 a teenage boy riding an e-bike, who appeared to be around 15-years-old, struck a 7-year-old girl at Bungan Street, Mona Vale. Bystanders said the boy had been riding through the arcade between Bungan Street and Akuna Lane. The girl was taken to hospital in a stable condition.[263]
- 2025-03-31: On 2025-03-31 a young female driving a black 2012 Mercedes sedan struck a 62-year-old woman at Pittwater Road, Collaroy, between Ramsay and Frazer Streets. The woman had been sent flying by the collision and was found unconscious on the road. The woman remained with the Intensive Care crew for transport to hospital in a stable condition. There are no pedestrian crossings on Pittwater Road between Collaroy Street, Collaroy, and Mactier Street, Narrabeen, and it is common for people to cross the six lane road using the median strip as a pedestrian island.[264]
- 2025-07-11: On 2025-07-11 a person driving a car struck a 6-year-old boy riding an e-scooter at Musgrove Crescent in Doonside. The boy riding the scooter was taken to hospital in a serious condition.[265]
- 2025-10-03: On 2025-10-03 a 28-year-old man driving a motorcycle struck a 53-year-old man crossing the road at Condamine Street, Manly Vale, near Koorala Street. The man walking was in a critical condition and placed into an induced coma. The man driving the motorcycle had minor injuries.[266]
- 2025-11-03: On 2025-11-03 a person driving a car struck a man in his 80s walking at the intersection of Pittwater Road and Mitchell Road, Brookvale. NSW Police and NSW Ambulance attended. After assessment by paramedics he was taken to hospital in a stable condition.[267]
- 2025-09-15: On 2025-09-15 a 20-year-old male riding a bicycle downhill struck a roadside barrier and was knocked unconscious near West Head lookout at Ku-ring-gai Chase National Park. The man was taken to hospital in a serious but stable condition. There is no indication a motor vehicle was involved.[268]
- 2025-09-15: On 2025-09-15 a person driving a car struck a person walking near Yerin Bridge, Springfield. The person walking was taken to hospital.[269]
- 2025-10-17: On 2025-10-17 an 81-year-old man driving a car struck a 14-year-old girl and a 16-year-old girl walking at Main Street, Lithgow. Both girls were taken to hospital. One girl was transferred via helicopter from a local hospital to Westmead Children’s Hospital.[270][271]
- 2025-11-06: On 2025-11-06, a person driving a car struck a 34-year-old man at Kite Street, outside Factory Espresso, Orange. The man walking was pinned against a wall and was taken to hospital in a serious but stable condition.[272]
- 2025-11-14: On 2025-11-14, a person driving a car struck a 10-year-old boy riding a bicycle at Avalon Parade, Avalon Beach. The person driving was reversing out of a driveway. The boy was taken to hospital in a stable condition.[273]
- 2025-11-14: On 2025-11-14 a person driving a motorbike struck a 4-year-old girl walking at Popondetta Road in Dharruk. Officers allege a young person on the trail bike continued riding without stopping. The girl was taken to hospital.[274]
- 2025-11-15: On 2025-11-15 a person driving a vehicle struck at woman, in their 50s, walking at Ferguson Street, Forestville. The woman walking was assessed by paramedics for possible hip and spinal injuries, and taken to hospital in a stable condition. NSW Police and NSW Ambulance attended.[275]
- 2025-11-16: On 2025-11-16 a 35-year-old man riding an e-bike struck a 25-year-old person walking at Flood St in Bondi. The woman walking was taken to hospital in a serious but stable condition.[276]
- 2025-12-10: On 2025-12-10 at 19:04:58, a person riding a motorbike was recorded allegedly pushing Daas Jabbour off his bicycle while he was riding on the M7 cycleway (an off-road bike path) at Rooty Hill. Daas stated one motorbike rider filmed while a second motorbike rider used his leg to push him off his bike, and footage of him in hospital is shown. 7 News reported 3 other cyclists reported being attacked on the same night, one of which suffered serious injuries.[277]
- 2025-12-13: On 2025-12-13 a 78-year-old person driving a car crashed into a busy Vietnamese restaurant in Campbelltown. A 45-year-old woman walking past was struck. Eyewitness accounts describe the woman being face down and unable to move, and was taken to hospital with minor injuries. No people were dining in the car’s path when it crashed through the restaurant.[278]
NSW Centre for Road Safety Statistics
Eligibility of fatalities reporting in daily statistics
Fatalities are removed from daily NSW Centre for Road Safety statistics[279] if subsequent police or coronial investigation shows that they did not fall within National reporting guidelines. Fatalities are added from a crash occurring prior to the day’s date where a person subsequently dies within 30 days or the crash is reported late. Fatalities are deaths which occurred within 30 days of a crash as a result of injuries received in the crash. The crash must have occurred within the surveyed road reserve.[161]: 1
Daily publication of statistics
Daily road fatality statistics are deleted daily. Updates are published in the morning and afternoon. Morning statistics documents are one page long.[280] Additional information about the change in fatalities across all modes, such as road user class, age group, gender and urbanisation (metropolitan vs regional) is included in documents published in the afternoon.[161]: 5
Publication of Police press releases
As of November 2025, NSW Police press releases are deleted or disappear after some months, and return “Oops, we appear to be experiencing technical difficulties”.[70][74][77][101] NSW Police press releases are republished by other news organisations. For example, Mirage News articles republishing these press releases include a link to the original press release, and where NSW Police press releases are still available, the body text is identical.[156][63]
Language
It is my goal to use accurate, factually correct and appropriate language in this page. I have followed Australian and international road safety communication guidelines.[281][282][283][284][285][286] Any corrections or suggestions on language are much appreciated.
Use of the term ‘road toll’
‘Road toll’ is a legacy term. While the term is still sometimes used, most agencies instead using the phase “road deaths”[10], “road fatalities”[284][287], or “road trauma”.[288] The problem with talking about ‘road toll’ is that “it implies that road trauma is an acceptable cost of having roads.”[289] Journalists[290][291][292] and media reporting guidelines suggest not using the term.[284]
Use of the term ‘jaywalking’
The term ‘jaywalking’ has plenty of historical, derogatory and racial baggage. The term jaywalk “is not a historically neutral—one”. In the 1920s, the term “jaywalking” was created by the auto industry to shift blame for pedestrian deaths from cars to the pedestrians themselves.[293][294][295][296][297][298][299][300][301] Originally an insult against bumptious “jays” from the country who ineptly gamboled on city sidewalks, it was taken up by a coalition of pro-automobile interests in the 1920s.[293][298] In 1915, when New York City’s police commissioner Arthur Woods sought to apply the word “jaywalker” to anyone who crossed the street at mid-block, the New York Times protested, calling it “highly opprobrious” and “a truly shocking name.”[302]: 15 [303][304]
The term “jaywalking” is an American term used for when pedestrians illegally cross the road at places other than intersections and zebra crossing, which is not illegal in NSW or Australia[305] (for the exact details of the rules, see part 14 of the NSW road rules). “Jaywalking” is not a legal term in NSW[306] or Australia.[307] Victoria Walks have stated “No-one in Australia should use the word ‘jaywalking.'”[308]
Australian writers should describe the specific pedestrian offence defined in the NSW Road Rules[309][310] if possible, or use perhaps use the term ‘crossing against the light’[307][311][312][313][314][315] or ‘illegal pedestrian crossing’.[316] Other terms in use are ‘unsafe crossing’[317][318]: 200 [319] and ‘unsafe crossing behaviour’.[320][318]: 60 [321][322]
Footnotes
- ↑ Personal correspondence
- ↑ 38 deaths in 12 months to 2024-11-11 to 58 deaths in 12 months to 2025-11-11
- ↑ 158 to 166 deaths
- ↑ 4 to 12 deaths
- ↑ I appreciate that Little Black Book at least replaced “arms” with “gives” in their republication of Thinkerbell’s press release[56]. Language is important, and advertising agencies know this better than anyone.
- ↑ 6.0 6.1 6.2 The daily report states “The crash must have occurred within the surveyed road reserve” to be included in daily statistics. BITRE monthly bulletins state “…a death is classified as resulting from a road crash if the crash occurred on a public road…”
- ↑ This doesn’t appear to include all three fatalities in police reports over the weekend
- ↑ Note that Preliminary pedestrian fatalities changed from 55 to 54. See the Preliminary Data heading in either document for why this occurs.
- ↑ AAP News changed their wording from the rider “…slamming into a garbage truck…” to “An e-bike rider is dead after being hit by a garbage truck…” at 2025-12-02 13:14[195]
- ↑ 10.0 10.1 TfNSW daily stats show 1 pedestrian fatality and zero cyclist fatalities between 2025-12-12 and 2025-12-15 (inclusive), however Police were notified of cyclist fatality 2025-12-15 9:15. It is unclear why this fatality appears to be excluded from statistics.
- ↑ Note: pedal cyclist fatality statistic reduced from 12 on 2025-12-11[203] to 11 on 2025-12-18.[207] This may be due to the crash occurring outside a surveyed road reserve.[f]
References
- ↑ 1.0 1.1 Jake Coppinger (2025-12-04). “Why Won’t the Media Report Accurately on Road Deaths?”.
- ↑ “Road Deaths Australia—Monthly Bulletins”. Bureau of Infrastructure and Transport Research Economics. ISSN 1449-1168.
- ↑ 3.0 3.1 Jamie van Geldermalsen (2025-10-29). “The ABC is wrong about e-bikes (again)”. WalkSydney.
- ↑ “Pedestrian Deaths (correction)”. ABC News. 2025-08-27. Archived from the original on 2025-11-02.
- ↑ Bureau of Infrastructure and Transport Research Economics. “Road Deaths Australia – July 2025” (PDF). Commonwealth of Australia. p. 4. Archived (PDF) from the original on 2025-08-18. Retrieved 2025-11-02.
- ↑ Robert Lechte (2023-07-21). “Victim blaming has made cars the biggest killer of children in Australia”. Crikey. Archived from the original on 2025-07-29.
- ↑ Katrina Strickland (2025-11-08). “Use your head, cyclists – before it hits the pavement”. Sydney Morning Herald. Archived from the original on 2025-11-08. Note: This article includes a stock image from NYC where helmets are not mandatory while riding a bicycle (or while walking, or while driving a car).
- ↑ “Eliminating the hazard is the most effective way to manage risks”: SafeWork NSW. “Hierarchy of Risk Control Measures” (PDF). NSW Government.
- ↑ “You should always aim to eliminate risks, as this is the best way to manage risk. If you can’t eliminate risks, you must minimise risks so far as is reasonably practicable”: Safe Work Australia. “Identify, assess and control hazards – Managing risks”.
- ↑ 10.0 10.1 Bureau of Infrastructure and Transport Research Economics. “Monthly road deaths”. Commonwealth of Australia.
- ↑ “Annual trauma”. Bureau of Infrastructure and Transport Research Economics.
- ↑ “Road safety statistics 2023 in more detail, Figure 3: Collision matrix (all roads)”. European Commission. 2024. Archived from the original on 2025-11-07.
- ↑ Elias Visontay (2025-01-28). “Australia’s road toll hits 12-year high as pedestrian and cyclist fatalities rise”. The Guardian.
- ↑ Australian Institute of Health and Welfare. “Injury in Australia: Transport accidents”. Australian Government.
- ↑ 15.0 15.1 City of Sydney (2025-08-19). “Safe Speeds: The role of speed reduction and lower speed limits in reducing road trauma” (PDF). AITPM.
- ↑ “2026 Road Safety Action Plan – Toward zero trauma on NSW roads” (PDF). Transport for NSW. Archived (PDF) from the original on 2025-11-03. Retrieved 2025-11-02.
- ↑ 17.0 17.1 Transport for NSW (October 2025). “Connecting NSW Strategy – Priorities for Transport” (PDF). New South Wales Government. Archived (PDF) from the original on 2025-11-01. Retrieved 2025-11-02.
- ↑ 18.0 18.1 18.2 “Road Fatalities for NSW up to and including Tuesday, 11 November 2025” (PDF). Transport for NSW. 2025-11-12. Archived from the original (PDF) on 2025-11-12. Additional archives: 2025-11-12.
- ↑ Sela Musa (2025-08-21). “Pedestrian road deaths in Australia rise by 50% in 4 years”. Zag Daily.
- ↑
“Road fatalities and serious injuries have continued to trend upwards.”
“Transport for NSW Annual Report 2024–25 Volume 1” (PDF). Transport for NSW. 2025-11-21. p. 42. - ↑ “Transport for NSW Annual Report 2024–25 Volume 2” (PDF). Transport for NSW. 2025-11-21.
- ↑ 22.0 22.1 “Pedestrians”. Transport for NSW. Archived from the original on 2025-10-07.
- ↑ “National Road Safety Strategy 2021-30” (PDF). Commonwealth of Australia. 2021. p. 1. Archived (PDF) from the original on 2025-06-26.
- ↑ National Road Safety Strategy. “Fact sheet: Vision Zero and the Safe System”. Commonwealth of Australia. Archived from the original on 2025-08-30.
- ↑ 25.0 25.1 Julie Power (2025-12-12). “It took years to come up with a plan to cut road deaths, and just 11 days to kill it”. Sydney Morning Herald.
- ↑ 26.0 26.1 “Consultation Regulatory Impact Analysis: Reducing default speed limits outside of builtup areas” (PDF). Australian Government Department of Infrastructure, Transport, Regional Development, Communications, Sport and the Arts. September 2025. Archived (PDF) from the original on 2025-11-13.
- ↑ Jennifer L. Kent (2024-08-30). “Lower speeds on local streets cut deaths and injuries by a quarter in Wales. Over 100 experts want Australia to do the same”. The Conversation. doi:10.64628/AA.ntnra7rt3.
- ↑ Dr Jennifer L. Kent, Prof. Marco Amati, Prof. Hannah Badland, Prof. Michael Bell, Prof. David Bissel, Prof. Matthew Burke, Prof. Graham Currie, Prof. Melanie Davern, Prof. Hussein Dia, Prof. Melody Ding, Prof. Jago Dodson, Prof. Rae Dufty-Jones, Prof. Stephen Greaves, Prof. Nicole Gurran, Prof. David Hensher, Prof. Taha Hossein Rashidi, Prof. Joe Hurley, Prof. Kurt Iveson, Prof. David Levinson, Prof. Sue McNeil, Prof. Jaime Miranda, Prof. John Nelson, Prof. John Newman, Prof. Alexander Paz, Prof. Christopher Pettit, Prof. Philayrath Phongsavan, Prof. Libby Porter, Prof. Carlo Prato, Prof. Jason Prior, Prof. Chris Rissel, Prof. Geoffrey Rose, Prof. Teresa Senserrick, Prof. Michael Small, Prof. Mark Stevenson, Prof. Susan Thompson, Prof. Zudo Zheng, Emeritus Prof. Michael Regan, Emeritus Prof. Barry Watson, Adjunct Prof. Judy Fleiter, Assoc. Prof. Tooran Alizadeh, Assoc. Prof. Phillippa Carnemolla, Assoc. Prof. Selby Coxon, Assoc. Prof. Alexa Delbosc, Assoc. Prof. Sarah Foster, Assoc. Prof. Adrienne Keane, Assoc. Prof. Crystal Legacy, Assoc. Prof. Nancy Marshall, Assoc. Prof. Robbie Napper, Assoc. Prof. Doina Olaru, Assoc. Prof. Mohsen Ramezani, Assoc. Prof. Deena Ridenour, Assoc. Prof. Paul Roberts, Assoc. Prof. Maeed Saberi, Assoc. Prof. Paul Tranter, Dr. Amanda Alderton, Dr. Courtney Babb, Dr. Maryam Bostanara, Dr. Jane Bryant, Dr. Caitlin Buckle, Dr. Linji Chen, Dr. Rebecca Clements, Dr. Chris De Gruyter, Dr. Kasun De Silva Wijayaratna, Dr. Chirag Deb, Dr. Andres Fielbaum, Dr. Elliot Fishman, Dr. Klaus Gebel, Dr. Milad Ghasrikhouzani, Dr. Catherine Gilbert, Dr. Hulya Gilbert, Dr. Giles Giles Thomson, Dr. Ori Gudes, Dr. Patrick Harris, Dr. Kristi Heesch, Dr. Elnaz Irannezhad, Dr. Afshin Jafari, Dr. Edward Jegasothy, Dr. Annette Kroen, Dr. Edgar Liu, Dr. Melanie Lowe, Dr. Miguel Loyola Borja, Dr. Xiao Ma, Dr. Sophia Maalsen, Dr. Erica McIntyre, Dr. Jamie McKenzie, Dr. Lara Mottee, Dr. Emily Moylan, Dr. Ali Najmi, Dr. Zahra Nasreen, Dr. Deepti Prasad, Dr. Lee Roberts, Dr. Rumana Sarker, Dr. Jan Scheurer, Dr. Chris Standen, Dr. John Stone, Dr. Chao Sun, Dr. Long Truong, Dr. Greta Wener, Dr. Ian Woodcock, Dr. Yuting Zhang, Mrs. Laya Hossein Rashidi, Ms. Laura Goh, Ms. Tracy Nau, Ms. Rebecca Weiner, Mr. Nathan Pittman (August 2024). “Australia’s transport and urban researchers call on government to reduce default road speeds” (PDF). The Conversation. Archived (PDF) from the original on 2024-11-21.
- ↑ Petra Stock (2025-10-15). “Switching 50km/h speed limits to 30km/h would protect cyclists while barely affecting commutes, research finds”. The Guardian.
- ↑ Afshin Jafari; Steve Pemberton; Sapan Tiwari; Tayebeh Saghapour; Nikhil Chand; Belen Zapata-Diomedi; Billie Giles-Corti (2025-08-29). “Modelling the impact of lower speed limits on residential streets for cyclist level of traffic stress and car travel time in Greater Melbourne”. Journal of Cycling and Micromobility Research. 6. doi:10.1016/j.jcmr.2025.100085.
- ↑ “NSW Speed Zoning Standard”. Transport for NSW. 2025-09-23. p. 4.
- ↑ David Barwell (2025-06-08). “Councils want power to slash speed limits to 40km/h”. Sydney Morning Herald. Archived from the original on 2025-06-08.
- ↑ Clover Moore (October 2025). “(Untitled post)”. LinkedIn.
- ↑ “Manly slows down”. Northern Beaches Advocate. 2020-06-18.
- ↑ “Road Legislation Amendment (Speed Limits) Bill 2025”. Parliament of New South Wales. Retrieved 2025-11-14.
- ↑ “Road Legislation Amendment (Speed Limits) Bill 2025 – First Print” (PDF).
- ↑ Kobi Shetty (2025-11-13). “Road Legislation Amendment (Speed Limits) Bill 2025 – Second Reading Speech”. Parliament of New South Wales.
- ↑ 38.0 38.1
Quotes spoken by Clinton Maynard from the talkback radio segment at 15:23pm on 2GB Sydney:
- …Well we genuinely have a problem with the road toll going up year after year after years of going down. It doesn’t make a lot of sense because cars are safer than they’ve ever been. It can’t be the speed. Speed is 30% related to fatalities. But somebody’s still putting the foot down and contributing to that 30%…
- …The road toll is going up. We know that. Stats show speed amounts for 30%, contributes to 30% of fatal accidents but fatigue is a big issue. Distraction is a factor. Are we going to ban fatigue? How’s that going to work? It’s not….
- …Road safety experts will tell you that there’s a lot less chance of being seriously injured or killed when cars are traveling at 30 than 50 or 60. Sure, but there’s also less chance you’re going to be seriously injured if a car is traveling at 20 kilometers an hour or 10 kilometers an hour. You’ve got to draw the line somewhere. 30 is too low…
- …It’s an absolutely bonkers idea cutting the speed limit to 30 and I cannot find any justification for it. Because sure it is going to be safer but it’s also going to be safer at 20 kilometers an hour so you’ve got to draw the line somewhere…
- ↑ Excess and inappropriate speed are responsible for a high proportion of the mortality and morbidity that result from road crashes. In high-income countries, speed contributes to about 30% of deaths on the road, while in some low-income and middle-income countries, speed is estimated to be the main contributory factor in about half of all road crashes. “Road safety – Speed” (PDF). World Health Organization. 2004. p. 2. Archived from the original (PDF) on 2015-05-26.
- ↑ Brian Fildes (2020-03-22). “National Road Safety Strategy 2021-30 – have your say submission – Brian Fildes [SEC=OFFICIAL]” (PDF). Letter to Office of Road Safety. National Road Safety Strategy. Archived (PDF) from the original on 2025-03-30.
- ↑ Each year, speeding contributes to about 42% of road fatalities and 25% of serious injuries. Almost 128 lives are lost and 1050 people are seriously injured each year.“Speeding”. Transport for NSW. Archived from the original on 2025-04-30. Retrieved 2025-11-16.
- ↑ …The preliminary report on road fatalities in New South Wales for 2024 shows that 340 people lost their lives, and 51 of those deaths were vulnerable road users who were walking, cycling or scootering. Looking at the signposted speeds where these fatalities took place, 16 per cent were in 50 kilometres per hour zones. Kobi Shetty (2025-11-13). “Road Legislation Amendment (Speed Limits) Bill 2025 – Second Reading Speech”. Parliament of New South Wales.
- ↑ “It is time to make the speed limit 30km per hour for the whole street so that it becomes safe for cyclists and pedestrian alike. At 30 the amenity killing noise finally becomes acceptable for outdoor dining, public space activation and encourages people spurs economic activity by encouraging people to linger longer to enjoy what the Street has to offer.” “High time – the future of Oxford Street” (PDF). Business Sydney, Robertsday. November 2020. p. 12. Archived (PDF) from the original on 2024-07-05.
- ↑ Paul Nicolaou (2025-11-18). “(Untitled LinkedIn Post)”. LinkedIn. Archived from the original on 2025-11-30.
- ↑ Savannah Pocock (2025-11-25). “Sydney Business fears Greens MP Kobi Shetty’s reduced speed limit bill will halt the city”. Daily Telegraph. Archived from the original on 2025-11-25.
- ↑ Elias Visontay (2023-07-07). “Carmakers double spending on ads in Australia for SUVs and utes”. The Guardian.
- ↑ Julian O’Shea (2023-05-12). “Why is everyone buying truckzillas that are too big for our streets?”. Sydney Morning Herald. Archived from the original on 2025-07-27.
- ↑ Mostafa Rachwani; Anthony Segaert (2025-11-05). “Big car drivers ignore risks for comfort and space”. Sydney Morning Herald.
- ↑ Sara Stace (2025-11-03). “No Thanks to The Tanks”. Better Streets.
- ↑ 50.0 50.1 “The launch arms Australians and New Zealanders with a powerful vehicle”: ““BE MORE TANK” says GWM in Tank 500 Plug-in Hybrid launch”. Thinkerbell. Archived from the original on 2025-10-31.
- ↑ Aitor Hernández-Morales (2025-08-02). “Helsinki just went a full year without a single traffic death”. Politico. Archived from the original on 2025-09-13.
- ↑ Julie Power (2020-01-13). “Oslo cut road deaths to one in 2019. Can Sydney do the same?”. Sydney Morning Herald. Archived from the original on 2024-06-15.
- ↑ Tom Flood. “Enough”. Rovélo Creative.
- ↑ Tom Flood (2025-10-16). “(Untitled photo of Vision Zero Vancouver Billboard)”. Bluesky.
- ↑ “GWM RALLIES AUSSIES TO ‘BE MORE TANK’ IN TANK 500 PLUG-IN HYBRID LAUNCH VIA THINKERBELL”. Bandt. 2025-10-15. Archived from the original on 2025-11-10. Retrieved 2025-11-10.
- ↑ “‘Be More Tank’, GWM and Thinkerbell Urge”. Little Black Book. 2025-10-15. Archived from the original on 2025-11-10. Retrieved 2025-11-10.
- ↑ Daniel Lo Surdo (2025-11-17). “Why this set of Sydney traffic lights could change how we cross the road”. Sydney Morning Herald. Archived from the original on 2025-11-16. Retrieved 2025-11-17.
- ↑ Roy Brown (September 2025). “SCATS SNUG Update September 2025” (PDF). Signals New Zealand User Group.
- ↑ Jake Coppinger (2025-09-24). “Green Lights More Often: The Secret 2018 Study of Sydney’s Traffic Signals”.
- ↑ Jake Coppinger (2025-05-15). “No Signal for Pedestrian Safety: TfNSW Refuses Signal Data During National Road Safety Week”.
- ↑ “Active Transport”. Transport for NSW. Archived from the original on 2025-11-03. Retrieved 2025-11-02.
- ↑ 62.0 62.1 62.2 “Road Fatalities for NSW up to and including Sunday, 16 November 2025” (PDF). Transport for NSW. 2025-11-17. Archived from the original (PDF) on 2025-11-17. Additional archives: 2025-11-17.
- ↑ 63.0 63.1 63.2 “Man charged following fatal crash – Ulmarra”. NSW Police. 2025-10-29. Archived from the original on 2025-11-03. Retrieved 2025-11-02.
- ↑ 64.0 64.1 “Road Fatalities for NSW up to and including Monday, 27 October 2025” (PDF). Transport for NSW. 2025-10-28. p. 1. Archived from the original (PDF) on 2025-10-28.
- ↑ 65.0 65.1 65.2 “Road Fatalities for NSW up to and including Tuesday, 28 October 2025” (PDF). Transport for NSW. 2025-10-29. p. 1. Archived from the original (PDF) on 2025-10-29. Additional archives: 2025-10-29.
- ↑ “Man Dies After Being Struck By Car – Hornsby”. Mirage News. 2025-01-08. Archived from the original on 2025-11-02. Retrieved 2025-11-02.
- ↑ “Man Dies After Being Struck By Car – Hornsby”. NSW Police. 2025-01-08. [broken link]
- ↑ Gisela Payne (2025-01-09). “Man Dies After Being Struck by Car in Hornsby Incident”. Archived from the original on 2025-05-21. Retrieved 2025-11-02.
- ↑ “Driver Charged After Cyclist Dies in Waterfall Crash”. Mirage News. 2025-01-17.
- ↑ 70.0 70.1 “Female Cyclist Dies After Crash At Waterfall”. NSW Police. 2025-01-14. [broken link]
- ↑ “Female Cyclist Dies After Crash At Waterfall”. Mirage News. 2025-01-14.
- ↑ Sarah Swain (2025-01-14). “Cyclist in her 70s killed in crash south of Sydney, as driver, 23 tested”. 9News. Archived from the original on 2025-01-23. Retrieved 2025-11-02.
- ↑ “Fatal Pedestrian Crash At Nowra 17 January”. 2025-01-17. Archived from the original on 2025-11-02. Retrieved 2025-11-02.
- ↑ 74.0 74.1 “Fatal Pedestrian Crash At Nowra 17 January”. NSW Police. 2025-01-17. [broken link]
- ↑ Peter Andrea (2025-01-21). “Pedestrian killed in Nowra”. 2St News. Archived from the original on 2025-11-01. Retrieved 2025-11-02.
- ↑ “Fatal Pedestrian Crash – Glenugie”. Mirage News. 2025-01-18. Archived from the original on 2025-11-02. Retrieved 2025-11-02.
- ↑ 77.0 77.1 “Fatal Pedestrian Crash – Glenugie”. NSW Police. 2025-01-18. [broken link]
- ↑ “Pedestrian dies after crash – Cabramatta West”. NSW Police. 2025-02-07. Archived from the original on 2025-02-07.
- ↑ “Fatal crash – Greenacre”. NSW Police. 2025-02-06. Archived from the original on 2025-03-19.
- ↑ Mikala Theocharous (2025-02-07). “Man killed while crossing road in Greenacre had been visiting friend with dementia”. 9News. Archived from the original on 2025-03-21. Retrieved 2025-11-02.
- ↑ “Fatal e-scooter crash – Lithgow”. 2025-03-01. Archived from the original on 2025-03-26.
- ↑ Duncan Evans (2025-03-02). “Jessie Van Der Draay identified as Lithgow electric scooter crash”. Archived from the original on 2025-11-02. Retrieved 2025-11-02.
- ↑ “Cyclist dies following crash – Tuggerah”. NSW Police. 2025-03-19. Archived from the original on 2025-03-19.
- ↑ “Tuggerah: Nathan Scott Parker, 43, farewelled in moving funeral after tragic cycling crash”. Daily Telegraph. 2025-04-04. Archived from the original on 2025-04-04. Retrieved 2025-11-02.
- ↑ “Fatal pedestrian crash – Lake Macquarie”. NSW Police. 2025-03-21. Archived from the original on 2025-04-28.
- ↑ Inga Neilsen (2025-03-28). “Clinging to life”. 7NEWS Sydney. Archived from the original on 2025-11-02. Retrieved 2025-11-02.
- ↑ “Fatal pedestrian crash – Mt Druitt”. NSW Police. 2025-03-27. Archived from the original on 2025-04-15.
- ↑ Adam Vidler (2025-03-27). “Man dead, infant fighting for life after collision in western Sydney”. 9News. Archived from the original on 2025-04-18. Retrieved 2025-11-02.
- ↑ Rafqa Touma (2025-03-27). “Man riding e-bike killed when NSW police car attempted to pull him over”. The Guardian. Archived from the original on 2025-03-30. Retrieved 2025-11-02.
- ↑ “Man dead after police car collides with e-bike in Sydney’s Waterloo”. ABC News. 2025-03-28. Archived from the original on 2025-07-23. Retrieved 2025-11-02.
- ↑ “Critical incident declared after man’s death – Waterloo”. NSW Police. 2025-03-28. Archived from the original on 2025-04-15.
- ↑ “Critical Incident Media Alert – Monitoring of Critical Incident at Waterloo”. Law Enforcement Conduct Commission. 2025-03-28.
- ↑ Riley Walter; Sally Rawsthorne (2025-03-28). “$10,000, drugs found on e-bike rider hit and killed by police car, detectives hunting CCTV of incident”. Sydney Morning Herald. Archived from the original on 2025-07-27.
- ↑ Lucy Cooper; Jess Scully (2025-04-30). “Family mourns Solomon Islander Argen Kuni, victim of suspected Griffith hit-run”. ABC News. Archived from the original on 2025-08-03. Retrieved 2025-11-02.
- ↑ “Fatal Pedestrian Crash – Barrack Heights”. Mirage News. 2025-04-14. Archived from the original on 2025-11-02. Retrieved 2025-11-02.
- ↑ Olivia Lancuba; William Tyson (2025-04-30). “Driver charged after pedestrian fatally struck by car on King Georges Rd, Blakehurst”. Daily Telegraph. Archived from the original on 2025-11-02. Retrieved 2025-11-02.
- ↑ “Police Charge Man After Fatal Crash – Blakehurst”. Mirage News. 2025-04-30. Archived from the original on 2025-11-02. Retrieved 2025-11-02.
- ↑ Andrew Mangelsdorf (2025-05-11). “Man dies after being hit by bus in Wagga Wagga”. ABC News. Archived from the original on 2025-05-18. Retrieved 2025-11-02.
- ↑ “Man Dies After Crash – Kanahooka”. Mirage News. 2025-05-17.
- ↑ Brooke Chandler (2025-05-17). “Man dies after falling from e-scooter, hit by passing vehicle in Illawarra”. ABC News. Archived from the original on 2025-11-02. Retrieved 2025-11-02.
- ↑ 101.0 101.1 “Man Charged After Elderly Man Dies in Liverpool Crash”. NSW Police. 2025-05-23. [broken link]
- ↑ “Man Charged After Elderly Man Dies in Liverpool Crash”. Mirage News. 2025-05-23.
- ↑ Richard Wood (2025-05-23). “Driver arrested over death of 95-year-old pedestrian on city street”. 9News. Archived from the original on 2025-07-21. Retrieved 2025-11-02.
- ↑ “Pedestrian dies in hospital following crash – Dee Why”. NSW Police. 2025-06-05. Archived from the original on 2025-07-19.
- ↑ “Pedestrian Dies In Hospital After Crash – Dee Why”. Mirage News. 2025-06-05.
- ↑ “Pedestrian dies in hospital”. Northern Beaches Advocate. 2025-06-05. Archived from the original on 2025-07-16. Retrieved 2025-11-02.
- ↑ “Pedestrian dies in hospital following crash – Dee Why”. NSW Police. 2025-06-05. Archived from the original on 2025-07-19.
- ↑ “Elderly pedestrian hit by car”. Northern Beaches Advocate. 2025-06-03. Archived from the original on 2025-11-15.
- ↑ “Pedestrian dies after crash – Penrith”. NSW Police. 2025-06-05. Archived from the original on 2025-07-18.
- ↑ Mikala Theocharous (2025-06-07). “Man behind bars over the alleged fatal hit-run of woman”. 9News. Archived from the original on 2025-06-09. Retrieved 2025-11-02.
- ↑ “Pedestrian struck by light rail carriage – Surry Hills”. NSW Police. 2025-06-05. [broken link]
- ↑ “Fatal Light Rail Incident – Surry Hills”. Mirage News. 2025-06-05.
- ↑ Anton Rose (2025-06-05). “Man dies after being struck by light rail carriage in Sydney’s Surry Hills”. ABC News.
- ↑ “Woman charged following alleged hit and run – Leumeah”. NSW Police. 2025-06-10. Archived from the original on 2025-07-17.
- ↑ “UPDATE: Pedestrian dies after an alleged hit-and-run – Glenfield”. NSW Police. 2025-06-17. Archived from the original on 2025-07-19.
- ↑ “Pedestrian dies after being hit by car – Awaba”. NSW Police. 2025-06-22. Archived from the original on 2025-07-18.
- ↑ Blair Jackson (2025-06-24). “NSW M1 highway blocked, man dead after being hit by truck”. Archived from the original on 2025-11-02. Retrieved 2025-11-02.
- ↑ Jessica Brown (2025-06-25). “Fatal crash closes M1 Pacific Motorway at Beresfield overnight”.
- ↑ “Pedestrian dies after hit-and-run in state’s far north”. NSW Police. 2025-07-06. Archived from the original on 2025-08-10.
- ↑ “CCTV released in fatal hit-and-run inquiry”. NSW Police. 2025-08-27. [broken link]
- ↑ “CCTV Released in Bangalow Fatal Hit-and-Run Inquiry”. Mirage News. 2025-08-27. Archived from the original on 2025-11-02. Retrieved 2025-11-02.
- ↑ Emma Rennie (2025-07-10). “Family and police appeal for information into alleged hit-and-run death in Bangalow”. Archived from the original on 2025-07-30. Retrieved 2025-11-02.
- ↑ Paul Bibby (2025-08-27). “Action on Bangalow’s blackspot”. Echo. Archived from the original on 2025-11-02. Retrieved 2025-11-02.
- ↑ “Cyclist Dies After Crash With Bus – Mosman”. NSW Police. 2025-07-06. [broken link]
- ↑ “Cyclist Dies After Crash With Bus – Mosman”. Mirage News. Archived from the original on 2025-11-02. Retrieved 2025-11-02.
- ↑ “Vale Tim Miles”. Supercars. 2025-07-06. Archived from the original on 2025-07-12. Retrieved 2025-11-02.
- ↑ “Teen killed in Padstow Heights pedestrian crash”. NSW Police. 2025-07-13.[broken link]
- ↑ “Teen Killed in Padstow Heights Pedestrian Crash”. Mirage News. 2025-07-13. Archived from the original on 2025-11-02. Retrieved 2025-11-02.
- ↑ Caleb Taylor (2025-07-13). “Teen pedestrian dies at intersection after driver allegedly runs red light in Padstow”. 7News.
- ↑ “Pedestrian dies after crash at Medowie”. NSW Police. 2025-08-03. [broken link]
- ↑ “Pedestrian Dies After Crash At Medowie”. Mirage News. 2025-08-03. Retrieved 2025-11-02.
- ↑ “Pedestrian dies after crash – Lakemba”. NSW Police. 2025-08-05.
{{cite web}}: Unknown parameter|fix-attempted=ignored (help) - ↑ “Pedestrian Dies After Crash – Lakemba”. Mirage News. 2025-08-11.
- ↑ “Man Identified After Fatal Crash At Richmond”. Mirage News. 2025-08-12.
- ↑ “Fatal hit and run crash near Richmond”. NSW Police. 2025-08-12. [broken link]
- ↑ “Fatal Hit And Run Crash Near Richmond”. Mirage News. 2025-08-12.
- ↑ “Driver charged over fatal hit-and-run in Yarramundi – Strike Force Yetmore”. NSW Police. 2025-11-11. Archived from the original on 2025-11-11.
- ↑ “Fatal Pedestrian Crash – Gregory Hills”. NSW Police. 2025-08-29. [broken link]
- ↑ “Fatal Pedestrian Crash – Gregory Hills”. Mirage News. 2025-08-29. Retrieved 2025-11-02.
- ↑ “UPDATE: Driver charged after pedestrian seriously injured – Bradbury”. NSW Police. 2025-09-04. Archived from the original on 2025-09-05.
- ↑ “UPDATE: Pedestrian dies following crash – Bradbury”. NSW Police. 2025-09-19. Archived from the original on 2025-11-02. Retrieved 2025-11-02.
- ↑ “Pedestrian Dies After Crash At Shellharbour”. NSW Police. 2025-09-07. [broken link]
- ↑ “Pedestrian Dies After Crash At Shellharbour”. Mirage News. 2025-09-07. Retrieved 2025-11-02.
- ↑ Bryce Luff (2025-09-15). “Baby killed and child seriously injured after being hit by car outside Minto Mall”. 7News. Archived from the original on 2025-09-19. Retrieved 2025-11-02.
- ↑ “Driver charged after fatal crash – Oran Park”. NSW Police. 2025-10-16. Archived from the original on 2025-11-12.
- ↑ “Police Charge Driver After Fatal Crash – Oran Park”. Mirage News. 2025-10-16.
- ↑ “Man Dies After Bike And Truck Crash – Near Griffith”. NSW Police. 2025-09-26. [broken link]
- ↑ “Man Dies After Bike And Truck Crash – Near Griffith”. Mirage News. 2025-09-26.
- ↑ “UPDATE: Woman dies following crash – Five Dock”. NSW Police. 2025-09-30. Archived from the original on 2025-11-03.
- ↑ “Fatal e-bike crash – St George”. NSW Police. 2025-10-01. Archived from the original on 2025-11-02. Retrieved 2025-11-02.
- ↑ “Fatal crash – Auburn”. NSW Police. 2025-10-09. Archived from the original on 2025-11-01.
- ↑ “Woman dies following bicycle crash – Albury”. NSW Police. 2025-10-11. Archived from the original on 2025-11-12.
- ↑ “Pedestrian dies, rider arrested following crash – Toongabbie”. NSW Police. 2025-10-24. Archived from the original on 2025-11-02. Retrieved 2025-11-02.
- ↑ “Way: Settlers Walk”. OpenStreetMap. Retrieved 2025-11-02.
- ↑ 7NEWS Australia (2025-10-24). “Pedestrian dies after e-bike collision in Toongabbie”. YouTube.
- ↑ 156.0 156.1 “Man charged following fatal crash – Ulmarra”. Mirage News. 2025-10-29.
- ↑ “Man charged with alleged hit-and-run murder of former police officer in Ulmarra”. ABC News. 2025-10-30.
- ↑ 158.0 158.1 “Road Fatalities for NSW up to and including Wednesday, 29 October 2025” (PDF). Transport for NSW. 2025-10-30. p. 1. Archived from the original (PDF) on 2025-10-30. Additional archives: 2025-10-30.
- ↑ “Pedestrian dies following crash – Byron Bay”. NSW Police. 2025-10-30. Archived from the original on 2025-11-03. Retrieved 2025-11-02.
- ↑ Hannah Ross (2025-10-30). “Byron Bay’s well-known ‘wanderer’ dies after being hit by a van”. ABC News. Archived from the original on 2025-11-06. Retrieved 2025-11-07.
- ↑ 161.0 161.1 161.2 161.3 “Road Fatalities for NSW up to and including Thursday, 30 October 2025” (PDF). Transport for NSW. 2025-10-31. p. 1. Archived from the original (PDF) on 2025-11-01. Additional archives: 2025-10-31.
- ↑ “Child dies following crash – Rouse Hill”. NSW Police. 2025-10-31. Archived from the original on 2025-11-01. Retrieved 2025-11-02.
- ↑ David Barwell; Anthony Segaert (2025-10-31). “‘My heart breaks’: Tributes to girl hit and killed by ute outside Sydney school”. Archived from the original on 2025-11-01. Retrieved 2025-11-02.
- ↑ “Girl, 5, dies after being hit by car outside school in north-west Sydney”. ABC News. 2025-10-31. Archived from the original on 2025-11-01. Retrieved 2025-11-02.
- ↑ “Road Fatalities for NSW up to and including Sunday, 02 November 2025” (PDF). Transport for NSW. 2025-11-03. Archived from the original (PDF) on 2025-11-03. Additional archives: 2025-11-03.
- ↑ “Pedestrian dies following crash – Tweed Heads”. NSW Police. 2025-11-02. Archived from the original on 2025-11-03. Retrieved 2025-11-02.
- ↑ “Road Fatalities for NSW up to and including Wednesday, 05 November 2025” (PDF). Transport for NSW. 2025-11-06. p. 1. Archived from the original (PDF) on 2025-11-06. Additional archives: 2025-11-06.
- ↑ 168.0 168.1 “Road Fatalities for NSW up to and including Thursday, 06 November 2025” (PDF). Transport for NSW. 2025-11-07. p. 1. Archived from the original (PDF) on 2025-11-07. Additional archives: 2025-11-07.
- ↑ “Man dies after workplace incident – Tarro”. NSW Police. 2025-11-07. Archived from the original on 2025-11-09.
- ↑ Keely Johnson (2025-11-07). “Worker dies after being hit by vehicle at New England Highway construction site”. ABC News.
- ↑ 171.0 171.1 “Road Fatalities for NSW up to and including Monday, 10 November 2025” (PDF). Transport for NSW. 2025-11-11. p. 1. Archived from the original (PDF) on 2025-11-11.
- ↑ “Woman dies following crash – Mt Druitt”. NSW Police. 2025-11-10. Archived from the original on 2025-11-11.
- ↑ “Pedestrian dies following crash – Liverpool”. NSW Police. 2025-11-11. Archived from the original on 2025-11-12.
- ↑ “Man dies following bicycle crash – Southern Highlands”. NSW Police. 2025-11-11. Archived from the original on 2025-11-12.
- ↑ 175.0 175.1 “Road Fatalities for NSW up to and including Wednesday, 12 November 2025” (PDF). Transport for NSW. 2025-11-13. p. 1. Archived from the original (PDF) on 2025-11-13. Additional archives: 2025-11-13.
- ↑ “Pedestrian dies after bus crash – Miranda”. NSW Police. 2025-11-12. Archived from the original on 2025-11-13.
- ↑ Freddy Pawle (2025-11-13). “Pedestrian hit and killed by bus in Miranda identified as father of former Sutherland Shire mayor Carmelo Pesce”. 7News.
- ↑ “Pedestrian dies after crash – Gordon”. NSW Police. 2025-11-14. Archived from the original on 2025-11-15.
- ↑ David Hirst (2025-11-15). “Man charged after pregnant woman struck by car and killed in Sydney”. ABC News. Archived from the original on 2025-11-15. Retrieved 2025-11-15.
- ↑ “Driver charged after fatal pedestrian crash – Hornsby”. NSW Police. 2025-11-15. Archived from the original on 2025-11-15.
- ↑ “Driver arrested after fatal pedestrian crash involving two vehicles – Hornsby”. NSW Police. 2025-11-15. Archived from the original on 2025-11-15.; “Driver arrested after fatal pedestrian crash involving two vehicles – Hornsby”. NSW Police. 2025-11-15.
- ↑ Kayla Olaya (2025-11-15). “‘Terrible’: P-plate driver charged after pregnant woman killed in Sydney’s north”. The Sydney Morning Herald. Archived from the original on 2025-11-15.
- ↑ “UPDATE: Man dies after suspected hit-and-run crash – Richmond”. NSW Police. 2025-11-17. Archived from the original on 2025-11-17. Retrieved 2025-11-17.
- ↑ “Man dies after suspected hit-and-run – Richmond”. NSW Police. 2025-11-16. Archived from the original on 2025-11-16.
- ↑ Jack Gramenz (2025-11-17). “Man dead in suspected Sydney hit-and-run, ute found crashed in paddock”. The Sydney Morning Herald. Archived from the original on 2025-11-17. Retrieved 2025-11-17.
- ↑ 186.0 186.1 “Road Fatalities for NSW up to and including Monday, 18 November 2025” (PDF). Transport for NSW. 2025-11-19. p. 1. Archived from the original (PDF) on 2025-11-18. Additional archives: 2025-11-19.
- ↑ “Road Fatalities for NSW up to and including Monday, 20 November 2025” (PDF). Transport for NSW. 2025-11-21. p. 1. Archived from the original (PDF) on 2025-11-21.
- ↑ “Road Fatalities for NSW up to and including Wednesday, 24 November 2025” (PDF). Transport for NSW. 2025-11-25. p. 1. Archived from the original (PDF) on 2025-11-25.
- ↑ “Road Fatalities for NSW up to and including Wednesday, 26 November 2025” (PDF). Transport for NSW. 2025-11-27. p. 1. Archived from the original (PDF) on 2025-11-27.
- ↑ “Road Fatalities for NSW up to and including Thursday, 27 November 2025” (PDF). Transport for NSW. 2025-11-28. p. 1. Archived from the original (PDF) on 2025-11-28.
- ↑ “Road Fatalities for NSW up to and including Sunday, 30 November 2025” (PDF). Transport for NSW. 2025-12-01. p. 1. Archived from the original (PDF) on 2025-12-01.
- ↑ “Road Fatalities for NSW up to and including Monday, 01 December 2025” (PDF). Transport for NSW. 2025-12-02. p. 1. Archived from the original (PDF) on 2025-12-02.
- ↑ “Road Fatalities for NSW up to and including Tuesday, 02 December 2025” (PDF). Transport for NSW. 2025-12-03. p. 1. Archived from the original (PDF) on 2025-12-03.
- ↑ William Tyson; Rory Williams (2025-12-02). “Man dies after being struck by garbage truck while riding an e-bike in Sydney’s inner city”. Daily Telegraph. Retrieved 2025-12-02.
- ↑ 195.0 195.1 Kat Wong (2025-12-02). “Speed limits urged after e-bike rider dies in crash”. AAP News. Retrieved 2025-12-02.; Kat Wong (AAP) (2025-12-02). “Speed limits urged after e-bike rider dies in crash”. The Leader. Archived from the original on 2025-12-03. Retrieved 2025-12-02.; Kat Wong (AAP) (2025-12-02). “E-bike rider killed in crash as safety warning sounds”. Yahoo News. Retrieved 2025-12-02.; Kat Wong (AAP) (2025-12-02). “Speed limits urged after e-bike rider dies in crash”. The New Daily. Archived from the original on 2025-12-02.
- ↑ “E-bike rider dies after crash with garbage truck – Ultimo”. NSW Police. 2025-12-02. Archived from the original on 2025-12-01.
- ↑ Hannah Moore (2025-12-02). “E-bike rider killed in garbage truck crash in Sydney’s CBD”. News.com.au. Retrieved 2025-12-02.
- ↑ Molly Magennis (2025-12-02). “E-bike rider killed in collision with garbage truck”. 7News. Retrieved 2025-12-02.
- ↑ “Chris Minns says NSW considering ‘serious’ change to maximum power of ebikes amid safety concerns”. The Guardian. 2025-12-02. Archived from the original on 2025-12-01. Retrieved 2025-12-02.
- ↑ “Road Fatalities for NSW up to and including Monday, 08 December 2025” (PDF). Transport for NSW. 2025-12-08. p. 1. Archived from the original (PDF) on 2025-12-09.
- ↑ “Road Fatalities for NSW up to and including Tuesday, 09 December 2025” (PDF). Transport for NSW. 2025-12-09. p. 1. Archived from the original (PDF) on 2025-12-10.
- ↑ “Toddler dies after crash – Port Stephens”. NSW Police. 2025-12-10. Archived from the original on 2025-12-10. Retrieved 2025-12-10.
- ↑ 203.0 203.1 “Road Fatalities for NSW up to and including Thursday, 11 December 2025” (PDF). Transport for NSW. 2025-12-12. p. 1. Archived from the original (PDF) on 2025-12-12.
- ↑ “Road Fatalities for NSW up to and including Monday, 15 December 2025” (PDF). Transport for NSW. 2025-12-16. p. 1. Archived from the original (PDF) on 2025-12-16.
- ↑ “Cyclist dies following fail to stop crash – Nords Wharf”. NSW Police. 2025-12-16. Archived from the original on 2025-12-16. Retrieved 2025-12-16.
- ↑ “Road Fatalities for NSW up to and including Wednesday, 17 December 2025” (PDF). Transport for NSW. 2025-12-18. p. 1. Archived from the original (PDF) on 2025-12-18.
- ↑ 207.0 207.1 “Road Fatalities for NSW up to and including Thursday, 18 December 2025” (PDF). Transport for NSW. 2025-12-19. p. 1. Archived from the original (PDF) on 2025-12-19.
- ↑ “Child critical following crash – Mt Pritchard”. NSW Police. 2025-02-18. Archived from the original on 2025-03-26.
- ↑ “Child Critical After Crash – Mt Pritchard”. Mirage News. 2025-02-18.
- ↑ “Push Bike Rider Seriously Injured In Crash At Fairfield”. NSW Police. 2025-02-25. [broken link]
- ↑ “Push Bike Rider Seriously Injured In Crash At Fairfield”. Mirage News. 2025-02-25.
- ↑ Josefine Ganko; Riley Walter (2025-04-14). “‘They love this place’: Grandparents’ daily visit to north shore fishing spot turns to tragedy”. The Sydney Morning Herald. Archived from the original on 2025-07-23.
- ↑ Jean Kennedy; Paulina Vidal (2025-04-14). “Police recover man’s body from Parramatta River after car hit woman and plunged into water”. ABC News. Archived from the original on 2025-05-23. Retrieved 2025-11-02.
- ↑ “Pedestrian hit at Mona Vale”. Northern Beaches Advocate. 2025-04-23.
- ↑ “Pedestrian Seriously Injured In Crash At Ashcroft”. NSW Police. 2025-05-05. [broken link]
- ↑ “Police Seek Leads After Ashcroft Pedestrian Hit”. Mirage News. 2025-05-05.
- ↑ “Cyclist Seriously Injured In Crash – Surry Hills”. NSW Police. 2025-06-02. [broken link]
- ↑ “Cyclist Critically Injured in Surry Hills Crash”. Mirage News. 2025-06-02.
- ↑ Fairfield City Police Area Command (2025-07-02). “Pedestrian critical following crash – Mount Pritchard”. Facebook. Archived from the original on 2025-11-02.
- ↑ Sarah Keszler (2025-07-02). “Pedestrian fighting for life after being hit by car in Mount Pritchard”. 7News. Archived from the original on 2025-07-02.
- ↑ “Rider Seriously Injured In Crash At Orange”. NSW Police. 2025-07-15. [broken link]
- ↑ “Rider Seriously Injured In Crash At Orange”. Mirage News. 2025-07-15. Archived from the original on 2025-11-02. Retrieved 2025-11-02.
- ↑ “Charges laid after e-bike rider seriously injured in crash – Orange”. NSW Police. 2025-10-30. Archived from the original on 2025-11-02. Retrieved 2025-11-02.
- ↑ “Man charged over hit-and-run – Villawood”. NSW Police. 2025-09-23. Archived from the original on 2025-11-02. Retrieved 2025-11-02.
- ↑ “Pedestrian Hit By Car In Sydney’s South”. NSW Police. 2025-07-19. [broken link]
- ↑ “Pedestrian Hit By Car In Sydney’s South”. Mirage News. 2025-07-19.
- ↑ “Officer charged after allegedly hitting pedestrian – Western Region”. NSW Police. 2025-12-19. Archived from the original on 2025-12-19.
- ↑ “Driver Charged After Pedestrian Injured in Mt Druitt”. NSW Police. 2025-08-23. [broken link]
- ↑ “Driver Charged After Pedestrian Injured in Mt Druitt”. Mirage News. 2025-08-23.
- ↑ “Pedestrian Seriously Injured – Bradbury”. NSW Police. 2025-09-03.[broken link]
- ↑ “Pedestrian Seriously Injured – Bradbury”. Mirage News. 2025-09-03.
- ↑ “Driver Charged After Pedestrian Hurt in Dubbo”. Mirage News. 2025-09-07.
- ↑ “Driver Charged After Pedestrian Hurt in Dubbo”. NSW Police. 2025-09-07.
{{cite web}}: Unknown parameter|fix-attempted=ignored (help) - ↑ Hayley Taylor (2025-09-07). “Pedestrians struck in separate NSW crashes on Dubbo footpath and M1 near Wollongong”. 7News. Retrieved 2025-12-19.
- ↑ “Pedestrian Struck by Taxi in Rozelle, Police Probe”. NSW Police. 2025-09-26. [broken link]
- ↑ “Pedestrian Struck by Taxi in Rozelle, Police Probe”. Mirage News. 2025-09-26.
- ↑ “Appeal for information following bicycle crash- South of Wollongong”. NSW Police. 2025-10-28. Archived from the original on 2025-11-03. Retrieved 2025-11-02.
- ↑ ABC Illawarra (2025-10-28). “Young cyclist collides with truck at Warrawong critical in hospital”. ABC News. Archived from the original on 2025-11-02. Retrieved 2025-11-02.
- ↑ “Investigation after man and woman seriously injured in separate traffic incidents – Newcastle”. NSW Police. 2025-10-23. Archived from the original on 2025-11-02. Retrieved 2025-11-02.
- ↑ “Two pedestrians seriously injured in crash – Concord”. NSW Police. 2025-11-05. Archived from the original on 2025-11-06.
- ↑ “Man charged following alleged hit and run in North Albury”. NSW Police. 2025-12-19. Archived from the original on 2025-12-19.
- ↑ “Three pedestrians critically injured – Blacktown”. NSW Police. 2025-11-07. Archived from the original on 2025-11-07.
- ↑ Yashee Sharma (2025-11-07). “Three tradies fight for life after being hit by car outside restaurant in Sydney’s west”. 9News. Archived from the original on 2025-11-07.
- ↑ “Driver charged after three pedestrians critically injured – Blacktown”. NSW Police. 2025-11-12. Archived from the original on 2025-11-15.
- ↑ “Woman charged after crash involving e-bike – Lake Macquarie”. NSW Police. 2025-11-13. Archived from the original on 2025-11-13.
- ↑ “Teenager charged after crash with young girl – Dharruk”. NSW Police. 2025-11-14. Archived from the original on 2025-11-15.
- ↑ “Spectators injured when car crashes into crowd at Walcha showground rally”. ABC News. 2025-11-16. Retrieved 2025-11-16.
- ↑ Josefine Ganko; Ben Cubby (2025-11-15). “‘He’s blacked out’: Demolition derby car ploughs into crowd at NSW show”. The Sydney Morning Herald. Retrieved 2025-11-16.
- ↑ “UPDATE: Thirteen injured, one critically, when speedway car crashes into crowd at Walcha”. NSW Police. 2025-11-16. Archived from the original on 2025-11-16.
- ↑ “Nine injured, one critically, when speedway car crashes into crowd at Walcha”. 2025-11-15. Archived from the original on 2025-11-16.
- ↑ Josh Taylor; AAP (2025-11-16). “Thirteen people injured after speedway car ploughs into grandstand during NSW demolition derby”. The Guardian. Archived from the original on 2025-11-16. Retrieved 2025-11-16.
- ↑ “Additional charges laid over alleged road-rage incident – Forster”. NSW Police. 2025-11-17.
- ↑ 253.0 253.1 Burwood Police Area Command (2025-12-07). “(Untitled Facebook Post)”. Facebook. Archived from the original on 2025-12-07.
- ↑ “The Cycleway Route – Concord to the Bay Run”. Canada Bay Council. 2025-12-07.
- ↑ “E-bike rider critically injured following crash – Mona Vale”. NSW Police. 2025-12-04. Archived from the original on 2025-12-04.
- ↑ “E-bike rider critically injured”. Northern Beaches Advocate. 2025-12-04. Archived from the original on 2025-12-04.
- ↑ “Teenager charged following alleged malicious damage, assault – Rose Bay”. NSW Police. 2025-12-09. Archived from the original on 2025-12-10.
- ↑ Emily Kaine (2025-12-10). “Teen faces court after eastern suburbs e-bike altercation”. Sydney Morning Herald. Retrieved 2025-12-10.
- ↑ Massimiliano Rodella (2025-12-09). “(Untitled Facebook comment, 2025-12-09 14:52)”. OnScene Bondi Community News Group (Facebook). Retrieved 2025-12-10.
- ↑ “Cyclist critical following serious crash – Sans Souci”. NSW Police. 2025-12-09. Archived from the original on 2025-12-10.
- ↑ “Appeal for information after elderly man critically injured in crash – Blackbutt”. NSW Police. 2025-12-11. Archived from the original on 2025-12-19. Retrieved 2025-12-19.
- ↑ “Hit-and-run at Manly Beach”. Northern Beaches Advocate. 2025-01-28. Archived from the original on 2025-01-28.
- ↑ “Girl knocked down by e-bike”. Northern Beaches Advocate. 2025-03-28. Archived from the original on 2025-03-28.
- ↑ “Pedestrian hit at Collaroy”. Northern Beaches Advocate. 2025-03-31. Archived from the original on 2025-03-31.
- ↑ Demi Huang (2025-07-11). “Young boy fighting for life after being hit by car while riding e-scooter”. 7News.
- ↑ “Pedestrian hit at Manly Vale”. 2025-10-04.
- ↑ “Pedestrian hit at Brookvale”. Northern Beaches Advocate. 2025-11-08.
- ↑ “Rider crashes into railing”. Northern Beaches Advocate. 2025-09-15.
- ↑ NSW Central Coast Incident Alerts, News & Information (2025-09-15). “PEDESTRIAN HIT Springfield”. Facebook. Retrieved 2025-12-01.
- ↑ Bradley Jurd; Rachel Chamberlain (2025-10-17). “New details: driver tested by police after two teenage girls hit by car”. Western Advocate. Retrieved 2025-12-01.
- ↑ Bathurst Scan. “(Untitled Facebook post)”. Facebook.
- ↑ Riley Krause (2025-11-06). “Police launch investigation after pedestrian hit by car and pinned against wall”. Central Western Daily. Archived from the original on 2025-11-06.
- ↑ “Public safety round-up”. Northern Beaches Advocate. 2025-11-15. Archived from the original on 2025-11-15.
- ↑ Emily Bennett (2025-11-14). “Four-year-old girl rushed to hospital after being hit by motorbike”. 9News. Archived from the original on 2025-11-30. Retrieved 2025-11-30.
- ↑ “Public safety round-up”. Northern Beaches Advocate. 2025-11-22.
- ↑ Freddy Pawle (2025-11-16). “Woman rushed to hospital with head injuries after being hit by e-bike in Bondi”. 7News.
- ↑ Clementine Cuneo (2025-12-14). “Motorbike gang terrorises Sydney cyclists”. 7News. Retrieved 2025-12-15.
- ↑ Brianna Jackson (2025-12-14). “Car crashes through Vietnamese restaurant after hitting woman at Campbelltown, Western Sydney”. 7News.
- ↑ “NSW Centre for Road Safety Statistics”. Transport for NSW.
- ↑ “Road Fatalities for NSW up to and including Thursday, 18 September 2025” (PDF). Transport for NSW. p. 1. Archived from the original (PDF) on 2025-09-18.
- ↑ “Using Appropriate Language in Road Safety Communication” (PDF). Australasian College Of Road Safety.
- ↑ Laura Laker. “Road Collision Reporting Guidelines”. Road Collision Reporting Guidelines, University of Westminster’s Active Travel Academy.
- ↑ Laura Laker. “What does the research tell us? Rationale for the Guidelines and references” (PDF). Road Collision Reporting Guidelines, University of Westminster’s Active Travel Academy.
- ↑ 284.0 284.1 284.2 “Media guidelines for reporting road traffic incidents” (PDF). Injury Matters. Injury Matters, Road Trauma Support WA. 2022. p. 6. Archived (PDF) from the original on 2024-06-26. Retrieved 2025-11-02.
- ↑ “10 guidelines for reporting road trauma”. Road Trauma Support Group NSW. 2025-11-04.
- ↑ “When covering car-cyclist collisions”. National Public Radio. 2023-09-07.
- ↑ “Latest weekly road fatality report”. Queensland Government.
- ↑ “Road Trauma Australia—Annual Summaries”. Bureau of Infrastructure and Transport Research Economics (BITRE). The Department of Infrastructure, Transport, Regional Development, Communications, Sport and the Arts (Australian Government). 23 September 2025. ISSN 2205-4235.
- ↑ “Lives Lost – Year to Date”. Transport Accident Commission. Victorian Government. Archived from the original on 2025-10-10. Retrieved 2025-11-01.
- ↑ Paul Daley (2023-12-23). “The ‘road toll’ is a benign term that sanitises the senseless waste of human life in Australia”. The Guardian. Archived from the original on 2024-05-29. Retrieved 2025-11-02.
- ↑ Cary Grant (2018-01-04). “Can we stop saying ‘road toll’?”. Stuff. Archived from the original on 2020-11-18. Retrieved 2025-11-02.
- ↑
…”But the nature of Australia’s road toll has changed a lot since we used to obsess over it 20 years ago, including the terminology — we call it “road deaths” now. Tolls are an unavoidable price of using roads, while we need to be more ambitious in fighting road deaths.”…
Jason Murphy (2025-12-19). “Road deaths may be rising again after falling for years. Why?”. Crikey. Retrieved 2025-12-19. - ↑ 293.0 293.1 Norton, Peter D. (2008). Fighting Traffic: The Dawn of the Motor Age in the American City. Inside Technology. MIT Press. p. 408. ISBN 978-0-262-28075-4. JSTOR j.ctt5hhckp.
- ↑ “Why Jaywalking is Called Jaywalking”. Merriam-Webster. 2025-04-28. Archived from the original on 2025-09-20.
- ↑ Brian Addison (2018-03-13). “The (Classist, Racist) History of Jaywalking”. Counterpunch. Archived from the original on 2025-07-27.
- ↑ Sarah Holder (2022-08-13). “Navigator: The Etymology of Jaywalking”. Bloomberg.
- ↑ Sarah Goodyear (2012-04-25). “The Invention of Jaywalking”. Bloomberg CityLab.
- ↑ 298.0 298.1 Tom Vanderbilt (2009-11-02). “In Defense of Jaywalking”. Slate.
- ↑ Aidan Lewis (2014-02-12). “Jaywalking: How the car industry outlawed crossing the road”. BBC.
- ↑ Joseph Stromberg (2015-01-15). “The forgotten history of how automakers invented the crime of “jaywalking”“. Slate.
- ↑ David Marr (2025-02-10). “Is it time to decriminalise jaywalking?”. ABC Radio National.
- ↑ Norton, Peter D. (2007-04-02). “Street Rivals: Jaywalking and the Invention of the Motor Age Street”. Project MUSE. Technology and Culture. 48 (2). Johns Hopkins University Press: 331–359. doi:10.1353/tech.2007.0085. S2CID 144015588. Retrieved 2021-05-27.
- ↑ “Middle-Block Crossing Is Defended”. New York Times. 1915-12-02. p. 10.
- ↑ “Crossing at the Corners”. New York Times. 1915-11-11. p. 12.
- ↑ Rudy Botha (2019-06-17). “Phone Zombies: Distracted walking or distracting discussion?”. WalkSydney.
- ↑ I am advised by the NSW Police Force that `jaywalking’ is not a specific legal term used in the Road Rules 2008. “5972 – Police and Emergency Services – JAYWALKING IN WOLLONGONG”. Parliament of New South Wales. 2014-08-06.
- ↑ 307.0 307.1 Melissa Compagnoni (2024-07-30). “Good reasons to observe the pedestrian road rules”. SBS News.
- ↑ Victoria Walks (2019-02-12). “(Untitled X / Twitter post)”. X. Archived from the original on 2025-11-19.
- ↑ “NSW Road Rules 2014 – Part 14 Rule 232 – Crossing a road at traffic lights”. NSW Legislation.
- ↑ “NSW Road Rules 2014 – Part 14 Rule 234 – Crossing a road on or near a crossing for pedestrians”. NSW Legislation.
- ↑ Eamonn Duff (2015-09-17). “Sydney pedestrian crackdown: more than 10,000 fined”. Sydney Morning Herald.
- ↑ Moylan, E; Ramezani, M; Kay, J; Levinson, D (September 2022). Interplay between intersection design, risky behaviours and pedestrian safety (PDF). Australasian Road Safety Conference. doi:10.33492/ARSC-2022. ISBN 9780648184850. Archived from the original (PDF) on 2024-10-28.
- ↑ Mr Bill Orme (2009-06-17). “INQUIRY INTO PEDESTRIAN SAFETY (MINISTERIAL REFERENCE) Walking Volunteers submission” (PDF). Parliament of New South Wales.
- ↑ “New campaign urges shoppers to cross with care”. Orange City Council. 2016-12-01.
- ↑ David Levinson (2018-03-06). “How much time is spent at traffic signals?”. Transportist.
- ↑ King MJ, Soole D, Ghafourian A (2009-05-01). “Illegal pedestrian crossing at signalised intersections: incidence and relative risk”. PubMed Central. doi:10.1016/j.aap.2009.01.008.
- ↑ “Safety around schools”. Transport for NSW. Archived from the original on 2023-10-01. Retrieved 2025-11-19.
- ↑ 318.0 318.1 “Pedestrian Bridge – across Dobroyd Parade at Waratah Street intersection” (PDF). Transport for NSW. Archived (PDF) from the original on 2025-08-13.
- ↑ “Intersection – Signalised Pedestrian crossings” (PDF). Department of Transport and Main Roads Queensland.
- ↑ Stefanova, Teodora; Burkhardt, Jean-Marie; Wullems, Christian; Freeman, James; Rakotonirainy, Andry; Delhomme, Patricia (2015). “Direct Observations of Pedestrian Unsafe Crossing at Urban Australian Level Crossing”. Urban Rail Transit. 1: 112–130. doi:10.1007/s40864-015-0022-9.
- ↑ Yang, J.; Gauli, N.; Shiwakoti, N.; Tay, R.; Deng, H.; Chen, J.; Nepal, B.; Li, J. (2025). “Examining the Factors Influencing Pedestrian Behaviour and Safety: A Review with a Focus on Culturally and Linguistically Diverse Communities” (PDF). Sustainability. 17 (13): 9. doi:10.3390/su17136007.
- ↑ Maziar Yazdani, Elnaz Irannezhad, Taha Rashidi (May 2023). “Desire Lines User Behaviour Research: Initial Scoping and Feasibility” (PDF). iMove Australia.
The post List of pedestrian, cyclist and personal mobility device road deaths in NSW in 2025 first appeared on Jake Coppinger.
]]>With such impressive results, why doesn't TfNSW do it again?
The post Green Lights More Often: The Secret 2018 Study of Sydney’s Traffic Signals first appeared on Jake Coppinger.
]]>Overnight, traffic signals across the core of Sydney’s CBD were reprogrammed to show a green light more frequently – at least every 90 seconds. This reduced the maximum wait time by a full 20 seconds (from the previous maximum cycle time of 110 seconds) for every pedestrian, cyclist and motorist.
TfNSW studied traffic patterns for 3 months afterwards in unpublished daily qualitative observation reports, sent out traffic survey experts to walk laps of streets with a stopwatch, and record any bus delays…and those results were unbelievably positive for everybody – people walking, buses and vehicles:
- People walking spent up to 40% less time waiting at traffic lights on average on some streets, and over 18% improvement on every measured street[1]: 1 (92% of trips within the Sydney city centre are on foot[2])
- “Buses continued to operate normally”[3][4], on most streets they ran faster, and on one street they arrived an average of 3.6 minutes earlier [5][4]: 5 – so much faster bus drivers were unable to drive slow enough to meet the old timetable! (only one of the streets analysed had slower buses, with <50s avg. delay behind timetable)
- Within only 8 weeks[4]: 4 , car traffic had apparently evaporated (traffic evaporation[6] is the opposite of induced demand, as per the Law of Peak-Hour Traffic Congestion (1962)[7][8]), the “Network worked well”[4]: 4 and “General traffic vehicle travel times were operating as normal with the exception of a couple locations in the CBD”[3].
- “The project has been a success”[4].
With such impressive results and a successful permanent implementation for a subset of the CBD, why doesn’t TfNSW run more cycle time reduction trials? Why not for the whole inner city, as Clover Moore formally requested almost 7 years ago?[9] Why not on every high pedestrian activity area in NSW, including urban arterials?
The number of people being killed while walking is increasing. As of 2025-09-23, pedestrian fatalities are rising 27% year on year in NSW[10] (rising over three times faster than car driver fatalities). More people walking are killed in the City of Sydney than any other LGA in NSW[11]: 6 , but the council has no power to reduce speed limits or change signal operation.[11]: 19
Despite clear evidence that shorter signal cycles reduce wait times and improve safety for pedestrians[12][13][14][15], and in their own words “Shorter wait times…could potentially reduce the risk of jaywalking and pedestrian crashes”[16][17], TfNSW has not expanded this successful program beyond the CBD in the City of Sydney. Along with the desperately needed reduction of urban state road speed limits to 40km/h[11]: 12 , why hasn’t TfNSW doubled down on this proven solution? Why isn’t TfNSW writing papers on pedestrian wait-time reduction, similar to the recent award winning study from Manchester by Josef Whitfield?[18]
Walkable and bikeable streets are good for business.[19] Improved access brings agglomeration productivity benefits: improving pedestrian connectivity and “prioritising pedestrian crossings” is action 4D of the Tech Central Economic Strategy (released this month).[20]
Improving life between buildings with walkable streets make dense neighbourhoods not just possible, but desirable. Our streets and public spaces determine whether dense development enhances or diminishes quality of life. Legacy traffic modelling recommended against pedestrianising George Street[21]: 34 , now perhaps Sydney’s greatest street.[22]
TfNSW’s Road User Space Allocation Policy states that temporal allocation should consider pedestrians before cars (and all other modes). This policy is mandatory[23] though only sometimes followed.[21] The Roads Act 1993 Review[24] should formalise the road user hierarchy into the objects and intent of the Act.[25][26][27][28][29] TfNSW could highlight the results of this project to show their international customers that the Sydney Coordinated Adaptive Traffic System (SCATS) system is able to be “policy responsive” (per their sales materials[30]).
We don’t need to wait another quarter-century to stop killing people walking on local streets – Oslo[31] (which typically uses even shorter cycle times of ~50 seconds[32]) and Helsinki[33] have already achieved zero pedestrian fatalities in one year, likely as a result of 30km/h urban speed limits, fewer cars, and shorter signal cycle times. If we want a different outcome we have to do something different – and these documents uncover just how great the change is.
The GIPA[a] 25T-1151 material suggests prioritising pedestrians can deliver measurable economic and safety benefits at minimal cost – and who doesn’t want to wait less at traffic lights?
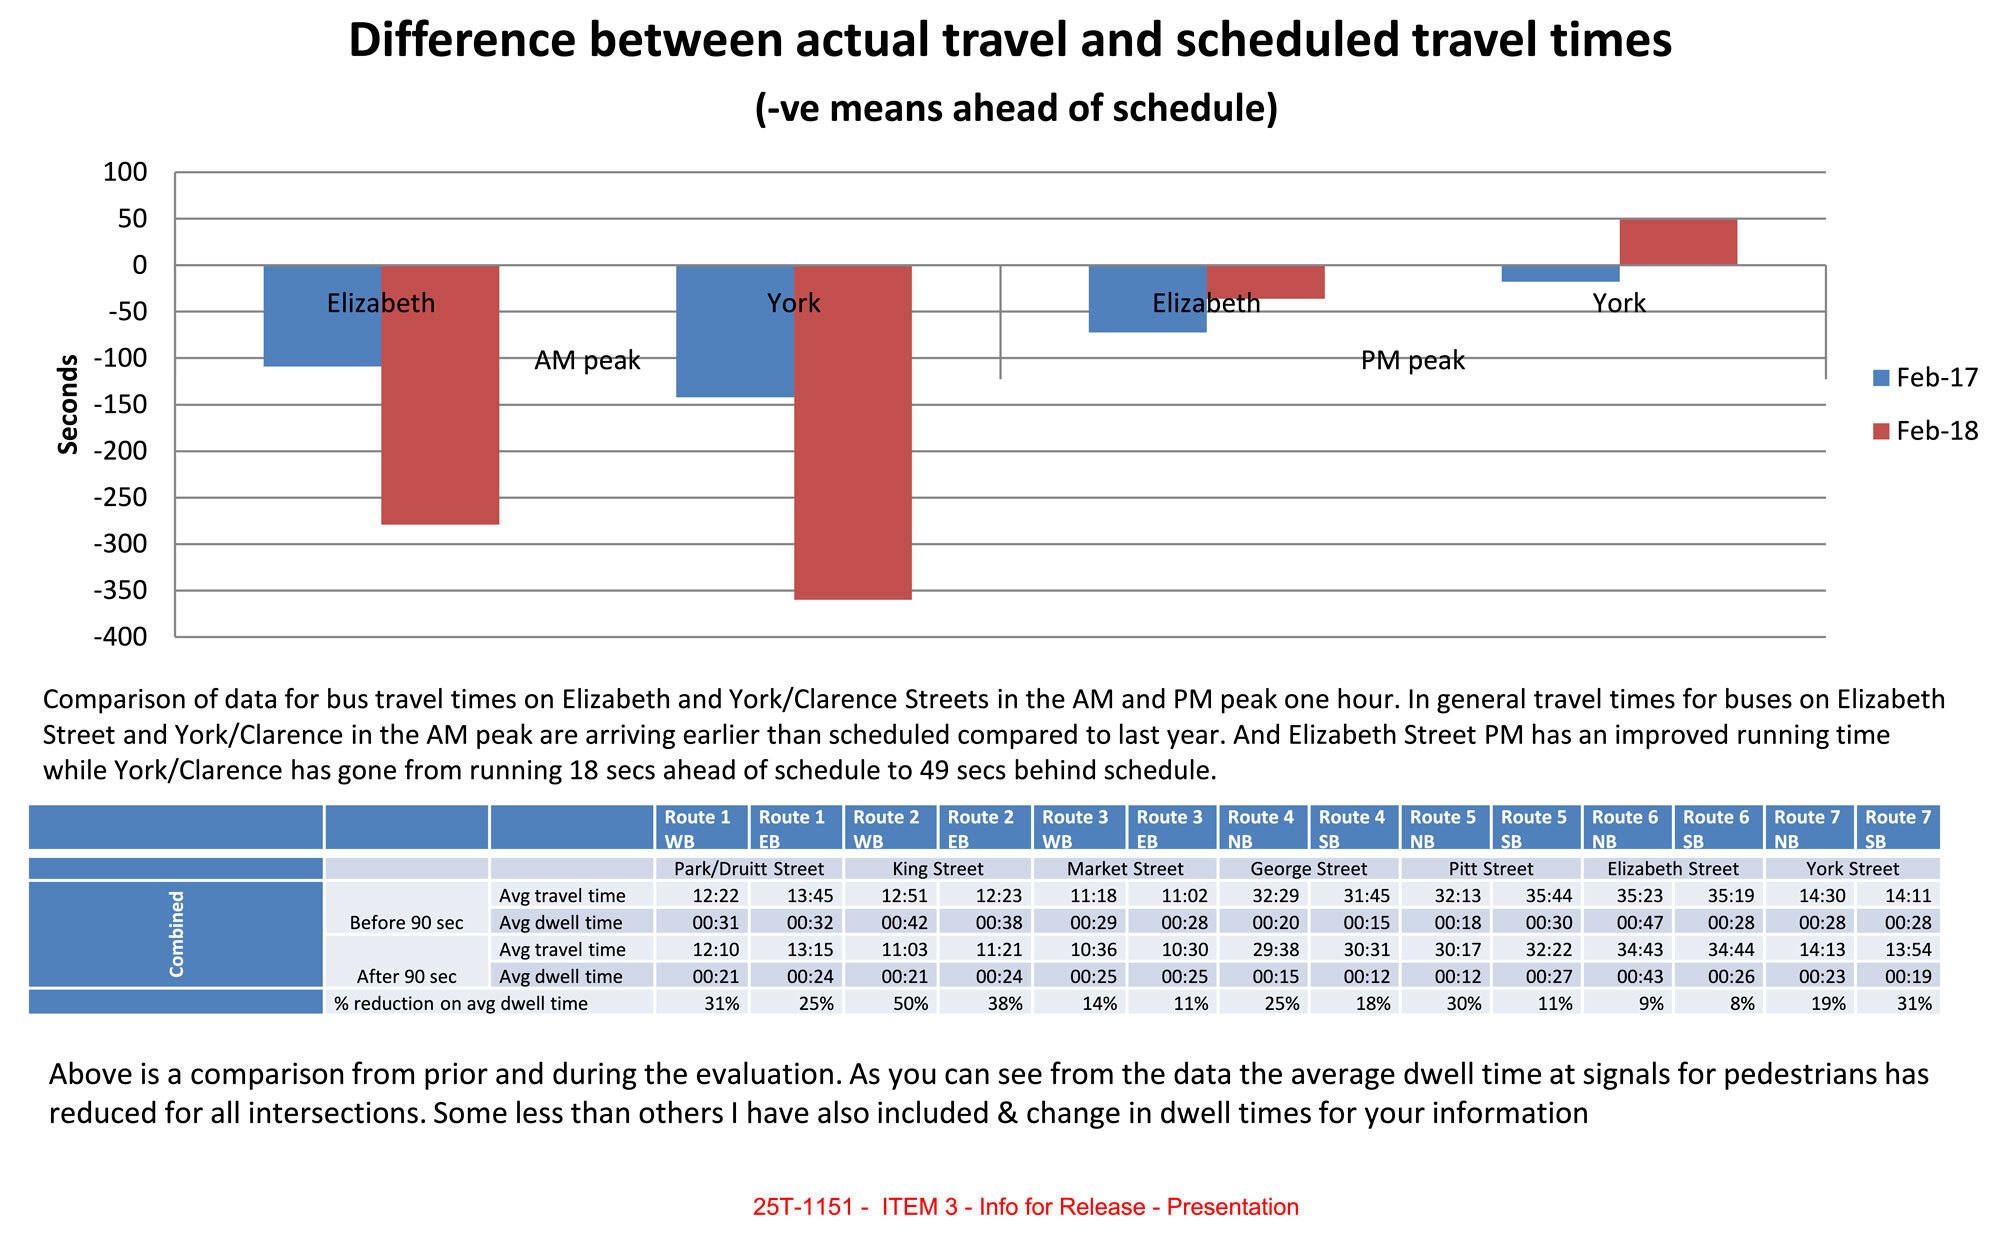
Image: Page 5 of the presentation
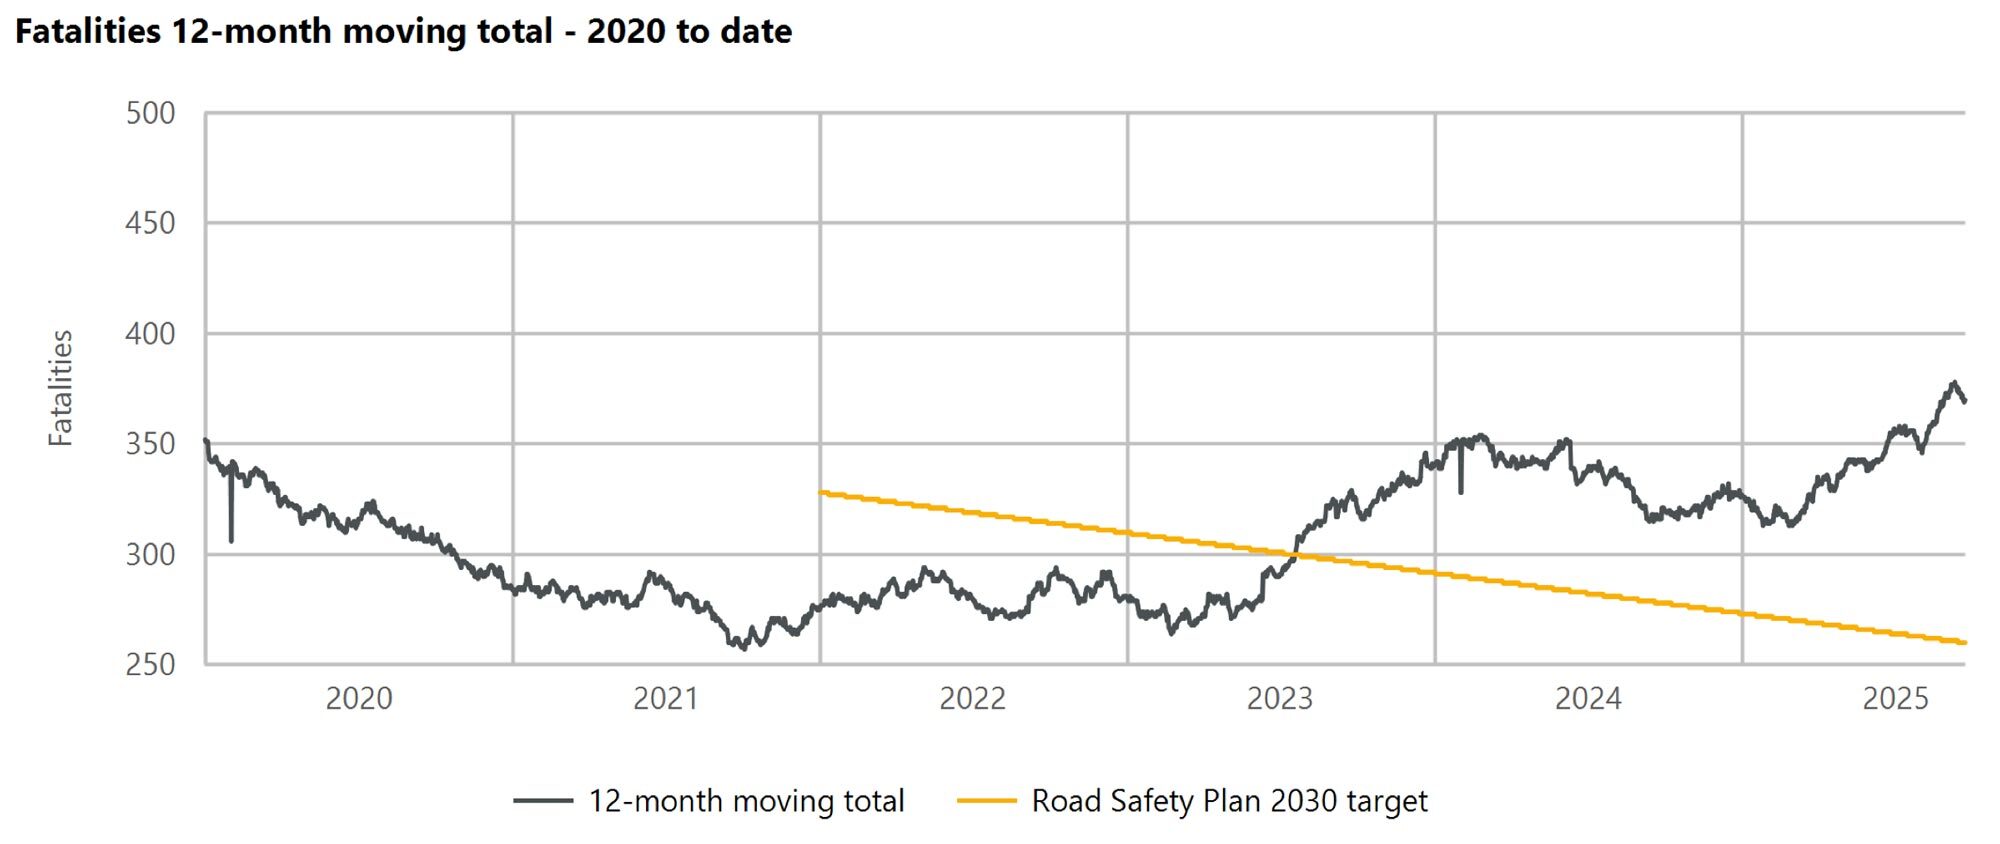
Image: NSW Fatalities 12-month moving total – 2020 to date (2025-09-23)
Overview
This analysis is a personal side-project. I initiated the information request on February 3rd 2025[34] and proceeded with the release at a personal cost of $441.
I am not a traffic engineer! If you have corrections, suggestions or constructive criticism I would greatly appreciate it. Feel free to drop a comment below or email me privately at jake@jakecoppinger.com. I have released all documents and code openly for further analysis, reproduction, and research (OCR / perceived congestion git repo, Observable visualisation notebook).
Live in Australia and want to improve your local streets? Run out of Not Just Bikes episodes to watch and want to learn how change actually happens? Join Better Streets! Drop me an email – I’ll invite you to the Slack (where the magic happens) and point you to the communities and individuals in your city/suburb to learn from and collaborate with. See their views, recommendations (and 114 business and community organisation partners so far) at https://www.betterstreets.org.au/coalition.
I worked for the past 5 years as a full-stack software engineer at Atlassian. I’m currently working on a commercial project with an organisation I’m very excited about – I’m looking forward to showcasing that work in the coming months.
I’m planning to build more commercial software in the walking / cycling / planning space. I’m pretty passionate about these fields if you didn’t gather from this blog post! See a summary of side projects I’ve worked on in the past ~5 years here.
Get in touch at jake@jakecoppinger.com or on Mastodon at @jakecoppinger@mastodon.social.
Maps
Map of Original CBD Signal Phasing Times
This map is dated 2017-11-29.[35]
Map of Revised CBD Signal Phasing Times
I previously published this map (CCO_604/005/05APR18) as a vector PDF[36] in “Shining a Light on the Traffic Signals of Sydney” (2023).[37]
Analysis 1: How much shorter could traffic signals run through their cycles in Sydney’s CBD?
One of the documents in GIPA[a] 25T-1151 is an audit of traffic signal cycle times dated November 2017.[38] This document includes a Min. time column, which appears to be the minimum possible cycle time for each signal.
Minimum cycle times specify how low cycle times can be while ensuring a safe amount of time is provided to each phase. By design, SCATS increases signal cycle time to accommodate detected vehicle volumes, until the maximum cycle time is reached. The maximum cycle time is an arbitrary ceiling set in the SCATS software to limit worst case outcomes for pedestrians and cyclists. Maximum cycle times settings of traffic signals are a numerical representation of the prioritisation of different modes of transport.
A claim advocates often hear is that traffic signal cycle times are already as low as they can be. However, this document suggests otherwise.
This analysis of TfNSW data suggests over 85% of signal sites within the CBD study area have minimum cycle times less than sixty seconds, significantly lower than the current maximum cycle time of 90 seconds (excluding sites definitely changed since 2017). In other words, most signals in the Sydney CBD could show a green light more often. It suggests TfNSW could further reduce cycle times of signals in the Sydney CBD. There is no public data showing otherwise. TfNSW has refused[39] to publish timing data on signals for anywhere in NSW – “As previously advised, Transport for NSW does not publish the SCATS Signal Phasing data you requested and currently has no plans to make this information publicly available.” (Howard Collins, Coordinator-General TfNSW, 2025-08-25[40]).
All data in this section is from 7 years ago, but it’s more than the public has ever seen before. While specific charts imply which signals have likely changed or remain the same, the only way to understand how the current situation has changed is open data on traffic signals timing in NSW.
An early draft of this analysis was presented at the 2025 TransportCamp Sydney one-day ‘unconference’[41]. Thanks to all those who have provided feedback!
I was told at this conference by a TfNSW employee that one sensitivity of open signal data was the perceived risk of private bus operators initiating legal action in the case of missed on time running targets. If a valid risk, this is certainly a perverse outcome of private bus operator contracts. I hope the (positive) results showcasing that buses ran earlier addresses this concern. In any case, from first principles – if buses are provided with a dedicated lane and there are no split failures at signals for the bus lane (i.e. as long as there isn’t a line of 10 buses), more frequent green lights should benefit buses just like pedestrians. If a bus route often runs late, buses should be provided with a dedicated lane. Such changes only require paint and software tweaks, not concrete.
Methodology
Data meaning
 Above is a screenshot of a subset of the source data.[38] : 259
The minimum cycle time is not filled for all rows. These are likely outside the study area. We can’t calculate minimum cycle times by summing phase times if some are missing, however when all phase times are present, their sum equals the minimum cycle time specified. The value under “Available green time at” … “90” … “Cycle”, when subtracted from 90, equals the minimum cycle time specified (though note when intersections are double cycled).
Without intersection diagrams, it’s impossible to know which pedestrian phases run in parallel, and with which vehicle phases.. Note Victoria[42] and WA[43] publish such diagrams openly for every single signal, and Western Australian (WA) publishes actual (as run) phase timing for throughout the day in monthly GeoParquet data dumps[44], so the resultant cycle time (including min & max) can be estimated with a high degree of accuracy.
Data extraction
The tabular data in the GIPA result was not machine readable and not easily copied/exported into a structured spreadsheet for analysis. I have generated structured JSON data from this document [38]: 258–269 using LLM-powered OCR against a TypeScript interface. I have published the the code (and output) in a git repo – it may contain errors. PRs much appreciated!
Note there are some apparently incorrect dates in the daily report titles. On some documents it appears the day was updated but the month was not. See the README.md for details on this.
All JavaScript calculations for these charts are open, reproducible, and editable on the Observable notebook for your review or further analysis.[45]
See the appendix for Overpass Turbo queries utilised for this analysis.
Interpreted data
Results / graphs
This analysis suggests over 85% of signal sites have minimum cycle times less than sixty seconds, significantly lower than the current maximum cycle time of 90 seconds (excluding sites definitely changed since 2017).
This may have changed since, perhaps due to more protected phases which may increase minimum cycle times – but there is no open data, so it is impossible for the public to confirm.
Minimum cycle times for traffic signals in the Sydney CBD
Note: as discussed above, not all of these crossings are still present (see further charts guessing at which ones are no longer present).
Histogram of minimum signal cycle times in the Sydney CBD
What percentage of signals could run faster than 90 seconds?
This table shows what percentage of signals, of this potentially valid sample (i.e. signals in the study area, excluding George St, and excluding signals where TCS site IDs no longer exist in OSM), have a cycle time less than x seconds.
Map of minimum cycle times by status in the study area
Where have signals likely changed in design since the 2017 analysis?
How many signals in the study area could still be accurate?
There is currently no open dataset of post Nov-2017 signal timing data for the study area in the Sydney CBD, so we can not tell which signals have been physically redesigned or reprogrammed.
We can reasonably assume signals have likely been redesigned (but not confirm they haven’t been) when:
- The TCS site number no longer exists (i.e. the TCS site no longer exists in OpenStreetMap)
- the intersection is on George St, which has likely been changed as a result of the light rail
This chart visualises different signal groups. These groups attempt to infer which signal sites may still be present since the 2017 data. Of course, the only way to be sure of the current signal sites, their phasing and minimum duration – is to have more recent open data.
Key meaning:
- “On George St, but still in OSM”: A signal that is located on George St, and TCS site ID matches an existing relation in OpenStreetMap (OSM) – i.e. The TCS site still exists, but we the intersection has likely been redesigned.
- “Removed from OSM & on George St”: A signal that is located on George St, but the site ID is not in OSM – so likely has been removed (eg. completely removed signal sites)
- “Site in OSM & not on George St”: TCS site present in OSM, signal not on George Street. This indicates the signal is likely to still be present. Elsewhere in this report “potentially still remaining” or similar terminology refers to this subset.
- “Site removed from OSM, but not on George St”: TCS site id not in OSM, site not on George St. Signals have likely been removed.
Do mid-block / pedestrian only signals have a lower cycle time than intersections of two roads?
Yes – see the difference in distributions for pedestrian only intersections in the dataset.
Note there are still plenty of intersections of two roads with low minimum cycle times.
Which intersections have a minimum cycle time between 80 & 90 seconds?
Does the number of phases influence the minimum signal cycle time?
In theory, yes – more phases take more time to run.
How much available green time do signals have at 90s with current double cycling?
Note: This is a different distribution to the minimum cycle time chart, as an intersection that is currently double cycled will have a much smaller available green time than 90s minus the minimum cycle time.
Minimum cycle time for intersections to be double cycled
Double cycling means two pedestrian phases can be run in one cycle, reducing the pedestrian delay (think subdividing in musical terms).
Pedestrians are guaranteed to receive a green signal at least once per cycle for some of the Sydney CBD during daylight hours (automatic introduction), however this excludes specific state roads, the locations are which are publicly unknown.
Min time for double cycling is calculated using an unknown method and stored in the source document under DC Threshold (stored under the double_cycle_cycle_length_threshold key in this export).
Map of number of phases per signal
Map of “pedestrian sites” (eg. mid-block pedestrian crossings)
Analysis 2: Graphing qualitative congestion after CBD Cycle Time reductions
By week 8 (26 Feb – 2 Mar) of the signal cycle time reduction study, the only notes for the AM and PM peaks were that the “Network worked well”[4]: 4 . Every single prior week noted perceived (qualitative) traffic or congestion issues in both AM and PM peak periods. This suggests traffic evaporation, or the inverse of induced demand, occurred after 8 weeks.
This may be comparable to the duration following the opening of the Rozelle Interchange. A 2024-02-16 NSW Government press release[46] stated that “average travel time on Victoria Road between Lyons Road at Drummoyne and Anzac Bridge during the morning peak” had dropped from 62 minutes “the first week after Rozelle Interchange opened” (opening 2023-11-26, week after 2023-11-27 – 2023-12-01), to 30 minutes the week before this press release (2024-02-05 to 2024-02-09): a period of 10 weeks. Unfortunately the dashboard has since been hidden from public view – “Access denied” (HTTP 403) as opposed to “Page not found” (HTTP 404).
The difference between signal cycle times reductions and physical reallocation of road space is that cycle times are a continuous (and trivially revertable variable) rather than a (quite literally) set in concrete step function – and if SCATS has the technical software capability, could be changed slowly rather than as an immediate step function. Such adjustments are well known to software engineers as progressive rollouts as a technique to avoid disruption.
But can we graph this change in perceived congestion?
Method
Qualitative congestion data
Unfortunately, this analysis took place before connected-vehicle telematics data was more widely available. ITEM 2 DOC A[47]is titled “Traffic Volume” (same title in the Decision[48]), has a y-axis labelled “Traffic Volume” (seemingly a veh/hr scale), however it only includes data between 2018-01-08 and 2018-01-25 – it doesn’t include data before cycle times were changed. Traffic volumes in these graphs don’t visually appear to significantly increase or decrease, however less than one month of data was included. The source of traffic volume in this figure is unclear; I assume it is SCATS-derived (loop detector derived) volumes.
The only supplied material in the documents is daily qualitative observation reports, occasionally with photos from traffic cameras or Google Maps congestion colouring.
All input data is LLM OCRed (which may contain errors) of perceived qualitative perceived congestion. This is far from a rigorous analysis.
Scoring
To attempt to graph the change in perceived congestion through the trial from the daily qualitative observation reports, I wrote a simple function to map keywords to a score.
This code has been published as open-source. See the git repo and Observable notebook for futher reproduction, analysis and improvement.
The specific function for evaluating the score (as the critical code) is included in this blog post under the appendix heading below (as well as in the repo).
Results / graphs
AM+PM Summed Arbitrary Perceived Congestion values (daily)
AM+PM Summed Arbitrary Perceived Congestion values (weekly average)
AM, PM, AM+PM Summed Arbitrary Perceived Congestion values
Policy landscape and lack of transparency
2018 request to expand 90 second phasing
Eight months after the change, the City of Sydney Council unanimously resolved to ask the Roads Minister to expand “90 second signal phasing to the whole City of Sydney local government area”[2](motion by Philip Thalis, recent Australian Institute of Architects 2024 Gold Medallist). Clover Moore wrote to the Roads Minister (Melinda Pavey) to request a broader rollout on the 8th of November 2018[9] (as discussed in the media[49][16]), but the Sydney Morning Herald reported on the 19th that “A spokesman for Ms Pavey declined to comment, saying the minister’s office had not yet received the lord mayor’s letter.”[16] I am not aware of a reply to this letter or any TfNSW consideration of a broader rollout in the City of Sydney.
The 2018 Transport for NSW Road Safety Progress report (under the “Pedestrian safety” section) even counted “Six hundred Look Out Before you Step Out pavement vinyls were installed across Sydney”, but didn’t have a single mention of this signal timing change.[50]
I am not aware of an official record identifying other 90-second timing areas elsewhere in NSW. Advocates have been told of a few locations in meetings[51]: 2 , though validating this is impossible as data on signal timing is not published.[39] Advocates have resorted to crowdsourcing signal timing, spearheaded by yours truly.[52] Wouldn’t you like to know if intersections on your local high street, or next to your children’s school, or outside your nearest hospital, have been made safer – and if not, why?
Government policy states TfNSW must “document road user space trade-off decisions, providing evidence and reasons”, and to “adhere to these principles ahead of any guidance that seeks to protect or maintain private vehicle level of service.”[23] Signal timing data is not published in NSW. As discussed in my prior analyses, [53][54][37][55][39] access to traffic signal data is prohibitively expensive ($200 per intersection[56]), for seemingly no logical reason. Other states demonstrate that publishing phase/timing data openly is feasible (“There is nothing particularly tricky happening here”[51]: 3 – WA Network Operations Analysis Manager, personal correspondence, 2025-06-06)
Temporal allocation is too important to be hidden from the public, however the December 2023 implementation review of the Road User Space Allocation Policy noted that “…temporal considerations of road space allocation are rarely discussed in the road space allocation conversation.” Finding 4.11 a) was “Our current tools and processes focus on measuring vehicle movements, and benefits such as travel time savings and safety, making it difficult to fairly assess trade-offs”, and 4.11 b) was “There was a reported lack of maturity in tools to trade-off or quantify impacts of changes to road space allocation for non-car modes”[21]
Transparency and accountability are cornerstones of good governance. Without access to data, the public cannot learn whether outcomes are improving. This is government data – taxpayers have already paid for the infrastructure and expertise that generates this data.
Formal requests for open signal phasing data
In April 2025, I wrote to TfNSW on behalf of WalkSydney (co-signed by the Presidents of WalkSydney and Better Streets) requesting publication of signal-timing data.[57] After two[58] responses[59] declining release (with factual errors we addressed in reply[60]), we met with TfNSW officers (who did not have authority to release the data).
Concerns were raised about releasing “raw” data and about complaint risk. We reiterated our view that “transparent access to data assists and is critical for citizens to understand how the Government is implementing its policies eg: TfNSW Movement & Place policy”, and that prioritisation debates should be resolved by policy, not by making changes behind closed doors.
In a subsequent letter to the we requested data for just one weekday[51].
We received a response from the Coordinator-General of Transport for NSW (Howard Collins) that “…Transport for NSW does not publish the SCATS Signal Phasing data you requested and currently has no plans to make this information publicly available.”[40]
This correspondence has been described on the WalkSydney blog.[61]
Current TfNSW initiatives to enhance pedestrian environments and improve signal priority for people walking
This response[40] outlined work-in-progress efforts to improve pedestrian priority at signals, though some have limited public visibility into their progress or data on their outcomes:
- Trial site in Manly using video density detection to dynamically extend the Green Pedestrian Symbol,
- I hope a public outcomes report is published at the conclusion of the trial. No public data of the extension in green interval amid large crowds is currently published. Keep an eye on Better Intersections at the site. I have so far measured an extension of only 3 seconds after a ferry arrived, though this was off-peak.
- 2025-10-19 edit: By detecting how many people are waiting and and prompting “longer or more frequent green signals for pedestrians”, this trial has found “in terms of safety outcomes, we’ve already seen that that’s made a 34% decrease in risky crossing behaviour.” It is the first time pedestrian measures have been used within the SCATS network to influence signal phasing.[62][63] This is an incredible result. It begs the question: what would be the safety benefit across Sydney if pedestrian signals were given longer crossing times or shorter wait (cycle) times with similar ambition to this 2018 trial?
- The Manly trial “technology would have little applicability in the CBD or areas where the maximum cycle time is very close to the minimal safety signal times permitted”[64], however this analysis page casts doubt on the claim that CBD cycle times cannot be reduced below 90 seconds. In any case, there are plenty of intersections across Sydney where additional time could be given to pedestrians without waiting for camera technology – the unstated assumption of this trial is to prioritise vehicle level of service over pedestrians when the number of pedestrians is not deemed significant (above an unpublished threshold) or where such a camera is not present: “…But it adapts back; if there’s nobody waiting, it goes back to a normal walk time, which then allows the vehicular traffic to go through.”[63]
- Sharing phasing data – as is clearly possible (“We also have a product that provides the signal phase and timing of each individual intersection and broadcasts it”[63]) but has been apparently been delayed for commercial reasons (“So we’ve got the way to do it now, the business model and how to do it is a different question”[63]) – would clear up this doubt on what can or can’t be done.
- While one expressed view is that reselling phasing data through brokers may be faster (“…I think it absolutely makes sense that there’s one source of data, but I think there are commercial imperatives that might make, that might be faster. I don’t want to cast any aspersions on the speed with which traffic authorities move”[63]), WA Main Roads released over 8GB of signal data in GeoParquet format an impressive 76 days after deciding to do so.[60]: 6 [39] I have no doubt in the technical ability of our road agencies, such ability has been acknowledged since the 70s: “the Department of Main Roads, for example (and it is typical of many others) are exceptionally well-equipped to analyze the engineering aspects of any problem”.[65]: 35 Planning decisions “…are not simply technical decisions but have environmental, social and redistributive effects which require not only technical and engineering analysis but also the broader type of policy analysis…” (1978)[65]: 34 , a sentiment which still echos today[21]: 7 .
- The Committee for Sydney also published a report on the critical role longer crossing times has for older people, carers with prams, and anyone moving with reduced mobility.[66]
- Pedestrian Protection Mass Action Program to reduce conflicts between turning vehicles and pedestrians at signalised intersections,
- The 2023 Summary Report on the program is much appreciated, and highlights some impressive improved safety outcomes.[67] (I was previously unaware of some the useful information in this report and regret not including this earlier). There is no public information about the timeline of this program, where pedestrian protection is missing, and where they will be installed in future. I am unsure if/when unprotected pedestrian crossings with long green durations (as common in Copenhagen, Paris) are/become unsafe (eg. 85th percentile speed, vehicle volumes?)
- Ongoing review and optimisation of signal timings to minimise pedestrian wait times where feasible, and
- There is no public data on when, where, how often, or the outcome of how signal timings are adjusted. There is a widely held scepticism in advocacy circles that many signals are being reviewed. In contrast, Transport for London undertakes “annual timing reviews at 1,200 signal junctions and crossings”, with reducing pedestrian wait times a (measured) objective since 2018 (7 years ago). In 2017, “TfL reduced the wait times for people walking at 200 crossing locations close to schools, hospitals and transport hubs”, published a map of the locations of these intersections, and “over 94 per cent now run a cycle time of less than one minute”, with a maximum wait time of “40 seconds or less”.[68]
- Installation of over 30 missing marked pedestrian crossings at signalised intersections in the past two years.
An Auckland traffic engineer documented in 2022 that SCATS does not natively show pedestrian delay. “data can be viewed in the Event log in SCATS history but it requires exporting and manipulation to get any usable data”.[71]
Community interest and safety context
Frustration with long pedestrian waits is well-documented. The public[55][72][73][74][75][76][77], a wide range of good-governance groups[78][26][79] [80] , media[16][81][49], councils[82][83][84][85][86], urban strategy firms[87]and evidence-based urban policy think tanks[88] are calling for improvements.
The latest road safety data is a disaster: As of 2025-09-23, pedestrian fatalities are rising 27% year on year in NSW[10] (rising over three times faster than car driver fatalities). More people walking are killed in the City of Sydney than any other LGA in NSW[11]: 6 , but the council has no power to reduce speed limits or change signal operation.[11]: 19
In 2018 SMH reported “Transport for NSW previously said the shorter 90-second wait times had kept pedestrians moving and could potentially reduce the risk of jaywalking and pedestrian crashes.”[16] A direct TfNSW spokesperson quote of “Shorter wait times have kept pedestrians moving and could potentially reduce the risk of jaywalking and pedestrian crashes” was published in 2019.[17]
Against the direction of world cities, TfNSW (with direction from Chris Minns[89]) has refused requests from councils to allow reduction of speed limits to 30km/h on local roads. Under the previous executive director Katherine O’Regan, Business Sydney described the benefits in 2020: “At 30 the amenity killing noise finally becomes acceptable for outdoor dining, public space activation and encourages people spurs economic activity by encouraging people to linger longer to enjoy what the Street has to offer.”[90]
The NSW Government 3 Star AusRAP target has been achieved or exceeded on all streets in the City of Sydney, yet people walking and riding are still being killed and injured. More people walking are killed in the City of Sydney than any other LGA in NSW. The City of Sydney is unable to change speed limits – the City of Sydney is advocating for TfNSW to set 40km/h on state roads in the local government area.[11]
Economic analysis indicates that pedestrian signal delay has significant costs. One study estimated that a 10% increase in pedestrian delays in central Melbourne would impose approximately $2.1 billion in additional time costs — about a 6.6% reduction in CBD economic output.[91][92]
Sydney Metro Conditions of Approval relation to traffic signals
Note that Sydney Metro Condition of Approval D12[93] Block 1 – 4 data includes minimum actual cycle times during AM & PM weekday peaks and weekend peaks, however these periods are likely run close to the maximum cycle time. Signal data as part of these reports is not currently public. This requirement was interpreted in the Block 1 Report[94] as measuring and preserving the vehicle Level of Service metric at nearby intersections at the expense of other modes (which, if you are a keen observer, is against the guideance of the RUSAP[23]), several of which are within the study area (CBD). Both reports contain nominal cycle times supplied for SIDRA modelling at intersections outside metro stations. Pedestrian Movement Performance levels of service output by SIDRA modelling are not discussed or included in the evaluation of intersection performance.
Advocates should be aware of Sydney Metro West CoA E126 and E124[95] and how they may interact.
US Automated Signal Performance Metrics (ATSPMs)
A transcript of the Q&A discussion[96] after a presentation hosted by The Eastern Transportation Coalition contains some great insights into the benefit of public traffic signal data and performance metrics based on such data.
The 2022 presentation was titled “Everything You’ve Ever Wanted To Know About ATSPMs: Harnessing The Power Of Automated Signal Performance Metrics For Your Agency”[97].
Q: Jeremy Borden (Alabama DOT): What is the benefit of sharing ATSPMs [Automated Signal Performance Metrics] with the public? Seems like it invites a lot of unnecessary discussions and public signal experts.
A: Mark Taylor (Utah DOT): One of the things that we are always reminded of by our director at UDOT is we are working for the public. Our revenue in government is how much the public trusts us. We try to be as transparent as we can and if there’s any data that’s not personal, we give it to the public.
A: Joanna Bush (Mead and Hunt): It’s a time saver. As a public agency, it’s your responsibility to provide this information if the public asks for it. Our signal engineers would spend a lot of time packaging crash information at signalized intersections. Instead, you can point the public to one place to get information. As Kelly said, in the end, everybody benefits from it. You’re getting free services. Somebody is looking at your efficiencies without you having to spend time analyzing them.
FAQs
Note: many signal-related FAQs are answered on my blog post “Shining a Light on the Traffic Signals of Sydney”.[37]
Why did TfNSW take the initiative to reduce cycle times?
I don’t know! None of the documents reference the light rail installation, so it doesn’t appear to be related to that.
In 2007, the public spaces and public life study by Gehl Architects included that the second highest problem in the pedestrian landscape was “Unacceptable long waiting times at intersections”. Problem #3 was “Push buttons at every intersection” and problem #4 “Unacceptable short periods for crossing streets”[98]
The TfNSW Sydney City Centre Access Strategy (2013)[99] includes “…there will be reduced waiting times for pedestrians at traffic lights”[99]: 3 and a “Key Consideration” is that “Minimising signal cycle times at intersections by simplifying intersections in terms of the turning movement required”: 28
In 2014, Alex Greenwich moved a motion that the Sydney City Centre Access Strategy is supported, and priority is given to pedestrians, including that he supports pedestrian improvements including “reducing waiting times at traffic lights”.[100]
The TfNSW Movement & Place framework and Road User Space Allocation Policy didn’t exist in late 2017, so there was no specific policy recommending temporal street space is reallocated for pedestrians.
A TfNSW spokesperson stated in a 2018 SMH article that “Shorter wait times have kept pedestrians moving and could potentially reduce the risk of jaywalking and pedestrian crashes”[101].
Transport for NSW’s coordinator-general, Marg Prendergast stated in a 2018 Guardian article that “The wait times were reduced to keep pedestrians moving and help reduce the risk of jaywalking and pedestrian crashes”[81]
In 2020 Gehl Architects included this in their 2020 Public Space & Public Life Study:[87]: 142
The reduction in waiting times has improved pedestrian amenity, however further improvements can be made. … Transport NSW have reduced pedestrian signal cycle time from 110 seconds to 90 seconds enabling more frequent crossing opportunities for pedestrians. Further changes will be explored after light rail becomes operational to ascertain further efficiencies.
Philip Thalis’ 2018 motion in the City of Sydney council mentioned “research by Transport for NSW in 2011 showed that pedestrians wait on average 50 per cent longer than motor vehicles at intersections in the city centre”[2]. Clover Moore’s letter mirrored the requests in this motion.[9]
See the Timeline section below for a brief timeline of events.
Sydney City Centre Capacity Improvement Project
The 2017 briefing note to “To inform both Ministers of a planned evaluation of improved pedestrian” stated:[102]
Since 2014, Transport Coordination and Roads and Maritime have worked to deliver a number of initiatives to improve traffic flow within the core of the Sydney CBD, which has included:
- Tomorrows Sydney Campaign.
- Travel Choices (Travel Demand Management).
- Sydney City Centre Capacity Improvement project – Improve traffic flow on the outer perimeter of the CBD to prioritise the CBD core for pedestrians and public transport.
Over that period, there has been a continued reduction in private vehicle trips entering the CBD core in the morning peak period, which has improved traffic flow in the Sydney CBD and has enabled the proposed reduction in traffic signal cycle times.
The ‘Sydney City Centre Capacity Improvement project[103][104] was particularly contentious. It was explicitly designed to increase road capacity for private vehicles (in the title).
It planned to “achieve equivalent throughput” at east-west signalised intersections, to create additional north-south capacity, with “The primary objective of schemes proposed is to provide additional intersection capacity”, discussing traffic signals only in the context of maintaining private vehicle capacity.[104]: 76
In a remarkably enlightening statement, it claims “The reduction in demand within the city centre would be negated by the reduction in capacity”[104]: 72 – which forgets to mention the reason for (vehicle) demand reduction. The overwhelming evidence is that reduction in road capacity causes the reduction in demand.[6][105]
How did you find out about this 3-month study?
I found this interesting footnote in an NRMA document[106].
Reducing the waiting time for pedestrians to cross at a signalised intersections can help to reduce the risk of jaywalking and pedestrian crashes, with minimal impact on traffic congestion. From 7 January 2018, Transport for NSW with the Roads and Maritime Services introduced 90 second pedestrian cycle times across the Sydney CBD. Monitoring was undertaken for a three month period to assess impacts across the network and the wait time was tweaked for certain streets. The change in cycle times has reduced waiting times for pedestrians at signals, meaning more frequent safe crossing opportunities.14
Footnote 14 is referenced as “Transport for NSW (2019). Personal correspondence”. The GIPA[a] officer was not able to find this correspondence[48]: 5
Note: This report unproductively focuses on victim-blaming ‘distracted’ pedestrians for the continued increase in fatalities due to car drivers killing people walking, which is still increasing this year. Research from the NYC Department of Transportation found “little concrete evidence that device-induced distracted walking contributes significantly to pedestrian fatalities and injuries”[107]
Timeline
- 2006-02: TfL: Factors Influencing Pedestrian Safety Literature Review (> 30 seconds waits hazardous)[12]
- 2007: Gehl Architects: Public Spaces and Public Life Study, with recomendations for reducing wait times[98]
- 2011-04: NZ Transport Agency: Reducing pedestrian delay at traffic signals report[13]
- 2014-03-27: Alex Greenwich: motion to reduce wait times at traffic lights[100]
- 2014-11: TfNSW: Sydney City Centre Capacity Improvement Plan Review of Environmental Factors[103]
- 2017-11-24: TfNSW: CBD Pedestrian Times Review[38]
- 2017-11-29: TfNSW: Map of CBD area for cycle time evaluation[35]
- 2018-01-07: TfNSW: Sydney CBD cycle times reduced from 110 to 90 seconds[102]
- 2018-09-17: CoS: Thalis motion to reduce wait times at traffic lights across council area[2]
- 2018-11-08: Clover Moore, Lord Mayor of Sydney: “Optimising Pedestrian Movement in Central Sydney”[9]
- 2018-11-19: SMH: Quote: “the minister’s office had not yet received the lord mayor’s letter”[16]
- 2018: TfNSW: Road Safety Progress Report does not mention cycle time reduction program[50]
- 2019: SMH: Oslo achieves 0 pedestrian and cyclist road deaths[31]
- 2020: Gehl Architects: Second City of Sydney Public Space and Public Life Study, with recomendations that more can be done on wait times[87]
- 2021: TfNSW: RUSAP introduced[21]
- 2022-12-19: Jake Coppinger: Blog post on “beg buttons”
- 2023-06-12: Jake Coppinger: Blog post on measuring pedestrian wait times with Better Intersections[54]
- 2023-07-10: Jake Coppinger: Blog post on “Shining a Light on the Traffic Signals of Sydney”[37]
- 2023-12: TfNSW: RUSAP Implementation Review Report[21]
- 2024-06: Updated (strengthened) RUSAP[23]
- 2024-11: CfS: “Walkable and bikeable streets are good for business” factsheet[19]
- 2025-08-02: Politico: Helsinki achieves Vision Zero, with 0 traffic fatalities[33]
- 2025: Josef Whitfield: “Pedestrian Wait-Time Reduction: A Vast Improvement to the Pedestrian Experience on a Shoestring Budget” wins ‘Best Paper at the Conference’ at 2025TPM[18]
- 2026: TfNSW: Roads Act 1993 Review carried out until 2026[21]
Appendix
Documents
I personally paid $441 to obtain and release these documents. If you find them useful, please let me know!
- GIPA[a] Correspondence
- Documents released:
- ITEM 1 – Briefing Notes: (25T-1151 ITEM 1 – Briefing notes_Redacted.pdf[112]), containing:
- 25T-1151 ITEM 2 – Statistical reports.pdf[1]
- 25T-1151 ITEM 2 – Statistical Reports – Brodie BOAM February 2017.xlsm[116]
- 2017 Bus Opal Assignment Model data
- 25T-1151 ITEM 2 – Statistical Reports – Brodie BOAM February 2018.xlsx[117]
- 2018 Bus Opal Assignment Model data
- ITEM 3 – Presentations: 25T-1151 ITEM 3 – Presentations.pdf[4]
- ITEM 4 – Email correspondence: 25T-1151 ITEM 4 – Emails_Redacted.pdf[118], containing:
- BATCH A – Traffic reports discussing 90 second trial
- BATCH B – 90 second impacts correspondence and attachment
- BATCH C – 100 second locations
- ITEM 5 – Email correspondence with NRMA: “Not held”
- ITEM 6 – Meeting Minutes: “Not held”
- ITEM 7: Daily Summary Reports: 25T-1151 ITEM 7 – Daily Summary Reports.pdf[119]
Analysis 1 Appendix
Overpass Turbo queries utilised
- Signals query: https://overpass-turbo.eu/s/1OF5
- CoS relation: https://overpass-turbo.eu/s/1OF8
- Ways: https://overpass-turbo.eu/s/1OF7
- CoS CBD ways: https://overpass-turbo.eu/s/289A
- Sydney CBD relation query: https://overpass-turbo.eu/s/289y
If you want to find the coordinates of a TCS signal ID, this is the query you need: https://overpass-turbo.eu/s/2bRJ
Thanks very much to the OSM contributors importing traffic_signal site refs and start_date‘s – I couldn’t have done this without you!
OpenStreetMap intersections missing ref values
Most OSM site=traffic_signals relations in the City of Sydney have a ref attribute, so they can be matched against this dataset, but this is not guaranteed.
In such cases, the dataset we plot on maps (as lat and lon come from OSM data) doesn’t necessarily contain all sites from the TfNSW signal audit.
Use this Overpass query to identify and fix these sites missing a ref: https://overpass-turbo.eu/s/289G. Use this Overpass query to identify and fix potential signal sites, that don’t have a site=traffic_signals: https://overpass-turbo.eu/s/289I
I have looked through all the sites in the survey area and they all appear to be complete. Therefore sites missing lat (i.e. an OSM attribute decorated/added in the “join”) have likely been removed from OSM.
Analysis 2 Appendix
Scoring function
I whipped this analysis piece up quickly – it’s not my best work or production code!
The scores themselves are arbitrary; and so is this keyword analysis, but I found it interesting to see the change over the trial.
Further interesting work on this topic could include evaluating descriptors against Austroads Level of Service (LoS) descriptors, however I think it would be more worthwhile to undertake quantitative analysis of the bus data.
See the git repo for the full code. As this is the ‘critical path’ I thought I’d also include it here.
export function inferCongestionFromReport(descriptor: string | undefined):
  number | undefined {
  // If no note has been made, consider there to be no congestion.
  if (descriptor === undefined) {
    return 0;
  }
  const text = descriptor.replace(/\n/g, ' ').toLowerCase().trim();
  const ratings: number[] = [];

  const zeroRatingStrings = [
    'no issue',
    'no issues',
    'lighter than usual',
  ];

  const oneRatingStrings = [
    'some delays',
    'no major issues',
    'no major concerns',
    'usual congestion',
    'reasonable performance',
    'traffic significantly lighter',
    'noticeably lighter',
    'significantly lighter than previous',
    'intermittently queuing',
    'not as busy as previous',
  ];
  const twoRatingStrings = [
    'some queuing',
    'queues were observed',
    'some delays experienced',
    'some local congestion',
    'reasonable congestion',
    'generally observed to be clearing the intersections',
    'slightly heavier',
    'heavier than previous weeks',
    'some congestion',
  ];
  const threeRatingStrings = [
    'appeared heavier',
    'noticeably heavier',
    'general traffic was also queued',
    'noticeably heavier than previous',
    'reasonably heavy',
    'generally heavy',
    'heavy congestion although not as bad',
    'heavy but flowing',
  ];

  const fourRatingStrings = [
    'heavy traffic',
    'heavy general traffic',
    'heavy congestion',
    'congestion very heavy',
    'severe congestion',
  ];

  /** Used only if no matches found in the above mappings */
  const ifNoMatchesMappings: { key: string, value: number }[] = [
    { key: 'very heavy', value: 4 },
    { key: 'queuing', value: 2 },
    { key: 'heavy', value: 3 },
    { key: 'congested', value: 1 },
    { key: 'congestion', value: 1 },
    { key: 'busy', value: 1 },
  ];

  if (text === '' || zeroRatingStrings.some(str => text.includes(str))) { ratings.push(0); }
  if (oneRatingStrings.some(str => text.includes(str))) { ratings.push(1); }
  if (twoRatingStrings.some(str => text.includes(str))) { ratings.push(2); }
  if (threeRatingStrings.some(str => text.includes(str))) { ratings.push(3); }
  if (fourRatingStrings.some(str => text.includes(str))) { ratings.push(4); }

  if (ratings.length === 0) {
    for (const { key, value } of ifNoMatchesMappings) {
      if (text.includes(key)) {
        ratings.push(value);
        // Only use the first match - we don't want to double count based on single words that aren't
        // highly specific.
        break;
      }
    }
  }

  if (ratings.length !== 0) {
    if (ratings.length !== 1) {
      // console.warn(`Multiple ratings (${ratings.join(', ')}, using 1st) for: ${descriptor})`);
    }
    return ratings[0];
  }
  if (!descriptorReport[text]) {
    descriptorReport[text] = ratings[0];
  }
  return undefined;
}
Meta notes on my drafting process
I welcome any feedback on this blog post format, or any corrections or constructive criticism, as always!
Drafting in Wikitext
I’ve tried out drafting this blog post in Wikitext as I greatly appreciate Wikipedia-style citations. I’d usually draft in Markdown (for source control) and then export to WordPress for finalising formatting working with images (I’ve previously run my own blog templating engine with a custom srcset generation implementation, it was not fun!).
At first I wrote an HTML transformer (operating on a virtual DOM using JSDOM) to remove some Mediawiki-specific elements.
As WordPress strips li id‘s on paste (and strips paragraph elements if they are the only child of a list element) I “rendered” the ordered list elements to actual paragraphs with numbers in them (moving list id‘s to the corresponding paragraph for citation anchor links). I found that WordPress HTML sterilisation still ran on superscript element id‘s, and raw HTML blocks are only available as block elements (forcing in-text citations onto their own lines), so I resorted to using one HTML block for the entire page. I’m still using JSDOM transformation for some minor tweaks, such as removing [ edit | edit source ] from titles.
I added few tiny CSS/JS snippets for Wikipedia-style citations-on-hover to my WordPress installation, showing a tooltip at the bottom of screen on mobile on click. Please email me if you notice any usability issues on your device/browser in this functionality.
I was initially drafting in the Wikipedia sandbox but I wanted to enable the `$wgRawHtml` setting to enable embedding the iframe tags for the Observable chart embeds (I didn’t want to have to copy them in one-by-one (or copy text around them) for updates). I ended up spinning up a local Mediawiki instance to draft in. Let me know if you’d like a copy of my LocalSettings.php to get this running, along with the minimal list of Template: and Module: pages I had to export/import to get inline citations running.
If anyone has been tinkering on rendering Wikitext citations in the sidebar or has other ideas for better Wikitext citation rendering, I’d love to chat! I’m on Mastodon at @jakecoppinger@mastodon.social.
Text fragment hyperlinks
In many cases I’ve hyperlinked with #page=NUMBER or #:~:text=QUOTE affixed so that clicking on the link takes the user to the exact page or paragraph, except when a reference is reused by multiple mentions, in which I use : PAGE_NUM . This functionality is currently only supported in some browsers (https://caniuse.com/url-scroll-to-text-fragment), and is described in this draft W3C Draft Community Group Report. Urls will load normally in all browsers.
Footnotes
References
- ↑ 1.0 1.1 Transport for NSW (2025-06-04). “25T-1151 – Info for Release – ITEM 2 – Statistical Reports (276 pages)” (PDF).
- ↑ 2.0 2.1 2.2 2.3 City of Sydney Council (2018-09-17). “City of Sydney Council Minutes – 2018-09-17 – Pedestrian Signals motion (Philip Thalis)” (PDF). Archived (PDF) from the original on 2019-03-30.
- ↑ 3.0 3.1 3.2 Transport for NSW. ““Improved pedestrian accessibility in the CBD”, Briefing: Minister for Transport and Infrastructure, Minister for Roads, Maritime and Freight, FOR INFORMATION” (PDF). p. 7.
- ↑ 4.0 4.1 4.2 4.3 4.4 4.5 4.6 Transport for NSW. “25T-1151 – ITEM 3 – Info for Release – Presentation” (PDF).
- ↑ 5.0 5.1 Transport for NSW. “Doc B – Bus Travel times” (PDF). p. 273.
- ↑ 6.0 6.1 Cairns, Sally; Hass-Klau, Carmen & Goodwin, Phil (1998). Traffic Impact of Highway Capacity Reductions: Assessment of the Evidence (PDF). London: Landor Publishing. ISBN 1-899650-10-5. Archived from the original (PDF) on 2017-01-17.
- ↑ Downs, Anthony (July 1962). “The law of peak-hour expressway congestion”. Traffic Quarterly. 16 (3): 393–409. hdl:2027/uc1.$b3477.
- ↑ Downs, Anthony (1992). Stuck in traffic: Coping with peak-hour traffic congestion. Brookings Institution Press. ISBN 9780815719236.
- ↑ 9.0 9.1 9.2 9.3 Clover Moore, Lord Mayor of Sydney (2018-11-08). “Optimising Pedestrian Movement in Central Sydney” (PDF). Letter to The Hon. Melinda Pavey MP, Minister for Roads, Maritime and Freight.
- ↑ 10.0 10.1 “Road Fatalities for NSW up to and including Monday, 22 September 2025: 12-MONTH PERIOD ENDING 22 September (2025 vs 2024) (Prelim)” (PDF). Transport for NSW. p. 3. Archived from the original (PDF) on 2025-09-23.
- ↑ 11.0 11.1 11.2 11.3 11.4 11.5 City of Sydney (2025-08-19). “Safe Speeds: The role of speed reduction and lower speed limits in reducing road trauma” (PDF). AITPM.
- ↑ 12.0 12.1 A Martin (TRL Limited) (February 2006). “FACTORS INFLUENCING PEDESTRIAN SAFETY: A LITERATURE REVIEW” (PDF). London Road Safety Unit, Transport for London. Archived (PDF) from the original on 2016-06-15.
- ↑ 13.0 13.1 C Vallyon,; S Turner (April 2011). “Reducing pedestrian delay at traffic signals (NZTA research report 440)” (PDF). NZ Transport Agency. Archived (PDF) from the original on 2015-09-08.
- ↑ Baass K G (1989). “Review of European and North American practice of pedestrian signal timing”. Transportation Association of Canada (TAC). ISBN 1-895102-10-3.
- ↑ Stefan Bussey (2018). “Reducing Pedestrian Delay at Half Signals in the City of Portland, OR: Striving to increase safety and decrease delay for pedestrian trips” (PDF). City of Portland Oregon, City of Portland Bureau of Transportation, Oregon Transportation Research and Education Consortium (OTREC). Archived (PDF) from the original on 2020-04-19.
- ↑ 16.0 16.1 16.2 16.3 16.4 16.5 Megan Gorrey (2018-11-19). “Two minutes too long before crossing? Push to shorten pedestrian wait”. The Sydney Morning Herald. Archived from the original on 2022-01-25.
- ↑ 17.0 17.1 Andrew Taylor (2019-05-19). “Shorter wait times, diagonal crossings, more footpaths: How to ease Sydney’s pedestrian congestion”. Sydney Morning Herald. Archived from the original on 2021-12-05.
- ↑ 18.0 18.1 Josef Whitfield (2025). Pedestrian Wait-Time Reduction: A Vast Improvement to the Pedestrian Experience on a Shoestring Budget. Transport Planning and Modelling (TPM) Conference. Transport for Greater Manchester (TfGM). Archived from the original on 2025-09-25.
- ↑ 19.0 19.1 Committee for Sydney, AECOM (November 2024). “Walkable and bikeable streets are good for business” (PDF). Archived (PDF) from the original on 2025-08-05.
- ↑ “Tech Central Economic Development Strategy”. NSW Government – Premier’s Department. September 2025. Archived from the original on 2025-09-25.
- ↑ 21.0 21.1 21.2 21.3 21.4 21.5 21.6 Transport for NSW (December 2023). “Road User Space Allocation Policy Implementation Review Report” (PDF). Archived (PDF) from the original on 2025-09-11.
- ↑ Lord Mayor Clover Moore (2024-04-08). “2024 Australian Urban Design Awards (Minute by the Lord Mayor)”. City of Sydney. Archived from the original on 2025-04-30.
- ↑ 23.0 23.1 23.2 23.3 Transport for NSW (July 2024). “Road User Space Allocation Policy” (PDF). Archived (PDF) from the original on 2024-07-25.
- ↑ “Roads Act 1993 Review”. Transport for NSW. 2025-09-15. Archived from the original on 2025-09-25.
- ↑ “Roads Act 1993 Issues Paper Committee for Sydney submission” (PDF). Committee for Sydney. April 2025. p. 10. Archived (PDF) from the original on 2025-09-24.
- ↑ 26.0 26.1 WalkSydney & Better Streets. “Roads Act Review Submission” (PDF). p. 13. Archived (PDF) from the original on 2025-09-25.
- ↑ Sarah Bickford; Peter McLean (2025-03-25). “Re: Roads Act Review Issues Paper” (PDF). Letter to Ben Cebuliak (Manager Movement and Place). Bicycle NSW. p. 7.
- ↑ Warren Salomon. “Re: Review of the 1993 NSW Roads Act” (PDF). Letter to Transport for NSW. BIKEast. Archived (PDF) from the original on 2025-09-25.
- ↑ Dr Christopher Standen (2025-03-25). “Personal submission on Roads Act 1993 – Issues Paper Review” (PDF). p. 1. Archived (PDF) from the original on 2025-09-25.
- ↑ Sydney Coordinated Adaptive Traffic System (SCATS), New South Wales. “SCATS Evolution” (PDF). p. 3. Archived (PDF) from the original on 2025-09-24.
- ↑ 31.0 31.1 Julie Power (2020-01-13). “Oslo cut road deaths to one in 2019. Can Sydney do the same?”. Sydney Morning Herald. Archived from the original on 2024-06-15.
- ↑ Jake Coppinger. “Better Intersections, Oslo”.
- ↑ 33.0 33.1 Aitor Hernández-Morales (2025-08-02). “Helsinki just went a full year without a single traffic death”. Politico. Archived from the original on 2025-09-13.
- ↑ 34.0 34.1 Manisha Prakash (2025-02-03). “Your application under the Government Information (Public Access) Act 2009 (GIPA Act) (25T-1151 Ack)” (PDF). Letter to Jake Coppinger. Transport for NSW.
- ↑ 35.0 35.1 “Map of original CBD area for evaluation (attachment A) (CCO_0604/004/29NOV17), from “Improved pedestrian accessibility in the CBD””, Briefing for Minister for Transport and Infrastructure & Minister for Roads, Maritime and Freight” (PDF). Transport for NSW. 2017-11-29. p. 11.
- ↑ Transport for NSW (2018-04-05). “CBD Signal Phasing Times, CCO_604/005/05APR18” (PDF).
- ↑ 37.0 37.1 37.2 37.3 Jake Coppinger (2023-07-10). “Shining a Light on the Traffic Signals of Sydney”.
- ↑ 38.0 38.1 38.2 38.3 38.4 Denis Wood (Senior Traffic Network Manager) (2017-11-24). “CBD pedestrian times & CBD Pedestrian Times Review (DOC H – Pedestrian times Summary & Assessment)” (PDF). Transport for NSW. p. 256.
- ↑ 39.0 39.1 39.2 39.3 Jake Coppinger (2025-05-15). “No Signal for Pedestrian Safety: TfNSW Refuses Signal Data During National Road Safety Week”.
- ↑ 40.0 40.1 40.2 Howard Collins (2025-08-25). “Re: Request for Public Access of SCATS Signal Phasing Data across one weekday for all NSW signals” (PDF). Letter to Jake Coppinger. Transport for NSW.
- ↑ Better Streets (2025-08-30). “Transport Camp Sydney 2025”. Archived from the original on 2025-09-25.
- ↑ “Traffic Signal Configuration Data Sheets (Creative Commons Attribution 4.0 International)”. Department of Transport and Planning. 2025-06-25. Archived from the original on 2025-05-15.
- ↑ WA Main Roads. “Traffic Map”. Archived from the original on 2025-07-12.
- ↑ WA Main Roads. “Historic Traffic Data at Signalised derived by SCATS (Creative Commons Attribution 4.0 International License)”. Archived from the original on 2025-09-25.
- ↑ Jake Coppinger. “Minimum cycle times of Sydney CBD signals in Nov 2017”.
- ↑ Minister for Regional Transport and Roads (2024-02-16). “Travel time data to shine light on journeys around Rozelle Interchange” (Press release). NSW Government. Transport for NSW. Archived from the original on 2025-06-22.
- ↑ 47.0 47.1 Transport for NSW. “DOC A – Traffic Volume – CBD – Cycle Time Change” (PDF). p. 270.
- ↑ 48.0 48.1 48.2 Natacha Doust (2025-03-28). “Notice of decision on your access application under the Government Information (Public Access) Act 2009 (GIPA Act) (10 pages)” (PDF). Letter to Jake Coppinger. Transport for NSW.
- ↑ 49.0 49.1 Yvonne C Lam (2018-11-19). “Sick of Waiting at the Lights? Sydney Lord Mayor Wants to Speed Things Up for Pedestrians”. Broadsheet. Archived from the original on 2025-09-25.
- ↑ 50.0 50.1 Transport for NSW (2018). “Road Safety Progress Report 2018” (PDF). p. 15. Archived (PDF) from the original on 2023-10-21.
- ↑ 51.0 51.1 51.2 Jake Coppinger, Tegan Mitchell, Sara Stace (2025-08-04). “Subject: Request for Public Access of SCATS Signal Phasing Data across one weekday for all NSW signals” (PDF). Letter to Josh Murray, cc. Howard Collins.
- ↑ Jake Coppinger. “Better Intersections”. WalkSydney.
- ↑ Jake Coppinger (2022-12-19). “Sydney CBD is bringing back pedestrian “beg buttons”“.
- ↑ 54.0 54.1 Jake Coppinger (2023-06-12). “Mapping pedestrian traffic light timing in Sydney, Australia”.
- ↑ 55.0 55.1 Jake Coppinger (2024-08-22). “Why Did the Chicken Catch the Metro? Because It Was Faster Than Crossing the Road…”.
- ↑ Transport for NSW (2022-08-01). “Network Operations – Schedule of Fees” (PDF).
- ↑ Jake Coppinger, Tegan Mitchell, Sara Stace (2025-04-16). “Re: Public Access to SCATS Traffic Signal Phasing Data” (PDF). Letter to Josh Murray, Secretary, Transport for NSW. WalkSydney.
- ↑ Brenda Hoang (2025-05-09). “Re: SCATS traffic signal phasing data release 9 May 2025” (PDF). Letter to. Transport for NSW.
- ↑ Brenda Hoang (2025-06-03). “Re: SCATS traffic signal phasing data release” (PDF). Letter to Jake Coppinger. Transport for NSW.
- ↑ 60.0 60.1 Jake Coppinger, Tegan Mitchell, Sara Stace (2025-05-14). “Re: Public Access to SCATS Traffic Signal Phasing Data” (PDF). Letter to Brenda Hoang, cc. Josh Murray, Roy Brown.
- ↑ Yvonne (2025-09-20). “Why won’t Transport for NSW share SCATS Traffic Signal Phasing Data?”. WalkSydney.
- ↑ Daniel Lo Surdo (2025-11-17). “Why this set of Sydney traffic lights could change how we cross the road”. Sydney Morning Herald. Archived from the original on 2025-11-16. Retrieved 2025-11-17.
- ↑ 63.0 63.1 63.2 63.3 63.4 Roy Brown (SCATS Director Technology and Product, Transport for NSW) (2025-10-15). “2025-10-15: SCATS traffic signal extracts from panel discussion at Highways AU”. Jake Coppinger.
- ↑ “SCATS and WalkSydney discussion (private minutes)”. 2025-07-04.
{{cite web}}: Missing or empty|url=(help) - ↑ 65.0 65.1 Professor Peter Wilenski (1978-01-26). “Interim Report of the Commissioner Appointed to Inquire into Improvements in the Machinery of Government and State Government Administration (Review of New South Wales Government Administration – Directions for change: an interim report)” (PDF). Peter Wilenski (1978). Directions for change : an interim report / by Peter Wilenski. ISBN 0724016694.
- ↑ Committee for Sydney (2025-10-15). “Raising Sydney’s Care Factor – The critical role of care work to Sydney’s productivity & prosperity” (PDF). p. 71. Archived (PDF) from the original on 2025-11-18.
- ↑ Transport for NSW (September 2023). “Evaluation of the NSW Pedestrian Protection Program” (PDF). Archived (PDF) from the original on 2023-12-16.
- ↑ Transport for London (July 2018). “Walking action plan: Making London the world’s most walkable city” (PDF). Transport for London. Archived (PDF) from the original on 2025-02-16.
- ↑ “Western Distributor Road Network Improvements”. Transport for NSW. 2025-05-08. Archived from the original on 2025-08-07.
- ↑ “(Untitled Facebook Post)”. BikeSydney. 2025-05-28. Archived from the original on 2025-09-03.
- ↑ Rogan Parker (2022-08-25). “SCATS Management of loop faults and pedestrian reintroduction” (PDF). Auckland Transport Operations Centre (ATOC). Archived (PDF) from the original on 2025-09-24.
- ↑ Anthony Segaert (2025-01-31). “The change to our traffic lights that could make you happier”. The Sydney Morning Herald. Archived from the original on 2025-05-15.
- ↑ Declan Bowring (2023-09-25). “Better Intersections website gathers data on long pedestrian wait times in Sydney”. ABC News. Archived from the original on 2025-09-25.
- ↑ “It’s faster to catch the Sydney Metro one stop than cross this road”. Reddit. 2024-08-24. Archived from the original on 2025-09-25.
- ↑ Jake Coppinger (2024-08-22). “It’s faster to catch the Sydney Metro one stop than cross this road”. YouTube.
- ↑ “Better Intersections website gathers data on long pedestrian wait times in Sydney”. Reddit. 2023-08-25. Archived from the original on 2025-09-25.
- ↑ “Shining a Light on the Traffic Signals of Sydney”. Reddit. 2023-07-11. Archived from the original on 2025-09-25.
- ↑ “Category:Traffic Signals”. WalkSydney.
- ↑ “Pedestrians are fed up with begging”. Bicycle NSW. 2023-08-08. Archived from the original on 2025-07-13.
- ↑ “Constitution Road Infrastructure Upgrade – Community Engagement Outcomes Report” (PDF). City of Ryde Council. May 2025. p. 4. Archived (PDF) from the original on 2025-08-29.
- ↑ 81.0 81.1 Naaman Zhou (2018-09-09). “Placebo buttons: Australian pedestrians press for no reason at traffic lights”. The Guardian. Archived from the original on 2025-09-24.
- ↑ City of Sydney (June 2024). “‘A City for Walking’ Strategy and Action Plan – Continuing the Vision” (PDF). pp. 21, 36. Archived (PDF) from the original on 2025-10-02.
- ↑ “Waverley Bike Strategy” (PDF). Waverley Council. 2025. p. 48. Archived (PDF) from the original on 2025-10-01.
- ↑ Arup (2013-06-21). “Macquarie Park Pedestrian Access and Mobility Plan” (PDF). City of Ryde Council. pp. 11, 109, 126, 129, 155, 157, 159, 211. Archived (PDF) from the original on 2025-10-02.
- ↑ Arup (2014-06-25). “Gladesville Town Centre Pedestrian Access & Mobility Plan (PAMP)” (PDF). City of Ryde & Hunters Hill Council. pp. 63, 117, 118. Archived (PDF) from the original on 2025-10-02.
- ↑ Cardno (2017-04-06). “Parramatta CBD Pedestrian Strategy” (PDF). City of Parramatta. p. 82. Archived (PDF) from the original on 2025-09-01.
- ↑ 87.0 87.1 87.2 Gehl Architects (2020). “Public Space & Public Life Study 2020” (PDF). p. 142. Archived (PDF) from the original on 2025-04-18.
- ↑ Committee for Sydney (February 2020). “Reclaiming Sydney’s High Streets” (PDF). p. 12. Archived (PDF) from the original on 2025-07-14.
- ↑ Aleisha Orr (2024-07-11). “‘Over the top’ or a life-saving move? The push for 30km/h speed limits”. SBS News. Archived from the original on 2024-09-10.
- ↑ “High time – the future of Oxford Street” (PDF). Business Sydney, Robertsday. November 2020. p. 12. Archived (PDF) from the original on 2024-07-05.
- ↑ SGS Economics and Planning (June 2014). “CBD Pedestrian Analysis: Technical Report, City of Melbourne” (PDF). p. 22. Archived (PDF) from the original on 2025-09-24.
- ↑ Department of Transport and Main Roads, Queensland Government (August 2021). “Guideline: Options for reducing pedestrian delays at traffic signals (CC BY 4.0)” (PDF). p. 32. Archived (PDF) from the original on 2025-09-24.
- ↑ “Sydney Metro City & Southwest Chatswood to Sydenham Conditions of Approval” (PDF). NSW Government. p. 32. Archived (PDF) from the original on 2025-09-24.
- ↑ “Block 1 Report – Sydney Metro C&SW – Traffic and Interchange Monitoring” (PDF). AECOM. August 11, 2023. p. 28. Archived (PDF) from the original on 2025-09-24.
- ↑ “Sydney Metro West – Rail infrastructure, stations, precincts and operations Conditions of Approval”. NSW Government. p. 61. Archived from the original on 2025-09-25.
- ↑ “Everything You’ve Ever Wanted to Know About ATSPMs: Harnessing the Power of Automated Signal Performance Metrics for Your Agency – November 9, 2022 (Question and Answer Summary)” (PDF). The Eastern Transportation Coalition. 2022-11-09. Archived (PDF) from the original on 2025-09-24.
- ↑ “Everything You’ve Ever Wanted To Know About ATSPMs: Harnessing The Power Of Automated Signal Performance Metrics For Your Agency” (PDF). The Eastern Transportation Coalition. 2022-11-09. Archived (PDF) from the original on 2025-09-24.
- ↑ 98.0 98.1 Gehl Architects (2007). “Public Spaces and Public Life Study 2007 (Part 2, page 71, PDF page 8)” (PDF). p. 8. Archived (PDF) from the original on 2025-09-24.
- ↑ 99.0 99.1 “SYDNEY CITY CENTRE ACCESS STRATEGY” (PDF). December 2013. ISBN 978-1-922030-62-7. Archived (PDF) from the original on 2018-09-13.
- ↑ 100.0 100.1 Alex Greenwich (2014-03-27). “Sydney City Centre Access Strategy (Notice of Motion, 27 March 2014, Legislative Assembly, NSW Parliament)”. Archived from the original on 2025-08-04.
- ↑ Nigel Gladstone (2018-08-20). “When pushing the pedestrian button works and when it doesn’t”. The Sydney Morning Herald. Archived from the original on 2022-12-06.
- ↑ 102.0 102.1 102.2 Transport for NSW. “Reducing pedestrian waiting times in the CBD (“Briefing: Minister for Transport and Infrastructure, Minister for Roads, Maritime and Freight, For Information), RMS” (PDF). p. 3.
- ↑ 103.0 103.1 Transport for NSW (November 2014). “Sydney City Centre Capacity Improvement Plan Review of Environmental Factors Volume 1” (PDF). Transport for NSW. ISBN 978-1-925217-60-5. Archived from the original (PDF) on 2019-04-02.
- ↑ 104.0 104.1 104.2 Mark Russell; Henrik Malker (11 November 2014). “Sydney City Centre Capacity Improvement Plan Review of Environmental Factors Volume 2 – Appendices” (PDF). Transport for NSW. ISBN 978-1-925217-60-5. Archived from the original (PDF) on 2015-03-20.
- ↑ Cairns, Sally; Atkins, Stephen & Goodwin, Phil (2002). “Disappearing traffic? The story so far” (PDF). Proceedings of the Institution of Civil Engineers – Municipal Engineer. 151 (1). doi:10.1680/muen.2002.151.1.13. Archived (PDF) from the original on 2025-06-19.
- ↑ NRMA (June 2019). “Look up: Keeping pedestrians safe (Road Safety Series)” (PDF). p. 8. Archived (PDF) from the original on 2025-09-24.
- ↑ New York City Department of Transportation (2019-08-30). “Distraction Shouldn’t Be Deadly” (PDF). Archived (PDF) from the original on 2025-08-29.
- ↑ Natacha Doust (2025-03-13). “Extending the timeframe for deciding your application under the Government Information (Public Access) Act 2009 (GIPA Act)” (PDF). Letter to Jake Coppinger. Transport for NSW.
- ↑ Nick Yetzotis (2025-02-18). “Request for an advance deposit of processing charges under the Government Information (Public Access) Act 2009 (GIPA Act)” (PDF). Letter to Jake Coppinger. Transport for NSW.
- ↑ Manisha Prakash (2025-05-12). “Your Internal Review under the Government Information (Public Access) Act 2009 (GIPA Act) (IR Ack)” (PDF). Letter to Jake Coppinger. Transport for NSW.
- ↑ Jarrod Whitbourn (2025-06-02). “Notice of decision on your access application under the Government Information (Public Access) Act 2009 (GIPA Act)” (PDF). Letter to Jake Coppinger. Transport for NSW.
- ↑ “25T-1151 – Info for Release – ITEM 1 – Briefing Notes (12 pages)” (PDF). Transport for NSW.
- ↑ Roads and Maritime Services (December 2017). ““Improving pedestrian accessibility in the CBD”, (Briefing: For Approval, to John Hardwick, RMS)” (PDF). p. 1.
- ↑ Transport for NSW. “Doc C – Bus Travel Time – Single Trip / Multi Days” (PDF). p. 274.
- ↑ Transport for NSW. “Bus Travel Time – By Scheduled Hour Band” (PDF). p. 276.
- ↑ Transport for NSW (February 2017). “2017 Bus Opal Assignment Model data”.
- ↑ Transport for NSW (February 2018). “2018 Bus Opal Assignment Model data”.
- ↑ Transport for NSW (2018). “25T-1151 – ITEM 4 – Info for Release – Emails (45 pages)” (PDF).
- ↑ Transport for NSW (2018). “Reducing Pedestrian waiting times in the CBD evaluation – Daily Summary (02/01/2018 – 15/03/2018 [inferred])” (PDF).
The post Green Lights More Often: The Secret 2018 Study of Sydney’s Traffic Signals first appeared on Jake Coppinger.
]]>