Mats, Mops and Uniforms Built a Compounding Machine
Cintas (NASDAQ:CTAS) rents and launders work uniforms. It also keeps businesses stocked with floor mats, restroom supplies, first-aid cabinets, and fire extinguishers. It serves more than one million businesses on a route-based, recurring-revenue model with high customer retention.
Most of the growth comes from converting companies that still handle these tasks themselves. Management says “over two-thirds of our new business comes from no programmers,” and it puts the addressable market at 16 to 20 million businesses.
A Decade of Singles and Doubles
For ten years, Cintas has moved past uniforms into first aid, safety, and fire protection, and it has invested in routing technology and automation. Margins expanded as a result. Gross margin hit an all-time high of 51.5%, and operating margin reached a record 23.6% in fiscal Q1 2027, the company’s first quarter with $3 billion in revenue. The company split its stock 4-for-1 in September 2024 and agreed on March 10, 2026, to buy rival UniFirst (NYSE:UNF) in an all-cash deal worth $5.2B-$5.5B. That deal still needs FTC clearance.
The dividend grew alongside the business. Cintas has raised its payout every year since going public 43 years ago, most recently by 15.6% to $0.52 per quarter.
Your $1,000 Grew to $9,427
1-Year Return
- Initial Investment: $1,000
- Current Value: $1,185.20
- Total Return: 18.52%
- S&P 500 (same period): $1,138.50 (13.85%)
5-Year Return
- Initial Investment: $1,000
- Current Value: $2,215.70
- Total Return: 121.57%
- Annualized Return: 17.25%
- S&P 500 (same period): $1,687.80 (68.78%)
10-Year Return
- Initial Investment: $1,000
- Current Value: $9,427.40
- Total Return: 842.74%
- Annualized Return: 25.15%
- S&P 500 (same period): $3,570.90 (257.09%)
Cintas beat the market over every period, the kind of quiet compounder most investors walked past at the time (we studied that pattern among recent winners nobody noticed, here). The Cintas figures are adjusted for splits and dividends, while the S&P 500 figures reflect price change only.
Timing counted more than usual over the past year. Shares swung between $160.31 and $225.79, and the stock rose 17.57% in the month after the September earnings report, while the S&P 500 slipped 0.4%.
I’m Waiting for a Better Entry
A $1,000 stake in Cintas today makes sense if UniFirst clears the FTC and management keeps beating its raised fiscal 2027 guidance of $5.45 to $5.54 in adjusted EPS. The company has exceeded EPS estimates for 7 consecutive quarters, and management says growth comes “from volume” rather than pricing.

I’d stay away if valuation stays this stretched. At $225.70, shares trade near 36 times forward earnings and 44 times trailing earnings, above the average analyst target of $218.31. Uniform rental also tracks employment, so a hiring slowdown would hit volumes just as the company takes on integration risk.

I like the business, but a valuation near a 52-week high leaves less room for error.
Got $1,000? Before You Buy CTAS, Read This
If you have cash sitting in your account right now, give this two minutes. After more than two decades of helping investors beat the market, our top analysts at 24/7 Wall St. put together a definitive report on the Top 10 Stocks To Buy Today. And CTAS wasn’t one of them.
They combed the entire market. It's not 10 ideas, not 10 stocks everyone is talking about, it's what their research points to as the 10 best stocks to buy right now, and it's free. Read more here and see which stocks made the list –>>
The post $1,000 in This Boring Stock Grew to $9,427. The S&P 500 Couldn’t Keep Up appeared first on 24/7 Wall St..
]]>She left her full-time job this summer at 64, started Social Security a few weeks later, and the deposits have been arriving on schedule. Now a local distribution center wants her for November and December shifts, and the extra money sounds welcome until she remembers hearing that working while collecting early can make Social Security hold back benefits.
Retailers expect a busy shopping season but aren’t rushing to staff up. The National Retail Federation forecasts 4.2% holiday sales growth and 325,000 to 375,000 seasonal hires, according to Retail Dive’s October 19 report. For a retiree offered one of those jobs, the question is how much extra pay she can earn without putting her Social Security checks at risk.
Why Her Earlier Paychecks Look Like a Problem
The Social Security Administration’s guidance on working while receiving benefits is clear. If you are under full retirement age for the entire year, it deducts $1 for every $2 you earn above the annual limit. For 2026, that limit is $24,480.
The annual test counts every dollar of wages she earned in the calendar year, including the months she worked full time before retiring. Her salary from January through summer almost certainly topped $24,480 already. On paper, she looks like someone whose checks should shrink for the rest of the year, and a holiday job would seem to make things worse.
A First-Year Exception That Flips the Math
Social Security has a special earnings rule built for people who retire partway through a year after earning a full-time income. The agency’s guidance on the rule says it can pay a full check for any whole month it considers you retired, no matter what you earned for the year.
For 2026, someone below the age for full benefits all year counts as retired in any month her earnings are $2,040 or less and she did no substantial work in self-employment. Her earlier salary stops driving the outcome. Each month passes or fails on its own.
For any full month after her benefits began when she wasn’t working, she can collect her full Social Security payment despite her earlier salary. September and October would qualify if she earned no wages or did no substantial self-employment work during those months.
Months Where Seasonal Pay Can Cost Her a Check
Her holiday shifts can change whether November and December qualify for the exception. If she earns $2,040 or less in November, that month’s benefit is protected. If she earns more in December, the exception no longer protects that month’s payment, and Social Security may withhold it.
Social Security’s own example on its special-rule page follows the same pattern. A worker earns well above the annual limit. Yet she still collects benefits for the quiet months after retiring and loses them only for the months of heavier work. The months she already passed stay paid.
Self-employed gig work follows different rules. Spending more than 45 hours a month running a business generally counts as substantial work, even when earnings are modest. In a highly skilled occupation, as few as 15 hours can sometimes disqualify the month.
A withheld month is also less permanent than it sounds. When she reaches 67, Social Security recalculates her benefit to account for months when payments were withheld. That raises her future checks, although there’s no guaranteed dollar-for-dollar refund.
How to Schedule Shifts Around the $2,040 Line
She can limit her shifts to keep the wages she earns each month at $2,040 or less. Or she can take more hours, knowing a busy month may cost her that month’s Social Security benefit. Before deciding, she should compare what she’ll take home from the job with any benefits Social Security expects to withhold.
She should also treat this as a one-season opportunity. This monthly exception generally applies only for one year. In 2027, her earnings will be measured against the annual limit of $25,560, making next holiday season a different calculation.
One Comparison to Make Before Saying Yes
Before signing up for extra shifts, she should total the wages she’ll earn in November and December, regardless of when the paychecks arrive. The $2,040 limit helps determine which months Social Security can treat as retired. Letting Social Security know about the job early helps it apply the rule correctly and avoid an overpayment notice later.
Pay schedules, self-employment income, and a spouse’s benefits can all change how this plays out for a given household. A quick call to Social Security before the first shift can confirm which months count as retired in her own case.
Released: 401k & IRA Tips and Answers
(sponsor) 401(k)s are powerful retirement tools. But even savvy savers can make mistakes that quietly cost you money for decades. Choosing the wrong fund, ignoring small fees nobody adds up, rollover steps done in the wrong order, the list goes on.
These sort of mistakes is exactly what 401k & IRA Tips and Answers was created to help prevent. It is a free guide from Fisher Investments on rollovers, contributions, required withdrawals and the mistakes that do the most damage to a retirement account. Learn More Here ›
The post Holiday Hiring Is Muted This Year. Social Security’s $2,040 Monthly Line Decides Whether a First-Year Retiree Keeps Her Check appeared first on 24/7 Wall St..
]]>Citi’s new Buy rating and a reported investment from Tesla (NASDAQ:TSLA) CEO Elon Musk haven’t been enough to steady Skydance (NYSE:SKYD) shares. Skydance stock is trading at $7.33, down 6%, a slide that leaves SKYD shares moving against two pieces of good news.
Sector pressure is part of the Skydance picture, though a far milder part. The Communication Services Select Sector SPDR ETF (NYSEARCA:XLC) is at $104.22, down 1%, with the fund’s direction set largely by the biggest advertising platforms. Large caps are heading the other way, as the SPDR S&P 500 ETF Trust (NYSEARCA:SPY) trades at $765.24, up 0.7%.
Meanwhile, Roku (NASDAQ:ROKU) stock is at $157.66, down 0.6%, while Walt Disney (NYSE:DIS) shares are declining 2% to $110.32. Thus, the selling looks much more concentrated in Skydance stock than ROKU and DIS. This is happening despite the bullish call and the high-profile investment. So, what’s going on with Skydance stock, exactly?
Buy Call and Musk Money Meet Heavy Selling
Citi resumed its Skydance coverage with a Buy rating; moreover, Citi set a $10 price target. Barron’s reported that Citi’s case rests on Skydance’s cost cuts paying off, which puts execution at the heart of the call. Sellers have brushed that research aside, keeping Skydance shares under pressure even with a major bank backing the name.
Reports of Musk’s Investment in Skydance Emerge
Late last week, reports came out that Musk had invested $1 billion in Skydance. Coverage of the stake tied it to Skydance’s effort to cut costs after its string of media combinations. Musk’s arrival adds one of the most closely followed names in business to the shareholder list, yet Skydance shares haven’t drawn support from it.
Those combinations were funded heavily with debt. They built a portfolio including CBS, CNN, Paramount+ and HBO Max, keeping cost cuts and debt reduction at the center of the Skydance story.
At the same time, a pending takeover hangs over Roku, so Roku stock trades largely on deal terms. This anchor helps explain the small move in Roku shares next to the steeper drop in Skydance stock, and deal-driven trading also makes Roku stock a weak gauge of broader sentiment toward media owners such as Skydance.
What the Selloff Says About Skydance After the Musk Investment
The slide in Skydance stock despite a Buy rating and a famous new backer shows sellers focusing on the balance sheet, and progress on cost cuts and debt reduction could matter more to Skydance shares than any single analyst call. Citi’s thesis and Musk’s money both need time to show up in reported results, and the market appears unwilling to wait.
Look for evidence that Skydance is trimming expenses and paying down debt while it grows its film slate. A larger movie lineup could lift revenue for Skydance over time, though it also adds spending during a cost-cutting push. Future updates on borrowing levels may reveal how quickly Skydance is turning savings into a stronger balance sheet.
Before those questions get clear answers, Skydance shares may stay more volatile than the sector fund that holds them. Any clear sign of falling leverage could change how the market views the Skydance story. Investors should consider keeping their position sizes modest until Skydance’s debt question is settled.
Got $1,000? Before You Buy DIS, Read This
If you have cash sitting in your account right now, give this two minutes. After more than two decades of helping investors beat the market, our top analysts at 24/7 Wall St. put together a definitive report on the Top 10 Stocks To Buy Today. And DIS wasn’t one of them.
They combed the entire market. It's not 10 ideas, not 10 stocks everyone is talking about, it's what their research points to as the 10 best stocks to buy right now, and it's free. Read more here and see which stocks made the list –>>
The post Skydance Sinks 6% Despite Citi Buy Call and Elon Musk’s Reported $1B Investment; Roku and Disney Dip appeared first on 24/7 Wall St..
]]>In October 2026, Solana (CRYPTO:SOL) fell 14.1%, the biggest loser among the four major cryptocurrencies. In comparison, Ethereum (CRYPTO:ETH) fell by 13.2%, XRP (CRYPTO:XRP) dropped 12.9%, and Bitcoin (CRYPTO:BTC) declined only 4.1%. SOL is currently trading around $101, after dipping to $99.84 earlier that day.
Over the past 30 days, the coin fluctuated between a high of $125 on September 27 and a low of $98.51 on October 24, when it bounced to close at $102. Year to date, SOL is down 18.5%. On October 22, we questioned whether SOL could maintain a price above $100. It has managed to do so, albeit barely. The pressing concern now is identifying potential support levels if the price falls below $98.51.
Solana’s First Support Is the $93 to $96 Range
Support levels are price points where buyers have previously stepped in, often slowing down further declines. Solana has several support areas below the $98.51 mark, with gaps widening as the price falls.
The initial support zone to watch is between $93 and $96. Prior to October, SOL last fell below $98.51 on September 17, hitting a low of $98.38 but still closing at $102. Two days earlier, on September 15, the price dipped to $96, approximately 5% below its price.
Buyers rallied in this zone multiple times. During the week of August 30, SOL hit a weekly low of $93, about 8% below its current price, yet it still closed that week at $102. Thus, this $93 to $96 range represents the last solid support before a more significant drop.
Solana’s Deeper Floors Are $71 and $60

Further down, Solana has deeper support levels. The next major floor is the 90-day low of $71, which occurred on August 1—about 30% lower than where SOL trades now. SOL spent much of July and early August fluctuating between $70 and $79, leading many holders to establish positions in this range.
The lowest significant floor is the 2026 low of $60, recorded on June 6. This is about 40% below its price. This week, SOL opened at $82 but closed at $66, suggesting a capitulation event in which exhausted holders sold off their positions en masse.
ETF Outflows, Moving Averages and Bitcoin Could Push Solana Lower

Spot Solana ETFs, which hold SOL directly and trade like stocks, experienced net outflows of $17.3 million in the week of October 19. Despite this, they still hold $1.61 billion in assets, so one week of outflows is minor in the grand scheme. However, consecutive weeks of redemptions could create sustained selling pressure, as funds must sell coins to meet withdrawals.
Traders also watch moving averages, which show the average closing price over a set number of days. SOL is below its 20-day average of $107 and its 50-day average of $110—both approximately 6% and 9% higher, respectively. When a coin trades below its moving averages, it often struggles to rally back, as buyers from the past few weeks may sell near those averages to break even.
Additionally, Bitcoin’s performance influences SOL, as the two often move in tandem. Over the last 90 days, SOL increased by 37.6% while Bitcoin gained 25.6%. However, SOL has declined 16.4% over the past month, while Bitcoin fell 5%. With Bitcoin at $79,401 today, any further downturn could hit SOL even harder.
How Low Could the Solana Price Go If $98.51 Breaks?
If SOL breaks below $98.51, we anticipate it could initially test the $93 to $96 support zone, where buyers previously held the line. A weekly close below $93 would be concerning since there isn’t much historical buying activity until the low $70s. SOL bounced quickly from $75 to $103 in late August, suggesting few buyers stepped in that range, so a breakdown could quickly revert to the $71 mark.
While reaching the June low of $60 seems unlikely at the moment, significant market shifts, such as a broader crypto selloff or sustained ETF outflows beyond $17.3 million a week, could bring it into play. Buyers might establish a new support base by keeping SOL above $96, seeing a week of inflows into Solana ETFs, and reclaiming the $107 mark. A close above $110 would likely signal the end of the October selloff.
Want Up To $3,000 In Stock? SoFi Is Giving New Active Invest Users Complimentary Stock
Looking to grow your money but unsure where to begin? SoFi Active Invest is offering a limited-time promotion; open a new Active Invest account, fund it with $50 or more, and you could receive up to $1,000 in complimentary stock.
From $0 commission trading3 to fractional shares4 and automated investing, this app is designed to simplify investing for everyone, whether you’re just starting or already experienced. Its easy to sign up and secure your bonus. (Sponsor)
The post Solana Price Prediction: SOL Is Down 14% in October, the Most of the Big Four. How Low Could It Go? appeared first on 24/7 Wall St..
]]>As the crypto market faces a potential 20% decline, Grok AI, a model developed by xAI, expects Ethereum (CRYPTO: ETH) to remain the most resilient. In contrast, Avalanche (CRYPTO: AVAX) is predicted to withstand the drop better than Sui (CRYPTO: SUI). We assessed this ranking against current prices to identify which levels are crucial for these cryptocurrencies.
The selling trend has already begun. Bitcoin (CRYPTO: BTC) fell below $79,300 on October 26, 2026, as fears about AI spending seeped from the stock market into crypto. The crypto market’s total value has now fallen to $2.7 trillion. The Fear & Greed Index, which gauges investor sentiment on a scale from 0 to 100, currently sits at 44, indicating a fearful outlook.
All three cryptocurrencies are already experiencing declines. Ethereum is trading at $2,301, down 4.3% over the past week and 53.3% from its all-time high. Sui is priced around $0.91, down 8.7% this week and 22.2% over the past month. Meanwhile, Avalanche is valued at $8.88, down 8% this week and 18.3% this month.
Grok AI Sees ETH Falling 19% and SUI 34% in a Further Selloff

Grok started from initial prices of $2,329 for ETH, $0.92 for SUI, and $8.94 for AVAX, and all three cryptocurrencies have already dipped below these levels. In Grok’s scenario, ETH might decline 19% to around $1,887, a smaller slide than the overall market. AVAX could drop 27% to about $6.53, while SUI may take the biggest hit, falling 34% to about $0.61.
ETH’s larger market capitalization helps explain this ranking. Currently, ETH ranks second at about $281 billion, while AVAX ranks 28th at around $3.9 billion, and SUI ranks 30th at about $3.7 billion. A smaller market cap generally means less selling pressure is needed to drive the price down.
Sui’s Token Unlocks Lead to Increased Supply Pressure

Out of Sui’s total maximum supply of 10 billion tokens, only about 4.12 billion are currently in circulation. The fully diluted valuation, which considers every token that could ever exist, is approximately $9.1 billion, more than double its current market value. The remaining 5.9 billion tokens still to be released could add selling pressure on SUI, especially as monthly unlocks add more supply to the market.
Avalanche’s gap is narrower, with a fully diluted valuation of about $4.2 billion. In contrast, ETH’s fully diluted valuation aligns with its market value. However, Avalanche has struggled with demand; U.S. spot Avalanche ETFs held just $51.4 million on October 22 and have seen minimal inflows recently.
Both Sui and Avalanche also face the challenge of recent gains that may be vulnerable to retracement. Over the past 90 days, in an altcoin run that lifted smaller coins, AVAX has surged 36.1%, and SUI has risen 33.1%, compared to a 21.3% increase for ETH.
Ether ETF Holdings Provide Liquidity but Show Outflows
Grok notes that ETH has the deepest liquidity of the three, with about $14.5 billion in spot ETF assets. Data from SoSoValue indicates that U.S. spot Ether ETFs held $14.64 billion on October 23, down from $17.79 billion on September 29.
Total net inflow—money received since launch minus withdrawals—slipped to $12.72 billion from $13.96 billion on September 28. The largest single-day outflow, which occurred on October 6, amounted to $201.9 million, and the funds added only $4.35 million in the most recent session.
A Whale’s Liquidation Prices Fall Inside ETH’s Support Zone

Support levels are vital price zones where buyers have historically stepped in. Grok identifies ETH support between $2,150 and $2,220, about 3.5% to 6.6% below its current price. Should it break below this range, it could drop to around $2,000.
For AVAX, support is found between $8.50 and $8.70, just 2% to 4.3% below, with a break there targeting $6 to $7.50. In SUI’s case, Grok points to support around $0.65, which is about 28% lower.
Lookonchain has detected a whale holding 93,184 ETH, valued at roughly $214 million, in leveraged long positions that profit only if prices rise. A liquidation would occur if an exchange force-sold its position due to insufficient collateral. This whale’s liquidation prices fall between $2,182 and $2,178, both within Grok’s ETH support zone. If forced selling occurs here, it could hit the same zone where buyers typically defend the price.
Which Holds Up Best if Crypto Falls 20%, According to Grok AI?
Based on Grok AI’s analysis, ETH is likely to hold up best in a market drop. Grok assigns a 52% probability that ETH will recover first, followed by AVAX at 30% and SUI at 18%. If the anticipated drop occurs in November, Grok forecasts ETH could settle around $2,100 by December 31, with AVAX at approximately $7.10 and SUI around $0.68.
Monitoring three critical levels is essential. If ETH falls below $2,150, forced selling may push it toward $2,000. AVAX is currently closest to its support level, and a close below $8.50 could push it into the $6-$7.50 range. For SUI, its crucial line is $0.65, and it has the weakest one-year performance, down 65.6%. Grok’s outlook holds if ETH stays above $2,150 while AVAX and SUI breach their floor levels, but it could be challenged if ETH breaks below $2,150 first.
Want Up To $3,000 In Stock? SoFi Is Giving New Active Invest Users Complimentary Stock
Looking to grow your money but unsure where to begin? SoFi Active Invest is offering a limited-time promotion; open a new Active Invest account, fund it with $50 or more, and you could receive up to $1,000 in complimentary stock.
From $0 commission trading3 to fractional shares4 and automated investing, this app is designed to simplify investing for everyone, whether you’re just starting or already experienced. Its easy to sign up and secure your bonus. (Sponsor)
The post If Crypto Falls Another 20%, Which Holds Up Best: Ethereum, Sui or Avalanche? Grok AI Ranks Them appeared first on 24/7 Wall St..
]]>A Bank of America note arguing that memory customers are now locking in supply for years at a time is lifting chip and storage stocks together, and the group is beating the S&P 500 by a wide margin. Shares of Micron Technology (NASDAQ:MU) are at $913.77, up 4% so far in the session. The move rewards the argument that longer contracts can steady one of the most cyclical corners of the chip industry.
Meanwhile, Western Digital (NASDAQ:WDC) shares are at $362.32, up 5%, the largest gain in the group and a step ahead of Micron stock. SanDisk (NASDAQ:SNDK) stock is at $1,271.99, up 3%, trailing Micron stock while still joining the advance. Hard drive and flash storage names often move with memory chip makers, since the same AI data center expansion feeds demand for all three businesses and shapes how customers plan purchases.
For a sector-level check, the Roundhill Memory ETF (CBOE:DRAM) is at $48.91, up 4%, moving almost in tandem with Micron shares. The SPDR S&P 500 ETF Trust (NYSEARCA:SPY) is at $764.93, up 0.65%, a much smaller gain that leaves memory and storage stocks far out in front of everything else. That gap marks this as a sector-specific rally powered by memory’s own news, with the rest of the market following at a slower pace.
Bank of America Sees Memory Deals Stretching for Years
Bank of America analyst Vivek Arya kept a Buy rating and a $1,550 price target on Micron stock after meeting with company executives, saying he came away “incrementally more positive on memory.” Arya’s note said customer supply deals for memory now run three to five years, where they once lasted a year or less. Contracts of that length can give Micron a clearer view of future demand and may help smooth the pricing swings that have historically defined its business.

Micron makes memory chips used in AI servers, phones and PCs, so steadier customer commitments reach nearly every part of its business. That reassurance arrives after a choppy stretch for memory stocks, which raises the value of any credible signal that demand can hold up. However, a single analyst note can’t settle how long tight supply and firm pricing will last for Micron, and memory demand has cooled suddenly in past cycles.
Western Digital Tops a Memory Rally That Leaves the S&P 500 Behind
SK Hynix is in the news as well, after a Bloomberg report that it plans a special dividend funded by gains from selling its stake in Kioxia. The company said nothing has been decided and that it will announce shareholder returns with its third-quarter 2026 results.
Micron ranks among the biggest weights in the Roundhill Memory ETF, alongside SK Hynix and Samsung Electronics, which helps explain why the fund’s gain mirrors the move in Micron shares. Western Digital and SanDisk carry smaller weights in the fund, so the storage names have less pull on its overall result.
What Longer Memory Contracts Mean for Micron
Micron now faces the question of whether longer customer deals cover a larger share of its sales. A growing portion of revenue under multiyear terms would back Arya’s case for steadier memory economics and could support a richer valuation for Micron shares. If that progress stalls, Micron stock could stay at the mercy of spot pricing swings that can reverse quickly and have punished memory holders before.
Western Digital and SanDisk shares face a related question, because their gains rest on demand for storage holding firm alongside memory. Memory/storage has a long record of boom and bust cycles, and these longer contracts have yet to prove themselves through a downturn. Those reviewing their exposure should adjust their holdings carefully given the unresolved memory pricing question.
Got $1,000? Before You Buy MU, Read This
If you have cash sitting in your account right now, give this two minutes. After more than two decades of helping investors beat the market, our top analysts at 24/7 Wall St. put together a definitive report on the Top 10 Stocks To Buy Today. And MU wasn’t one of them.
They combed the entire market. It's not 10 ideas, not 10 stocks everyone is talking about, it's what their research points to as the 10 best stocks to buy right now, and it's free. Read more here and see which stocks made the list –>>
The post Micron Climbs 4% as Bank of America Grows More Positive on Memory; Western Digital Rises 5%, SanDisk Gains 3% appeared first on 24/7 Wall St..
]]>A Wall Street upgrade built on a shortage of server central processing unit (CPU) capacity has pushed Intel (NASDAQ:INTC) to the front of the chip group. Intel stock is at $91.36, up 5% in the session, a gain that puts it at the head of the semiconductor pack.
Meanwhile, Advanced Micro Devices (NASDAQ:AMD) stock is at $532.26, up 3%, following Intel shares higher at a slower clip. NVIDIA (NASDAQ:NVDA) shares are trading at $216.29, up 3%, keeping pace with AMD stock while staying behind Intel stock. This gap between the leader and its two big rivals suggests a stock-specific catalyst at work.
Chip-focused funds are running ahead of the wider technology complex. The iShares Semiconductor ETF (NASDAQ:SOXX) is at $496.02, up 4%, a stronger showing than AMD or NVIDIA shares. By comparison, the Invesco QQQ Trust (NASDAQ:QQQ) is at $714.41, up 1%, a far smaller lift for the large-cap technology benchmark.
Server CPU Shortage Drives New Street’s Buy Call on Intel
New Street Research analyst Pierre Ferragu upgraded Intel to Buy from Neutral and set a $125 price target. Ferragu wrote, “Agentic AI is driving a sustained increase in server CPU demand, with supply constraints set to persist for years, while Intel is getting rid of bad nodes and adding capacity.” His argument pairs a durable demand thesis with a manufacturing cleanup, and Intel stock is responding to both.

Stronger demand for Intel’s own chips also supports utilization at its foundry business, according to Ferragu. Foundry loading matters to Intel because idle plants are expensive, so a steady pull on its own server products can help keep those lines running.
Intel’s Factory Model Sets It Apart From AMD and NVIDIA
Both AMD and NVIDIA design chips and rely on outside manufacturers, a lighter model that leaves the heavy factory spending to their suppliers. Intel designs and manufactures its own processors and runs a foundry business that builds silicon for outside customers, linking its results more closely to how well its plants perform. Direct competition adds another layer, since AMD goes head to head with Intel in server and PC processors.
In AI accelerators, NVIDIA holds the lead, placing it in a market adjacent to the server CPU business at the center of the New Street call. That role linking NVIDIA to accelerator spending across the broader AI expansion (we pulled together seven suppliers behind that expansion, from power to cooling, in a free report).
For Intel, the optimistic view rests on Ferragu’s belief that tight supply could last for years while the company drops older nodes and adds capacity. Building that capacity is costly, however, and a shortage only pays off if Intel can turn out enough chips to meet the demand.
What New Street’s Upgrade Signals for Intel’s Coming Report
Intel reports third-quarter 2026 results later this week, and that release now carries the added weight of a fresh Buy rating. The central question is whether data center demand is holding up, since Ferragu’s thesis depends on server CPU orders remaining strong and supply staying tight. A soft data center report could challenge the upgrade, while steady demand could support the view that the shortage has staying power.

Shareholders can watch for whether Intel’s commentary on server supply lines up with Ferragu’s view that the constraints will remain. Follow-through in the iShares Semiconductor ETF relative to the Invesco QQQ Trust may show whether chip stocks can hold their lead over the broader technology group.
Upgrades that land days before an earnings report can fade quickly if results disappoint, which makes the coming release the real test for Intel shares. Keeping one’s exposure smaller may be prudent for investors until the Intel earnings question is settled.
Got $1,000? Before You Buy NVDA, Read This
If you have cash sitting in your account right now, give this two minutes. After more than two decades of helping investors beat the market, our top analysts at 24/7 Wall St. put together a definitive report on the Top 10 Stocks To Buy Today. And NVDA wasn’t one of them.
They combed the entire market. It's not 10 ideas, not 10 stocks everyone is talking about, it's what their research points to as the 10 best stocks to buy right now, and it's free. Read more here and see which stocks made the list –>>
The post Intel Rises 5% as New Street Upgrade Cites Server CPU Shortage; AMD and NVIDIA Gain 3% appeared first on 24/7 Wall St..
]]>When a husband dies, nearly everyone gives his widow the same advice: don’t make any big decisions for a year, and it’s sound advice. If she owns a home, though, a federal tax rule starts a clock on the day he dies. A surviving spouse who sells the house within two years can still claim the married couple’s $500,000 home-sale exclusion. If she sells after that window closes, she’s back to the $250,000 single amount.
A $500,000 Exclusion That Outlives the Marriage
The home-sale exclusion lets you exclude profit from your main home from taxable income, and that profit, called the gain, is about the sale price minus your basis. Basis is what the IRS treats as your cost for the house, plus improvements. You normally must meet two tests. You qualify if you owned the home and lived in it as your principal residence for at least 2 years during the 5-year period before the sale. Single filers can exclude up to $250,000. Married couples filing jointly can exclude up to $500,000.
A special rule allows an unmarried widow or widower to keep the $500,000 figure if the sale happens no later than 2 years after the date of death and the couple met the joint requirements immediately before the death.
Where It’s Written in the Tax Code
The rule is 26 U.S.C. § 121(b)(4), titled “Special rule for certain sales by surviving spouses.” IRS Publication 523 lists four conditions. You sell within 2 years of your spouse’s death. You haven’t remarried at the time of the sale. Neither of you took the exclusion on another home sold within 2 years of this sale. And you meet the 2-year ownership and residence requirements, and you can count your late spouse’s time toward them.
Who Qualifies and Who Doesn’t
You must be unmarried on the closing date. You qualify if, just before the death, either spouse met the ownership test and both of you met the use test. If you remarry before the sale, you lose the higher amount. A closing one day after the two-year mark drops the exclusion to $250,000, provided you meet the tests on your own. Taking a year to grieve still leaves time in the window, but the risk comes from waiting much longer or never knowing the window exists.
How Much the Window Is Worth
The answer depends on the basis, which changes at death. Common law states don’t use community property rules. In those states, your late spouse’s half of a jointly owned home gets a new basis equal to its fair market value on the date of death. Your half keeps its old basis. In community property states (Arizona, California, Idaho, Louisiana, Nevada, New Mexico, Texas, Washington, and Wisconsin), the whole home generally gets a new basis under 26 U.S.C. § 1014(b)(6). That applies if at least half of the community interest is included in the deceased spouse’s estate.
Here’s an example with stated assumptions. A couple bought a home for $200,000 decades ago. They held it as joint tenants in a common law state, and it was worth $1.2 million when the husband died. She sells for the same price, and the sale costs are ignored.
Her new basis is $700,000, which leaves a $500,000 gain. If she sells within the window, she excludes the full gain. If she sells after it closes, $250,000 becomes taxable.
Move the same house to a community property state and the basis resets to $1.2 million. Her gain is $0, so the exclusion amount barely matters. Long-time owners in common law states face higher stakes, and national prices keep rising. The Case-Shiller index reached a five-year high of 337.3 in July 2026, up 1.9% from a year earlier.
That two-year window is one of a handful of IRS rules that can quietly cost a retiree six figures if the date slips by unnoticed. We counted nine of them and put the full map in a free report: The Retiree’s Tax Trap Map.
Filing Status Runs on a Separate Clock
For the year your spouse dies, you can file a joint return if you don’t remarry before the year ends. For the 2 years after that, you may be able to file as a qualifying surviving spouse, which keeps joint tax rates. You only qualify if your home is the main home of a dependent son, daughter, stepson, or stepdaughter. That clock counts tax years. The home-sale window counts from the date of death. Many survivors mix up the two rules.
Steps to Take Before Listing the House
- Document the home’s value on the date of death, ideally with a professional appraisal, since that value sets the new basis.
- Write down the window’s closing date, the second anniversary of the death, when you’ll see it.
- Gather records of improvements, because they still add to basis.
- Talk with a tax professional before listing if the gain could be large.
One Date Worth Writing Down
Grief deserves the year that friends and family recommend, but before that year starts, mark the second anniversary of your spouse’s death on your calendar. A closing by that date can shelter up to $500,000 of gain. A closing after it caps the exclusion at $250,000.
Released: 401k & IRA Tips and Answers
(sponsor) 401(k)s are powerful retirement tools. But even savvy savers can make mistakes that quietly cost you money for decades. Choosing the wrong fund, ignoring small fees nobody adds up, rollover steps done in the wrong order, the list goes on.
These sort of mistakes is exactly what 401k & IRA Tips and Answers was created to help prevent. It is a free guide from Fisher Investments on rollovers, contributions, required withdrawals and the mistakes that do the most damage to a retirement account. Learn More Here ›
The post Her Husband Will Die in March. If She Sells the House Within Two Years, the IRS Will Still Give Her the Married Couple’s $500,000 Exclusion. Wait Longer and She’s Back to the Single Amount appeared first on 24/7 Wall St..
]]>Yield is the easy part. What lets income investors sleep at night is a dividend that rises every year, no matter what the economy does, and all five companies here raised their regular quarterly payout in 2026. The increases ran from a step to $0.76 per share at Southern Company (NYSE:SO) up to an 8.8% boost at Philip Morris International (NYSE:PM). Two of them, Duke Energy (NYSE:DUK) and Southern, go ex-dividend in mid-November, on November 13 and November 16. Each pick below is graded on coverage, cash flow, balance sheet, and payout history before yield comes up in the conversation.
Philip Morris International: 19 Straight Raises and a Record Cash Year
Philip Morris raised its quarterly dividend to $1.60, or $6.40 annualized. At $202.93 a share, that works out to a forward yield of about 3.2%. The stock has rose 29.8% year to date, which has pushed the yield down. Even so, the payout keeps growing.
Safety read: Management called September’s increase its 19th consecutive year of dividend growth. The dividend history backs that up, with annual step-ups going back to the $0.46 to $0.54 raise in 2008. Operating cash flow is guided to around $13.5 billion this year against capex of $1.4 billion to $1.6 billion. That leaves room for a dividend bill of roughly $10 billion at the new rate. The $6.40 payout is about 77% of 2026 adjusted EPS guidance at its floor of $8.29 to $8.44. Leverage is falling: net debt to adjusted EBITDA improved to 2.17x from 2.53x at the end of 2025, and the company has no share repurchases planned. That keeps the dividend first in line for cash.
Bull case: Smoke-free products now make up more than 40% of net revenue. U.S. segment revenue grew 22.7% last quarter, and adjusted operating margin expanded to 44.7%. Third-quarter adjusted EPS of $2.36 beat the $2.34 estimate, the company’s 6th straight beat. Shares trade at 19x forward earnings.
Risk: ZYN is getting expensive to defend. Philip Morris is switching cans to 20 pouches at the old 15-count price, which management called a 25% per-pouch price reduction. It expects fourth-quarter U.S. adjusted operating income to be around zero or slightly negative.
Prudential Financial: Nearly 5% Yield at 10x Earnings
Prudential Financial (NYSE:PRU) pays a regular quarterly dividend of $1.40, or $5.60 annualized. At $116.46, the forward yield is about 4.8%. A separate $0.3516 distribution recorded in July falls outside the regular payout and shouldn’t be counted as recurring income.
Safety read: Trailing dividends of $5.50 come to about 50% of trailing EPS of $11.04, the most comfortable coverage on this list. Second-quarter adjusted EPS of $4.08 was almost three times the quarterly dividend. The company still returned $743 million in the quarter, including $250 million of buybacks. Its main insurance subsidiaries carry AA- ratings from S&P and Fitch. The regular quarterly payout has risen every year, from $0.70 in 2016 to $1.40 in 2026, and the payment history dates back to 2002.
Bull case: Shares trade at 10x forward earnings while returning an operating ROE of 16.4%. The asset manager PGIM grew pre-tax adjusted operating income 28% to $294 million, which brings in fee income to sit alongside the insurance spread business.
Risk: Japan is the weak spot. A voluntary sales suspension at Prudential of Japan cut international sales 33% in constant currency. Wall Street is cool on the stock, with 14 holds, 3 sells and a consensus target of $110.20, below the current price.
Duke Energy: Data-Center Demand Backs a Rising Payout
Duke declared a quarterly dividend of $1.085, with an ex-dividend date of November 13 and payment on December 16. On a $4.34 annualized basis, that gives a forward yield of about 3.5% at $125.10.
Safety read: The forward dividend is roughly 66% of reaffirmed 2026 adjusted EPS guidance at its floor of $6.55 to $6.80. That is a normal range for a regulated utility, whose earnings are set by state rate cases. The quarterly payout has risen from $0.89 in 2017 to $1.085 today, and quarterly payments date back to 1999.
Bull case: Duke has signed 7.6 GW of economic-development projects under electric service agreements and targets 5% to 7% annual EPS growth through 2030. The company expects to land in the top half of that range starting in 2028. Second-quarter adjusted EPS of $1.43 exceeded the $1.31 estimate, the company’s 5th consecutive beat.
Risk: A growing rate base brings higher depreciation and rising interest expense, and coal ash cleanup costs remain uncertain. The stock has also gained 9.57% in the past month, so the yield on new money has already declined.
Southern Company: 25 Years of Annual Raises on Record
Southern declared a $0.76 quarterly dividend, with an ex-dividend date of November 16 and payment on December 7. On a $3.04 annualized basis, that yields about 3.3% at $93.04.
Safety read: Southern has the clearest raise record in this group. Its dividend history shows an increase in every year from 2002 through 2026, most recently from $0.74 to $0.76. Trailing dividends of $2.98 equal about 72% of trailing EPS of $4.15. Second-quarter net income rose 33.4% to $1.17 billion.
Bull case: Commercial electricity sales rose 7.3% on data-center demand, and wholesale volumes grew 9.2%. Adjusted EPS of $1.13 beat the $1.00 estimate. Shares trade at 17x forward earnings with a beta of 0.301, which makes Southern one of the steadiest names on this list.
Risk: Repowering wind farms at Southern Power will add roughly $205 million of accelerated depreciation in 2026 and about $120 million in 2027. Residential kWh sales also fell 1.5% in the second quarter.
T. Rowe Price: A Debt-Free Balance Sheet Behind a Nearly 5% Yield
T. Rowe Price Group (NASDAQ:TROW) pays $1.30 per quarter, or $5.20 annualized. That is a forward yield of about 4.9% at $105.32, the highest on this list.
Safety read: T. Rowe has the strongest balance sheet here. It carries almost no long-term debt and holds $3.23 billion in cash and equivalents. On the last earnings call, CFO Jen Dardis said, “Our balance sheet remains strong with $4.4 billion of cash and discretionary investments.” Trailing dividends of $5.14 equal about 52% of trailing EPS of $9.96. The quarterly payout rose every year from $0.90 in 2020 to $1.30 in 2026, and the record also includes a $3 special dividend in 2021.
Bull case: Assets under management hit a record $1.89 trillion, and about two-thirds of client assets are retirement money, which tends to stay put. The ETF business took in $4.4 billion of net inflows in the second quarter. Shares trade at 10x forward earnings.
Risk: Outflows are still running. Clients pulled a net $6.5 billion in the second quarter after $13.7 billion in the first, and CEO Rob Sharps warned that “net flows in the second half of the year [will be] meaningfully more challenging than the first half.” The stock is still down 36.2% over five years.
Five Raises in 2026, Five Different Engines
These five names pay for their dividends with different sources: tobacco pricing power, insurance and asset-management fees, regulated utility rate bases, and a debt-free fund manager. Each raised its regular payout this year. Prudential and T. Rowe Price offer the most coverage per dollar of yield. Philip Morris brings the fastest dividend growth, and Duke Energy and Southern provide steady, rate-backed income heading into their November ex-dividend dates. Build a few of these into a ladder, and the checks can cover the bills without ever selling a share, which is exactly the setup we walked through in a free dividend ladder guide.
Got $1,000? Before You Buy PM, Read This
If you have cash sitting in your account right now, give this two minutes. After more than two decades of helping investors beat the market, our top analysts at 24/7 Wall St. put together a definitive report on the Top 10 Stocks To Buy Today. And PM wasn’t one of them.
They combed the entire market. It's not 10 ideas, not 10 stocks everyone is talking about, it's what their research points to as the 10 best stocks to buy right now, and it's free. Read more here and see which stocks made the list –>>
The post These 5 Dividend Stocks Raised Their Payouts. Are They Worth Buying in November? appeared first on 24/7 Wall St..
]]>Quant (CRYPTO: QNT) has risen 109.5% in the past 30 days, more than doubling its value, while XRP (CRYPTO: XRP) has fallen 16.2% to $1.29 over the same period. The Quant price jumped 18.1% in just 24 hours, reaching $217. This surge marked its largest daily gain since September 27, when it closed up 89%.
Despite this impressive jump, Quant released no significant news. The last update, dated October 22, simply recapped a UK Finance conference, making the October 26 spike seem more like a trading reaction to earlier developments than a new catalyst.
A September Bank Partnership Still Fuels Quant’s Rally
The recent rally traces back to a key announcement on September 24 when The Clearing House chose Quant to support its On-Chain Money Initiative. The Clearing House is a payments company owned by 25 major U.S. banks, and this initiative aims to facilitate the clearing and settlement of tokenized deposits—digital representations of traditional bank deposits that maintain the same regulatory protections.
Quant’s technology runs the network’s coordination layer, connecting it to existing payment systems banks use, like RTP and CHIPS. Quant’s founder, Gilbert Verdian, noted that “tokenized deposits are now the de facto way banks move money on-chain.” By September 28, UK Finance confirmed that banks successfully completed live tokenized sterling payments using Quant’s platform.
As traders noticed this potential, QNT surged from a September 20 close of $64 to an intraday high of $372 by September 27. The jump on October 26, however, came without similar news to back it. Overnight trading saw as few as 459 tokens change hands in an hour, but then it spiked just before the U.S. market opened, with around 14,918 QNT (approximately $3 million) changing hands in a busy hour.
With only 14.6 million QNT in circulation, a small increase in buying can significantly impact the price. This burst could have come from short sellers, who borrow tokens to profit on falling prices and might be forced to buy back their positions. However, no liquidations for October 26 were reported, leaving this theory unconfirmed.
QNT Surges Past $200 While Bitcoin, Ethereum and XRP Decline

On October 26, QNT broke through the $200 mark after reaching it the day before. It surpassed its October 21 high of $213.90 and peaked at $224.62, its highest price since October 13. Still, trading volume appears thin compared to September; during the peak on September 28, around 807,600 QNT traded, whereas only about 55,100 exchanged on October 25.
QNT has shown volatility in the past. After peaking at $372 in September, it fell to $287 by September 30 and dropped further to $179 on October 24. While QNT is currently up 10.6% over the past week, it remains down 5.5% over the past two weeks.
Additionally, Lookonchain noted in late September that QNT wallets inactive for over three years began transferring tokens to exchanges, which typically signals an intent to sell. In contrast, QNT significantly outperformed other major cryptocurrencies. Over 24 hours, Bitcoin (CRYPTO: BTC) fell 1.1%, Ethereum (CRYPTO: ETH) slipped 1%, and XRP fell 0.4%. Over the month, Bitcoin lost 5%, and Ethereum dropped 13.6%, highlighting QNT’s rally amid broader market weakness.
Quant and XRP Court Banks in Different Ways

Part of the performance difference can be attributed to size; QNT has a smaller float, meaning fewer tokens are available to trade. As a result, a small increase in demand can drive significant price moves. In contrast, XRP operates in a much larger market, so it takes more capital to move its price.
The design of these projects also matters. Quant’s Overledger technology connects banks’ existing systems to blockchains, enabling tokenized deposits to move between banks. By contrast, XRP acts as a bridge asset that converts one currency to another during transactions.
Recently, Ripple’s partnerships have leaned towards its RLUSD stablecoin, with Cross River incorporating RLUSD into its core banking systems as of October 15. As a result, XRP holders are waiting for banks to drive demand.
Can the Quant Price Continue to Outperform XRP?
This seems likely for now, but the 30-day gain is measured from a price set before the September 27 spike. That reference point shifts to levels like $286 and $287, both above the current $217. The rally relies on the launch of The Clearing House’s network, which is open to banks in the first half of 2027. QNT trades 49.3% below its all-time high, while XRP is 64.6% below its peak.
QNT can maintain its lead over XRP only if it stays above the $200 threshold it just reclaimed. A daily close above $224.62 may signal new buyers entering the market beyond the recent surge. However, if it dips back below $200 before the end of October, it could signal a failed breakout driven by short covering, putting the October 24 low of $173 back in view and allowing XRP to close the gap.
Want Up To $3,000 In Stock? SoFi Is Giving New Active Invest Users Complimentary Stock
Looking to grow your money but unsure where to begin? SoFi Active Invest is offering a limited-time promotion; open a new Active Invest account, fund it with $50 or more, and you could receive up to $1,000 in complimentary stock.
From $0 commission trading3 to fractional shares4 and automated investing, this app is designed to simplify investing for everyone, whether you’re just starting or already experienced. Its easy to sign up and secure your bonus. (Sponsor)
The post Can Quant (QNT) Keep Beating XRP After Nearly Doubling in a Month? appeared first on 24/7 Wall St..
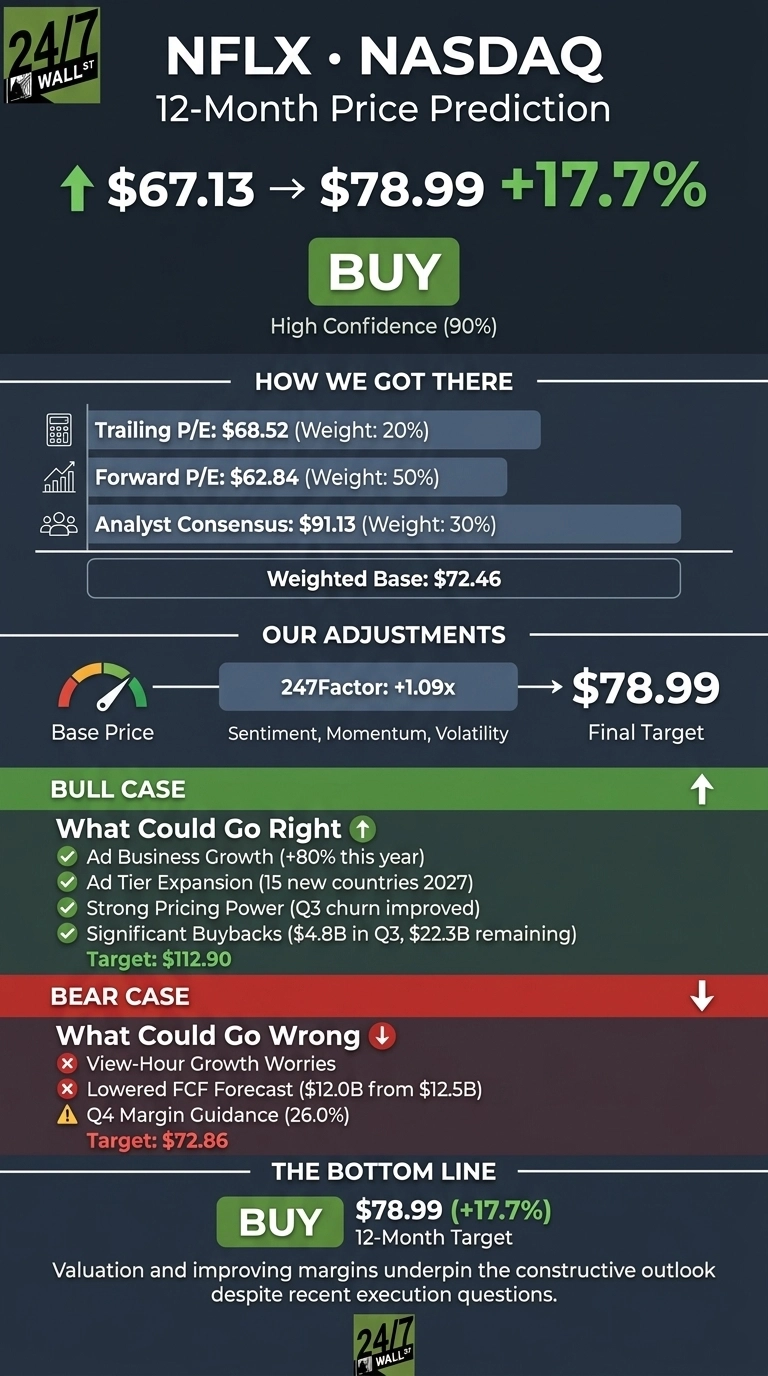
]]>Our 24/7 Wall St. price target for Netflix (NASDAQ:NFLX) is $78.99 over the next 12 months. Shares trade at $67.13, so the target means 17.7% upside. We rate Netflix a buy with high confidence.

24/7 Wall St. Price Target Summary
| Metric | Value |
|---|---|
| Current Price | $67.13 |
| Price Target from 24/7 Wall St. | $78.99 |
| Upside/Downside | 17.7% |
| Recommendation | BUY |
| Confidence Level | 90% |
After a year of questions, the market is pricing Netflix like a franchise whose growth is running out. What we see is a business still growing revenue at double digits, widening its margins and buying back stock at a record pace.
Sentiment and fundamentals have drifted apart, and that is why our model remains constructive even after expectations were revised hard.
A 45.92% Slide That Ignored an Earnings Beat
Netflix is down 4.87% over the past week, 8.49% over the past month, 5.09% over the past quarter and 28.4% year to date. The stock has lost 45.92% over one year. The shares are 42.5% below their 52-week high of $116.73 and just 4.7% above the $64.10 low.
Third-quarter results on October 20 show how wide that gap has become. EPS of $0.87 beat the $0.8229 estimate. Revenue of $12.874B (+11.85% YoY) came in just short of the $12.878B consensus. Operating margin widened to 34.6% from 28.2%.
Even so, shares fell 5.31% on earnings day. Netflix cut its 2026 ad revenue outlook to about $2.70B from $3.00B, and co-CEO Ted Sarandos admitted, “We do need better execution in the U.S.” Today the stock is up 3.21%.
Why Bulls See $112.90 Ahead
The bull case hits $112.90. Advertising is still early. Management said, “We are still growing our ads business over 80% this year,” and ad tiers launch in 15 new countries starting March 2027. Pricing power looks solid, with Q3 churn better than forecast both globally and in the U.S. LatAm revenue rose 17%.
Netflix bought back 63.9M shares for $4.8B in Q3 and has $22.3B left on its authorization. Analysts agree, with 7 Strong Buy and 28 Buy ratings against 15 Hold and 1 Sell.

View-Hour Worries Could Cap the Rebound
The bear case lands at $72.86. CFO Spence Neumann said, “We want to grow view hours faster. We’re not satisfied.” Netflix also lowered its FY2026 FCF forecast to about $12B from $12.5B and guided Q4 operating margin to 26%.

The FCF cut comes from a one-time Q4 real estate transaction. The margin guidance factors in roughly 120 bps from job cuts that should lower costs over time.
Netflix Earns Its Premium Over Disney and Spotify
Disney (NYSE:DIS) competes directly for streaming subscribers. It trades at 16x earnings, but its operating margin is 14.6%, about half of Netflix’s 29.49%.
Spotify (NYSE:SPOT) runs the same subscription-plus-ads model. Its Q3 revenue rose 16.32%, yet it trades at 49x earnings. Netflix sits between the two with the best margins, which makes our 24/7 Wall St. price target look reasonable and arguably conservative.
| Company | P/E | P/FCF | Operating Margin |
|---|---|---|---|
| Netflix | 25x | 29x | 29.49% |
| Disney | 16x | 19x | 14.6% |
| Spotify | 49x | 38x | 12.8% |
Valuation Tilts Our Model Toward Netflix Near $67
My 24/7 Wall St. price target is $78.99, rated buy with 90% confidence. What tips the scale is valuation.
The stock got cheaper while margins got wider. The case strengthens if advertising picks up again in 2027. It weakens if U.S. view hours keep stalling. At these levels, our model sees more reward than risk.
| Year | Price Target from 24/7 Wall St. |
|---|---|
| 2026 (December) | $68.80 |
| 2027 (October) | $78.99 |
| 2028 (October) | $87.70 |
| 2029 (October) | $97.58 |
| 2030 (October) | $101.57 |
The projections rest on Netflix continuing to execute its current strategy. Faster ad monetization could drive results well above them, and continued engagement weakness could pull them lower.
Got $1,000? Before You Buy NFLX, Read This
If you have cash sitting in your account right now, give this two minutes. After more than two decades of helping investors beat the market, our top analysts at 24/7 Wall St. put together a definitive report on the Top 10 Stocks To Buy Today. And NFLX wasn’t one of them.
They combed the entire market. It's not 10 ideas, not 10 stocks everyone is talking about, it's what their research points to as the 10 best stocks to buy right now, and it's free. Read more here and see which stocks made the list –>>
The post Netflix Price Prediction: Where the Stock Goes After a Year of Doubts appeared first on 24/7 Wall St..
]]>According to analyses from ChatGPT and Claude, Monero (CRYPTO:XMR) stands out as the best crypto to hold through December 31, 2026. Meanwhile, Grok favors Zcash (CRYPTO:ZEC), and two of the three models rank Solana (CRYPTO:SOL) at the bottom. Average year-end predictions suggest Monero could reach around $660, Zcash about $1,360, and Solana about $111.
Monero is trading at about $592, reflecting an 11.3% increase over the past 14 days. Zcash is priced at around $1,225, up 8.0% in seven days, though it remains down 19.9% over the last month. Solana, trading at about $101, has fallen 14.1% in October, hitting a 30-day low of $98.51.
So, how do these year-end target predictions compare with current figures?
What the AI Targets Would Make Monero, Zcash and Solana Worth
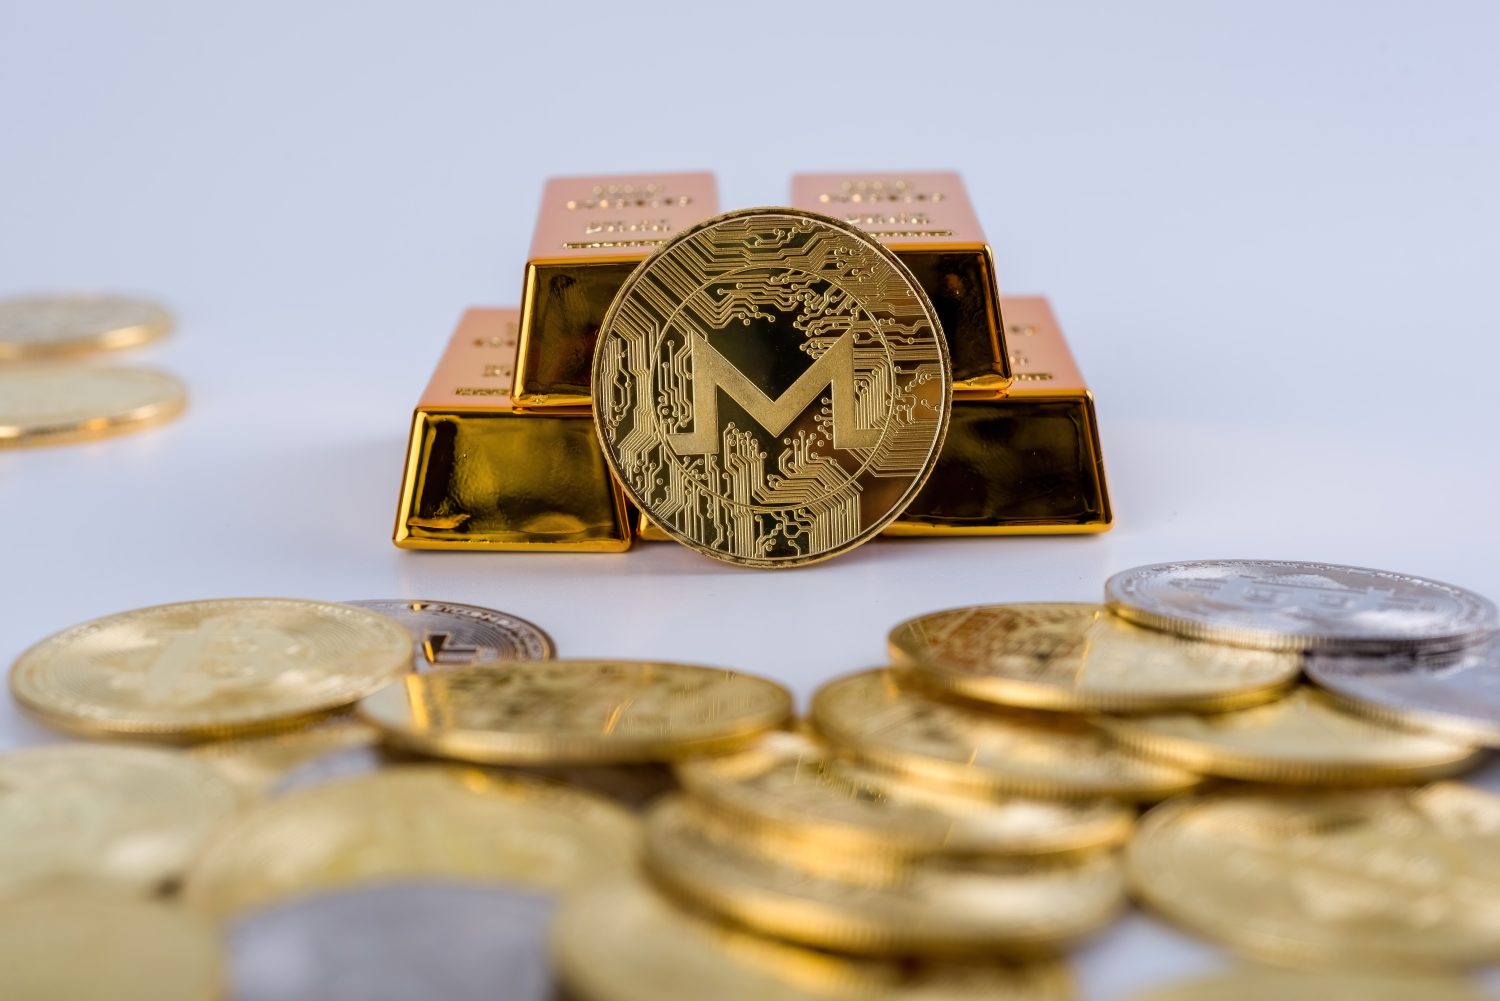
Market capitalization, calculated by multiplying a coin’s price by its circulating supply, offers a clear way to assess target prices. Monero has a market cap of about $11.1 billion. ChatGPT’s target of $680, which it gives a 57% probability, implies a 14.9% gain, bringing Monero’s valuation to around $12.8 billion. Claude’s target of $660, with a 62% probability, anticipates an 11.5% gain.
Both of these predictions fall below Monero’s record high of $797.73 reached on January 14, 2026, which would equate to a market cap of around $15.0 billion at the current supply.
Zcash, with a market cap nearing $20.8 billion, could rise to Grok’s target of $1,580, implying a 29.0% gain and raising its market cap to about $26.8 billion. Zcash’s 2016 peak of $3,191.93 occurred when far fewer coins were in circulation; with about 17 million ZEC available, that price would imply a market cap of roughly $54.2 billion.
For Solana, which has a market cap around $59.4 billion, the targets of $112 from ChatGPT and Grok would boost its valuation to approximately $66.0 billion. Given that there’s no supply cap on Solana, its previous high of $293 would equal a market cap of around $173 billion at the current supply.
Zcash’s NU7 Upgrade Could Influence Its Year-End Performance

Zcash’s upcoming NU7 upgrade, designed to speed up private payments through a network-wide software change, is expected in November, activating at block 3,543,405. Grok’s support for Zcash relates to this upgrade.
ChatGPT also ranks Zcash higher than Solana, even though its expected Zcash return of 10.2% is slightly lower than its Solana forecast of 10.5%, because NU7 gives Zcash a dated catalyst. In contrast, Claude sees Zcash’s recent rebound as a temporary pause, predicting a price of $1,150.
Grok points out two potential risks. First is the “sell-the-news” scenario, where investors exit following the upgrade. The second is a short squeeze running out of steam once short sellers finish buying back. Either could lead to a price drop of 20% to more than 40%. Zcash’s price surged from around $486 in mid-August to around $1,587 by late September, before falling to about $1,129 by mid-October.
Solana Faces ETF Outflows While Monero Faces Delisting Risks

Recent trends show that Solana ETFs, which operate like stock funds holding SOL, have suffered outflows of $25.5 million in the week of October 12 and $17.3 million in the week of October 19, according to SoSoValue. Additionally, Grok notes that SkyAI has sold its entire Solana treasury.
In this context, Solana’s price dropped from about $122 in early October to around $101 by the week of October 25, and it has fallen 48.7% over the past year. Solana trades 65.6% below its all-time high, while Monero is only 25.8% off its peak.
This greater price resiliency is why both ChatGPT and Claude are leaning toward Monero, which has appreciated by 74.1% over the past year. However, both models acknowledge a risk: being a privacy coin, Monero faces increasing regulatory scrutiny, leading to potential delistings that could harm its already thin trading volumes. Monero trades around $138 million in 24-hour volume, compared to Solana’s $2 billion.
Which Is the Best Crypto to Hold Until Year-End?
Monero appears to be the most promising option for reaching its year-end target. It only needs a modest rise, its price targets are below the January record, and it has managed to gain 6.8% over the last 30 days, despite facing potential delisting risks. Monero must first surpass its recent high of about $608, then Grok’s more cautious forecast of $640, before reaching the $680 target.
Zcash has the biggest potential upside, but successfully activating the NU7 upgrade in early November is crucial for It to break its recent weekly high of about $1,373 and reach $1,580. If the upgrade leads to a sell-the-news drop, Claude’s more conservative estimate of $1,150 may be more realistic.
As for Solana, it appears the weakest of the three. A weekly close below $98.51 could make its target of $111 unattainable.
Want Up To $3,000 In Stock? SoFi Is Giving New Active Invest Users Complimentary Stock
Looking to grow your money but unsure where to begin? SoFi Active Invest is offering a limited-time promotion; open a new Active Invest account, fund it with $50 or more, and you could receive up to $1,000 in complimentary stock.
From $0 commission trading3 to fractional shares4 and automated investing, this app is designed to simplify investing for everyone, whether you’re just starting or already experienced. Its easy to sign up and secure your bonus. (Sponsor)
The post 3 AI Models Pick the Best Crypto to Hold Into Year-End: Solana, Zcash or Monero? appeared first on 24/7 Wall St..
]]>Many retirees with a paid-off house weigh whether to stay put or move to cities like Charlotte, Austin, or Charleston, where their adult children and grandchildren have settled. Following them is common, but it comes with different costs than staying put. That’s why a 66-year-old couple choosing between staying in a paid-off home and following the grandkids to a fast-growing city should run the numbers so they can see what each version of retirement actually costs.
Pricing the Stay-Put Baseline
The Bureau of Labor Statistics places average household spending at $78,535 a year. Rounded up to $80,000, that gives a workable budget for a couple with no mortgage. Of course, don’t forget costs like Medicare Part B, which alone runs $202.90 a month per person, or $4,869.60 a year for two. That fits within a healthcare line that also covers Medigap, Part D, and out-of-pocket costs.
| Annual line item | Stay put | Follow the kids |
|---|---|---|
| Property tax, insurance, maintenance | $14,000 | $20,000 |
| Healthcare | $12,000 | $12,000 |
| Food | $12,000 | $12,000 |
| Utilities | $5,000 | $5,000 |
| Transportation | $8,000 | $8,000 |
| Personal, travel, and gifts | $14,000 | $16,000 |
| Reserves (roof, car, emergencies) | $10,000 | $10,000 |
| Income tax on withdrawals | $5,000 | $5,000 |
| Total | $80,000 | $88,000 |
The average aged couple collecting Social Security will receive $3,355 a month after the 3.6% 2027 COLA, or $40,260 a year. The portfolio must cover the rest, and at a 4% withdrawal rate over a 30-year horizon, the couple needs $993,500, or roughly $1 million. If the higher earner waits to claim until 70, the couple’s income floor rises, and the survivor benefit increases, which reduces that number.
What Following Adds to the Bill
In the following case, housing costs rise because the new home is valued at today’s market price, and insurance costs more in coastal Southeast cities. You also budget for trips back to see the friends and siblings you left behind. Buyers coming now also pay for a steep run-up: FHFA data shows prices up 61.64% over five years in Charleston, 59.65% in Wilmington and 63.76% in Hilton Head.
With an $88,000 budget, the portfolio target rises to $1,193,500. That is about $200,000 more, and it still doesn’t include selling costs or movers. At 4%, every $1,000 of new recurring spending requires $25,000 more in savings. The sale itself can also raise Medicare costs. If your home gain tops the home-sale exclusion and pushes joint income above $218,000, each spouse’s Part B premium rises to $284.10 a month for that year.
Why One Move Often Turns Into Two
Adult children in their 30s and 40s change jobs and change cities. IRS migration data shows how much families move back and forth between states: 28,263 returns moved from Florida to Georgia while 23,475 went the other way, and 44,417 moved from California to Texas against 24,970 heading back.
The property-tax protections retirees build up usually work only inside one state. In California, a homeowner over 55 can carry the home’s taxable value to a replacement home bought within two years of selling the original, up to three times (Cal. Rev. & Tax. Code § 69.6(a)).
In Texas, school taxes on a homestead owned by someone 65 years of age or older are capped (Tex. Tax Code § 11.26(a)), and a certificate under § 11.26(h) lets that cap follow you to a new Texas homestead. Once you cross a state line, both protections are gone. A second move to follow the kids means paying a full market-value assessment again, along with a second round of transaction costs.
What Following Without Regret Requires
Staying put works on about $1 million if you withdraw 4% each year, with a paid-off house in reserve as a backstop for long-term care. Following the kids takes closer to $1.2 million plus the cost of moving. The portfolio, a mix of index funds and a Treasury ladder, must keep up with inflation for older households, which the BLS research index puts at 3.6% over the past year.
That 4% figure comes from research done decades ago, and we walk through why it wobbles today, along with an income-first alternative, in a free guide. Social Security funding also carries uncertainty. Trustees project the combined Social Security trust funds will pay only 83% of scheduled benefits after 2034.
If the numbers are tight, renting near the grandkids for two or three years before buying is a lower-cost option that keeps the original home and its tax basis in place, and a move within the current state preserves in-state tax protections. That approach can turn a move retirees may have to make twice into one move.
Released: The Definitive Guide to Retirement Income
(Sponsor) Most people spend their entire working lives focusing on one thing: growing a pile of money. Then they retire and discover the skill they actually need is close to the opposite. Turning that pile into steady income, year after year, through good markets and bad, without ever running out.
It may be the least discussed and most consequential transition in personal finance, and plenty of otherwise careful investors walk into it with no real plan. That is exactly what The Definitive Guide to Retirement Income helps answer. It is a free guide from Fisher Investments covering what your retirement will really cost, where the cash flow should come from, and how much you can safely withdraw each year. Learn more here. Learn More Here ›
The post Following the Grandkids Is the Move Nobody Regrets Out Loud. The Retirees Who Stayed Put Got the Better Deal appeared first on 24/7 Wall St..
]]>On October 23, 2026, the 5-year Treasury Inflation-Protected Security (TIPS) carried a real yield of 2.34%, and the 10-year TIPS carried 2.66%. On the same day, the ordinary 10-year Treasury yielded 5%. A real yield is the yield a bond pays on top of inflation. If you buy a TIPS and hold it to maturity, you lock in that yield above whatever the Consumer Price Index records. Meanwhile, the research inflation index for Americans 62 and older rose 3.6% through September 2026, and Social Security’s 2027 cost-of-living adjustment is also 3.6%. This edition sets TIPS against Procter & Gamble (NYSE:PG), one of the market’s longest-running dividend growers.
How TIPS Work and What You Get Back at Maturity
The Treasury sells TIPS in 5-, 10-, or 30-year terms. With most bonds, the principal remains fixed. A TIPS principal rises with inflation and falls with deflation, adjusted using a version of the Consumer Price Index published by the Bureau of Labor Statistics (TreasuryDirect).
The interest rate, determined at auction, never falls below 0.125%. The Treasury pays that rate every six months on the adjusted principal. The rate remains fixed, but the dollar amount of each payment changes as the principal moves with prices. Purchases start at $100. The Treasury issues new 5-year TIPS in April and October, and new 10-year TIPS in January and July. You can also buy issued TIPS through a brokerage at market prices.
At maturity, you get back either the inflation-adjusted principal or the original principal, whichever is larger (TreasuryDirect). That floor has limits. It protects the original face value, which isn’t always the price you paid. A buyer who pays more than face value on the open market, or who purchases a bond that has already built up inflation adjustments, can get back less than they paid if deflation follows.
Three more limits apply. First, the real yield you get depends on when you buy. The market real yield changes every trading day, so the 2.66% from late October is a snapshot, and it is locked only for buyers who hold to maturity. Second, if you sell early, the price can fall: when real yields rise, existing TIPS lose value, so selling before maturity can mean a loss.
Third, reinvestment risk: interest payments and maturing principal get reinvested at whatever real yields exist at that point, which could be much lower than today’s. U.S. government support guarantees both the stated coupon and the return of principal. That support doesn’t protect the market price before maturity, nor can it make the CPI match your budget. The senior-focused index puts extra weight on housing and medical care, and no benefit or bond is tied directly to it.
Dividend Safety Comes First: Can P&G’s Payout Keep Up With Prices?
A higher yield means little if the payment is at risk, so P&G’s cash coverage comes first. P&G pays $1.0885 per share each quarter, which works out to a forward annual dividend of $4.354. The next payment is due November 16, 2026. Fiscal 2026 was P&G’s 70th consecutive year of dividend increases and its 136th consecutive year of paying a dividend. Free cash flow reached $15.84 billion in fiscal 2026, and management plans to pay “over $10 billion in dividends” in fiscal 2027. Guidance for fiscal 2027 core EPS is $6.89 to $7.11. The forward dividend equals about 62% of the range’s midpoint, leaving room for error.
As of October 26, 2026, the stock’s dividend yield was about 2.61%. That number measures something different from a TIPS real yield. The TIPS figure is earned on top of inflation adjustments. P&G’s yield is a starting cash yield, and it keeps up with inflation only if the board keeps raising the dividend.

Where TIPS Win: A Payment That Cannot Be Cut
A TIPS coupon is a contractual obligation of the U.S. Treasury. A corporate dividend is a board decision that can be reduced at any meeting. P&G is under real cost pressure. Management expects an after-tax cost increase of about $1.4 billion in fiscal 2027 from raw materials, energy, and transportation, based on an assumed Brent crude price of $100 a barrel. Pricing added only 0.4 points to organic sales growth of 4.0% in the first quarter. Management called recovery a matter of time: “We will take the right amount of time to recover the dollar impact of the commodity hurt.” It also added, “The consumer is the key variable here.” The stock adds another risk TIPS do not carry to maturity: it has traded between $133.74 and $165.75 over the past 52 weeks.

P&G’s most recent raise, in April 2026, lifted the quarterly payout by about 3.0%, from $1.0568. That trailed the 3.6% rise in senior inflation through September. Even a Dividend King can lose ground to prices for a year (we ranked ten of them by valuation in a free Dividend Kings report if you want to see which ones look cheapest right now).
Where P&G Wins: A Payment That Can Grow
A TIPS payment rises with the CPI and no faster. A dividend has no such ceiling. P&G’s 2025 raise was about 5.0%, and the quarterly payout has grown about 46% since the $0.7459 paid in 2019. The company sets its own prices in a way bonds cannot.
During its October 22 earnings call, management said that “there is no way to recover this level of commodity pressure without pricing,” and it plans to raise prices alongside product innovation. The shares are also up 15.52% year to date as of October 26, 2026. The move reminds us that prices can rise as well as fall.
Taxes Can Settle This Matchup
TIPS: Interest on Treasury securities is subject to federal income tax and exempt from income taxes imposed by states and localities (IRS Publication 550, 2025). IRS Publication 550 also requires holders to report any annual increase in inflation-adjusted principal as original issue discount, which is a form of interest (Publication 550, 2025). In practice, you owe federal tax on inflation adjustments in the year they happen, even though you don’t receive that money before redemption or sale. This is often called phantom income, and it is taxed at ordinary income rates. For tax year 2026, those rates run from 10% to 37%. The higher inflation runs, the larger the tax bill on money you haven’t received yet. That is why many retired people keep TIPS in tax-deferred accounts such as IRAs, where the annual phantom income problem goes away.
P&G dividends: Qualified dividends face the same 0%, 15%, or 20% maximum rates that apply to net capital gain (Publication 550, 2025). To qualify, you must hold the shares for more than 60 days within the 121-day period that starts 60 days before the ex-dividend date. Dividends get no state exemption, so residents in states with steep tax rates lose part of that federal advantage. You also pay tax only on cash you actually receive. That often shifts the after-tax picture in taxable accounts toward the dividend. In an IRA, both are taxed the same way at withdrawal, so that advantage mostly disappears.
Who Each Option Suits
Retired people who want inflation-linked income backed by the Treasury, can hold to maturity, and have room in an IRA or other tax-deferred account to avoid phantom income may find TIPS appealing. P&G suits retirees with a long time horizon who can live with share-price swings and a slower rate of return, in exchange for a payout that has grown faster than inflation over long periods. It also suits investors in taxable accounts who benefit from the 0%, 15%, and 20% qualified-dividend rates. Retired people whose main worry is a dividend cut may find TIPS a closer fit. Those whose main worry is income that stops growing lean toward P&G.
Got $1,000? Before You Buy PG, Read This
If you have cash sitting in your account right now, give this two minutes. After more than two decades of helping investors beat the market, our top analysts at 24/7 Wall St. put together a definitive report on the Top 10 Stocks To Buy Today. And PG wasn’t one of them.
They combed the entire market. It's not 10 ideas, not 10 stocks everyone is talking about, it's what their research points to as the 10 best stocks to buy right now, and it's free. Read more here and see which stocks made the list –>>
The post TIPS or Dividend Stocks? How Retirees Can Keep Up With Inflation appeared first on 24/7 Wall St..
]]>Denver-based Janus Living (NYSE:JAN) bought Harmony at Greensboro, a North Carolina senior-living community, for $123.5 million in a deal reported on October 6, 2026. The community has 34 memory-care beds. Medicare won’t pay the long-term room, board and custodial-care charges for residents in those beds.
Picture a hypothetical Greensboro family. Their widowed mother, 82, has a dementia diagnosis, and they choose one of those memory-care rooms for her, and the tour covers on-site therapy and rehab, so her children assume Medicare will cover part of the cost. After all, it has paid her doctor and hospital bills since she turned 65. That assumption breaks on the first invoice. Medicare pays nothing toward the monthly memory-care charge.
Why a Dementia Diagnosis Leaves the Monthly Bill With Your Family
Most of what families pay for in memory care is long-term custodial care: help with dressing, bathing, using the bathroom and the other daily tasks dementia gradually takes away. Medicare doesn’t cover long-term custodial care in an assisted living facility simply because the resident has a medical diagnosis. It can still cover qualifying medical services, but the room, board and daily personal care remain outside that benefit.
Medicare Still Covers Her Medical Care Inside the Building
Her Medicare card still works at Harmony. Doctor visits, hospital care, covered prescriptions and Part B therapy continue as before, subject to the 2026 Part B premium of $202.90 a month and the $283 annual deductible.
Suppose she falls and breaks a hip. Under Original Medicare, a medically necessary inpatient hospital stay of at least three consecutive days can help qualify her for a short stay in a Medicare-certified skilled nursing facility if she also needs daily skilled care. In 2026, skilled nursing costs $0 for days 1 through 20 after the applicable Part A deductible, then $217 a day for days 21 through 100. Medicare stops paying sooner if she no longer needs qualifying skilled care, and after day 100 she pays the full cost.
Time spent under hospital observation generally doesn’t count toward that three-day inpatient requirement. Medicare Advantage plans and some qualifying care arrangements can waive the three-day rule, so families should check the patient’s specific coverage before assuming a hospital stay qualifies her for rehab.
Once rehab ends and she returns to her memory-care room, the custodial charge starts again, still on the family’s account. Medicare covers the hip surgery and the therapy, but the residential bill stays with the family.
Her Social Security Check Covers Only a Slice
The average widow or widower living alone receives $1,936 a month from Social Security, rising to $2,005 after the 3.6% cost-of-living adjustment that takes effect for 2027. Most beneficiaries have the Part B premium deducted from that check before it arrives. The rest of the memory-care rate has to come from savings, home-sale proceeds or relatives.
Families who planned ahead may have long-term care insurance, which can become difficult or impossible to buy after a dementia diagnosis. North Carolina also offers help for qualifying low-income residents, but Medicaid doesn’t simply pick up the memory-care room-and-board bill. Medicaid can cover eligible personal-care and medical services in adult care homes, while the state’s Special Assistance program can help qualifying residents with room and board at participating facilities.
If your parent already has a long-term care policy or enough savings to cover several years of private-pay care, this gap is a budgeting problem. Without either one, it becomes a funding problem. It starts the day she moves in (the custodial-care gap is one of several Medicare surprises we mapped in a free guide to Medicare’s hidden bills, from IRMAA surcharges to coverage holes like this one).
Three Questions to Ask Before Signing the Admission Agreement
- Get the base monthly rate in writing. Make sure every care-level add-on is documented, too. Memory-care pricing can add charges for issues like medication management, incontinence care and extra supervision on top of the base rate. Ask what triggers a move to a higher care level and how often staff reassess.
- Ask how each service gets charged. Covered physician visits and therapy generally run through Part B or her Medicare Advantage plan, while covered outpatient prescriptions run through Part D or the drug coverage in her Medicare Advantage plan. Room, board and personal care stay on the facility bill.
- Confirm her hospital status in writing. If she is hospitalized, ask before discharge whether she was admitted as an inpatient or kept under observation. Her status determines whether Medicare covers the first 20 rehab days in full or the family pays for every day.
Families who know which bills Medicare pays can budget for the monthly charge from the start, without waiting for coverage that will never come. Medicare will pay for the hip surgery, the hospital stay and the rehab. The memory-care rent, the supervision and the help getting dressed every morning stay with the family, so fund them before she moves in.
Released: 401k & IRA Tips and Answers
(sponsor) 401(k)s are powerful retirement tools. But even savvy savers can make mistakes that quietly cost you money for decades. Choosing the wrong fund, ignoring small fees nobody adds up, rollover steps done in the wrong order, the list goes on.
These sort of mistakes is exactly what 401k & IRA Tips and Answers was created to help prevent. It is a free guide from Fisher Investments on rollovers, contributions, required withdrawals and the mistakes that do the most damage to a retirement account. Learn More Here ›
The post She Moves Into One of 34 Memory-Care Beds at a $123.5 Million Senior Community. Medicare Won’t Pay for Her Long-Term Stay appeared first on 24/7 Wall St..
]]>CoinDCX, India’s largest cryptocurrency exchange, said it lost about 15.99 million Tether (CRYPTO: USDT), worth around $16 million, from old wallets that it said were no longer in use after a July 2025 hack. This revelation came just days after CEO Sumit Gupta dismissed earlier breach reports as “a false alarm.” It raises an important question for anyone who wants to keep crypto on an exchange.
According to CoinDCX, customer funds were not affected, and the company has promised to cover the loss. However, this incident reminds us that while your balance may look secure in an app, the systems behind it can fail unexpectedly. So, how vulnerable are those who keep Bitcoin (CRYPTO: BTC) or other cryptocurrencies on an exchange?
What Led to CoinDCX Losing $16 Million From Retired Wallets?

Exchanges manage customer funds using two types of wallets. Hot wallets connect to the internet to enable quick transactions, while cold wallets are offline, making them more secure against theft. CoinDCX’s troubles began with deposit addresses it set up in January 2025, which were compromised in a July 2025 hack.
Although CoinDCX said it had stopped using those old addresses, customers kept sending funds to them. Unfortunately, the internal service responsible for transferring those deposits into safer wallets failed. On-chain investigator ZachXBT noted that one of the compromised addresses still directed deposits to CoinDCX’s current hot wallet as recently as April and May.
| Item | Detail |
|---|---|
| Exchange | CoinDCX, the largest in India by trading volume |
| Loss | About $16 million in USDT |
| Cause | Failed sweep of deposits sent to retired wallets |
| Who paid | CoinDCX, which agreed to cover the losses |
CoinDCX’s customers are covered only because the exchange chose to absorb the loss and had the funds to do so. The company acknowledged it could have communicated the incident sooner.
An Exchange Balance Is an IOU Without Federal Insurance

When you keep your cryptocurrencies on an exchange, you don’t truly “own” those coins; the exchange does. Instead, you hold a claim to them. In the U.S., crypto on exchanges lacks FDIC insurance, and the Securities Investor Protection Corporation (SIPC) does not extend protections to cryptocurrencies not classified as securities.
In contrast, traditional bank customers enjoy strengthened protections. FDIC insurance covers up to $250,000 per depositor, and when a bank fails, another institution often assumes its accounts. For instance, when regulators shut down Nano Banc in Irvine, California, on September 25, Sunwest Bank took over its account holders’ deposits.
Conversely, crypto customers may face a lengthy court process. After the Mt. Gox exchange collapsed in 2014, its trustee pushed the creditor repayment deadline to October 31, 2027, stretching the wait to about 13 years. FTX customers received compensation based on their account values as of November 2022 but missed out on Bitcoin’s subsequent price rise.
While market fluctuations may seem daunting, the bigger risk lies in how you manage custody. For example, Ethereum (CRYPTO: ETH) has plunged around 44% over the past year, but holders still possess their coins.
If an exchange holding a customer’s entire $20,000 balance fails, that amount becomes part of a bankruptcy claim. In contrast, a holder who keeps $2,000 on the exchange and stores $18,000 in a personal wallet risks only $2,000.
Different Ways to Hold Crypto Carry Their Own Risks

Keeping all your crypto on an exchange is the easiest option, with quick trades and easy password resets, but it’s not ideal for long-term investors. Regular proof-of-reserves reports—showing that an exchange holds enough coins to cover customer balances—can help, but they reflect only one moment in time and may not account for the exchange’s other liabilities. Additionally, insurance may cover only specific types of hacks, not a complete failure.
A more balanced approach is to split holdings. This means keeping a small trading balance on the exchange while storing most of your coins in a wallet where you control the private keys—the secret codes that secure your assets. This way, an exchange only retains what you might need for a short-term trade.
Full self-custody removes exchange-related risks but introduces others. If you lose your recovery phrase—the backup words used to restore access to your wallet—you could permanently lose your coins. This method suits experienced users who rarely sell and manage their backups carefully. Meanwhile, spot Bitcoin ETFs secure assets with a regulated custodian.
Is It Safe to Keep Crypto on an Exchange?
In short, it’s generally safe to keep cryptocurrencies on an exchange for regular trading, but long-term holdings are at risk. Consider your balance size; if losing access for years would be damaging, it’s too large to keep on an exchange. Regular proof-of-reserves reports, transparent communication, and a history of covering losses can enhance a platform’s reliability. CoinDCX’s handling of this incident highlights the importance of prompt, clear disclosure to maintain customer trust.
Consider the costs and responsibilities of moving coins off an exchange to help protect your investments.
Want Up To $3,000 In Stock? SoFi Is Giving New Active Invest Users Complimentary Stock
Looking to grow your money but unsure where to begin? SoFi Active Invest is offering a limited-time promotion; open a new Active Invest account, fund it with $50 or more, and you could receive up to $1,000 in complimentary stock.
From $0 commission trading3 to fractional shares4 and automated investing, this app is designed to simplify investing for everyone, whether you’re just starting or already experienced. Its easy to sign up and secure your bonus. (Sponsor)
The post An Indian Exchange Lost $16 Million From Wallets It Said It Had Retired. Is It Safe to Leave Crypto on an Exchange? appeared first on 24/7 Wall St..
]]>SanDisk (NASDAQ:SNDK) trades at $1,260.93 after a sharp October sell-off. The 24/7 Wall St. price target stands at $1,407.07 over the next 12 months. That implies 11.59% upside, and we rate the stock a strong buy.
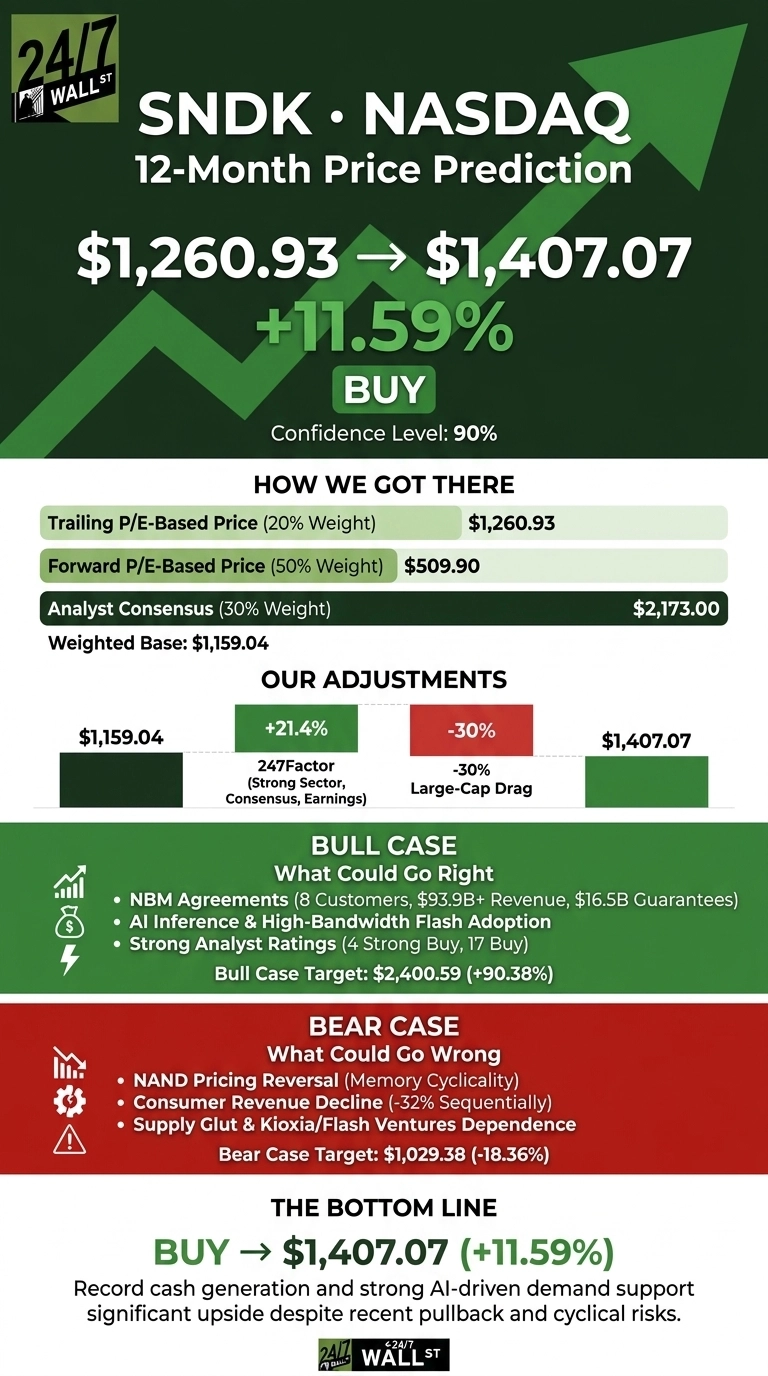
| Metric | Value |
|---|---|
| Current Price | $1,260.93 |
| Price Target from 24/7 Wall St. | $1,407.07 |
| Upside/Downside | 11.59% |
| Recommendation | BUY |
| Confidence Level | 90% |

SanDisk is generating record cash at very high margins, but the stock is priced as if the NAND cycle has already peaked. In our view, the pullback has gotten ahead of the fundamentals.
A 33% Monthly Slide Masks a Record Fiscal Year
SanDisk fell 9.47% over the past week and 33.09% over the past month. That leaves it about 46% below its 52-week high of $2,354.39. Shares are still up 431.92% year to date, and Barron’s listed SanDisk Friday among the stocks explaining today’s market.
Fiscal fourth-quarter revenue reached $8.965 billion, up 371.6% year over year. Non-GAAP EPS of $39.25 beat the $33.28 estimate, the fifth consecutive beat. For the first quarter of fiscal 2027, management forecast to revenue of $10.30 billion to $10.80 billion and EPS of $44 to $46. The board also authorized an additional $14 billion in buybacks.
Why Bulls See $2,400 Ahead
Visibility supports the upside thesis. SanDisk has signed New Business Model (NBM) agreements with 8 customers. At floor pricing, those deals carry a minimum of $93.9 billion in expected revenue, backed by $16.5 billion in financial guarantees. CEO David Goeckeler said customers are “giving us demand signals all the way out to the end of the decade.”
Analyst ratings stand at 4 Strong Buy, 17 Buy, 3 Hold and 1 Strong Sell. The consensus target implies about 72% upside. The bullish case reaches $2,400.59, a 90.38% gain, if pricing holds and high-bandwidth flash gains traction.

What Could Break the NAND Story
Memory is a cyclical business. About two-thirds of fourth-quarter sequential growth came from higher pricing, so new supply would hit earnings quickly. Consumer revenue fell 32% sequentially to $556 million.
SanDisk also depends heavily on Kioxia through the Flash Ventures joint venture. The bear case stands at $1,029.38, a decline of 18.36%.
As a counterpoint, the consumer drop partly reflects bits being shifted to Datacenter, which grew from about 12% of bits to 38%. Floor prices in the NBM contracts also limit how far pricing can fall.

How SanDisk Compares to Micron and Western Digital
Micron Technology (NASDAQ:MU) is the closest AI memory peer. Its fiscal fourth-quarter revenue rose 379.27% to $54.229 billion. Micron’s margin guidance is similar to SanDisk’s, yet its market value is far larger, which leaves SanDisk room to re-rate.
Western Digital (NASDAQ:WDC) is SanDisk’s former parent and now focuses on hard drives. It offers a useful contrast on the same AI storage demand.
Its fiscal first-quarter non-GAAP EPS of $4.64 beat the $4.0771 estimate, but its margins are well below SanDisk’s. Measured against both peers, our target looks reasonable and arguably conservative.
| Company | Next-Quarter Non-GAAP Gross Margin Guide | Market Cap |
|---|---|---|
| SanDisk | 83.0% to 85.0% | $183.41B |
| Micron | 86.25% | $980.92B |
| Western Digital | 60% to 61% | $129.69B |
Signed Visibility Could Power SanDisk’s Rebound
The 24/7 Wall St. price target is $1,407.07, with a buy rating and 90% confidence. Contracted visibility is the critical factor for me.
The upside thesis strengthens if NBM deals keep growing and first-quarter results land within guidance. The thesis weakens if NAND pricing falls over before signed volumes build up. At about 16x trailing earnings, the October drop leaves shares trading below our target.
SanDisk’s longer-term trading range appears below, assuming current growth trends and market conditions hold.
| Year | Bear | Price Target from 24/7 Wall St. | Bull |
|---|---|---|---|
| 2026 | $1,212.39 | $1,293.03 | $1,390.90 |
| 2027 | $1,076.94 | $1,412.83 | $2,131.85 |
| 2028 | $983.36 | $1,523.16 | $3,211.19 |
| 2029 | $966.80 | $1,661.59 | $4,081.09 |
| 2030 | $969.18 | $1,763.78 | $4,815.42 |
They rest on SanDisk continuing to execute on its NBM agreements and its BiCS technology roadmap. Adoption of high-bandwidth flash could push results above these figures, while a NAND supply glut would move them toward the bear column.
Got $1,000? Before You Buy SNDK, Read This
If you have cash sitting in your account right now, give this two minutes. After more than two decades of helping investors beat the market, our top analysts at 24/7 Wall St. put together a definitive report on the Top 10 Stocks To Buy Today. And SNDK wasn’t one of them.
They combed the entire market. It's not 10 ideas, not 10 stocks everyone is talking about, it's what their research points to as the 10 best stocks to buy right now, and it's free. Read more here and see which stocks made the list –>>
The post SanDisk Stock Is Back on Wall Street’s Radar. Here’s Where I See It Going appeared first on 24/7 Wall St..
]]>A retired couple living on pension income can sell appreciated stock every December and owe no federal tax on the gain. This works year after year until one spouse turns 73. That’s when the first required minimum distribution (RMD), the annual withdrawal the IRS requires from tax-deferred retirement accounts, adds ordinary income and pushes part of those same gains into the 15% bracket. We recently looked at how a Roth conversion fits the zero rate within a single year. This time the trigger is a birthday, so the question is about timing across years.
How Capital Gains Stack on Top of Pension Income
For 2026, married couples filing jointly pay 0% on long-term gains (assets held more than a year) as long as taxable income stays at or below $98,900. The key idea is stacking, and ordinary income, such as pensions and IRA withdrawals, fills the brackets first, and gains sit on top. Only the gains that fit under that line after all ordinary income is considered get the zero rate.
Deductions expand that space; in 2026, the standard deduction for joint filers is $32,200, plus $1,650 for each spouse age 65 or older. There’s also a recent senior deduction of $6,000 per person, available from 2025 through 2028. For joint filers, it starts phasing out once modified adjusted gross income (MAGI) goes above $150,000.
Modeling the Window Before and After the First RMD
The model makes a few assumptions. First, both spouses are 72 in 2026, have $60,000 in combined pension income, and receive no Social Security. Their traditional IRA held $800,000 at the end of the prior year, and their taxable brokerage account has plenty of long-term gains. The 2026 thresholds are used for both years so the comparison remains clean.
Before RMDs begin, their deductions total $47,500. That leaves enough space to sell $86,400 of gains at 0%, and MAGI comes out to $146,400, just under the senior deduction phase-out. RMDs start at age 73 for anyone who turned 72 after December 31, 2022. The IRS divisor at that age is 26.5, so the first RMD comes to about $30,189. That cuts the zero-rate space to about $56,211.
If the couple sells the full $86,400 anyway, roughly $30,189 of it is taxed at 15%, costing about $4,528. MAGI also rises past the senior deduction phase-out line, pushing more of it into the 15% bracket. Put simply, each dollar of RMD pushes out a dollar of gain that would have been tax-free.
Harvesting a gain means selling and buying the same shares right back, which resets the cost basis (the purchase price the tax code uses) to today’s higher value. The wash sale rule in 26 U.S.C. § 1091(a) blocks a loss deduction when the same security is bought within 30 days. It only covers losses, so buying back right after selling at a gain is allowed.
Roth Conversions Compete for the Same Low-Income Years
These same years are also when many retirees do Roth conversions. A conversion is considered ordinary income, so it raises the floor that benefits stack on top of. The more space conversions use, the less is left for gains taxed at zero. One way to weigh it is to look at the bracket future RMDs would land in. If they’d push the couple above the 22% line, which starts at $100,800 of taxable income for joint filers, converting now tends to look better (we walked through how a large pre-tax balance becomes a first-year tax bill once withdrawals begin, and how to shrink it years early, in a free guide here). A small IRA paired with large unrealized gains tips the math toward harvesting.
Income Lines That Count Gains Taxed at Zero
Gains taxed at 0% still count as income everywhere else. The net investment income tax applies to joint filers with MAGI above $250,000. For couples who also collect Social Security, up to 85% of benefits can become taxable once half the benefits plus all other income goes above $44,000.
Medicare premiums also depend on income. The standard Part B premium for 2026 is $202.90, and joint filers with income over $218,000 pay at least $284.10. The surcharge is based on the tax return from two years earlier, so a big harvest year shows up on a later Medicare bill.
Tools That Protect the Zero-Rate Space After RMDs Start
Qualified charitable distributions (QCDs) are gifts sent straight from an IRA to a charity. They’re available from age 70 1/2, with a 2026 limit of up to $111,000 per person. They count toward the RMD but don’t count toward taxable income, so they protect the zero-rate space. Giving appreciated shares directly to charity avoids realizing the gain. Heirs who inherit stock get a basis equal to its fair market value at the date of death, which is why most people hold appreciated positions instead of selling them.
A December Routine for Every Year Before the First RMD
For a couple in this spot, the year-end routine usually goes like this. Estimate the year’s pension income, subtract deductions, and see how much room you have under the 0% line. Then sell and buy back long-term winners up to that amount, while watching the $150,000 senior deduction phase-out and the $218,000 Medicare line. The thresholds change every year, and the senior deduction is scheduled to end after 2028. Once the first RMD arrives, the space shrinks by about the size of that withdrawal.
Help Avoid These 13 Retirement Mistakes Before They Derail Your Future
One investment mistake could create big risks for your retirement. Many investors make the same critical errors: being too conservative, making big bets on “sure things,” or paying excessive fees. Any of those blunders can endanger your hard-earned savings.
Now you can learn the mistakes even experienced investors make (and ways you can sidestep them before it’s too late) with this new guide: 13 Retirement Mistakes and How to Avoid Them from Fisher Investments. (sponsor)
The post A Retired Couple Living on Pension Income Can Sell Stock at 0% Capital Gains Every Year Until 73. Then the First RMD Lands Underneath Those Gains, and Part of Every Sale After That Is Taxed at 15% appeared first on 24/7 Wall St..
]]>Ethereum (CRYPTO: ETH) is trading about 6% above the critical $2,180 level, where a whale’s massive $214 million long position is at risk of liquidation, according to on-chain tracker Lookonchain. Ethereum was at $2,315 on the morning of October 26, 2026, down 0.7% in the past 24 hours and 13.2% for the month of October.
Recently, ETH hit a low of $2,276 on October 24, marking the month’s lowest point. If this downtrend continues, ETH could hit a two-month low. So, what has caused this shift, and is a drop to $2,180 possible?
Fed Caution, AI Concerns and ETF Outflows Are Weighing on ETH
Factors outside the crypto world are driving Ethereum’s price decline. On October 26, Bitcoin (CRYPTO: BTC) also dipped as investors became cautious ahead of a Federal Reserve meeting. Additionally, concerns about increased spending in AI sectors weighed on stocks and cryptocurrencies alike, especially as major tech firms were set to announce earnings. Consequently, smaller tokens like Ether followed Bitcoin’s downward trend.
Pratik Kala, a portfolio manager at Apollo Crypto, noted that many systematic funds and algorithmic traders view Bitcoin as a riskier asset. When these funds reduce exposure to riskier assets, they often sell both Bitcoin and Ethereum.
Furthermore, Ethereum has recently lost a consistent buyer. Spot Ether ETFs—funds that hold ETH directly and trade like stocks—experienced a withdrawal of $225 million during the week of October 19. When investors pull money out of these funds, it often leads to ETH being sold off or fewer purchases.
A $214 Million Whale May Be Approaching Liquidation

ETH’s recent drop poses a significant risk to a major whale. Lookonchain tracks a trader who holds 93,184 ETH, valued at $214 million, in leveraged long positions. These positions profit when prices rise but are funded mainly with borrowed money, secured by a cash reserve called margin. If losses exceed that margin, the exchange will automatically sell the position, forcing a liquidation that can further push the price down.
This trader has already added margin once, contributing $5.67 million in USD Coin (CRYPTO: USDC) as a buffer. This adjustment shifted his liquidation prices from $2,256 and $2,227 on October 24 to $2,182 and $2,178 on October 25.
However, this position comes at a cost. The trader is currently down $18.6 million and has incurred $2.7 million in funding fees, regular payments between traders on perpetual futures contracts. AI-driven selling has exacerbated ETH’s decline, and if liquidation occurs, the resulting forced sell-off could trigger a steeper drop.
ETH Trades Below Key Averages With Weak Support Under $2,276

Moving averages—averages of closing prices over a specified period—help traders identify trends. ETH’s 20-day moving average sits at $2,453, while its 50-day average is at $2,543. This means that most recent buyers are currently facing losses.
Heavy selling activity hit at the start of the month, with ETH dropping from a close of $2,697 on October 6 to $2,573 on October 7, then to $2,473 on October 8, during the month’s highest-volume trading days.
On October 24, ETH plummeted to $2,276 in just one intense hour of trading before bouncing back to close at $2,355. Such a fast fall followed by a rebound often signals forced selling, which may stop once overleveraged positions are cleared. However, since ETH hasn’t dipped below $2,276 since August 20, there’s little recent support before the critical $2,180 level, with its 90-day low at $1,820 much lower.
Ethereum Has Declined More Sharply Than Bitcoin, but Less Than Solana

| Time Period | ETH | BTC | SOL |
|---|---|---|---|
| Last 24 hours | -0.7% | -1.1% | +0.2% |
| One month | -13.6% | -5% | -16.4% |
| Year to date | -21.5% | -8.4% | -18.5% |
Over the past month, Ethereum has declined more sharply than Bitcoin, which is down only 5%. However, it has fared better than Solana (CRYPTO: SOL), down 16.4%. Bitcoin benefits from a larger pool of institutional buyers, which helps it hold its value better during sell-offs. Caroline Mauron, co-founder of Orbit Markets, remarked that “Bitcoin has so far been relatively resilient to the AI debt concerns that are weighing on all risk assets.”
ETH and Solana often behave more like high-risk tech stocks, attracting leveraged traders who tend to sell more aggressively during downturns. ETH is also facing pressure from $225 million in weekly ETF outflows.
Could the Ethereum Price Fall to $2,180?
Yes, ETH could drop to $2,180, especially if it closes a day below $2,276. Large traders are split. Lookonchain highlighted a trader with a perfect track record of profitable trades, who opened a $63.9 million long on 26,974 ETH and has gained $842,000 so far. In contrast, BitMEX co-founder Arthur Hayes sold $28.8 million in tokens, primarily ETH and Ethena (CRYPTO: ENA), for a profit of $6.65 million.
With the Federal Reserve meeting and crucial tech earnings on the horizon, the whale’s fate remains uncertain, and he could add margin again, while BitMine Immersion Technologies (NYSE: BMNR) keeps buying. If ETH closes a day below $2,276, a run at his $2,182 and $2,178 liquidation prices looks likely. If ETH climbs back above its $2,453 20-day average, the threat could fade.
Want Up To $3,000 In Stock? SoFi Is Giving New Active Invest Users Complimentary Stock
Looking to grow your money but unsure where to begin? SoFi Active Invest is offering a limited-time promotion; open a new Active Invest account, fund it with $50 or more, and you could receive up to $1,000 in complimentary stock.
From $0 commission trading3 to fractional shares4 and automated investing, this app is designed to simplify investing for everyone, whether you’re just starting or already experienced. Its easy to sign up and secure your bonus. (Sponsor)
The post Ethereum Analysis: Could ETH Fall to $2,180 and Liquidate a $214 Million Whale? appeared first on 24/7 Wall St..
]]>Engagement doubts are outweighing an earnings beat at Netflix (NASDAQ:NFLX), and the selling is spreading across streaming and media stocks. Netflix stock is at $63.54, down 4% in afternoon trading, the biggest loss in the group as post-earnings selling extends.
Meanwhile, Walt Disney (NYSE:DIS) stock is at $110.11, down 2%, a softer pullback than the Netflix stock drop. Spotify Technology (NYSE:SPOT) stock is at $570.05, down 2%, a smaller retreat than the Netflix stock decline.
At the same time, the Communication Services Select Sector SPDR ETF (NYSEARCA:XLC) is at $104.33, down 1%, indicating a lighter decline for the sector. The SPDR S&P 500 ETF Trust (NYSEARCA:SPY) is up 0.6% to $764.34, keeping the broad market in positive territory.
View-Hour Worries Overshadow a Q3 Earnings Beat
Pressure on Netflix stock has built since the company’s Q3 2026 report, which delivered GAAP EPS of $0.87, exceeding Wall Street’s forecast, with sales in line with estimates. Its full-year top-line guidance landed at the lower end of Netflix’s outlook and slightly below consensus. Management also trimmed the 2026 advertising revenue outlook to $2.7 billion from $3 billion, citing a slower-than-expected launch of some product capabilities.

Engagement is the greater worry for Netflix, and management addressed it directly on the October 20 call. Netflix didn’t report growth in watch hours for the quarter, and co-CEO Greg Peters stated, “We know that we can do better,” about U.S. engagement. Co-CEO Ted Sarandos added, “We do need better execution in the U.S.”
Netflix Bears the Brunt Among Streamers
Pressure is biggest on Netflix stock, given the questions over the company’s engagement. Within the sector fund, Netflix carries a slightly larger weight than Disney, at 4.8% of net assets versus 4.5% as of June 30.
Supporters of Netflix stock can point to churn. Peters said improved globally and in the U.S. year over year, along with $4.8 billion of Q3 repurchases funded by free cash flow. Peters also argued. U.S. members pay “the least per hour of viewing compared to other SVOD offerings in the country.” Skeptics counter that view-hour growth remains slow and that the ads business is “a bit behind our aggressive target for the year,” in Peters’ words.
International markets offer Netflix a balance, with view hours in India growing 24% in Q3 and non-English content exceeding a third of the total. Sarandos said the U.S. business is “just not growing as fast as it could or as fast as we’d like,”. He called for more hits that travel globally.
What the Engagement Debate Means for Netflix
The next test for Netflix is whether its Q4 2026 content slate lifts U.S. engagement. Highlights include East of Eden, season four of The Diplomat, the final season of Emily in Paris, a Thanksgiving Eve NFL game and Christmas Day matchups. Management guided Q4 revenue to $13.4 billion, with a 26% operating margin that includes a drag from headcount reductions.
Netflix also cut its full-year free cash flow outlook. It trimmed the outlook to $12 billion from $12.5 billion on a Q4 real estate transaction, though $22.3 billion remains under its buyback authorization after a record Q3.
Shareholders could look for signs that those Netflix titles speed up view-hour gains, which management described as an accelerant to already healthy revenue growth. Expansion of the ad tier into 15 new countries, beginning in March 2027, gives Netflix a second lever to pull. Traders may prefer to keep their exposure smaller until Netflix’s engagement question is settled.
Got $1,000? Before You Buy NFLX, Read This
If you have cash sitting in your account right now, give this two minutes. After more than two decades of helping investors beat the market, our top analysts at 24/7 Wall St. put together a definitive report on the Top 10 Stocks To Buy Today. And NFLX wasn’t one of them.
They combed the entire market. It's not 10 ideas, not 10 stocks everyone is talking about, it's what their research points to as the 10 best stocks to buy right now, and it's free. Read more here and see which stocks made the list –>>
The post Netflix Drops 4% as Engagement Worries Outweigh Earnings Beat; Disney and Spotify Slip appeared first on 24/7 Wall St..
]]>A fresh Buy rating from StoneX is pulling optical networking stocks higher, and Lumentum Holdings (NASDAQ:LITE) is out in front. Lumentum stock is up 8% to $819.98 in afternoon trading, a gain that shows buyers returning to the AI optics trade after a rough month for the group.
At the same time, shares of Applied Optoelectronics (NASDAQ:AAOI) are at $71.85, up 6%, running a close second to the leader. Coherent (NYSE:COHR) stock is at $220.93, up 6%, matching Applied Optoelectronics pace for pace. That breadth shows the buying reaches across optics, well beyond the single stock that drew the new analyst coverage.
Fund figures tell the same story with less force. The Roundhill Photonics & Optics ETF (CBOE:LYTE) is up 4% to $18.96, a gain that trails the aforementioned individual optics stocks. Meanwhile, the SPDR S&P 500 ETF Trust (NYSEARCA:SPY) is up 0.7% to $765.32, leaving the optics names well ahead of the broad market.
StoneX Initiation Sparks Optics Rebound
StoneX started coverage of Lumentum stock with a Buy rating and a $1,200 price target. Lumentum makes lasers and optical components for data center and telecom networks. That puts the company directly in the path of AI infrastructure spending by cloud operators. A bullish initiation from a firm that’s new to the name carries extra weight after the pressure optics stocks have absorbed.

Optics stocks slid steeply over the past month before the initiation landed. Questions about how customers will fund large AI infrastructure projects weighed on the timing of orders for optical components across the group. Against that background, the rally in Lumentum shares offers an early read on whether a bullish analyst view can pull the sector out of its slide.
Optics Buying Spreads Past Lumentum
Coherent makes optical transceivers and the materials behind them, with a technology stack that runs from compound semiconductors up through finished modules. That vertical reach gives Coherent more control over its supply chain as AI data centers shift from copper to optical connections between servers. The risk is that Coherent is spending heavily to expand capacity, and the order-timing questions that hit the group apply to its transceiver business as well.
Applied Optoelectronics makes fiber-optic transceivers and lasers, and its revenue is concentrated among a small number of large customers. Such a customer base cuts both ways, since one big order can lift results sharply while a delay from a single buyer can leave a visible gap. Next to Coherent’s broader portfolio, Applied Optoelectronics offers a narrower way to participate in the optics expansion, with less diversification behind it.
Roundhill’s photonics fund gives Lumentum and Coherent its two heaviest weights, alongside several overseas optical suppliers and a smaller stake in Applied Optoelectronics. Owning a wider basket spreads the fund’s risk across many names, moderating both its upside and its downside relative to any single optics stock, yet this diversified basket is still moving higher, showing that the buying reaches past the three stocks leading the group.
What the StoneX Call Means for Lumentum and the Optics Rebound
The next test for Lumentum is whether AI customers turn their expansion plans into firm optical orders, since a rating initiation sparks interest but sustained gains depend on order flow that confirms the bullish view.
Momentum favors Lumentum for now, though gains this sharp after a steep slide can fade quickly if order data disappoints. Investors should keep their position sizes modest while the AI funding issue is still in flux.
Got $1,000? Before You Buy COHR, Read This
If you have cash sitting in your account right now, give this two minutes. After more than two decades of helping investors beat the market, our top analysts at 24/7 Wall St. put together a definitive report on the Top 10 Stocks To Buy Today. And COHR wasn’t one of them.
They combed the entire market. It's not 10 ideas, not 10 stocks everyone is talking about, it's what their research points to as the 10 best stocks to buy right now, and it's free. Read more here and see which stocks made the list –>>
The post Lumentum Jumps 8% as StoneX Starts Coverage With $1,200 Target; Applied Optoelectronics and Coherent Climb 6% appeared first on 24/7 Wall St..
]]>For six years, Dow (NYSE:DOW) paid shareholders the same amount every quarter: $0.70 per share, starting with the May 2019 payment. In July 2025, the board cut it in half to $0.35. That rate has now held through six straight announcements. The latest came on October 15, 2026, with payment due December 11, 2026.
One Number Tells You How Dow Is Doing
Dow’s quarterly dividend per share is the cash that actually lands in your account. Unlike adjusted earnings, which can leave out charges, a dividend payment reflects cash actually paid out. At the old rate, Dow paid out roughly $490 million to $496 million a quarter. The lower rate brings that down to $249 million to $253 million.
Why Dow Had to Cut
Cash generation fell short of the payout. Operating cash flow tracks day-to-day cash generation. It fell from $7.475 billion in 2022 to $1.032 billion in 2025. That same year, Dow spent $2.479 billion on plants and equipment and $1.49 billion on dividends, while posting a GAAP net loss of $2.62 billion. Dow covered the gap with borrowed money.
Total debt reached $19.598 billion at the end of 2025, up from $17.645 billion a year earlier. Former CEO Jim Fitterling called the chemical slump an “unprecedented industry downturn”. The setup is a classic warning sign. A high payout funded by debt as cash flow collapsed is one we flagged in a free guide to spotting dividend cuts before they happen.
Cash Flow Has Turned, but Debt Gets Paid First
The recovery shows up in cash flow. Third-quarter 2026 operating cash flow came in at $1.838 billion, compared with $706 million of capital spending and $253 million in dividends. CFO Jeffrey Tate put free cash flow, the cash left after running and maintaining the business, at $1.1 billion for the quarter. Second-quarter adjusted EPS of $1.44 came in ahead of the $1.28 estimate, helped by a 30% jump in polyethylene prices.

Management has said where extra cash goes next. “We are prioritizing debt reduction with excess cash,” Tate said on the October 22 call. Dow expects to retire about $1.4 billion of debt and reports about $14 billion of liquidity, with no substantial due dates until 2029. Management did not talk about the dividend on that call.
For income investors, the $1.40 annual payout works out to a yield of about 4.1% at today’s price of $34.13. The stock gained 38.36% from the day the cut was announced through October 23.

Signals That Matter Before the Next Declaration
- Bullish: Operating cash flow keeps covering capital spending and the roughly $250 million quarterly dividend. Management expects about $1.3 billion in self-help benefits in 2027 and cash conversion of 70% to 80%. As debt comes down, the board has more room to consider a raise.
- Bearish: Cash flow slips back toward the negative $470 million Dow posted in the second quarter of 2025. Watch for excess industry capacity, high European energy costs, and Middle East disruption, all of which management highlighted.
Fourth-quarter EBITDA guidance of about $1.5 billion will be the next test.
Bottom Line for Income Investors
The $0.35 dividend offers a clear signal. It shows how much cash Dow’s board believes the business can generate after paying down debt, making it a more reliable measure of the recovery than any one quarter’s earnings beat.
Got $1,000? Before You Buy DOW, Read This
If you have cash sitting in your account right now, give this two minutes. After more than two decades of helping investors beat the market, our top analysts at 24/7 Wall St. put together a definitive report on the Top 10 Stocks To Buy Today. And DOW wasn’t one of them.
They combed the entire market. It's not 10 ideas, not 10 stocks everyone is talking about, it's what their research points to as the 10 best stocks to buy right now, and it's free. Read more here and see which stocks made the list –>>
The post Dow Cut Its Dividend in Half. Is the New Payout Finally Safe? appeared first on 24/7 Wall St..
]]>IBM (NYSE:IBM) and Intel (NASDAQ:INTC) are two legacy tech icons rebuilding in public. IBM’s third-quarter report on October 21 showed a software-led business that keeps generating more cash. Intel’s July 23 report showed strong AI demand resting on a foundry that still loses money. One company has fixed its plumbing. The other is still spending heavily.
Red Hat Pays IBM’s Bills While Xeon Outruns Intel’s Factories
IBM’s revenue rose 4.7% to $17.10 billion. The growth rate is low, so the mix matters more. Software reached $7.80 billion, Red Hat grew 11%, and OpenShift is now a $2.4 billion ARR business. Enterprises renew that kind of revenue as they update their apps for AI. IBM Z mainframe sales fell 20%, but Distributed Infrastructure grew 31% and made up for it. Arvind Krishna credited “disciplined execution” for the faster growth.
Intel’s growth was far more dramatic. Revenue rose 25.4% to $16.13 billion, and Data Center and AI revenue jumped 59%. Lip-Bu Tan called it the “strongest revenue growth in more than fifteen years.” Foundry results fell behind. Intel Foundry lost $2.1 billion, and external foundry revenue was only $293 million. A $12.53 billion CHIPS Act escrow charge also pushed Intel to a GAAP net loss of $11.0 billion.
| Business Driver | IBM | Intel |
|---|---|---|
| Growth Engine | Red Hat and Data software | Xeon server CPUs |
| Biggest Drag | Aging mainframe cycle | Foundry operating losses |
| Cash Posture | Free cash flow outlook raised | Heavy capex ahead of customers |
Productivity Compounds at IBM While Intel Spends First
IBM has generated more than $5.5 billion of productivity savings, and its software margin expanded by 210 basis points. Net revenue retention on enterprise license agreements is running north of 130%. That tells me IBM’s long-standing customer relationships still pay off.
Intel runs the opposite way: it spends first and hopes to earn later. CFO David Zinsner said, “Until we really know we have customers, we don’t want to put a significant amount of capital at risk.” Even so, management named no external foundry customers. He also admitted Intel “may need to tap the capital markets.” Add a large U.S. government equity interest and no dividend, and the risks stack up.
Named Foundry Customers Are Intel’s Make-or-Break Test
Watch whether Intel turns 14A interest into signed external customers. Until it does, the foundry is a cost center serving one main customer: Intel itself. Also monitor whether IBM delivers the double-digit fourth-quarter Red Hat growth Krishna expects. The other question is whether Confluent moves into what Jim Kavanaugh called the “growth synergies” phase in 2027.
Why IBM’s Steadier Machine Stands Out
The stocks have moved the other way. Intel is up 135.66% year to date, and IBM is down 12.65%. Over the past month, though, Intel fell 29.07% while IBM gained 8.94%. That shows how quickly sentiment around a recovery can flip.
To me, IBM is the cleaner business. It now expects free cash flow to grow by more than $1 billion this year. It pays a $1.69 quarterly dividend and has raised it for 31 consecutive years. Its weak spots are easy to see: 0.2% consulting growth and $63.8 billion of debt. Intel offers direct exposure to an American chipmaking return, along with heavy charges and rising spending. I would rethink my view if Intel named a major external 14A customer.
Got $1,000? Before You Buy INTC, Read This
If you have cash sitting in your account right now, give this two minutes. After more than two decades of helping investors beat the market, our top analysts at 24/7 Wall St. put together a definitive report on the Top 10 Stocks To Buy Today. And INTC wasn’t one of them.
They combed the entire market. It's not 10 ideas, not 10 stocks everyone is talking about, it's what their research points to as the 10 best stocks to buy right now, and it's free. Read more here and see which stocks made the list –>>
The post IBM Fixed Its Plumbing; Intel Became Big Tech’s Real Structural Trap appeared first on 24/7 Wall St..
]]>Adobe (NASDAQ:ADBE) trades at $263.82. The market is pricing a dominant software franchise as an AI victim even though its numbers keep improving.
Adobe owns the default workflows in creative and document software: Photoshop, Illustrator, Premiere Pro, Acrobat and the PDF, along with Experience Cloud for enterprise marketing. The stock is down 24.62% year to date. Investors marked it down on three concerns: generative AI rivals, a CEO transition and an interim CFO. Through all of that, Adobe posted a record Q3 with revenue of $6.76 billion, up 12.9%, and beat EPS estimates for the fifth consecutive quarter.
Cash Machine Trading Near 10x Next Year’s Earnings
Consensus calls for fiscal 2027 non-GAAP EPS of $27.5076. At the current price, that works out to about 10x, which is a low multiple for a business with a 61.9% return on equity. Q3 free cash flow rose 14.68% to $2.44 billion. Adobe used $2.232 billion to retire about 9.5 million shares and still has $24.55 billion left on its authorization.
AI is adding to the business. AI-first ARR exceeded $650 million, growing more than 150%, and monthly active users passed 1 billion. Management raised full-year non-GAAP EPS guidance to $24.45 to $24.50. Analysts followed with 27 upward revisions and no cuts to fiscal 2026 estimates over the past week.
Margin Squeeze and AI Rivals Could Keep Shares Cheap
Profit is growing more slowly than sales. In Q3, revenue grew 12.89%, but operating income rose only 8.33% and net income just 3.1%. Management postponed price increases and tied slower net new ARR growth to its freemium push. Ending ARR growth is targeted at only 10.2%.
Canva, Figma and OpenAI’s image and video tools are going after the same creators. A $70 million goodwill impairment in Publishing and Advertising showed that some units are already under pressure. Wall Street remains cautious: 23 of 39 analysts rate the stock Hold.
New CEO and Freemium Conversion Still Need Proof
Anil Chakravarthy becomes CEO effective December 1, and his strategy has not yet been tested. The next checkpoint is Q4, which Adobe guided to $6.8 billion to $6.85 billion in revenue. Adobe MAX in November and the close of the Topaz Labs acquisition come before that report. Whether freemium users convert to paid plans over the next two or three quarters will decide whether margins recover.
Shares Fell 25% While the S&P 500 Gained 13%
Over the past year, Adobe fell 25.5% while the S&P 500 rose 13.13%. That pattern is now reversing: over the past month the stock gained 9.61% while the index slipped 1.02%. Shares trade at 15x trailing earnings and sit about 27% below the 52-week high of $363.70.
The consensus price target of $272.31 implies about 3.2% upside. Price targets are not guarantees, and this one appears to trail the improving fundamentals. The 39 ratings break down as follows:
- Strong Buy: 4
- Buy: 7
- Hold: 23
- Sell: 4
- Strong Sell: 1
A Franchise the Market Has Written Off
At $263.82, Adobe’s valuation leaves room for upside if its fundamentals hold.
The stock is priced as if its moat is shrinking, yet revenue is growing at double digits, guidance keeps rising and the user base passed 1 billion. At about 10x next year’s earnings, buybacks shrink the share count every quarter, so EPS can grow even if the multiple never recovers.
The first test comes with the Q4 earnings report. If Adobe hits the top of its guidance and announces new AI products at MAX, the gap between its fundamentals and its share price becomes hard to defend. A second leg comes if paid conversion improves in the first half of fiscal 2027.
The thesis breaks if net new ARR keeps slowing after freemium users have had time to convert, or if operating margins keep falling below sales growth. Investors should keep an eye on both trends every quarter.
Investors are paying a value-stock multiple for a franchise that still controls creative and document workflows and keeps raising its outlook.
Got $1,000? Before You Buy ADBE, Read This
If you have cash sitting in your account right now, give this two minutes. After more than two decades of helping investors beat the market, our top analysts at 24/7 Wall St. put together a definitive report on the Top 10 Stocks To Buy Today. And ADBE wasn’t one of them.
They combed the entire market. It's not 10 ideas, not 10 stocks everyone is talking about, it's what their research points to as the 10 best stocks to buy right now, and it's free. Read more here and see which stocks made the list –>>
The post The Software Monopoly Priced Like a Victim: Adobe appeared first on 24/7 Wall St..
]]>Selling in payments stocks is landing hardest on PayPal Holdings (NASDAQ:PYPL) as the company’s third-quarter report draws near this week. PayPal stock is at $55.12, down 3% in afternoon trading. This decline reflects trader caution before results arrive. That drop stands out because a Wall Street firm just lifted its price target on PayPal stock.
Meanwhile, Klarna (NYSE:KLAR) stock is at $12.61, down 2%, a smaller loss than PayPal’s that still keeps the buy now, pay later lender in negative territory. Affirm Holdings (NASDAQ:AFRM) stock is at $69.52, down 0.8%, the smallest decline of the three payments names and well short of PayPal’s drop.
Broader financials are moving in the opposite direction. The Financial Select Sector SPDR ETF (NYSEARCA:XLF) is at $56.04, up 0.3%. For a market-wide read, the SPDR S&P 500 ETF Trust (NYSEARCA:SPY) is at $765.41, up 0.7%.
Truist Lifts Its PayPal Target as Shares Slide
Truist raised its price target on PayPal stock to $58. The firm also kept a Hold rating as part of a preview of third-quarter results across payments and fintech stocks. That raise arrives while PayPal stock is heading lower, which sets the analyst’s view apart from the trading in the shares.
A Hold rating keeps Truist neutral on PayPal stock, so the higher target reads as a measured adjustment to the firm’s model, and the coming report is the next chance for PayPal’s results to support that adjustment or undermine it.
Selling Concentrates in the Biggest Payments Name
While the Financial Select Sector SPDR ETF and the SPDR S&P 500 ETF Trust rise, PayPal stock is falling, which marks the pressure as company-specific. Smaller declines in Klarna and Affirm stock show the selling sitting hardest on the largest payments name as its quarterly update approaches.
Venmo, branded checkout and merchant processing all sit inside PayPal’s broad digital payments platform. Klarna and Affirm, by comparison, focus on buy now, pay later lending at the point of sale, and their shares are posting smallest declines.
PayPal stock trades at a trailing P/E ratio of 10x, a low multiple that frames the debate over whether the company’s growth can pick up. Supporters can point to that cheap multiple as a cushion if results hold steady, but skeptics can argue the discount reflects slow growth that has yet to turn higher.
What PayPal’s Report Has to Show
Branded checkout is the core test for PayPal’s third-quarter report. Steady growth there could support the case that the company’s turnaround is gaining traction, while a slowdown could add weight to the doubts behind the selling. That business is central to the debate over PayPal’s recovery.

Venmo and merchant processing round out the picture, since both show whether PayPal can lean on growth beyond its own checkout button. Traders can watch for any change in the company’s full-year outlook alongside the quarterly numbers.
Truist’s higher target gives the bull case a reference point, while its Hold rating keeps that view measured. A PayPal quarter that holds up on branded checkout could draw fresh support for the shares, and a miss could leave the target raise looking early. Investors weighing their exposure should adjust their holdings carefully given PayPal stock’s slide ahead of the report.
Got $1,000? Before You Buy PYPL, Read This
If you have cash sitting in your account right now, give this two minutes. After more than two decades of helping investors beat the market, our top analysts at 24/7 Wall St. put together a definitive report on the Top 10 Stocks To Buy Today. And PYPL wasn’t one of them.
They combed the entire market. It's not 10 ideas, not 10 stocks everyone is talking about, it's what their research points to as the 10 best stocks to buy right now, and it's free. Read more here and see which stocks made the list –>>
The post PayPal Slips 3% Ahead of Earnings Despite Truist Target Raise; Klarna and Affirm Retreat appeared first on 24/7 Wall St..
]]>The 24/7 Wall St. price target for Alphabet (NASDAQ:GOOG) is $423.95. That means 32.17% upside from the prior close of $320.76. The stock gets a buy rating with 70% confidence, which we read as solid conviction with a margin for error.
| Metric | Value |
|---|---|
| Current Price | $320.76 |
| Price Target from 24/7 Wall St. | $423.95 |
| Upside/Downside | 32.17% |
| Recommendation | BUY |
| Confidence Level | 70% |
Applied to Alphabet’s $4.05 trillion market cap, that upside works out to about $1.3 trillion in added market value. That figure is the opportunity behind our headline.

Google Stock Pulls Back Even as Cloud Growth Accelerates
Shares fell 7.82% over the past week and 8.49% over the past month. Early Friday they traded at $317.93, up just 1.51% year to date and about 21% below the 52-week high of $403.96. Over the past year the stock is still up 26.23%.
The fundamentals point the other way. In Q2, revenue rose 24.2% to $119.80 billion, ahead of the $116.91 billion estimate. EPS came in at $9.11 against a $3.04 estimate, although a $99.03 billion equity securities gain inflated that number. Google Cloud grew 82%, and its backlog reached $514 billion.
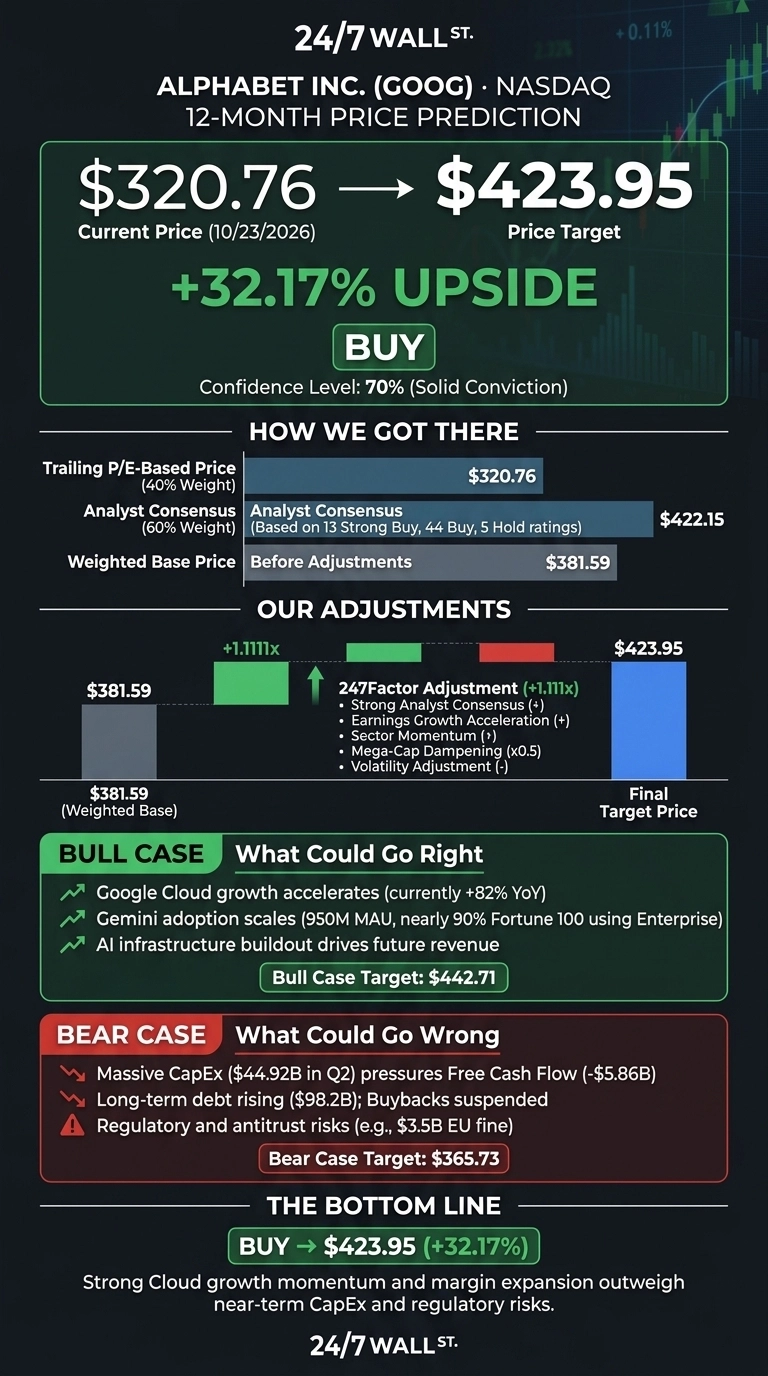
Why Bulls See a Breakout to $442
Cloud is now a profit engine. Its operating margin expanded to 35.6% from 20.7% a year earlier. The Gemini app has 950 million monthly users, and nearly 90% of the Fortune 100 use Gemini Enterprise.
Waymo has passed 500,000 fully autonomous rides a week. On the Q2 call, CEO Sundar Pichai said, “If anything, over the past year, we’ve gotten more bullish on the opportunities ahead.”
Wall Street largely agrees: 13 analysts rate the stock Strong Buy, 44 rate it Buy, 5 rate it Hold and none rate it Sell. The bull case reaches $442.71.

Spending Risks That Could Cap the Upside
Q2 capex jumped 100.14% to $44.92 billion, and free cash flow fell to -$5.86 billion. Long-term debt rose from $46.5 billion to $98.2 billion. Buybacks are suspended, and a new at-the-market program of up to $40 billion could dilute shareholders. Regulators also remain a threat after the $3.5 billion EU fine.
The counterpoint is that this cash is going into capacity customers are waiting for. Management says Alphabet remains supply constrained. Operating cash flow still rose 40.8%, and interest coverage stands at 175.5x.
Even our bear case of $365.73 sits above today’s price. The same AI expansion driving that capex is pulling a long list of suppliers along with it (we highlighted seven of them, from power to cooling, in a free report you can grab here).
Alphabet Looks Cheaper Than Microsoft and Meta
The most direct cloud rival is Microsoft (NASDAQ:MSFT). Azure grew 43%, about half of Google Cloud’s rate, yet Microsoft trades at 29x earnings.
Meta Platforms (NASDAQ:META) competes with Alphabet for ad budgets and AI talent. Its Q3 operating margin fell to 20%, partly because of a $9.89 billion legal charge.
| Company | P/E | Latest Quarter Revenue Growth |
|---|---|---|
| Alphabet | 13x | 24.2% |
| Microsoft | 29x | 17.75% |
| Meta | 24x | 26.07% |
Alphabet’s multiple gets a lift from equity gains. Even its forward P/E of 22x is still below Microsoft’s trailing multiple. Next to these peers, our target looks reasonable, maybe even conservative.
Cloud Momentum Tips the Scale
The 24/7 Wall St. price target of $423.95 carries a buy rating with 70% confidence. The deciding factor is cloud growth that is speeding up as margins expand.
I’d view the stock as attractive if the backlog keeps turning into revenue at these margins. I’d grow more cautious if free cash flow stays negative while debt keeps rising. On balance, Alphabet looks undervalued.

| Year | Price Target from 24/7 Wall St. |
|---|---|
| 2026 (12-month target) | $423.95 |
| 2027 | $426.05 |
| 2028 | $510.24 |
| 2029 | $597.01 |
| 2030 | $659.84 |
Alphabet needs to keep executing on its full-stack AI strategy for these projections to hold. Gemini adoption, regulatory action or a slowdown in AI spending could move the stock well above or below these targets.
Got $1,000? Before You Buy GOOG, Read This
If you have cash sitting in your account right now, give this two minutes. After more than two decades of helping investors beat the market, our top analysts at 24/7 Wall St. put together a definitive report on the Top 10 Stocks To Buy Today. And GOOG wasn’t one of them.
They combed the entire market. It's not 10 ideas, not 10 stocks everyone is talking about, it's what their research points to as the 10 best stocks to buy right now, and it's free. Read more here and see which stocks made the list –>>
The post Prediction: This Magnificent Seven Stock Could Be a $1 Trillion Opportunity appeared first on 24/7 Wall St..
]]>Put $100,000 into three blue-chip dividend payers equally, and it pays about $3,968 a year. In a taxable brokerage account in the 24% tax bracket, about $595 of that goes to the IRS each year. In a Roth IRA, every dollar stays in the account.
Roth Vs. Taxable: What $100,000 Keeps
The portfolio holds $100,000 split equally across Bristol-Myers Squibb (NYSE:BMY), Truist Financial (NYSE:TFC), and U.S. Bancorp (NYSE:USB). All three pay qualified dividends. Those are taxed at capital gains rates of 0%, 15%, or 20% under 26 U.S.C. § 1(h)(1), which are lower than ordinary income rates. In 2026, the 24% bracket covers taxable income over $105,700 for single filers ($211,400 for married couples filing jointly), and taxpayers at that level pay 15% on qualified dividends.
| Scenario (24% bracket) | Gross Income | Tax | Net Income |
|---|---|---|---|
| Roth IRA | $3,968 | $0 | $3,968 |
| Taxable | $3,968 | $595 | $3,373 |
The Roth advantage is $595 a year, or $5,952 over 10 years, before any growth. The gap is modest because qualified dividends already get a tax discount. A REIT or BDC paying the same income as ordinary dividends would cost $952 at 24%. With these three stocks, the Roth wins by removing the remaining 15% tax and allowing reinvested dividends to compound untaxed.
Bristol-Myers Squibb: 4.08% Yield
Based on a $2.52 annualized dividend and a $61.69 share price, Bristol-Myers yields 4.08%. That’s about $1,362 a year from a $33,333 stake. In 2025, operating cash flow of $14.16 billion minus capex left $12.85 billion of free cash flow, about 2.5 times the dividends paid. The quarterly payout has risen from $0.45 in 2020 to $0.63. Risk: revenue from the legacy portfolio is expected to fall 4% to 6% in 2026.
Truist Financial: 4.24% Yield
Truist yields 4.24% on a $2.08 annual dividend, which comes to about $1,412 a year on its share of the portfolio. Common dividends in 2025 came to about 56% of net income. Third-quarter adjusted EPS of $1.16 beat estimates. Risk: the dividend has stayed at $0.52 per share every quarter since late 2022, so income hasn’t grown while the bank sells off its RAC and LightStream businesses.
U.S. Bancorp: 3.58% Yield
U.S. Bancorp yields 3.58% on a $2.16 forward dividend, which comes to about $1,194 a year. Dividends in 2025 accounted for about 46% of net income, and the quarterly payout recently rose from $0.52 to $0.54. Risk: management paused buybacks after a rate move cut capital ratios by 40 basis points.
Higher Brackets Pay a Bigger Toll
The 3.8% net investment income tax applies once modified AGI passes $200,000 for single filers or $250,000 for joint filers (26 U.S.C. § 1411). Every taxpayer in the 32% and 37% brackets is above that line.
| Bracket | Dividend Rate | Taxable Net | Annual Roth Benefit |
|---|---|---|---|
| 22% | 15% | $3,373 | $595 |
| 24% | 15% | $3,373 | $595 |
| 32% | 18.8% | $3,222 | $746 |
| 37% | 23.8% | $3,024 | $944 |
What Holding These Outside a Roth Costs Over 20 Years
At 24%, assume the $595 saved each year is reinvested at a conservative 4%. That adds up to about $7,146 after 10 years and $17,724 after 20 years. The math leaves out share price gains and dividend raises. It counts only the tax you’d owe on these holdings, and that money is gone for good. Future dividends depend on board decisions and aren’t guaranteed. If you’re considering a conversion, the quiet stretch before your first RMD is usually the cheapest time to do it, which is the whole subject of our free Roth Window guide.
Three Steps to Take Before Your Next Tax Filing
- Compare boxes 1a and 1b on your 1099-DIV for these holdings. Then multiply the qualified dividends by your actual rate (15%, 18.8% or 23.8%) to see what you lose to taxes each year.
- If you also own REITs, BDCs, or mortgage REITs in a taxable account, run the numbers on those first. At the 24% bracket, the same income costs $952 in tax as ordinary dividends versus $595 as qualified dividends.
- Before converting these positions to a Roth, divide the tax due on the conversion by your annual Roth benefit from the table above. That tells you how many years it takes to break even.
Got $1,000? Before You Buy BMY, Read This
If you have cash sitting in your account right now, give this two minutes. After more than two decades of helping investors beat the market, our top analysts at 24/7 Wall St. put together a definitive report on the Top 10 Stocks To Buy Today. And BMY wasn’t one of them.
They combed the entire market. It's not 10 ideas, not 10 stocks everyone is talking about, it's what their research points to as the 10 best stocks to buy right now, and it's free. Read more here and see which stocks made the list –>>
The post 3 Blue-Chip Dividend Stocks That Show Why Roth IRA Income Can Be Worth More appeared first on 24/7 Wall St..
]]>Pulling in $10,900 a month adds up to $130,800 a year, a solid six-figure paycheck that lands every month without a job attached. So how much capital does it actually take to get there on dividends alone? We’ll run the numbers using a three-bucket portfolio split across VIG (15%), FDVV (15%), SPYD (10%), VICI (10%), STAG (10%), GPIX (15%), GBDC (10%), and JAAA (15%).
Your Number at Three Yield Levels
The formula is simple as you divide the income target by the yield to get the capital you need.
- Using a 3.5% rate, $130,800 divided by 0.035 is about $3.74 million.
- Using a 6% rate, $130,800 divided by 0.06 is $2.18 million.
- Using a 10% rate, $130,800 divided by 0.10 is $1.31 million.
The important thing to remember is that each extra point of yield cuts the required capital. Each one also adds a new risk.
Bucket 1: Dividend Growers That Pay the Least Today
Vanguard Dividend Appreciation ETF (NYSEARCA:VIG) yields about 1.5% on its forward payout. Fidelity High Dividend ETF (NYSEARCA:FDVV) yields about 2.8% on trailing payouts. Both sit below the classic 3% to 4% conservative range. Funding the full target from this bucket alone, at its roughly 2.1% blend, would require about $6.09 million.
This bucket offers diversified, quality companies and a payout that rises over time. The caveat is that you give up current income.
Bucket 2: Real Estate and High-Dividend Stocks
In bucket two, you’ll have SPDR Portfolio S&P 500 High Dividend ETF (NYSEARCA:SPYD) and STAG Industrial (NYSE:STAG), each yielding about 4.3%. VICI Properties (NYSE:VICI) yields about 7.7%, backed by 100% occupancy, a 39.6-year average lease term, and 2.0% annual escalators. VICI just raised its quarterly payout to $0.46 from $0.45.
The bucket blends to roughly 5.4%. The tradeoff shows up in price: VICI shares fell about 19% over the past year even as the dividend rose. STAG also moved from monthly to quarterly payments of $0.3875 in 2026, so plan your cash calendar around it.
Bucket 3: Maximum Income, Real Cut Risk
Bucket three includes holdings like the Goldman Sachs S&P 500 Premium Income ETF (NASDAQ:GPIX), which sells S&P 500 options and yields about 8.6% monthly, with capped upside. Golub Capital BDC (NASDAQ:GBDC) yields about 10.9%, but it cut its base distribution from $0.39 to $0.33, a roughly 15% reduction. On the August call, chief executive David Golub said: “We’re in a credit cycle. There’s elevated credit stress.”
Janus Henderson AAA CLO ETF (NYSEARCA:JAAA) holds the bucket at about 4.8%. Its income moves with short-term rates, and its monthly payout has fallen from 0.280985 per share in December 2024 to about 0.20 now.
What the Full Portfolio Requires
Combined across all eight holdings, the portfolio yields about 5.4%. To produce $130,800, you need roughly $2.44 million. Bucket 3 holds 40% of the money but generates about $75,500, or 58% of the income. Your paycheck leans hardest on the holdings most likely to cut (we walked through the mix, the payment calendar, and the withdrawal order for turning savings into monthly income in a free guide here).
Why the Smallest Yield May Pay You the Most
VIG paid $0.459 per share in March 2015 and $0.9377 in March 2025, roughly a 2x increase in a decade. Apply that logic to your target: $3.74 million at 3.5%, with payouts growing 7% a year, makes about $257,000 of annual income by year 10. A $1.09 million portfolio at 12% starts at $130,800 and, with no growth, stays there or contracts after cuts like Golub’s.
Principal tells the same story. VIG’s dividend-adjusted price rose 255% over ten years, against 68% for Golub Capital.
Three Moves Before You Commit Capital
- Total up 12 months of real spending. Spending $8,000 a month instead of $10,900 drops the capital you need at 5.4% sharply, and you can move more money into Bucket 1.
- Map taxes by account. Payouts from REITs, BDCs, and option-income strategies are largely taxed as ordinary income. For 2025, married joint filers hit the 24% bracket at $206,701 of taxable income. Hold Bucket 3 in an IRA where you can, and keep qualified-dividend payers in taxable accounts.
- Run a 10-year side-by-side. Compare VIG’s 255% adjusted gain with SPYD’s 131%, then decide how much yield you’re willing to give up for growth.
Released: The Definitive Guide to Retirement Income
(Sponsor) Most people spend their entire working lives focusing on one thing: growing a pile of money. Then they retire and discover the skill they actually need is close to the opposite. Turning that pile into steady income, year after year, through good markets and bad, without ever running out.
It may be the least discussed and most consequential transition in personal finance, and plenty of otherwise careful investors walk into it with no real plan. That is exactly what The Definitive Guide to Retirement Income helps answer. It is a free guide from Fisher Investments covering what your retirement will really cost, where the cash flow should come from, and how much you can safely withdraw each year. Learn more here. Learn More Here ›
The post How to Build $10,900 a Month in Dividend Income From Three Income Buckets appeared first on 24/7 Wall St..
]]>What would $1,000 in Amazon (NASDAQ:AMZN) turn into by 2030? The timing makes the question worth asking. Shares are trading at $252.75 noon, down 3.67% on the session and below the $287.20 52-week high, even as the business underlying speeds up.
Our price-prediction model starts from a reference price of $262.37 and maps out where that stake could land.

What $1,000 in Amazon Could Become
In the model’s base case, a $1,000 investment could be worth about $2,032.90 by October 2031, returning 103.29% in total. That figure rests on a five-year base-case target of $533.36 per share, which works out to an annualized return of 15.24%.
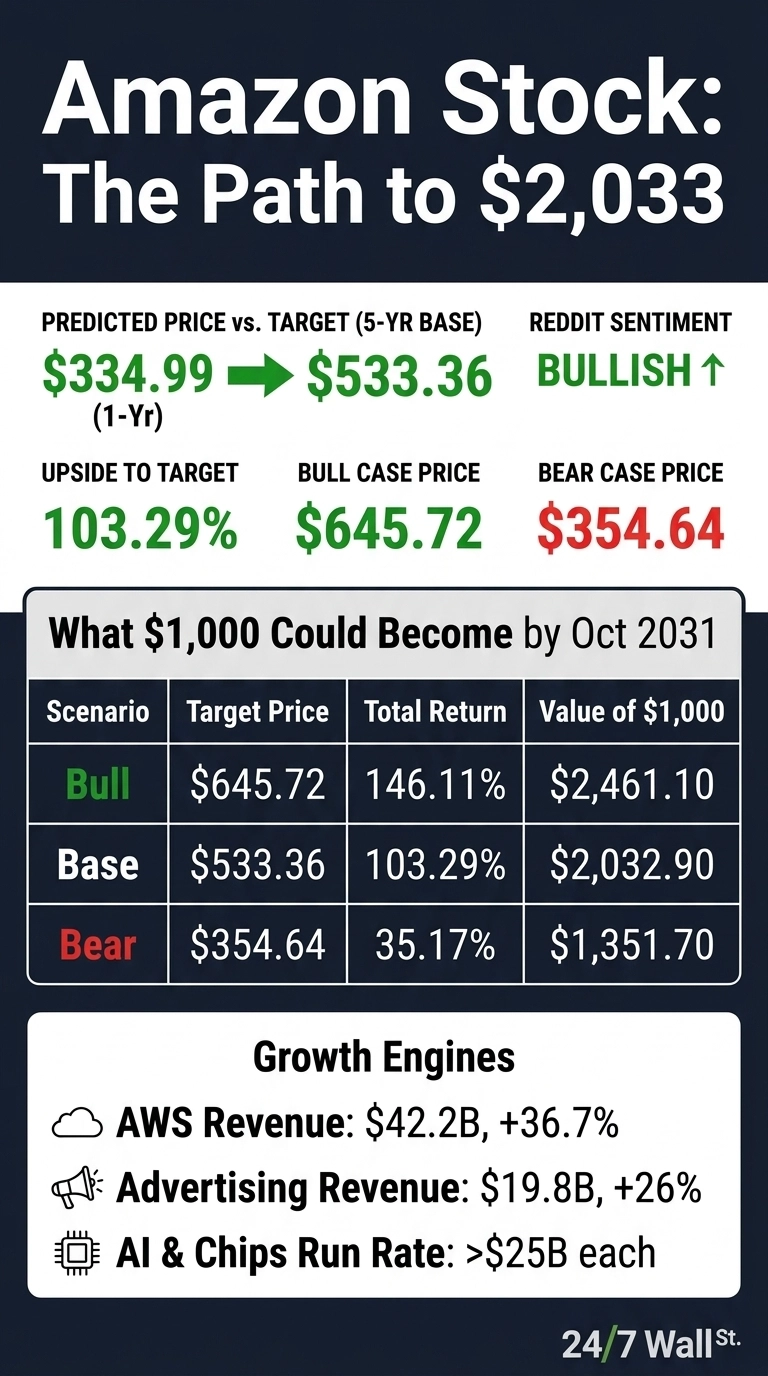
Why October 2031 and not 2030? The model produces one-year and five-year targets. 2030 sits between the two, so the five-year horizon is the anchor. For an example 2030 reading, the base case puts shares at $485.68 on October 22, 2030, which would turn $1,000 into roughly $1,851.13.
What about the headline’s claim? If the stock compounds at 10% a year for four years from the $262.37 reference, shares would reach $384.14 and $1,000 would become $1,464.10. That is a simple illustration. The model’s own base case compounds faster than 10% a year.
Bull, Base and Bear Outcomes for a $1,000 Stake
| Scenario (Five-Year, October 2031) | Target Share Price | Total Return | Value of $1,000 |
|---|---|---|---|
| Bull | $645.72 | 146.11% | $2,461.10 |
| Base | $533.36 | 103.29% | $2,032.90 |
| Bear | $354.64 | 35.17% | $1,351.70 |
Example October 2030 checkpoints on the same three paths: a bull price of $584.96 (about $2,229.52 for the stake), a base price of $485.68 (about $1,851.13), and a bear price of $339.88 (about $1,295.42). On a one-year view, the base target is $334.99, meaning 27.68% upside. The model gives a confidence score of 0.7.
Analysts come out in roughly the same place. The consensus target is $331.72, with 16 strong buy ratings, 43 buys, 2 holds and zero sells.

Three Engines Driving Amazon’s Upside
AWS Is Accelerating Again
AWS revenue reached $42.2 billion last quarter, up 36.7%. That was the fifth straight quarter of faster growth, and the AWS backlog stands at $496 billion.
Amazon’s AI and chips businesses each run at an annualized rate above $25 billion, both growing at triple-digit rates. On the earnings call, the CEO said AWS could become “very possibly a trillion-dollar annual revenue business for us in time.”
All of that AWS expansion has to be powered, cooled, and connected by somebody, and we rounded up seven suppliers riding that wave in a free report on the AI infrastructure trade.
Advertising Is a High-Margin Profit Lever
Ad revenue rose 26% to $19.8 billion, helped by more shoppers using agentic and conversational shopping tools. Alexa for Shopping has reached more than 350 million customers over the last 12 months.
Guidance Supports the 10% Premise
Third-quarter guidance calls for net sales of $197 billion to $202 billion, which is growth of 9% to 12%. Without the shift in Prime Day timing, growth would be nearly 400 basis points higher.
On 24/7 Wall St.’s AI Investor Podcast, a host described this setup: a “really good path to grow sales, maybe only 8 to 10%, but profits 20% plus.”
Risks That Could Shrink Your $1,000
- Capex strain: Amazon raised its 2026 cash capex plan to about $220 billion from $200 billion, pointing to higher memory costs. Trailing free cash flow has fallen to -$7.6B.
- Earnings quality: Q2 GAAP EPS of $5.75 got a lift from a $53.4B non-operating Anthropic gain. Comparable EPS was closer to $1.88.
- Macro pressure: Management highlighted tariffs, recession risk, supply volatility and a foreign-exchange drag of about 80 basis points in Q3.
- Volatility: With a beta of 1.456, the stock tends to swing harder than the market. Its 52-week low is $196.
What to Watch on the Road to 2030
Across the projected scenarios, a $1,000 Amazon stake ranges from $1,351.70 to $2,461.10 by October 2031, and the base case is $2,032.90. Example 2030 checkpoints fall between $1,295.42 and $2,229.52.
These figures are projections rather than investment advice, and none of them is guaranteed. Keep an eye on AWS growth and capex returns in the next earnings report.
Got $1,000? Before You Buy AMZN, Read This
If you have cash sitting in your account right now, give this two minutes. After more than two decades of helping investors beat the market, our top analysts at 24/7 Wall St. put together a definitive report on the Top 10 Stocks To Buy Today. And AMZN wasn’t one of them.
They combed the entire market. It's not 10 ideas, not 10 stocks everyone is talking about, it's what their research points to as the 10 best stocks to buy right now, and it's free. Read more here and see which stocks made the list –>>
The post If Amazon Grows At 10% a Year, Here’s What $1,000 Becomes By 2030 appeared first on 24/7 Wall St..
]]>Anthropic filed publicly for its IPO on Oct. 26, 2026, and Election Day comes on Nov. 3. Michael Pearce, chief U.S. economist at Oxford Economics, says the biggest risk to the AI data center expansion sits in state capitals and town halls, with Washington a smaller factor.
He told Fortune that local officials present “more immediate threats via moratoriums, environmental reviews, and bottlenecks in connecting new data centers to the power grid”. Few companies need new data centers more than Anthropic does.
What Anthropic Filed
Anthropic filed a Form S-1 to list Class A shares on the NASDAQ Global Select Market under the ticker “ANT”. The share count and price range have not been set. Reuters reports first-half 2026 revenue of $16.3 billion. TradingKey and Reuters report a net loss of $80.7 billion, driven mainly by a rise in the fair value of convertible bonds.
Reuters says Anthropic was valued at $965 billion in May. Some investors now put it near $1.5 trillion, according to Reuters, down from about $2 trillion a week earlier. Reuters says the listing could come as early as late October. Earlier reports pointed to November.
A Massive Compute Bill Runs Through Local Zoning Boards
The S-1 says Anthropic plans to secure compute beyond its existing commitments and expand its own data center presence. It also warns that delays in securing energy, water and other critical services for dedicated data centers could slow new compute. investingLive, citing the WSJ, puts compute commitments above $600 billion. Per investingLive, that includes about $450 billion in mostly non-cancellable cloud agreements: roughly $111 billion with Google parent Alphabet (NASDAQ:GOOGL), $110 billion with Amazon Web Services, a unit of Amazon, and $31 billion with Microsoft (NASDAQ:MSFT). TradingKey reported a figure of $750 billion, so the totals vary by source. CNBC reports Anthropic plans to invest $50 billion in U.S. data centers.
CNBC reported on Aug. 21, citing sources, that Anthropic told bankers and investors that opposition to AI and data centers would be a key risk factor. The WSJ-based account says the risk factors cite growing organized opposition to data center construction that could target projects linked to Anthropic.
Local Opposition Is Already Widespread
A May Gallup poll found 71% of Americans oppose data center construction near them, compared with 53% who oppose a nearby nuclear plant. According to Route Fifty, the National League of Cities tracker shows at least 76 localities have tried halts or bans, including three permanent bans, and Route Fifty counts almost 40 Georgia local governments with some form of halts. Yahoo Tech reports that more than 100 Ohio communities have halts and that 18 will vote on local measures this year.
How Elections Enter the Picture
The link to elections comes from economists, campaign memos and industry filings, separate from Anthropic’s own risk language. Pearce notes that the Trump administration has eased construction through regulations and executive orders, and Route Fifty reports the President has pressed state and local officials to accept developers’ demands. That leaves local officials as the main point of control. Pearce names Texas, the Carolinas, Ohio, Illinois and Wisconsin as the key races.
Macquarie’s Thierry Wizman wrote that state-level governance may matter more to the economy than control of Congress. An Aug. 18 National Republican Senatorial Committee memo called data centers an “anchor” for Sen. Jon Husted in Ohio. Nscale’s own S-1 warns that candidates may run against data center development, which could lead to more halts and stricter permitting.
Digital Realty Shows What Is at Stake on the Ground
Digital Realty (NYSE:DLR) shows how much this expansion depends on land. In its first-quarter filing, revenue reached $1.64B (+16.2% YoY), helped by a 200-megawatt AI inference lease, the largest in the company’s history. It has about 1.2 GW under construction and bought an 873-acre parcel near Atlanta, in Georgia, where halts are spreading. The stock traded at $173.30, up 14.29% year to date but down 4.49% over the past month.
Limits on the Election Case
Sitting councils pass most halts, so elections matter mainly through who wins office and through ballot measures. Energy, water and grid limits can slow projects whoever wins. Local budgets also depend on data centers: Yahoo Tech reports Loudoun County, Virginia, collected $1.2 billion in data center property taxes, about 40% of its budget. Anthropic faces other risks too. It relies on a few suppliers, including Amazon (NASDAQ:AMZN) and Broadcom (NASDAQ:AVGO). Two customers made up about a fifth of its first-half revenue, and the filing also lists AI safety risks.
What to Watch
Key dates and events include the IPO pricing date, state and local results on Nov. 3, Ohio’s local data center votes and any new halts.
Got $1,000? Before You Buy DLR, Read This
If you have cash sitting in your account right now, give this two minutes. After more than two decades of helping investors beat the market, our top analysts at 24/7 Wall St. put together a definitive report on the Top 10 Stocks To Buy Today. And DLR wasn’t one of them.
They combed the entire market. It's not 10 ideas, not 10 stocks everyone is talking about, it's what their research points to as the 10 best stocks to buy right now, and it's free. Read more here and see which stocks made the list –>>
The post As Anthropic’s IPO Looms, The Company Faces A Significant Risk From A Surprising Place, Midterm State And Local Elections appeared first on 24/7 Wall St..
]]>A weekend response from TeraWulf‘s (NASDAQ:WULF) chief executive is lifting the former Bitcoin miners now racing to build AI data centers, with TeraWulf shares leading the charge. The pushback targets a worry that has weighed on the group: some sites could end up without tenants, power or interconnection. TeraWulf shares are at $12.15 in morning trading, up 7% as the market reassesses fears that partially built data centers could leave computing capacity stranded.
Even with the rebound, TeraWulf stock is down 26% over the past month, so the gain recovers only part of that decline. Meanwhile, Cipher Digital (NASDAQ:CIFR) shares are up 3% to $8.17, a smaller advance that trails TeraWulf’s move. Applied Digital (NASDAQ:APLD) shares are up 2% to $18.63, the most modest gain of the three data center builders.
The CoinShares Bitcoin Mining and Digital Power ETF (NASDAQ:WGMI) is up 3% to $30, giving a read on the sector. That’s well ahead of the SPDR S&P 500 ETF Trust (NYSEARCA:SPY), which is up 0.9% to $767.08, showing the AI infrastructure group recovering alongside a stronger market while also outpacing it.
Prager Rejects the Stranded Data Center Narrative
Over the weekend, TeraWulf chief executive Paul Prager pushed back on warnings that partially built data centers will leave computing capacity stranded. His case rests on sequencing, since TeraWulf secures power, fixed-price construction contracts, long-term tenants with investment-grade backing and financing before it builds. Prager wrote, “We may move dirt early, but we don’t build on spec.”
Prager made his stance clear. In the same pushback, he maintained that “what others call stranded assets, we may call a development pipeline.” Late last week, TeraWulf also expanded its senior secured revolving credit facility, giving the company more borrowing capacity for its AI data center expansion. Taken together, the message and the larger credit line offer a concrete answer to the funding question hanging over TeraWulf’s unfinished sites.
Mining Roots Set TeraWulf and Cipher Digital Apart From Applied Digital
TeraWulf, Cipher Digital and Applied Digital all build data center capacity for AI and high-performance computing customers. Both TeraWulf and Cipher Digital are converting from Bitcoin mining, while Applied Digital built its business around hosting computing workloads. That shared origin puts TeraWulf and Cipher Digital in the same debate over how converted mining sites get financed and filled.
Contracted tenants anchor TeraWulf’s argument, including a long-term Anthropic lease at its Justified Data Campus in Kentucky and existing operations at its Lake Mariner campus in New York. Prager’s “development pipeline” line also covers earlier-stage TeraWulf sites such as the Muskie Data Campus in Kentucky and the Chesapeake Data Campus in Maryland. Cipher Digital has its own contracted campuses, including Black Pearl and Barber Lake, as it moves away from mining.
Applied Digital’s hosting background gives it a different profile. The company runs an HPC Hosting segment serving hyperscale customers and a Data Center Hosting segment that provides energized space to crypto mining customers.
What TeraWulf’s Financing-First Model Means for Its Recovery
TeraWulf’s next test is whether its financing-first approach keeps its projects on schedule amid broader questions about how AI data centers get funded (we covered seven companies supplying that expansion, from power to cooling, in a free report here). The milestones to watch are construction progress at Lake Mariner and Justified, along with any draw on the expanded credit facility.
On the risk side, TeraWulf still runs a legacy mining business it’s repurposing for high-performance computing, and its sites take time to turn into lease revenue, while the expanded borrowing capacity at TeraWulf also adds obligations that pay off only if tenants move in on schedule.
Cipher Digital’s contracted campuses support its case, but it faces the same conversion and financing questions, and Applied Digital’s hyperscale customers are an advantage, though its crypto mining hosting segment keeps it tied to a volatile sector. Prager’s no-spec pledge sets a clear standard for measuring TeraWulf in the quarters ahead.
Got $1,000? Before You Buy CIFR, Read This
If you have cash sitting in your account right now, give this two minutes. After more than two decades of helping investors beat the market, our top analysts at 24/7 Wall St. put together a definitive report on the Top 10 Stocks To Buy Today. And CIFR wasn’t one of them.
They combed the entire market. It's not 10 ideas, not 10 stocks everyone is talking about, it's what their research points to as the 10 best stocks to buy right now, and it's free. Read more here and see which stocks made the list –>>
The post TeraWulf Jumps 7% as CEO Pushes Back on Stranded Data Center Fears; Cipher Digital Rises 3%, Applied Digital Edges Higher appeared first on 24/7 Wall St..
]]>Last week’s blowout quarter from the fuel cell group’s biggest data center winner is pulling buyers back after a steep post-earnings slide. Bloom Energy (NYSE:BE) stock is at $207.61, up 7% in morning trading, recovering part of last week’s post-earnings slide.
Meanwhile, FuelCell Energy (NASDAQ:FCEL) stock is at $11.83, up 6%, running close behind the rally in Bloom Energy stock. Plug Power (NASDAQ:PLUG) stock is at $1.41, up 2%, trailing both Bloom Energy and FuelCell shares.
The Global X Hydrogen ETF (NASDAQ:HYDR), which serves as the hydrogen sector’s fund proxy, is at $35.79, up 1%. At the same time, the SPDR S&P 500 ETF Trust (NYSEARCA:SPY) is at $767.13, up 0.9%. Bloom Energy and FuelCell are outperforming both funds, with Plug Power also participating but to a lesser degree.
Blowout Quarter Collides With a Cash Flow Scare
Bloom Energy reported third-quarter 2026 results last week, with revenue more than doubling as hyperscaler and AI data center customers drove product demand. Management also raised its full-year revenue outlook for the third time this year. Chief executive KR Sridhar framed the shift in the earnings release, saying, “What began with hyperscalers is rapidly moving across market segments because every business needs reliable power to grow.”
The quarter’s weak spot was liquidity: free cash flow turned negative, ending a run of four positive quarters, and Bloom Energy stock fell sharply after the report. On the earnings call, chief financial officer Simon Edwards stated that the cash use is “not the beginning of a trend.” Edwards tied the outflow to inventory, contract assets, and receivables built up for future deliveries, and he pointed to positive free cash flow for the year to date as the counterweight.

High-Beta Buying Spreads Across Fuel Cell Names
A rising SPDR S&P 500 ETF Trust tends to reach high-beta stocks such as Bloom Energy harder than the broader market, which fits the size of the rebound relative to the fund. Bloom Energy sells on-site fuel cell power systems and has been the largest beneficiary of data center power demand in the group (we profiled seven of the suppliers supporting that expansion in a free report). Its recent addition to the S&P 500 index also ties Bloom Energy stock more closely to the broad market’s direction.
FuelCell builds utility-scale fuel cell platforms and earns revenue as modules are ordered and serviced; bulls point to its growing data center pipeline, while bears point to its latest revenue miss. Plug Power is weighted toward hydrogen fuel and handling equipment; bulls cite its narrowing losses, while bears note its distance from the on-site data center power story Bloom Energy leads.
What Bloom Energy’s Rebound Says About Its Cash Flow Test
Bloom Energy’s next test is whether its fourth-quarter 2026 deliveries turn into cash. Edwards said on the call that he expects contract assets to turn as the company reaches billing milestones and collects cash. A clean conversion would back up his view that the quarter’s outflow isn’t the start of a pattern. Capacity additions are also coming in increments, so Bloom Energy’s capital spending tracks customer demand.
The bull case for Bloom Energy leans on the quarter’s surging revenue and its repeated outlook raises, and another quarter of negative free cash flow at Bloom Energy could revive the selling that followed the report, particularly with Bloom Energy stock still trading below its pre-earnings level. Management has also said backlog is continuing to expand faster than revenue, which gives the company visibility into future deliveries.
Holders of Bloom Energy stock who rode out the post-earnings drop now have a rally behind them. Those reviewing their exposure should adjust their holdings carefully, since the conversion of deliveries into cash remains unproven until the fourth-quarter results arrive.
Got $1,000? Before You Buy PLUG, Read This
If you have cash sitting in your account right now, give this two minutes. After more than two decades of helping investors beat the market, our top analysts at 24/7 Wall St. put together a definitive report on the Top 10 Stocks To Buy Today. And PLUG wasn’t one of them.
They combed the entire market. It's not 10 ideas, not 10 stocks everyone is talking about, it's what their research points to as the 10 best stocks to buy right now, and it's free. Read more here and see which stocks made the list –>>
The post Bloom Energy Jumps 7% as Post-Earnings Selloff Reverses; FuelCell Rises 6%, Plug Power Edges Higher appeared first on 24/7 Wall St..
]]>Reddit‘s (NYSE:RDDT) guidance for slower third-quarter 2026 revenue growth looms over its upcoming earnings report, and Reddit stock is taking the biggest selling among social media names. At $136.52, Reddit stock is down 5% in morning trading. The slide signals fading confidence in how long its streak of rapid revenue gains can last.
Meanwhile, Snap (NYSE:SNAP) stock is down 3% to $6.16, a shallower drop than Reddit’s. Meta Platforms (NASDAQ:META) stock is up 0.2% to $643.55, holding steady while its two smaller rivals slip. The Global X Social Media ETF (NASDAQ:SOCL) is down 0.8% to $42.44, while the SPDR S&P 500 ETF Trust (NYSEARCA:SPY) is up 0.9% to $767.08, so Reddit’s slide runs against both its sector fund and the broader market.
When Reddit last reported, management guided third-quarter revenue to $860 million to $870 million, following Q2 2026 sales of $804.9 million that rose 61.1% year over year, according to its SEC filings. It also said it would stop separately reporting logged-in and logged-out daily active users, after weak U.S. logged-in user growth. Advertising is the swing factor this week, after segment revenue of $762 million rose 64% last quarter.
Meta Platforms stock is barely moving, keeping the group’s largest company clear of the selling. The Global X Social Media ETF’s latest disclosed holdings gave Reddit and Meta Platforms each a large slice of the fund, while Snap carried a smaller weight.
Three Ad Models Carry Different Risks
Reddit earns most of its revenue from advertising and also licenses its data to AI developers, tying it to rising demand for authentic human perspectives as AI-generated content spreads. Uneven search referral traffic last quarter added risk.
Meta Platforms sells advertising across Facebook, Instagram, Messenger and WhatsApp, a reach that protects it, though biggest AI spending is a risk to margins. Snap’s camera-centered messaging app is a narrower base more exposed to swings in marketing budgets, though its subscription products give it a growing second revenue stream. Ad sales at Reddit are growing quickly from a far smaller base.
For Reddit, the bullish view rests on a long streak of quarterly results that topped Wall Street estimates. The bearish view centers on slowing, since the guided third-quarter range points to growth below the pace of recent periods. Past beats haven’t guaranteed gains, as Reddit stock fell sharply after its last report despite strong results.

What Reddit’s Report Has to Prove
Reddit reports third-quarter results later this week, with its conference call scheduled for October 29 at 4:30 p.m. ET. Growth in Reddit’s advertising is the central test, and the report has to show it holding up despite the slower guidance.
Look for commentary on U.S. user trends. A revenue result near the top of the guided range, paired with firm ad pricing, could ease the worries weighing on Reddit stock, and those reviewing their positions should size their holdings carefully given the slower guidance.
Got $1,000? Before You Buy META, Read This
If you have cash sitting in your account right now, give this two minutes. After more than two decades of helping investors beat the market, our top analysts at 24/7 Wall St. put together a definitive report on the Top 10 Stocks To Buy Today. And META wasn’t one of them.
They combed the entire market. It's not 10 ideas, not 10 stocks everyone is talking about, it's what their research points to as the 10 best stocks to buy right now, and it's free. Read more here and see which stocks made the list –>>
The post Reddit Sinks 5% as Slower Growth Guidance Looms Over Earnings; Snap Drops 3%, Meta Holds Steady appeared first on 24/7 Wall St..
]]>XRP (CRYPTO:XRP) is a popular topic on forums and social media, where long-term investors discuss its potential future price. Many hope XRP can reach $100, believing such a rise could turn a small investment into something life-changing.
XRP is trading at $1.29 following a 12.9% drop in October. It has fluctuated between a high of $1.56 on September 29 and a low of $1.25 on October 24, and it has declined 51% from $2.65 over the past year.
For XRP to hit $100, it would need to reach a market value not seen in the crypto space so far. Only a few key factors could drive it to this level.
XRP at $100 Would Be Worth More Than the Whole Crypto Market

Market capitalization is calculated by multiplying a token’s price by the total number of tokens in circulation. About 63.4 billion XRP are in circulation out of a maximum supply of 100 billion. To reach $100, XRP would need to multiply its price by 77.5 times, resulting in a market value of around $6.34 trillion.
This figure is about 3.9 times larger than Bitcoin’s market cap (CRYPTO:BTC), with Bitcoin trading at $79,401. It’s also about 2.3 times the entire cryptocurrency market, which is valued at $2.7 trillion. In other words, XRP alone would need to be worth more than all other cryptocurrencies combined. This is significant, especially since XRP’s all-time high is only $3.65, achieved in July 2025, and it trades 64.6% below that peak.
As supply increases, this target becomes more challenging each year. Ripple, the company behind XRP, holds some of these tokens in escrow — a locked account that releases them gradually. If all 100 billion XRP tokens are circulating by 2030, hitting $100 would push the market value to about $10 trillion, meaning every released token raises the target even higher.
XRP ETFs’ $1.48 Billion in Assets Falls Short of a $100 Target
Exchange-traded funds (ETFs) allow investors to gain exposure to XRP through traditional brokerage accounts. As of October 23, U.S. XRP ETFs held net assets of $1.48 billion, with total new money added since their launch reaching $1.80 billion.
However, inflows have been minimal, with the largest single-day inflow over the past month only reaching $8.2 million on October 8. In the week starting October 19, three out of five trading sessions saw no new money entering these funds, with only $709,000 on October 21 and $3.55 million on October 22. On October 16, the funds even saw a $2.5 million outflow.
To reach a $6.34 trillion valuation, XRP ETF assets would need to grow from billions to trillions, a far cry from the $1.48 billion the funds hold.
XRP’s 2024 Rally Shows What a Shift in Sentiment Can Do

The strongest evidence of what positive market sentiment can do for XRP comes from late 2024. The price jumped from $0.51 at the end of October to $1.94 by the end of November — a staggering 280% increase, driven by expectations of a more favorable regulatory environment after the presidential election. XRP reached $3.40 in January 2025 and hit a record high of $3.65 in July 2025.
Despite this significant rally, the price never reached $4. Since then, XRP has decreased by 29.5% in 2026 alone. While another similar surge could propel XRP back toward $3.65, it would still be around 96% below the $100 target.
What Would Need to Happen for XRP to Reach $100
For XRP to realistically hit $100, several conditions must align. Financial institutions and payment companies would need to process a substantial portion of global payments and settlements using XRP. Additionally, demand for ETFs would have to rise dramatically, from billions to trillions. Furthermore, tokenization—converting assets like bonds or real estate into tradable tokens—would have to occur at scale on the XRP Ledger.
XRP would also need to play a role alongside RLUSD, Ripple’s stablecoin. As a U.S. dollar-pegged stablecoin, RLUSD would let banks settle payments without worrying about XRP’s price volatility.
So, Can XRP Reach $100 by 2030?
The short answer is no; XRP has a very slim chance of reaching $100 by 2030. This target implies a market value of $6.34 trillion at the circulating supply and around $10 trillion at full supply—figures that far exceed the overall $2.7 trillion crypto market and go well beyond mainstream expectations.
Before dreaming of hitting $100, XRP first needs to recapture its $1.56 high from September 29, 20.9% above its October 26 price. Then it must pass $2.65 and its record high of $3.65. A sustained move above $3.65, along with a notable rise in ETF assets, would signal progress. However, if ETF inflows remain low and XRP falls below $1.25, it may drop back towards $1.07, a level it traded at in late July.
Want Up To $3,000 In Stock? SoFi Is Giving New Active Invest Users Complimentary Stock
Looking to grow your money but unsure where to begin? SoFi Active Invest is offering a limited-time promotion; open a new Active Invest account, fund it with $50 or more, and you could receive up to $1,000 in complimentary stock.
From $0 commission trading3 to fractional shares4 and automated investing, this app is designed to simplify investing for everyone, whether you’re just starting or already experienced. Its easy to sign up and secure your bonus. (Sponsor)
The post Prediction: Can XRP Reach $100 by 2030? appeared first on 24/7 Wall St..
]]>Building up $5,700 in monthly dividend income means someone is getting approximately $68,400 a year from their portfolio without selling shares, and yes, taxes will take a bite. In 2025, a single filer’s 22% federal bracket started at $48,476 of taxable income, so part of that income could be taxed at 22%. Reaching this target takes different amounts of money depending on the yield you aim for, and each level has its own trade-offs. We’ll walk through three of them, and then see how a six-fund income portfolio compares.
The big caveat to remember is that every number comes from one formula: income target divided by yield equals capital required.
Sleep-at-Night Tier: 3% to 4% Yield
The least worrisome position is to take $68,400 divided by 0.035 equals $1,954,000. That’s the highest entry price, and it offers the most durable income.
This level includes dividend-growth funds and broad high-dividend equity funds. The Schwab US Dividend Equity ETF (NYSEARCA:SCHD) yields about 3.0% on its forward payout, so funding the whole target with it would take around $2.3 million. The return is growth, as shares rose 256% over the past decade. The iShares Core High Dividend ETF (NYSEARCA:HDV) yields about 4.2%, charges just 0.08% a year, and climbed 176% over ten years.
Monthly Checks at a Lower Price: 5% to 7% Yield
For a slightly higher yield, take $68,400 and divide it by 0.06 to get $1,140,000. You need far less capital than in the safe level, and you give up most of your dividend growth to get there.
REITs, preferred shares, and high-dividend equity funds live here. Realty Income (NYSE:O) yields about 5.7% and just declared its 676th consecutive monthly dividend. Adjusted funds from operations (AFFO, the cash flow REITs use to fund dividends) rose 4% to $1.09 per share in Q2. Raises come in small steps, though. The monthly payout rose from $0.26 in October 2024 to $0.27 today, a modest increase.
Maximum Income, Minimum Capital: 8% to 14% Yield
$68,400 divided by 0.10 equals $684,000. You need the least money here, and your income is the least predictable.
The JPMorgan Nasdaq Equity Premium Income ETF (NASDAQ:JEPQ) sells covered calls on Nasdaq stocks and yields about 11.6%. That means around $588,000 could cover the full target. Its 2026 monthly payouts swung between $0.47 and $0.70, so your paycheck changes every month.
Main Street Capital (NYSE:MAIN), a business development company that lends to private companies, paid $4.33 per share over the past year, about 8.1%. Count only the regular monthly dividend, which works out to about 5.9%, as reliable income. The quarterly $0.30 supplements depend on the business’s performance.
Where Cash Fits
The iShares 0-3 Month Treasury Bond ETF (NYSEARCA:SGOV) yields about 3.6% with almost no price risk. Its payout floats with interest rates. The monthly distribution fell from $0.36 in August 2025 to $0.30 this month. It functions as a near-term spending reserve.
Pricing a Six-Fund Mix
| Fund | Weight | Approx. Yield |
|---|---|---|
| SCHD | 20% | 3.0% |
| JEPQ | 20% | 11.6% |
| O | 15% | 5.7% |
| MAIN (regular only) | 15% | 5.9% |
| HDV | 15% | 4.2% |
| SGOV | 15% | 3.6% |
The mix yields about 5.9%, so it takes around $1.2 million to produce $68,400. MAIN’s supplements and a strong month from JEPQ would add to that. Building a portfolio that acts like a paycheck, with payouts on a schedule, is the whole point of our free Paycheck Portfolio Method guide, which walks through the mix, calendar, and withdrawal order.
Why the Smallest Yield Can Pay the Most
Picture $1,954,000 at a 3.5% yield, with dividends growing 8% a year. It pays $68,400 today, about $136,700 in year nine, and about $273,300 by year 18. Now picture $684,000 at a flat 10% yield. It still pays $68,400 in year 18, and inflation has eaten a big share of what that money buys. The high-yield investor saves on capital today and pays for it with lost purchasing power later.
Three Moves to Make Now
- Size the plan around actual spending. Add up a year of real expenses. If you need $4,800 a month instead of $5,700, every capital figure above drops by about one-sixth.
- Budget from regular payouts only. Use MAIN’s regular dividend and JEPQ’s lowest recent month as your base. Treat anything above that as a bonus to reinvest or save.
- Model taxes before you pick funds. Payouts from REITs, BDCs, and covered-call funds are mostly taxed as ordinary income. Holding those in an IRA and keeping qualified dividend payers in a taxable account can leave more of the $68,400 in your pocket.
Released: 401k & IRA Tips and Answers
(sponsor) 401(k)s are powerful retirement tools. But even savvy savers can make mistakes that quietly cost you money for decades. Choosing the wrong fund, ignoring small fees nobody adds up, rollover steps done in the wrong order, the list goes on.
These sort of mistakes is exactly what 401k & IRA Tips and Answers was created to help prevent. It is a free guide from Fisher Investments on rollovers, contributions, required withdrawals and the mistakes that do the most damage to a retirement account. Learn More Here ›
The post How to Build $5,700 a Month in Dividend Income for Life appeared first on 24/7 Wall St..
]]>Bittensor (CRYPTO:TAO) and NEAR Protocol (CRYPTO:NEAR) have experienced significant drops in price over the past two weeks, with declines of up to 19%. In contrast, Bitcoin (CRYPTO:BTC) saw a smaller drop of just 4%. As these two major AI coins struggle, many investors are left wondering if the AI coin trade is coming to an end.
Over the past 14 days, Bittensor has fallen 12.9% to around $251, while NEAR has dropped 19.4% to about $4.53. In comparison, Bitcoin’s decline is relatively minor, at just 3.7%. This stark difference has raised investor concerns about the future of AI coins.
On October 24, 2026, both TAO and NEAR hit new monthly lows. TAO closed just below $251, its lowest monthly close, with a 30-day loss of 23.5%. NEAR, too, sank to about $4.24, its lowest point in a month. For perspective, TAO is trading 66.9% below its all-time high, while NEAR is down 77.9%.
What Triggered the Selloff in AI Coins?

The latest downturn was sparked by a selloff in technology stocks after a concerning report regarding AI spending surfaced on October 22.
Meta Platforms (NASDAQ:META) fell about 7% that day, despite beating revenue expectations. Traders at Wells Fargo said Meta’s comments about its need for AI funding caused its shares to roll over, and the Nasdaq Composite fell 2.6% that day.
Adding to the uncertainty, Jensen Huang, CEO of NVIDIA (NASDAQ:NVDA), mentioned in an interview that while demand for AI-related cloud services is “off the charts,” the available capital for investment is limited. This statement raised market concerns, as it suggested lenders may be less willing to finance the AI sector’s growth.
As investors pulled away from riskier assets, they shifted toward safer investments like U.S. Treasuries, pushing the 10-year yield down to 4.97%. Simultaneously, Brent crude oil prices surged by 4% to around $113 per barrel on reports of renewed strikes against Iran.
AI Coins Are Feeling the Pressure More Than Bitcoin and NVIDIA
AI coins began to decline earlier in the month. On October 8, the cryptocurrency market took a hit as rising oil prices, rising interest rates, concerns about the future of cryptography, and tech-stock anxiety converged. On that day, TAO fell from about $291 to $269, while NEAR dropped from around $5.33 to $4.46, both experiencing their highest trading volumes of the month.
In comparison, NVIDIA, a leading AI stock, declined by 7.8% from September 28 to October 23 but remains up by 15.3% in 2026. Fetch.ai, another AI coin, fell 27.9% over the month, suggesting the sector’s weakness isn’t limited to TAO and NEAR.
Investors who jumped into the AI market during the hype need to consider an exit strategy as well as how to enter, and our free bubble survivor’s handbook can help them with both.
Bitcoin has managed to hold its ground better than most. Bitcoin has the deepest market in crypto, and many investors view it as a store of value, so a panic over AI doesn’t impact it as directly. In contrast, both TAO and NEAR’s prices are closely tied to AI expectations, so any doubt in the AI space directly affects their value.
NEAR also had more to lose after experiencing substantial gains earlier this year, soaring 204.5% in 2026 and 138.7% over the last 60 days. Investors had more profits to protect when the wave of fear came crashing in. Bitwise also began trading a spot NEAR ETF on September 29, yet NEAR remains down 7% over the last 30 days.
TAO and NEAR Have Dropped Below Their October 8 Lows

TAO is also facing supply pressures. The Bittensor network operates subnets—specialized mini-networks where miners compete to fulfill AI-related tasks such as storage and inference. Here, both miners and validators earn new TAO tokens through emissions, which can increase supply they may sell as buyer interest wanes, even after the December 2025 halving cut daily issuance in half.
Support levels indicate where buyers typically enter the market, while resistance levels denote where sellers take over. TAO fell below its October 8 low of about $254, dropping to around $242 on October 24, and its October 22 high of about $273 serves as the nearest resistance.
Similarly, NEAR fell below its October 8 low of about $4.30, touching approximately $4.24. Its October 22 high of around $5.33 is the closest resistance level.
Despite these struggles, trading volume suggests sellers may be tiring. On October 25, TAO’s trading volume was the lowest recorded since the selloff began on October 7. Trading remained light as TAO dipped to around $247 before bouncing back to above $250.
Is the AI Coin Trade Over, or Just Taking a Break?
The AI coin trend seems more likely to be taking a break than ending, but it is on shaky ground. Recently, NEAR has risen 2.2% in the past 24 hours, and TAO has stayed above its $242 low for two days. However, these rebounds have occurred on low trading volume, which raises concerns.
For investors, this uncertainty can be unsettling, especially since major tech companies need to prove to shareholders that their investments in AI are worthwhile. Meta’s October 22 report didn’t help, as its AI spending plans worried investors despite a revenue beat.
On October 24, NEAR co-founder Illia Polosukhin announced that NEAR Intents will integrate with Nasdaq and NYSE trading platforms, though he presented his stock-buying example as hypothetical. Additionally, the upcoming Backers Summit on October 28 includes a House of Stake issuance proposal that could reduce coin issuance.
If TAO closes below $242 or NEAR closes below $4.24, the outlook for AI coins may appear broken for this cycle. Conversely, if both coins can rise back above $273 and $5.33, respectively, it would suggest that the trading trend is only pausing.
Want Up To $3,000 In Stock? SoFi Is Giving New Active Invest Users Complimentary Stock
Looking to grow your money but unsure where to begin? SoFi Active Invest is offering a limited-time promotion; open a new Active Invest account, fund it with $50 or more, and you could receive up to $1,000 in complimentary stock.
From $0 commission trading3 to fractional shares4 and automated investing, this app is designed to simplify investing for everyone, whether you’re just starting or already experienced. Its easy to sign up and secure your bonus. (Sponsor)
The post Bittensor (TAO) and NEAR Fell Up to 22% in Two Weeks While Bitcoin Fell 4%. Is the AI Coin Trade Over? appeared first on 24/7 Wall St..
]]>Mortgage REIT AGNC Investment (NASDAQ:AGNC) now yields about 16.2%, even though its tangible book value per share fell 16.9% in a single quarter. A high yield only matters when the payout is sustainable. Jim Cramer summed up the risk on Mad Money: “Often, super high yields are a signal that the payout simply can’t be maintained.”
Quick test for sustainability: check the payout ratio (the share of profit paid out as dividends), check free cash flow (the cash left over after running and maintaining the business), and check whether debt is quietly covering the gap.
AGNC Investment (AGNC): A 16% Yield Running on a Shrinking Book
AGNC pays $0.12 every month, or $1.44 a year, and has held that rate since 2020. For monthly income seekers, that yield is hard to ignore.
For a mortgage REIT, spread income and book value matter more than EPS payout ratios. In the third quarter, net spread and dollar roll income came in at $0.37 per share against $0.36 in dividends declared, so coverage was nearly gone. The comprehensive loss reached $1.28 per share, tangible book value fell to $7.13, and the net interest spread narrowed to 1.86% from 2.00%. Leverage rose to 7.9 times tangible equity. AGNC also sold $992 million of new stock. Shares are down 9% over the past month, and AGNC has cut its payout from $0.22 to the current level over several steps. Our deep dive on AGNC’s monthly dividend covers the mechanics in more detail.
Management says the dividend remains “well-aligned with the economics of our business,” and its hedge ratio is 97%. For the payout to hold, rate volatility has to calm down.
Newell Brands (NWL): A Cut Dividend Still Looks Exposed
Newell Brands (NASDAQ:NWL) pays $0.07 a quarter, for a yield of about 5.2%. That payout was already cut from $0.23 in 2023. A big reason the yield is high: the stock has fallen 69.72% over five years.
Trailing diluted EPS is -$0.53, which means the dividend is paid out of a GAAP loss. Gross debt is about $5.0 billion, much larger than the market cap of about $2.32 billion, and interest expense hit $87 million in the second quarter alone. First-quarter operating cash flow was -$233 million. The strong second-quarter EPS of $0.42 included about $0.21 per share from tariff refunds, which management says won’t recur in 2027.
Management guides to about $400 million in operating cash flow and $200 million in capex. That leaves around $200 million against a dividend that costs about $119 million a year. That math assumes the company takes in substantially all of its tariff recovery.
Carter’s (CRI): A Yield Inflated by Years of Price Damage
Carter’s (NYSE:CRI) pays $0.25 a quarter, a yield of about 3.1%. The headline yield is modest, but the stock is down 61.92% over five years. The dividend was also cut from $0.80 in 2025.
Management guides fiscal 2026 adjusted EPS down from $3.47, with a high-single-digit to low-double-digit decline, and higher refinancing costs alone take out about $0.30 per share. Second-quarter adjusted EPS was $0.26, just above the $0.25 quarterly payout. Fiscal 2025 free cash flow fell 71.71%, and the company has gone through two CEO departures in recent quarters.
Cash exceeded $650 million, and the CFO says “to maintain more liquidity in this environment is absolutely the prudent thing to do.”
Altria (MO): Rising Payouts on a Shrinking Base
Altria (NYSE:MO) just raised its quarterly dividend to $1.11 from $1.06, for a yield of about 6.0%. The shares are up 35.06% year to date, so dividend growth drives this yield.
The forward payout uses about 93% of trailing diluted EPS of $4.75, and about 79% of the low end of adjusted guidance. Shareholders’ equity is negative at -$2.618 billion, which means debt-funded payouts over the years have left liabilities larger than assets. Domestic cigarette shipments fell 3.2%, oral tobacco volume dropped 8.5%, and second-quarter net income declined 3.36%.
2026 adjusted EPS guidance of $5.61 to $5.72 still covers the dividend, and pricing power has offset volume losses so far.
Omega Healthcare Investors (OHI): Covered for Now, with Tenant Risk
Omega Healthcare Investors (NYSE:OHI) raised its dividend to $0.68, the first increase since the payout settled at $0.67 in 2020. That puts the yield near 5.8%.
The right measure here is adjusted funds from operations (AFFO). At the center of 2026 AFFO guidance of $3.22 to $3.26, the dividend takes about 84%, so it is covered. The concern is tenant concentration. Genesis Healthcare is still in Chapter 11 with $148.5 million in loans outstanding; the Ciena Laurels portfolio covers its rent at only 0.87x, and cash fell 94.68% to $39 million. Medicaid reimbursement risk and the CEO’s planned retirement add uncertainty.
Portfolio rent coverage improved to 1.65x from 1.55x. If one large tenant fails, the buffer gets smaller.
Protect the Income Before Chasing It
When a dividend gets cut, the stock usually falls too, so investors lose income and capital together. We counted seven warning signs that a big yield is about to be cut in a free dividend trap guide, and most of the names above check more than one box. For more names under pressure, see our earlier list of dividend stocks with huge yields and bigger warning signs. On each of these five, keep an eye on coverage, cash flow, and debt every quarter. A high yield alone is never a reason to buy.
Got $1,000? AGNC Made Our Top 10 List. Here's Who Else Did
If you have cash sitting in your account right now, give this two minutes. After more than two decades of helping investors beat the market, our top analysts at 24/7 Wall St. put together a definitive report on the Top 10 Stocks To Buy Today. And AGNC was one of them.
They combed the entire market. It's not 10 ideas, not 10 stocks everyone is talking about, it's what their research points to as the 10 best stocks to buy right now, and it's free. Read more here and see which stocks made the list –>>
The post These High-Yield Dividend Stocks Could Be Traps for Retirement Investors appeared first on 24/7 Wall St..
]]>Neocloud stocks drew attention Monday after Elon Musk said more than 200 of them face “guppy-level death and consolidation,” according to CNBC. Nebius Group (NASDAQ:NBIS) traded at $158.73 as of 10:51 a.m. ET, roughly flat and down 0.01% on the day. That leaves the stock down 29.95% over the past month and still up 89.63% year to date.

Nebius’s own chief executive had already acknowledged part of Musk’s point. Per Stocktwits, an excerpt from Arkady Volozh’s podcast, recorded on the sidelines of the NVIDIA (NASDAQ:NVDA) GTC conference in Berlin last week, circulated on X on Sunday. He said some sources of capital had temporarily dried up, including “asset-backed financing or debt markets.” TradingView reported his words as “some of the capital sources are temporarily closed.”
Volozh Hedges His Own Funding Claim
He followed with a more confident line, per Stocktwits: “We have a pretty healthy balance sheet. We always thought about being more conservative here. But we’re working now with customer advances and several other instruments, which will probably provide us enough finance to build this gigawatt at least.”
“Probably” makes the funding a likelihood, and “at least” ties it to one gigawatt. On the August earnings call, Volozh set a larger goal: “Yes, we want to build a gigawatt capacity per year.” He said Nebius plans to start doing that in 2027.
Why Neoclouds Live and Die by Debt
A neocloud is a company that builds data centers and rents out AI computing power, mostly running on NVIDIA chips. The chips and buildings cost a great deal upfront. Returns come later, and only if customers pay enough to cover the borrowing costs and the cost of running the hardware. When lenders pull back, building slows. The suppliers one rung back from the chips, power, cooling, networking, keep profiting either way, and we rounded up seven of them in a free AI infrastructure report.
Per Stocktwits, Musk said debt markets have almost entirely shut off financing for companies without substantial revenue independent of AI data centers. He said SpaceX is outside that group, recently secured $40 billion in debt to buy NVIDIA GPUs, and has no interest in buying a neocloud.
Citi Loan Buys Time While Customer Contracts Carry the Weight
Nebius said Thursday it secured a $3.5 billion debt facility from Citigroup (NYSE:C) to fund data center expansion and GPU purchases. The loan matures in October next year and also covers general corporate purposes. Chief Operating Officer Ophir Nave said, per Stocktwits, “Sequencing our financing is how we optimize our long-term cost of capital,” and “We still have a range of capital sources available to us to finance the next phase of growth.” He pointed to $40 billion in long-term customer contracts that could serve as collateral.
Those contracts include large deals with Microsoft (NASDAQ:MSFT) and Meta Platforms (NASDAQ:META). Nebius’s second-quarter results filed with the SEC showed $37.5B in remaining performance obligations and $8.04B in cash. Customer advances do much of the work. Chief Financial Officer Dado Alonso said in August that Nebius expected more than $9 billion of upfront prepayments in 2026, and that Q2 deal terms covered approximately 50% to 60% of associated capex.
Both Sides of the Ledger
The conservative reading: the Citi facility runs about a year, funding leans on customer advances, and Volozh framed the gigawatt as likely. Concentration adds risk, with three customers making up 24%, 21%, and 14% of Q2 revenue. The constructive reading: Citi lent $3.5 billion into a market Musk calls closed, and hyperscale customers keep signing multiyear commitments. That puts Nebius in the group Musk described as still able to borrow. For background on how shares responded to the Citi deal, see our recent coverage of Nebius’s decline despite fresh Citi financing.
What to Watch Before the Citi Loan Comes Due
- Longer-term financing: whether Nebius replaces or extends the Citi facility with longer-dated debt before it matures next October.
- Executive commentary: further remarks from Nebius and other neocloud leaders on whether asset-backed and debt markets reopen.
- Lender behavior: how lenders treat neoclouds without contracts like Nebius’s Microsoft and Meta deals. A wave of distressed sales would support Musk’s consolidation call.
Volozh’s own words set the standard to measure against: enough capital for a gigawatt, probably. Every new financing announcement will show whether that “probably” firms up.
Got $1,000? Before You Buy NBIS, Read This
If you have cash sitting in your account right now, give this two minutes. After more than two decades of helping investors beat the market, our top analysts at 24/7 Wall St. put together a definitive report on the Top 10 Stocks To Buy Today. And NBIS wasn’t one of them.
They combed the entire market. It's not 10 ideas, not 10 stocks everyone is talking about, it's what their research points to as the 10 best stocks to buy right now, and it's free. Read more here and see which stocks made the list –>>
The post Nebius CEO Says Company Has Enough To Build Its Gigawatt, But Admits That “Some Of The Capital Sources Are Temporarily Closed” appeared first on 24/7 Wall St..
]]>Imagine a widow in her late 70s. She’s a composite, but her situation plays out in plenty of families. Her monthly income is just above her state’s Medicaid limit, and a recent hospital stay left her with a $12,000 bill that Medicare didn’t fully cover. Her adult kids gather together, decide the bill just made everything worse, and start talking about moving it to a credit card.
That move could backfire. In a state with a Medicaid spend-down program, the unpaid bill may be what gets her in the door. Under Medicaid’s “medically needy” pathway, people whose income is too high for regular Medicaid can count qualifying medical bills against the excess. Once the bills close that gap, she can become eligible for Medicaid. The expenses used to meet the spend-down remain hers, while Medicaid can begin covering eligible care beyond that point.
Plenty of Company
A quick note on the two programs, since they’re easy to mix up. Medicare is the government health plan most people qualify for at 65 regardless of income. The joint federal and state program for people with limited income and assets is Medicaid. It’s also the one that pays for extended stays in care facilities. The gap between what Medicare charges and what it actually covers is a big part of why bills like hers pile up (we mapped those coverage gaps and the surcharges that go with them in a free guide: Medicare’s Hidden Bills).
She has plenty of company. Alignment Health (NASDAQ:ALHC) runs an annual Social Threats to Aging Well in America survey with Ipsos. The 2026 edition polled more than 2,200 adults 65 and older and found that 16% of the seniors surveyed carry medical debt.
How a $12,000 Hospital Bill Becomes Part of the Medicaid Math
States can run a medically needy program for people with big health needs whose income is too high for other Medicaid groups, according to Medicaid.gov, the federal government’s official site for Medicaid policy. Those people qualify by “spending down.” They run up medical and remedial expenses that insurance doesn’t cover until those expenses top the gap between their income and the state’s medically needy income level. After that, Medicaid covers the costs.
It works a lot like an insurance deductible. The gap between her income and the state’s line is the deductible, and her $12,000 hospital bill counts toward meeting it. A bill that big can clear the threshold in one shot.
There’s another path as well. Some states, known as 209(b) states, use Medicaid eligibility rules that can be more restrictive than the federal SSI rules. Those states must give people who are 65 or older, blind or disabled a way to spend down excess income with qualifying medical expenses.
Keep in mind that this spend-down works on income. The familiar advice to “spend down your savings” deals with Medicaid’s asset limits, which are a separate test. Families still have to pass both.
36 States and D.C. Offer a Spend-Down, but Rules Vary Widely
Medicaid.gov counts 36 states plus the District of Columbia that use spend-down programs, either as medically needy programs or as 209(b) states. A family living outside that group can’t use this path at all, and inside it, some eligibility groups still don’t qualify.
The rules vary from state to state. Each state sets its budget period, decides which bills count and determines how older unpaid medical expenses are handled. States can also differ on when coverage begins. Two families with the same $12,000 bill in neighboring states can end up with very different answers.
One detail switches the usual logic. A bill that’s been issued may count toward the spend-down before anyone pays it. So the unpaid balance the family fears could be the most useful paper in the folder.
Timing matters too. Medicaid.gov notes that Medicaid can pay retroactively for up to three months before the month of application, as long as the person would have qualified back then. A prompt application could reach the hospital stay itself.
Show the $12,000 Bill to Medicaid Before It Lands on a Credit Card
Families who handle this well bring the bill to the Medicaid eligibility worker before they pay it, refinance it, or charge it. They also bring the itemized hospital statement and Medicare’s Summary Notice, so the caseworker can see exactly what insurance didn’t cover.
Moving the balance to a credit card can complicate the paper trail without making the original medical expense disappear. States have their own rules for medical bills paid with borrowed money, so the family should ask how the charge would be treated before moving the balance and keep the original hospital bill either way.
Card debt also brings interest, and that interest is a cost Medicaid won’t cover. A hospital payment plan or a short delay while the application is processed usually costs less than the rate on a card.
The decision in front of the widow’s kids is whether to treat the $12,000 as a debt to wipe out fast or as evidence for her Medicaid application. In the right state and eligibility group, it works as evidence. That’s worth checking with the state Medicaid office before anyone reaches for a credit card.
Released: 401k & IRA Tips and Answers
(sponsor) 401(k)s are powerful retirement tools. But even savvy savers can make mistakes that quietly cost you money for decades. Choosing the wrong fund, ignoring small fees nobody adds up, rollover steps done in the wrong order, the list goes on.
These sort of mistakes is exactly what 401k & IRA Tips and Answers was created to help prevent. It is a free guide from Fisher Investments on rollovers, contributions, required withdrawals and the mistakes that do the most damage to a retirement account. Learn More Here ›
The post 16% of Seniors Carry Medical Debt. A $12,000 Hospital Bill Could Help Someone Qualify for Medicaid Instead of Keeping Them Out appeared first on 24/7 Wall St..
]]>Consider a retired schoolteacher in her seventies. Years before she expects to need help bathing, cooking or managing her pills, she puts her name on her state’s Medicaid home care waiting list. Over Sunday dinner, she tells her kids she’s “on the list.” In her mind, that settles it. Nobody has looked at her bank statements, and nobody has checked whether she needs care. She read that the wait runs 34 months, so she figures her time is already running.
Plenty of people share her goal. The insurer’s annual survey studies how Americans plan their finances. In its 2026 Planning and Progress Study, Northwestern Mutual found that 83% of Boomers would prefer in-home care if a health event required long-term support. The problem is that the list she’s on may be a different kind of list from the ones behind that 34-month figure.
Medicaid’s Home Care “Waiting List” Can Mean 2 Different Things
Medicaid is the program run by Washington and the states that pays long-term care bills for people with limited income and assets. Medicare is different. Most people get this health coverage from the federal government at 65, and it doesn’t pay for ongoing custodial help at home. Families mix the two up all the time, and that confusion is exactly what leads to plans like hers.
States often provide specialized Medicaid home care through waivers, programs that can cap how many people receive services. When more people want a waiver than there are open slots, a waiting or interest list can form.
KFF, the health policy research group, surveys state Medicaid officials every year about these home care programs and finds that some waiting lists include only people the state has already found eligible. Others include people whose eligibility nobody has determined, and some states call those interest lists or referral lists, which share a name but mean very different things.
Why the 34-Month Average Can Mislead
KFF reports that people on waiting or interest lists who eventually got services in 2026 had waited 34 months on average. That one national number combines both kinds of lists.
The split between them is big. In 2026, 32 states screened people for eligibility on at least one waiver list. Eight states (Alaska, Florida, Iowa, New Mexico, Oklahoma, Oregon, South Carolina and Texas) screened no one on any list, yet those eight states accounted for 56% of everyone waiting nationwide. In other words, more than half of the people on the lists lived in states where getting on one did not mean anyone had established their eligibility.
The average has one more catch. Most people on these lists are waiting for programs that serve people with intellectual or developmental disabilities. That makes the 34-month national average a shaky guide to how long an older adult like her might actually wait.
Getting to the Top of an Interest List Only Starts the Real Process
On an unscreened list, hearing her name called is just the starting gun. Only then might she face the full financial application. She may also need a level-of-care assessment to show she needs the kind of help the program covers, and possibly a spend-down of savings to get under her state’s limits.
If her income or assets turn out to be too high, reaching the top of the list still doesn’t guarantee services. Her years in line may have moved her closer to an opening without settling whether she can actually take it. Her family may also find that her house, her IRA or a recent gift to a grandchild matters in ways nobody had looked at.
A screened list works differently. The state has already put her through some form of eligibility review before adding her, so her place on the list carries more weight. The family also has a better chance of learning about eligibility problems before her name reaches the top.
2 Questions Worth Getting in Writing
Families can clear this up by putting two questions to the state Medicaid agency or the office that runs the waiver:
- Is this a screened waiting list or an unscreened interest list?
- Has anyone reviewed her finances or her care needs yet?
If the answers are “unscreened” and “no,” the family knows her place on the list isn’t an approval for services. The real work of gathering financial records and finding out the state’s rules still lies ahead. Getting those answers in an email or letter helps, because a friendly phone call won’t count for much when her name comes up years from now.
Timing matters too. A parent who’s healthy today has room to sort out paperwork, records and family decisions calmly. Once she’s had a fall or a hospital stay, that same work gets done in a hurry.
Starting in 2027, States Have to Show Their Work
More transparency is on the way. KFF notes that starting in 2027, states will have to report whether the people on their waiting lists have been screened for eligibility. That should make the national numbers easier to read.
Until then, being on the list can feel like a plan. For her family, the question that matters most is whether the list knows anything about her yet.
Learn 7 Ways To Generate Income With A $1,000,000+ Portfolio
If you’ve saved over $1,000,000, this guide is for you. The last thing you want in retirement is to run out of money, you want your money to generate lasting income while you enjoy your life.
Now you can learn the strategies wealthy retirees use to fund their retirement with The Definitive Guide to Retirement Income from Fisher Investments. Download the guide today! (sponsor)
The post 83% of Boomers Want Care at Home. The 34-Month Medicaid Wait She Read About May Not Even Apply to the List She’s On appeared first on 24/7 Wall St..
]]>A $1,000 stake in Micron Technology (NASDAQ:MU) is now a direct play on AI memory demand. Shares traded at $870.54 noon, down 4.72% on the session, as chip stocks fell on Thursday. The forecast model starts from $913.67.
The stock deserves a long-range look because Micron grew fiscal 2026 revenue to $133.19B (+256.3% YoY), and management expects an even stronger fiscal 2027.

Base Case: What $1,000 Could Become
The model produces 1-year and 5-year targets. Because 2030 falls between those two, every specific figure below comes from the closest projected horizon, the 5-year target ending October 22, 2031.
Under the central projection, a $1,000 investment could be worth about $1,416.10 by that date, a total return of 41.61%, or 7.21% a year. That figure rests on a projected stock price of $1,293.88.
For a 2030 reference point only, the base path passes $1,192.96 on October 22, 2030. The bull path reaches $2,035.08 on that date and the bear path $739.76. Treat these as interim points along the path to the 5-year targets.
Bull, Base and Bear Scenarios for a $1,000 Stake
| Scenario | Target Price (Oct. 2031) | Total Return | Annualized Return | Value of $1,000 |
|---|---|---|---|---|
| Bull | $2,259.48 | 147.3% | 19.85% | $2,473.00 |
| Base | $1,293.88 | 41.61% | 7.21% | $1,416.10 |
| Bear | $747.64 | -18.17% | -3.93% | $818.30 |
Over the next year, the central projection points to $1,003.28 per share. A $1,000 investment would become $1,098.10, with a 1-year range running from $825.50 to $1,476.80.
Wall Street is more optimistic than the central forecast. The analyst consensus target is $1,560.57, supported by 9 Strong Buy, 36 Buy, 3 Hold and 1 Strong Sell ratings, and 92% of analyst sentiment is bullish. The model rates its own confidence as high (0.9).
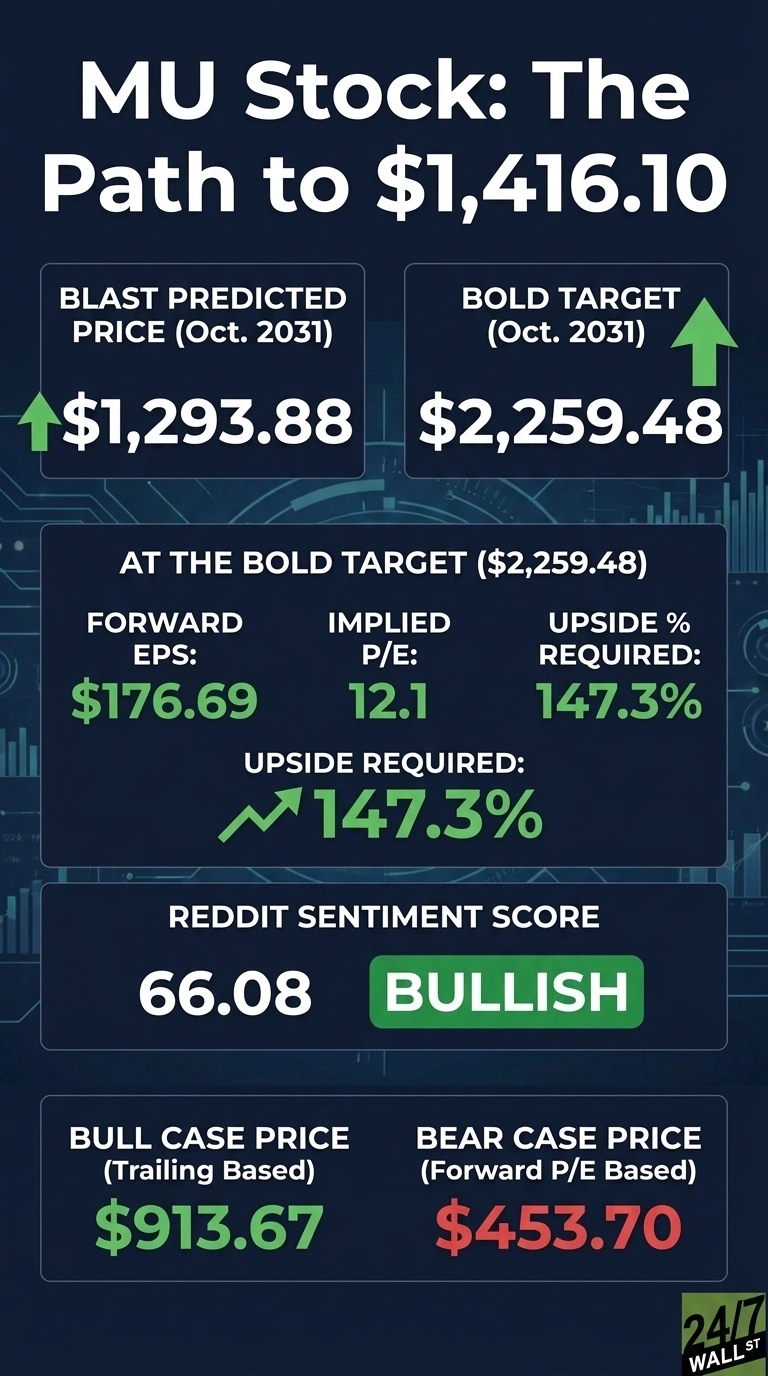
Three Drivers Behind the Upside
Earnings Momentum Is Still Accelerating
Fiscal Q4 revenue reached $54.23B (+379.3% YoY), ahead of the $50.97B consensus. Non-GAAP EPS of $33.42 beat the $31.35 estimate. Non-GAAP gross margin expanded to 87.0% from 45.7% a year earlier.
For fiscal Q1 2027, Micron guided to revenue of $61.5B ± $1.5B and non-GAAP EPS of $38.15 ± $1.00.
Tight Supply in HBM and DRAM
HBM4 is shipping in high volume, and HBM4E volume production is targeted for calendar 2027. Micron has spent more than a year co-designing HBM4E with NVIDIA (NASDAQ:NVDA).
Management called “DRAM the principal constraint versus logic or power to the data center” and added, “We really don’t have line of sight to when supply and demand balance.”
Multi-Year Contracts Extend Visibility
Micron has 26 Strategic Customer Agreements running through 2030, including 10 new agreements signed last quarter. More than 75% of fiscal 2027 shipments are already committed.
Management described the agreements as “transformational for us in terms of being able to match supply with future demand and to invest with confidence.”
Risks That Could Shrink Your $1,000
Memory has historically been a cyclical business with sharp pricing swings, and Micron’s outlook depends heavily on continued hyperscaler AI spending (the same expansion we broke down beyond the chipmakers in a free report on the suppliers driving it, here).
Fiscal 2026 capex reached $30.7B. That spending could weigh on margins should AI demand cool while new clean rooms come online. HBM4 revenue is also concentrated in a small number of lead customers.
Volatility matters too. Micron’s beta is 2.226, and the stock has fallen 16.6% over the past month even though it is still up 205.25% year to date. In the worst scenario, a $1,000 investment slips to $818.30 after five years.
What This Could Mean for Your Money
At the projected 5-year horizon, a $1,000 investment in Micron ranges from $818.30 to $2,473, and the central projection is $1,416.10.
Over the next few quarters, keep an eye on HBM4E timing, contract pricing and hyperscaler capex. These figures are projected scenarios and carry uncertainty. This projection is for informational purposes only.
Got $1,000? Before You Buy MU, Read This
If you have cash sitting in your account right now, give this two minutes. After more than two decades of helping investors beat the market, our top analysts at 24/7 Wall St. put together a definitive report on the Top 10 Stocks To Buy Today. And MU wasn’t one of them.
They combed the entire market. It's not 10 ideas, not 10 stocks everyone is talking about, it's what their research points to as the 10 best stocks to buy right now, and it's free. Read more here and see which stocks made the list –>>
The post If You Invest $1,000 in Micron Today, Here’s What It Could Be Worth by 2030 appeared first on 24/7 Wall St..
]]>Bitmine Immersion Technologies (NYSE: BMNR) recently made headlines by acquiring 10,452 ETH, valued at about $24 million, in the week leading up to October 25, 2026. In a statement, the company said it now holds 6.05 million ETH, which accounts for 4.95% of the 122.2 million ETH in circulation. This purchase brings Bitmine closer to its goal of holding 5% of all Ethereum.
Surprisingly, Ethereum (CRYPTO: ETH) showed little reaction to this news. ETH traded at $2,307, down 1% over the previous 24 hours and 13.2% for October. Meanwhile, Bitmine’s stock fell 5.2% to $21 in early trading.
The statement also noted that Bitmine’s total assets, including crypto, cash, and marketable securities, now stand at $15 billion. The company also repurchased 2.04 million shares during the week and 22.9 million so far this year, reducing the number of shares available to the public.
What Bitmine Owns and How It Profits From Its ETH

Bitmine describes itself as a cryptocurrency network company focused on accumulating digital assets for long-term investment. The company values its ETH at $2,356 each, based on Coinbase (NASDAQ: COIN) prices as of October 25. Bitmine also owns 215 Bitcoin (CRYPTO: BTC) and has $514 million in cash and marketable securities. Its investments include $180 million in Beast Industries and $76 million in Eightco Holdings (NASDAQ: ORBS), which it calls “moonshots.”
The company primarily generates revenue through staking. Staking involves locking ETH into Ethereum’s validator network that confirms transactions, allowing Bitmine to earn rewards paid in ETH. Bitmine currently has 5,227,037 ETH staked, valued at about $12.3 billion, through its Made in America Validator Network (MAVAN). MAVAN also provides services to external institutions, which could become a fee-based business, though Bitmine has not disclosed specific staking income figures.
Bitmine originally started as a Bitcoin mining operation and joined the Russell 1000 large-cap index on June 26. Notable investors supporting the company include ARK’s Cathie Wood, Founders Fund, Pantera, Galaxy Digital, and Bill Miller III. However, since these investors hold Bitmine shares, their presence indicates confidence in the company rather than a surge in independent demand for ETH.
Bitmine’s Weekly Buying Looks Small Next to Ether ETF Selling

While Bitmine is investing its capital, institutional investors in Ether ETFs are pulling back. In the week of October 19, U.S. spot Ether ETFs that directly hold ETH saw $225 million in net outflows, with withdrawals in three of the five trading sessions. Therefore, Bitmine’s $24 million purchase addresses only a small fraction of the ETH the funds have sold.
Interestingly, Bitmine’s current holdings rival the total assets managed by the spot Ether ETFs, which stood at about $14.6 billion as of October 23. Bitmine’s reported $15 billion includes cash and other investments.
Bitmine Is About 58,067 ETH Away From Its 5% Stop

Bitmine has indicated that it plans to halt further purchases once it reaches 5% of Ethereum’s supply, a goal it has dubbed the “Alchemy of 5%.” At 4.95%, the company is already 99% of the way there and needs about 58,067 more ETH, or about $137 million at current prices. With its recent purchase pace, it would take around 5.6 weeks to hit this target.
Reaching this ownership threshold could significantly impact the market, as Bitmine has consistently bought since launching its treasury strategy. Moreover, with spot ETFs seeing net outflows in most sessions since late September, Bitmine’s stop could remove demand while fund investors continue selling.
However, ETH’s price may already factor in this development. Bitmine has promoted its 5% goal since at least November 2025, and the remaining ETH needed is small compared to the daily trading volumes in the spot Ether ETFs. Furthermore, Bitmine’s staked ETH will remain locked after purchasing ends.
Chairman Tom Lee attributed ETH’s recent price drop to broader market trends, stating, “Crypto got pulled down by the same ‘risk-off’ forces behind the AI sell-off,” which he interprets as further proof that a crypto bull market is underway.
Could Bitmine’s 4.95% Share Push ETH Higher?
Reaching the 5% ownership goal does not necessarily mean ETH will rise. Bitmine secures a larger staking base and buybacks that bolster BMNR, which has fallen 56.8% over the past year, compared with ETH’s 44% drop, and is valued at $12.8 billion—below its $15 billion asset value. While Bitmine’s long-term holding keeps 5.2 million coins staked and out of circulation, it doesn’t translate into new demand for ETH once buying stops.
The primary question remains: who will purchase ETH next? ETF investors, the likeliest candidates, were net sellers in the week of October 19. The market’s response after Bitmine’s first 5% update will be crucial. A net inflow in the first week after the halt could suggest the market can absorb the change, while continued outflows and ETH falling below $2,307 could signal that losing Bitmine as a major buyer is weighing on the market.
Want Up To $3,000 In Stock? SoFi Is Giving New Active Invest Users Complimentary Stock
Looking to grow your money but unsure where to begin? SoFi Active Invest is offering a limited-time promotion; open a new Active Invest account, fund it with $50 or more, and you could receive up to $1,000 in complimentary stock.
From $0 commission trading3 to fractional shares4 and automated investing, this app is designed to simplify investing for everyone, whether you’re just starting or already experienced. Its easy to sign up and secure your bonus. (Sponsor)
The post Ethereum News: BitMine Just Bought 10,452 ETH and Now Owns 4.95% of All Ethereum appeared first on 24/7 Wall St..
]]>Strategy Inc. (NASDAQ: MSTR) reported cash reserves of $5.1 billion, enough to cover dividends and interest payments for the next 3.4 years without selling any Bitcoin. Executive Chairman Michael Saylor shared on X on October 26, 2026, that the company holds 848,517 Bitcoin (CRYPTO: BTC), valued at about $67.5 billion, along with $5.1 billion in cash as of October 25.
Saylor announced, “Strategy has repurchased $205M of $STRC. As of 10/25/26, we hold 848,517 $BTC and $5.1B of USD Assets.” STRC refers to one of Strategy’s preferred stocks, which pays a fixed dividend to its holders before common shareholders receive any dividend.
Despite this promising news, investor reactions were mixed. On October 26, the value of Strategy’s shares fell by 5.8%, settling around $138. Meanwhile, Bitcoin is trading at $79,560 after Bitcoin ETFs posted their largest outflow since June, putting it about 37% below its record high of $126,080.
Saylor Outlines Cash Coverage for 3.4 Years of Payments

Saylor detailed that the cash reserve can cover its obligations for 3.4 years. Those obligations are large, as Strategy paid $400.7 million in preferred dividends in the second quarter alone, a figure that can escalate with each new stock issuance. He also noted that “USD Duration is 3.4 yrs and STRC’s BTC Credit is 54 bps assuming 10% BTC ARR, 40% BTC Vol, and a BTC price of $81,200.”
The USD Duration reflects how long the reserves can sustain dividend payments, while BTC Credit indicates how well Strategy’s Bitcoin assets safeguard STRC holders.
Strategy’s Bitcoin holdings remained unchanged from its October 19 filing, indicating no new Bitcoin purchases in the week leading up to October 25. The week before, the company bought 250 BTC, roughly $20 million at today’s prices, and repurchased $192 million of STRC shares. Saylor did not disclose details about cash reserves or annual dividend obligations.
Strategy’s Cash Reserve Has Grown Since Q2, but Its Bills Are Large

The company’s cash reserves have increased from $3.75 billion in Q2, enough to cover just over 2.1 years of payments. However, the company’s obligations are also significant. Its convertible debt totals $6.7 billion, and it posted a net loss of $8.22 billion in Q2, primarily from an $8.32 billion unrealized loss on its Bitcoin holdings, recorded when the price declines.
Has Strategy Sold Bitcoin This Year?

Strategy has a history of selling Bitcoin, having monetized $218.4 million through Q2, with board approvals for sales up to $1.25 billion to bolster cash reserves.
For a forced sale to occur, three factors must align: cash reserves must deplete, Bitcoin prices must drop significantly enough to challenge cash flow, and capital markets must close off funding opportunities. In Q2, capital markets were accessible, allowing Strategy to raise $8.41 billion through its at-the-market program, which involves gradually selling new shares.
Despite this, Strategy’s Bitcoin acquisitions have slowed as share buybacks took precedence, dropping from 250 BTC purchases to none within a week, while STRC share repurchases rose to $205 million. Strategy’s shares have fallen 51.7% over the past year, meaning each new share sale raises less money—diluting existing shareholders more.
Could Strategy Need to Sell Bitcoin Again?
At this point, a forced sale appears unlikely. With enough cash to cover 3.4 years, Strategy can maintain its dividend payments without needing to liquidate Bitcoin. However, a voluntary sale remains possible, given board approval and the company’s prior Bitcoin sales. For MSTR shareholders, not selling Bitcoin may require more share sales, which yield decreasing returns as the stock price continues to drop.
Strategy is anticipated to announce its Q3 results after the market closes on October 29. If the upcoming report shows Bitcoin sales exceeding the previously reported $218.4 million or USD Duration below 3.4 years, selling could increase further.
Want Up To $3,000 In Stock? SoFi Is Giving New Active Invest Users Complimentary Stock
Looking to grow your money but unsure where to begin? SoFi Active Invest is offering a limited-time promotion; open a new Active Invest account, fund it with $50 or more, and you could receive up to $1,000 in complimentary stock.
From $0 commission trading3 to fractional shares4 and automated investing, this app is designed to simplify investing for everyone, whether you’re just starting or already experienced. Its easy to sign up and secure your bonus. (Sponsor)
The post Bitcoin News: Strategy Has $5.1 Billion in Cash to Cover 3.4 Years of Dividends. Could It Have to Sell Bitcoin Again? appeared first on 24/7 Wall St..
]]>Income investors usually pay a premium for reliable dividends. Right now, four well-known payers trade at a discount to their own valuation history, and each still covers its dividend from earnings or cash flow. T. Rowe Price (NASDAQ:TROW), United Parcel Service (NYSE:UPS), Verizon Communications (NYSE:VZ), and Realty Income (NYSE:O) all screen cheaper than their 10-year averages. The deepest discount belongs to T. Rowe Price, which trades at about 10 times trailing adjusted earnings, a lower multiple than at any year-end in the past decade.
Valuation Discounts at a Glance
| Stock | Forward Yield | Measure | Current | 10-Year Average |
|---|---|---|---|---|
| T. Rowe Price | 4.95% | Adjusted P/E | 10 | 15 |
| UPS | 6.45% | Adjusted P/E | 15 | 17 |
| Verizon | 6.62% | Adjusted P/E | 9 | 11 |
| Realty Income | 5.71% | Dividend yield | 5.71% | 4.70% |
The 10-year averages use each year-end share price from 2016 through 2025 divided by that year’s adjusted EPS. For Realty Income, whose GAAP earnings are distorted by real estate depreciation, the comparison uses forward dividend yield at each year-end, where a higher yield means a cheaper stock.
T. Rowe Price: A Decade-Low Multiple Backed by a Fortress Balance Sheet
T. Rowe Price pays $1.30 per share quarterly, or $5.20 annualized, for a 4.95% yield at $105.
Dividend safety: That payout takes about 50% of trailing adjusted EPS of $10.34, leaving room for buybacks too. CFO Jen Dardis said on the July call that year-to-date repurchases exceeded $497 million and that the firm holds $4.4 billion of cash and discretionary investments. The quarterly dividend has increased annually throughout the record, from $0.70 in 2018 to $1.30 in 2026.
Why it is out of favor: Clients pulled a net $6.5 billion in the second quarter, and the effective fee rate fell to 38.1 bps. Shares are down 36.39% over five years, and analysts count 9 holds, 1 sell, and 3 strong sells with zero buy ratings. The year-end P/E ran from 11 to 19 over the decade, and today’s multiple stands below that entire range.
Bull case: Assets under management hit a record $1.89T, and the ETF lineup pulled in $4.4 billion of Q2 net inflows. CEO Rob Sharps said, “We expect 2026 to be a record year for gross flows.”
Risk: Sharps also warned, “We expect net flows in the second half of the year to be meaningfully more challenging than the first half.”
United Parcel Service: An Ultra-High Yield Priced for a Recovery Nobody Trusts Yet
UPS pays $1.64 per share quarterly, or $6.56 a year, for an ultra-high 6.45% yield at $101.75.
Dividend safety: This is the thinnest buffer in the group. The dividend equals about 94% of trailing adjusted EPS of $6.95 and roughly 91% of the company’s 2026 EPS target of about $7.22. Management plans about $5.4 billion of 2026 dividends against expected free cash flow of roughly $5.5 billion. UPS ended Q2 with $4.7 billion in cash and no outstanding commercial paper. The quarterly payout rose from $0.17 in 2000 to $1.64.
Why it is out of favor: The Amazon glide-down cut volumes by 3.6%, and adjusted EPS fell from $12.95 in 2022 to $7.16 in 2025. Shares are down 36.78% over five years. The trailing multiple of 15 compares with a decade range of 13 to 20, and the stock trades near 14 times this year’s EPS target.
Bull case: U.S. Domestic revenue per piece rose 9.3%, and that segment’s operating margin reached 8%. Chief executive Carol Tomé said on the July call, “We now have a leaner, more automated, more agile network that will deliver operating leverage as volume grows.”
Risk: The quarterly rate has held at $1.64 per payment in 2025 and 2026, so any stumble in the turnaround leaves little margin for error.
Verizon: Record Cash Flow at a Single-Digit Multiple
Verizon pays $0.7075 per share quarterly, or $2.83 annualized, for an ultra-high 6.62% yield at $42.72.
Dividend safety: The payout equals about 58% of trailing adjusted EPS of $4.88. In cash terms, first-half dividends of $5.9 billion used about 58% of $10.2 billion in free cash flow. Q2 free cash flow alone rose 27.1% to $6.43B. The quarterly dividend has increased every year, from $0.50 in 2012 to today’s rate.
Why it is out of favor: Growth is slow, and third-quarter revenue reported this morning fell short of Wall Street estimates, according to StockStory. Shares were down 4.34% in early trading. At 9 times trailing adjusted earnings, Verizon stands below its 10-year average of 11, near the bottom of a decade range of 8 to 14.
Bull case: Q2 adjusted EBITDA margin hit 40.1%, postpaid phone net additions at Verizon reached 184K, and it paid off substantially all of Frontier’s debt 6 months ahead of schedule. CEO Dan Schulman said in July, “We’re growing our dividend, and we are paying down our debt.”
Risk: Unsecured debt totals $136.5B, with net unsecured debt at 2.5x EBITDA, which limits flexibility if cash flow softens.
Realty Income: Monthly Checks at One of Its Richest Yields in a Decade
Realty Income pays $0.2715 monthly, or $3.258 annualized, for a high 5.71% yield at $57.03.
Dividend safety: REITs pay dividends from AFFO, and the dividend uses about 73% of 2026 AFFO guidance of $4.44 to $4.45 per share. Occupancy is at 98.8%, Fitch rates the company ‘A’, and pro forma liquidity exceeded $5.7 billion. The Q2 increase was its 115th consecutive quarterly dividend increase.
Why it is out of favor: Rate-sensitive REITs have lagged, and shares sit below the $71.59 close at the end of 2021 and the $61.69 200-day average. A GAAP P/E of 41 looks expensive, but depreciation inflates it. On yield, today’s 5.71% beats the 10-year average of 4.70% and stands near the top of a range running from 3.71% to 5.92%.
Bull case: AFFO per share grew 3.8% to $1.09 in Q2, new deals closed at a 7.3% initial cash yield, and a $6B JV in hyperscale data centers adds a growth driver.
Risk: The net debt-to-adjusted EBITDA ratio, on a pro forma annualized basis, rose to 5.4x from 5.2x as the company leans on a $10.0B investment plan.
Four Discounted Payouts Worth a Closer Look
These four names all trade below their own decade-long valuation averages for a specific reason: fund outflows, the Amazon reset, slow telecom growth, or rate pressure on REITs. T. Rowe Price and Verizon pair that discount with payout ratios near 50% to 58%, Realty Income supports its monthly check with AFFO, and UPS offers the biggest turnaround return with the lowest coverage. For income investors, the discount gets a higher starting yield on dividends that are still funded.
Got $1,000? VZ Made Our Top 10 List. Here's Who Else Did
If you have cash sitting in your account right now, give this two minutes. After more than two decades of helping investors beat the market, our top analysts at 24/7 Wall St. put together a definitive report on the Top 10 Stocks To Buy Today. And VZ was one of them.
They combed the entire market. It's not 10 ideas, not 10 stocks everyone is talking about, it's what their research points to as the 10 best stocks to buy right now, and it's free. Read more here and see which stocks made the list –>>
The post 4 Historically Cheap High-Yield Dividend Stocks Ripe for Income Seekers appeared first on 24/7 Wall St..
]]>It should go without saying that there are several 55+ communities in Florida built to compete with The Villages. The list includes, but is not limited to, Solivita near Kissimmee, On Top of the World in Ocala, the Del Webb projects south of Orlando, and Latitude Margaritaville.
Their amenities include golf carts and pickleball clinics, and each publishes a monthly fee line that buyers consider alongside the purchase price. That line adds an HOA, a Community Development District (CDD) assessment, and a club fee, and it continues running after the house is paid off. Below are the costs of that line and what it costs to carry it for 25 years.
Fee Stack Buyers Price Last
Around Orlando, combined HOA, CDD, and club fees in 55+ communities run $376 to $653 a month. The CDD piece alone adds $128 to $220 per month, and the operations and maintenance portion continues indefinitely even after the bond is retired. Solivita adds a required $195 amenity fee on top of its base HOA, bringing the real monthly cost to the mid-$400s. On Top of the World lands in the same range, and its fee covers yard care, cable, and internet.
The Villages uses a different structure, as new buyers pay a $204/month amenity fee, plus a CDD assessment of $1,200 to $3,000 per year and a maintenance assessment of $600 to $1,400 per year. Copycat HOAs bundle services that Village owners pay for separately. So you can only compare the two once both are converted to a full annual figure.
A Working Budget for a Couple at 67
Take a couple paying cash for a resale home near Solivita’s $375,000 median. Florida’s income-adjusted state and local tax burden of $5,110 ranks among the lowest in the country. Insurance is the exception, averaging $3,000 to $4,000 per year.
| Annual Line Item | Estimate |
|---|---|
| HOA, CDD and club fees | $6,000 |
| Property tax after homestead | $4,500 |
| Homeowners and wind insurance | $3,500 |
| Medicare Part B for two ($202.90 each monthly) | $4,870 |
| Part D and Medigap for two | $7,000 |
| Dental, vision, out-of-pocket care | $3,000 |
| Groceries and clubhouse dining | $13,000 |
| Utilities and phone | $4,500 |
| Golf cart and vehicle replacement | $5,500 |
| Travel, clubs, gifts | $8,000 |
| Maintenance and emergency reserve | $5,000 |
| Federal tax on withdrawals | $2,500 |
| Total | $67,370 |
After the 2027 COLA, the average senior couple receives $3,355 a month, or $40,260 a year. That leaves a $27,110 gap, so covering it would take $677,750 at a 4% withdrawal rate, or about $775,000 at 3.5%. If both claims rest on full retirement age, waiting until 70 raises benefits to about $49,900. The gap then shrinks, and the 3.5% target falls to roughly $499,000. Some retirees cover the three years in between with a short treasury ladder.
Why the Fee Line Compounds Differently
The Villages amenity fee is linked to CPI and can rise no more than the CPI. Copycat HOA dues have no such cap as they follow the board’s budget, including clubhouse insurance and staff payroll. Over time, the fee functions as a recurring cost that can rise with inflation.
To see what that cost requires in savings, convert it to portfolio dollars. A total fee of $653 runs $7,836 a year and requires $195,900 in savings at 4%. Inflation for Americans 62 and older recently ran 3.6% year over year. If dues grew at that rate, a $500 fee would reach about $1,014 in 20 years, adding $6,168 a year to spending. Social Security will not always keep up. COLAs were 0% in 2009, 2010, and 2015.
Fees also weigh on resale, because the next buyer prices them in. Over the past year, home prices in Wildwood-The Villages rose 2.61%, as Cape Coral-Fort Myers fell 0.9%. For a retiree, home equity growth varies by market, as these figures show.
What It Takes to Buy and Stay
This lifestyle for a 67-year-old couple requires a paid-off home and about $680,000 to $775,000 invested. Under this model, the portfolio supports withdrawals of 3.5% to 4%. Delaying Social Security to 70 brings the invested target closer to $500,000. Add a fee reserve on top, since dues may grow faster than Social Security COLAs.
Multiplying a community’s full fee total by 25 gives the long-run cost of the fee line, which you can compare against the portfolio available to cover it alongside the list price.
Learn 7 Ways To Generate Income With A $1,000,000+ Portfolio
If you’ve saved over $1,000,000, this guide is for you. The last thing you want in retirement is to run out of money, you want your money to generate lasting income while you enjoy your life.
Now you can learn the strategies wealthy retirees use to fund their retirement with The Definitive Guide to Retirement Income from Fisher Investments. Download the guide today! (sponsor)
The post Plenty of Retirees Tour the Communities Chasing The Villages and Never Buy. One Reason Comes Up Every Time appeared first on 24/7 Wall St..
]]>Bitcoin (CRYPTO:BTC) fell below $80,000 today, driven by investor anxiety about AI spending. The top cryptocurrency slipped as much as 1.4%, hitting under $79,300, and was trading at $79,859 in early New York hours, close to its 30-day low of $79,107. So far in October, Bitcoin has dropped 4.1%.
While a 1.4% decline is minor compared to Bitcoin’s typical volatility, it coincided with a significant selloff in AI and tech stocks. So, is Bitcoin now behaving like a tech stock?
AI Spending Fears Hit Tech Stocks, and Bitcoin Follows Suit

The downturn began on Wall Street. On October 22, the Nasdaq Composite fell 2.6%, and the S&P 500 fell 1.2%—its worst performance since July. Investors grew concerned that rising borrowing costs for data centers and AI chips could hinder the AI sector’s growth. The CBOE Volatility Index (VIX), which gauges expected market fluctuations using S&P 500 options, increased from 14.8 on October 9 to 19.0 by October 22.
Earnings reports fueled the fears. Meta Platforms (NASDAQ:META) fell 7% after a mixed quarterly report and the announcement of a new class of stock to raise funds for AI projects. CoreWeave (NASDAQ:CRWV), a company that borrows money to buy AI chips for cloud rental, fell 10.1% on debt concerns, while NVIDIA (NASDAQ:NVDA) fell 4.4%.
So why do worries about AI spending affect Bitcoin, which doesn’t rely on borrowing for data centers? Pratik Kala from Apollo Crypto explains that many systematic funds—those that operate based on computer-driven strategies—tend to group Bitcoin with other risky assets. When these funds reduce risk, they often sell both Bitcoin and tech stocks, regardless of Bitcoin’s own news.
Nonetheless, Caroline Mauron, co-founder of Orbit Markets, noted that Bitcoin has been “relatively resilient” amid AI debt concerns. She also noted that market focus is shifting to the Federal Reserve meeting on October 28 and the upcoming U.S. midterm elections.
Bitcoin Fell Below $80,000 as ETF Investors Pulled $773 Million

A moving average helps traders analyze price trends by smoothing out daily fluctuations, and at $79,859, Bitcoin is trading 2.9% below its 20-day average of $82,254 and 2.4% below its 50-day average of $81,802.
Traders closely watch the $80,000 mark for psychological reasons. The next key level to monitor is the 30-day low of $79,107, about 0.9% lower. The current intraday low, slightly under $79,300, came close to testing it.
Bitcoin’s weakness may be partly due to ETF selling. SoSoValue data shows U.S. spot Bitcoin ETFs—funds that directly hold Bitcoin and function like stocks—saw net outflows of $635.5 million on October 22 during $2.56 billion of trading. Another $137.9 million flowed out on October 23, bringing the two-day total to about $773 million.
These outflows reversed a strong start to the week, when the funds had attracted $526.6 million on October 19 and $528.4 million on October 21. So, ETF investors sold on the same day the Nasdaq fell.
Bitcoin’s Connection to Tech Stocks Tightens

We measured the correlation of daily returns between Bitcoin and the Invesco QQQ Trust (NASDAQ:QQQ), an ETF tracking the Nasdaq-100. Correlation measures how closely two assets move together: 1 means they move in lockstep, while near zero indicates independent movements.
Over the past 21 trading days, the correlation reached 0.67. This contrasts with 0.38 over the past 63 trading days and 0.44 over the full 99-day sample. In other words, Bitcoin has moved much more like tech stocks in the past month than over the past quarter. Over a similar period, QQQ fell 4.6%, while Bitcoin fell slightly more, to 5.0%.
However, this link has limits. QQQ is up 15.2% in 2026, whereas Bitcoin is down 8.4% this year. In early trading today, QQQ rose 0.4% while Bitcoin dipped, suggesting Bitcoin may be influenced by tech stocks in downturns but doesn’t necessarily rise alongside them.
Bitcoin Has Held Up Better Than Ethereum and Solana
Over the past month, Ethereum (CRYPTO:ETH) dropped 13.6%, and Solana (CRYPTO:SOL) fell 16.4%, both significantly worse than Bitcoin’s 5.0% decline.
| Time Frame | Bitcoin | Ethereum | Solana |
|---|---|---|---|
| 24 hours | -1.1% | -1.0% | +0.1% |
| One week | -2.0% | -3.2% | -3.4% |
| One month | -5.0% | -13.6% | -16.4% |
| Year to date | -8.4% | -21.5% | -18.5% |
Bitcoin has the largest pool of buyers in the crypto market, including spot ETFs, which held $104.4 billion in net assets as of October 23. Smaller cryptocurrencies tend to swing more dramatically when traders cut risk, because fewer big buyers are ready to step in. Therefore, in a volatile crypto market, Bitcoin operates more like the steadier tech stocks.
Is Bitcoin Acting Like a Tech Stock Now?
For now, Bitcoin seems to be trading more like a tech stock than usual. Its 0.67 correlation with the Nasdaq-100 ETF (QQQ) over the past 21 trading days shows it. Investors fear rising AI borrowing costs could hurt tech profits. The next round of big tech earnings reports could confirm or ease these fears. Our free bubble survivor’s handbook offers tips on navigating an AI rally like this.
However, the 63-day and 99-day readings of 0.38 and 0.44 show this close link is new, and links that tighten in a selloff can loosen once the panic subsides. If Bitcoin rises above its 20-day average of $82,254—approximately 3% higher—on a day QQQ drops, the link may be breaking. Conversely, if Bitcoin closes below its 30-day low of $79,107 while ETF outflows persist, Bitcoin would still be behaving like a high-risk tech investment.
Want Up To $3,000 In Stock? SoFi Is Giving New Active Invest Users Complimentary Stock
Looking to grow your money but unsure where to begin? SoFi Active Invest is offering a limited-time promotion; open a new Active Invest account, fund it with $50 or more, and you could receive up to $1,000 in complimentary stock.
From $0 commission trading3 to fractional shares4 and automated investing, this app is designed to simplify investing for everyone, whether you’re just starting or already experienced. Its easy to sign up and secure your bonus. (Sponsor)
The post Bitcoin Analysis: BTC Is Falling on Doubts About AI Spending. Is It Trading Like a Tech Stock Now? appeared first on 24/7 Wall St..
]]>Walmart (NASDAQ:WMT) announced three holiday shopping events on Oct. 26, with its stock close to a $1 trillion market value. As of 10:25 a.m. ET, shares traded at $121.59. That was up 1.42% on the day, 10.01% over the past month and 9.83% year to date, for a market value of about $966.67 billion.

Investors may be counting on a strong holiday season to carry Walmart past $1 trillion. Available sources link the rally to other factors. TIKR attributes the move to investors paying a higher valuation multiple, and TipRanks linked the Oct. 22 gain to comments from an Oppenheimer analyst. That puts a lot of weight on the holidays, because a richer valuation needs profit growth to back it up.
Three Holiday Sales Built Around Lower Prices
Walmart’s holiday calendar, per its press release:
- Early Black Friday Deals: Nov. 12 to 15
- Black Friday: Nov. 23 to 29. Both Black Friday sales open online at 12:01 a.m. ET and in stores at 6 a.m. local time.
- Cyber Monday: Nov. 30 to Dec. 2, online only
Walmart said Walmart+ members get early access to hot deal drops for the first 24 hours of each Black Friday sale. Walmart’s own research found that 60% of shoppers say gift prices affect how they feel about the season, and Walmart said 70% say lower prices would make holiday shopping easier. Walmart is also promoting its new Walmart+ and Sam’s Club Plus bundle at $120 a year. Walmart’s Top Toys list includes 25 toys priced under $25.
Julie Barber, chief merchandising officer for Walmart U.S., summed up the pitch: “It’s all about helping our customers save more, discover more and make more room for what matters.”
A Higher Multiple Drove the Rally
TIKR data shows Walmart closed at $119.89 on Oct. 23, up 15.4% from $103.92 on Sept. 30. Over that period, TIKR shows analysts’ next-12-months earnings estimate stayed at $3.00 a share. The forward price-to-earnings ratio, which measures what investors pay for each dollar of profit expected over the next year, rose from about 35 times to about 40 times, per TIKR. In other words, investors paid more for the same expected earnings. TIKR puts the Street’s mean price target at $127.48, about 6% above the Oct. 23 close.
Why Price Cuts Can Squeeze Profit
Walmart has been putting its gains back into prices. Management said Walmart qualified for about $2.9 billion in tariff refunds and is using much of that money to fund more than 11,000 rollbacks. CEO John Furner said, “We’re investing heavily in price because customers need us to and because we believe it drives market share gains over time.”
TIKR names the main risk: if Walmart keeps reinvesting in lower prices, earnings could fall short. Oppenheimer’s Rupesh Parikh rates the stock Perform. According to TIKR, citing TipRanks, he said the bundle strengthens Walmart’s value proposition but noted a near-term profit headwind.
Higher-margin businesses help cover that cost. In the second quarter of fiscal 2027, global advertising rose 38% and membership fee revenue grew 17%. Adjusted EPS came in at $0.81, beating the $0.74 estimate, according to Walmart’s earnings release filed with the SEC. Even so, the stock fell 9.15% on the day of that report.

Nov. 19 Falls Between the Two Black Friday Sales
Walmart’s next report is expected on Nov. 19, though the company has not made that date official. That falls between its two Black Friday sales. The report covers the fall quarter, and holiday-quarter results won’t come until early next year, so Nov. 19 will give investors their first look at Walmart’s holiday outlook.
Walmart forecast to adjusted EPS of $0.62 to $0.64 for the quarter, and TIKR puts the year-earlier figure at $0.62 and the consensus estimate at $0.64. TIKR says results at or above consensus, along with Walmart’s full-year range of $2.80 to $2.87 held or raised, would support the higher multiple. A result at the low end of guidance would mean a stock TIKR values near 40 times forward earnings had reported flat quarterly earnings.

What to Watch Before the Holidays
- The Nov. 19 report, and any update to Walmart’s holiday outlook and full-year guidance
- How deep Walmart’s holiday discounts go, and whether management says they are weighing on margins
- Whether Walmart’s $120 bundle brings in new members, since membership fees help offset lower prices
Got $1,000? Before You Buy WMT, Read This
If you have cash sitting in your account right now, give this two minutes. After more than two decades of helping investors beat the market, our top analysts at 24/7 Wall St. put together a definitive report on the Top 10 Stocks To Buy Today. And WMT wasn’t one of them.
They combed the entire market. It's not 10 ideas, not 10 stocks everyone is talking about, it's what their research points to as the 10 best stocks to buy right now, and it's free. Read more here and see which stocks made the list –>>
The post Walmart Just Announced Its Triple Holiday Event. Investors Are Betting The Holidays Will Pave The Path To $1 Trillion For the Stock appeared first on 24/7 Wall St..
]]>The 24/7 Wall St. price target for Apple (NASDAQ:AAPL) is $398.25 over the next 12 months. That means 15.77% upside from $343.99. We rate the stock a buy, and our model holds high confidence in that call.
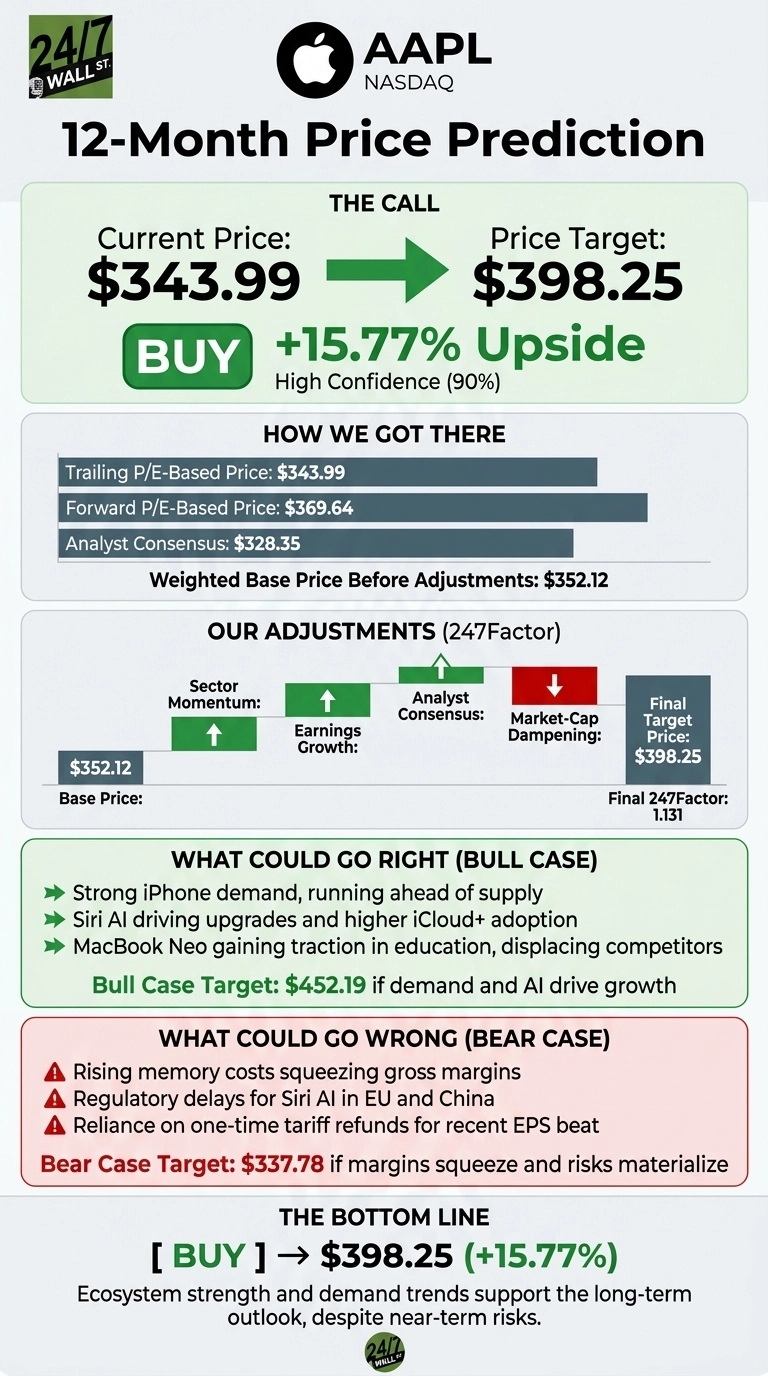
| Metric | Value |
|---|---|
| Current Price | $343.99 |
| Price Target from 24/7 Wall St. | $398.25 |
| Upside/Downside | 15.77% |
| Recommendation | BUY |
| Confidence Level | 90% |

Apple is heading into its most important stretch in years. A leadership handoff is underway, Siri AI is rolling out, and iPhone demand is running ahead of supply. Our model sees those forces adding up to meaningful upside, even after a strong run.

A Record June Quarter Fueled Apple’s 28% Rally
Shares have gained 1.57% over the past week, 2.24% over the past month, 8.35% over the past quarter and 28.12% year to date. That puts the stock near the top of its 52-week range of $242.76 to $348.15.
In fiscal Q3, revenue came in at $109.42 billion, up 16.4% and ahead of the $108.96 billion consensus. EPS of $2.02 exceeded expectations of $1.89.
iPhone revenue rose 22% and Mac grew 29%. Tim Cook said that July 30 call was his final one as CEO and that John Ternus was expected to lead future calls. This week, CNBC reported that the iPhone Duo is in short supply.

Why Bulls See $452 Within Reach
The bull case is $452.19, a 31.46% return. Apple has over two and a half billion active devices and more than one and a half billion paid subscriptions. Management expects Siri AI to push some users into higher iCloud+ levels.
The MacBook Neo is also pulling schools away from Windows and Chromebook devices. Guidance for the September quarter calls for 9%-11% revenue growth, with iPhone growth in the mid-teens.
On the Street, Apple has 6 Strong Buy and 19 Buy ratings, against 3 Sells and 3 Strong Sells.

Memory Costs Could Squeeze Apple’s Margins
The bear case is at $337.78, or -1.8%. Cook called the memory market “a 100-year flood” and warned that costs keep rising. Gross margin guidance of 47%-48% includes about one percentage point from one-time tariff refunds.
Those refunds also added $0.11 to Q3 EPS. Siri AI is still delayed in the EU and China. Among tracked institutions, 8 cut their positions in the June quarter. Berkshire Hathaway (NYSE:BRK-B) kept its 227,917,808 shares unchanged.
Bulls would point out that operating expenses rose 23% mainly because of R&D. That spending climbed to $11.73 billion from $8.9 billion, a planned investment in AI.
How Apple Compares to Microsoft and Alphabet
Because it is Apple’s closest rival for the title of most valuable company and competes for the same AI dollars, Microsoft (NASDAQ:MSFT) belongs here. The stock trades at a trailing P/E of 29 with a 40.3% net margin.
In mobile platforms and AI assistants, Alphabet (NASDAQ:GOOGL) competes with Apple. Its P/E of 14 is held down by a $99.03 billion equity gain. Alphabet also posted negative free cash flow and suspended buybacks.
| Company | Trailing P/E | Latest Revenue Growth |
|---|---|---|
| Apple | 45 | 16.4% |
| Microsoft | 29 | 17.75% |
| Alphabet | 14 | 24.23% |
Apple carries a clear premium over both peers. Our target looks reasonable, but it relies on Apple’s capital returns and ecosystem lock-in rather than on further multiple expansion.
Apple Price Prediction 2026-2030
The 24/7 Wall St. price target of $398.25 supports a buy with high confidence. What tips the scale for me is iPhone demand exceeding supply.
The bull case improves if Siri AI drives upgrades and memory costs level off. The outlook weakens if gross margin falls below guidance once tariff refunds wear off. On balance, Apple’s ecosystem and demand trends support our long-term outlook.
This is where our model projects Apple could trade, assuming current trends hold. The 2026 figure reflects our model’s January 2027 update.
| Year | Price Target from 24/7 Wall St. |
|---|---|
| 2026 | $351.30 |
| 2027 | $397.25 |
| 2028 | $443.95 |
| 2029 | $491.53 |
| 2030 | $523.62 |
These projections assume Apple keeps performing under new leadership. The biggest swing factors are Siri AI adoption and memory pricing.
Got $1,000? Before You Buy AAPL, Read This
If you have cash sitting in your account right now, give this two minutes. After more than two decades of helping investors beat the market, our top analysts at 24/7 Wall St. put together a definitive report on the Top 10 Stocks To Buy Today. And AAPL wasn’t one of them.
They combed the entire market. It's not 10 ideas, not 10 stocks everyone is talking about, it's what their research points to as the 10 best stocks to buy right now, and it's free. Read more here and see which stocks made the list –>>
The post Prediction: The Next Chapter for Apple Could Be Its Most Important Yet appeared first on 24/7 Wall St..
]]>Bitcoin (CRYPTO:BTC) is hovering around $80,000, the average price many of Wall Street’s recent Bitcoin investors paid, so many are weighing whether to buy at $80,000. BTC is trading at about $79,560, roughly 36.9% below its all-time high of $126,080. Over the past month, Bitcoin has declined by 5.0%, is down 8.4% year-to-date, and has dropped 30.0% over the last year.
In October, Bitcoin has also fallen 4.1% so far, with its 30-day low at $79,107, just below the current price. It also remains below its 50-day average of $81,802. So, is this a good time to buy Bitcoin, especially since many significant investors are at breakeven?
Big Investors Paid Around $80,000 for Bitcoin

The cost basis, or the average price that investors paid for Bitcoin, shows some interesting trends. According to Glassnode data, spot ETF holders and corporate treasuries bought Bitcoin at an average price between $80,000 and $81,500. This means they are nearly at breakeven, with little gain or loss.
Glassnode’s findings indicate that Bitcoin bounced back twice near $81,500, which is the average price for U.S. spot ETF holders. On October 15, Bitcoin dropped to around $80,000, and buying interest picked up quickly.
If the price falls further, Glassnode’s True Market Mean suggests that the average price for active investors is about $77,600. To reach this level, Bitcoin would need to decline approximately 2.5%, a price point it last hit on September 18.
Three Reasons Investors Are Considering Buying Bitcoin Near $80,000

- Breakeven Buying Behavior: When investors find themselves at breakeven, they often buy more to protect their positions, which can help stabilize the price. Bitcoin has appreciated by 25.6% over the last 90 days and is up 37.8% since hitting a low of $57,718 on July 1.
- Investor Sentiment: Market sentiment is leaning toward fear. The Crypto Fear & Greed Index, which ranges from 0 to 100 (with scores below 50 indicating fear), reads 44. Historically, buyers who enter during periods of fear often secure better prices than those who chase rising markets.
- Strong Historical Performance: Over the past decade, Bitcoin has surged more than 11,500%. For example, someone who bought at $58,681 late in the 2021 bull run, on October 27, 2021, is still up 35.6% despite the market’s decline in 2026.
ETF Outflows and Slower Corporate Buying Call for Caution

In late October, spot Bitcoin ETFs (which directly hold Bitcoin) experienced significant outflows, losing $635.5 million on October 22 and another $137.9 million on October 23. Total assets also fell from $110.8 billion on October 5 to $104.4 billion. However, the funds reported $304.7 million in net inflows by the end of the week of October 19, bringing cumulative net inflows to $57.2 billion.
Moreover, corporate Bitcoin buying has slowed. For instance, Strategy (NASDAQ:MSTR), which holds 848,517 BTC, added no Bitcoin in the week leading up to October 25. Its last purchase, revealed on October 12, was only 250 BTC—a small amount for the market’s largest corporate buyer.
Bitcoin has also mirrored tech stocks in 2026, raising concerns that a sell-off in AI-focused stocks could drag its price down further. Markets are also awaiting the Federal Reserve’s rate decision on October 28. If the support level around $80,000 breaks, the next significant level to watch will be the True Market Mean at $77,600.
Should Investors Buy Bitcoin at $80,000?
Whether this is a good time to buy Bitcoin largely depends on your investment strategy and how you would react to potential price drops. Long-term investors might view $80,000 as a noteworthy price point. However, due to ETF outflows and slowing corporate purchases, Bitcoin may test the $77,600 level first.
A lump-sum investment might work well if Bitcoin rallies immediately, while dollar-cost averaging—investing fixed amounts at scheduled intervals—could help minimize losses if the price drops initially.
A price recovery would likely happen in stages. First, Bitcoin would need to hold above its recent 30-day low of $79,107, then break back above $81,500 and its 50-day average of $81,802, all while ETF inflows turn positive.
If the price closes above $81,802, it suggests that major holders are defending their positions. Conversely, a close below $77,600 could bring back the 2026 low of $57,718 into view. Until we see clearer upward momentum, a move toward the previous record high of $126,080 seems unlikely.
Want Up To $3,000 In Stock? SoFi Is Giving New Active Invest Users Complimentary Stock
Looking to grow your money but unsure where to begin? SoFi Active Invest is offering a limited-time promotion; open a new Active Invest account, fund it with $50 or more, and you could receive up to $1,000 in complimentary stock.
From $0 commission trading3 to fractional shares4 and automated investing, this app is designed to simplify investing for everyone, whether you’re just starting or already experienced. Its easy to sign up and secure your bonus. (Sponsor)
The post Is Bitcoin a Good Buy at $80,000 Right Now? appeared first on 24/7 Wall St..
]]>Ripple has rolled out a new Treasury feature that lets eligible corporate clients earn ongoing returns on Ripple USD (CRYPTO: RLUSD), its dollar-backed stablecoin. Ripple announced this new option, called 24/7 Returns, at Swell 2026, alongside advancements in AI tools that build on the AI agents Ripple introduced in September.
The announcement said RLUSD held in a Ripple wallet qualifies for the program, but it did not disclose the return rate or its source. Notably, the release did not mention XRP (CRYPTO: XRP) or the XRP Ledger.
After the news, XRP’s price saw minimal movement, trading at $1.28 —down 1% over the last 24 hours, 12.9% for October, and 51% over the past year.
Ripple Treasury’s 24/7 Returns Targets Idle Cash

Ripple Treasury is a treasury management system that helps a company’s finance team track cash across various bank accounts, forecast needs, and manage payments. Ripple built this system on GTreasury, a company Ripple acquired for about $1 billion in 2025, and launched the platform on April 1.
The October 26 upgrade consists of two main components. First, a new orchestration layer integrates with GSmart, Ripple Treasury’s AI tools, to automate cash positioning, forecasting, reconciliation, liquidity, and payments. Then comes the 24/7 Returns feature, which rewards eligible companies for cash that sits idle overnight, on weekends, and during holidays when banks are closed.
Some of Ripple Treasury’s customers include American Airlines (NASDAQ: AAL), Trax, Christian Louboutin, Subway, Adecco, and Kingfisher. However, using Ripple’s software does not automatically mean these companies will park their cash in RLUSD.
Ripple backed its pitch with a 2026 liquidity survey from the Association for Financial Professionals, which found that 46% of organizations increased their U.S. cash balances over the past year. Additionally, 86% of treasury professionals said they would prefer real-time money market funds if they complied with their investment policies.
Since companies typically place short-term cash in money market funds, Ripple is positioning RLUSD as an alternative for earning returns during banking downtime.
Ripple Hasn’t Said What 24/7 Returns Pay

The GENIUS Act, a federal law regarding stablecoins, prohibits issuers from offering interest or yield merely for holding a payment stablecoin. While Ripple is responsible for issuing RLUSD, the announcement failed to clarify how returns would work or specify a rate, making it impossible for treasury managers to compare 24/7 Returns with traditional money market funds.
The law’s restrictions make the structure of any stablecoin reward the first concern for interested parties.
Because Ripple is a private company and does not publicly disclose revenue figures, it is unclear how much income it generates from Ripple Payments, custody services, Ripple Treasury, RLUSD, or Ripple Prime, which targets institutional clients.
Like other dollar stablecoin issuers, Ripple likely derives most of its RLUSD income from the interest earned on the reserves backing each token. A trust company regulated by the New York Department of Financial Services oversees these reserves, and Ripple has received conditional approval from the Office of the Comptroller of the Currency to operate a national trust bank.
Ripple also faces stiff competition for corporate cash. Circle (NYSE: CRCL) issues USD Coin (CRYPTO: USDC), a larger regulated dollar stablecoin with a market cap of about $71 billion, while Coinbase (NASDAQ: COIN) already offers rewards to customers holding USDC. Meanwhile, RLUSD ranks 41st among cryptocurrencies, with a market cap of about $2.5 billion.
Ripple’s advantage lies in its existing distribution. Finance teams already use its software, and a U.S. bank recently integrated RLUSD into its core systems, allowing Ripple to present RLUSD directly to finance teams without requiring them to open an exchange account.
What Role Does XRP Play in Ripple Treasury’s 24/7 Returns?
From what we can gather, XRP plays no direct role in the newly launched product. Ripple is enhancing its software product and establishing a sales channel for RLUSD, while XRP seems to gain no direct benefit from this development.
Want Up To $3,000 In Stock? SoFi Is Giving New Active Invest Users Complimentary Stock
Looking to grow your money but unsure where to begin? SoFi Active Invest is offering a limited-time promotion; open a new Active Invest account, fund it with $50 or more, and you could receive up to $1,000 in complimentary stock.
From $0 commission trading3 to fractional shares4 and automated investing, this app is designed to simplify investing for everyone, whether you’re just starting or already experienced. Its easy to sign up and secure your bonus. (Sponsor)
The post XRP News: Ripple Now Lets Companies Earn Returns on RLUSD Around the Clock. What Role Does XRP Play? appeared first on 24/7 Wall St..
]]>Aviva Investors, Aviva plc’s asset management division, recently launched a tokenized share class of its £22 billion Sterling Liquidity Fund on the XRP Ledger. In an announcement, Ripple said Aviva invested £50 million (about $66 million) in this new class, which lets the fund’s shares exist as digital tokens on the blockchain.
While the fund totals about £22 billion (around $29.4 billion), the tokenized segment is much smaller. According to Ripple, Aviva’s tokenized holdings across its two share classes exceed £86 million ($116 million).
Despite this significant development, XRP (CRYPTO: XRP) showed little reaction. The cryptocurrency stayed around $1.29, down 0.4% over the past 24 hours, and fell 12.9% in October. One reason for XRP’s lackluster performance is that the announcement did not mention XRP as a currency for fund-related transactions.
What Aviva’s Tokenized Sterling Fund Share Class Represents
The Sterling Liquidity Fund, operational since 2002, is a short-term cash fund that holds high-quality, sterling-denominated short-term debt. This structure lets investors earn a modest yield while retaining the flexibility to withdraw funds daily. The fund is based in Ireland and complies with UCITS regulations, setting guidelines for diversification, liquidity, and transparency for European investment funds. The tokenized share class is available only to eligible investors with digital wallets.
In this setup, a share class acts as a distinct wrapper around the same pool of assets. Aviva utilizes a “digital twin” model, where the tokenized shares appear on the XRP Ledger while the official fund structure operates off-chain, ensuring that tokenized investors receive the same objectives, risk profiles, and protections as other investors in the fund.
The project involves collaboration with external firms. The Bank of New York Mellon acts as the fund’s custodian, while Komainu, a digital asset custodian backed by Nomura, and Licuido, a tokenization platform, played instrumental roles in the launch. This makes it Aviva’s second tokenized fund, following the introduction of a USD Liquidity Fund class in July 2026, positioning Aviva Investors as one of Europe’s leading providers of tokenized liquidity funds.
Ripple’s Announcement Didn’t Specify XRP as a Payment Method

In its announcement, Ripple referred to XRP primarily as the ledger’s name, without specifying that investors purchase or redeem shares in XRP or use XRP as collateral. While Ripple highlighted impressive statistics—like over 4 billion transactions since its 2012 launch, nearly 8 million active wallets, and more than 130 validators—these figures focus on network activity rather than any direct demand for XRP from this fund.
The tokenized shares use the XRP Ledger for issuance and transfers. Each transfer incurs a small XRP fee, and every account must maintain a minimum XRP balance to avoid spam on the ledger. However, because this professional-only fund operates among a limited number of institutional wallets, it generates minimal demand for XRP.
Moreover, the announcement did not clarify investors’ payment methods, leaving open the possibility that transactions could still occur through traditional banking means. If settlement moves on-chain, a stablecoin might fit better for a cash fund where investors prefer reliable value.
Major Fund Issuers View Blockchains as Interchangeable

Some quotes from industry leaders are worth noting. Nigel Khakoo, Ripple’s senior vice president of trading and markets, emphasized that “settlement is moving to real-time, always-on rails,” promoting his employer’s network, Aviva’s technology partner, and a significant XRP holder. Meanwhile, Aviva Investors CEO Mark Versey said this launch “sets the groundwork for a future expansion of our capabilities,” without mentioning the token itself.
Competition in tokenized cash funds is intensifying. For example, BlackRock (NYSE: BLK) launched its BUIDL fund on Ethereum (CRYPTO: ETH) before expanding to other blockchains, while Franklin Resources (NYSE: BEN), the parent company of Franklin Templeton, also issues tokenized money fund shares across various networks, including the XRP Ledger. This shows that major issuers can adopt a new blockchain without buying XRP.
Franklin Templeton’s recent news regarding the XRP Ledger offered a preview of XRP’s reaction. On October 24, XRP opened at $1.29, dipped to $1.25, and closed at $1.30, indicating a minimal reaction to institutional tokenization announcements so far.
Could Aviva’s Tokenized Fund Lift XRP’s Price?
Not directly. Funds like this mainly increase demand for the XRP Ledger itself, boosting transaction volume and institutional wallet usage rather than directly affecting XRP’s price. Aviva benefits from a faster distribution method and management fees, while Ripple gains visibility through its association with a well-known name in the British finance sector. Ultimately, XRP benefits from a few fee burns and positive media attention, but its price trajectory remains unaltered for now.
That could change if Aviva or Ripple named XRP as the settlement asset, accepted it as collateral against fund shares, or used it to bridge pounds into other currencies. If the next update on Aviva’s tokenized balance, now above £86 million, names XRP for settlement or collateral, the token could gain direct demand, but if only the balance grows, the benefit stays with the ledger.
Want Up To $3,000 In Stock? SoFi Is Giving New Active Invest Users Complimentary Stock
Looking to grow your money but unsure where to begin? SoFi Active Invest is offering a limited-time promotion; open a new Active Invest account, fund it with $50 or more, and you could receive up to $1,000 in complimentary stock.
From $0 commission trading3 to fractional shares4 and automated investing, this app is designed to simplify investing for everyone, whether you’re just starting or already experienced. Its easy to sign up and secure your bonus. (Sponsor)
The post XRP News: Aviva Investors Just Tokenized a Share Class of Its £22 Billion Fund on the XRP Ledger. Could That Lift XRP? appeared first on 24/7 Wall St..
]]>A creditor group preparing for a possible restructuring has made JetBlue Airways (NASDAQ:JBLU) the lone casualty in an otherwise firm airline sector. JetBlue Airways stock has fallen 16% to $2.22, a decline that shows shareholders pricing in real balance-sheet risk at the discount carrier.
At the same time, United Airlines Holdings (NASDAQ:UAL) stock is up 3% to $100.75, moving in the opposite direction from its smaller rival. Delta Air Lines (NYSE:DAL) stock is up 2% to $78.19, a second legacy-carrier gain that keeps the pressure isolated on JetBlue Airways. Both carriers fly the same domestic skies as JetBlue Airways, which makes the gap between the three stocks stand out.
Fund-level moves confirm how narrow the selling is. Meanwhile, the U.S. Global Jets ETF (NYSEARCA:JETS) is up 0.8% to $26.32, so the airline basket is climbing even with JetBlue Airways among its members. The SPDR S&P 500 ETF Trust (NYSEARCA:SPY) is up 0.85% to $766.44, which leaves JetBlue Airways out of step with both the airline group and the broad market.
JetBlue’s Creditors Hire Restructuring Advisers
JetBlue Airways creditors have hired two restructuring specialists. The group, including holders of the airline’s senior bonds and a first-lien loan, brought in an advisor and a law firm, according to a Wall Street Journal report late last week. Those bonds, which are backed by collateral tied to the JetBlue Airways loyalty program, have fallen to record lows along with the loan and the stock. Creditor groups typically bring in such advisers to organize their bargaining position before any talks over a borrower’s obligations.
So far, JetBlue Airways hasn’t commented on the adviser hirings. In April, the airline’s chief executive told employees that the company wasn’t considering bankruptcy this year. The creditor move lands as higher jet fuel costs weigh on airlines and before JetBlue Airways releases its third-quarter 2026 report.
United Airlines and Delta Climb While JetBlue Airways Carries the Credit Risk
A loyalty and interline partnership called Blue Sky links JetBlue Airways and United Airlines commercially, giving travelers mutual benefits across both networks. However, shares of the two partners are moving in opposite directions, with the credit concern falling entirely on the more indebted one.
Loyalty-backed debt adds another layer to the comparison. Collateral for the senior bonds at JetBlue Airways is tied to its TrueBlue program, placing a core commercial asset at the center of any creditor negotiation. Bondholders with a claim on that collateral could gain significant leverage if formal talks begin.
What the Creditor Move Means for JetBlue Airways
JetBlue Airways’ upcoming third-quarter report is the next major test, particularly on whether management addresses the airline’s debt and cash position, and shareholders can watch for whether the report lays out a path for the obligations owed to bond and loan holders. The company’s response to the advisor hirings, whenever it comes, is another potential catalyst for the stock.
JetBlue Airways is pursuing its multi-year JetForward turnaround plan. On the bull side, the effort focuses on revenue optimization, cost discipline, network restructuring and product upgrades to restore sustained profitability. A credible update on that effort could ease some pressure on the stock, while fresh silence on liquidity may leave the creditor overhang in place.
United Airlines stock and Delta stock remain the firmer legacy names in the group, though higher jet fuel costs still hang over the whole industry. JBLU stock traders may prefer to keep their exposure limited until JetBlue Airways’ creditor dispute resolves.
Got $1,000? Before You Buy DAL, Read This
If you have cash sitting in your account right now, give this two minutes. After more than two decades of helping investors beat the market, our top analysts at 24/7 Wall St. put together a definitive report on the Top 10 Stocks To Buy Today. And DAL wasn’t one of them.
They combed the entire market. It's not 10 ideas, not 10 stocks everyone is talking about, it's what their research points to as the 10 best stocks to buy right now, and it's free. Read more here and see which stocks made the list –>>
The post JetBlue Airways Tumbles 16% as Creditors Hire Restructuring Advisers; United Airlines Rises 3%, Delta Edges Higher appeared first on 24/7 Wall St..
]]>There are a couple of ways to look at it, but the picture is about the same. MarketBeat shows that 54 of the 55 analysts who cover Nvidia (NASDAQ: NVDA) have a bullish call (“strong buy”, “buy”). Stock Analysis has the figure at 59 of 62 analysts. That is a range of over 95% to 98%. The news is either good or bad.
So many buy ratings are exceptional, as the stock continues its climb. At least a few analysts are skeptical. The average price target across all analysts is $325. The stock trades at $211 today. So, the assumption is that it can rise 54%. If the past means anything, the forecast is not crazy. Nvidia is up 725% in the last five years, but has done no better than the S&P 500 this year.
Nvidia’s stock price rests on two pillars. The first is 100% year-over-year revenue growth each quarter. In the most recently reported quarter, revenue was up 106% to $96 billion. On paper, by 2029, it should be the largest company in the US based on revenue, jumping ahead of Amazon (NASDAQ: AMZN). It would not take much of a dent in that growth to drive off some investors.
Nvidia’s growth rests on one simple premise: Data center growth will stay on fire. Megatech companies like Microsoft (NASDAQ: MSFT) will continue to have negative cash flow after decades of being positive. And Wall St. will need to fill in what these companies cannot. Skeptics have already argued that this is not sustainable. Apollo economist Torsten Slok notes, “Despite massive investments and widespread hype around artificial intelligence, the technology has delivered zero financial payoff to corporate America outside of tech.” In other words, the forecasts based on customer demand are deeply flawed. If this continues, presumably customer demand will dry up.
A major anxiety about Nvidia is that it sells the chips at the heart of AI’s technology success and growth rate, making it the arms merchant to the entire industry. Over and over again, critics and analysts say that Nvidia funds the demand for its own products by investing in its own chip customers. Nvidia’s balance sheet, and to an extent its revenue, is built on a house of cards.
And fulfilling AI demand may not be entirely driven by profitability. Depending on who is counting, communities that do not want data centers have delayed 200 of them this year. It has become a rallying point for some politicians, and there is no reason it will go away. By itself, this could slow AI growth.
A reader may say this analysis adds nothing new. It does not. It is, however, a juxtaposition of analysts’ wild optimism set next to what may be a less-than-perfect outcome.
Got $1,000? Before You Buy MSFT, Read This
If you have cash sitting in your account right now, give this two minutes. After more than two decades of helping investors beat the market, our top analysts at 24/7 Wall St. put together a definitive report on the Top 10 Stocks To Buy Today. And MSFT wasn’t one of them.
They combed the entire market. It's not 10 ideas, not 10 stocks everyone is talking about, it's what their research points to as the 10 best stocks to buy right now, and it's free. Read more here and see which stocks made the list –>>
The post 98% Of Nvidia Analysts Have “Buy” Rating appeared first on 24/7 Wall St..
]]>If you want a $6,400 monthly dividend check ($76,800 a year), consider a sample portfolio like this. This portfolio is built to hit this exact number with the following holdings: 25% in Schwab US Dividend Equity ETF (NYSEARCA:SCHD), 20% in Amplify CWP Enhanced Dividend Income ETF (NYSEARCA:DIVO), 20% in Goldman Sachs S&P 500 Premium Income ETF (NASDAQ:GPIX), 15% in Agree Realty (NYSE:ADC), and 10% each in AbbVie (NYSE:ABBV) and Duke Energy (NYSE:DUK). That leaves two questions: how much capital it takes, and which of those payouts will last.
How Much Capital $76,800 a Year Requires
Conservative: 3% to 4% Yield
Starting off with a conservative portfolio, $76,800 divided by 0.035 is about $2,194,000. At this level, you’ll find broad dividend-growth funds like SCHD, which typically yield 3.5% to 4%, and regulated utilities like Duke, which yield about 3.4%. You need the most money up front, but you get the steadiest income and the best odds of principal growth.
Moderate: 5% to 7% Yield
Moving on to a more moderate portfolio, you’ll take $76,800 divided by 0.06, which is $1,280,000. This level holds net-lease REITs like Agree Realty, which yields about 4.7%, along with preferred shares and covered call funds. DIVO typically yields 4% to 5% because it sells calls against blue chips, which cap its upside and slow dividend growth.
Aggressive: 8% to 14% Yield
At a 10% yield, the target takes $768,000. Business development companies, mortgage REITs, and leveraged call-writing funds live here. GPIX typically distributes 8% to 9%, and much of that comes from option premium, which moves with market volatility. Funds at this level often cut distributions and erode principal.
Plug in representative yields and the sample portfolio blends to roughly 4.8%, so it needs about $1,600,000 to produce $6,400 a month.
Three Tests That Expose a Yield Trap
- Is the payout rising? Agree Realty’s monthly dividend rose from $0.207 in 2021 to $0.271. AbbVie’s quarterly payout rose from $1.18 in 2020 to $1.73, roughly 7% per year. Duke’s most recent raise was 2%, continuing more than 20 years of annual increases.
- Do the cash flows cover it? Agree Realty guides to $4.57 to $4.59 in AFFO per share (adjusted funds from operations, a REIT’s version of cash earnings) against a forward dividend of $3.252. Its properties are 99.8% occupied. AbbVie’s GAAP EPS of $3.54 trails its $6.92 annual dividend, but that figure includes acquisition charges. Its adjusted EPS guidance of $13.87 to $14.07 covers the payout with plenty of room.
- Is the price holding? A fund that pays 9% while its share price slips gives you your money back. GPIX rose 15% over the past year, and SCHD gained 35%. Agree Realty fell 7%, which points to rate pressure, with the 10-year Treasury near 5%.
Why a Smaller Check Can Win Within a Decade
Say you put $2,194,000 into a 3.5% portfolio and its payouts grow 8% a year. Your $6,400 monthly check reaches about $12,800 by year nine, or roughly $153,500 a year. A 10% yielder with no growth still pays $6,400 nine years later, and inflation has eaten part of that check. One distribution cut leaves it smaller still.
The 10-year Treasury yields close to 5% with no credit risk. A yield far above that compensates you for the risk you’re taking on, so ask what that risk is.
What to Do Before You Build the Portfolio
- Pull five years of distribution history for every holding. Flag any cut, and flag any fund whose share price fell while it kept paying.
- Match each payout to the right coverage metric. Use AFFO for REITs, adjusted EPS for drugmakers and utilities, and total return against distributions for option-income ETFs.
- Model taxes in your bracket. Option premium income often gets taxed differently from qualified dividends. A single filer in the 22% bracket for 2025 (taxable income from $48,476 to $103,350) could keep noticeably less of a GPIX check than of an equal SCHD check, so compare after-tax income for each level.
Learn 7 Ways To Generate Income With A $1,000,000+ Portfolio
If you’ve saved over $1,000,000, this guide is for you. The last thing you want in retirement is to run out of money, you want your money to generate lasting income while you enjoy your life.
Now you can learn the strategies wealthy retirees use to fund their retirement with The Definitive Guide to Retirement Income from Fisher Investments. Download the guide today! (sponsor)
The post How Do You Tell a Yield Trap From a Real $6,400-a-Month Dividend Portfolio? appeared first on 24/7 Wall St..
]]>Crypto-linked equities are absorbing a heavier blow than the digital asset they track, which places the pressure directly on the stocks. Riot Platforms (NASDAQ:RIOT) stock has dropped 4% to $12.06, a slide that puts the miner’s turn toward AI data centers back in focus. Meanwhile, Strategy (NASDAQ:MSTR) stock is down 4% to $140.26, falling in step with Riot stock.
Bitcoin (CRYPTO:BTC) is at $79,883, only down 1% over the past 24 hours, leaving the coin comparatively steady while the equities tied to it retreat. MARA Holdings (NASDAQ:MARA) stock is down 4% to $6.77; this matches the declines in Riot stock and Strategy stock and confirms that the selling runs across Bitcoin-linked names. That divergence between the coin and its related equities points to pressure specific to the stocks.
For a sector read, the CoinShares Bitcoin Mining and Digital Power ETF (NASDAQ:WGMI) is down 2% to $28.36, a softer decline than Riot, Strategy or MARA shares. Across the broader market, the SPDR S&P 500 ETF Trust (NYSEARCA:SPY) is up 0.6% to $764.15, which sets the Bitcoin-linked group apart from equities overall.
Selling Concentrates in Bitcoin-Linked Stocks
Riot’s shift toward AI data centers also ties it to the concerns about debt-funded AI infrastructure that have weighed on similar companies this month.
Building data center capacity requires heavy upfront spending, and those concerns focus on how developers fund that work. These issues can land harder on Riot stock, which already swings with Bitcoin and now carries a second source of risk.
Miners and Strategy Carry Different Bitcoin Risks
Mining is the common thread for Riot and MARA. That ties each company’s results to the coin’s price and to the cost of running and expanding its facilities. Part of Riot’s business has been converting toward data center capacity for AI computing, giving the company a revenue stream that doesn’t hinge on Bitcoin alone.
Strategy’s model centers on holding Bitcoin on its balance sheet as a treasury asset, which ties the company directly to the coin’s price. That structure spares Strategy the facility costs that Riot and MARA shoulder, but it leaves the stock with few offsets when sentiment toward Bitcoin turns negative, though the upside works the same way, since a stronger coin price would flow straight through to the value of Strategy’s treasury.
What the Selloff Means for Riot’s Data Center Shift
Riot’s next test is whether its data center expansion keeps drawing customers while Bitcoin holds its current level. Steady demand from AI tenants could give Riot a revenue source that protects its mining business when the coin stalls. Any slowdown in new tenant commitments could leave Riot stock more exposed to swings in Bitcoin.

Funding is another unresolved piece, since the debt concerns hanging over AI infrastructure developers could shape how cheaply Riot raises capital for new capacity. Shareholders can watch for signs that Riot secures financing on terms that keep its balance sheet sound. Clear progress on that front may help separate Riot from the rest of the Bitcoin-linked pack.
Strategy and MARA remain tied to the coin, so a stronger Bitcoin price could lift both stocks while further weakness might deepen the decline. The CoinShares WGMI fund offers a broader read on whether the pressure spreads across the mining group. Position sizes should stay modest until Riot’s data center financing question resolves.
Want Up To $3,000 In Stock? SoFi Is Giving New Active Invest Users Complimentary Stock
Looking to grow your money but unsure where to begin? SoFi Active Invest is offering a limited-time promotion; open a new Active Invest account, fund it with $50 or more, and you could receive up to $1,000 in complimentary stock.
From $0 commission trading3 to fractional shares4 and automated investing, this app is designed to simplify investing for everyone, whether you’re just starting or already experienced. Its easy to sign up and secure your bonus. (Sponsor)
The post Cryptocurrency Stocks Slide as Bitcoin Hovers Near $80,000: Riot, Strategy and MARA Drop 4% appeared first on 24/7 Wall St..
]]>Retirees who live off a portfolio watch one number more than any other: the cash that lands in the account each quarter. Split $100,000 equally across three large-cap dividend payers, about $33,333.33 in each, and forward dividend rates would produce about $3,973.89 in annual passive income. That is more than $3,950 a year from a single six-figure investment, a combined yield of 3.97%.
The three companies work in pharmaceuticals, energy, and tobacco. Each answers to a different set of forces (drug patents, crude prices, and nicotine demand), so the income rests on cash flows that have little to do with one another. None of these payouts is guaranteed. Boards set dividends, and business results can change them. Below is what a $33,333.33 stake in each name would generate, using forward yields based on share prices from the October 26, 2026 session.
Chevron
- Stock #3: Chevron (NYSE:CVX)
- Forward Yield: 3.06%
- Shares for $33,333.33: 143.49
- Annual Passive Income: ~$1,021.62
Chevron is an integrated supermajor. It produces oil and gas in the Permian Basin, the Gulf of America, Guyana, and Kazakhstan, then refines and sells fuels, lubricants, and chemicals. Its yield comes from a mature, cash-rich business that returns capital through a steady dividend plus buybacks. The forward payout is $7.12 per share. The yield has fallen because shares are up 56.66% year to date.
Coverage looks solid. Second-quarter adjusted EPS came in at $6.06 against a $1.78 quarterly dividend, and the quarter produced $18.1 billion of free cash flow. Chevron also paid down $8.4 billion of debt and bought back $3.1 billion of stock. Its payout rose from $1.71 to $1.78 per quarter in 2026. Risk: oil prices drive much of that cash flow. Brent averaged $104 per barrel versus $68 a year earlier, and a reversal would squeeze free cash flow.
Philip Morris International
- Stock #2: Philip Morris International (NYSE:PM)
- Forward Yield: 3.18%
- Shares for $33,333.33: 165.44
- Annual Passive Income: ~$1,058.83
Philip Morris sells Marlboro outside the U.S. and runs a fast-growing smoke-free business built on IQOS, ZYN, and VEEV. Smoke-free products made up more than 40% of third-quarter net revenue. The yield reflects the tobacco discount investors apply to the stock, combined with a policy of raising the dividend every year. The latest increase lifted the quarterly payout to $1.60 from $1.47.
Against 2026 adjusted EPS guidance of $8.29 to $8.44, the $6.40 forward dividend works out to a payout ratio of about 77% at the midpoint. Expected operating cash flow of about $13.5 billion is well above planned capex of $1.4 to $1.6 billion. Net debt to adjusted EBITDA fell to 2.17x from 2.53x. Risk: management expects operating income growth to land toward the middle or lower half of its range because of geopolitical cost impacts and the U.S. investment ramp-up.
Pfizer
- Stock #1: Pfizer (NYSE:PFE)
- Forward Yield: 5.68%
- Shares for $33,333.33: 1,100.84
- Annual Passive Income: ~$1,893.44
Pfizer develops and sells prescription medicines and vaccines, including Eliquis, Prevnar, Vyndaqel, and Padcev. Its high yield reflects years of pressure: COVID product sales collapsed, with Paxlovid down 95% operationally, and the company faces patent expirations. Even after a 27.92% year-to-date rise, the stock still yields well above the other two.
The $1.72 annual dividend equals about 59% of the midpoint of confirmed 2026 adjusted EPS guidance of $2.80 to $3.00. Pfizer has also raised its 2026 revenue guidance midpoint by $500 million. The quarterly payout rose from $0.41 in 2023 to $0.43 and has not been cut in the period shown. Risk: generic and biosimilar competition is expected to cost about $1.1 billion in 2026 revenue, and no buybacks are planned while the company reduces debt.
Income Breakdown Across All Three Positions
| Name | Forward Yield | Annual Dividend Income |
|---|---|---|
| Chevron | 3.06% | $1,021.62 |
| Philip Morris International | 3.18% | $1,058.83 |
| Pfizer | 5.68% | $1,893.44 |
| Total | 3.97% | $3,973.89 |
These 3 positions together generate $3,973.89 in annual passive income on a $100,000 investment, a combined yield of 3.97%. Chevron contributes $1,021.62, Philip Morris adds $1,058.83, and Pfizer accounts for $1,893.44.
All three pay quarterly, so the income arrives on a regular schedule. Pfizer’s next payment is due December 7, 2026. For someone covering monthly bills, that steady flow of cash from three unrelated industries can be worth as much as the yield. Investors should watch payout coverage each quarter, since it is the first sign of whether the income will hold up.
Learn 7 Ways To Generate Income With A $1,000,000+ Portfolio
If you’ve saved over $1,000,000, this guide is for you. The last thing you want in retirement is to run out of money, you want your money to generate lasting income while you enjoy your life.
Now you can learn the strategies wealthy retirees use to fund their retirement with The Definitive Guide to Retirement Income from Fisher Investments. Download the guide today! (sponsor)
The post How Much Retirement Income Could $100,000 in These 3 Dividend Stocks Generate? appeared first on 24/7 Wall St..
]]>Applied Digital (NASDAQ:APLD) currently trades at $18.25, while the average analyst target stands at $62.44. That gap implies 242.1% upside.
Applied Digital builds and runs purpose-built AI data center campuses in North Dakota and the southern U.S. It leases capacity to CoreWeave (NASDAQ:CRWV) and investment-grade hyperscalers and holds about $36B in contracted revenue. The highest target on the Street is more aggressive still. Lake Street Capital Markets analyst Rob Brown holds a $90.00 target, which works out to 393.2% upside. With a gap that wide, the market and the analysts disagree sharply on this stock.
A Record Quarter Failed to Stop a Steep Slide
Applied Digital has fallen 32.98% in one month. That is a selloff of more than 30%, and it started right after the strongest quarter in company history. Shares stood at $25.45 when the company reported fiscal Q1 2027 revenue of $341.88M, beating the $124.57M consensus. Adjusted EPS of -$0.01 exceeded the -$0.3023 estimate, marking a 6th consecutive EPS beat.
Investors looked past those beats to the balance sheet. The company posted a GAAP net loss of $184.06M and spent $2.07B on capex in the quarter. It has $6.4 billion in total debt against about $3.7 billion in cash and restricted cash. Rising yields and a sliding Bitcoin (CRYPTO:BTC) price pressured the whole group. Rothschild & Co Redburn also initiated coverage at Neutral with a $22 target, highlighting execution, power and pipeline-conversion risks. As the stock hit a one-year low, co-founders Wes Cummins and Jason Zhang bought about $6.7 million in shares.
Why Analysts Kept Raising Targets Into the Selloff
The contracted backlog supports the bullish thesis. Applied Digital has about 1.41 GW of leased critical IT load, and the contracts reach ~$86B if all renewal options exercised. Management expects “to place over 600 megawatts into service versus the 250 megawatts over the past 12 months.”
Pricing is the next catalyst. Management expects about 250 megawatts of expansion leases by calendar year-end, with lease rates up “definitely north of 15%”. The ChronoScale compute unit is on track for $1 billion of ARR in 2027. The longer-range target is 3.5 to 4 gigawatts by the end of calendar year 2030.
Recent analyst moves have mostly been reiterations and upgrades. Wells Fargo kept its Overweight rating and lifted its target to $55. Morgan Stanley stayed at Equal-Weight but upgrades its target to $41. Jones Trading initiated at Buy with a $70 target. Needham and B. Riley hold targets in the $70–$85 range.
The consensus fiscal 2028 EPS estimate has slipped to -0.7844 from -0.2500 30 days ago, which means analysts expect losses to continue for at least two more years.
Neocloud Peers Fell Even Harder Than Applied Digital
The whole group sold off together, and Applied Digital held up better than its closest rivals.
IREN (NASDAQ:IREN) has dropped 47.07% in a month to $24.91. Its average target of $77.81 implies 212.4% upside, which is smaller than Applied Digital’s. Of its 20 analysts, two call it a Strong Buy, 13 a Buy and five a Hold. Its latest quarterly revenue of $137.20 million missed estimates.
Cipher Digital (NASDAQ:CIFR) has fallen 56.73% in a month to $7.94. Its average target of $29.36 implies 269.8% upside, which is larger than Applied Digital’s. Of its 22 analysts, five call it a Strong Buy, 15 a Buy and two a Hold, despite a Q2 EPS of -0.65 that missed estimates.
Cipher offers the biggest consensus upside among the three. Applied Digital has the most aggressive single target and is the only one of the three beating estimates. None of these targets is a guarantee.
Down 25.57% This Year While the S&P 500 Gained 11.45%
At $18.25, Applied Digital trades near its 52-week low of $17.65 and far below its high of $50.73. The 15 covering analysts average $62.44, which implies 242.1% upside. The ratings break down this way:
- Strong Buy: 2
- Buy: 11
- Hold: 2
- Sell: 0
The stock is down 25.57% so far this year, compared with an S&P 500 gain of 11.45%. Over one year, Applied Digital has lost 45.33%, against a 13.13% gain for the index. A beta of 6.0 explains why the moves in both directions are so large.
A Real Backlog Weighed Down by Real Debt
The bullish thesis improves if the 600-plus megawatts reach service on schedule and the expansion leases close at higher rates. Should both occur, base rent replaces one-time fit-out revenue and the 89% NOI margin on HPC operations starts to has the income statement. But the stock looks like a value trap if capital markets tighten before Polaris Forge 3 and the two Delta Forge campuses are financed. A free cash flow yield of -50.3% leaves little room for error.
The bullish thesis has support. The contracts are signed, insiders are buying, and Applied Digital is the only name in the group beating estimates. The $90 target needs years of flawless execution, so it reads as a ceiling, while the average target reflects a multiyear outlook. All of that AI data center expansion still has to be powered, cooled, and networked by somebody, and we rounded up seven suppliers doing exactly that in a free report on the AI boom beyond the chipmakers. Watch the stock around the next lease announcements.
Want Up To $3,000 In Stock? SoFi Is Giving New Active Invest Users Complimentary Stock
Looking to grow your money but unsure where to begin? SoFi Active Invest is offering a limited-time promotion; open a new Active Invest account, fund it with $50 or more, and you could receive up to $1,000 in complimentary stock.
From $0 commission trading3 to fractional shares4 and automated investing, this app is designed to simplify investing for everyone, whether you’re just starting or already experienced. Its easy to sign up and secure your bonus. (Sponsor)
The post Applied Digital Keeps Cratering: This Analyst Keeps Insisting It’s Going to Jump by 390% appeared first on 24/7 Wall St..
]]>Adobe (NASDAQ:ADBE) keeps slipping, and every new leg down broadens the gap between its share price and its fundamentals. The stock has fallen 24.62% year to date to $263.82. The loudest Reddit post on the name carries the title “ADOBE is cooked.” The crowd thinks AI will commoditize Adobe. I think Adobe is the company getting paid for AI, and I think the margins prove it.
AI Already Pays Adobe’s Bills
Adobe’s AI-first ending ARR topped $650 million, growing more than 150% year over year. Monthly active users passed 1 billion, up more than 20%. Creative freemium users crossed 100 million, up more than 70%, and Firefly ARR grew 40% quarter over quarter. Adobe keeps adding users, then routes them toward paid credits and premium levels. Total ARR reached $27.5 billion, up 11.2%.
Margins Expanding Faster Than Revenue
Third-quarter revenue rose 12.89% to $6.76B, and free cash flow grew 14.68% to $2.438B on just $85M of capex. Management targets a full-year non-GAAP operating margin of approximately 45%. In fiscal 2025, operating income grew 29.15% on 10.53% revenue growth. Non-GAAP EPS of $6.13 topped the $6.09 estimate for a fifth consecutive beat, and Adobe raised fiscal 2026 non-GAAP EPS guidance to $24.45 to $24.50.
Buybacks Do My Compounding
Adobe pays no dividend, so for a retirement portfolio the buyback serves as my income engine. The company retired roughly 8.1M, 8.5M and 9.5M shares across the first three quarters, with $24.55 billion still authorized. Every share I hold claims a bigger slice each quarter. At today’s price, Adobe trades near 11 times the fiscal 2026 consensus EPS of $24.476 and about 10 times the fiscal 2027 estimate.
How Adobe Stacks Up Against Microsoft and Autodesk
The obvious AI story belongs to Microsoft (NASDAQ:MSFT), and it spent $115.95 billion on capex in its latest fiscal year to fund it. Its fourth-quarter free cash flow fell 23.19%, and the stock trades at about 29 times earnings. Adobe’s light-capex model converts AI demand more directly into cash.
Autodesk (NASDAQ:ADSK) grows faster, with revenue up 16.05% last quarter. It guides to a non-GAAP operating margin of ~39%, though, below Adobe’s target. Adobe offers the wider margin.
Real Risk I Track Every Quarter
Adobe deliberately drives users into its freemium model before monetizing them, and RPO grew only 8%. Leadership also changes: Anil Chakravarthy becomes CEO on December 1, ending Shantanu Narayen’s 29 years at the helm. A conversion miss under a new chief would hurt. The risk looks contained. The internal successor knows the business, guidance rose about $50 million at the midpoint, and analysts posted 27 upward fiscal 2026 EPS revisions against 3 downward over 30 days.
Catalysts Investors Should Track Next
Adobe MAX arrives in November, and the Topaz Labs deal should close in Q4. The consensus calls for fiscal 2027 EPS of $27.5076. A business with 45% margins, a billion users and a shrinking share count keeps getting cheaper while it gets better, and investors should watch whether that trend holds.
Got $1,000? Before You Buy ADBE, Read This
If you have cash sitting in your account right now, give this two minutes. After more than two decades of helping investors beat the market, our top analysts at 24/7 Wall St. put together a definitive report on the Top 10 Stocks To Buy Today. And ADBE wasn’t one of them.
They combed the entire market. It's not 10 ideas, not 10 stocks everyone is talking about, it's what their research points to as the 10 best stocks to buy right now, and it's free. Read more here and see which stocks made the list –>>
The post The Market is Misinformed About Adobe’s AI Risks and Blind to Its Margins appeared first on 24/7 Wall St..
]]>Alternative media names are falling while large-cap stocks climb, a split that isolates the pressure in one small corner of the market. Trump Media & Technology Group (NASDAQ:DJT) stock has fallen 4% to $6.16 early in the session, a decline that pulls it toward the bottom of its yearly range.
Meanwhile, Rumble (NASDAQ:RUM) stock is down 5% to $5.38, a larger drop than Trump Media stock’s that marks the selling as shared across the two alternative platforms. Rumble stock’s heavier loss puts it at the front of the decline, with Trump Media shares close behind.
Two funds focus that picture. The SPDR S&P 500 ETF Trust (NYSEARCA:SPY) is up 0.7% to $765.41. At the same time, the Global X Social Media ETF (NASDAQ:SOCL) is down 1% to $42.24, a comparatively small loss that indicates heavier pressure on Trump Media and Rumble shares.
Selling Concentrates in Alternative Media Names
Neither Trump Media nor Rumble has issued a fresh announcement tied to the decline, so the stocks’ own behavior carries the story. Shares of both are falling harder than the SOCL social media ETF. Moreover, the broad-market SPY ETF is rising, a pattern that points to selling concentrated in the alternative media corner of the market. That divergence also shows Trump Media shares trading on their own story, apart from how the broader economy is doing.
Ongoing overhangs add to the pressure. Senate Democrats have targeted Trump Media’s newly launched Truth API, a business-to-business data feed, with proposed legislation, while the pending TAE Technologies merger and digital asset holdings add uncertainty.
Trump Media’s quarterly filing showed Q2 2026 revenue of $1.7 million against a net loss of $238.1 million, driven mainly by $190.4 million in unrealized declines in the value of digital assets and equity securities. At quarter-end, Trump Media’s financial assets totaled approximately $1.9 billion, and management expects legal expenses to decline materially.
Rumble Leads the Slide as the Social Media Fund Holds Up
The Global X Social Media ETF holds a broad basket of U.S. and international platforms, and Trump Media and Rumble were both small positions in the fund as of its most recent holdings report, so its decline is sector context.
International exposure spans China, South Korea and Japan. Unlike Trump Media, Rumble is a video platform growing users through Rumble Shorts and international expansion, a bull case backed by its pending Northern Data AG acquisition and a Tether advertising commitment. The bear case: revenue has missed estimates and net losses have grown.
Over the past year, Trump Media stock has traded between a low of $6.04 and a high of $17.09. Trading at the bottom of that range ties the stock’s next leg to company-specific news, and a break beneath that floor could mark new territory for Trump Media shares.
TAE Merger Sets the Next Catalyst
Traders can watch for progress toward closing the TAE Technologies merger, targeted for Q4 2026 after a formal regulatory step at the end of September. A delayed deal could leave Trump Media without the strategic reset its management has described.
Management views the deal as an extension into energy security infrastructure, a shift that could change how the market values Trump Media stock. Until that question is resolved, investors weighing their exposure should adjust their holdings carefully.
Got $1,000? Before You Buy RUM, Read This
If you have cash sitting in your account right now, give this two minutes. After more than two decades of helping investors beat the market, our top analysts at 24/7 Wall St. put together a definitive report on the Top 10 Stocks To Buy Today. And RUM wasn’t one of them.
They combed the entire market. It's not 10 ideas, not 10 stocks everyone is talking about, it's what their research points to as the 10 best stocks to buy right now, and it's free. Read more here and see which stocks made the list –>>
The post Trump Media Slides 4% Toward 52-Week Low While Market Rises; Rumble Sinks 5% appeared first on 24/7 Wall St..
]]>The quarter NVIDIA (NASDAQ:NVDA) just delivered would impress at a company one-tenth its size. Q2 fiscal 2027 revenue reached $96.22 billion, up 105.8% year over year. Data Center networking grew 138%, faster than compute.
Jensen Huang put it simply: “AI has reached its inflection point. It’s doing useful work. Its tokens are productive and profitable. Now, compute is revenue.”
Shares are up 18.43% year to date at $220.36, but they fell 3.57% over the past week. Even rumors of a big China chip purchase failed to lift the stock. That break leaves room for a bigger move. NVIDIA’s path to $400 by late 2027 depends on rising earnings and a market-level multiple.
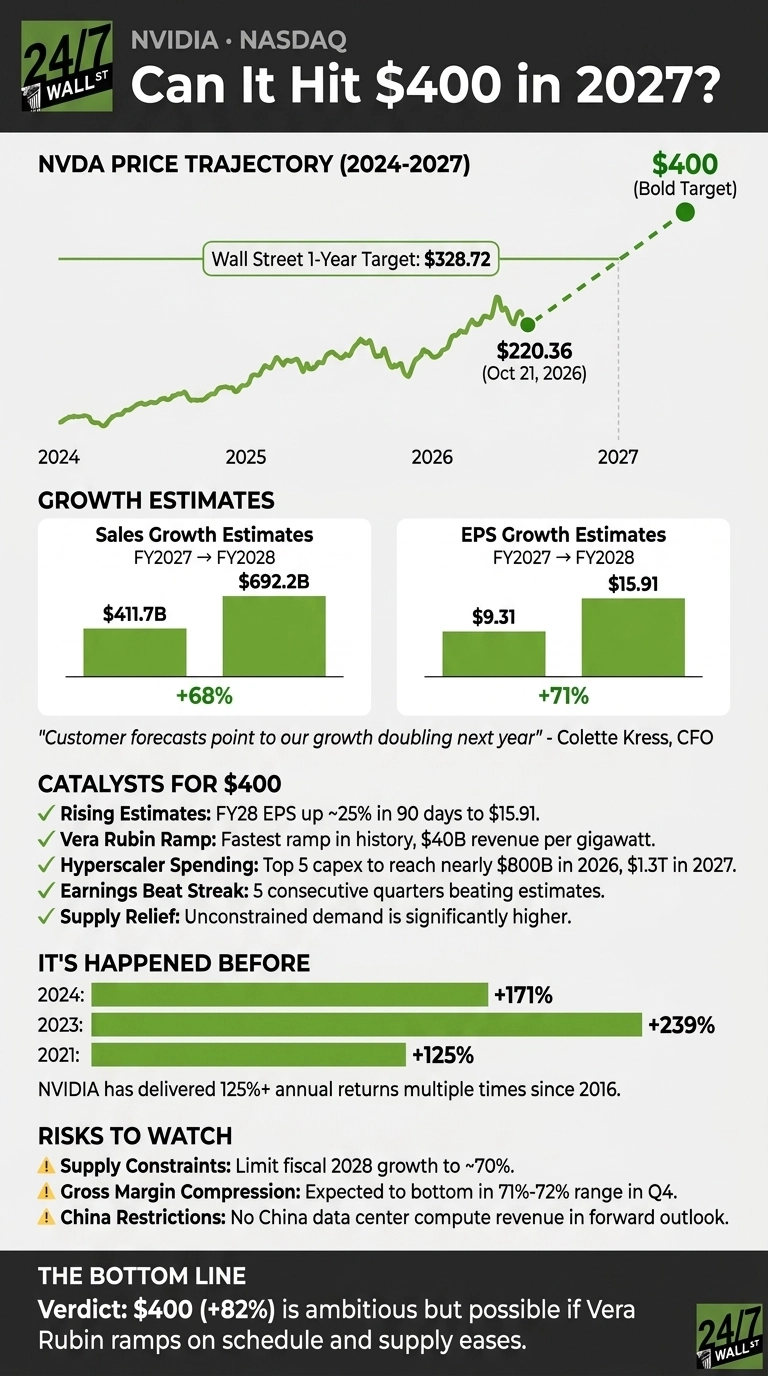
Wall Street Sees 49% Upside as Estimates Keep Climbing
The average analyst target is $328.72, which implies 49% upside. Ratings lean heavily positive, led by 10 Strong Buys, 49 Buys, 2 Holds and 1 Sell.

For fiscal 2028, analysts project revenue of $692.2 billion, up from $411.7 billion this year, or 68% growth. They expect EPS to rise about 71% to $15.9146. Management guides to similar growth.
CFO Colette Kress said “customer forecasts point to our growth doubling next year,” but NVIDIA expects roughly 70% because supply is tight.

Path to $400 Requires Only a Market-Level Multiple
NVIDIA currently trades at about 14x fiscal 2028 earnings. At $400, that rises to about 25x. That is a small premium to the S&P 500’s forward multiple of roughly 21-23x, and it would buy earnings growing at 71%.

What Could Push NVIDIA to $400?
- Rising estimates: 90 days ago, analysts expected fiscal 2028 EPS of $12.7636. Today the figure is $15.9146, about 25% higher, following 7 raised estimates and zero cuts in the past 30 days.
- Beat run: NVIDIA has beaten estimates for 5 consecutive quarters. In Q2 it earned $2.22 against an expected $2.09.
- Vera Rubin ramp: Management expects the fastest product ramp in company history. Rubin brings in $40 billion per gigawatt, compared with $25 billion for Blackwell.
- Hyperscaler spending: Capex at the top five hyperscalers is expected to reach nearly $800 billion in 2026 and $1.3 trillion in 2027.
- Supply relief and China: Huang said “the unconstrained number would be a lot higher.” The outlook includes no compute revenue from Chinese data centers, so any return there adds upside.
NVIDIA Has Topped This Gain Four Times Since 2016
Reaching $400 requires a gain of about 82%. NVIDIA has gone well beyond that before: shares rose 171% in 2024, 239% in 2023, 125% in 2021 and 224% in 2016.
With a market value of $5.33 trillion, repeating those returns is harder, but the stock has a track record of doing it.

$400 Is a Stretch, but the Math Holds Up
Hurdles remain: gross margin is expected to bottom at 71% to 72% in Q4, and days sales outstanding rose to 60 days. Reddit sentiment has also changed from bullish to neutral as concerns about AI financing grow.
Still, analysts already project 49% upside, and estimates are rising. NVIDIA trades at a forward multiple below the market’s. If Rubin ramps on schedule and supply eases, a 25x multiple on fiscal 2028 earnings would take the stock to $400.
That hyperscaler capex also has to be powered, cooled, and connected by someone, and we rounded up seven suppliers riding the same wave in a free report. Returns like this are rare, and this is how NVIDIA could deliver an outsized gain by 2027.
Got $1,000? Before You Buy NVDA, Read This
If you have cash sitting in your account right now, give this two minutes. After more than two decades of helping investors beat the market, our top analysts at 24/7 Wall St. put together a definitive report on the Top 10 Stocks To Buy Today. And NVDA wasn’t one of them.
They combed the entire market. It's not 10 ideas, not 10 stocks everyone is talking about, it's what their research points to as the 10 best stocks to buy right now, and it's free. Read more here and see which stocks made the list –>>
The post Prediction: This Could Trigger NVDA’s Next Breakout by 2027 appeared first on 24/7 Wall St..
]]>
Inflation has been America’s unwelcome houseguest for five years, and despite repeated promises that relief is coming, it shows little interest in leaving. Prices are already roughly 30% higher than before the pandemic, borrowing costs remain elevated, and families increasingly find that even a decent raise doesn’t stretch as far as it once did.
Now a new warning suggests the problem could run deeper than another disappointing inflation report. Researchers at the University of Michigan see troubling similarities between today’s economy and the inflationary cycles that began in the 1960s — when temporary price pressures gradually became a permanent feature of American economic life.
The Inflation Warning Hidden in Consumer Expectations
The University of Michigan’s Oct. 23 report, Risks of Entrenchment: Long-Run Inflation Expectations in Recent and Longer Historical Context, raises a concern that goes beyond today’s prices.
After five consecutive years of inflation exceeding the Federal Reserve’s 2% target, Americans increasingly expect higher prices to persist.
The university’s October Surveys of Consumers found:
| Inflation Measure | Latest Reading |
| Expected inflation, next 12 months | 4.7% |
| Expected inflation, next 5–10 years | 3.5% |
| September annual CPI inflation | 3.7% |
| Federal Reserve inflation target | 2.0% |
Sources: University of Michigan Surveys of Consumers, October 23, 2026; Bureau of Labor Statistics, September CPI.
The longer-term reading climbed from 3.4% in September and remains above its 2024 range of 2.8% to 3.2%.
The concern isn’t simply that consumers expect inflation to remain above the Fed’s target. It’s that those expectations may begin influencing their behavior.
When families believe something will cost more next year, they may buy it today. Businesses facing rising costs may raise prices sooner, while workers seek larger pay increases to protect their purchasing power. That creates the possibility of a self-reinforcing cycle — one that makes inflation harder to extinguish.
And with everyday living costs already 30% higher than in 2019, households have reason to worry.
Why the 1960s Comparison Is Troubling
The Michigan researchers identified a pattern in the inflationary episodes spanning the late 1960s through the 1980s.
Inflation expectations surged during successive shocks, then retreated. But each recovery left expectations higher than before. The next inflation episode consequently began from a higher starting point and reached a higher peak.
Over time, rising prices became something Americans expected rather than an occasional economic disruption.
Today’s situation isn’t identical. The researchers compare the post-pandemic inflation episode more closely with the beginning of that historical pattern, not the worst years of the 1970s.
However, two subsequent inflationary policy shocks have complicated the recovery, and consumers may be interpreting price increases as continuing rather than temporary.
There’s also evidence that additional pressure could be coming. September’s Producer Price Index rose 6.3% annually, according to the Bureau of Labor Statistics, while diesel producer prices surged 115.2%.
Businesses may eventually pass some of those costs to customers, keeping inflation elevated even as earlier price shocks fade.
What Persistent Inflation Means for Investors
The Federal Reserve faces an uncomfortable choice. Keeping interest rates elevated can restrain demand, but it also increases financing costs for businesses, homebuyers, and consumers. Lowering rates prematurely risks reinforcing the very inflation expectations policymakers hope to contain.
For investors, that favors companies with strong cash flow, manageable debt, and the ability to pass higher costs along without losing customers.
It also makes valuation more important. Growth stocks whose profits lie years in the future become more vulnerable when interest rates remain elevated. Meanwhile, nearly $8 trillion sitting in money-market funds demonstrates that investors have alternatives to expensive equities.
Key Takeaway
In short, the University of Michigan isn’t predicting another 1970s inflation crisis. It’s warning that Americans could become accustomed to inflation that remains above the Fed’s target.
Investors shouldn’t abandon stocks over that possibility. Instead, favor financially resilient businesses, avoid excessive debt exposure, and don’t build a portfolio around the assumption that interest rates will soon return to pandemic-era lows.
The greatest risk may not be another sudden inflation spike — but discovering that higher prices have become the economy’s new normal.
Got $1,000? Read This Before You Buy Another Stock
If you have cash sitting in your account right now, give this two minutes. After more than two decades of helping investors beat the market, our top analysts at 24/7 Wall St. put together a definitive report on the Top 10 Stocks To Buy Today.
They combed the entire market. It's not 10 ideas, not 10 stocks everyone is talking about, it's what their research points to as the 10 best stocks to buy right now, and it's free. Read more here and see which stocks made the list –>>
The post New Inflation Warning Echoes the 1960s — Years of Higher Prices Could Become the New Reality appeared first on 24/7 Wall St..
]]>One of the most common retirement questions is whether you should sell your house and rent for the remainder of your life. Like many retirement questions, it comes down to money. If you sell, you free up the equity, stop paying property taxes, never buy another roof, and put the proceeds to work. Below we walk through the numbers that make it work, then the costs that never show up on a spreadsheet.
What a Rented Retirement Costs a Couple Today
Zillow Group (NASDAQ:Z) puts the typical U.S. asking rent at $1,962 a month, up 2.3% annually. That’s $23,544 a year. Here is a sample budget for two retirees in their late 60s paying that rent. Uncited lines are example assumptions, not verified data; swap in your own:
- Rent: $23,544
- Medicare Part B for two at $202.90 a month each: about $4,870
- Medigap and Part D premiums plus out-of-pocket care: $6,000
- Groceries at a moderate food-plan level: $10,000
- Utilities and renters insurance: $4,500
- Transportation, including saving for the next car: $7,000
- Miscellaneous and reserves (gifts, travel, emergencies, income tax on withdrawals): $12,000
All in, that’s $67,914 a year, but note that the budget excludes property tax, a homeowners policy, and a maintenance fund. When you rent, the landlord covers those costs.
Turning That Budget Into a Portfolio Target
After the 2027 COLA, a couple drawing benefits averages $3,355 a month, or $40,260 a year. That leaves a $27,654 gap for the portfolio to cover, based on our math for those in a similar budget situation. At a 4% withdrawal rate, you would need about $691,000. At 3.5%, it’s closer to $790,000. For a renter, we’d use the tighter rate for the reasons below.
Ultimately, claiming timing matters more here than it does for owners. Each year you delay past full retirement age adds delayed retirement credits, and that larger, inflation-adjusted check is the only income that rises alongside your rent.
The plan can also be stress-tested against Social Security’s long-term outlook. The 2026 Trustees Report projects the combined Social Security trust funds will run out in 2034, with 83% of benefits payable after that unless Congress acts, and while there is hope this won’t come to pass, it’s something to keep in the back of any retiree’s mind.
Rent Keeps Climbing, and the Tax Code Treats the Swap Unevenly
A paid-off house’s costs drift up a little each year, while rent resets at every renewal. Keep rent growing at 2.3% a year and today’s payment comes to about $37,100 a year two decades out, roughly $13,600 more than now. That growth is why we’d plan for 3.5%.
Taxes also affect the comparison because an owner living in a paid-off house effectively pays themselves rent, and that benefit isn’t taxed. A renter pays rent from IRA withdrawals and dividends on the invested sale proceeds, and both are taxable.
Selling the house also has tax consequences, as the gain exclusion is capped at $250,000 for single filers (double that for joint filers), and any gain above the cap counts toward the income Medicare looks at. IRMAA is based on income from two years earlier.
If the sale pushes joint income over $218,000, each spouse pays an extra $81.20 a month for Part B and $14.50 for Part D. Together, that adds up to about $2,297 for the year. Social Security’s life-changing-event appeal covers things like stopping work or losing a spouse. A home sale is not on that list, so plan for the surcharge when you choose the sale year.
What Money Cannot Buy Back
Many of the costs retirees cite center on keeping a stable place to live, making changes to their home, and staying close to people they care about. In addition, a landlord may sell the building late in a renter’s life.
Additionally, a lease may not allow you to install grab bars or a walk-in shower, so most rentals must be lived in as is. Beyond the physical home, moving at 85 also costs you neighbors and routines along with the moving bill. Households 70 and older still own 27.3% of all owner-occupied real estate, and for many, the house is the implicit plan for paying for long-term care. Once you sell, that backstop becomes portfolio dollars you can easily spend on other things.
Making the Rented Retirement Work
For this budget, the plan holds together with about $790,000 invested, plus average Social Security, drawn at 3.5%. The portfolio needs to earn enough to outpace rent growth after withdrawals, and some retirees use index funds for growth and a Treasury ladder to cover the next few years of rent.
Choose the year you sell with IRMAA in mind, and put Social Security delay at the top of your list. On taxes, when you sell, a housing benefit you never paid tax on becomes a monthly bill you pay with taxable dollars. One approach is to set aside part of the sale proceeds as a reserve for housing and long-term care, so that money remains available for housing and long-term care costs.
Released: The Definitive Guide to Retirement Income
(Sponsor) Most people spend their entire working lives focusing on one thing: growing a pile of money. Then they retire and discover the skill they actually need is close to the opposite. Turning that pile into steady income, year after year, through good markets and bad, without ever running out.
It may be the least discussed and most consequential transition in personal finance, and plenty of otherwise careful investors walk into it with no real plan. That is exactly what The Definitive Guide to Retirement Income helps answer. It is a free guide from Fisher Investments covering what your retirement will really cost, where the cash flow should come from, and how much you can safely withdraw each year. Learn more here. Learn More Here ›
The post Renting for Good Was Supposed to Be About the Money. Retirees Who Did It Found That Was the Smallest Part appeared first on 24/7 Wall St..
]]>Between McDonald’s (NYSE:MCD) and Starbucks (NASDAQ:SBUX), which restaurant dividend holds up better for an investor focused on income right now? The two stocks have gone in opposite directions this year. McDonald’s shares are down 16.68% year-to-date. Starbucks is up 23.26% as its turnaround gains traction. An income investor should care less about the stock charts and more about the cash flow statements, which tell a clearer story.
Valuation: McDonald’s Delivers More Cash Per Dollar
McDonald’s trades at a P/E of 21 and 24 times free cash flow. Starbucks trades at a P/E of 62 and 47 times free cash flow. Even on forward earnings, Starbucks still trades at a 31x multiple, so the market has already priced in much of the recovery. Free cash flow yield is 4.09% at McDonald’s against 2.13% at Starbucks.
Winner: McDonald’s.
Dividend Safety: McDonald’s Covers Its Payout With Room to Spare
In 2025, McDonald’s produced $7.186 billion in free cash flow and paid out $5.115 billion in dividends. Roughly 71% of free cash flow went to dividends, and the ratio stayed near 71% in the first half of 2026. The company still found room to buy back $2.056 billion of stock last year. A 46.1% operating margin and a franchise model that generates about 90% of restaurant margin dollars from royalties make that cash stream particularly predictable.

Starbucks had a rockier fiscal 2025. Free cash flow came to $2.442 billion, while dividends reached $2.771 billion, roughly 113% of free cash flow. Coverage has since improved to about 78% over the first three quarters of fiscal 2026. The company also used China joint venture proceeds to repay about $1.8 billion of debt, which brought leverage down to 2.9x. CFO Cathy Smith said the stronger balance sheet lets Starbucks “maintain our competitive dividend.” Still, a 9.6% operating margin leaves far less buffer if the recovery stalls.
Recent raises point the same way. McDonald’s lifted its quarterly payout to $1.93 from $1.86, a 3.8% increase, and its record shows a higher quarterly amount every year since 2009. Starbucks rose from $ 0.62 to $ 0.63, a 1.6% increase. McDonald’s also yields more, at 2.91% compared with 2.41%.
Winner: McDonald’s.

Growth Trajectory: Starbucks Owns the Momentum
Starbucks posted global comparable sales growth of 7.9% in fiscal Q3, with transactions up 4.2%. EPS came in at $0.85, well ahead of the $0.65 estimate, and management raised full-year EPS guidance to $2.55-$2.65.

McDonald’s is losing speed. Global comps grew only 1.3% in Q2, U.S. comps rose 0.8%, and July U.S. comps were “slightly negative.” Management also pushed its 50,000-restaurant goal back to 2028. CEO Chris Kempczinski put the blame on execution: “We don’t have a strategy problem. We didn’t execute at the level we needed to in the second quarter.”
Winner: Starbucks.

Verdict: McDonald’s Offers the Sturdier Retirement Dividend
For an income-focused investor, McDonald’s wins. It pays a higher yield, comfortably covers that payout, trades at a lower multiple, and keeps a steady record of annual raises. Its weak spot right now is sales growth, but slow growth doesn’t put the dividend at risk. As Jim Cramer put it on Mad Money, “McDonald’s has come through difficult stretches before. It’s in their DNA.”
Starbucks suits a different reader: a younger investor focused on total return who is comfortable paying a premium for a turnaround and can live with dividend coverage that only recently got back under 100%. The momentum is real. The dividend has less margin for error.
Next, keep an eye on McDonald’s upcoming earnings report to see whether U.S. comps recover after the July decline, and on Starbucks’ fiscal Q4 to see whether U.S. comps hit the guided 6.5% or better.
Got $1,000? Before You Buy MCD, Read This
If you have cash sitting in your account right now, give this two minutes. After more than two decades of helping investors beat the market, our top analysts at 24/7 Wall St. put together a definitive report on the Top 10 Stocks To Buy Today. And MCD wasn’t one of them.
They combed the entire market. It's not 10 ideas, not 10 stocks everyone is talking about, it's what their research points to as the 10 best stocks to buy right now, and it's free. Read more here and see which stocks made the list –>>
The post Starbucks Is Beating McDonald’s in 2026. But Which Dividend Is Safer? appeared first on 24/7 Wall St..
]]>
Wall Street has spent much of 2026 betting that artificial intelligence will keep driving stocks higher. Hedge funds have joined the stampede, pouring money into technology companies expected to profit from the AI boom. Yet the trade that helped lift portfolios is turning against some of Wall Street’s biggest investors.
With technology valuations stretched, borrowing costs elevated, and companies spending billions on AI infrastructure, the margin for disappointment has narrowed. The latest selloff exposed something investors might have overlooked: Even sophisticated hedge funds running different investment strategies can wind up making essentially the same bet — and losing money together.
Hedge Funds Just Experienced a Historic Selloff
According to an Oct. 23 Reuters report citing Goldman Sachs’ prime brokerage data, all three major hedge fund strategies the bank tracks lost more than 1% on Oct. 22.
It was the first time since the COVID-19 pandemic that fundamental equity long-short, systematic, and multi-strategy hedge funds suffered simultaneous losses exceeding that threshold. The damage also extended beyond one miserable trading session.
Hedge Fund Performance Through October 22, 2026
| Hedge Fund Strategy | October Return |
| Global fundamental long-short | -3.8% |
| Technology-focused | Approximately -10% |
| Asia-focused | Approximately -9% |
Source: Goldman Sachs prime brokerage estimates reported by Reuters, October 23, 2026.
Surprisingly, global fundamental long-short funds remained up 8.8% year to date despite October’s losses. This isn’t another COVID crash, but it reveals how quickly profitable strategies can unravel.
The warning signs were already appearing in Wall Street’s crowded technology trade, where record margin borrowing increased the potential damage from falling stock prices.
Why Wall Street’s Smart Money Got Caught Flat-Footed
Hedge funds are supposed to manage risks that ordinary investors might overlook. Some buy promising stocks while betting against weaker companies. Others follow market trends or spread investments across multiple strategies.
The problem arises when supposedly diversified portfolios share the same underlying exposures.
On Oct. 22, Meta Platforms (NASDAQ:META) fell 7% after announcing plans to issue a new class of shares to raise capital. Nvidia (NASDAQ:NVDA) dropped 4%, while the Nasdaq Composite declined 2.6%, its worst session since June 5.
Those moves were enough to expose crowded AI investments. As positions lost value, some hedge funds reduced leverage — borrowed money used to amplify returns — and sold holdings to limit further losses.
That selling can pressure prices further, potentially forcing other leveraged investors to unload positions. Ironically, even funds betting against stocks encountered trouble when heavily shorted companies moved against them.
The pressure also follows billionaire Ken Griffin’s warning that AI investment may be creating bubbles, despite Citadel maintaining substantial exposure to leading technology companies.
The Bigger Risk Isn’t AI — It’s Concentration
The selloff doesn’t mean artificial intelligence has stopped creating economic value. Nvidia continues supplying chips powering the expansion, while Meta and other technology giants are investing in computing infrastructure.
However, believing in AI’s future doesn’t guarantee every AI investment will deliver attractive returns. Investors already have evidence of how vulnerable portfolios become when too much capital follows one investment theme.
Ray Dalio’s comparison of today’s AI boom with the bubbles of 1929 and 2000 highlights the danger of elevated valuations when investors’ expectations outrun business fundamentals.
Hedge funds are discovering that lesson firsthand.
Key Takeaway
In short, October’s hedge fund losses offer a warning, not a prediction of another market crash. Investors should examine how much of their portfolio depends on the same handful of technology companies, including exposure through index funds and individual holdings.
Maintaining positions across industries, limiting leverage, and favoring companies generating dependable cash flow can reduce the damage when crowded trades unwind. The smartest investment strategy isn’t necessarily following smart money. Sometimes it’s avoiding the risks that smart money overlooked.
Got $1,000? Before You Buy NVDA, Read This
If you have cash sitting in your account right now, give this two minutes. After more than two decades of helping investors beat the market, our top analysts at 24/7 Wall St. put together a definitive report on the Top 10 Stocks To Buy Today. And NVDA wasn’t one of them.
They combed the entire market. It's not 10 ideas, not 10 stocks everyone is talking about, it's what their research points to as the 10 best stocks to buy right now, and it's free. Read more here and see which stocks made the list –>>
The post Wall Street’s Smart Money Just Suffered a Shock Not Seen Since the COVID Crash appeared first on 24/7 Wall St..
]]>A Reddit user spent years sitting on 745,575 Chase Ultimate Rewards points. That’s the rewards currency on credit cards from JPMorgan Chase (NYSE:JPM). He was waiting for the perfect trip. Then his second child was born, and he cashed out the whole balance.
He titled his r/CreditCards post “Cashed out 745,575 Chase UR points… and I feel oddly free.” I think he made the right call for his situation. What decided it was how his family actually travels.
Years of Analysis Paralysis
He said he’d held the points “forever with nonstop analysis paralysis.” He also admitted that “the whole ‘wait for the perfect redemption’ mindset had me in denial that I’d ever actually use them.”
Points don’t earn interest, and they don’t compound. Until you redeem them, all they do is sit there. A balance you keep planning to use but never do adds nothing to your finances.
Two Kids, Economy Seats and a 1.5-Cent Reality
Several things changed when his second child arrived. His first was 2 years old, which meant the family was losing its lap baby option. A lap baby is a young child who flies on a parent’s lap rather than in a paid seat. From then on, every trip would mean buying more seats.
The family also flies mostly economy. That affects cents per point, the number points enthusiasts use to judge what a point is worth when you redeem it. The eye-catching values usually come from premium cabins. Economy tickets give much smaller returns. In his words, “I was never consistently getting more than about 1.5 cpp, no matter how hard I tried.”
He also gave his view on timing: “I’m basically done with travel for a while, and inflation is only going to eat away at these points. Hoarding them started to feel worse than cashing them out.” That’s his opinion. Still, the logic holds up. The longer a reward goes unused, the more chance its value slips.
Turning Rewards Into a Roth IRA
He also knew where the money was going: “I’ll be using the cashback to max out my 2025 Roth IRA, so I really can’t complain.” He said it “feels borderline criminal not to mention it here.”
The IRS caps the general 2025 IRA contribution at $7,000. People age 50 or older can put in $8,000. You also can’t contribute more than your taxable compensation.
Single filers with modified adjusted gross income under $150,000 can make the full contribution, and those at $165,000 or more can’t contribute at all.
A Roth gives you no tax deduction now, as 26 U.S.C. § 408A(c)(1) spells out. In exchange, qualified withdrawals in retirement come out tax-free, and that includes the growth. Here’s a hypothetical example: $7,000 earning 7% a year for 30 years grows to about $53,000, and none of it is taxed when you take it out.
Clark Howard Has Argued Both Sides
Consumer advocate Clark Howard has long leaned toward simple cards. On his March 21, 2018 podcast, he said, “For ordinary earthlings, most people, what works best is either an independent travel rewards card or my favorite, a cash back card.” In a March 2017 episode, he warned that for people who carry a balance, “the whole value of the points is destroyed by the interest you’re paying.” The average credit card APR is now about 21%, so that warning matters more than ever.
On March 20, 2026, though, he told listeners that “those points that you’ve been hoarding should be used to book travel.” He pointed out that most programs let you book with points and redeposit them later for full credit. If you have trips coming up, that advice makes sense. If you’ve stopped traveling for now, as this dad has, it doesn’t fit.
Questions to Ask Before You Cash Out a Big Balance
- Will you really travel? Be realistic about the next year or two. If no trips are planned and your family’s needs keep changing, holding out for a dream redemption may just mean the points sit unused longer.
- Are you paying interest? If you carry a balance, the interest probably costs more than your rewards earn. Pay off the debt before you worry about redemption value.
- Which matters more to you, flexibility or maximum value? Getting the most out of travel redemptions takes time, research and flexible dates. Cash is simpler and works for anything.
- What would the cash do? Money with a clear job, like a Roth IRA or an emergency fund, is a good reason to redeem. Without a plan, the cash can get spent on nothing in particular.
Peace of Mind Was the Real Payoff
His advice to others: “If you’re sitting on a pile of points and deep down know you’re probably never going to redeem them the way you planned, consider this your sign to just cash them out.” He was also relieved: “The constant pressure of maximizing UR is gone.”
Worth watching: whether he keeps chasing points or switches to cash back.
Released: 401k & IRA Tips and Answers
(sponsor) 401(k)s are powerful retirement tools. But even savvy savers can make mistakes that quietly cost you money for decades. Choosing the wrong fund, ignoring small fees nobody adds up, rollover steps done in the wrong order, the list goes on.
These sort of mistakes is exactly what 401k & IRA Tips and Answers was created to help prevent. It is a free guide from Fisher Investments on rollovers, contributions, required withdrawals and the mistakes that do the most damage to a retirement account. Learn More Here ›
The post He Sat On 745,575 Chase Points For Years, Waiting For The Perfect Trip. When His Second Kid Was Born He Decided To Do Something Totally Different appeared first on 24/7 Wall St..
]]>EV sales in the US fell 30% through the first three quarters of this year. Meanwhile, several manufacturers walked away from EV production altogether, at least in the US market. One reason is that nothing on the horizon will slow the slide. As gas prices have risen, people have aggressively turned to hybrids as “good enough” to offset those prices. Hybrids like the Toyota (NYSE: TM) Prius get about 57 MPG. Range isn’t a problem, as it is with EVs. Most hybrids can travel up to 500 miles without stopping for fuel. Some can go 700. That makes range similar to or better than gas-powered cars.
As companies exit the EV market, another question is how much it will cost them to return. It will include retooling factories, changing marketing plans, supplying dealers with parts and mechanic training, and creating new models. An industry that lost tens of billions of dollars on its first EV gamble faces doing that again.
The US is a different market than China and the EU, which are the only other two that matter in volume. Europe has continued incentives across many countries. It has focused on building out charging station networks. Among the most important incentives in China is staggering air pollution. And many of the largest Chinese EV companies were built on government money. US companies spent their own money and shouldered their own losses.
Charging stations remain a drawback. Public charging stations may be plentiful around large cities. Outside those areas, they are not. As EV range continues to be a problem, the challenge of getting buyers continues to be crippled.
And, if history is any measure, gas prices will drop again. Oil is plentiful worldwide. Because of the Middle East, however, it simply isn’t available. And the US is the world’s largest producer and exporter of crude. That does not entirely solve its problem. Much of the crude it imports goes to US-based refineries. Oil flows will resume. Less than a year ago, it traded for $55.
If gas drops below $3, US demand for EVs won’t return. If federal financial or tax incentives don’t return, solving the EV demand problem will be even harder.
EVs may have gone the route of the horse and buggy.
Got $1,000? Before You Buy TM, Read This
If you have cash sitting in your account right now, give this two minutes. After more than two decades of helping investors beat the market, our top analysts at 24/7 Wall St. put together a definitive report on the Top 10 Stocks To Buy Today. And TM wasn’t one of them.
They combed the entire market. It's not 10 ideas, not 10 stocks everyone is talking about, it's what their research points to as the 10 best stocks to buy right now, and it's free. Read more here and see which stocks made the list –>>
The post US Demand For EVs May Be Gone Forever appeared first on 24/7 Wall St..
]]>A new India engineering partnership is pushing the AI infrastructure strategy at Nokia (NYSE:NOK) deeper into its technology base, and the network equipment maker is drawing buyers as a result. In morning trading, Nokia stock is up 3% to $8.35, a rebound that signals renewed appetite for the company’s AI-era network story. Stretching its engineering bench into India gives Nokia added resources for its fastest-growing business, which serves cloud and AI customers.
Meanwhile, Ericsson (NASDAQ:ERIC) stock is up 1% to $10.77, a smaller advance that leaves Nokia stock leading the two large carrier equipment names. Both companies compete for the same operator contracts, so the gap between their moves stands out, as that gap tracks a company-specific catalyst at Nokia that Ericsson doesn’t share.
Measured against the major index funds, the jump in Nokia stock looks even stronger. The iShares U.S. Technology ETF (NYSEARCA:IYW) is up 0.4% to $250.90, a modest gain for the sector fund. Also, the SPDR S&P 500 ETF Trust (NYSEARCA:SPY) is up 0.5% to $763.46, leaving both funds well short of the move in Nokia stock.
India Engineering Deal Sparks Nokia Rally
Nokia signed a five-year contract, announced before U.S. markets opened, to support its engineering and research and development (R&D) work in India. L&T Technology Services is the partner, and it will set up a dedicated offshore development center along with an engineering team serving Nokia’s global technology operations. Work under the agreement spans next-generation wireless networks, intelligent automation, AI-driven operations and AI infrastructure, which lines up closely with the areas Nokia has tied to its growth plans.
This deal follows Nokia’s Q3 2026 results last week. Management highlighted AI and cloud customers as its fastest-growing business and pointed to quicker expansion in optical and data networking next year. Those same results showed supply constraints, higher restructuring costs and a lower cash conversion assumption, and Nokia stock fell sharply on the day they were released, yet against that background, the India contract signals that Nokia is still building engineering capacity to meet AI demand while it works through near-term friction.
Nokia’s AI Data Center Edge Sets It Apart From Ericsson
Nokia and Ericsson are the two large U.S.-listed suppliers of radio access and carrier transport equipment. Both sell to telecom operators whose overall spending Nokia expects to stay broadly flat.
Beyond carrier gear, Nokia sells optical and data networking equipment to cloud and AI data center customers, which management describes as the fastest-growing part of its business. Hyperscale build-outs give Nokia a growth path tied directly to AI infrastructure spending (we covered seven suppliers riding that same wave, from power to networking, in a free report here). Adding India-based engineers focused on AI infrastructure feeds that same engine.
Ericsson stock is trailing the advance in Nokia shares, leaving the carrier equipment gains led by the name with the clearer AI data center story. On the positive side, Ericsson stands as one of only two large U.S.-listed carrier equipment suppliers, which gives it scale with telecom operators. However, broadly flat operator spending remains a core risk for both companies.
What the India Deal Means for Nokia’s AI Push
This India agreement extends Nokia’s AI infrastructure push from its sales pipeline into its R&D base. A dedicated offshore team could help Nokia bring products to cloud and AI customers faster, which matters most if demand from those buyers keeps climbing. Extra engineering muscle won’t solve hardware shortages by itself, though.
Until supply eases, Nokia stock may stay sensitive to any update on restructuring or cash conversion. Investors weighing their NOK stock exposure should adjust their holdings carefully given those unresolved supply constraints.
Got $1,000? Before You Buy NOK, Read This
If you have cash sitting in your account right now, give this two minutes. After more than two decades of helping investors beat the market, our top analysts at 24/7 Wall St. put together a definitive report on the Top 10 Stocks To Buy Today. And NOK wasn’t one of them.
They combed the entire market. It's not 10 ideas, not 10 stocks everyone is talking about, it's what their research points to as the 10 best stocks to buy right now, and it's free. Read more here and see which stocks made the list –>>
The post Nokia Climbs 3% on Five-Year India R&D Deal; Ericsson Edges Higher appeared first on 24/7 Wall St..
]]>The 24/7 Wall St. price target for AMD (NASDAQ:AMD) is $546.06 over the next 12 months. That means 1.23% upside from the most recent close of $539.43.
| Metric | Value |
|---|---|
| Current Price | $539.43 |
| 24/7 Wall St. Price Target | $546.06 |
| Upside/Downside | 1.23% |
| Recommendation | HOLD |
| Confidence Level | 90% |
AMD gets a hold rating from our model with high confidence. After a huge 2026 run, the stock sits near fair value.
The gap with NVIDIA (NASDAQ:NVDA) in data center scale and margins is still wide, and how much of it AMD closes through the Helios and MI450 ramp will decide where the shares go next.

A 156% Rally Hits an October Air Pocket
AMD shares fell 9.31% over the past week and 1.91% over the past month. They are still up 156.42% year to date, compared with 18.43% for NVIDIA. The stock trades about 18% below its 52-week high of $658.52 and about 187% off its low.
In the second quarter, revenue came in at $11.54 billion, up 50.11% and ahead of the $11.31 billion estimate. Non-GAAP EPS of $1.66 beat the $1.6107 consensus. Data Center revenue grew 107% to $6.72 billion, and management guided third-quarter revenue to about $13 billion.
Why Bulls See $689 Within Reach
Management says Helios delivers “up to 15% more throughput at the same rack power and up to 30% more tokens per dollar than the competition.” Anchor commitments include OpenAI at 6 GW, Meta Platforms (NASDAQ:META) at up to 6 GW and Anthropic at up to 2 GW.
AMD expects Data Center revenue to more than double in 2027, and Lisa Su expects to “significantly exceed” the company’s $20 annual EPS target.
Wall Street agrees: 45 analysts rate the stock Buy or Strong Buy, and none rate it Sell. If the optimistic scenario plays out, our model points to $689.35.

What Could Drag AMD Toward $433
AMD trades at a trailing P/E of 201x. NVIDIA’s Data Center revenue of $89.02 billion is about 13x AMD’s. CFO Jean Hu said that data center AI gross margin is “slightly below corporate average” during the ramp, and Helios yields are still improving.
Gaming revenue fell 31%. Free cash flow slid 9.89%, though that reflects capex rising 186.52% to fund capacity for the ramp. The bear case is $433.06.

AMD vs. NVIDIA and Broadcom on Scale and Growth
NVIDIA is the GPU target AMD is chasing. Its trailing P/E of 44x is about in line with AMD’s forward multiple of 43x, and it gets a 75% non-GAAP gross margin against AMD’s 56%.
Broadcom (NASDAQ:AVGO) vies for the same hyperscaler budgets with custom silicon. Its AI semiconductor revenue reached $16.70 billion, up 221%. Both rivals are growing faster today, which makes our target look reasonable.
| Company | Market Cap | Latest-Quarter Revenue Growth |
|---|---|---|
| AMD | $895.27B | 50.11% |
| NVIDIA | $5.33T | 105.85% |
| Broadcom | $1.61T | 85.5% |
AMD Price Prediction 2026-2030
I rate AMD a hold with a 24/7 Wall St. price target of $546.06 and 90% confidence. Valuation tips the scale: the 2027 ramp already looks largely priced in.
I would turn more constructive if fourth-quarter Helios shipments step up on schedule and gross margins hold at 56% or better. I would remain conservative if yields lag or customer build-outs slid into late 2027.
The 24/7 Wall St. price target model projects where AMD could trade, assuming current trends hold.
| Year | 24/7 Wall St. Price Target |
|---|---|
| 2026 | $557.08 |
| 2027 | $546.06 |
| 2028 | $559.92 |
| 2029 | $601.18 |
| 2030 | $598.86 |
AMD needs to keep executing on its roadmap for these projections to hold. The biggest swing factors are the MI500 launch, which could add upside, and tighter export controls, which could take it away.
Got $1,000? Before You Buy AMD, Read This
If you have cash sitting in your account right now, give this two minutes. After more than two decades of helping investors beat the market, our top analysts at 24/7 Wall St. put together a definitive report on the Top 10 Stocks To Buy Today. And AMD wasn’t one of them.
They combed the entire market. It's not 10 ideas, not 10 stocks everyone is talking about, it's what their research points to as the 10 best stocks to buy right now, and it's free. Read more here and see which stocks made the list –>>
The post Price Prediction: The Gap With Nvidia Could Shape AMD’s Next Big Move appeared first on 24/7 Wall St..
]]>A Barclays upgrade tied to merger potential is splitting the electric vehicle group, lifting its largest name while two smaller rivals slip. Tesla (NASDAQ:TSLA) stock is up 6%, trading at $394.72, a gain that pushes a possible takeover premium into how the market values the car maker.
Meanwhile, Lucid Group (NASDAQ:LCID) stock is down 4% to $3.38, moving in the opposite direction from the rally in Tesla stock. Rivian Automotive (NASDAQ:RIVN) shares are slipping 2% to $11.64, a softer decline than the drop in Lucid stock that still lands on the losing side of the split.
Broader benchmarks show how concentrated the buying is around a single company. The Global X Autonomous & Electric Vehicles ETF (NASDAQ:DRIV) is up 0.5% to $29.50, a modest advance for a fund that spans the wider industry. Over on the large-cap tech side, the Invesco QQQ Trust (NASDAQ:QQQ) is up 0.7% to $708.97, leaving both funds well short of the jump in Tesla stock.
Barclays Upgrade Prices in a SpaceX Merger Premium
Barclays analyst Dan Levy upgraded Tesla stock to Overweight from Equal Weight and raised his price target to $450. Levy’s note cited a potential takeover premium for Tesla shareholders from a possible merger, along with an expected return to growth in the automotive business driven by Full Self-Driving adoption and higher exports from the Shanghai factory. That combination layers a deal angle on top of the familiar automotive and self-driving case for Tesla shares.

The company on the other side of that potential deal is SpaceX (NASDAQ:SPCX). Last week, Tesla CEO Elon Musk confirmed that the two companies had formed independent committees to explore a combination, while emphasizing that a deal isn’t certain. Musk’s caution matters, since part of the Barclays case leans on an outcome the two companies haven’t agreed to.
Lucid and Rivian Sit Outside the Merger Story
One reason the upgrade lands on a single name is Tesla’s business mix. Its lineup spans electric vehicles, energy storage systems, Full Self-Driving software and a robotaxi service. Rivian and Lucid are smaller car maker whose results rest mainly on vehicle sales. Neither Rivian nor Lucid is part of the merger discussion Barclays mentioned for Tesla.
Multiple issues now face Tesla stock: an operating story built on Full Self-Driving and Shanghai exports, plus a merger premium tied to SpaceX, and Barclays’ operating argument can stand on its own while the merger angle depends on a process that remains preliminary. If the committees fail to reach terms, the takeover premium in the Barclays note could fade from Tesla shares quickly.
What the Barclays Upgrade Means for Tesla

Next up for Tesla is whether the independent committees produce a merger agreement with SpaceX. A signed agreement could firm up the premium, while a stalled process could shift attention back to the automotive business.
Musk’s own caution keeps the outcome open. The rally in Tesla stock already reflects part of the optimism in Barclays’ call, which leaves less room for error if the process slows down. Investors should consider keeping their position sizes modest until the Tesla and SpaceX merger question is clarified.
Got $1,000? Before You Buy TSLA, Read This
If you have cash sitting in your account right now, give this two minutes. After more than two decades of helping investors beat the market, our top analysts at 24/7 Wall St. put together a definitive report on the Top 10 Stocks To Buy Today. And TSLA wasn’t one of them.
They combed the entire market. It's not 10 ideas, not 10 stocks everyone is talking about, it's what their research points to as the 10 best stocks to buy right now, and it's free. Read more here and see which stocks made the list –>>
The post Tesla Rises 6% as Barclays Upgrade Cites SpaceX Merger Potential; Lucid Drops 4%, Rivian Slips appeared first on 24/7 Wall St..
]]>EQT (NYSE:EQT) announced on Oct. 26, 2026, that it will acquire Range Resources (NYSE:RRC) in an all-stock deal. In premarket trading, Range shares rose 9.7% to $49.94, and EQT fell 7.4% to $51.52. That split is typical of stock swaps. The buyer often falls as it prepares to issue new shares, and the target rises toward the offer value.
EQT Turned $1,000 Into $2,608 Over Five Years
- Initial Investment: $1,000 (Oct. 22, 2021, at $19.93)
- Current Value: $2,608.13
- Total Return: 158.45%
- Annualized Return: 21.13%
- S&P 500 (same period): $1,682.30 (68.23%)
EQT grew into the largest U.S. natural gas producer and took on pipelines of its own after its 2024 Equitrans Midstream merger. It then signed a 10-year supply deal for CPV’s 2-GW Shay Energy Center and an LNG offtake contract. The past year was weaker. Shares fell 2.66% as second-quarter revenue fell 29.2% on lower gas prices.


Range Resources Delivered $2,145 and Led the Past Year
- Initial Investment: $1,000 (Oct. 22, 2021, at $23.61)
- Current Value: $2,144.85
- Total Return: 111.51%
- Annualized Return: 16.49%
- S&P 500 (same period): $1,682.30 (68.23%)
Range gained 34.5% over the past year and 42.7% year to date, while EQT lost 3.0% this year. A one-year $1,000 stake became $1,344.80 in Range versus $973.40 in EQT and $1,134.80 in the S&P 500. Record natural gas liquids (NGL) export premiums and a 32% reduction in net debt drove the gains.
Ten-year results look far less impressive. Since Oct. 25, 2016, EQT gained 61.04% and Range 50.82%, against 255.93% for the S&P 500. Most of the gains were highly dependent on entry timing.

How Range Shares Convert Into EQT Stock
TradingView reported an exchange ratio of 0.987 EQT shares for each Range share. When the deal closes, every Range share converts into that fixed amount of EQT stock. Range holders become EQT holders, and their value then moves with EQT’s share price. Citybiz reported that the deal values the combined company at over $50 billion.
A Larger Appalachian Gas Producer Aimed at AI Power Demand
Barron’s framed the deal around natural gas as fuel for AI data centers. Scale can lower per-unit costs, secure pipeline capacity, and give a producer more pricing leverage with utilities and liquefied natural gas (LNG) buyers. (The gas producers are only one slice of the AI power trade, and we rounded up seven of the suppliers behind the data-center expansion in a free report here.) The Energy Information Administration (EIA) projects LNG exports rising from 14.9 billion cubic feet per day (Bcf/d) in 2025 to more than 30 Bcf/d by 2050 in most cases. Risks include gas price swings, regulatory review, integration problems, and shareholder votes. Details on benefits, leadership, and timing are still emerging.
What Retirement Investors Should Track Next
For income-minded investors, the combined stock looks attractive if data center and LNG demand lifts Appalachian gas prices and the bigger company keeps paying down debt. It looks less appealing if gas prices remain soft, since consolidating into a single larger producer reduces diversification. The next things to track are merger proxy filings, regulatory clearance, and EQT’s next earnings report.
Got $1,000? Before You Buy EQT, Read This
If you have cash sitting in your account right now, give this two minutes. After more than two decades of helping investors beat the market, our top analysts at 24/7 Wall St. put together a definitive report on the Top 10 Stocks To Buy Today. And EQT wasn’t one of them.
They combed the entire market. It's not 10 ideas, not 10 stocks everyone is talking about, it's what their research points to as the 10 best stocks to buy right now, and it's free. Read more here and see which stocks made the list –>>
The post Had You Invested $1,000 in EQT or Range Resources 5 Years Ago, Here’s What You’d Have: What to Expect From the Merged Company appeared first on 24/7 Wall St..
]]>A revenue shortfall is eclipsing a quarter of strong subscriber gains at Verizon Communications (NYSE:VZ), and the market is siding with the top line. Verizon stock is at $42.72, down 4% in early trading. That decline puts the revenue line ahead of the customer count after the carrier’s Q3 2026 report, a reaction that mutes results that otherwise delivered the subscriber growth and the higher full-year targets Verizon has been chasing.
Sector-wide weakness is far softer by comparison. The Communication Services Select Sector SPDR ETF (NYSEARCA:XLC) is at $104.60, down 0.9%, though the fund leans heavily toward large internet and media companies, so its move offers sector context and says little about any single carrier. At the same time, the SPDR S&P 500 ETF Trust (NYSEARCA:SPY) is at $761.99, up 0.3%, leaving Verizon stock falling far harder than either fund.
Meanwhile, AT&T (NYSE:T) stock is at $20.95, up 0.1%, holding steady against the slide in Verizon stock. T-Mobile (NASDAQ:TMUS) shares are at $145.91, down 0.4%, a far smaller dip than the drop in Verizon stock. Steady trading in both rival stocks marks the selloff in Verizon shares as company-specific and puts the focus on Verizon’s own quarter.
Revenue Miss Overshadows Verizon’s Subscriber Surge
Verizon reported third-quarter results before the market opened, with adjusted earnings per share beating analyst estimates while revenue fell short of the consensus. Growth in Verizon’s subscriber base was the clear strong, as the company posted its strongest third-quarter postpaid phone additions in five years and its best haul of postpaid accounts in more than a decade.
Management also raised the full-year outlook for both adjusted earnings per share and postpaid phone net additions, which marks Verizon’s third consecutive quarterly guidance increase.
AT&T and T-Mobile Hold Firm as Verizon Slides

Still, Verizon stock is sliding on the revenue shortfall despite the subscriber gains and the higher targets. Customer-first offerings and an expanded loyalty program get the credit from Verizon for those gains, as the carrier steers away from heavy device subsidies to win and keep postpaid customers. Without visible revenue acceleration, that strategy faces a tougher reception from the market than the subscriber figures alone would suggest.
AT&T, T-Mobile and Verizon compete for postpaid customers, yet both rivals are barely moving. AT&T beat estimates and raised its outlook, though bears flag a Mexico impairment. T-Mobile lifted cash flow guidance, though shares sit below summer levels.
What the Revenue Miss Means for Verizon
Verizon must now show its subscriber gains can drive faster revenue growth in the coming quarters. Management’s raised outlook for earnings and phone additions gives the company room to make that case, though the top line now carries the burden of proof. Trends in Verizon’s service revenue may decide how Verizon stock trades from here.
Subscriber momentum and a string of guidance increases give optimists evidence that Verizon’s customer-first strategy is gaining traction. Skeptics focus on the revenue shortfall itself, which suggests subscriber wins alone haven’t yet satisfied Wall Street’s expectations for the top line. Both readings hold merit, and the decline in Verizon stock shows the skeptical view has the upper hand.

The question for shareholders is whether new-account momentum shows up in service revenue when Verizon next reports. Keeping one’s VZ stock exposure smaller is a prudent policy until Verizon’s revenue outlook resolves.
Got $1,000? Before You Buy TMUS, Read This
If you have cash sitting in your account right now, give this two minutes. After more than two decades of helping investors beat the market, our top analysts at 24/7 Wall St. put together a definitive report on the Top 10 Stocks To Buy Today. And TMUS wasn’t one of them.
They combed the entire market. It's not 10 ideas, not 10 stocks everyone is talking about, it's what their research points to as the 10 best stocks to buy right now, and it's free. Read more here and see which stocks made the list –>>
The post Verizon Falls 4% as Revenue Miss Overshadows Raised Outlook; AT&T and T-Mobile Hold Steady appeared first on 24/7 Wall St..
]]>Two hypothetical married couples who each hold $400,000 in a traditional IRA plan to move all of it into a Roth IRA before required minimum distributions (RMDs) begin. For one couple, the retiree turns 62 in 2027, while the other retiree turns 70 that same year. They have the same balance and face the same tax brackets, but their tax bills on the conversion end up far apart. The gap comes down to how many calendar years each has to spread the income across.
Each converted dollar counts as gross income in the year of the conversion under 26 U.S.C. § 408A(d)(3)(A)(i). Roth IRAs have no lifetime withdrawal requirement because the minimum distribution rules that apply to traditional IRAs don’t apply to Roth IRAs while the owner is alive. With fewer years available, each year’s conversion gets bigger and sits on top of whatever other income the household already has.
How SECURE 2.0 Sets Each Retiree’s Deadline
Under current IRS rules, a person who reaches 72 after 2022 and 73 before January 1, 2033 has an RMD age of 73. A person who reaches 74 after December 31, 2032 has an RMD age of 75. The 70-year-old turns 73 in 2030, which leaves 2027 through 2029 as conversion years, while the 62-year-old falls under the age-75 rule.
Counting from 62 through 72 gives the 11 years in the headline. Because this retiree’s legal deadline is later, the conversion window actually runs through age 74, so 11 is the low end of the range (we sized up those quiet years between leaving work and starting RMDs in a free Roth guide).
Running the Same $400,000 Through Current Brackets
The comparison uses the 2026 federal brackets for married couples filing jointly. In 2026, the standard deduction for joint filers is $32,200. The 12% rate applies to taxable income over $24,800, and the 22% rate starts above $100,800. To keep the math simple, we assume the balance has no investment growth and exclude the separate senior deduction added by OBBB.
We assume the 62-year-old couple has $60,000 in other income from a pension or part-time work, bringing taxable income to $27,800 before any conversion. Converting about $36,364 a year increases taxable income to roughly $64,164. That stays entirely within the 12% bracket.
At 70, Social Security has usually started. In 2027, the Social Security Administration estimates the average benefit for an aged couple both receiving benefits at $3,355 a month after a 3.6% cost-of-living adjustment. This couple is assumed to have $80,000 of other taxable income, which leaves $53,000 of room in the 12% bracket. Converting about $133,333 a year uses up that room, and the rest is taxed at 22%.
| Measure | Turning 62 | Turning 70 |
|---|---|---|
| Annual conversion | $36,364 | $133,333 |
| Taxed at 22% each year | $0 | $80,333 |
| Federal tax per year | $4,364 | $24,033 |
| Total tax on $400,000 | $48,000 | $72,100 |
For the older couple, about 60% of each year’s conversion is taxed at 22%. Over the full conversion, they pay roughly $24,100 more in federal tax on the same balance.
Medicare Surcharges Sit Close to the Larger Conversions
Each year of the condensed conversion brings the 70-year-old couple’s income to about $213,333. That is roughly $4,667 below the 2026 joint-filer threshold of $218,000.
Above that line, each spouse’s Part B premium rises from $202.90 to $284.10 a month. A bit more other income, or some investment growth on the IRA, would push this couple over the threshold. The younger couple’s income of about $96,364 leaves a wide margin.
Where Retirement Account Money Sits by Age
The Federal Reserve’s Distributional Financial Accounts show households headed by someone aged 55 to 69 held 49.5% of defined contribution and annuity assets in the second quarter of 2026. Households headed by someone aged 70 and older held 9.4%. These are totals for the whole household sector, so they say nothing about any one household’s balance.
What Could Shift the Math Next
The comparison rests on assumptions that change over time. Social Security benefits rise with each cost-of-living adjustment, increasing the income base for anyone already collecting. Bracket thresholds adjust for inflation each year. Future tax rates, a spouse’s death that moves the survivor to single-filer brackets, and heirs’ tax rates also affect whether a conversion pays off.
A recent MarketWatch piece noted that people worried about missing out on Roth conversions may be giving up less than they think. The next inflation adjustment to brackets and benefits will reset the income base each household converts on top of.
Help Avoid These 13 Retirement Mistakes Before They Derail Your Future
One investment mistake could create big risks for your retirement. Many investors make the same critical errors: being too conservative, making big bets on “sure things,” or paying excessive fees. Any of those blunders can endanger your hard-earned savings.
Now you can learn the mistakes even experienced investors make (and ways you can sidestep them before it’s too late) with this new guide: 13 Retirement Mistakes and How to Avoid Them from Fisher Investments. (sponsor)
The post A Retiree Turning 62 in 2027 Has 11 Conversion Years Before RMDs. One Turning 70 Has Three. The Same $400,000 Comes Out at 12% in the First Case and Mostly at 22% in the Second appeared first on 24/7 Wall St..
]]>Palantir Technologies (NASDAQ:PLTR) reports third-quarter results Monday, November 2, after the bell. Michael Burry is still short the stock, and shares trade at roughly 122 times 2026 earnings. This report will test whether the AI story can keep outpacing its valuation.
An Otherworldly Quarter Raised the Bar
Last quarter was Palantir’s best yet. Revenue rose 93% year over year to $1.935 billion, and U.S. commercial revenue jumped 149% to $764 million. EPS of $0.41 exceeded the $0.346 consensus. CEO Alex Karp called the quarter “otherworldly” after the Rule of 40 score reached 155%.

Management raised full-year revenue guidance to $8.150 billion to $8.158 billion and lifted adjusted free cash flow guidance to $4.5 billion to $4.7 billion.
Burry closed his Scion hedge fund last year. In September he sold his December 2026 Palantir puts but maintained short positions in the stock. Shares have gained 11.22% year to date to $197.70, a small move for a company growing this fast.
Wall Street Expects Nearly 85% Revenue Growth
| Metric | Consensus | YoY Growth |
|---|---|---|
| Q3 2026 EPS | $0.4118 | 96.1% |
| Q3 2026 Revenue | $2.18 billion | 84.5% |
| FY 2026 EPS | $1.6187 | 115.8% |
| FY 2026 Revenue | $8.22 billion | 83.6% |

Consensus sits above management’s $2.160 billion to $2.164 billion revenue guide. Landing at the top of that range would still mean missing expectations.
U.S. Commercial Growth and Margins Decide the Short Case
U.S. commercial revenue remains the swing factor. Management guided that segment above $3.424 billion for the year, which works out to at least 134% growth. Karp said he is driving the business to grow at a rate “equal to or above what we have in U.S. commercial for the next 18 months.” I’ll be watching whether that segment holds a triple-digit pace off a much larger base.
Bookings give the forward read. U.S. commercial TCV reached $2.132 billion in Q2, up 153%, and net dollar retention rose to 157%. Another strong TCV quarter would weaken the argument that demand is peaking.
Margins are the second test. Adjusted operating margin hit 62%, but management highlighted a significant third-quarter expense increase tied to new-hire seasonality and marketing. You should also look at stock-based compensation, which ran $265 million last quarter.
The outlook matters most. Palantir has beaten EPS and revenue estimates for eight straight quarters, so the market expects a raise. Any lift to full-year revenue or free cash flow guidance, plus early framing of 2027, will carry more weight than the headline beat. Options traders sound conservative too. The full-chain put/call ratio is 0.72, but mid-November expirations show ratios of 1.07 and 1.02.
Priced for Perfection Heading Into 2027
At 122 times this year’s consensus EPS, Palantir is priced for perfect execution. That premium is exactly what Burry is aiming for (riding an AI mania is one thing, planning the exit is another, and we covered both in a free bubble survivor’s handbook). Clearing the $2.18 billion consensus, holding triple-digit U.S. commercial growth and raising guidance again would weaken the bear thesis considerably. A result that only lands inside management’s range would give skeptics an opening. Next Monday’s report will decide which narrative carries into 2027.
Got $1,000? Before You Buy PLTR, Read This
If you have cash sitting in your account right now, give this two minutes. After more than two decades of helping investors beat the market, our top analysts at 24/7 Wall St. put together a definitive report on the Top 10 Stocks To Buy Today. And PLTR wasn’t one of them.
They combed the entire market. It's not 10 ideas, not 10 stocks everyone is talking about, it's what their research points to as the 10 best stocks to buy right now, and it's free. Read more here and see which stocks made the list –>>
The post Michael Burry Is Shorting PLTR: Why Palantir’s Earnings Next Monday Are a Make-or-Break Moment appeared first on 24/7 Wall St..
]]>Vertex Pharmaceuticals (NASDAQ:VRTX) reports third-quarter results on Nov. 2. Cystic fibrosis still pays the bills, but I’ll be watching whether CASGEVY and JOURNAVX stay on pace for management’s $500 million non-CF revenue target.

Diversification Picks Up Speed After a Raised Outlook
Second-quarter revenue rose 12.4% to $3.33 billion, exceeding the $3.22 billion consensus. Adjusted EPS of $4.73 missed the $4.75 estimate. CASGEVY revenue rose 151% to $76.4 million, and JOURNAVX revenue more than quadrupled to $49.6 million.

Spending climbed too. Non-GAAP SG&A rose 45% on pain and renal investments, and management expects operating expenses at the high end of its $5.65 billion to $5.75 billion range.
Vertex still raised full-year revenue guidance to $13.10 billion to $13.20 billion. It then closed the Crinetics acquisition on September 1, 2026, adding rare endocrine diseases as a fifth pillar. Shares are up 16.42% year to date and 5.61% over the past week.
Wall Street Models a Crinetics Hit
| Metric | Consensus | Prior Year | YoY Change |
|---|---|---|---|
| Q3 EPS | -$1.1999 | $4.80 | N/M |
| Q3 Revenue | $3.42 billion | $3.08 billion | 11.2% |
| FY 2026 EPS | $16.1914 | $18.40 | -12.0% |
| FY 2026 Revenue | $13.26 billion | $12.00 billion | 10.5% |

Ninety days ago, the Q3 EPS consensus stood at $4.9090. Vertex counts acquired in-process R&D in its non-GAAP expenses, so analysts appear to be modeling a Crinetics charge. Estimates now range from -$29.51 to $5.06, which makes revenue the cleaner read this quarter.
CASGEVY Infusions and JOURNAVX Scripts Will Set the Tone
CASGEVY and JOURNAVX delivered about $200 million combined through June, leaving roughly $300 million to go. On the August call, Charles Wagner said Vertex is “very confident in getting to that $500 million plus.”
For CASGEVY, I’ll be watching how many patients move through to infusion. Vertex logged more than 100 patient starts in Q2, its third straight quarter above that level. The pediatric approval adds about 5,500 eligible patients. Management warned that quarterly revenue will stay variable because it depends on infusion timing.
JOURNAVX reached about 535,000 prescriptions in Q2, ahead of forecast. Patients also used the support program more than expected, and management expects gross-to-net to normalize in the first half of 2027. Q2 got a lift from channel build after a Q1 decline, so you should watch for inventory swings.
Results from the core business still matter. TRIKAFTA/KAFTRIO revenue is falling as ALYFTREK adoption speeds up, and BofA forecasts Trikafta sales of $2.42 billion, 5% below consensus. I also want to see updated guidance that includes Crinetics, plus more detail on gross margin. Management guided it to just under 86% as CASGEVY becomes a bigger part of the mix.
A Renal Launch Is Weeks Away
This report lands weeks before the Nov. 30 FDA action date for povetacicept in IgA kidney disease, and Vertex has finished hiring its renal field force. After last year’s Q3 report, shares fell about 10% on concerns about the pace of diversification. Clear progress toward $500 million in non-CF revenue would show Vertex can launch at scale outside CF. That track record would make the povetacicept rollout far more credible heading into 2027.
Got $1,000? Before You Buy VRTX, Read This
If you have cash sitting in your account right now, give this two minutes. After more than two decades of helping investors beat the market, our top analysts at 24/7 Wall St. put together a definitive report on the Top 10 Stocks To Buy Today. And VRTX wasn’t one of them.
They combed the entire market. It's not 10 ideas, not 10 stocks everyone is talking about, it's what their research points to as the 10 best stocks to buy right now, and it's free. Read more here and see which stocks made the list –>>
The post The $500 Million Non-CF Factor Vertex Investors Can’t Ignore on Nov. 2 appeared first on 24/7 Wall St..
]]>Three high-yield income names share one deadline this week. Plains All American Pipeline (NASDAQ:PAA), a First Merchants (NASDAQ:FRME) preferred issue, and Union Bankshares (NASDAQ:UNB) each lose their dividend eligibility on October 30, 2026, and all three pay in November. To collect the upcoming checks, buyers must own the shares through the close on October 29.
How the timing works: You must own the stock before the ex-dividend date to collect the payment. If you buy on or after the ex-date, the seller gets that payment. The pay date is just when the cash arrives.
| Security | Payment | Ex-Date | Pay Date | Forward Yield |
|---|---|---|---|---|
| Plains All American | $0.4175 | Oct. 30 | Nov. 13 | 6.3% |
| First Merchants Preferred | $0.4688 | Oct. 30 | Nov. 16 | 7.4% (at 50-day average) |
| Union Bankshares | $0.36 | Oct. 30 | Nov. 5 | 6.25% |
Plains All American Pipeline (PAA): A 6.3% Yield That Grew This Year
Plains declared a distribution of $0.4175 per unit on October 1. Units go ex on October 30, and the payment date is November 13, so the last day to buy is October 29. The $1.67 annualized rate on a $26.50 unit price gives a forward yield of 6.3%.
For an MLP, the right test is distributable cash flow. Operating cash flow serves as a practical proxy. In 2025, Plains generated $2.936 billion in operating cash flow and paid $1.295 billion in distributions, or 44.1% of that cash. After $643 million in capex, what remained covered distributions 1.77 times. The quarter ended June 2026 was better, with $955 million of operating cash against $346 million paid out (2.76x). The March quarter was closer: $418 million against $348 million.
The high yield pairs with a rising unit price. The units are up 70.61% over the past year, and the quarterly rate rose 9.9% from $0.38. There are risks, though. Earnings missed estimates in each of the last two reported quarters. Financing for the EPIC Crude acquisition cut pro forma 2025 earnings per unit to $1.01 from $1.12. And Plains cut its distribution to $0.18 from $0.36 in 2020, a reminder that a past cut is one of the warning signs we cataloged in a free guide to spotting dividend traps before the next one.
First Merchants Series A Preferred (FRMEP): A 7.50% Coupon Near Par
First Merchants 7.50% Non-Cumulative Perpetual Preferred, Series A (NASDAQ:FRMEP) depositary shares will pay $0.4688 per share. The company declared the payment on October 15; shares begin trading without the dividend on October 30, and it pays on November 16. The indicated annual payout is $1.8752. Over the past year, the shares traded between $23.89 and $26.51. At the $25.21 50-day average, that payout works out to about 7.4%.
The preferred is paid out of the parent bank’s earnings, so coverage comes down to the bank’s profits. In the third quarter, First Merchants posted GAAP EPS of $1.09. Adjusted EPS was $1.10, beating the $1.04 consensus, and net income rose 20.4% to $68.3 million. The $0.37 common dividend used about 34% of GAAP EPS, and preferred holders get paid before common holders. Credit costs also fell: the provision for losses dropped to $3.3 million from $33.0 million after two problem loans were charged off.
Structure poses the biggest risk here. Because the preferred is non-cumulative, the board never makes up any missed payments. Revenue of $199.07 million also missed the $203.94 million estimate, and a CEO transition is set for year-end.
Union Bankshares (UNB): First to Pay of the Three
Union Bankshares, the Vermont parent of Union Bank, declared $0.36 per share on October 21. The ex-date is October 30, the record date is October 31, and the money arrives November 5, the earliest of the three. The $1.44 annual rate on a $23.04 share price yields 6.25%.
Coverage looks solid. Third-quarter GAAP EPS of $0.77 puts the quarterly payout ratio at 46.8%, and trailing EPS of $2.62 puts the annual payout ratio near 55%. Net income rose 9.7% to $3.77 million, net interest income grew 10.0%, and credit loss expense was just $34,000.
Some of that yield shows a stock that has gone nowhere. Shares are down 2.72% over one year and 8.71% over five years. Two things deserve attention: the accumulated unrealized securities loss grew to $40.7 million, and a $113.95 million market cap means trading can be thin.
Several other stocks also go ex on October 30.
Miss October 29 and You Miss This Payment
Buying a stock to catch one payment rarely pays off, because the share price usually falls by about the dividend once trading begins without it. Income investors typically consider whether they would want to own a stock after the cash arrives. Either way, the deadline is firm: anyone who isn’t a holder before October 30 won’t get the November payment.
Got $1,000? Before You Buy PAA, Read This
If you have cash sitting in your account right now, give this two minutes. After more than two decades of helping investors beat the market, our top analysts at 24/7 Wall St. put together a definitive report on the Top 10 Stocks To Buy Today. And PAA wasn’t one of them.
They combed the entire market. It's not 10 ideas, not 10 stocks everyone is talking about, it's what their research points to as the 10 best stocks to buy right now, and it's free. Read more here and see which stocks made the list –>>
The post The Clock Is Ticking: 3 High-Yield Dividend Stocks With Deadlines This Week appeared first on 24/7 Wall St..
]]>I’m watching Apple (NASDAQ:AAPL) ahead of its fiscal fourth-quarter results, due Nov. 2 after the close. Shares are up 26.65% this year and the market cap stands near $5.07 trillion. This report tests whether record demand can outrun rising costs.
Record Demand Meets a Memory Cost Squeeze
Last quarter, revenue rose 16.4% to $109.42 billion. EPS of $2.02 exceeded the $1.89 consensus, Apple’s ninth straight EPS beat. iPhone revenue climbed 22% to $54.3 billion on iPhone 17 demand. Shares still fell 7.35% on earnings day.
That quarter included a one-time boost. Tariff refunds added roughly two percentage points to gross margin and $0.11 to EPS. For the September quarter, management guided revenue growth of 9% to 11% and gross margin of 47% to 48%, including about one percentage point from refunds.
On what he said was his final earnings call, Tim Cook warned that memory costs would climb again. He described “a 100-year flood on the memory pricing” and said supply constraints on advanced chip nodes would tighten sharply from the June quarter.
Wall Street’s Numbers for the September Quarter
| Metric | Consensus | Prior Year | YoY Growth |
|---|---|---|---|
| Q4 FY26 Normalized EPS | $1.9782 | $1.85 | 6.9% |
| Q4 FY26 Revenue | $113.36 billion | $102.47 billion | 10.6% |
| FY26 EPS | $8.8199 | $7.46 | 18.2% |
| FY26 Revenue | $477.62 billion | $416.16 billion | 14.8% |
The quarterly EPS estimate has dropped from $2.0179 90 days ago.
Three Reasons This Report Could Swing Either Way
Margins Without the Tariff Cushion
On the July call, CFO Kevan Parekh said memory costs explained more than 100% of the sequential change in adjusted gross margin. Whether gross margin holds the guided range and what management signals for December will be worth watching, since Cook expects memory prices to keep rising beyond September.
iPhone Duo Sets Up the Holiday Quarter
Apple guided mid-teens iPhone growth for September, with Mac and iPad also supply constrained. The $1,999 foldable iPhone Duo reached store shelves this month after online pre-orders sold out within minutes. December-quarter consensus is already at $2.8977 in EPS on $153.44 billion in revenue. How incoming CEO John Ternus, who management said would lead future calls, considers supply against that demand will be a key focus.
Siri AI Costs Versus Services Monetization
Services grew 12% to $30.7 billion, though mobile gaming moderated. Management said the full compute cost of Siri AI remains unclear and pointed to higher iCloud+ levels as one offset. Regulatory work is still holding up Siri AI’s launch in the European Union and China.
A $5 Trillion Valuation Leaves Little Room for Error
Apple trades at about 40 times trailing earnings and 35 times forward estimates. It has beaten estimates for 10 straight quarters, yet shares have averaged a 1.16% decline the day after those beats. Options traders lean conservative, with a put/call ratio of 1.83 on the Nov. 4 expiration. Steady margins and confident holiday guidance could support a rally. Another memory warning on top of rising AI spending would put that premium multiple under pressure.
Got $1,000? Before You Buy AAPL, Read This
If you have cash sitting in your account right now, give this two minutes. After more than two decades of helping investors beat the market, our top analysts at 24/7 Wall St. put together a definitive report on the Top 10 Stocks To Buy Today. And AAPL wasn’t one of them.
They combed the entire market. It's not 10 ideas, not 10 stocks everyone is talking about, it's what their research points to as the 10 best stocks to buy right now, and it's free. Read more here and see which stocks made the list –>>
The post Apple’s $5 Trillion Dilemma: 3 Reasons Earnings Could Spark a Breakout on Nov. 2 — or a Meltdown appeared first on 24/7 Wall St..
]]>Regeneron (NASDAQ:REGN) reports third-quarter results on Oct. 30. Regeneron books its full share of Dupixent profits from Sanofi (NASDAQ:SNY) for the first time this quarter. I think that change matters more than the market is giving it credit for.

Dupixent’s Billion-Dollar Profit Drag Is Gone
Last quarter, Regeneron posted non-GAAP EPS of $14.29 against an $8.00 consensus. Revenue rose 16.73% to $4.29 billion, and global Dupixent sales reached $6.00 billion, up 38%.
On the conference call, management said Regeneron has fully returned the Sanofi development balance, which stood at about $3.1 billion when the agreement was amended in 2022. Repayments cut reported collaboration revenue by roughly $930 million in 2025 and $530 million in the first half of this year. Management expects collaboration revenue to step up beginning in the third quarter.
Since then, the two partners announced an expanded alliance worth up to $8 billion. The deal brings four long-acting antibodies and settles prior litigation between the companies. Shares trade near $815, up 42.28% over the past year.
Analysts Already Expect a Sharp Step-Up
| Metric | Consensus | Prior-Year Actual | Implied YoY Growth |
|---|---|---|---|
| Q3 2026 Normalized EPS | $16.198 | $11.83 | 36.9% |
| Q3 2026 Revenue | $4.56 billion | $3.75 billion | 21.5% |
| FY 2026 EPS | $59.1298 | $44.31 | 33.4% |
| FY 2026 Revenue | $17.60 billion | $14.34 billion | 22.7% |
The quarterly EPS estimate stood at $13.2058 90 days ago, so analysts have partly priced in the Sanofi change.
Collaboration Margins and Eylea HD Will Set the Tone
My first focus is the size of the collaboration step-up. Management expects second-half Dupixent growth to remain strong but moderate against harder comparisons. That means the jump in Regeneron’s share needs to come from the cleaner profit split, and the quarter will reveal the extent of it.
Eylea HD is the second test. U.S. sales hit $596 million last quarter, up 52%, and passed legacy Eylea for the first time. Management guided to sequential HD demand growth in the low to mid-teens, while legacy Eylea demand falls by a similar rate. You should look for any update on the prefilled syringe, which management hopes to get approved before the end of the year.

Margins matter too. Limerick production returned to normal by the end of the second quarter, and Regeneron raised GAAP gross margin guidance to 78%-79%. Launch plans for cemdisiran also deserve attention ahead of its November 2026 FDA target action date. Drug-pricing policy remains a risk that could weigh on top-selling biologics.
First Clean Look at Dupixent’s True Earnings Power
For years, repayment of the development balance hid how much Dupixent actually adds to Regeneron’s earnings. This quarter gives investors the first clear read on that number. If Eylea HD continues outpacing the decline in legacy Eylea, Regeneron enters 2027 with its growth engine running at full strength. That is the setup I’ll be measuring against the upcoming results.
Got $1,000? Before You Buy REGN, Read This
If you have cash sitting in your account right now, give this two minutes. After more than two decades of helping investors beat the market, our top analysts at 24/7 Wall St. put together a definitive report on the Top 10 Stocks To Buy Today. And REGN wasn’t one of them.
They combed the entire market. It's not 10 ideas, not 10 stocks everyone is talking about, it's what their research points to as the 10 best stocks to buy right now, and it's free. Read more here and see which stocks made the list –>>
The post Regeneron’s Billion-Dollar Catalyst Flying Under Wall Street’s Radar Ahead of Oct. 30 Earnings appeared first on 24/7 Wall St..
]]>Colgate-Palmolive (NYSE:CL) reports third-quarter results on Friday, Oct. 30. The stock has rose 21.87% year to date. That rally puts a premium price on a business that is still struggling to grow in the U.S.

Strong Beats, a Weak Home Market and a Rich Multiple
Last quarter, Colgate posted Base Business EPS of $0.99, beating the $0.95 consensus, on revenue of $5.36B (+4.9% YoY). Gross margin expanded 140 bps to 61.5% even as advertising rose 15% to $777M. Management raised its Base Business EPS growth outlook to mid-single digits and lifted gross margin guidance to roughly flat.
North America was the problem. Net sales fell 3.0%, the fourth straight quarterly decline, with volume down 3.9%. Shares slid 1.56% the day after the report despite the beat.
Momentum has since returned. CL gained 10.05% over the past month and trades around 24x the full-year 2026 EPS consensus. That is a demanding multiple for a company guiding to 1% to 4% organic growth.
Wall Street Expects Modest Q3 Growth
| Metric | Consensus | Year-Ago Actual | Implied YoY Growth |
|---|---|---|---|
| Q3 2026 EPS | $0.9253 | $0.91 | 1.7% |
| Q3 2026 Revenue | $5.33B | $5.13B | 4.0% |
| FY 2026 EPS | $3.8668 | $3.69 | 4.8% |
| FY 2026 Revenue | $21.40B | $20.38B | 5.0% |
Colgate has beaten EPS estimates six straight quarters.

U.S. Recovery and Oil Costs Will Test the Premium
North America is my first focus. On the Q2 call, management said consumption was about flat while shipments fell 3% as retailers cut inventory and Colgate lost some share. Management promised “surgical actions by category and channel”, more advertising and fixes to select price spreads, but warned it “won’t be a linear improvement.”
Margins are the hidden risk. Management called Q3 largely locked in but expected cost of goods and tariffs to peak in the back half, highlighting Q4 risk with oil “more in the $90 range.” WTI crude hit $107.89 per barrel on Oct. 20. You should listen closely for any change to the fourth-quarter gross margin outlook.
Mix matters too. Management expects a more volume-driven second half after pricing carried the first half, and it does not expect the same Latin American FX benefit. Hill’s faces a about flat U.S. pet category plus a 200 basis point volume drag from private label exits.
Analysts are already reducing. The FY2026 EPS consensus saw three downward revisions and zero upward revisions over the past 30 days.

A Defensive Premium Now Requires U.S. Proof
Colgate’s 63 consecutive years of dividend increases and its 41.3% global toothpaste share explain why investors treat it as a safe haven. At about 24x earnings, the stock prices in steady execution. If the U.S. shows sequential improvement and margin guidance holds against higher oil, the premium looks earned. If costs rose while North America keeps contracting, this earnings report could expose how much of the rally rests on reputation.
Got $1,000? Before You Buy CL, Read This
If you have cash sitting in your account right now, give this two minutes. After more than two decades of helping investors beat the market, our top analysts at 24/7 Wall St. put together a definitive report on the Top 10 Stocks To Buy Today. And CL wasn’t one of them.
They combed the entire market. It's not 10 ideas, not 10 stocks everyone is talking about, it's what their research points to as the 10 best stocks to buy right now, and it's free. Read more here and see which stocks made the list –>>
The post Is This Safe-Haven Stock Overvalued? The Hidden Risk Facing Colgate-Palmolive on Oct. 30 appeared first on 24/7 Wall St..
]]>Dominion Energy (NYSE:D) is expected to report third-quarter results before the market opens on Friday, October 30. Record data center demand continues raising earnings. At the same time, Virginia officials want a six-year base-rate freeze as the price of the NextEra Energy (NYSE:NEE) merger.
Six Straight Beats Run Into a Political Wall
Last quarter, Dominion posted operating EPS of $0.79 against a $0.68 consensus. That made six beats in a row. Revenue rose 17.6% YoY to $4.48B, and Dominion Energy Virginia’s operating earnings climbed to $670M from $549M on Biennial Review effects and rider equity returns. GAAP results looked worse. Nonregulated impairments of $626M cut net income to $340M.
Management reaffirmed 2026 operating EPS guidance of $3.45 to $3.69. Since then, the politics around the deal with NextEra have hardened. Governor Abigail Spanberger and State Corporation Commission staff oppose the merger. They are demanding a six-year base-rate freeze and tripled customer credits. Even so, shares have gained 14.73% year to date, to $65.20.

Consensus Calls for Double-Digit EPS Growth
| Metric | Consensus | Prior Year | YoY Growth |
|---|---|---|---|
| Q3 2026 EPS | $1.1933 | $1.06 | 12.6% |
| Q3 2026 Revenue | $4.80B | $4.53B | 6.1% |
| FY 2026 EPS | $3.5857 | $3.42 | 4.8% |
| FY 2026 Revenue | $18.16B | $16.5B | 10.0% |
The Q3 EPS estimate has slipped from $1.2059 60 days ago. Analysts made two downward revisions in the past month.
Freeze Talk and the 53 GW Pipeline Will Set the Tone
Mostly, I’ll be watching how management responds to the freeze demand before Virginia’s formal hearings begin November 17. Rider returns and base-rate increases drove this year’s Virginia gains, and a six-year freeze would cap the base-rate side. In July, Robert Blue pushed back: “We don’t think it makes sense to change the rules in the middle of the game.”
Demand remains the strongest card Dominion holds. The utility has over 53 gigawatts of data center capacity in various stages of contracting, with about 12 gigawatts under electric service agreements. You should track whether that signed figure continues rising, because signed contracts are what turn into rate base.

Offshore wind is the third test. The Coastal Virginia Offshore Wind project was 81% complete, with costs revised to $11.65 billion and final turbine installation pushed back 6 months. Any further decline would matter.
Finally, watch the new resource plan. It proposes nearly 9 GW of new gas plants and only 3.5 GW of battery storage, against Virginia’s 16 GW storage mandate. Dominion has also sued Prince William County after local supervisors blocked a substation overhaul.
A Freeze Would Rewrite the Growth Math
Dominion’s target of 5% to 7% annual EPS growth through 2030 depends on a $64.7B capital plan making regulated returns. The demand is clearly there. What’s uncertain is how much of that spending regulators will let Dominion recover. If management shows a merger path that avoids punishing freeze terms, the rally has support. If those terms stick, the company’s stated lean toward the upper half of its range for 2028 to 2030 becomes much harder to defend.
Got $1,000? Before You Buy D, Read This
If you have cash sitting in your account right now, give this two minutes. After more than two decades of helping investors beat the market, our top analysts at 24/7 Wall St. put together a definitive report on the Top 10 Stocks To Buy Today. And D wasn’t one of them.
They combed the entire market. It's not 10 ideas, not 10 stocks everyone is talking about, it's what their research points to as the 10 best stocks to buy right now, and it's free. Read more here and see which stocks made the list –>>
The post Dominion’s Q3 Dilemma: Massive Grid Demand Meets A 6-Year Rate Freeze Threat appeared first on 24/7 Wall St..
]]>Our 24/7 Wall St. price target for Oracle (NYSE:ORCL) is $195.90. That implies 56.04% upside from $125.54. Our model rates the stock a buy with high confidence.
| Metric | Value |
|---|---|
| Current Price | $125.54 |
| Price Target from 24/7 Wall St. | $195.90 |
| Upside/Downside | 56.04% |
| Recommendation | BUY |
| Confidence Level | 90% |

Investors have been selling Oracle over concerns about its debt-funded AI buildout, but the business keeps growing faster. In our view, the market is focused on the pressure on the balance sheet and is giving too little credit to the earnings power behind it.
AI Debt Fears Pushed Oracle Toward Its 52-Week Low
Oracle fell 6.92% over the past week and 15.82% over the past month, which leaves it down 34.93% year to date. Shares trade far below the 52-week high of $283.40 and close to the $114.08 low. Barron’s argued this week that Oracle was caught in a broader AI debt selloff and that the drop could be a mistake.
Results in fiscal Q1 2027 were strong. Adjusted EPS came in at $1.92, ahead of the $1.74 estimate. Revenue of $19.34 billion rose 29.6%, and cloud infrastructure revenue grew 121% to $7.39 billion. Management raised full-year non-GAAP EPS guidance to $8.10.

Why Bulls See $290 Within Reach
Contracted revenue not yet recognized reached $664 billion. The company expects around half to convert into sales over the next 36 months. GPU usage ran at 97.9%, and GPUs that came up for renewal were re-signed or resold at a 20% premium. Oracle also closed more than $30 billion of AI contracts “without requiring additional capital from Oracle.”
Wall Street’s consensus target is $237.36, backed by 7 Strong Buy and 28 Buy ratings. If backlog conversion speeds up, our bull scenario reaches $290.19.

Negative Free Cash Flow Is the Risk to Watch
Free cash flow came in at -$5.40 billion as capital spending reached $28.5 billion. Interest expense rose 55% to $1.4 billion, and the completed $20 billion equity program diluted existing shareholders. Software license revenue fell 15%.
All of that spending has to be powered and cooled by someone, which is why we rounded up seven suppliers behind the AI data-center expansion in a free report.
On the other side, operating cash flow hit $23.10 billion, up 184%. Hilary Maxson said projects that have ramped up deliver “a free cash flow conversion ratio of something like 100% to post-tax EBITDA.” Even our bear case lands at $167.93.
Oracle Trades Cheaper Than Microsoft and Amazon
Azure competes directly with Oracle for AI and enterprise workloads, which is why Microsoft (NASDAQ:MSFT) belongs in this comparison. Microsoft trades at 25x forward earnings with 17.7% revenue growth, a higher multiple for slower growth than Oracle’s.
The largest rival in AI infrastructure, AWS, is run by Amazon (NASDAQ:AMZN) and now connects to Oracle through Oracle Interconnect for AWS. The stock trades at 24x forward earnings with 19.6% revenue growth.
| Company | Forward P/E | Revenue Growth (YoY) |
|---|---|---|
| Oracle | 18x | 29.6% |
| Microsoft | 25x | 17.7% |
| Amazon | 24x | 19.6% |
Oracle has the fastest growth of the three but the lowest multiple. Next to these peers, our 24/7 Wall St. price target looks reasonable and arguably conservative.
Oracle Price Prediction 2026-2030
Our 24/7 Wall St. price target of $195.90 carries a buy rating with 90% confidence. What tips the balance is the backlog, which turns today’s spending into contracted revenue.
The bull case strengthens if results on December 14 show cloud growth within the guided 65% to 71% range. The case weakens if financing costs rise faster than infrastructure profits. At these levels, the potential reward appears to outweigh the risk.
Looking further ahead, this is where the 24/7 Wall St. model projects Oracle could trade, assuming current growth trends hold.
| Year | Price Target from 24/7 Wall St. |
|---|---|
| 2026 | $138.30 |
| 2027 | $197.32 |
| 2028 | $262.66 |
| 2029 | $333.27 |
| 2030 | $384.94 |
Oracle would need to keep converting its backlog on schedule for these projections to hold. How long AI demand lasts and how much the expansion costs to finance could move the stock well above or below these levels.
Got $1,000? Before You Buy ORCL, Read This
If you have cash sitting in your account right now, give this two minutes. After more than two decades of helping investors beat the market, our top analysts at 24/7 Wall St. put together a definitive report on the Top 10 Stocks To Buy Today. And ORCL wasn’t one of them.
They combed the entire market. It's not 10 ideas, not 10 stocks everyone is talking about, it's what their research points to as the 10 best stocks to buy right now, and it's free. Read more here and see which stocks made the list –>>
The post Oracle Could Have a Massive AI Opportunity. Here’s Where the Stock Could Go appeared first on 24/7 Wall St..
]]>Brazil’s surprise election result is hitting the country’s U.S.-listed companies hardest where government policy and borrowing costs carry the most weight. Nu Holdings (NYSE:NU) stock is down 25% to $11.30 in morning trading, a drop that marks the market’s toughest verdict on Brazil’s financial-services outlook.
Meanwhile, Petrobras (NYSE:PBR) stock is sliding 21% to $20.54, trailing only Nu Holdings among the three companies, as the state-controlled oil producer faces fresh questions about government influence. MercadoLibre (NASDAQ:MELI) shares are falling 15% to $1,545, a smaller decline than either Nu Holdings or Petrobras.
The selling pressure is landing directly on Brazil. Tracking a broad basket of Brazilian equities, the iShares MSCI Brazil ETF (NYSEARCA:EWZ) is down 28% to $30.66, a deeper slide than any of the three companies. For comparison, the SPDR S&P 500 ETF Trust (NYSEARCA:SPY) is up 0.3% to $762.13, showing that risk appetite outside of Brazil is holding steady.
Lula’s Fourth-Term Upset Catches Markets Off Guard
Luiz Inácio Lula da Silva won Brazil’s presidential runoff over the weekend, a surprise victory that gives him a fourth term and sends a shock through Nu Holdings, Petrobras and MercadoLibre shares. Senator Flávio Bolsonaro, who led the first round earlier this month, has refused to concede, adding further political uncertainty.
Investors had largely positioned for a Bolsonaro win and the economic reforms it was expected to bring. Brazil is dealing with deteriorating public finances and elevated interest rates. Whether Lula’s more gradual approach to fiscal repair can still bring borrowing costs down is now the central question hanging over Brazilian assets.
Nu Holdings and Petrobras Absorb the Heaviest Blows
Nu Holdings is a digital financial services platform operating primarily in Brazil, Mexico and Colombia, with the majority of its customers in Brazil. That footprint ties the company directly to Brazilian interest rates, consumer credit conditions and the tax treatment of financial services. Lula’s win stokes fears of further tax hikes and heavier regulation on Brazilian lenders, and as a result Nu Holdings stock is leading the decline.
Petrobras is Brazil’s state-controlled integrated oil company, with the national government as its controlling shareholder. Such a structure makes the oil producer sharply sensitive to the presidency, with the selloff reflecting fears of renewed state intervention, fuel-price controls, higher taxation, and dividend policy risk. A new crude export tax and fuel subsidy obligations already weigh on the company, though its large deepwater and pre-salt production base still gives Petrobras a solid operating foundation.
MercadoLibre runs e-commerce and fintech businesses across Brazil, Mexico, Argentina and other Latin American markets. Yet, Brazil is its largest market, which leaves the company highly sensitive to a weaker real and local policy risk. Its wider reach hasn’t saved it a steep decline, though MercadoLibre stock is holding up better than the two names most tied to Brasília.
What Lula’s Win Means for Nu Holdings, Petrobras and MercadoLibre
Next up for MercadoLibre is its quarterly report, expected in early November, though the company hasn’t yet confirmed the date. That report is the next test of whether Brazilian demand holds up after the election. Steady order growth in the results could help MercadoLibre stock separate from the wider Brazil selloff.
For Nu Holdings and Petrobras, the clearest signals could come from how quickly Lula’s government outlines its fiscal repair plan and from fresh tax measures on Brazilian financial services. Any shift in Petrobras’ pricing or dividend policy could also sway its shares.
With the iShares MSCI Brazil ETF falling harder than any single company, the political shock is clearly spreading across the country’s equities. Those weighing exposure to Nu Holdings, Petrobras and MercadoLibre shares should adjust their holdings carefully given the unresolved fiscal and policy questions hanging over Brazil.
Got $1,000? Before You Buy PBR, Read This
If you have cash sitting in your account right now, give this two minutes. After more than two decades of helping investors beat the market, our top analysts at 24/7 Wall St. put together a definitive report on the Top 10 Stocks To Buy Today. And PBR wasn’t one of them.
They combed the entire market. It's not 10 ideas, not 10 stocks everyone is talking about, it's what their research points to as the 10 best stocks to buy right now, and it's free. Read more here and see which stocks made the list –>>
The post Brazilian Stocks Tumble as Lula Wins Surprise Fourth Term: Nu Holdings Sinks 25%, Petrobras Tumbles 21%, MercadoLibre Drops 15% appeared first on 24/7 Wall St..
]]>SpaceX (NASDAQ:SPCX) founder Elon Musk delivered a blunt warning to the companies that rent out AI computing power, and the selling it triggered is concentrated in a narrow slice of the market. CoreWeave (NASDAQ:CRWV) stock is at $51.62, down 5% in morning trading. For a company that leans heavily on borrowed money to build data centers, a warning about closed-off credit markets strikes at the core of its growth plan.
Meanwhile, IREN Limited (NASDAQ:IREN) stock is at $24.37, down 3% to $24.21. Nebius Group (NASDAQ:NBIS) stock trades at $155.50, down 2%.
Also, the First Trust Cloud Computing ETF (NASDAQ:SKYY) is at $167.42 and essentially unmoved. Large caps are stronger, with the SPDR S&P 500 ETF Trust (NYSEARCA:SPY) at $762.07, up 0.3%. That gap limits the pressure to the neocloud corner.
Musk’s Credit Warning Rattles AI Cloud Renters
In posts on X on October 25, Musk said debt markets have almost entirely shut off financing for companies without substantial revenue independent of AI data centers. He went further. He stated that neoclouds, the companies renting graphics processing unit (GPU) capacity to AI developers, face “guppy-level death and consolidation.” Musk named no company, so CoreWeave, IREN and Nebius shares are trading on the remarks as a verdict on debt-funded AI cloud models as a whole.
Asked whether he was trying to push the stocks down ahead of a buyout, Musk replied: “SpaceX is not buying any neoclouds. Pointless.” His answer takes a SpaceX deal off the table and leaves the financing argument as the core message for CoreWeave and its peers. CoreWeave’s bonds fell to distressed levels this month on concern over the debt funding the neocloud buildout, so the remarks land on a group already under credit pressure.
Nebius Holds Firm While CoreWeave and IREN Slide
Both CoreWeave and Nebius rent GPU capacity to AI developers and fund much of their data center buildout with borrowed money. That model ties both stocks closely to credit conditions, which is exactly the pressure point Musk described in his posts. Yet, Nebius is inching higher while CoreWeave slips.
IREN came to AI cloud from cryptocurrency mining, so its data center capacity grew out of a different business than the two pure neoclouds. Its shares are still tracking CoreWeave stock lower, which shows that the mining origin hasn’t shielded IREN from the selling, and for now, IREN stock sits closer to CoreWeave stock than to Nebius stock in how traders are pricing Musk’s warning.
Within the First Trust Cloud Computing ETF, CoreWeave is one holding among a wide spread of software, networking and infrastructure names, which helps explain the fund’s flat reading. Nebius and IREN aren’t among the fund’s holdings, so the ETF offers no direct read on either name. The fund’s stability points to stress concentrated among a handful of GPU renters.
What Musk’s Warning Means for CoreWeave, IREN and Nebius
CoreWeave’s next test is whether its bond prices stabilize as lenders reassess the neocloud group, and a recovery in those bonds would ease the credit worry weighing on CoreWeave shares, while further weakness could keep the stock under pressure. Musk warned the group as a whole. Because of that, stronger operators may still separate themselves if consolidation arrives, and we laid out how to ride an AI mania while planning the exit in a free handbook here.
For Nebius, the bull case is its contracted demand and its resilience while peers slide; the bear case is that it relies on the same borrowed money Musk called out. For IREN, bulls point to its AI cloud pivot and big-name customers, while bears note its shares are trading in lockstep with CoreWeave. Those with exposure to these neocloud stocks should keep their positions sized modestly given how tightly this group trades on credit conditions.
Got $1,000? Before You Buy NBIS, Read This
If you have cash sitting in your account right now, give this two minutes. After more than two decades of helping investors beat the market, our top analysts at 24/7 Wall St. put together a definitive report on the Top 10 Stocks To Buy Today. And NBIS wasn’t one of them.
They combed the entire market. It's not 10 ideas, not 10 stocks everyone is talking about, it's what their research points to as the 10 best stocks to buy right now, and it's free. Read more here and see which stocks made the list –>>
The post CoreWeave Drops 5% as Musk Warns of Neocloud ‘Guppy-Level Death’; IREN Slides 3%, Nebius Slips 2% appeared first on 24/7 Wall St..
]]>Wes Moss has raised his retirement happiness target. Moss said during the October 20 Ask An Advisor section of The Clark Howard Podcast that his updated research for The Retire Sooner Method shows that noticeably higher happiness relative to the baseline “starts at a million” in liquid savings. That includes 401(k), 403(b), IRA, Roth and brokerage money. Reaching that level, he said, gives retirees “a ton of peace of mind around that and what that money can produce in income.”
In his older book, Moss said, “the inflection point in the old book was at 500k.” Moss added that after inflation, the old $500,000 mark is “probably 800 today.” Back in April, he put the target this way: “We want to get to a million dollars in liquid assets. We want $100,000, let’s say, in retirement income.” So how much income can Moss’s $1 million actually produce?
Moss’s Yield Ladder Puts a Price on Peace of Mind
Moss uses what he calls a yield ladder. Each step pays more income and takes more risk. On September 29, Moss estimated the S&P 500 yields about 1.2%, while utility ETFs yield around 3%. Moss said big energy companies yield closer to 4% to 4.5%, and Moss placed REITs and closed-end funds in the 7% to 8% range. He calls that income “permission, license to feel okay about spending.”
Here is how six real holdings measure up, using their annualized forward payouts and October 23 prices:
| Holding | Current Yield | Annual Income on Moss’s $1 Million |
|---|---|---|
| SPDR S&P 500 ETF Trust (NYSEARCA:SPY) | 1.0% (trailing) | $9,978 |
| Utilities Select Sector SPDR Fund (NYSEARCA:XLU) | 2.8% (trailing) | $28,463 |
| Exxon Mobil (NYSE:XOM) | 2.2% | $22,488 |
| Chevron (NYSE:CVX) | 3.1% | $30,526 |
| Realty Income (NYSE:O) | 5.7% | $57,268 |
| PIMCO Dynamic Income Fund (NYSE:PDI) | 18.5% | $184,906 |
Energy’s Rally Shrank the Middle Rung
The SPDR S&P 500 ETF Trust is the low step, paying $7.58 per share over the trailing 12 months. The Utilities Select Sector SPDR Fund lands close to Moss’s 3% estimate.
The energy step has fallen below Moss’s range because prices ran ahead of payouts. Exxon Mobil is up 55.27% year to date and Chevron is up 57.27%. Both payouts are still rising. Exxon’s quarterly dividend went from $0.95 in 2024 to $1.03 in 2026, and the company plans $20B in buybacks this year. Chevron raised its payout to $1.78 per quarter as Brent averaged $104/BBL vs $68/BBL a year earlier. Anyone buying energy stocks for income today gets a lower starting yield than Moss’s ladder suggests.
Top Rungs Pay Monthly, With Very Different Risk
Realty Income has declared 673 consecutive monthly dividends, and its second-quarter SEC filing marked its 115th consecutive quarterly dividend increase. Occupancy stands at 98.8%, and 2026 AFFO guidance was raised to $4.44-$4.45 per share. That easily covers the $3.258 annualized dividend.
PIMCO Dynamic Income Fund yields more than twice the top of Moss’s range. Its $0.2205 monthly distribution has held steady since 2023, but shares have fallen 10.09% over the past year. A yield that high can signal that the market sees elevated risk in the fund’s credit portfolio. Moss has also said his ladder moves “into other areas, bonds and other specialty categories, so that we’re not leaning in on these ultra-high-yielding stocks.”
What a Blended Ladder Means for Retirees
Among the five lower-yielding holdings, only Realty Income produces more than $50,000 on Moss’s $1 million. For most retirees, that leaves Moss’s $100,000 target dependent on Social Security, pensions, or a blend of steps. Spreading money across the ladder gives up some yield in exchange for not relying on any single payer (we walked through how to build a dividend ladder that funds retirement without touching the principal in a free guide). Climbing higher brings in more cash each year, but the principal is less stable.
The next milestones are close. PDI pays on November 2, SPY on October 30, and Realty Income on November 13. Exxon and Chevron will show in their next announcements whether payout growth can keep up with their share prices.
Got $1,000? Before You Buy XOM, Read This
If you have cash sitting in your account right now, give this two minutes. After more than two decades of helping investors beat the market, our top analysts at 24/7 Wall St. put together a definitive report on the Top 10 Stocks To Buy Today. And XOM wasn’t one of them.
They combed the entire market. It's not 10 ideas, not 10 stocks everyone is talking about, it's what their research points to as the 10 best stocks to buy right now, and it's free. Read more here and see which stocks made the list –>>
The post Wes Moss: Retirement Happiness “Starts at a Million” in Liquid Savings appeared first on 24/7 Wall St..
]]>A woman in her late fifties is the named heir to her father’s cabin outside Gatlinburg, Tennessee, which matters because he is in his eighties. The cabin is currently listed on Airbnb (NASDAQ:ABNB), and the calendar already holds 61 reservations reaching well into next year. The problem is the paperwork: the short-term-rental permit is in his name, and under local rules it expires when ownership changes, so on the day he dies, the bookings, income, and a large part of the property’s market value could disappear.
This comes up often in the Smoky Mountains, where many cabins were bought as retirement rentals. A brokerage that specializes in the area warns that “Tennessee’s grandfathering protection does not transfer when a property is sold.” Host forums raise the same issue. In one thread about a host’s death, a commenter wrote, “Future bookings will probably also be canceled by [Airbnb].”
Why the Permit Can Be Worth More Than the Logs
Since January 1, 2024, every short-term rental in unincorporated Sevier County has needed an annual permit and a yearly inspection. Gatlinburg and Pigeon Forge each run their own permit systems with separate rules, and if a cabin can legally rent by the night in a tourist market, it works like a small business. If it can’t, it’s a vacation home, and buyers value it on views and square footage.
The whole scenario turns on that gap. Over five years, the Knoxville-area home price index has risen about 63%. That index tracks houses in general, though, and says nothing about rental rights; in rental-heavy markets, buyers often price cabins partly on their booking history. If the permit ends at death, the heir gets the building but loses the income that supported much of its price.
Federal Taxes Are Mostly Settled Already
The federal estate tax is unlikely to matter, as estates of people who die in 2026 have a basic exclusion amount of $15,000,000. Only 7,195 estate tax returns were filed nationwide in 2024. A single mountain cabin rarely pushes an ordinary estate into that range.
Income tax matters more, as under 26 U.S.C. § 1014(a)(1), inherited property takes a basis equal to its fair market value at the date of death. Decades of appreciation drop out of the capital gains math. IRS guidance also treats a later sale of inherited property as a long-term gain or loss, regardless of how long you held it. A cabin bought long ago for a fraction of today’s price can be sold soon after death with little or no taxable gain.
Two Realistic Paths for Protecting the Cabin’s Value
Retitle Into a Revocable Trust While He Is Alive
For most families, the stronger move is to act now. The cabin can be moved into the father’s revocable living trust, or into an LLC owned by that trust. If the trust or LLC holds the permit, the permit holder of record may not change when he dies. The tax benefit is kept. 26 U.S.C. § 1014(b)(2) treats property in a revocable trust as acquired from the decedent, so it still gets the stepped-up basis.
The key step is written confirmation from the county or city permitting office that retitling doesn’t void the permit. Some jurisdictions treat any deed change as a new owner. It’s worth hiring a local real estate attorney. The answer depends on the parcel’s zoning and how the office interprets its own rules.
Giving the cabin to the daughter outright is the weaker version of this idea. With a lifetime gift, she takes over his original basis. That gives up the step-up and leaves decades of gains, plus the depreciation he claimed on the rental, taxable when she sells.
Plan an Orderly Sale After Death
If the permit can’t be kept, the goal becomes protecting value during the transition. The daughter can be added as a co-host on the Airbnb account now. The father’s will or trust can also give the executor clear authority to decide which of the 61 bookings to honor and which to refund. Selling soon after death, at close to the appraised date-of-death value, produces little taxable gain under the basis rules.
Keeping the cabin and reapplying for a new permit is an option only where new permits are available. Even then, any depreciation she claims as the new owner is subject to recapture rules under 26 U.S.C. § 1250 when she eventually sells.
Settle These Questions Before the Next Booking Lands
Start by confirming which jurisdiction the cabin is actually in. A Gatlinburg mailing address is frequently in unincorporated county, and the permit, tax, and inspection rules change completely at that line. Whether the permit survives a trust transfer depends entirely on which office issued it.
Next, settle the title while the father can still sign a deed. Waiting has a cost. Once he dies, the permit question is decided by default, and only the stepped-up basis remains. Retitling into a revocable trust with written sign-off from the permitting office keeps both the tax benefit and, possibly, the rental business. Doing nothing keeps only the tax benefit.
Estate problems like this almost always trace back to a missed form, a stale deed, or an untitled account. Our free guide, Die With a Plan, includes the full cleanup checklist.
Released: 401k & IRA Tips and Answers
(sponsor) 401(k)s are powerful retirement tools. But even savvy savers can make mistakes that quietly cost you money for decades. Choosing the wrong fund, ignoring small fees nobody adds up, rollover steps done in the wrong order, the list goes on.
These sort of mistakes is exactly what 401k & IRA Tips and Answers was created to help prevent. It is a free guide from Fisher Investments on rollovers, contributions, required withdrawals and the mistakes that do the most damage to a retirement account. Learn More Here ›
The post Her Father’s Smoky Mountains Cabin Will Come With 61 Airbnb Bookings Already on the Calendar and a Short-Term-Rental Permit That Will Die With Him appeared first on 24/7 Wall St..
]]>A closely tracked personalized melanoma vaccine met its main goal. Its effect on distant spread came in far smaller than an earlier study suggested in a late-stage trial. Moderna (NASDAQ:MRNA) stock is down 7% to $185.74 in morning trading, a move that reprices the commercial upside of its flagship cancer program. That decline extends a selloff that started when the results leaked, and it reflects a judgment on how big the benefit is, since the trial cleared its primary hurdle.
Merck (NYSE:MRK) co-develops the vaccine with Moderna and supplies Keytruda, the immunotherapy the shot is paired with in the trial; MRK stock is down 0.2% to $145.61. Meanwhile, BioNTech SE (NASDAQ:BNTX) stock is down 3% to $85.65, a smaller slide for the other messenger RNA (mRNA) developer in the group. Pfizer (NYSE:PFE) stock is down 0.2% to $29.96, essentially holding steady as the diversified drugmaker in the comparison.
Biotech as a group is moving in the opposite direction. The iShares Biotechnology ETF (NASDAQ:IBB) is up 0.2% to $208.21, putting the sector fund on the other side of the slide in Moderna stock. Broader stocks are stronger as well, with the SPDR S&P 500 ETF Trust (NYSEARCA:SPY) up 0.3% to $762.27.

The Leaked Melanoma Data
The numbers leaked before a scheduled presentation. Moderna then released detailed late-stage results for intismeran autogene, its personalized melanoma vaccine, on October 22, set for a European oncology conference in Madrid. Combined with Keytruda, the shot met the main goal of reducing return or death risk, but distant metastasis results fell well short of the earlier mid-stage study.
Selling in Moderna stock is continuing this session. The distant-spread miss outweighs the main-goal win the company flagged in August.
Moderna’s Single-Platform Model Takes the Hardest Hit
Moderna’s business rests entirely on mRNA medicines, so the cancer vaccine carries an outsized share of its pipeline value, and that concentration helps explain why Moderna stock is sliding while the biotech fund edges higher.
BioNTech, an mRNA developer with its own cancer pipeline, has exposure that spreads well beyond this readout. Its shares are falling by a far smaller margin.
Pfizer’s diversified portfolio protects it from any one cancer vaccine result. Merck, Moderna’s partner on the shot, also has a much larger oncology business anchored by Keytruda.
What the Melanoma Data Means for Moderna
Moderna’s next test is whether the full melanoma dataset holds up as the basis for a regulatory filing, since even with a weaker read on distant spread, a trial that met its main goal could still support that submission. Shareholders can watch for the filing plan Moderna lays out around the complete results.

Any recovery in Moderna stock may depend on whether the market comes to see a modest benefit on distant spread as commercially meaningful. BioNTech and Pfizer offer a reference point, since both companies carry pipelines that extend well beyond this one vaccine.
Reviewers at regulatory agencies would see the full dataset only after Moderna and Merck submit it, which keeps the shot’s commercial outlook uncertain for now. Traders may prefer to keep their exposure smaller until the debate over Moderna’s melanoma vaccine data resolves.
Got $1,000? Before You Buy PFE, Read This
If you have cash sitting in your account right now, give this two minutes. After more than two decades of helping investors beat the market, our top analysts at 24/7 Wall St. put together a definitive report on the Top 10 Stocks To Buy Today. And PFE wasn’t one of them.
They combed the entire market. It's not 10 ideas, not 10 stocks everyone is talking about, it's what their research points to as the 10 best stocks to buy right now, and it's free. Read more here and see which stocks made the list –>>
The post Moderna Tumbles 7% as Cancer Vaccine Selloff Deepens; BioNTech Falls 3%, Pfizer Holds Steady appeared first on 24/7 Wall St..
]]>Tesla investors have spent two years arguing over whether they own a carmaker or an AI platform. After the third-quarter report, one catalyst could settle the argument: the unsupervised Robotaxi fleet.
The 24/7 Wall St. price target for Tesla (NASDAQ:TSLA) is $404.84. That implies 8.1% upside from the $374.58 close on October 22.
| Metric | Value |
|---|---|
| Current Price | $374.58 |
| Price Target from 24/7 Wall St. | $404.84 |
| Upside/Downside | 8.1% |
| Recommendation | HOLD |
| Confidence Level | 90% |
The model has high confidence and sees Tesla trading near fair value, so we rate it a hold. The upside case depends on Robotaxi economics showing up in reported results, and that has not happened yet.
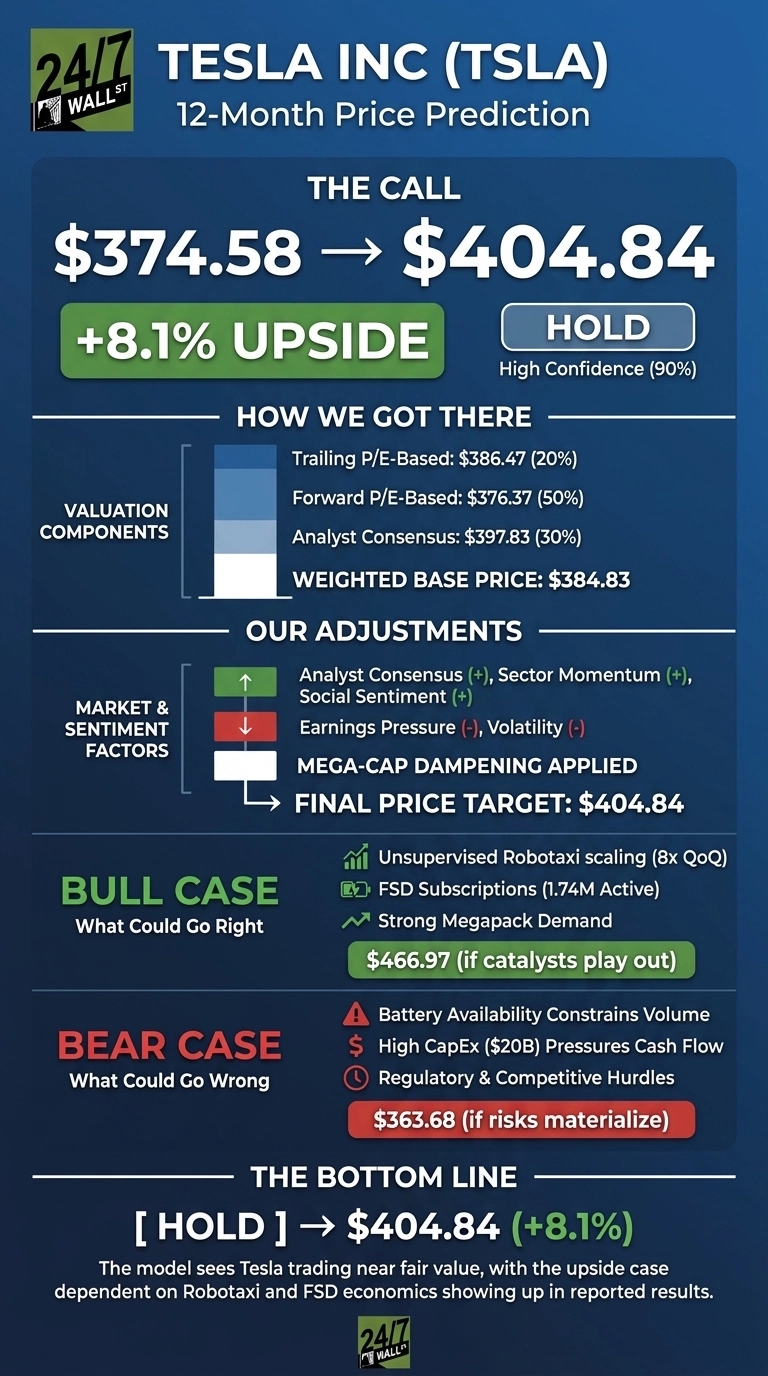
Battery Shortages Capped a Q3 Beat as Shares Slid 16.71% This Year
Shares rose 3.35% over the past week but fell 1.14% over the past month and are down 16.71% year to date. Tesla sits 24.9% below its 52-week high of $498.83.
Q3 revenue of $28.05 billion came in just above the $28.02 billion estimate, and EPS of $0.48 beat the $0.45 consensus. Operating income still fell 55.79% as R&D rose to $2.76 billion.
Battery supply limited deliveries to 486,532, even though the order backlog is the largest in four years. On top of that, reports of merger talks with SpaceX have raised fresh questions about valuation (Morningstar).
Why Bulls See Robotaxi Rewriting the Math
Cybercab joined the unsupervised Austin fleet on September 3, and cumulative unsupervised miles rose 8x quarter over quarter to nearly 2 million. Management said Dallas is next and that some customer cars could join the fleet “somewhere around Q2 next year,” with Robotaxi becoming a meaningful source of profit in 2027.
FSD subscriptions reached 1.74 million, up from 1.04 million. Megapacks are nearly sold out for 2027, and energy gross margin rose to 33.1%. The bull case of $466.97 implies 24.7% upside.

What Could Stall the Autonomy Story
Free cash flow fell 61.63% to $1.53 billion, and management now expects about $20 billion in capex this year. Robotaxi has yet to reach its target of 30 cents per mile, and traders put the odds of a California launch this year at just 13%.
Among analysts, 21 rate the stock a hold. In fairness, cash rose to $45.45 billion, so the margin squeeze is funding autonomy and robotics rather than signaling financial stress. The bear case is $363.68.
How Tesla Compares to GM and Ford
General Motors (NYSE:GM) is the main Detroit rival in EVs and autonomy. GM trades at 25x earnings after Q3 EPS of $3.70.
Ford (NYSE:F) shows the value end of the sector, with a 6.39% dividend yield, negative GAAP earnings, and Model e losses of roughly $4 billion.
| Company | Trailing P/E | P/FCF |
|---|---|---|
| Tesla | 390 | 238 |
| GM | 25 | 6 |
| Ford | Negative | 4 |
On auto multiples, our target looks aggressive. Investors are paying for software and autonomy, so Robotaxi has to produce real revenue to back up the premium.
Tesla Price Prediction 2026-2030
The 24/7 Wall St. price target is $404.84, rated hold with 90% confidence. The steep cost of building out autonomy tips the scale.
I would turn more bullish if Robotaxi cities and customer-car integration arrive on schedule. I would stay cautious if battery shortages and capex keep eating into cash flow.
The 24/7 Wall St. price target model projects where Tesla could trade if current trends and market conditions hold.
| Year | Price Target from 24/7 Wall St. |
|---|---|
| 2026 | $377.71 |
| 2027 | $411.74 |
| 2028 | $411.51 |
| 2029 | $448.39 |
| 2030 | $456.84 |
The projections assume Tesla keeps executing its current strategy. A SpaceX merger, which traders give 65.5% odds of being announced by the end of 2027, or a faster Robotaxi rollout could move the outlook sharply in either direction.
Got $1,000? Before You Buy TSLA, Read This
If you have cash sitting in your account right now, give this two minutes. After more than two decades of helping investors beat the market, our top analysts at 24/7 Wall St. put together a definitive report on the Top 10 Stocks To Buy Today. And TSLA wasn’t one of them.
They combed the entire market. It's not 10 ideas, not 10 stocks everyone is talking about, it's what their research points to as the 10 best stocks to buy right now, and it's free. Read more here and see which stocks made the list –>>
The post One Catalyst Could Completely Change the Tesla Stock Story appeared first on 24/7 Wall St..
]]>Exelon (NASDAQ:EXC) reports third-quarter results before the open on Friday, Oct. 30. Shares trade at $44.42, about 12.6% below $50. I think data center demand is the driver that could close that gap.

Steady Guidance After a Stormy Summer
Last quarter, Exelon posted adjusted operating earnings of $0.43 per share and confirmed full-year guidance of $2.81 to $2.91. Management aims to land “at the midpoint or better.” Jeanne Jones said the third quarter should represent about 27% of that midpoint.
Storms, weather, and a PECO employee strike in early July shaped that outlook. ComEd alone faced 16 major weather events. Exelon also withdrew its PECO rate case without cutting planned capital.
The stock rose 9.17% over the past month and 4.74% year to date, but remains down 3.24% over the past year. Analysts lowered their third-quarter EPS average from $0.8746 90 days ago to $0.7951.
Wall Street Expects a Lighter Third Quarter
| Metric | Consensus | Year-Ago Actual | YoY Change |
|---|---|---|---|
| Q3 2026 EPS | $0.7951 | $0.86 | -7.5% |
| Q3 2026 Revenue | $6.82B | $6.705B | +1.7% |
| FY 2026 EPS | $2.8567 | $2.77 | +3.1% |
| FY 2026 Revenue | $25.5B | $24.26B | +5.1% |

Gigawatts Must Turn Into Signed Contracts
Transmission is the hidden driver. Exelon cut its data center pipeline to 36 gigawatts from 43 gigawatts after a stricter review, yet kept its $41 billion capital plan through 2029 unchanged. 4 gigawatts carry signed transmission security agreements supported by $1 billion of collateral. The focus turns to how much of the remaining 25 gigawatts under review changes into secured commitments.
Management also sees a $12 billion to $17 billion transmission opportunity beyond the plan. Two MISO Tranche 2.1 bids with Invenergy should get answers in the fourth quarter, and a 500-megawatt New Jersey battery project adds about $1 billion not yet in the plan.
PJM’s strain supports the case. Capacity prices cleared at the $330 per megawatt-day cap for a third straight auction, and PJM’s simulation showed ComEd clearing near $777 without it. Regulatory timing is another factor to watch: an order on ComEd’s $15.3 billion grid plan is expected by December 15, while BGE’s $156.1 million request waits a January 2027 decision.
Funding risk looks contained. Exelon completed about 86% of its 2026 debt financing and priced all 2026 equity needs.
Why Transmission Could Re-Rate This Utility
Exelon beat EPS estimates in every quarter from Q2 2024 through Q4 2025, and a softer third quarter already sits in consensus. The path toward $50 runs through rate base. If management turns more of the pipeline into signed, collateral-backed load and holds growth near the top of its 5% to 7% range, I think investors will start valuing Exelon as a grid growth story.

Got $1,000? Before You Buy EXC, Read This
If you have cash sitting in your account right now, give this two minutes. After more than two decades of helping investors beat the market, our top analysts at 24/7 Wall St. put together a definitive report on the Top 10 Stocks To Buy Today. And EXC wasn’t one of them.
They combed the entire market. It's not 10 ideas, not 10 stocks everyone is talking about, it's what their research points to as the 10 best stocks to buy right now, and it's free. Read more here and see which stocks made the list –>>
The post The Hidden Catalyst That Could Send Exelon Stock Back to $50 on Oct. 30 appeared first on 24/7 Wall St..
]]>Social Security benefits rise 3.6% under the cost-of-living adjustment taking effect in 2027. The raise is applied to the check each retiree already gets, so it helps the benefit keep up with prices. It does nothing for the savings in a brokerage account. To grow your income alongside that benefit, you need dividend payers whose cash flow can support a steady, rising payout. Each of the three stocks below yields more than the COLA figure, and each passed a coverage check before yield was considered.
First, a COLA and a yield measure different things, as a COLA is a percentage increase on a benefit you already receive. On a hypothetical $2,000 monthly check, a 3.6% adjustment adds $72 a month. A dividend yield is the cash a stock pays each year divided by its current share price, and a yield alone can’t tell you whether the payout will grow or even last. So the COLA works here as a reference point for how fast a retiree’s income is rising, and each dividend still has to be judged on whether the business can pay for it.
PepsiCo: Global Brands Funding a Dividend That Has Risen Every Year in the Record
PepsiCo (NASDAQ:PEP) sells snacks, foods and drinks in more than 200 countries and territories. Its brands include Pepsi, Lay’s, Doritos and Gatorade. At $136.28, the stock yields 4.13%. Part of that yield comes from a falling share price. The stock is down 6.41% over the past year and trades well below its 52-week high of $166.41.
Dividend safety: PepsiCo paid $5.80 per share in dividends against trailing EPS of $7.95, a payout ratio of about 73% of earnings. Free cash flow coverage is lower. The free cash flow yield of 4.15% roughly matches the dividend yield, so the business generates about enough free cash to pay its dividend. Management plans to return $8.9B to shareholders this year, including $7.9B in dividends. It is also targeting free cash flow conversion of at least 80%. Debt is manageable: operating earnings cover interest expense 10.26x.
Track record: PepsiCo’s dividend history goes back to 1999, and the quarterly payout steps up every year in that record. The latest quarterly payment is $1.48, up from $1.4225. That sets the forward annual dividend at $5.92.
Bull case: International growth is making up for a weak U.S. snack business. In the latest quarter, adjusted EPS of $2.34 beat the $2.30 estimate. Revenue rose 5.6% to $25.27B, and LatAm Foods grew 14%. People keep buying chips and sports drinks in a downturn, which gives retirees a steady source of cash to lean on.
Risk: North American snacks remain under pressure. Core operating profit in that segment fell 12%, and rising input costs led management to cut its core EPS growth outlook to 2.5% to 3.5%. Slower earnings growth could mean smaller dividend raises.
Realty Income: Monthly Checks With an A-Rated Balance Sheet Behind Them
Realty Income (NYSE:O) is a real estate investment trust that owns over 15,500 properties. It rents them to 1,798 clients across 92 industries, mostly on long-term net rents where tenants cover taxes, insurance and maintenance. At $57.05, the stock yields 5.43%. That yield isn’t the result of a falling price, since the shares are roughly flat over the past year (down 0.05%).
Dividend safety: For a REIT, adjusted funds from operations (AFFO) is the right measure of coverage, because accounting depreciation makes GAAP earnings look smaller than the cash coming in. Second-quarter AFFO was $1.09 per share, against $0.8115 in dividends paid. That works out to a payout of about 74% of AFFO. The free cash flow yield of 7.18% sits above the dividend yield. The balance sheet has A-range credit ratings from all three major agencies: Moody’s A3, S&P A- and Fitch A. Net debt is 5.4x adjusted EBITDAre. Occupancy stands at 98.8%.
Track record: Realty Income has raised its dividend for 115 consecutive quarters and is part of to the S&P 500 Dividend Aristocrats index. Its dividend record shows a payment every month from 1999 onward, with the payout rising from $0.17 to $0.2715. The forward annual dividend is $3.258.
Bull case: Monthly payments match how retirees pay their bills. We rounded up seven of our favorite monthly payers in a free report here. The company keeps adding properties: it invested about $2.6B in the second quarter at a 7.3% initial cash yield. On re-leased properties, it recovered 102.7% of prior rent. A $6B hyperscale data center joint venture adds a new source of rent alongside retail and industrial.
Risk: Tenant credit quality. About 65.7% of annualized base rent comes from tenants without investment-grade ratings. A run of retail bankruptcies would put pressure on AFFO.
Verizon: The Biggest Yield in the Group, Covered Comfortably by Free Cash Flow
Verizon (NYSE:VZ) provides wireless and broadband service to roughly 94.1 million postpaid phone connections and about 17.1 million broadband connections. The stock yields 6.18%, which puts it in ultra-high-yield territory. The yield is high even after a strong run: the shares are up 25.36% over the past year to $45.07. The stock trades at about 9x forward earnings.
Dividend safety: Free cash flow reached $6.43B in the second quarter, up 27.1% from a year earlier. The quarterly dividend of $0.7075 across 4,154,775,000 shares costs about $2.94 billion, roughly 46% of that quarter’s free cash flow. That leaves room for buybacks: Verizon had bought back $3.5B of stock through the second quarter. Net unsecured debt is 2.5x adjusted EBITDA.
Track record: Verizon’s quarterly payout has risen every year in its dividend history from $0.46 in 2009 to the current $0.7075. The forward annual dividend is $2.83.
The bull case: the core business is gaining strength. Verizon gained 184,000 postpaid phone customers, compared with a loss of 9,000 a year earlier. Postpaid phone churn, the share of customers who leave, improved to 0.92% from 0.97%. Adjusted EBITDA margin expanded to 40.1%. The Frontier Communications acquisition raised fiber connections to about 10.9M. Adjusted EPS of $1.30 beat the $1.27 estimate. Phone and internet bills get paid in any economy, and that is what funds this dividend.
Risk: Debt. Total unsecured debt stands at $136.5B. Leverage rose to 2.5x from 2.2x at the end of last year after the Frontier deal. Higher refinancing costs could reduce the cash available for dividend raises. Verizon appears on Barron’s list of stocks to watch this week. That makes its next quarterly update the first check on that leverage trend.
Income That Grows Alongside Your Benefit
These three names suit retirees who want income from three different sources: everyday consumer brands, monthly rent checks and telecom bills. Realty Income offers the strongest coverage, with an A-rated balance sheet and monthly payments. Verizon has the highest yield and the largest free cash flow surplus. PepsiCo has the longest annual raise record in its dividend history, though its free cash flow covers the payout more narrowly than the other two. Together, they give a portfolio cash payouts that each business can fund, working alongside a Social Security check that rises with the COLA.
Got $1,000? Before You Buy PEP, Read This
If you have cash sitting in your account right now, give this two minutes. After more than two decades of helping investors beat the market, our top analysts at 24/7 Wall St. put together a definitive report on the Top 10 Stocks To Buy Today. And PEP wasn’t one of them.
They combed the entire market. It's not 10 ideas, not 10 stocks everyone is talking about, it's what their research points to as the 10 best stocks to buy right now, and it's free. Read more here and see which stocks made the list –>>
The post 3 Quality Dividend Stocks Yielding More Than the 3.6% Social Security COLA appeared first on 24/7 Wall St..
]]>A hypothetical father in a second marriage plans to leave his $700,000 house to his three children, while his 61-year-old wife keeps the right to live there for the rest of her life. Estate lawyers call this a life estate as she becomes the life tenant, and the children are the remaindermen, meaning they take full ownership when her right ends. Blended families often use this setup because it appears to protect both sides.
The arrangement can also go wrong, as a California attorney describes in a case where a mother’s trust let her husband of almost 30 years live in her home for life at the trust’s expense. If he moved, the trust would pay for “similar housing.” He moved out and remarried within 90 days, which left the daughter, who was serving as trustee, to handle the dispute.
A Wait That Could Outlast the Kids’ Careers
The main tension here is time. At 61, the wife could live in the house for decades, while the children could be close to retirement before they inherit. For all that time they own an interest they cannot live in, cannot easily sell, and cannot readily borrow against.
The other thing is that the asset is still gaining value while they wait. The Case-Shiller national home price index rose about 2% over the past year and is at the top of its recent range. That growth goes to the children on paper, while the wife lives with the day-to-day costs.
Federal Tax Is the Smaller Issue
Federal estate tax applies only to larger estates and is another piece of the puzzle. The basic exclusion for people who die in 2026 is $15,000,000. Basis matters more. Property included in a decedent’s gross estate generally receives a new basis at death under 26 U.S.C. § 1014(b)(9).
Putting the life interest in a trust adds another option. A spouse with a “usufruct interest for life” (the right to use the property) can qualify for the marital deduction if the executor makes a QTIP election under 26 U.S.C. § 2056(b)(7). The house is then included in her estate under 26 U.S.C. § 2044(a). In practice, the children’s taxable gain on a later sale is measured from the home’s value at her death instead of at their father’s death, which can be decades of growth.
Who Pays for the Roof Decides Whether It Works
Under one Texas guide, the life tenant pays property taxes, mortgage interest, and routine upkeep, while the children cover mortgage principal and major repairs such as roof or foundation work. Three siblings could be asked to share a large repair bill on a house they cannot use, sometimes while their stepmother lives in it.
Her own cash flow matters too. At 65, she will pay Medicare Part B premiums, which are a standard $202.90 a month in 2026, plus a $283 deductible. If the house is most of what she has, keeping up taxes and maintenance may strain her budget. A run-down house also hurts the children’s inheritance.
Bare Life Estate vs. Residence Trust: Cost and Flexibility Trade-Offs
A bare life estate in a deed or will costs the least and offers the least flexibility. If she needs assisted living at 80, a sale usually requires agreement from her and all three children. It says nothing about what happens if she remarries or moves away. For many families, this structure leaves more questions open.
A residence trust with written rules costs more to set up and prevents most predictable fights. The terms that do the most work:
- Expense division. Say exactly who pays property taxes, insurance, routine repairs, and capital items, so nobody has to rely on default state law.
- Sale-and-replace clause. Allow the trustee to sell the house and buy a smaller home or fund senior housing for her, with the leftover proceeds staying in trust for the children.
- Defined end triggers. Spell out whether remarriage, cohabitation, or a long non-medical absence ends her right, so the 90-day remarriage situation has a clear answer.
- Independent trustee. A corporate trustee or a neutral relative keeps the children from having to police their stepmother.
- Maintenance reserve. Set aside cash, or name the trust as the beneficiary of a life insurance policy, so major repairs don’t depend on what the siblings can afford.
Life insurance payable directly to the children also gives them something at their father’s death, which takes pressure off the long wait. Most estate messes in blended families come down to a missed form or an outdated beneficiary, and we put the full cleanup checklist in a free guide here.
Testing Whether She Can Carry the House for Decades
A useful early test is whether the wife can carry the house on her own income for 20 years or more. If she can’t, the plan needs a funded reserve or a planned downsizing path.
A frequent source of conflict is a one-line life estate clause with one of the children named as trustee. It’s worth paying for local legal drafting here. In Texas, for example, a surviving spouse’s homestead rights come from the Texas Constitution, so state law can override what the father’s documents say.
Learn 7 Ways To Generate Income With A $1,000,000+ Portfolio
If you’ve saved over $1,000,000, this guide is for you. The last thing you want in retirement is to run out of money, you want your money to generate lasting income while you enjoy your life.
Now you can learn the strategies wealthy retirees use to fund their retirement with The Definitive Guide to Retirement Income from Fisher Investments. Download the guide today! (sponsor)
The post Dad Will Leave His Three Kids the $700,000 House and His Second Wife the Right to Live in It for Life. She’s 61 appeared first on 24/7 Wall St..
]]>Cameco (NYSE:CCJ) reports third-quarter results on Thursday, October 30. The uranium producer has missed estimates five quarters in a row, and its shares sit near a 52-week low. This report will test whether a premium valuation can survive more operational issues.
A Rough Q2 Collides With Record Uranium Prices
In Q2, Cameco posted EPS of $0.13, missing the $0.26 consensus. Westinghouse, where Cameco holds a 49% interest, recorded a $10 million net loss on purchase price amortization and financing costs.
In the July release, CEO Tim Gitzel said the results “reflect normal quarterly variability.” He kept the annual production outlook unchanged even though flooding disrupted northern Saskatchewan supply routes.
The market has shown less patience. Shares trade at $79.39, down 12.57% over the past month and 13.23% year to date. That leaves the stock just above its 52-week low of $76.92, even as the long-term uranium contract price rose to a record $96.50/lb.
Consensus Expects a Sharp Rebound From a Weak Comparison
| Metric | Consensus | Prior-Year Actual | YoY Growth |
|---|---|---|---|
| Q3 2026 Normalized EPS | $0.2727 | $0.0502 | 443.2% |
| Q3 2026 Revenue | $753.9M | $440.8M | 71.0% |
| FY2026 EPS | $1.4467 | $1.0328 | 40.1% |
| FY2026 Revenue | $3.48B | $2.497B | 39.5% |

Key Lake, Cigar Lake and Westinghouse Will Set the Tone
Analysts have already cut their numbers. The Q3 EPS consensus of $0.2727 compares with $0.3521 90 days ago, and individual estimates run from $0.0800 to $0.3800. A spread that wide tells me the Street has limited visibility into operations.
First, I’ll be watching mine performance. Key Lake ran an extended Q3 maintenance shutdown to install new infrastructure. Cigar Lake only recently resumed shipping stockpiled ore after acid plant problems at Orano’s McClean Lake mill. Management has to show that the 19.5M to 21.5M lb production range still holds.
Second, Westinghouse. Management guided for a weak first half followed by a stronger second half, so Q3 should start to show that recovery. Progress on the $120 billion U.S.-South Korea framework for up to eight Westinghouse reactors would carry real weight. So would follow-through on the Energy Department’s conditional commitment to support AP1000 deployment. The reactor restart trade reaches well beyond Cameco, and we picked five ways to play it, utilities and fuel included, in a free nuclear report.
Third, you should look at pricing. Market-related contracts made up 69% of Q1 revenue, compared with 51% a year earlier. With 230M lbs already committed under long-term contracts, any new deals signed at record term prices would strengthen the outlook for 2027.
Performance Has to Catch Up to an 89x Multiple
Cameco trades around 89x trailing earnings, 52x forward earnings and 68x EV/EBITDA. Analysts remain bullish, with 8 Strong Buy ratings, 11 Buy ratings and a $125.60 average target. Still, the shares fell on each of the last five earnings days. A clean quarter with guidance intact would give the nuclear story fresh credibility. Another miss would show how much patience that premium can still buy.

Got $1,000? Before You Buy CCJ, Read This
If you have cash sitting in your account right now, give this two minutes. After more than two decades of helping investors beat the market, our top analysts at 24/7 Wall St. put together a definitive report on the Top 10 Stocks To Buy Today. And CCJ wasn’t one of them.
They combed the entire market. It's not 10 ideas, not 10 stocks everyone is talking about, it's what their research points to as the 10 best stocks to buy right now, and it's free. Read more here and see which stocks made the list –>>
The post Can Cameco’s 89x Premium Valuation Survive Another Big Miss on Oct. 30? appeared first on 24/7 Wall St..
]]>The top of the S&P 500 yield table is where income investors go looking first, and it is also where the market prices in its worries. A big yield often signals a share price that has fallen because investors expect a dividend cut. The four index members below clear a stricter test: each funds its dividend from cash the business generates, with a balance sheet that can carry it. The group’s highest payer, Verizon Communications (NYSE: VZ), yields 6.18%, and its free cash flow covers that payout with room to spare.
Verizon Communications: Free Cash Flow Covers the Biggest Yield Here
Verizon is one of the largest U.S. wireless and broadband carriers and a component of the Dow Jones Industrial Average. At 6.18%, it is the only ultra-high-yield name on this list. That yield comes with a rising share price: the stock trades at $44.78, up 24.56% over the past year, and still trades at about 9 times forward earnings.
Coverage: In the second quarter, Verizon generated $6.43 billion of free cash flow, up 27.1% year over year, against $2.954 billion in dividends paid. For full-year 2025, operating cash flow of $37.137 billion minus capital spending of $17.461 billion left $19.676 billion of free cash flow, against $11.481 billion in dividends. Even after the payout, the company completed $3.5 billion of buybacks through the first half.
Track record: The quarterly dividend is now $0.7075 per share. It has risen every year since 2019, climbing in steps from $0.6025.
Why the payout holds: The business is gaining momentum. Verizon added 184,000 postpaid phone subscribers in the second quarter, compared with a loss of 9,000 a year earlier, and its fiber broadband base reached 10.9 million. The shares were rising in premarket trading Monday after a subscriber surge impressed Wall Street. Adjusted EBITDA margin widened to 40.1% from 37.1%.
Risk: The Frontier acquisition added debt. Total unsecured debt stands at $136.5 billion, and net unsecured debt to adjusted EBITDA rose to 2.5x from 2.2x at the end of last year. Paying that down will compete with dividend growth for cash, so expect small raises.
Realty Income: A Monthly Check That Rising Rates Have Discounted
Realty Income (NYSE: O) is a real estate investment trust (REIT) that owns free-standing, single-tenant commercial properties in the United States, Puerto Rico, and the United Kingdom on net leases, where tenants cover most property costs. It pays monthly and yields 5.67%, which makes it a high-yield name.
Part of that yield comes from a lower share price. The stock sits at $56.91, below its 52-week high of $66.25 and its 200-day average of $61.69. The pullback followed a rise in Treasury yields that raised the cost of capital for rate-sensitive landlords. Over the same stretch, occupancy held at 98.8%.
Coverage: REITs measure dividend capacity with adjusted funds from operations (AFFO), a cash-earnings figure that adds back depreciation. Second-quarter AFFO was $1.09 per share, against monthly dividends that totaled $0.8115 for the quarter. Full-year AFFO guidance of $4.44 to $4.45 per share sits well above the $3.252 annualized dividend. On a market-price basis, the 7.18% runs ahead of the dividend yield.
Track record and balance sheet: The second-quarter raise was the company’s 115th consecutive quarterly dividend increase, and the next monthly payment is $0.2715. Realty Income carries a Fitch “A” rating with a stable outlook, and net debt runs at 5.4x annualized pro forma adjusted EBITDAre.
Why the payout holds: Thousands of leases spread the risk, rent recapture on re-leased properties came in at 102.7%, and new growth channels include a $6 billion hyperscale data center joint venture.
Risk: Tenant credit. About 65.7% of annualized base rent comes from non-investment-grade tenants, and credit-loss provisions reached $46.4 million in the first half. A retail downturn would show up here first.
Altria Group: Tobacco Cash Flow That Keeps Funding Raises
Altria Group (NYSE: MO) sells Marlboro cigarettes in the U.S. and a growing line of smoke-free products, including on! nicotine pouches and NJOY vapes. It yields 5.57%, a high yield that has held up even as the stock climbed 35% this year to $74.24.
Coverage: Tobacco needs very little reinvestment. In 2025, operating cash flow of $9.29 billion minus capital spending of $216 million left $9.074 billion of free cash flow, against $6.96 billion in dividends. Quarterly cash flow swings with tax and settlement timing. Second-quarter operating cash flow was $719 million, following the same seasonal dip as a year earlier at $205 million, so the full year is the right lens. Second-quarter adjusted EPS of $1.48 also cleared the $1.06 quarterly dividend paid at the time.
Track record and balance sheet: Altria has raised its quarterly dividend every year since 2009, from $0.32 to the current $1.11, with the latest increase from $1.06. Stockholders’ equity is negative at -$2.62 billion, a result of years of buybacks and dividends, while cash stands at $2.37 billion.
Why the payout holds: Pricing power, the smokeable segment runs an adjusted operating margin of about 65%, and Altria returned nearly $3.9 billion to shareholders in the first half.
Risk: Shrinking volume. Domestic cigarette industry volumes are falling about 5%, and Marlboro’s retail share slipped to 39.5%. Price increases can offset that for years, but not forever.
Kinder Morgan: The Lowest Yield With the Strongest Momentum
Kinder Morgan (NYSE: KMI) is one of the largest energy infrastructure companies in North America, moving natural gas through pipelines and charging fees that work like tolls. It yields 3.51%, the lowest here, because the stock gained 35.86% over the past year to $34.28. A rising price pulls the yield down, which is the healthy way for a yield to shrink.
Coverage: Second-quarter free cash flow of $978 million covered $665 million in dividends. For 2025, operating cash flow of $5.917 billion minus capital spending of $3.026 billion left $2.891 billion, above the $2.604 billion paid out.
Track record and balance sheet: The quarterly dividend has risen every year since 2019, from $0.25 to the current $0.2975, which the board declared again for the next payment. Net debt to adjusted EBITDA sits at 3.6x, and Moody’s upgrade to Baa1 puts the company at a BBB+ equivalent across all three agencies.
Why the payout holds: Demand for gas is climbing. The $9.6 billion project backlog is 92% natural gas, with more than 60% tied to power generation and utility demand, including data centers and LNG exports. Cheap natural gas could benefit pipeline operators like Kinder Morgan by encouraging more use.
Risk: Construction spending is eating into the cushion. In the third quarter, operating cash flow of $1.59 billion minus capital spending of $1.045 billion left $545 million, short of the $665 million dividend. Full-year coverage remains intact, but watch whether new projects start producing cash on schedule.
Where These Four Fit in a Retirement Income Plan
Each pays out less cash than it brings in, and each has raised its dividend steadily for years. Verizon offers the most current income, Realty Income the most frequent paycheck, Altria the fastest raises, and Kinder Morgan the most growth behind a smaller yield. Together, they suit retirees and near-retirees who want reliable, rising checks from businesses that pay dividends from operating cash rather than borrowed money. They don’t suit anyone hunting for the highest number on a yield screen.
Got $1,000? VZ Made Our Top 10 List. Here's Who Else Did
If you have cash sitting in your account right now, give this two minutes. After more than two decades of helping investors beat the market, our top analysts at 24/7 Wall St. put together a definitive report on the Top 10 Stocks To Buy Today. And VZ was one of them.
They combed the entire market. It's not 10 ideas, not 10 stocks everyone is talking about, it's what their research points to as the 10 best stocks to buy right now, and it's free. Read more here and see which stocks made the list –>>
The post 4 of the Highest Yields in the S&P 500 That Are Actually Covered appeared first on 24/7 Wall St..
]]>If you are at or near retirement, the dividend that matters most is the one that keeps arriving and keeps growing through recessions, lawsuits and bear markets. Chasing the biggest yield often means owning a business that strains to pay it, while durable companies whose free cash flow covers the check with room to spare can let their raises compound for decades. The two S&P 500 members below both qualify, and one of them has raised its payout for 70 consecutive years.
Johnson & Johnson
Through its Innovative Medicine and MedTech divisions, Johnson & Johnson (NYSE:JNJ) makes prescription drugs and medical devices. That spread across cancer drugs, immunology, neuroscience, heart devices, surgical tools and contact lenses is the source of its durability: when one product loses patent protection, dozens of others carry the load. The company now has 29 products and platforms generating at least $1 billion in annual sales, and its chief executive said on the latest earnings call that J&J is on track to "exceed $100 billion in annual revenue for the first time in our company’s 140-year history."

Dividend Safety Check for J&J
Yield: At a recent price of $265.78, the $1.34 quarterly dividend ($5.36 annualized) works out to a forward yield of about 2.02%, with a trailing yield of 1.97%. That is modest current income, but it is income that rises every year.
Coverage: Management guides to $21 billion of free cash flow this year. Paying $5.36 a share across all outstanding shares costs roughly $12.9 billion a year, or about 61% of that free cash flow. Measured against the adjusted EPS guidance midpoint of $11.10, the payout ratio is about 48%. GAAP earnings look far worse: third-quarter diluted EPS was $0.09 versus $2.12 a year ago, after roughly $7 billion in charges tied to a proposed talc settlement and two pipeline deals. That explains the trailing P/E of 40 next to a forward P/E of 21. Dividends are paid from cash, and the quarter still produced more than $6 billion of free cash flow.
Balance sheet: J&J ended the third quarter with about $17 billion of cash and marketable securities against roughly $45 billion of debt, for net debt near $28 billion. Full-year net interest expense guidance is only $150 million to $200 million, and the company’s profile notes it is one of only two U.S.-based companies with a AAA credit rating.
Track record: In April the board lifted the quarterly dividend 3.1% from $1.30 to $1.34, marking the 64th consecutive year of increases, well past the 50-year bar for Dividend King status. The payment history backs it up: the quarterly rate stepped from $1.01 in 2020 to $1.06, $1.13, $1.19, $1.24 and $1.30 in the following years before reaching today’s $1.34. The next $1.34 payment goes out December 8 to holders of record on November 24.
Why J&J Can Anchor an Income Portfolio for Decades
The growth engine is accelerating. Oncology sales grew about 17% last quarter, Tremfya rose 68.2% and Rybrevant climbed 64%, more than offsetting biosimilar losses on older drugs. Management says it sees a path to double-digit growth by the end of the decade without assuming any acquisitions. Raising the payout sits inside the company’s stated priorities, with the CFO describing capital allocation "centered on prioritizing investments that support key commercial launches, accelerate future innovation, increase our annual dividend." With a beta of 0.206, the shares have also historically moved far less than the broader market, a useful quality for a retiree who depends on stable income.
What Would Break the J&J Case
Talc litigation is the threat to watch. The proposed $5.5 billion ovarian talc resolution depends on participation from at least 95% of claimants. If that threshold fails and the cases drag on with larger judgments, cash that would otherwise fund future raises gets diverted to litigation, and while a dividend this well covered can absorb a lot, a long, open-ended legal bill is the scenario that would slow the streak.

Procter & Gamble
Procter & Gamble (NYSE:PG) sells the things households replace every week no matter what the economy does: Tide, Pampers, Gillette, Charmin, Dawn, Crest, Pantene, Olay and SK-II, organized into five divisions. Demand is strengthening. In the first quarter of fiscal 2027, organic sales rose 4.0%, all 10 product categories grew, and core EPS of $2.00 beat the $1.89 consensus, the sixth consecutive quarter P&G exceeded expectations. The Thorne acquisition, which closed October 1, adds a health and wellness brand to the portfolio.
Dividend Safety Check for P&G
Yield: At $161.25, the $1.0885 quarterly dividend ($4.354 annualized) yields about 2.70% on a forward basis, with a trailing yield of 2.61%.
Coverage: P&G generated $15.835 billion of free cash flow in fiscal 2026, up 12.74%, on $19.556 billion of operating cash flow. Its plan to pay over $10 billion in dividends this fiscal year equals around 63% of that free cash flow. Against the core EPS guidance midpoint of $7.00, the payout ratio is about 62%. The latest quarter shows the same buffer: $4.401 billion of free cash flow against $2.6 billion of dividends paid.
Balance sheet: Cash and equivalents reached $15.365 billion at quarter end, up 37.54% from a year earlier, with $55.337 billion of shareholders’ equity. The company is confident enough in that position to plan a combined $15 billion return to shareholders this fiscal year. In management’s words: "We expect to pay over $10 billion in dividends and to repurchase approximately $5 billion of common stock."
Track record: P&G highlights its 70th consecutive year of dividend increases and 136th consecutive year of dividend payments since incorporating in 1890. Payments confirm the steady climb, from $0.7907 a quarter in early 2021 through $0.8698, $0.9133, $0.9407, $1.0065 and $1.0568 to today’s $1.0885. The next payment arrives November 16.
Why P&G Can Keep Funding Dividend Raises for Decades
Few businesses are this woven into daily life. P&G’s scale gives it a productivity machine that funds reinvestment and the dividend at the same time: it delivered $2.8 billion of productivity savings last fiscal year. Growth is broadening, with Greater China organic sales up 8% and Europe up 4%. A beta of 0.377 reflects how little the stock tends to swing with the market, and the valuation trades at a forward P/E of 21 after the shares gained 10.14% over the past month.
What Would Break the P&G Case
A extended margin squeeze. This fiscal year’s outlook absorbs about $1.4 billion in after-tax commodity costs, and combined input costs and below-the-line items amount to roughly $1.9 billion, or 79 cents per share. Core gross margin already fell 150bps year over year. Management warned, "We expect these headwinds to increase in the next few quarters." If consumers push back on price increases for years rather than quarters, earnings would stall and the annual raises would likely shrink toward token size.
Two Dividend Kings Built for the Long Haul
Both carry balance sheets that can absorb a bad year. Johnson & Johnson and P&G pay their dividends out of roughly 60% of free cash flow and have raised their payouts for 64 and 70 straight years. Each faces a real threat, litigation for J&J and cost inflation for P&G, and each has the cash to work through it, so for a retiree building an income stream meant to outlast market cycles, these two durable, growing payers offer long records worth studying closely.
Got $1,000? Before You Buy JNJ, Read This
If you have cash sitting in your account right now, give this two minutes. After more than two decades of helping investors beat the market, our top analysts at 24/7 Wall St. put together a definitive report on the Top 10 Stocks To Buy Today. And JNJ wasn’t one of them.
They combed the entire market. It's not 10 ideas, not 10 stocks everyone is talking about, it's what their research points to as the 10 best stocks to buy right now, and it's free. Read more here and see which stocks made the list –>>
The post 2 Safe S&P 500 Dividend Stocks Boomers Can Buy and Hold Forever appeared first on 24/7 Wall St..
]]>Rocket Lab (NASDAQ:RKLB) trades at $52.60. The consensus price target sits at $102.15, meaning roughly 94.2% upside.
Rocket Lab flies Electron rockets and HASTE hypersonic test vehicles, builds spacecraft, and is developing Neutron, a reusable medium-lift rocket. Wall Street has followed the company closely because of its record backlog of $2.36 billion, which grew 137% year over year. Other attractions include an $816M Space Development Agency contract and the pending Iridium Communications (NASDAQ:IRDM) acquisition, which Iridium stockholders have approved.
The high end of Wall Street goes further. Trevor Walsh at Citizens JMP previously held a Street-high target near $130.00. From today’s price, that target works out to about 147% upside.
Neutron Slips to 2027 and Drags the Stock Down
The main reason for the selloff was a delay. Rocket Lab said Neutron’s first launch had slipped to 2027 after it had been targeted for the fourth quarter. The stock fell as much as 14% during that session and closed down 6.6%. Chief executive Peter Beck blamed manufacturing issues in the first stage’s forward propellant dome. He added, “Possible success isn’t our standard.”
Selling continued after that. Shares dropped almost 8% in a single session to $50.84 during a multi-day losing streak. The stock is down 25.19% over the past month and 21.42% over three months. With a beta of 2.938, swings this large are normal for Rocket Lab.
Earnings revisions point the same way. Second-quarter GAAP EPS of -$0.08 missed the -$0.0767 consensus. Over the past 90 days, the 2027 EPS consensus fell from -$0.0273 to -$0.0912. Dilution also weighs on the shares: the company raised $1.53B through at-the-market sales in the first half.
16 of 20 Analysts Still Rate It a Buy
Of the 20 analysts covering Rocket Lab, four give a Strong Buy rating, 12 rate it Buy and four rate it Hold. Nobody rates it Sell. Gregory Pendy at Clear Street currently maintains a target of up to $129.00, representing approximately 145% upside.
Three factors drive the optimistic view. First, Neutron becomes the main commercial alternative to SpaceX’s Falcon 9. Second, Space Systems grows its higher-margin business. Third, Rocket Lab shows it can win and deliver as a defense prime contractor. Early evidence supports this. Non-GAAP gross margin rose to 41.5% from 36.9%, and the adjusted EBITDA loss narrowed to $8.8M from $27.6M.
Analysts watching for near-term catalysts will look first at third-quarter revenue guidance of $250M to $265M and more than $1B in contracts already signed. Consensus revenue rises from $959.2 million this year to $1.33 billion next year. Defense spending helps too. The FY 2027 Space Force request is $71.2 billion, Golden Dome is budgeted at $17.9 billion, and Rocket Lab is listed as a prime contractor for national security launch. Price targets are opinions with no guarantee attached. Several were probably set before the Neutron delay.
Space Stocks Are Falling Together, and Planet Labs Shows the Most Upside
Rocket Lab’s closest peers dropped just as hard.
AST SpaceMobile (NASDAQ:ASTS) trades at $39.79, down 35.63% in a month. Its target of $74.68 meaning 87.7% upside, a bit less than Rocket Lab’s. Analysts are split: seven of 14 rate it Hold and two rate it a Sell.
Planet Labs (NYSE:PL) trades at $13.41, down 23.06% in a month. Its target of $30.27 meaning 125.7% upside. Seven of its 11 analysts rate it a Buy or Strong Buy, and none rate it Sell.
Planet Labs has the most consensus upside of the three. Rocket Lab sits in the middle on upside but has the strongest Buy consensus.
Down 24.6% While the S&P 500 Is Up 11.45%
At $52.60, Rocket Lab has 94.2% implied upside to the $102.15 consensus of 20 analysts. Year to date, the stock is down 24.6%, while the S&P 500 is up 11.45%.
Shares trade well below their 200-day moving average at $80.59 and far below the 52-week high of $151. The price-to-sales ratio still sits at 43.73 after the decline.
Neutron Will Decide Whether the 147% Call Pays Off
I’d find Rocket Lab compelling here if Neutron flies smoothly early in 2027, the backlog turns into revenue on time, and the Iridium deal adds communications revenue without more heavy dilution. If all three happen, analysts in the $130 range have a credible path.
The risk profile worsens sharply if Neutron slips again. Another delay would leave a company that still posts GAAP losses trading at more than 40 times sales, while it integrates acquisitions and keeps selling stock to fund them.
The outlook leans cautiously positive. The defense demand looks real and margins are improving. Still, the 147% call depends on Neutron flying, and Rocket Lab has now pushed back the Neutron timeline. A successful first flight would shrink the risk quickly.
Got $1,000? Before You Buy RKLB, Read This
If you have cash sitting in your account right now, give this two minutes. After more than two decades of helping investors beat the market, our top analysts at 24/7 Wall St. put together a definitive report on the Top 10 Stocks To Buy Today. And RKLB wasn’t one of them.
They combed the entire market. It's not 10 ideas, not 10 stocks everyone is talking about, it's what their research points to as the 10 best stocks to buy right now, and it's free. Read more here and see which stocks made the list –>>
The post Rocket Lab Shed 25% Over 3 Months: 150% Returns Sure to Come According to This Wall Street Pro appeared first on 24/7 Wall St..
]]>Arm Holdings (NASDAQ:ARM) trades at $210.33, a price that sits 53.5% below its 52-week high of $452.70 while revenue keeps growing above 20%. A 36.75% one-month drop has sharply lowered the stock’s valuation on the AI CPU story.
Arm designs CPU architecture and licenses it to chipmakers. It collects upfront license fees and then a royalty on every chip its licensees ship, across phones, PCs, data centers, cars and IoT devices. In March 2026 it moved into production silicon with the Arm AGI CPU. The stock is still up 92.42% year to date. Its recent drop came during a broader semiconductor sell-off driven by fears that AI infrastructure spending may slow.
Royalties, Licensing and Silicon Are Compounding Together
All three of the bulls’ multipliers are working. Royalty revenue rose 22% to $715 million as Armv9 and Compute Subsystems carry higher rates per chip, and “data center royalties more than doubled year over year once again.” Licensing grew 23% to $574 million. Demand for the AGI CPU, which counts Meta Platforms (NASDAQ:META) as its lead partner, “now exceeds $2 billion.”
The earnings multiple also contracts quickly as profits grow. The forward P/E is 87x, and consensus EPS rises from $2.2295 this fiscal year to $3.0665 next year. Management estimates the CPU market at as much as $220 billion.
A 217x Trailing Multiple Leaves No Room for Misses
The stock trades at 217x trailing earnings. Last quarter’s GAAP EPS of $0.25 came in at that level, missing the $0.40 consensus expectations. Operating margin contracted to 7% from 11% as opex jumped 28% to $1.16 billion. Stock-based compensation alone reached $343 million.
First-generation AGI CPU gross margins should land in the “high 30% range, maybe low 40s,” far below the company’s 92.5% gross margin. Smartphone weakness, China exposure, SoftBank’s control and a Qualcomm (NASDAQ:QCOM) trial expected in Q4 calendar 2026 all add risk, and a beta of 3.79 magnifies it.
Silicon Margins Remain the Missing Piece
Management promised “a much more detailed update for both the revenue and margin profile” at its fiscal third-quarter report. Before then, the next quarterly report has a guide of $1.38 billion in revenue and $0.47 in non-GAAP EPS. Both reports will shape the silicon margin picture.
Analysts See 38% Upside After a Brutal Month
At $210.33, Arm trades well below the $290.70 average analyst target, suggesting 38.2% upside. Targets are one data point among many. Of 43 analysts:
- Strong Buy: 8
- Buy: 21
- Hold: 12
- Sell or Strong Sell: 2
Over the past month, Arm fell 36.75% while the S&P 500 slipped 1.02%. Over one year, Arm gained 26.25% against the index’s 13.13%.
Sell-Off Resets Arm’s Valuation as Estimates Keep Rising
At $210.33, Arm trades well below its 52-week high.
The drop reflects worries about the whole sector, while Arm’s own estimates keep moving up. Analysts made 24 upward revisions to this quarter’s EPS over the past 30 days, against just 1 downward revision. Data center royalties keep doubling, and Arm holds roughly 50% CPU compute share among top hyperscalers.
The next two quarterly reports are the catalysts. AGI CPU shipments begin around the end of calendar 2026, and investors get a margin roadmap at the fiscal third-quarter report. Management expects silicon margins to reach 50% within a couple of years (we reverse-engineered what the biggest chip winners looked like this early and put the pattern in a free playbook here).
The thesis breaks if AGI CPU margins remain below 40%, if hyperscaler capex cuts slow royalty growth, or if the Qualcomm verdict goes against Arm. Keep an eye on the stock around each earnings report.
Arm trades at 87x forward earnings after the stock has lost half its value while all three growth drivers keep expanding.
Got $1,000? Before You Buy ARM, Read This
If you have cash sitting in your account right now, give this two minutes. After more than two decades of helping investors beat the market, our top analysts at 24/7 Wall St. put together a definitive report on the Top 10 Stocks To Buy Today. And ARM wasn’t one of them.
They combed the entire market. It's not 10 ideas, not 10 stocks everyone is talking about, it's what their research points to as the 10 best stocks to buy right now, and it's free. Read more here and see which stocks made the list –>>
The post Bulls Insist Arm’s Trio of Multipliers Justify Its Sky High Valuation appeared first on 24/7 Wall St..
]]>Retirement income holds up best when the check grows every year, regardless of the economy. Dividend Kings have shown they can do that: they have raised their payouts for at least half a century through recessions, rate shocks, and bear markets. The four names below combine that record with cash flow that easily covers today’s dividend. Cincinnati Financial (NASDAQ:CINF) has the longest run in the group. Its most recent payment completed 66 consecutive years of increasing annual cash dividends. None of the four offers a big starting yield, so the income case depends on reliable payments and regular raises that build up over a long retirement.
Automatic Data Processing: 51 Straight Years of Raises Funded by Payroll Cash
Automatic Data Processing (NASDAQ:ADP) yields 2.16% at a share price of $304.16. It pays $1.70 per quarter, for an annualized forward dividend of $6.80. The board’s latest 10% increase marked the 51st consecutive year ADP has raised its quarterly dividend. Dividend records show the quarterly rate grows every year, from $0.07625 in 1999 to today’s level.
Coverage is the strongest part of the story. In fiscal 2026, ADP generated $5.44 billion in operating cash flow and spent only $196.6 million on capital projects. Dividends paid totaled $2,626.3 million, and the company still had enough cash for $2,083.3 million in buybacks. Full-year EPS of $11.12 easily tops the annual dividend rate. ADP also earns interest on client funds, with an average balance of $41 billion yielding 3.5%. It earns that income by holding payroll cash until it is paid out.
For income investors, ADP works like a toll booth on employment. Revenue reached $21.95 billion, up 6.74%. For fiscal 2027, management forecast revenue growth of 5% to 6% and adjusted EPS growth of 9% to 11%. Chief Executive Maria Black cited “strong Employer Services retention and record client satisfaction.” Shares are up 20.87% year to date and trade at 22 times forward earnings.
The risk to watch is hiring. Management expects pays-per-control growth (a measure of headcount at client companies) of only 0% to 1%, which points to a cooling job market. ADP’s latest National Employment Report showed private employers adding only 90,000 jobs. Fiscal first-quarter results are due October 28, and slower hiring would show up there first.
Cincinnati Financial: 66 Years of Raises Backed by Growing Bond Income
Cincinnati Financial yields 2.03% at $176.30 a share. Its quarterly dividend of $0.94 is up 8% from $0.87 a year earlier, bringing the annualized forward payout to $3.76. Dividend records show a higher payout every year since 1999, and the company’s latest dividend release puts its run at 66 consecutive years.
Trailing earnings of $21.18 per share are far above the $3.69 paid over the past 12 months. That EPS figure includes investment gains that rise and fall with the stock market, though. Investment income is a cleaner measure: it rose 12% pretax in the second quarter, and bond interest climbed 14%. Bond income keeps coming in no matter how bad storm season gets, which gives the dividend a regular base. Shareholders’ equity stands at $16.67 billion, or $108.68 in book value per share.
The stock trades at 8 times trailing earnings, 18 times forward estimates and 1.564 times book value. Chief Executive Stephen M. Spray pointed to “non-GAAP operating income of $554 million” for the first half. The company also added more than 200 new agencies over the same period, expanding its distribution. A beta of 0.528 suits retirees who want a calmer ride, and shares are up 15.76% over the past year.
The main risk is catastrophe losses. Second-quarter adjusted EPS of $1.43 missed expectations of $1.82. The combined ratio climbed to 100.8% from 94.9%, and Ohio catastrophe losses ran about 4x the five-year average. One bad storm season can wipe out a quarter’s underwriting profit.
Johnson & Johnson: 64 Straight Raises Backed by a AAA Credit Rating
Johnson & Johnson (NYSE:JNJ) yields 1.97% at $263.86. The board raised the quarterly dividend 3.1% to $1.34, continuing its record to 64 consecutive years of dividend increases. The forward annualized payout is $5.36.
Its finances are about as strong as it gets. J&J is one of only two U.S.-based companies with a AAA credit rating, which is higher than the U.S. government’s. It produced more than $6 billion of free cash flow in the third quarter alone and reaffirmed full-year free cash flow guidance of $21 billion. The company holds about $17 billion in cash and marketable securities against roughly $45 billion of debt. Chief Financial Officer Joseph Wolk listed the dividend among management’s top uses of cash: “Our disciplined approach to capital allocation is centered on prioritizing investments that support key commercial launches, accelerate future innovation, increase our annual dividend, and strengthen our pipeline.”
Growth is picking up. Third-quarter sales reached $25.4 billion, up 6%. Oncology grew about 17%, and Tremfya sales rose 68.2%. Chairman and CEO Joaquin Duato said the company is “on track to meet our guidance and exceed $100 billion in annual revenue for the first time in our company’s 140-year history.” One-time charges inflate the trailing P/E of 40, while the forward multiple is 21. Shares are up 40.15% over the past year.
Talc litigation remains the main risk. The proposed ovarian talc resolution is valued at $5.5 billion, and that charge, along with deal-related expenses, cut third-quarter reported EPS to $0.09, down from $2.59 adjusted.
Lowe’s: Six Decades of Quarterly Checks at a Marked-Down Price
Lowe’s (NYSE:LOW) pays 2.36%, the highest starting yield in this group. The board raised the quarterly dividend 4% to $1.25, for a forward annualized payout of $5. Lowe’s has paid a quarterly cash dividend since going public in 1961. Its own releases say only that it has raised the dividend for more than 25 consecutive years, while widely followed Dividend Kings lists include Lowe’s. Chief Financial Officer Brandon Sink described the payout as “reinforcing our commitment to returning capital to shareholders and our status as a dividend aristocrat.”
Cash flow covers the dividend many times over. Lowe’s generated $3.1 billion of free cash flow in the second quarter and paid $673 million in dividends. The stock trades at 14.57 times free cash flow, a free cash flow yield of 6.86%. Interest coverage is 6.65x, and adjusted debt-to-EBITDA is 3.0x. Management is working toward a 2.75 times target by mid-2027. Shareholders’ equity stands at -$7.44 billion because of years of heavy buybacks, so cash coverage is a better safety measure than book value.
The share price has fallen while the dividend kept growing. At $198.69, shares are down 15.81% year to date and well below the 52-week high of $288.04. They trade at 16 times forward earnings. Online sales rose 15.7% in the second quarter, and return on invested capital reached 25.5%. CEO Marvin Ellison expects a housing recovery to bring do-it-yourself shoppers back first, “with positive growth in all the investments we’ve made in our e-commerce business, in our DIY loyalty platform, in our fulfillment capabilities, and our customer service initiatives.”
The near-term risk is a weak housing market. Management expects third-quarter adjusted EPS to come in roughly 7% below the prior year as DIY demand stays soft and residential construction remains under pressure.
Four Kings, One Retirement Income Plan
Automatic Data Processing, Cincinnati Financial, Johnson & Johnson and Lowe’s earn a place in a retirement portfolio because their cash flow and earnings comfortably cover the dividend. Each has kept raising its payout through decades of downturns. Lowe’s posts the top starting yield after a rough year for the stock, and J&J brings a AAA balance sheet. ADP and Cincinnati Financial add growth linked to payrolls and bond income, so together the four provide an income stream built to grow every year.
If you want a longer list, we ranked ten Kings by valuation right now in a free report you can get here: 10 Dividend Kings to Buy Now and Hold Forever.
Got $1,000? Before You Buy JNJ, Read This
If you have cash sitting in your account right now, give this two minutes. After more than two decades of helping investors beat the market, our top analysts at 24/7 Wall St. put together a definitive report on the Top 10 Stocks To Buy Today. And JNJ wasn’t one of them.
They combed the entire market. It's not 10 ideas, not 10 stocks everyone is talking about, it's what their research points to as the 10 best stocks to buy right now, and it's free. Read more here and see which stocks made the list –>>
The post Forget Chasing High Yields: These 4 Dividend Kings Play the Long Game appeared first on 24/7 Wall St..
]]>I keep adding to Microsoft (NASDAQ:MSFT) every quarter, and each earnings report gives me another reason to buy again.
The argument is simple: Microsoft runs three businesses that each pay their own way, so a company that can absorb a stumble anywhere is the one paying for its AI buildout. Azure supplies the growth. Microsoft 365, LinkedIn and Dynamics supply the stability. Windows and Xbox round out the mix. When one engine sputters, the others keep pulling.
Three Segments Doing the Heavy Lifting
Fiscal Q4 2026 showed that support at work. Intelligent Cloud revenue reached $39.31 billion, up 32%. Productivity and Business Processes added $37.85 billion, up 14%. More Personal Computing fell 4% to $12.85 billion, and total revenue still rose 17.8% to $90.01 billion. Azure also passed $100 billion in full-year revenue for the first time.
Visibility is what decides it for me. Commercial remaining performance obligations hit $678 billion, up 84%. Nearly 90% of full-year Microsoft Cloud revenue came from customers outside the frontier model companies, so a broad base of businesses stands behind that backlog.
Receipts I Keep Rereading
The first is consistency. Microsoft has beaten both EPS and revenue estimates for six straight quarters, and EPS rose from $3.46 in Q3 FY25 to $4.74 in Q4 FY26.
The second is its financial health. Interest coverage stands at 50.88x and net debt to EBITDA at 0.56. Return on equity is 34.04%, with a 46.78% operating margin.
The third is income that keeps growing. The 0.68% yield starts small, and I own it for the raises. The quarterly dividend just stepped up to $0.98 from $0.91, and full-year cash returned to shareholders exceeded $43 billion. Valuation helps too. Shares trade at a P/E of about 29 and rose only 1.59% over the past year, while fiscal 2026 net income grew 31.3%.
Why My Money Skips Amazon, Alphabet and Oracle
Amazon (NASDAQ:AMZN) grew AWS 37% in Q2 2026. It also pays no dividend, trades at a P/E near 34 and reported trailing-twelve-month free cash flow of -$7.6 billion.
Alphabet (NASDAQ:GOOGL) grew Google Cloud 82%, yet it posted Q2 free cash flow of -$5.86 billion, suspended its buyback and watched long-term debt rose from $46.5 billion to $98.2 billion.
Oracle (NYSE:ORCL) grew cloud infrastructure 121%, while software revenue fell 3% and free cash flow came in at -$5.4 billion. Microsoft pays for its expansion out of $182.94 billion in fiscal 2026 operating cash flow.
Risk That Could Actually Hurt Me
Capex is the risk. Fiscal 2026 spending reached $115.95 billion, up 79.6%, and Q4 free cash flow fell 23.2%. If AI demand cools, that spending turns into a drag on returns.
My thesis lasts because roughly two-thirds of capex goes to short-lived CPUs and GPUs. CFO Amy Hood said on the earnings call: “If the demand environment changes, you just slow down what is, in fact, the largest component.” Management also expects to stay free-cash-flow positive next fiscal year.
What Keeps My Buy Button Active
Microsoft 365 Copilot now has over 30 million paid seats, and Satya Nadella said earlier this year, “We are only at the beginning phases of AI diffusion.” As long as three engines keep funding one growth story, I keep buying, one quarter and one raise at a time.
Got $1,000? Before You Buy MSFT, Read This
If you have cash sitting in your account right now, give this two minutes. After more than two decades of helping investors beat the market, our top analysts at 24/7 Wall St. put together a definitive report on the Top 10 Stocks To Buy Today. And MSFT wasn’t one of them.
They combed the entire market. It's not 10 ideas, not 10 stocks everyone is talking about, it's what their research points to as the 10 best stocks to buy right now, and it's free. Read more here and see which stocks made the list –>>
The post Microsoft’s Diversified Backstop Keeps Me Buying appeared first on 24/7 Wall St..
]]>Microsoft (NASDAQ:MSFT) and Oracle (NYSE:ORCL) each ended their latest quarter with a record backlog. Microsoft reported $678B in commercial RPO, and Oracle reported $664B. The two figures are close, but the money behind them is very different. Microsoft pays for AI capacity out of a highly profitable software business. Oracle is turning itself into an AI infrastructure landlord and relies in part on raised capital to do it.
Azure Throws Off Cash While Oracle’s Cloud Burns It
Microsoft’s fiscal Q4 revenue reached $90.01B, up 17.8%, and Azure grew 43%. Even after heavy spending, the quarter produced $19.64B in free cash flow, so the AI expansion is paying for itself. Copilot passed 30 million paid seats, which shows AI is earning money in Office as well as in data centers. CFO Amy Hood said “customer demand continues to exceed available capacity.”
Oracle’s cloud infrastructure revenue grew 121% in fiscal Q1, and GPU usage was 97.9%. Demand is clearly there. However, $28.50B of capex turned free cash flow negative at $5.40B. License revenue fell 15% as the older software base moves to the cloud.
| Business Driver | Microsoft | Oracle |
|---|---|---|
| Main Growth Engine | Azure and Copilot | AI training and inference capacity |
| Backlog Growth | Up 84% YoY | Up $209B YoY |
| Quarterly Free Cash Flow | $19.64B | -$5.40B |
| Legacy Drag | More Personal Computing -4% | Software -3% |
Microsoft Spreads Its Risk While Oracle Leans on a Few Giants
Excluding OpenAI, Microsoft’s RPO rose 25%. Nearly 90% of Microsoft Cloud revenue came from customers outside the frontier model companies, which limits concentration risk. Hood also pointed to how flexible the spending is: “If the demand environment changes, you just slow down what is, in fact, the largest component.”
Oracle relies on a small number of very large AI contracts. Interest expense rose 55% to $1.4B, and the company finished a $20 billion at-the-market stock sale. Management says prepay and bring-your-own-hardware deals cover most of the more than $30 billion in new contracts. CFO Hilary Maxson would not say when free cash flow will turn positive: “We haven’t given a particular timeframe on that yet.” That lack of a timeline concerns me.
Cash Flow Timing Will Decide Who Pulls Ahead
My focus will be on whether Microsoft’s Azure growth hits the about 45% in constant currency it guided for fiscal Q1. I also want to see whether “seat plus usage” pricing speeds up Microsoft 365. For Oracle, watch whether net cash capex remains at not more than $70 billion and whether revenue hits at least $90B this fiscal year.
Why I Lean Toward Microsoft for Steadier AI Exposure
Investors have already priced in the gap. Oracle shares fell 54.35% over the past year as part of an AI debt selloff. Microsoft gained 1.59% over the same period. Oracle now trades at about 18x forward earnings, compared with 25x for Microsoft. Oracle’s lower multiple likely reflects balance sheet risk.
For my own research, I prefer Microsoft. It has many sources of revenue, positive cash flow, and a customer base that does not depend on one AI lab. Oracle carries more uncertainty, though a single quarter of positive free cash flow would change its story quickly. If that happens, I would take a closer look. All of that AI capex also has to be powered, cooled, and networked by someone, and we included seven of those suppliers into a free report on the AI boom beyond the chipmakers.
Got $1,000? Before You Buy MSFT, Read This
If you have cash sitting in your account right now, give this two minutes. After more than two decades of helping investors beat the market, our top analysts at 24/7 Wall St. put together a definitive report on the Top 10 Stocks To Buy Today. And MSFT wasn’t one of them.
They combed the entire market. It's not 10 ideas, not 10 stocks everyone is talking about, it's what their research points to as the 10 best stocks to buy right now, and it's free. Read more here and see which stocks made the list –>>
The post Microsoft Vs. Oracle: Massive Backlog Fortunes With Vastly Different Risk Profiles appeared first on 24/7 Wall St..
]]>Tesla (NASDAQ:TSLA | TSLA Price Prediction) delivered 486,532 vehicles last quarter. It also reached 1.74M active FSD subscriptions and started unsupervised Cybercab rides in Austin. Still, the stock is down 16.71% this year and closed at $374.58.
On the Q3 call, Elon Musk said, “I think we’re now headed for a lot of fun and significant growth.” My question is whether Tesla can reach $700 by 2030.
What’s Holding Tesla Back Right Now
Spending is the problem. Q3 operating income dropped 55.79% year over year to $718 million, while R&D rose to $2.76B from $1.63B. Revenue was flat, with a change of -0.17%.
The WSJ summed up the quarter as profit falling because batteries are limiting growth (WSJ). Management also raised its capex guidance for the year to roughly $20 billion.
The stock lost 3.08% on October 22 and is down 1.14% over the past month, even after a 3.35% gain over the past week. With a beta of 1.916, these moves are normal for Tesla.
Wall Street Sees 6.2% Upside. I Think That Is Too Timid
The consensus target of $397.83 points to only 6.2% upside. Of analyst ratings, 4 are Strong Buys, 15 are Buys, 21 are Holds, 2 are Sells and 2 are Strong Sells.
Our model projects $404.84, offering 8.1% upside. Its one-year range runs from $363.68 to $466.97, and the model has high confidence in it.
Only 43% of analysts are bullish, and the earnings growth factor subtracts 0.003. That undercounts Tesla. Earnings are lower because management chose to spend on R&D. Car demand did not fall off.
Here’s What It Takes for Tesla to Reach $700
Moving from $374.58 to $700 means a jump of 86.9%. With forward EPS of $2.0882, a $700 share price works out to a forward P/E of 335x. The base case already implies 225x, so the target needs about 111x more multiple expansion.
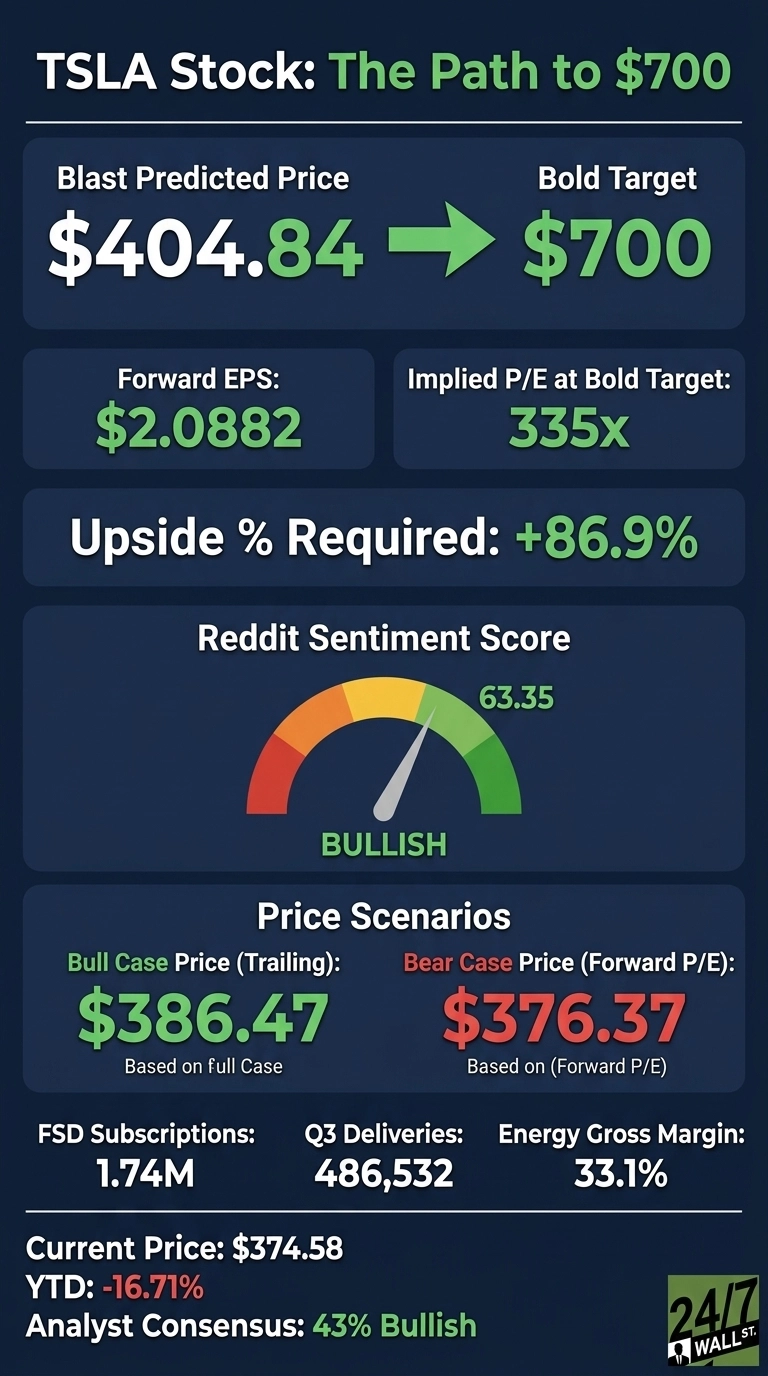
Earnings growth would do most of that work. Consensus growth is 18.23%. At that rate, EPS would reach about $4.08 in four years. That would put $700 at roughly 172x, which is below today’s multiple. An adjustment factor of 1.052 is also already positive in the model.
Here are the catalysts I see:
- Megapacks are “almost sold out” for 2027, and energy gross margin rose to 33.1%.
- More than 75% of North American Q3 deliveries included a paid FSD sign-up. Vaibhav Taneja said FSD “probably at least doubles the profit per car” over its lifetime.
- Tesla and SpaceX are in merger talks, and Morningstar highlighted valuation as a key issue (Morningstar).
The main risk is cost: Musk said TeraFab alone could need capital “north of 100 billion”.
Where Tesla Trades Today vs Its Earnings Power
At 179x forward earnings, Tesla is expensive. The stock trades in a 52-week range from a high of $498.83 to a low of $297.38.
Over 10 years, the stock has returned 2,671.11%. That record helps explain why investors pay a premium for Tesla’s future earnings.
$700 Is a Stretch, But Here’s Why It’s Possible
Reaching $700 means a 86.9% gain. The model’s highest 2030 bull case is $584.92, so I see $700 as a stretch.
Three things would have to go right. Robotaxi would need to become significantly profitable in 2027, energy margins would have to keep rising, and Optimus would need to start customer deliveries on schedule.
If battery shortages and spending keep pressuring profits, the target falls apart. Returns at this level shouldn’t be expected every year, but we’ve outlined the plan for how Tesla could reach $700 in 2030.
Got $1,000? Before You Buy TSLA, Read This
If you have cash sitting in your account right now, give this two minutes. After more than two decades of helping investors beat the market, our top analysts at 24/7 Wall St. put together a definitive report on the Top 10 Stocks To Buy Today. And TSLA wasn’t one of them.
They combed the entire market. It's not 10 ideas, not 10 stocks everyone is talking about, it's what their research points to as the 10 best stocks to buy right now, and it's free. Read more here and see which stocks made the list –>>
The post Forget the Short-Term Noise: Where Could Tesla Be in 2030? appeared first on 24/7 Wall St..
]]>VanEck Semiconductor ETF (NASDAQ:SMH) has gained 47% year to date and 54% over the past year. Its payout has moved far less. Trailing 12-month distributions total $1.10 per share, up just 3% from the prior period.
At a price near $528, that comes to a trailing yield of roughly 0.2%. The fund tracks the MVIS U.S.-Listed Semiconductor 25 Index and holds about $75 billion in net assets. For retirees, the real question is whether a payout that still trails its 2022 level can do any work in an income portfolio.
One Check a Year, Adjusted for the Split
The fund pays once a year, in late December in recent years, so every comparison rests on annual payments. The income stems from ordinary dividends that its chip holdings pay out; most of those companies put the bulk of their cash back into the business.
The fund completed a 2-for-1 forward split effective May 5, 2023. The December 2022 payment was originally $2.40 per share, which equals $1.20 after adjusting for the split. The apparent drop in 2023 is purely a split effect: holders owned twice as many shares, so their total income held up.
2025 Payout Still Trails Its 2022 Peak
| Year | Annual Payment Per Share (Split-Adjusted) |
|---|---|
| 2020 | $0.75 |
| 2021 | $0.79 |
| 2022 | $1.20 |
| 2023 | $1.04 |
| 2024 | $1.07 |
| 2025 | $1.10 |
The 2025 payment came in 8% below the split-adjusted 2022 figure. In this history, 2022 stands out as a spike. The three payments since have inched higher each year but have yet to recover it.
Five Years of Price Gains Against a Slower Payout
Over five years, the fund’s price is up 307%. On a calendar basis, the annual payout rose 40% from 2021 to 2025. The windows differ, so the comparison is approximate, yet it explains the shrinking yield: price has grown much faster than income.
Biggest Positions Pay the Smallest Dividends
Holdings reflect the fund’s June 30, 2026, filing and may have changed since then. The top 10 positions account for about 70% of assets.
- Nvidia (NASDAQ:NVDA): 18% weight, 0.1% yield. Its $0.28 annual dividend uses about 4% of EPS, so the payout is extremely safe and also tiny.
- Taiwan Semiconductor Manufacturing (NYSE:TSM): 9% weight, 0.9% yield, the biggest income source in the group, backed by a 51% profit margin.
- Advanced Micro Devices (NASDAQ:AMD): 6% weight and no dividend at all, so this position contributes nothing to the fund’s distribution.
- Broadcom (NASDAQ:AVGO): 5% weight, 0.8% yield. Its $2.60 dividend uses about 35% of EPS. That makes it the closest call in the group, yet coverage still leaves ample room.
- Micron Technology (NASDAQ:MU): 5% weight, 0.1% yield. The dividend consumes under 1% of EPS of $74.33, though memory pricing is notoriously cyclical.
Every dividend here looks well covered. The limit is scale: with yields this low among the largest weights, income per dollar invested stays small even when every dividend holds firm.
Verdict: Safe Income, Thin Income
The distribution is durable because the companies paying it are very profitable and pay out little. Long-term holders have collected a 1,590% price gain over 10 years while the payout has remained roughly flat. A new buyer gets about 20 cents of annual income per $100 invested.
For growth-oriented holders, the VanEck fund’s dividend functions as a bonus. Retirees needing reliable cash flow, along with high-yield income plans, will find this payout too small to carry the load.
Released: 401k & IRA Tips and Answers
(sponsor) 401(k)s are powerful retirement tools. But even savvy savers can make mistakes that quietly cost you money for decades. Choosing the wrong fund, ignoring small fees nobody adds up, rollover steps done in the wrong order, the list goes on.
These sort of mistakes is exactly what 401k & IRA Tips and Answers was created to help prevent. It is a free guide from Fisher Investments on rollovers, contributions, required withdrawals and the mistakes that do the most damage to a retirement account. Learn More Here ›
The post SMH’s Price Has Soared, but Its Payout Is Still Below 2022 Levels appeared first on 24/7 Wall St..
]]>A single 65-year-old retired ironworker with a $5,400-a-month union pension and $800,000 in a 401(k) is in a position many building-trades retirees reach after a full career in the local. For decades, taxes came out of each paycheck automatically, but in retirement, three tax mechanisms stack: ordinary income tax on the pension and 401(k) withdrawals, federal tax on Social Security payments, and Medicare premium surcharges tied to income.
The setup is common, and one retirement planning podcast recently described the same three traps: RMDs at 73, Social Security taxes, and Medicare’s income surcharges. Households headed by people ages 55 to 69 hold 48% of all U.S. defined benefit pension entitlements and 50% of defined contribution balances, so millions of people carry both kinds of plan into retirement.
His Pension Already Uses Up the Cheap Brackets
For this individual, the pension pays $64,800 a year, and pensions count as gross income under 26 U.S.C. § 61(a)(10). Subtract the 2026 single standard deduction of $16,100 and the temporary senior deduction of $2,000, and taxable income comes to about $46,700 before he touches the 401(k). The 22% bracket begins at $50,400 and the 24% bracket at $105,700.
The pension fills the low brackets for life, so nearly every dollar in a 401(k) lands on top of it at 22% or higher.
Three Layers Arrive Together at Age 73
Another big thing to know is that required minimum distributions start at age 73 under 26 U.S.C. § 401(a)(9)(C)(v). The 401(k) grows 6% a year if left alone. It reaches roughly $1.28 million by then, and the first RMD comes to around $48,000 under the IRS Uniform Lifetime Table (a divisor of 26.5). Add a Social Security check near the average retired-worker benefit of $2,095 a month.
- Income tax: Adjusted gross income rises to about $134,000. The senior deduction applies only to tax years beginning before January 1, 2029, so taxable income lands near $118,000. That puts the top portion in the 24% bracket.
- Social Security tax: Benefits start becoming taxable once income passes a single filer’s base amount of $25,000 and adjusted base amount of $34,000. These figures are written into the statute and have never been indexed for inflation. At this income, up to 85% of benefits are taxable, which is about $21,000 a year.
- Medicare surcharges: Anyone filing as single with an income over $109,000 pays an income-related surcharge known as IRMAA. At today’s thresholds, Part B rises from $202.90 to $284.10 a month, plus $14.50 for Part D. Because the surcharge looks back at past tax returns, a high-income year shows up in premiums two years later.
Roth Conversions Before RMDs Can Shrink All Three Tax Layers
One common approach for single retirees in this spot is to move 401(k) money into a Roth IRA each year between retirement and 73. The IRMAA line of $109,000 minus the pension leaves about $44,200 of conversion room a year, taxed mostly at 22%. Delaying Social Security until closer to 70 keeps that room open and raises the eventual check. Qualified Roth withdrawals aren’t includible in gross income, and each dollar converted reduces future RMDs that offset all three layers.
Converting has costs, and paying the tax bill from cash outside the 401(k) keeps more money in the Roth. Income above $75,000 also cuts the senior deduction by 6% of the excess, a small but real drag through 2028.
The other path is to take only the RMDs. That pushes tax into the future, but the balance keeps compounding into larger forced withdrawals stacked on a fixed pension, and for a single retiree with a pension this size, that path tends to produce higher taxable income later. Married couples have more room: a joint Social Security base of $32,000, an IRMAA threshold of $218,000, and a 12% bracket that runs to $100,800. A surviving spouse, though, eventually files as single while keeping much of that income.
Two Numbers to Check Before Taking Any Withdrawal
Each year, the first thing to do is check where projected income sits against two lines: the 24% bracket at $105,700 and the IRMAA threshold at $109,000. A pension makes the starting point predictable, making conversion planning far easier than for retirees whose income fluctuates.
Many retirees leave the 401(k) untouched until 73 because the pension already covers the bills. Those years before RMDs are often the lowest-tax window for paying tax on that money (we counted nine IRS rules like these three and detailed them all in a free report). A survivor pension election or a spouse may be involved. A CPA can model the widowhood years, since the survivor’s tax brackets drop to roughly half the joint levels, which can change how much to convert.
Released: 401k & IRA Tips and Answers
(sponsor) 401(k)s are powerful retirement tools. But even savvy savers can make mistakes that quietly cost you money for decades. Choosing the wrong fund, ignoring small fees nobody adds up, rollover steps done in the wrong order, the list goes on.
These sort of mistakes is exactly what 401k & IRA Tips and Answers was created to help prevent. It is a free guide from Fisher Investments on rollovers, contributions, required withdrawals and the mistakes that do the most damage to a retirement account. Learn More Here ›
The post Retired Ironworker With a $5,400-a-Month Union Pension and $800,000 in a 401(k) Will Be Slammed by Three Layers of Tax He Never Saw on a Paycheck appeared first on 24/7 Wall St..
]]>