Phoenix Metro Real Estate Update for February 2018
Inventory Under $150K Down 62% ……..

Buyers continue to have a tough time finding inventory on the low end of the market.
New listings overall are down 9% year-to-date thus far, which doesn’t help matters. Compared to February last year, inventory under $150K is down 62% and down 43% between $150K and $200K.
Mid-priced inventory between $200K and $500K is down 11% and down 7% between $500K and $1M.
Only inventory over $1M is up nearly 2% over last year.
Seller concessions are also down so far this year. After hovering around 27% for the past 2.5 years, closings with seller concessions dropped down to 23% as the seller market has strengthened in the new year. Homes sold between $150K and $200K had the highest percentage of seller concessions at 34%.
For Sellers:
Buyer season is ramping up as expected during this time of year.
So far listings under contract are nearly dead even with 2017 levels at this time and are expected to continue rising through May.
2018 year-to-date sales are within 2% of the first 6 weeks of last year. Not surprisingly, MLS sales under $200K are down 21% due to low inventory.
However, sales between $200K and $300K are up 14%, $300K and $500K are up 21%, $500K and $1M are up 20% and sales over $1M are up 36%.
Commentary written by Tina Tamboer, Senior Real Estate Analyst with The Cromford Report
©2018 Cromford Associates LLC and Tamboer Consulting LLC
What can I help you find?
The post Phoenix Metro Real Estate Update for February 2018 appeared first on Dorette Oppong-Takyi, Phoenix Real Estate Broker Associate authored by Dorette Oppong-Takyi Dorette Oppong-Takyi
]]>Phoenix Metro Real Estate Update for February 2018
MLS Sales Over $1M up 36%
Inventory Under $150K Down 62% ……..
For Buyers:
Buyers continue to have a tough time finding inventory on the low end of the market.
New listings overall are down 9% year-to-date thus far, which doesn’t help matters. Compared to February last year, inventory under $150K is down 62% and down 43% between $150K and $200K.
Mid-priced inventory between $200K and $500K is down 11% and down 7% between $500K and $1M.
Only inventory over $1M is up nearly 2% over last year.
Seller concessions are also down so far this year. After hovering around 27% for the past 2.5 years, closings with seller concessions dropped down to 23% as the seller market has strengthened in the new year. Homes sold between $150K and $200K had the highest percentage of seller concessions at 34%.
For Sellers:
Buyer season is ramping up as expected during this time of year.
So far listings under contract are nearly dead even with 2017 levels at this time and are expected to continue rising through May.
2018 year-to-date sales are within 2% of the first 6 weeks of last year. Not surprisingly, MLS sales under $200K are down 21% due to low inventory.
However, sales between $200K and $300K are up 14%, $300K and $500K are up 21%, $500K and $1M are up 20% and sales over $1M are up 36%.
Commentary written by Tina Tamboer, Senior Real Estate Analyst with The Cromford Report
©2018 Cromford Associates LLC and Tamboer Consulting LLC
What can I help you find?
The post Phoenix Metro Real Estate Update for February 2018 appeared first on Dorette Oppong-Takyi, Phoenix Real Estate Broker Associate authored by Dorette Oppong-Takyi Dorette Oppong-Takyi
]]>Phoenix Metro Real Estate Update for January 2018
Over 50% of 2017 Sales Were in this Price Range….

2018 is not going to be any less competitive for buyers in general.
The market is starting out with 14% fewer listings compared to 2017, however there are 35% fewer listings under $200K, a price range that commands 34% market share of all MLS resales in Greater Phoenix.
51% of MLS sales were between $200K-$400K in 2017, and supply in this range is down just 7%.
14% of sales were between $400-$1M and supply is down nearly 9%.
Only the market over $1M is starting 2018 with 4% more for sale, 2017 sales over $1M were less than 2% of the market.
For Sellers:
Over 51% of newly constructed condominiums, townhomes and single family residences sold in 2017 were between $275K-$500K as of November and approved single family permits are up nearly 12% going into 2018.
Added inventory from new construction continues to keep mid-range property appreciation at sustainable levels at the current level of demand.
The last wave of boomerang buyers are expected to rejoin the masses in home ownership this year after waiting 7 long years to qualify for conventional financing after foreclosure.
These buyers span all price ranges and their return combined with positive inbound relocation and employment keep Greater Phoenix a positive environment for sellers.
Commentary written by Tina Tamboer, Senior Real Estate Analyst with The Cromford Report
©2018 Cromford Associates LLC and Tamboer Consulting LLC
What can I help you find?
The post Phoenix Metro Real Estate Update for January 2018 appeared first on Dorette Oppong-Takyi, Phoenix Real Estate Broker Associate authored by Dorette Oppong-Takyi Dorette Oppong-Takyi
]]>——————————————————————————————-
Active Listings (excluding UCB): 18,422 versus 20,928 last year – down 12.0% – and down 1.2% from 18,646 last month
Active Listings (including UCB): 22,019 versus 24,514 last year – down 10.2% – and down 1.7% compared with 22,403 last month
Pending Listings: 5,579 versus 5,782 last year – down 3.5% – and down 1.2% from 5,646 last month
Under Contract Listings (including Pending, CCBS & UCB): 9,176 versus 9,368 last year – down 2.0% – and down 2.4% from 9,403 last month
Monthly Sales: 7,180 versus 6,875 last year – up 4.4% – but down 3.2% from 7,421 last month
Monthly Average Sales Price per Sq. Ft.: $154.62 versus $144.60 last year – up 6.9% – and up 2.7% from $150.53 last month
Monthly Median Sales Price: $244,900 versus $225,000 last year – up 8.8% – but down 0.04% from $245,000 last month
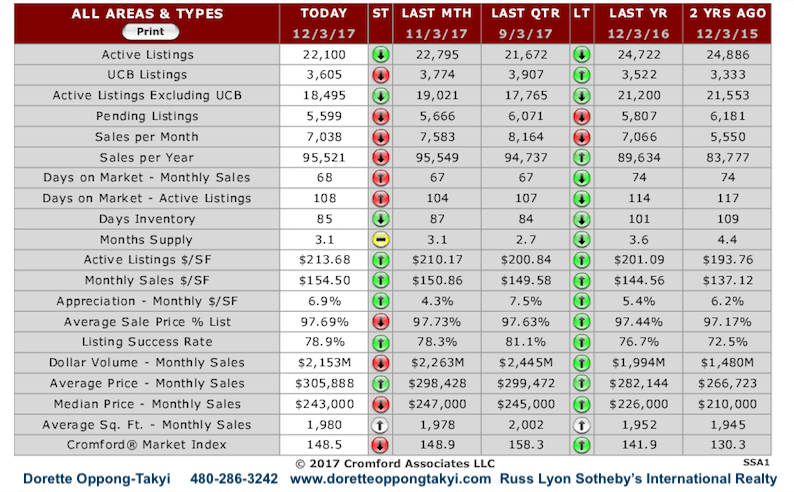
The supply of active listings is still substantially lower than last year, although almost all the drop is for homes under $200,000. We usually get a decent increase during the fall but in 2017 this increase was pretty paltry. Buyers got very little relief except at the upper end of the market, where relief was not required.
There were 19 working days in November 2017, the same as in 2016, so the 4.4% increase in sales is a valid and fair comparison. This is an improvement on October, although the percentage increase in sales is less than the percentage increase in the number of real estate agents since last year (6.3%). Luckily the increase in average prices makes up for that difference and then some.
The average price per square foot jumped a hefty 2.7% in just one month, between October 1 and November 1, putting appreciation back above the rate we saw last year. However those who watch only the median sales price will be disappointed at the lack of movement over the same period.
All in all, November was a positive month for sellers and has turned around the weakening demand trend that prevailed for the prior 3 months. This bodes well for a strong finish to the year in December.
Supply is still high above $1.5 million but demand continues to look better at this end of the market so well-priced homes should not have to wait excessively long to find a buyer.
Sourced from The Cromford Report
What can I help you find?
Need to Sell, Find out how much you can get?
The post Phoenix Real Estate Market Summary, December 1, 2017 appeared first on Dorette Oppong-Takyi, Phoenix Real Estate Broker Associate authored by Dorette Oppong-Takyi Dorette Oppong-Takyi
]]>
The 4th quarter is a good time to be a buyer seasonally. After April or May, buyer activity gradually declines every month with the 4th quarter seeing the lowest level of contracts in escrow. This is typical within all price ranges.
Meanwhile, supply levels tend to rally with new listings in October after a stale Summer. This provides the remaining buyers with more listings to choose from and fewer competing offers.
A welcome relief for many, however this seasonal lull doesn’t mean buyers will win with low offers. For most buyers, this environment only provides fewer competitors for their preferred properties. It doesn’t necessarily mean they will get a bargain.
What can I help you find?
For Sellers:
While 2017 is still outperforming the last 5 years in sales volume, contracts in escrow have declined 30% since peaking in April. Supply is up 11% after hitting a low in August, bringing current listing counts within 1% of where they were in April.
While seasonal and expected, this creates a more competitive environment for sellers compared to the Spring season. As a result, the number of price reductions counted every week has gone up 20% since the beginning of September. Expect price reductions to remain high as sellers push to get their properties under contract before Thanksgiving.
Need to Sell, Find out how much you can get?

Commentary written by Tina Tamboer, Senior Real Estate Analyst with The Cromford Report ©2017 Cromford Associates LLC and Tamboer Consulting LLC
The post 4th Quarter is Good for Buyers! Supply up 11% since August, Down 12% from 2016 appeared first on Dorette Oppong-Takyi, Phoenix Real Estate Broker Associate authored by Dorette Oppong-Takyi Dorette Oppong-Takyi
]]>Phoenix is ranking at number 10 compared to other cities in the metro area with Paradise Valley still being the most expensive city at $354.55 per sq. ft.

Carefree dropped to number 3, with Scottsdale stealing the second position at an annual average price of $241.08 per sq. ft
NOTE!!! These numbers will vary as you drill down to specific zip codes and subdivisions.
How about my zip code or Subdivision?
To find about your specific zip code or subdivision, send me the details below.
The post Phoenix is averaging $155 per sq. ft., up by 5.2% from last year appeared first on Dorette Oppong-Takyi, Phoenix Real Estate Broker Associate authored by Dorette Oppong-Takyi Dorette Oppong-Takyi
]]>The post Phoenix Real Estate Update for week of Oct 23, 2017 appeared first on Dorette Oppong-Takyi, Phoenix Real Estate Broker Associate authored by Dorette Oppong-Takyi Dorette Oppong-Takyi
]]>October 27 – The Census Bureau has published single family permit data for September 2017. Across Maricopa and Pinal counties we see 1,625 permits, the lowest monthly total since February. However it is up 11% from 1,467 in September 2016. As a result, the 12 month total has risen to 20,023 the first time we have seen over 20,000 permits since February 2008.
Looking at the year to date counts, the ranking by city or place is as follows:
Phoenix – 2,120
Mesa – 1,930
Buckeye – 1,642
Unincorporated Pinal County – 1,599
Peoria – 1,452
Gilbert – 1,260
Queen Creek – 889
Maricopa – 842
Goodyear – 836
Unincorporated Maricopa County – 628
Surprise – 575
Scottsdale – 546
Chandler – 408
Avondale – 198
Florence – 156
Wickenburg – 128
Glendale – 127
Casa Grande – 93
Eloy – 88
Litchfield Park – 63
Fountain Hills – 57
Tempe – 41
Apache Junction – 35
Carefree – 24
Cave Creek – 23
Guadalupe – 9
El Mirage – 8
Tolleson – 4
Coolidge – 2
The top 2 are not a surprise, but look how Buckeye is outbuilding Chandler, Scottsdale and Surprise combined.
Most of the activity in Unincorporated Pinal County is in the San Tan Valley area. When combined with the nearby incorporated towns of Queen Creek and Florence we have a total of 2,644.
Cromford Market Index Now compared to Last month
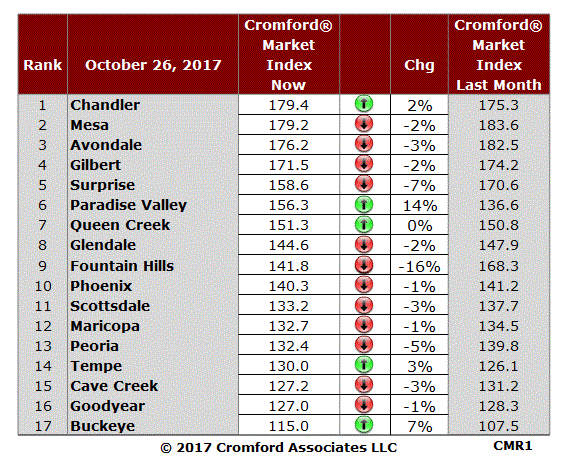
October 26 – Our regular table showing the Cromford® Market Index for the single-family markets in the largest 17 cities is shown below:
The usual increase in supply that we see during the first part of the fourth quarter is bring down many of the indexes and we have 12 cities deteriorating for sellers. However 5 cities are bucking that trend, with Paradise Valley and Buckeye drawing attention.
Avondale has conceded its place at the top once more with Chandler taking first place for the first time and former top-spot holder Mesa close behind. The Southeast Valley is doing particularly well in the CMI stakes at the moment. This not due to demand which is actually close to normal, but due to supply which is not only very low but has deteriorated much faster than the rest of the Phoenix area over the last 12 months. In contrast supply has been pouring in for Fountain Hills where the CMI has dropped 16% in the last month. Surprise and Peoria are other cities that dropped 5% or more in the last mont
The post Phoenix Real Estate Update for week of Oct 23, 2017 appeared first on Dorette Oppong-Takyi, Phoenix Real Estate Broker Associate authored by Dorette Oppong-Takyi Dorette Oppong-Takyi
]]>Homes that went under contract increased by 2.5% compared to same that last year.
In the market to buy a home or a property:
There’s both good and bad news for first-time home buyers this month.
The good news is that there’s been a 22% increase in single family active listings asking between $175,000-$200,000 over the last 10 weeks, going from 1,065 to 1,295.
Current inventory is 10% higher than where it was in week 49 of last year, adding some much needed choice to a high demand price range. The added supply is not universal across the valley; increases have been marked specifically in Buckeye, Surprise, Sun City, Peoria and Mesa.
The bad news for home buyers is that supply overall is down 3.7% while the level of competing buyers is remaining seasonally consistent. The Southeast Valley specifically has not seen the typical increase in supply that happens this time of year.
This indicates that the area will kick off 2017 with low supply just before the expected increase in buyer activity come February. In this case, the cost of waiting to purchase will be a lack of choice and possibly having to compromise on the condition or location of the property they choose to buy.
Looking to sell your home or property:
Bad news for buyers usually translates into good news for sellers, especially after positive news reports of Realtor.com ranking Phoenix as the #1 projected real estate market in the country for 2017.
However, it’s still not a market to be overpriced regardless of the strong demand for homes. Some price ranges have more competing listings than others, especially in areas such as North Phoenix, Mesa, Gilbert and Peoria where there is competition from new home subdivisions.
Permits for single family homes have been on the rise to accommodate the demand. This provides more choice for buyers in those areas, balances out the market and keeps annual appreciation in check.
The areas projected to have the highest appreciation rates are those where there is a high level of fix and flip activity along with a more affordable price range under $175,000.
–Tina Tamboer, Senior Real Estate Analyst | The Cromford Report
A visual presentation of the update

Real estate is still very local, have questions about a neighborhood?
The post Phoenix seeing an overall 4% supply reduction compared to same time last year appeared first on Dorette Oppong-Takyi, Phoenix Real Estate Broker Associate authored by Dorette Oppong-Takyi Dorette Oppong-Takyi
]]>This 4 bedroom home in Central City Phoenix is for sale at $175,000.
Built in 2009 with no HOA, this single story home comes with new carpet installed in bedrooms and closets as well as a recently painted interior including the 2 car garage.
Finding a newer build in Central City Phoenix and with no HOA is just like finding a needle in haystack making this home a rare find.

Calling this place your home means you will be very close to downtown Phoenix as well as Sky Harbor Airport. With clear views of the Chase Field ball park, means you never have to leave home to see the fireworks.
Do you love or appreciate Art and want to live in Phoenix?
If you love and appreciate art, then you will fall in love with the mural painted on the side block fence, by the art students from Herrera School for the Fine Arts & Dual Language across the street.

The mural can be painted over if needed but the kids worked hard and did a such great job so keeping it will be honoring their hard work as well as have others enjoy it too.
The backyard has ash trees that can give you a shady area to entertain and enjoy the gorgeous Phoenix weather or watch the stars in the clear skies at night, which Phoenix is well known for.

Other things you will love about this house
- The exterior lights by the garage are dusk to dawn meaning you can leave home and not worry about turning on the exterior lights or turning them off.
- Pre-wired for an alarm system if you will like to install one.
- The whole house is sound mitigated so it is quiet inside.
- Comes with Washer and Dryer.
- 2 car garage comes with an automatic garage door opener.
- Sprinkler and drip system in place.
- All bedrooms have ceiling fans already installed with lights.
- All windows currently have coverings.
- Located on a corner lot.
- North – South exposure
Need more information about this home!
The post 4 bedroom home in Central City Phoenix for sale at $175,000 appeared first on Dorette Oppong-Takyi, Phoenix Real Estate Broker Associate authored by Dorette Oppong-Takyi Dorette Oppong-Takyi
]]>The post New Listings Under $300,000 Down 10% in October 2016 appeared first on Dorette Oppong-Takyi, Phoenix Real Estate Broker Associate authored by Dorette Oppong-Takyi Dorette Oppong-Takyi
]]>Average Sales Price per Square Foot Up 8%
For Buyers:
October was a disappointing month for new active listings under $300,000. Normally October is a good month to buy as there is a boost of new listings without an increase in competing buyers. This rang true for new listings between $300,000 and $1,000,000 (up nearly 7%). New listings over $1,000,000 were down by nearly 14%, however this price point has been suffering from oversupply most of the year and the drop only equated to 57 fewer new listings in the past month. More importantly, new listings under $300,000 were down by nearly 10% with 669 fewer new listings than this time last year. For a price range that is already under supplied for the current demand, this was not good news for buyers. The fact that sales under $300,000 comprised 72% of all sales in the past month tells us to expect prices to continue rising with the current lack of new supply hitting the market.
For Sellers:
Under supply for listings under $300,000 has had a positive effect on sellers. The Monthly Average Sales Price per Square Foot in this price point went up 8.4% from $110.42 last November to $119.72 this November. The $300,000 – $500,000 price range saw this measure go from $146.03 to $151.50, up 3.7%. The $500,000-$1,000,000 price range increased 1.2% from $196.65 to $199.03; the Over $1,000,000 price range increased by 12.3% from $308.73 to $346.68 (with only 108 sales in this price point, average price measures will fluctuate dramatically from month to month).
Average Days on Market is still very good for sellers under $300,000 at 61 days. The measure increases to 91 days within $300,000-$500,000; 142 days within $500,000-$1,000,000; and 191 days Over $1,000,000.
Commentary written by:
Tina Tamboer, Senior Real Estate Analyst | The Cromford Report
The post New Listings Under $300,000 Down 10% in October 2016 appeared first on Dorette Oppong-Takyi, Phoenix Real Estate Broker Associate authored by Dorette Oppong-Takyi Dorette Oppong-Takyi
]]>