Months’ supply is calculated by dividing current inventory by the number of contracts accepted (pending) for the previous month. For April, it would take 1.2 months to sell everything on the market listed under $500,000.
In the $500-750,000 Gig Harbor home prices the inventory is still tight at 1.9 months and is only slightly better at $750-1,000,000 category with 2.5 months.
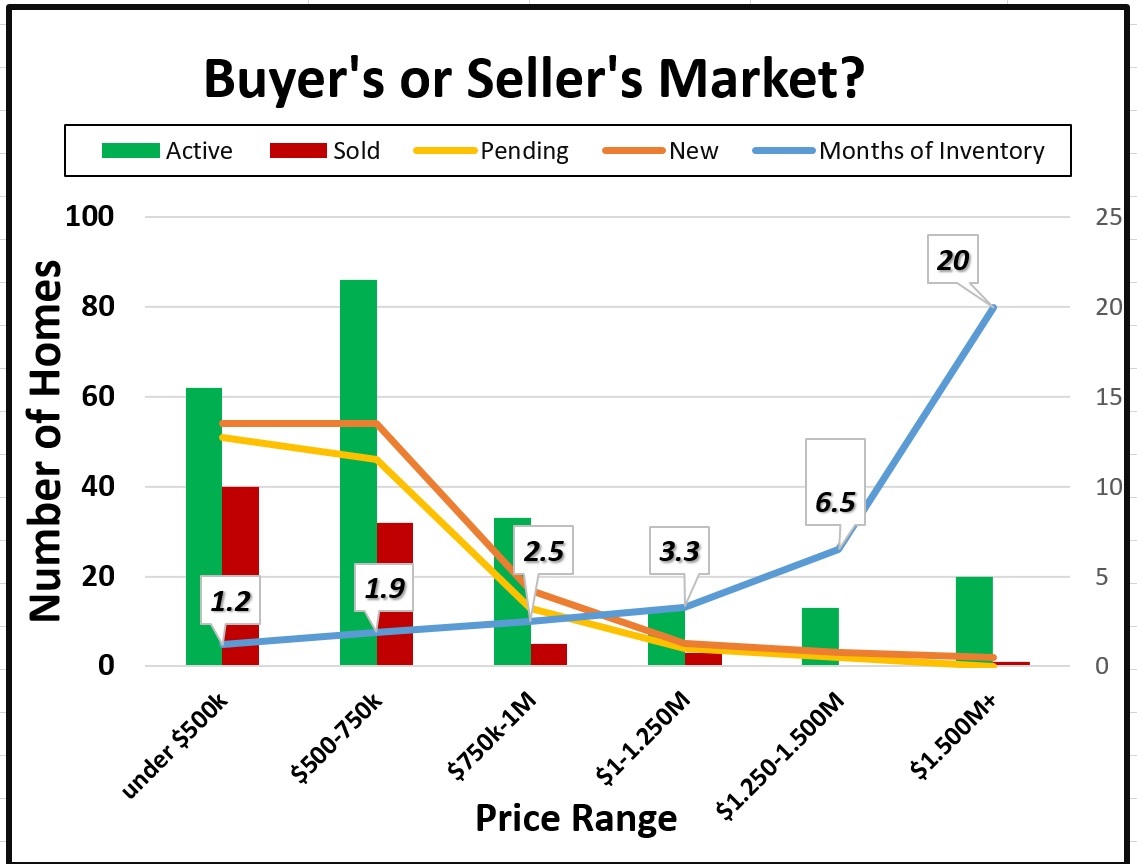
But once above $1M, buyers have a bit more breathing room and likely won’t face a bidding war for Gig Harbor home prices.. Up to $1,250,000 homes will remain on the market a bit longer, providing a 3.3-month supply and an opportunity for the move-up buyer to sell in a seller’s market and buy up in a buyer’s market.
Above $1,250,000 it jumps rapidly to a buyer’s market for Gig Harbor home prices with 6.5 months of homes in the $1,250-000-1,500,000 category and 20 months at $1,500,000 plus. Multiple offers are rare in the upper reaches and sellers likely have a longer wait especially at $1,500,000. Exceptions are found for homes in high demand areas, turn-key and priced where buyers believe it to be current market value. Currently 20 homes are available with just one sold in April and none pending.
So…pleased may be the seller under $750,000 and the buyer over $750,000, and trying perhaps for the buyer under and the seller over that mark.
]]>
The $1-1.25M category already has twice as many sales as the whole of 2016.
The conundrum though is between $1.25-$2M. The 2 closed sales to-date compare with 13 for the 2016 year and Gig Harbor waterfront homes currently under contract support the lack of interest, at this time, for this price range. It may be that many of the sellers with pent-up desire to change homes managed to sell their homes last year. And it may be that this season’s inventory is too aggressively priced.
For the first time I can remember, 40% of the homes on the market over $2M are in Gig Harbor Bay, with docks. These Gig Harbor waterfront homes were built within a five-year period a decade plus ago and likely represent the desire for a lifestyle change.
Gig Harbor/Fox Is overall real estate market….
- Highest single month MSP–$525,000
- Most new resale listings for years—up 6.8%
- 2-month supply of homes for sale
- New homes are 35% of sales volume
Key Peninsula
- Just 1.3-month supply
- MSP up 18% for the quarter
- Pending sales up 53% over 2016
]]>
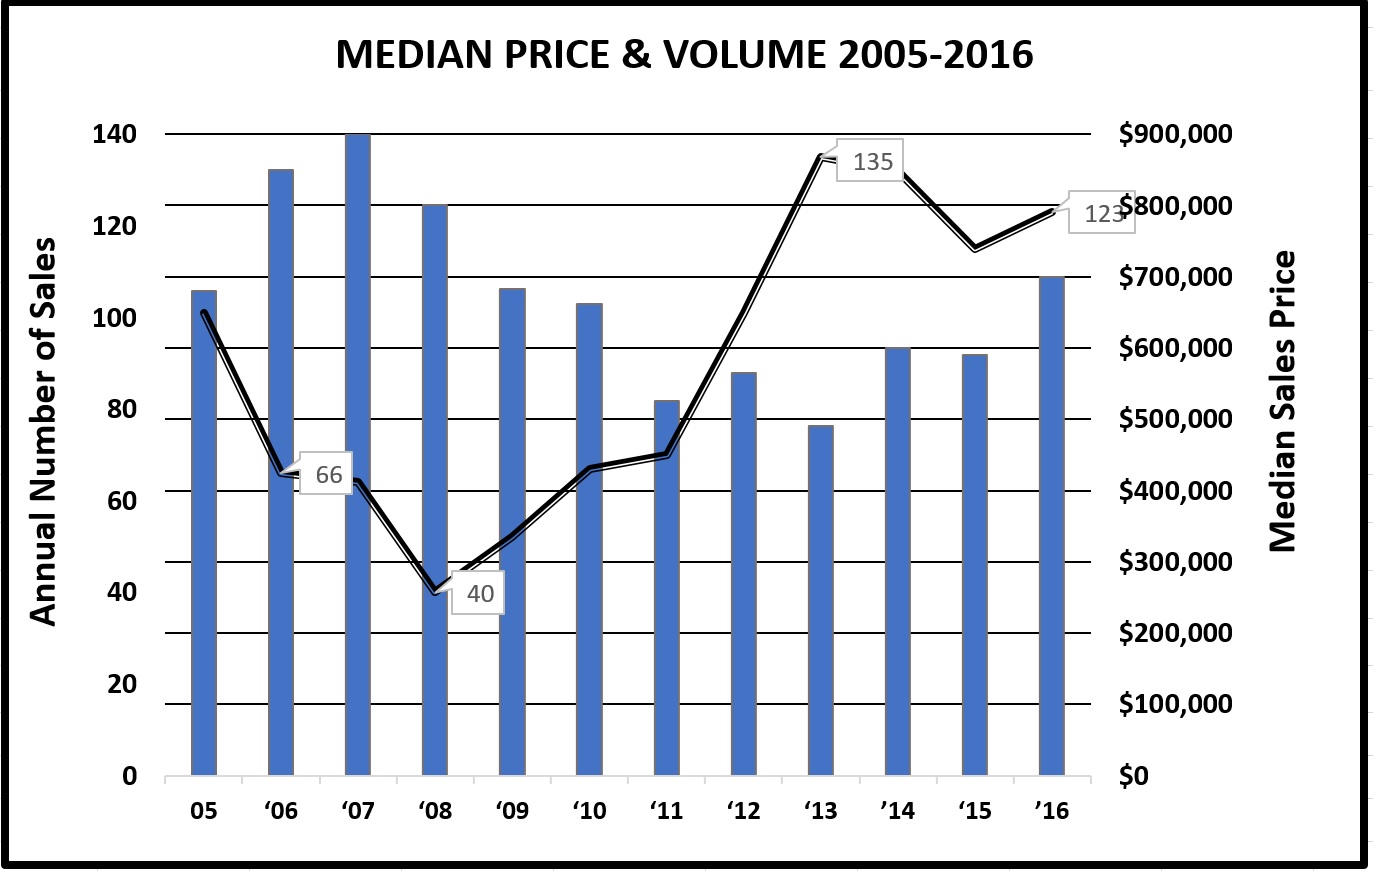
Sale prices of all Gig Harbor homes have recovered to best the peak years but the very high-tier waterfront prices have not caught up. Today prices are 22% off the 2007 $900,000 peak. 2017 could however minimize that difference for Gig Harbor waterfront.
In 2006-08, 35% of Gig Harbor waterfront sales were over $1M. In 2016, only 21% were over $1M. In 2006, 23 homes sold over $1M. In 2016, 26 homes sold–nearly the same, but twice the overall volume.
The selling price for the 10 homes that sold for $1.5M or more averaged 163% of their assessed value last year, something buyers need to be cognizant of in offering…and 133% in the $800-1M price range. Looking ahead at the 2017 assessed values, I believe prices for Gig Harbor waterfront will continue to outpace county assessments West to Southeast exposure was the norm for the $1.5M price range, and they averaged 154 feet of frontage. One third had docks and nearly all were low to medium-low bank…normal for the high-tier.
Some final thoughts–
- I believe there is a “backlog” of a minimum of 150 Gig Harbor waterfront owners who are ready to move–if market conditions (read prices) permit. This year should bring more of these properties to market.
- New flood plain maps will be implemented March 7, affecting Gig Harbor waterfront low bank. Sellers and buyers should review FEMA’s website for maps to see the impact for flood insurance rates in high-velocity wind and reach situations.
- Additionally, the long-waited Shoreline Master Plan revision is scheduled for adoption this year, expanding shoreline setbacks and restrictions. I was on the committee when it began in 2008…now eight years later. So…lots going on.
New construction dominates close-in Gig Harbor home prices, including the booming area surrounding Costco as well as Rosedale. Fox Island and Wollochet statistics are heavily weighted from waterfront sales. And a drop in distressed sales had a major impact for some of Key Peninsula home prices.
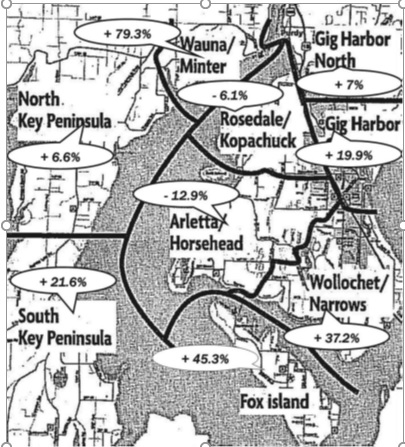
Gig Harbor–New home sales captured 41% of all sales, pushing the Gig Harbor home prices in this area up nearly 20% to $464,000. Waterfront sales were down by half, dropping median prices to $400,000 from $836,000 in that category.
Gig Harbor North–1 of every 8 sales was a new home, predominantly in Crescent Lake Estates. That market jumped $561-730,000. Gig Harbor home prices in this area showed an uptick $500-535,000 for 7%. While waterfront prices jumped 35%, less than half the number sold.
Fox Island–Prices jumped 45% $419-609,000 overall, with waterfront prices up 30.9% –$943-1,234,000. There are many view homes on the island, which helped push up the sales price. However, a smaller percentage of the sales was waterfront than a year ago. The few new homes on the island also added to the increase.
Median Home Prices 4th Q 2016 change from 2015
Arletta/Horsehead–21% of all sales were new homes with the median here for Gig Harbor home prices down slightly. 50% more waterfront homes sold this year, but those sales were down in price $935-835,000. There were more waterfront sales, albeit less pricey.
Wollochet/Narrows– 35% more waterfront homes sold, boosting Gig Harbor home prices here $422-800,000, pulling up the entire market $339-465,000 for a healthy 37.2% increase overall.
Rosedale/Kopachuck–The median price dropped here, $527-495,000. 1/3 fewer waterfront homes sold and those prices were down 30% to $583,000. Overall there were just fewer sales.
Wauna/Minter–Wauna and Minter experienced a huge boom in prices –$222-398,000. Double the waterfront sales and 1/3 fewer distressed sales made all the difference for this area with a 79% increase in median price.
North Key Peninsula–Here a reasonable increase $229-244,000. A 20% drop in distressed sales was a boost.
South Key Peninsula–Here a nice comeback $190-231,000 the past year. A few less waterfronts sold but distressed sales dropped 35%, making a major difference in the median price.
Regionally, prices year-over-year 4th quarter rose 12.9% for Pierce County, 4.3% South Kitsap, and 13.8% for King County.
]]>
- October was the best month for sales volume ever recorded
- Days on market are 20 in King County & 32 in Pierce
- Seattle has replaced Portland as the fastest growing market
- King Co prices are up 14.5%, Pierce Co 10% year-over-year
- Seattle is the 9th most expensive rental market in the nation
So, how’s “our neck of the woods” doing?
Gig Harbor home sales & Fox Island home sales
- MSP (median sales price) increase of 9.6% from a year ago
- Last 2 months of $492,000 MSP, besting 2006 peak of $482,000
- Each of 7 months of this year the MSP topping 2006
- September is 2nd highest recorded MSP; October is 7th best
- New listings are up 23% for the past 3 months over 2015
- Closed sales have climbed 17% during that time
- Pending sales show modest increase of 6%
- Cumulative days on market have dropped from 92 to 72
Key Peninsula home sales
The KEY has rebounded! That’s the good news for the peninsula that has struggled even as its eastern neighbor began to rebound a couple years ago.
- January to May the MSP was lower than same months of peak 2005-07
- Since June monthly prices have outpaced every previous year
- MSP is up 18% from $220,000 to $260,000 quarterly since 2015
- Closed volume is up nearly 10% for the quarter
- New listings are up over 28% for the quarter
]]>
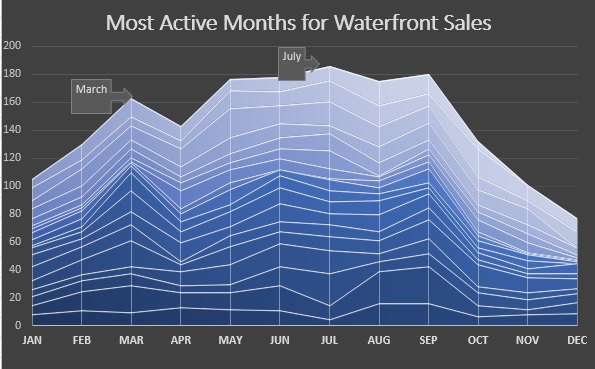
BEST SALES MONTHS: March has been the #1 selling month in 4 of the last 18 years for Gig Harbor waterfront . March has actually ranked either #1, #2, or #3 40% of that period. Last year March was #2 in new sales. Aggregated over the years, the best months are July, September, May, June and August in that order. Those sales typically close 45 days later. But those months’ sales include more second home usage, Key Peninsula and generally under $1m price tag.
2015 Waterfront roundup
MEDIAN SALES PRICE: 2006-08 were boom years for Gig Harbor waterfront prices—$800-900,000 was the median. But the year just prior to the boom—2005—the median price was where it has been the past 2 years–$600,000.
TOP TIER: The over $1M category produced 1 of every 4 sales in 2015. At the market height 35% of sales were over $1M. That plummeted to 10%—then jumped to 24% last year. 2 of every 3 sales in the top tier were initiated before June, with half by March. Gig Harbor waterfront buyers want to be using the waterfront—either on land or by boat–in the summertime.
INVENTORY: With Gig Harbor waterfront inventory even tighter this year, new listings, if priced right, disappear as fast as they are listed. That should keep prices rising in 2016. The median price of the 37 homes listed in Gig Harbor/Fox Island is $1,100,000 & in Key Peninsula $745,000 for 8 homes. That 45-house total is down from the past couple years. If, on the other hand, many of the 175 waterfront “pent-up sellers” enter the market, it could hold down prices. 175 is my take of the number of Gig Harbor waterfront sellers who would sell and move—if market conditions & prices permit.
I believe the earliest sellers of Gig Harbor waterfront to the marketplace this year will get the benefit of low inventory, coupled with historic low interest.
]]>
So that is the resale market for Gig Harbor home prices. New construction is another matter. Off 35% from its 2007 high, the forces at work may not allow local prices to catch up for several reasons. National and regional builders, rather than local small builders of 10 years ago, are building smaller on smaller lots (thank you Growth Management), with less detailing for the main part. Many of current lots, other than Harbor Hill, were picked up at rock bottom prices from banks who acquired them in the recession. Lot prices will increase as new inventory comes online…but the pipeline is slim and then in-fill lots will be the future. I believe Gig Harbor North will be built-out by 2017, considerably ahead of original plans.
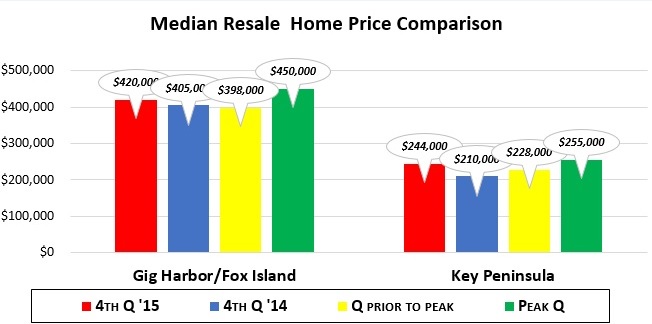
Highlights for Gig Harbor home prices
- It’s a seller’s market up to $750,000, with just a 3.8 month supply, even in the $500-750,000 category. Last year that range was working through a 13.4 month supply
- It is averaging just 3 months market time in the $500-750,000 range, less below $500,000
- 39% of the 228 listings, and 1 of 4 sales last month were new homes
- Inventory is down 30% and contracts written are running about 20% higher than a year ago
- Highlights for Key Peninsula home sales
- Resale home prices are running $244,000 for last 3 quarters—same as 2007-2008 “best years”
- Distressed sales still hover at 15%, but down from 35% 2 years ago
- New construction has not returned in any measurable way
Here are my observations…and predictions for Gig Harbor home prices
Interest rates finally started their climb which will bring buyers to the buying table sooner than later, even though these are historically some of the lowest. I expect rates to remain under 5% for the year.
Lending requirements are beginning to loosen a bit which will particularly help first-time buyers.
Wages are still a drag on the economy. That will either slow the creep for Gig Harbor home prices or continue to magnify the difference of who can buy and who can’t.
Inventory will remain low for two reasons. Sellers are waiting to cash in more of their equity with higher Gig Harbor home prices. But more likely those same sellers can’t find a home to move into. There is a very large “supply” of sellers with “pent-up” selling desires.
Waterfront home sales are “behind” 150 or more that should have sold historically during the period of the recession. The 120+ sales in each of the last three years hasn’t caught up to the recession years with only 4-5 dozen home sales.
Year of the new house, with most buyers settling for less privacy, yard and trees. But new.
]]>
A good gauge for Gig Harbor home prices (including Fox Island) is the quarterly figure of $434,000 — up a substantial 14.8% from a year ago, positioning Gig Harbor home prices very close to the peak years of 2006-07. The single quarter high was summer 2006.
New construction continues to produce one in four sales for Gig Harbor, while it creates one in three listings – typical for an area desirable to live and not yet built-out.
Key Peninsula’s improvement is more difficult to quantify. While Gig Harbor homes have gained value consistently all year, the Key has ranged from value increases as low as 2% to as high as 35%. Likely explanations include 1) the number of waterfront homes trading in a single month 2) a smaller number of sales in any single month 3) more distressed sales than Gig Harbor and 4) lack of new construction.
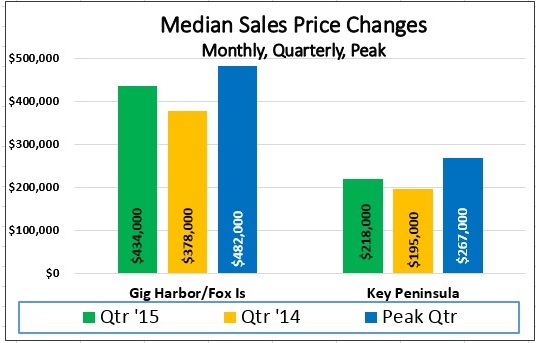
Top Quartile of Sales Makes Comeback
The top quartile of sales…that is the top 25% of sales by price…is making a noticeable comeback. That quartile encompasses sales starting at $580,000 currently and everything above—a strong increase from the $500,000 a year ago.
And while sales over $1m will always be a relatively small number, the 36 sales this year to date are nearly double 2014 and represent the highest number since 2007. The $1m+ category for Gig Harbor home prices has languished at less than half that number for the past six years. In 2014 this category included only view or waterfront homes. 2015 sales include a horse farm, Canterwood homes, and waterfront land as well. Market days have dropped from 127 to 102. All of these sales occurred in the Gig Harbor/Fox Island area.
The stage should be set for a continuing robust market for the top quartile in 2016.
]]>
The year started a bit slow with the prices trending $75,000 lower in Gig Harbor. But August’s median sales price of $470,000 is the single highest month since May 2007—and is reminiscent of roaring 2006. A better gauge though, in my opinion, is the quarterly figure of $442,000 which is up a solid 8.6% from a year ago and positions Gig Harbor to prices just 8% off that peak.
Key Peninsula’s improvement is more difficult to gauge. While Gig Harbor has been gaining consistently all year, the Key has fluctuated as much as 2-35% in a single month. This can be explained by many waterfront homes trade heavily in the spring and summer months, which can bounce prices around. The Key is still feeling the effect of more distressed sales than Gig Harbor (20% compared to 6%) as well as not receiving the number of new home sales. But overall the Key is looking healthy, with only a 3.9 month supply of homes for sale.
Noteworthy…
- Gig Harbor MSP August–↑13.8%
- Key Peninsula MSP August↑33%
- Pierce Co MSP August ↑6% — $250k
- King Co MSP August ↑13.2% — $451k
- Kitsap Co MSP August ↑8% –-$260k
- Inventory is building very slowly but new listings are barely staying ahead of pending sales
- New home sales continue increase—20% of sales in Gig Harbor–26% of listings
- Gig Harbor’s volume was third highest recorded, on the heels of 4 months of record setting numbers
]]>
Gig Harbor waterfront 2014’s sales nearly equaled 2013’s record-breaking year. But the real news is the 18% increase in median sales price for Gig Harbor waterfront. Half of all sales were more than $600,000 and half less. Gig Harbor waterfront sales prices peaked at $900,000 in 2007–now at 2005 levels.
But the sales pattern for Gig Harbor waterfront was atypical—the market slowing precipitously 4th quarter 2013, continuing through the entire 1st half of 2014. By July Gig Harbor waterfront sales were markedly down–both price & number.
Not surprisingly, all 23 $1m plus sales occurred in Gig Harbor & Fox Island. But what was noticeable was the buying intensity 4th quarter in the upper end. Only 6 Gig Harbor waterfront offers were accepted in the entire 1st half, 7 in the 3rd quarter & 9 in the 4th, mirroring consumer confidence. 10 of those 23 sales closed in November & December alone. $655,000 was the high sales price for Key Peninsula.
What a difference a year made in the over $1m tier for Gig Harbor waterfront. 2013’s record sales volume produced the smallest percentage (10%) of sales over $1m & the lowest median sales price ($490,000) since 2004. But 2014’s nearly equal numbers showed a healthy uptick of 17% high-end sales with 18% increase ($600,000) in median sales price.
| Median Sales Price 2006-2014 | ||||||
| Year | Sales Price | % Change | # $1.5m+ | # $1m+ | # All Sales | % $1m+ |
| ‘06 | 850,000 | 13 | 10 | 66 | 35% | |
| ‘07 | 900,000 | ↑6 | 6 | 17 | 64 | 36% |
| ‘08 | 800,000 | ↓11 | 3 | 11 | 40 | 35% |
| ‘09 | 682,500 | ↓15 | 3 | 6 | 52 | 17% |
| ‘10 | 662,000 | ↓3 | 2 | 15 | 67 | 25% |
| ‘11 | 525,000 | ↓20 | 2 | 7 | 70 | 13% |
| ‘12 | 565,000 | ↑8 | 4 | 10 | 101 | 14% |
| ‘13 | 490,000 | ↓13 | 5 | 9 | 135 | 10% |
| ’14 | 600,000 | ↑18 | 6 | 17 | 132 | 17% |
The current slim inventory of Gig Harbor waterfront—coupled with historically low interest rates & easier financing should keep prices rising in 2015. Median list price of the 38 homes in Gig Harbor/Fox Island is a shy $1m & in Key Peninsula $435,000 for the 18 homes listed. On the other hand, if an abundance of “pent-up sellers” list, it could hold down prices. I calculate a minimum of 250 Gig Harbor waterfront owners are ready to move—if market conditions (prices) permit.
Gig Harbor waterfront homes $1m plus sold on average for 150% of assessed value in 2014. Average frontage was 102 feet, considerably down from 170 feet the year before. Only 5 had more than 125 feet. 50% had docks or dock permits & 85% were low to medium-low…nothing unusual here. Homes $750,000-1,000,000 sold on average for 120% of assessed value.
Distressed Gig Harbor waterfront home sales are becoming nearly a non-issue—just 2% of the sales last year were short-sales and 5% were bank-owned, down 9% & 13% 3 years ago.
Carole is a Broker at Windermere/Gig Harbor, specializing in Gig Harbor waterfront and view properties. She may be reached at 253.549.6611 or Carole@ISellGigHarbor.com
]]>