Converting pre-tax retirement savings to a Roth raises a withholding question that trips people up: how much federal tax is withheld depends on whether the money comes from a 401(k) or an IRA. The tax you owe on the conversion itself is the same either way, and what changes is how much is withheld up front, which can make the April bill look very different.
Under federal law, a rollover from a pre-tax account to a Roth IRA adds to gross income any amount that would be includible were it not part of a qualified rollover contribution. The section 72(t) early distribution tax does not apply to the converted amount. The difference between the two paths is how and when you pay the tax.
Where the Convertible Money Sits by Age
The Federal Reserve’s Distributional Financial Accounts put the money in question mostly in the hands of people near retirement. As of 2026 Q2, families ages 55 to 69 held about $8.5 trillion in defined contribution benefits. That’s 49.5% of families’ total, and families ages 40 to 54 held another 33.1%.
Older families have also built up a larger share of these assets over time. People 70 and up held 2.3% of these assets in 1989 Q3, and that share reached 9.4% in the latest quarter. The Fed data covers defined contribution benefits by age, and the largest pre-tax balances sit with families ages 55 to 69.
Why a 401(k) Conversion Arrives With No Withholding
Inside an employer plan, a traditional-to-Roth move is called an in-plan Roth rollover. According to the IRS, “There is no income tax withholding required on an in-plan Roth direct rollover.” IRS guidance also clarified that you cannot voluntarily withhold on these rollovers. Converting $50,000 this way places the full amount into the designated Roth account.
You then settle the tax on your return. For 2026, the 22% rate applies to single taxpayers earning over $50,400, and the 24% rate starts over $105,700.
If the entire conversion falls into the 22% bracket, it adds $11,000 in federal tax. If it lands in the 24% bracket, the added tax is $12,000.
IRS Publication 575 notes that when a rollover creates taxable income, the taxpayer “may have to increase your withholding or make estimated tax payments.” In practice, the money for the tax comes from somewhere outside the converted balance. That usually means electing higher withholding from your paycheck or making quarterly estimated payments.
How the IRA Withholding Default Changes the Outcome
An IRA conversion counts as a nonperiodic distribution. Under federal law, the payer “shall withhold from such distribution an amount equal to 10 percent” unless the owner opts out. That opt-out applies on a distribution-by-distribution basis, and custodians typically collect it on Form W-4R. If the default stays in place on a $50,000 conversion, $5,000 goes to the IRS, and $45,000 reaches the Roth IRA.
The withheld money is treated as a distribution that was never converted. Conversion guidance from Wells Fargo (NYSE:WFC) notes that someone who chooses withholding to pay the taxes and is under age 59 1/2 may owe the additional tax on that portion. At 10%, the extra cost on $5,000 is $500, on top of regular income tax. The $5,000 also never grows tax-free inside the Roth.
The default withholding also falls short of the full bill. At the 22% rate, a $11,000 liability set against $5,000 withheld leaves $6,000 still owed in April.
Side-by-Side Comparison of the Two Conversion Paths
| Item | 401(k) In-Plan Conversion | IRA Conversion, Default Withholding |
|---|---|---|
| Federal withholding | None | 10% unless waived |
| Amount reaching the Roth | $50,000 | $45,000 |
| Extra tax on withheld amount, under 59 1/2 | Not applicable | $500 |
| Tax still owed at 22% | $11,000 | $6,000 |
Rule Changes to Watch Before Converting
IRA withholding is avoided when the withholding election is set to zero, so the full amount converts and you pay the tax from cash outside the account. Owners already past 59 1/2 avoid the additional tax. Even so, any amount withheld for them still leaves the Roth permanently. Timing matters too, and the low-tax years between the last paycheck and the first required withdrawal are often the cheapest window to run one (we sized up that window in a free Roth guide here: The Roth Window).
Rules for how rollovers are processed may change. In Notice 2026-49, released August 12, 2026, the Treasury Department and the IRS said they are considering guidance to standardize rollover procedures. One idea is a safe harbor that lets the distributing trustee reasonably conclude no withholding is needed on the rollover contribution. That proposal addresses rollovers between plans, while the 10% default on IRA-to-Roth conversions remains in the statute.
The post Convert $50,000 Inside a 401(k) and the Plan Can’t Withhold a Dollar of Tax From It. All $50,000 Lands in the Roth and the Bill Comes in April. Convert the Same $50,000 From an IRA and the Custodian Offers to Withhold, Which Is the Trap appeared first on 24/7 Wall St..
]]>Bank of America (NYSE:BAC) or Wells Fargo (NYSE:WFC): which beaten-down bank offers a retirement-focused income investor more right now? Bank of America has fallen 8.8% over the past month, compared with 0.2% for Wells Fargo. It now trades about 21.7% below its one-year high of $64.90, while Wells Fargo is 15.1% below its own high.
Interest rates make the choice harder. The Federal Reserve raised the upper bound of its target range from 3.75% to 4.00% in September. The two-year Treasury yields 4.65%, and the 10-year yields 4.96%, a gap of only 0.31 percentage points. Either Treasury pays more than both banks’ dividend yields. So a bank stock has to justify itself with two things a bond can’t offer: a dividend that grows and a price that has already come down.
Income Now and Dividend Growth: Bank of America Takes It
Bank of America yields 2.5%, against 2.4% for Wells Fargo. Its latest quarterly dividend of $0.32 reflects a 14.3% raise. Wells Fargo pays $0.50 per quarter after an 11.1% increase. The yield edge is thin, but Bank of America leads on both counts, and the bigger raise adds up over a retirement horizon.
Dividend Safety: Bank of America’s 2020 Record Settles It
Both dividends are well covered. Bank of America pays out 27.6% of trailing earnings and Wells Fargo pays out 26.5%. In 2020, Bank of America kept its quarterly dividend at $0.18 for every 2020 payment. Wells Fargo cut its dividend from $0.51 to $0.10.
Capital levels point the same way. Bank of America ended the third quarter with a CET1 ratio (the main measure of capital available to cover losses) of 10.9%. It still returned $8.3 billion through dividends and buybacks in the quarter. Wells Fargo’s ratio of 10% is at the bottom of the 10% to 10.5% range that CFO Mike Santomassimo targeted on October 13. He also said buybacks will depend on the rate environment.
Dip Quality and Rate Sensitivity: Bank of America Has More Upside
Bank of America’s drop traces to a $1.2 billion non-tax-deductible charge to settle Office of the Comptroller of the Currency (OCC) and Financial Crimes Enforcement Network (FinCEN) consent orders over anti-money-laundering and sanctions compliance. The charge reduced GAAP EPS by $0.17, and adjusted EPS of $1.08 missed the $1.11 consensus. Quarterly earnings fell 14.3% from a year earlier. Barron’s has also raised questions about the bank’s leadership.

Bank of America’s lending business kept growing. Net interest income rose 8% to $16.6 billion. On October 14, CFO Alastair Borthwick guided to approximately 8% net interest income (NII) growth for 2026 and 8% or more for 2027. Borthwick’s outlook assumes three 25-basis-point rate increases in December 2026, March 2027, and June 2027. Borthwick estimated that a 100-basis-point rise in rates above the forward curve would add $1.4 billion of NII over 12 months.
Wells Fargo, by contrast, has better near-term momentum. Third-quarter EPS was $1.87, up 13%, and net interest income grew 5%. Santomassimo kept full-year NII guidance at $50 billion, plus or minus, and the bank’s income is only modestly sensitive to rate changes. CEO Charlie Scharf highlighted the risk on the call: “Inflation and higher interest rates continue to be headwinds, and the longer they persist, the more pressure they could place on both consumers and commercial clients.”

Bank of America trades at 11 times forward earnings and 1.3 times book value. Wells Fargo trades at 11 times forward earnings and 1.5 times book. Bank of America wins this round because a one-time charge caused its drop, its interest income is growing faster, and it gains more if rates stay high.
Verdict: Bank of America Has the Stronger Dividend Case
For income investors buying the dip, Bank of America wins. It offers a higher yield, faster dividend growth, a dividend it held through 2020, a bigger capital cushion, and more earnings upside if rates stay high. Wells Fargo is the better fit for investors who prioritize near-term earnings momentum over dividend reliability.
Three developments would shift the verdict to Wells Fargo:
- A Fed that holds rates at 4.00% instead of raising them, reducing Borthwick’s interest income assumptions
- More regulatory costs at Bank of America
- Wells Fargo sustaining its double-digit EPS growth
The December Fed decision is the first test.


The post Bank of America Fell Harder Than Wells Fargo. Does That Make It the Better Dividend Buy? appeared first on 24/7 Wall St..
]]>All four of America’s largest banks have raised their quarterly payouts within the past six months: JPMorgan Chase (NYSE:JPM), Citigroup (NYSE:C), Wells Fargo (NYSE:WFC) and Bank of America (NYSE:BAC). Even so, the group’s best yield is only 2.3%. Because the yields are so close, what separates these four for an income portfolio is strength. That means how much of each bank’s earnings the dividend uses, how much capital sits above the regulatory floor, and what each board did the last time a crisis hit. Every one of these banks has cut its dividend at least once in the modern era, so a bank’s track record matters as much as its current payout (we laid out the seven warning signs that a big yield is about to be cut in a free report here).
JPMorgan Chase: The Fortress Payer With the Thickest Capital Cushion
JPMorgan yields 1.83% at a share price near $333. Among the four, the yield is the lowest, but the safety numbers are the strongest. The board just raised the quarterly dividend to $1.65 from $1.50, for an annualized forward payout of $6.60 per share.
Safety read: Trailing dividends of $6.15 against diluted EPS of $23.84 give a payout ratio of about 25.8%. JPMorgan ended the third quarter with a standardized CET1 ratio of 13.9%, the highest in this group. CEO Jamie Dimon estimated “probably $30 billion or something of excess capital”, and the bank holds $1.5 trillion of cash and marketable securities. The track record is mixed but solid. JPMorgan cut its quarterly payout from $0.38 to $0.05 in 2009. In 2020, though, it held the dividend at $0.90 per quarter and has raised the payout repeatedly since then.
Bull case: Dimon puts the dividend at the top of the capital list: “After you pay your dividend, which hopefully will be steady, we really like investing in organic growth.” Third-quarter ROTCE of 20% is above the bank’s through-cycle target of 17%. That gives income holders room for error, at a forward P/E of 14.
Risk: The trailing earnings include a one-time $4.6B Visa gain from the second quarter, so the payout ratio looks better than core earnings alone would justify. CFO Jeremy Barnum also warned that current conditions “are not typical by historical standards.”
Citigroup: Lowest Payout Ratio Behind a Turnaround That Is Starting to Pay
Citigroup yields 2.03% at about $122.61. The quarterly dividend rose to $0.67 from $0.60, a 12% increase, for an annualized forward payout of $2.68.
Safety read: Trailing dividends of $2.47 against EPS of $10.26 put the payout ratio near 24.1%, the lowest of the four. CET1 stands at 12.8% against an 11.6% requirement, a margin of roughly 120 basis points. Citi also has more than $1 trillion of available liquidity. Its history carries a deep mark: the payout fell to $0.01 in 2009 and stayed there until 2015. During the pandemic, however, Citi held its dividend at $0.51 without cutting it, and it has since raised the payout four times.
Bull case: Profitability is finally improving. Third-quarter ROTCE reached 11.5%, and management is aiming for 14% to 15% over the longer term. Year-to-date buybacks of $13.3 billion show that capital is flowing back to shareholders. CFO Gonzalo Luchetti put the framework this way: “We hold capital for resilience and flexibility, and we deploy it for returns and to distribute it to shareholders.” The forward P/E is just 10.
Risk: Citi assumes its regulatory minimum will rise to 13.1% starting in January 2028, which is above today’s ratio. The bank also expects a roughly $9 billion CTA-related loss to run through earnings in early 2027 as it deconsolidates Banamex. Management expects that process to be slightly accretive to CET1, but buyback flexibility could tighten.
Wells Fargo: Strong Raises, but the Most Recent Dividend Cut
Wells Fargo yields 2.26% at around $81.50. Its quarterly dividend rose to $0.50 from $0.45, for an annualized forward payout of $2.
Safety read: Trailing dividends of $1.85 against EPS of $7.12 produce a payout ratio of about 26.0%. CET1 is 10% against a minimum plus buffers of 8.5%, a margin of 150 basis points. CEO Charlie Scharf said the bank earns about $6 billion a quarter and that, after the dividend, this adds roughly 30 basis points to CET1 each quarter. The weak spot is the track record. Wells Fargo was the only one of the four to cut during the pandemic, slashing the quarterly payout from $0.51 to $0.10 in 2020. It has raised the dividend every year from 2022 through the latest increase, yet the payout is still $0.01 below where it stood before the cut.
Bull case: With the asset cap gone, the bank is growing again: average loans and deposits each rose 11% from a year ago. Third-quarter ROTCE of 16.3% is closing in on the 17% to 18% aim, and net charge-offs held at just 38 basis points of average loans. The forward P/E is 10.
Risk: Wells Fargo by design runs at the bottom of its 10% to 10.5% CET1 target range, and higher rates pulled the ratio down through AOCI losses last quarter. That leaves less spare capital if credit turns while the bank is expanding.
Bank of America: Highest Yield and Raises Every Year Since 2021
Bank of America offers the group’s top yield at 2.3%, with shares near $50.45. The quarterly dividend rose to $0.32 from $0.28, for an annualized forward payout of $1.28.
Safety read: Trailing dividends of $1.16 against EPS of $4.21 put the payout ratio near 27.6%. It is the highest of the four, but still conservative. CET1 is 10.9% against a 10% minimum. The bank returned $8.3 billion to shareholders last quarter, including $6 billion in buybacks. Funding is a real strength, with more than $2 trillion in deposits supporting $1.25 trillion of loans. In history, Bank of America cut its payout from $0.32 to $0.01 in 2009. It held at $0.18 through 2020 and has raised the dividend every year since 2021.
Bull case: CFO Alastair Borthwick described a simple order of priorities: “We know we have to support the regulatory minimum and the dividend, and then whatever is left, we’re going to return to shareholders.” Management expects net interest income to grow 8% or more next year, and card losses and delinquencies have improved for the sixth consecutive quarter. The forward P/E is 11.
Risk: Bank of America has the smallest regulatory margin of the four, at 90 basis points above the minimum, and management says buyback levels depend on final capital rules. Heavy loan growth could pressure that buffer further.
Ranking the Four: JPMorgan Owns the Safest Big Bank Dividend
JPMorgan ranks first. It pairs a payout ratio near 25.8% with the highest CET1 ratio in the group, around $30 billion of estimated excess capital, and an unbroken dividend through 2020. Citigroup ranks second on the lowest payout ratio and a wider margin than Bank of America, which ranks third on regular annual increases despite the smallest capital buffer. Wells Fargo comes last because its 2020 cut is the most recent flaw in the group, though its yield and growth make it the strongest recovery story among the four.
The post These 4 Big Banks Pay Similar Dividends. Their Balance Sheets Tell Another Story appeared first on 24/7 Wall St..
]]>Dividend investors usually have to pick between a dividend that grows fast and one that is well covered by earnings. However, three of the biggest U.S. banks are offering both right now.
JPMorgan Chase (NYSE:JPM), Wells Fargo (NYSE:WFC) and Goldman Sachs (NYSE:GS) each raised their quarterly payouts by double digits this year, and none of them pays out more than 29.6% of third-quarter earnings per share. That leaves most of each bank’s profit in reserve to fund buybacks, absorb losses on bad loans and pay for the next raise.
For a bank, earnings and regulatory capital do the job that free cash flow does at an industrial company, so coverage and capital buffers are the safety checks that count for income investors.
JPMorgan Chase: A Bigger Check Backed by Excess Capital
JPMorgan raised its quarterly dividend to $1.65 per share from $1.50, a 10% increase. That works out to an annualized $6.60 per share. At a share price around $338.87 on Tuesday, Oct. 20, the yield comes to about 1.97%. That is a growth-focused yield, so the income case here rests on how quickly the payout grows and how secure it is.
Coverage is strong. The new $1.65 quarterly dividend matches 29.6% of third-quarter EPS of $5.57. The bank earned $15.3 billion in net income for the quarter and ended it with a standardized CET1 ratio of 13.9%. The chief executive estimated excess capital at roughly $30 billion, adding, “that’s plenty.”
The dividend record supports that confidence. The quarterly payout was 44 cents in early 2016. In 2025 it went from $1.25 to $1.40 and then to $1.50, and this year’s increase makes three raises in under two years. Management also put the dividend first in its capital priorities, calling the payout as the commitment that comes “after you pay your dividend, which hopefully will be steady.”
Buybacks are still running, though they have slowed. JPMorgan’s net share repurchases came to $664 million in the third quarter, compared with total repurchases of $6.703 billion in the second quarter. The bank said it reduced share repurchases this quarter because it is putting that capital into lending and growth initiatives where it expects high returns. For dividend holders, that means the money is going into earnings growth that should support future raises. The board also authorized a new $50 billion repurchase program, so buybacks can pick up again when lending opportunities slow.
Bull case: The optimistic thesis is straightforward. The largest U.S. bank is valued at roughly 14x trailing earnings, keeps more than 70% of its profit after paying the dividend, and has room in its capital base to keep raising the payout.
Risk to keep in mind: Current earnings are being helped by unusually good conditions. The chief executive said a 17% return on tangible common equity is the through-cycle goal, compared with 20% last quarter, and noted “times are pretty good now with high volume and high asset prices and fairly low credit losses.” The quarter was also a rare profit miss. If returns fall back to normal levels, the payout ratio will rise even if the dividend remains flat.

Wells Fargo: Lowest Payout Ratio and the Highest Yield of the Three
Wells Fargo raised its quarterly dividend to 50 cents per share from 45 cents, an 11% increase. That works out to $2 a year. With the shares around $82.33 on Oct. 20, the yield is about 2.47%, the highest of the three stocks on today’s list. Part of the reason is price: WFC is only up 4.11% year to date, so new buyers get more income per dollar invested.
Coverage is the strongest in this group. The 50-cent dividend matches 26.7% of third-quarter EPS of $1.87, and EPS rose 13% from a year earlier. Credit quality held up, with net loan charge-offs at 38 basis points of average loans. The finance chief said there are “no signs of broad-based credit deterioration.” He also said quarterly earnings power of about $6 billion, after dividends, adds roughly 30 basis points to CET1 each quarter. In plain terms, the dividend is paid from earnings and still leaves capital to spare.
Income investors should know the full history. Wells Fargo cut its quarterly dividend from 51 cents to 10 cents in 2020. It has rebuilt the payout steadily since then, through 20 cents, 30 cents and 40 cents to today’s 50 cents. That puts the dividend almost back to where it was before the cut.
Buybacks are larger here than at JPMorgan. Wells Fargo bought back $2.5 billion of stock in the third quarter, after about $7 billion in the first half. A shrinking share count means each remaining share gets a bigger piece of earnings, which supports future dividend growth.
Bull case: The optimistic thesis centers on returns. Third-quarter ROTCE was 16.3%, and the chief executive said it “continues to increase and is getting closer to our 17% to 18% target.” Proposed Basel III changes could cut risk-weighted assets by about 7%, which would free up capital. The stock is valued at roughly 12 times trailing earnings, the lowest multiple of the three.
Risk to keep in mind: Wells Fargo has the smallest capital cushion of the three bank stocks on this list. Its CET1 ratio was 10%, at the bottom of its 10% to 10.5% target range, against a regulatory minimum plus buffers of 8.5%. Buybacks would be the first thing cut if capital tightens. The dividend would come after that.
Goldman Sachs: Two Raises This Year and a Dividend Ahead of Its Peers
Goldman is classified as a capital markets company rather than a diversified bank, but its dividend math looks a lot like the other two. The quarterly dividend rose to $5.00 from $4.50, an 11% increase, for an annualized $20.00 per share. With the shares around $880.71 on Oct. 20, the yield is about 2.28%. The stock fell 8.2% over the past month, which drove the yield higher.
This is actually Goldman’s second raise of the year. The payout went from $4 to $4.50 earlier this year before the latest increase. The finance chief calling the trend directly: “It’s obviously up 25% year over year. It’s now $5 a share. It was $4 a year ago. Five years ago, it was $2 a share.”
Coverage is solid even on a quarter that included one-time costs. The $5 dividend matches 29.4% of Q3 EPS of $17.01. That EPS figure already includes a charitable contribution that cut earnings by about $1 per share. Goldman ended the quarter with a CET1 ratio of 12.4% against a 11.4% requirement, and year-to-date return on tangible equity reached 22.4%.
Buybacks are larger than the dividend. Goldman bought back $3 billion of stock in the third quarter and paid $1.5 billion in dividends. Management places dividend growth just behind investing in the business: “We do expect to continue to invest in the sustainable growth of our dividend.”
Bull case: Goldman’s earnings are becoming more stable. The chief executive said the firm’s more durable revenue now makes up “approximately 45% of revenues for the year to date,” and assets under supervision reached $4.1 trillion. Those recurring fees help support the dividend in years when deal-making slows.
Risk to keep in mind: The rest of Goldman’s earnings still depend heavily on trading and deal activity. The investment banking backlog decreased from the prior quarter, and the stock’s beta of 1.284 is the highest of the three. A slowdown in capital markets would hit Goldman’s EPS harder than the others, which would drove its payout ratio up quickest.

Why These 3 Dividends Fit Together
JPMorgan, Wells Fargo and Goldman each raised their dividends by 10% or more while paying out less than 30% of quarterly earnings, and each kept buying back stock at the same time. Wells Fargo has the highest yield and the lowest payout ratio. JPMorgan has the most excess capital. Goldman has grown its dividend the quickest. All three pay their dividends first and have plenty of earnings left over, which is why their payouts can keep growing through an economic slowdown.
The post 3 Bank Stocks Raised Their Dividends 10% or More This Year and Pay Out Less Than 30% of Earnings appeared first on 24/7 Wall St..
]]>When a recession hits, the bank dividends that survive belong to the lenders with the deepest capital cushions. That makes balance sheet strength the right lens for America’s four biggest banks: JPMorgan Chase (NYSE:JPM), Bank of America (NYSE:BAC), Citigroup (NYSE:C) and Wells Fargo (NYSE:WFC). All four raised their quarterly payouts this year, and the scale of the cushion behind them is enormous. JPMorgan alone holds $1.5 trillion of cash and marketable securities.
Bank dividends follow a different rulebook. Regulators require large banks to hold common equity tier 1 (CET1) capital, their highest-quality loss-absorbing equity, above a minimum share of risk-weighted assets. The Federal Reserve’s annual stress test then adds a buffer based on how much capital each bank would burn in a severe recession. So a bank can be highly profitable and still be limited in what it returns. That is why bank payout ratios look low next to those of utilities or REITs: retained earnings are required capital. The trade-off is cyclicality. Credit losses climb in downturns, and net interest income (NII) moves with rates. Bank of America estimates a 100 basis point rate increase adds ~$1.4B of NII over 12 months, while a 100 basis point cut removes $1.9B.
JPMorgan Chase: The Deepest Capital Cushion in the Group
JPMorgan’s annualized forward dividend of $6.60 per share against a share price of $335 works out to a yield of about 1.97%, the lowest of the four. What income investors get in exchange is coverage. Trailing dividends of $6.15 against trailing EPS of $23.34 put the payout ratio near 26.3%.
The capital position is the strongest in this group. The standardized CET1 ratio stands at 13.9%, and management estimates roughly $30 billion of excess capital. Third-quarter net income was $15.3 billion, or $5.57 per share, with a 20% return on tangible common equity. Chief Executive Jamie Dimon put the dividend at the top of the capital stack: “After you pay your dividend, which hopefully will be steady, we really like investing in organic growth.”
The track record backs that up. The quarterly payout grew from $0.48 in late 2016 to $1.65, and it held at $0.90 through the pandemic stretch. The latest raise from $1.50 pays on 2026-10-31.
Bull case: The dividend uses only about a quarter of earnings, and management is putting the rest of its capital into growth it expects to earn strong returns, which supports future raises. Risk: The CFO warned that energy prices and higher rates mean “there are a lot of pressures building up” in corporate and commercial real estate credit.
Bank of America: Highest Yield, Thinnest Buffer
The recent selloff lifted Bank of America’s yield to about 2.49%, based on a $1.28 forward dividend and a $51.32 share price. The stock is down 13.7% over the past month after third-quarter adjusted EPS of $1.08 came in below the $1.10 estimate and a $1.2B regulatory settlement tied to anti-money-laundering consent orders weighed on GAAP results.
Earnings coverage is solid. Trailing dividends of $1.16 against EPS of 4.28 give a payout ratio near 27.1%. Liquidity is deep at $914 billion, and credit is improving: the net charge-off ratio fell to 0.44%. The dividend rose from $0.05 in 2016 to $0.32, held at $0.18 through 2020, and most recently stepped up from $0.28.
Bull case: The core bank is firing. NII rose 8% to $16.45B, and management expects it to keep improving through 2027. The bank still returned $8.3B in the quarter, including $2.2B of dividends, and trades at about 11 times forward earnings. Risk: Its CET1 ratio of 10.9% sits just 90 basis points above the regulatory minimum, the narrowest gap here. Another penalty or a credit shock would squeeze buybacks first and limit how fast the dividend can grow.
Citigroup: A Rebuilt Dividend Backed by a Turnaround
Citigroup yields about 2.19% on a $2.68 forward dividend and a $122.24 share price. Its payout ratio is the lowest of the four at roughly 24.1% (trailing dividends of $2.47 against EPS of 10.26).
The quarterly dividend fell from $0.16 to $0.01 in the financial crisis and stayed there through 2014. It then rebuilt to $0.51, sat flat for years, and has been raised each year since 2023. The latest raise of 12% took it to $0.67.
The capital base supports that. CET1 stands at 12.8%, about 120 basis points above its 11.6% requirement. Citi reports over $1 trillion of available liquidity and more than $22 billion of reserves. Year-to-date buybacks hit $13.3 billion.
Bull case: The restructuring is lifting returns. Third-quarter ROTCE reached 11.5%, Services earned a 31.2% ROTCE, and the stock trades at 1.155 times book value with a forward P/E of 10. Risk: Citi expects an approximate $9 billion CTA-related loss when Banamex is deconsolidated in early 2027. Management says the process should be slightly accretive to CET1, but the headline charge will hit reported earnings, and Citi’s payout record shows a crisis can still force a reset.
Wells Fargo: Asset Cap Gone, Dividend Nearly Restored
Wells Fargo yields about 2.48% on a $2 forward dividend and an $80.51 share price, after a 12.19% year-to-date decline. Trailing dividends of $1.85 against EPS of 6.9 give a payout ratio near 26.8%.
Its track record carries a recent scar. Wells Fargo cut its quarterly dividend from $0.51 to $0.10 in 2020. Since then it has rebuilt in steady steps to $0.50, still a penny below the pre-cut level. Third-quarter EPS grew 13% to $1.87, ROTCE reached 16.3%, and the net loan charge-off ratio was just 38 basis points.
Bull case: With the asset cap removed, average loans and deposits each grew 11%, and management estimates the Basel III proposal could cut risk-weighted assets by about 7%, freeing capital. CEO Charlie Scharf said ROTCE “is getting closer to our 17 to 18% target.” Risk: CET1 is at 10%, the bottom of its “10 to 10.5%” target range, and higher rates already pulled it down through AOCI losses on its securities, which reduce regulatory capital. That leaves less room to keep raising both buybacks and the dividend if rates rise further.
Which Bank Dividend Stands on the Strongest Footing
All four banks pay out about a quarter of their earnings, and that low payout is the real safety margin in bank income. JPMorgan is the anchor, with the most excess capital and a dividend it held through 2020. Citigroup and Wells Fargo are rebuilders whose returns are finally catching up with their payouts. Bank of America offers the highest yield after its recent drop, with the thinnest buffer of the four, so its CET1 cushion is the number to watch as rates and credit conditions shift. For income investors who want payers with multi-decade raise streaks rather than cyclical rebuilders, we ranked ten of them by valuation in a free Dividend Kings report.
The post America’s 4 Biggest Banks Are Raising Dividends. Which Has the Strongest Payout? appeared first on 24/7 Wall St..
]]>A one-time regulatory bill turned a solid lending quarter into an earnings miss for Bank of America (NYSE:BAC). Bank of America stock is at $51, down 5% in morning trading, after third-quarter 2026 results missed on revenue and earnings and absorbed a $1.2 billion money laundering penalty.
Meanwhile, JPMorgan Chase (NYSE:JPM) stock is at $330.59, down 0.3%, a far softer dip. Wells Fargo (NYSE:WFC) rounds out a trio of diversified U.S. lenders that don’t have to move together on a single bank’s result; WFC stock is down 0.62% and trading at $80.25.
The Financial Select Sector SPDR ETF (NYSEARCA:XLF) is flat, while the SPDR S&P 500 ETF Trust (NYSEARCA:SPY) is up 0.2%. The drop in Bank of America stock looks company-specific.
Money Laundering Penalty Triggers a Rare Earnings Miss
Bank of America posted adjusted earnings per share (EPS) of $1.08, missing the $1.10 consensus. Revenue of $29.96 billion fell short of the $30.58 billion estimate.
Regulators at the Office of the Comptroller of the Currency and the Financial Crimes Enforcement Network imposed the penalty a day before the results, citing failures in Bank Secrecy Act, anti-money laundering and sanctions safeguards and concluding the lender had effectively outsourced its compliance obligations. The non-tax-deductible charge cut generally accepted accounting principles (GAAP) EPS by $0.17, and it follows an enforcement order from nearly two years ago over the same weaknesses.
Lending Engine Keeps Growing Beneath the Charge
Underneath, Bank of America’s net interest income rose 8% to $16.45 billion on higher loan and deposit balances. Average loans climbed 6% to $1.23 trillion.
Chief Executive Brian Moynihan said in the release, “The team delivered organic growth, deepening client relationships and adding new ones. While investment banking and sales and trading revenues were lower, commercial lending grew in every client segment.”
Bank of America’s Global Wealth & Investment Management revenue grew 13%, Consumer Banking gained 4%, and the net charge-off ratio declined to 0.44%. The miss ended a streak of six consecutive quarterly beats.
Over the quarter, the bank bought back $6 billion of stock and paid $2.2 billion in dividends. It raised its dividend in July, and the quarterly payout now stands at $0.32 per share.
Wall Street Half Loses Momentum
Bank of America’s investment banking fees fell 11% to $1.8 billion. Fixed income, currencies and commodities trading revenue dropped 17% to $2.57 billion on weakness in mortgages, municipals and credit.
Its equities trading provided a partial offset, rising 11% to $2.51 billion. Management called its investment banking pipelines robust.
Moynihan also pointed to AI adoption. More than 200,000 employees use those tools, with over 300 approved use cases.
Remediation Costs Versus a Trading Rebound
Uncertainty remains over whether deal and trading activity recovers before ordered compliance remediation shows up in expenses. A growing loan book, rising net interest income and a one-time charge give the bank a sturdy base.
However, a second enforcement action raises the risk of heavier compliance spending, and Wall Street revenue could stay soft. Granted, Bank of America’s dividend increase and steady buybacks signal confidence in the company’s capital base. Still, investors should keep their BAC share positions modest.
The post Bank of America Falls 5% as $1.2B Money Laundering Penalty Drives Earnings Miss; JPMorgan Chase and Wells Fargo Hold Steady appeared first on 24/7 Wall St..
]]>The bull market that began in October 2022 turned four this week. Jim Cramer marked the anniversary on air by noting that the S&P 500 had gained 117% since the bottom, and in the same segment he argued that bonds, housing, and consumer stocks have already rolled over. “I would argue that either you’re in a bear market or you’re close to a bear market for most of the market,” Cramer said.
The data support both claims. An S&P 500 index fund is up 14.1% this year, but Wells Fargo (NYSE:WFC) is down 9.13%, and Capital One (NYSE:COF) is down 16.02%, even after both posted strong second-quarter results.
That gap matters if you own bank stocks, because the largest U.S. lenders sit where every force Cramer described comes together. Their earnings show what higher rates are doing to borrowers, while their share prices reflect how differently investors are paying for that strength.
Why a Record Index Can Hide a Bear Market
The S&P 500 is weighted by company size, so the largest companies drive most of its return. A few giant winners can lift the index while the median stock falls.
That comes from the math of weighting. One trillion-dollar stock rising moves the index more than dozens of smaller stocks falling together.
Among the banks, Citigroup (NYSE:C) is up 14.76% this year, while Bank of America (NYSE:BAC) is up just 0.82%. The broad financial sector fund has gained 1.73%.
Cost of Money Is Driving Everything Else
The 10-year Treasury yield reached 5.22% on October 8, and the 30-year hit 5.60%, up 0.35 percentage points in a month.
Cramer mentioned an 8% mortgage, which runs ahead of the published data. The national 30-year average is 7.40%, up 0.69 percentage points in a month and well above February’s 5.98% low.
Short rates are also rising. The fed funds upper bound is 4.00%, up 0.25% from a month ago.
Homeowners With Stocks and Renters With Balances Live in Different Economies
Higher mortgage payments freeze housing turnover. Existing home sales fell to a 3.98 million annual pace in August, which hurts brokers, movers and home-improvement retailers. Wells Fargo’s home lending revenue fell 7%.
A household that owns equities has compounded wealth through this period. A household that rents and carries a card balance pays an average APR of 21.19%.
Corporate earnings reflect that divide. Bank of America’s wealth unit posted record revenue, up 16%, while retailers that depend on financed purchases lose the customers who borrow to buy.
What Bank Earnings Will Confirm or Break
When banks report, watch net interest margin, credit provisions, loan growth, and deposit costs. Wells Fargo has guided to modest net interest margin compression in the third quarter.
Rising provisions and deposit costs that outpace loan yields would confirm Cramer’s bear view. Steady loan growth and flat provisions would contradict it.
So far the credit data look healthy. Capital One’s net charge-off rate fell to 3.23%, and it released $662 million in reserves.
The bullish argument is real, because employment has held and the four-year gains are large. If the 30-year yield falls and mortgages head back toward 6%, the market would likely expand into rate-sensitive sectors, and the bear thesis would no longer hold. Riding a four-year run while planning the exit is its own discipline, and we covered both sides in a free bubble survivor’s handbook.
How Bank Stocks Stack Up Against Cramer’s Bear Case
On the bull side, JPMorgan Chase (NYSE:JPM) earned $7.70 per share, which included a one-time gain on an equity stake. Bank of America bought back $6.0 billion of stock, and Wells Fargo and Citigroup each trade near 10 times forward earnings. A positive yield curve at 0.44% supports lending spreads, and U.S. Bancorp (NYSE:USB) expanded its margin to 2.79%.
The bear case covers credit normalization, commercial real estate, deposit competition, and a consumer living on credit. JPMorgan’s chief executive warned, “It’s getting close to as good as it gets. We just don’t know how long it’s going to last.”
On this data, bank stocks look reasonably placed, and the diversified universal banks appear stronger than card-heavy lenders. Their fee income, buybacks, and roughly 10x forward valuations give them a buffer that the rest of the market Cramer described lacks.
The post Jim Cramer Says Most of the Market Is Already in a Bear Market Despite S&P 500 Rally appeared first on 24/7 Wall St..
]]>Take-Two Interactive Software (NASDAQ:TTWO) stock is at $197.72, down 5% midday and off 23% year to date. Behind the drop is a Wells Fargo (NYSE:WFC) note that trimmed near-term estimates, and the selling looks company-specific because the rest of the gaming group is barely moving.
Gaming names around Take-Two tell a calmer story, and the contrast is sharp. Roblox (NYSE:RBLX) stock is flat at $49.60, holding steady even as Take-Two shares fall. Meanwhile, GameStop (NYSE:GME) stock is at $27.11, down 0.5%, a fraction of the move in Take-Two shares, and neither peer is responding to the Wells Fargo note.
The VanEck Video Gaming and eSports ETF (NASDAQ:ESPO) is flat, even though Take-Two represented 6.9% of the fund’s net assets as of June 30. For a wider benchmark, the SPDR S&P 500 ETF Trust (NYSEARCA:SPY) is down 0.1%, leaving Take-Two stock moving largely on its own.
Wells Fargo Cuts Near-Term Numbers but Keeps Its Overweight Call
Wells Fargo reiterated an Overweight rating and a $300 price target on Take-Two stock in the prior session. Beneath that headline, Wells Fargo trimmed its near-term bookings and adjusted EBITDA (earnings before interest, taxes, depreciation and amortization) estimates on weaker unit assumptions for the basketball franchise. Separately, Wells Fargo cut its recurrent consumer spending growth assumption on mixed player feedback to new gameplay mechanics and said Take-Two’s mobile business remains under pressure.
Looking ahead, Wells Fargo expects Take-Two’s third-quarter fiscal 2027 bookings and adjusted EBITDA guidance to come in below consensus. The rating and target remained unchanged. That is because of a Grand Theft Auto VI unit assumption that Wells Fargo places well above what it reads as implied in Take-Two’s current fiscal-year guidance. That gap is the whole debate in miniature: a weaker bridge to the release, paired with a bigger payoff once it arrives.

Gaming Group Holds Steady as Take-Two Falls Alone
Take-Two publishes the Grand Theft Auto and basketball franchises alongside a mobile portfolio, so its results turn on a few large releases and recurrent spending inside them. Roblox runs a user-generated platform, while GameStop is a specialty retailer. Each peer follows its own calendar, which keeps read-across inside this group weak.
Selling in Take-Two shares reflects a repricing ahead of a quarter Wells Fargo expects to guide below consensus, and with the VanEck fund and Roblox stock both flat, the evidence points back to the note itself.
What supports Take-Two is that the firm cutting near-term numbers kept both its rating and its target, because what it expects from Grand Theft Auto VI dwarfs the quarters in front of it. Rockstar Games, the Take-Two label behind the series, opened pre-orders in late June, and the game is scheduled to launch on November 19.

However, the bear case centers on the catalogue carrying Take-Two until that release, and both the basketball franchise and the mobile portfolio were marked down in a single Wells Fargo note, which suggests the path to launch is getting shakier. A softer bridge matters because Take-Two still reports another quarter before the release changes its results.
What to Watch Next
Take-Two’s next quarterly report lands in early November, on a date the company hasn’t confirmed, and that release is where the guidance Wells Fargo highlighted may surface. The open question is whether the pre-release catalogue holds firm enough to support the valuation until Grand Theft Auto VI ships.
The update is worth watching to see whether basketball unit trends and recurrent spending steady. Until then, TTWO shareholders may need to brace for more volatility around the report.
The post Take-Two Interactive Slides 5% as Wells Fargo Trims Estimates Behind $300 Target; Roblox Holds Flat, GameStop Barely Budges appeared first on 24/7 Wall St..
]]>Goldman Sachs (NYSE:GS) is setting the tone for the start of big-bank earnings season with its trading-led third quarter of 2026. Goldman Sachs stock rose 1% to $904.09 in early action after the investment bank topped Wall Street’s profit forecast on the strength of its equities business.
Meanwhile, JPMorgan Chase (NYSE:JPM) stock is basically unchanged at $334.39. At the same time, Wells Fargo (NYSE:WFC) stock is down 3% to $81.08 as the company’s third-quarter 2026 revenue of $21.87 billion disappointed WFC stock traders.
For a sector read, the Financial Select Sector SPDR ETF (NYSEARCA:XLF) is up 1% to $55.62. However, the SPDR S&P 500 ETF Trust (NYSEARCA:SPY) is down 0.1% to $777.41, leaving financials ahead of the overall market.
Equities Engine Powers a Big Earnings Beat
Goldman Sachs reported third-quarter results before the open, posting diluted EPS of $17.01 against a consensus estimate of $13.65. Its revenue came in at $18.68 billion, ahead of the $17.03 billion estimate.
Goldman’s equities business did the heavy lifting, generating $6.44 billion in revenue, up 72% from a year earlier, on prime and portfolio financing plus derivatives. Within that unit, the Equities Financing line jumped 96%. On the banking side, advisory fees reached a record $1.65 billion as completed merger volumes increased.

Trading-Heavy Model Sets Goldman Apart
In the earnings release, chief executive David Solomon stated, “Against the backdrop of a complicated operating environment, our clients continued to turn to Goldman Sachs for our world-class advice, execution and financing capabilities, resulting in our second highest quarterly net revenues and record year-to-date net revenues.” Goldman’s Asset & Wealth Management unit added stability, with revenue up 14% to $5.05 billion and assets under supervision at a record $4.1 trillion.
Alongside the results, Goldman disclosed agreements to acquire NEOS Investments and LCN Capital Partners, two privately held investment firms that expand its alternatives platform. On top of the deals, the firm declared a $5 quarterly dividend and bought back 2.9 million shares during the quarter at an average cost of $1,048.73, a level above where Goldman Sachs shares trade.
Rival capital-markets banks show the same trading strength. During Q2 2026, one peer’s equities sales and trading revenue rose 70% and another’s equity trading haul climbed 69%, a pace Goldman’s 72% third-quarter gain topped.
Backlog Dip Tempers the Trading Story
One soft spot sits in Goldman’s deal pipeline. The company said its investment banking fees backlog declined from the end of Q2 2026, primarily because of lower Advisory activity.
Goldman’s balance sheet also shifted. Its standardized common equity tier 1 ratio fell to 12.4% from 14.3% at year-end 2025, and wholesale loan losses drove credit provisions of $368 million. A charitable contribution of approximately $450 million to Goldman Sachs Gives also weighed on reported earnings.
On the other side of the ledger, Goldman’s year-to-date efficiency ratio improved to 59.4% from 62.1%. The firm also logged its 35th consecutive quarter of long-term fee-based net inflows.
What to Watch Next
Goldman’s conference call began at 9:30 a.m. ET, and management’s remarks on advisory activity could clarify whether the lower backlog catches up with the strength in trading. A firmer merger outlook would support the case that the beat is more than a trading spike.
It’s still early in the day, so anything can happen as traders weigh the data. Investors might consider reducing their bank-stock exposure as the market continues to bid or dump shares of GS, JPM, and WFC.
The post Goldman Sachs Rises on Equities-Led Earnings Beat; JPMorgan Chase Treads Water, Wells Fargo Declines 3% appeared first on 24/7 Wall St..
]]>Wells Fargo (NYSE:WFC) has announced another round of West Des Moines layoffs, with effective dates set for November 2026. The bank has reportedly already cut more than 1,500 Iowa employees since April 2022, according to state data. For older workers on those lists, a layoff can turn into a retirement decision almost overnight.
Consider a hypothetical laid-off worker who is 64. His last day of work is in November, he starts Social Security in December, and a severance check arrives in January 2027. The severance here is illustrative and may differ from Wells Fargo’s actual package.
His worry is a common one: will a big January deposit make it look like he went back to work? One retiree who was laid off in December and paid severance the next January later described getting an overpayment notice for $4,979. That kind of mix-up can often be avoided if Social Security gets the payment classified correctly.
The Payment Date Does Not Set the Work Date
Social Security lists severance among payments that can qualify for special-payment treatment. A special payment is money paid after retirement for work completed before he stopped working. His case rests on three facts: his job ended in November, all work required to earn the money was finished before he stopped working, and the January payment relates to that earlier job.
If a payment is not excluded as a special payment, Social Security may allocate termination pay to the last month worked or, when applicable, to the period it covers. A January payment for November work may therefore be treated as November earnings. The deposit date alone does not settle the question.
Before full retirement age (FRA), Social Security holds back $1 for every $2 you earn above the annual limit. Every $10,000 of severance wrongly considered above the 2027 limit would cost him $5,000 in withheld checks.
Severance terms decide whether a check gets kept out. Paid notice while still on payroll, regular salary, or money that required work after his last day each needs its own review.
December Faces a Separate Test
His 2026 wages still count. By November he had likely earned far more than the 2026 annual limit of $24,480. That alone would look like a problem.
A special monthly rule covers this. In your first year of retirement, Social Security pays a full check for any whole month it considers you retired. For someone under full retirement age (FRA) all year, that means earning $2,040 or less in the month and doing no substantial work in self-employment. With no paycheck and no business in December, he collects a full December benefit.
These are two different questions. Special-payment treatment determines whether the severance enters the earnings test at all. The monthly rule determines whether he can receive a December benefit despite having earned more than the annual limit before retiring. If the severance does not qualify as a special payment, its allocation could change the result.
Three Documents That Show When His Work Ended
- Separation agreement and final service date. This shows that his job ended in November and that he owed the bank no further work after that.
- Severance statement and W-2. His 2027 W-2 will list the severance as 2027 wages. The severance statement should spell out what the payment covers.
- Employer documentation on Form SSA-131. This report helps Social Security determine when the payment was earned and whether it qualifies for special-payment treatment.
If his reported earnings include a special payment, he should contact Social Security directly. The agency may not recognize it automatically.
What Special-Payment Treatment Leaves Unchanged
This treatment affects only the earnings test. The severance is still taxable wages in 2027. Stacked on top of his benefits, it could make more of his Social Security taxable that year.
A part-time job is another matter. If he takes one in 2027, those wages are new work, and the earnings test applies to them in the normal way.
Getting the Timeline on Record Early
An overpayment notice is much harder to fix after the fact. Collecting the separation agreement and the employer’s report before the 2027 W-2 reaches Social Security gives the agency the timeline it needs from the start.
Small details carry real weight here. A single clause in a separation agreement can change how a payment is treated, so read your own paperwork closely and don’t assume it matches a neighbor’s.
The post At 64, He Lost His Bank Job in November and Got Severance After Filing for Social Security. SSA Didn’t Treat Every Dollar as New Work appeared first on 24/7 Wall St..
]]>Bloomberg’s Joe Weisenthal put the market’s favorite theory to his guest flat out on Odd Lots. Are yields rising “straightforwardly because they’re issuing so many of them?” Carolin Pflueger said supply is “very simple” in her framework: “We’re all taxpayers and to the extent that we’re also holding bonds, it’s just going from one pocket to the other.”
Pflueger is an associate professor at the University of Chicago Harris School and a resident scholar at the Chicago Fed. She was speaking about her own research, and her comments do not represent the Fed’s views.
Her answer matters because of where rates sit. On October 2, the 10-year Treasury yielded 5.3% and the 30-year paid 5.63%. A week and a half earlier, CNBC’s Fast Money ran the headline “U.S. 10-Year Yield Hits 19-Year High.” Paul Christopher of Wells Fargo (NYSE:WFC) told CNBC that higher yields partly reflect compensation for competing bond issuance. If you build your portfolio around that story, you are protecting yourself from the wrong risk.
Why Pflueger’s Explanation Holds Up Better Than the Supply Story
Her verdict is right. The logic is the old economic idea called Ricardian equivalence. Every new Treasury bond is a future tax bill. The households paying those taxes are, through pensions, 401(k)s and money funds, the same households holding the bonds. Extra borrowing moves money between your left pocket and your right pocket.
Research by Pflueger and co-authors finds that the majority of the rise in the 10-year yield from 2020 to 2025 came from bonds becoming more stock-like. Changes in long-term inflation expectations explain much less.
Treasury data supports that. The 30-year inflation-protected yield sat near 3.3%. Strip that out of the 5.63% nominal yield and the market is pricing roughly 2.3% annual inflation over three decades. That sits close to the Fed’s 2% target. Most of the 30-year’s yield is real compensation for risk.
Pflueger pins down what that risk is: “There is actually something about the co-movement with the stock market which would suggest that these bond risks are at least to a first order priced against the stock market.” Bonds that fall when stocks fall are no longer insurance. Investors demand a higher yield to hold them.
Your Bonds’ Behavior in a Crash Decides the Outcome
The variable that matters is whether your bonds rise or fall when stocks drop. Take an sample $500,000 portfolio split 60/40, then hit stocks with a 20% decline. The stock side loses $60,000.
Say bonds act as a hedge and gain 5%. That adds $10,000, so the net loss is $50,000, or 10%.
Now say bonds move with stocks and fall 5%. The loss grows to $70,000, or 14%. The portfolio and the crash are identical. The only change is the sign on the bond move.
Long-duration holders have already lived through the bad version. Jared Woodard of Bank of America (NYSE:BAC) told Barron’s that the “20-plus year treasury bond ETF is down 40% since the summer of COVID.”
A 30-year bond that moves like a stock still pays its coupon. An sample $10,000 Treasury bought at 5.63% and held to maturity pays $563 a year no matter what its price does. Pflueger’s point is about what bonds do for you in a crash. The coupon continues paying even though the crash protection has worn off.
How to Rebuild Your Hedge While Long Bonds Act Like Stocks
- Look up your bond fund’s duration. Duration roughly tells you the percentage price drop for each one-point rise in yields. A fund with a duration of 15 loses about 15% if rates climb a point. That is equity-sized risk sitting in your “safe” bucket.
- Run the 20% crash test on your own balances. Plug in your actual stock and bond dollars. Model one case where bonds gain 5% and one where they lose 5%. That difference is the protection you may no longer have.
- Continues income and insurance in separate buckets. Individual Treasuries held to maturity can lock in income. For crash protection, short-term bills carry little price risk. The 1-month bill yielded 4%, so the safer bucket still pays.
- Plan home purchases around current rates. The average 30-year mortgage hit 7.3%, the highest reading in a year. If supply is a wash, slower deficit growth will not bring that rate down. Finance the purchase at today’s rate and treat any later refinance as a bonus.
You get paid 5.63% on the long bond because it now acts like a stock, so treat it as one when you size your safety net.
The post ‘It’s Just Going From One Pocket to the Other’: Chicago Fed Scholar on Why the 30-Year Pays 5.63% appeared first on 24/7 Wall St..
]]>JPMorgan Chase (NYSE:JPM) and Citigroup (NYSE:C) both just raised dividends, sharpening the choice for retirement-focused income investors. Both carry the same “diversified bank” label, but the label hides a wide gap. JPMorgan has long run with higher returns. Citi has spent years restructuring. That history determines everything about their dividends.
Income Today: JPMorgan Wins on Track Record
Citi pays slightly more per dollar invested. Its $2.68 annualized forward dividend yields about 2.12% at $126.55. JPMorgan’s $6.60 yields about 2.01% at $328.63. Both just raised payouts: JPMorgan to $1.65 from $1.50 quarterly, and Citi to $0.67 from $0.60, a 12% increase.

In stress periods, JPMorgan held at $0.90 through every 2020 payment and has climbed steadily since. Citi held $0.51 through 2020, too. During the financial crisis, though, Citi cut from $0.32 to $0.16 in 2008, its record shows no payments between January 2009 and May 2011, and it paid just $0.01 per quarter from 2011 to 2014. JPMorgan paid $0.05 per quarter in 2009 and 2010, but it kept paying. Retirees live on reliability, so a sliver of extra yield does not make up for Citi’s record.
Capacity to Keep Paying: JPMorgan’s Cushion Is Thicker
Every year, the Federal Reserve runs large banks through a hypothetical severe recession. The losses from that test set a “stress capital buffer,” meaning extra capital each bank must hold above its minimums. Only capital above that line can fund dividends and buybacks. The key gauge is the CET1 ratio: a bank’s highest-quality capital as a share of its loans and holdings, weighted by risk.
JPMorgan ended the second quarter at a 14.1% CET1 ratio, earned $16.9 billion and posted a 23% return on tangible common equity (ROTCE), meaning profit per dollar of shareholder capital. Trailing diluted EPS is $23.34.
Citi is improving fast. Its implied stress buffer fell to 3.3%, the third straight annual decline, and second-quarter ROTCE reached 13%. But its 12.8% CET1 sits only about 120 basis points above its 11.6% requirement, and management still guides to a 10% to 11% full-year ROTCE. Earnings have been bumpy, too: fourth-quarter 2025 EPS of $1.19 took a $1.2 billion loss on its Russia exit. JPMorgan wins this round clearly.
What You Pay: Citigroup Is Cheaper for a Reason
Citi trades at 10 times forward earnings and 1.155 times book value, with a PEG ratio of 0.6. JPMorgan costs 14 times forward earnings and 2.538 times book, with a PEG of 1.57.
Against their own recent trading, both have pulled back. JPMorgan sits below its 52-week high of $364.68, and Citi below its $147.21 high. Citi has gained 32.12% over a year versus 8.85% for JPMorgan. Over 10 years, JPMorgan’s 526.16% gain dwarfs Citi’s 247.24%.


Citi’s discount shows real gaps: its return on equity is 8.53% versus 17.8% at JPMorgan, and CEO Jane Fraser said removal of its regulatory consent orders is “fully at the discretion of our regulators.” Still, Barron’s argues Citi’s transformation can lift the stock, and the price already discounts plenty of risk. Citi wins on valuation.
Verdict: JPMorgan Holds the Edge on Dividend Reliability
JPMorgan takes two of three rounds, and they are the two that matter most to retirees. It kept paying through 2009 and 2020, carries more capital above its requirements and earns about double Citi’s returns on equity. That combination makes its dividend the one most likely to keep rising through the next downturn. JPMorgan’s higher valuation shows that strength.
The catch here is that if regulators lift Citi’s consent orders and its ROTCE holds above the 11% target, its discount to book value and faster dividend growth would improve its case for total-return investors willing to accept more volatility. Citi’s beta is 1.111, compared with 1.015 at JPMorgan. Watch third-quarter results from both banks for confirmation.
The post JPM vs. C: Which Bank Dividend Actually Survives the Next Crisis? appeared first on 24/7 Wall St..
]]>Wells Fargo (NYSE:WFC) and JPMorgan Chase (NYSE:JPM) both raised their dividends this summer, and both report quarterly results again soon. For a retiree, what matters is which payout lasts the next downturn. Wells Fargo pays the higher yield. JPMorgan has the better record.
Wells Fargo Pays More, but Only JPMorgan Held Firm in 2020
At $80.29, Wells Fargo’s $2 forward annual dividend yields about 2.49%. JPMorgan’s $6.60 on a $326.15 share price works out to roughly 2.02%. That gap is modest. Each bank pays out about 26% of trailing earnings, so both have plenty of room.
Their stress records are where they split. Wells Fargo cut its quarterly payout from $0.51 to $0.10 in 2020, and today’s $0.50 is still below that old peak. JPMorgan held $0.90 straight through the pandemic and just raised it to $1.65.
Why Capital Ratios Decide Your Bank Dividend
A bank’s board needs regulatory room to raise the payout. Regulators tie dividends and buybacks to capital levels and annual stress tests, so for a bank, capital strength is dividend safety. Wells Fargo’s CET1 ratio, which measures core capital against risky assets, fell to 10.3% from 11.1% after a $4.0B Q1 buyback. Management still says it operates “with significant excess capital.” JPMorgan approved a new $50B repurchase program and raised its credit-loss reserves to $31.4B (+12%). Building reserves like that is a conservative move, and I see it as a good sign.
| Revenue Driver | Wells Fargo (Q1 2026) | JPMorgan (Q2 2026) |
|---|---|---|
| Consumer | $9.998B (+7%) | $20.272B (+8%) |
| Corporate and Investment Bank | $5.278B (+4%) | $24.853B (+27%) |
| Wealth | $3.875B (+14%) | $6.851B (+19%) |
JPMorgan’s revenue moves more with markets. Equity markets revenue rose 86%, and a $4.6B Visa (NYSE:V) gain raised headline EPS. Adjusted EPS of $6.14 (+13%) gives the truer picture. Wells Fargo depends more on lending, and its net interest margin narrowed to 2.47% from 2.67%.
Wells Fargo’s Turnaround Has Momentum and Loose Ends
Regulators raised the asset cap in Q2 2025, and the Fed has since ended the 2018 order behind it (Investing.com). In total, 13 consent orders have been terminated since 2019. Growth followed: new card accounts rose nearly 60% and auto originations more than doubled. Still, office real estate nonaccruals of about $2.5B haven’t gone away. Morgan Stanley (NYSE:MS) recently argued that margin pressure is easing (Barron’s), but that is still a forecast.
What I’m Watching Before Both Banks Report
At Wells Fargo, I want to see progress toward its ~$50B net interest income guidance and a CET1 ratio that stops falling. At JPMorgan, watch whether investment banking fees, up 30%, hold up and whether the 3.33% card charge-off rate stays in check.
Why JPMorgan Is the Sturdier Income Stock
For retirement income, JPMorgan’s dividend record appears to be stronger. Wells Fargo has raised its dividend from $0.10 to $0.50 since 2021, but the 2020 cut showed how fast that check can shrink when capital gets tight. JPMorgan kept its dividend intact through a real crisis and now has more capital to spare. That record offsets the lower yield. My view changes only if Wells Fargo’s CET1 ratio steadies and its new growth holds up through a full credit cycle.
The post Wells Fargo’s Higher Dividend Yield Masks JPMorgan’s Superior Dividend Safety Record appeared first on 24/7 Wall St..
]]>Meta Platforms (NASDAQ:META) closed at $738.88 after Wells Fargo (NYSE:WFC) analyst Ken Gawrelski raised his price target to $1,000, implying about 35% upside. The average target across 63 analysts is $794.96, or about 7.6% above the share price.

Shares slipped 0.41% that session. The target was raised from $796, with an Overweight rating maintained, and it is now the highest currently tracked target for the stock.

The note itself explains why. The same model that produced $1,000 also expects Meta’s 2027 earnings to come in below consensus.
The highest target on the stock rests on a year the analyst expects to be weak, so its value depends on whether the gains he sees in 2028 arrive after a soft 2027.
Why Muse Sits at the Center of the $1,000 Target
Gawrelski wrote that “Investor enthusiasm around Meta’s Muse product cycle is warranted.” Muse is the AI agent Meta launched in September to complete tasks on a user’s behalf.
For an ad company, every new place people spend time can carry ads, transaction fees, or subscriptions. Meta already reaches 3.60 billion people daily, so it can put Muse in front of users without paying for distribution.
One estimate puts Muse revenue at over $27 billion by 2030, with about $23 billion from transactions and $4.5 billion from subscriptions. So far, the product has 6.6 million downloads and 1.8 million daily users.
Those figures are small next to the 2030 estimate, and although Meta’s reach gives it an advantage few companies have, usage has to climb sharply before that revenue is likely.
A Bullish Note That Expects a Weak 2027
Gawrelski expects the third-quarter call to moderate hopes for meaningful Muse revenue in 2027. He sees 2027 operating expenses of $210 billion to $215 billion, while the Street sits near $202 billion.
He calls 2027 earnings per share of $31 to $32 realistic, while consensus is near $34. He models $31.18 for 2027 and $40.02 for 2028.
In short, 2027 is the bottom, and 2028 is the return. Meta trades at about 24 times its 2027 estimate and about 18 times its 2028 figure.
Evaluating a stock on earnings two years out works only if spending peaks on schedule and Muse revenue arrives on time. If either slips by a year, you hold the bottom longer.
What Meta Has Guided Versus What the Analyst Assumes
Meta’s guidance covers 2026 only, with total expenses of $165 billion to $169 billion and capital spending of $130 billion to $145 billion. The analyst expects 2027 expenses to fall within that range.
The second quarter shows the mechanism. Revenue rose 28% to $60.80 billion, while earnings per share fell 13% to $6.18 as capital spending reached $31.08 billion.
Spending is being pulled forward ahead of the revenue it should produce. Depreciation and data center costs show up now, but returns from agents and enterprise sales come later.
Shares rose 19.88% over the past month. That gain likely reflects some of the enthusiasm around Muse.

Three Ways the $1,000 Case Could Break
The first test is legal costs, because a third-quarter charge well above $10 billion, or new losses in youth-related trials, would compound the bottom and push the recovery further out.
The second test is spending guidance, because if Meta guides 2027 above the analyst’s $210 billion to $215 billion, even the bearish half of the note would prove too generous and earnings estimates would likely fall further.
The third test is Muse engagement. If daily users stay near 1.8 million for several quarters, the 2030 revenue estimate has little support.
The next earnings report, expected in late October, tests the first two directly. A clean result on both would leave Muse adoption as the main open question.
What Investors Should Watch Before Meta’s Next Earnings Report
Ad revenue grew 27% last quarter on 14% more impressions and 12% higher prices per ad, so AI is already improving how Meta sells existing ad space.
The bearish parts of this note are already built into the model that produced $1,000. At about 18 times the 2028 estimate, the stock’s multiple sits alongside a business growing revenue near 28%.
Treat $1,000 as one analyst’s estimate of evaluating under specific assumptions. The $794.96 average is the more serious marker.
The stock has had a sharp one-month run, and the upcoming report could reset expectations. Investors researching the stock can compare Meta’s 2027 spending guidance in that report against the analyst’s assumptions.
The post Wells Fargo Just Put a $1,000 Price Target on Meta appeared first on 24/7 Wall St..
]]>Retirement investors choosing between Wells Fargo (NYSE:WFC) and Bank of America (NYSE:BAC) face one question: which big-bank dividend belongs in an income portfolio? Both raised payouts this summer and trade near 10x to 11x forward earnings. Wells Fargo fell 8.91% and Bank of America 13.1% over the past month. Bank of America comes out ahead.
Current Income: Wells Fargo Pays More per Dollar Invested
Wells Fargo lifted its quarterly dividend to $0.50 from $0.45, putting the forward annualized payout at $2 per share, or about 2.44% yield at $81.95. Bank of America raised its payment to $0.32 from $0.28, for a forward payout of $1.28 and a yield near 2.35% at $54.47.
Both payouts are covered equally well. Dividends took about 27% of Wells Fargo’s $6.96 EPS and about 27% of Bank of America’s $4.35. Bank of America’s raise was roughly 14% against Wells Fargo’s 11% increase. Wells Fargo wins on yield, with its quarterly payout climbing from $0.10 in early 2021 to $0.50 today.
Dividend Reliability and Capital: Bank of America Earns a Retiree’s Trust
Wells Fargo paid $0.51 per quarter through May 2020, then $0.10 starting in August 2020. Bank of America kept paying $0.18 and raised it to $0.21 in September 2021. Bank of America’s payout sat at $0.01 from 2009 through 2014, while Wells Fargo paid $0.05 in several 2009 and 2010 quarters. In 2020, Bank of America held its dividend and Wells Fargo cut.
Bank of America carries a deeper capital cushion. Its CET1 ratio was at 11.2% against a 10% minimum. Wells Fargo reported 10.3%, inside its 10% to 10.5% target range. Wells Fargo’s credit is better, with net charge-offs of 34 basis points versus Bank of America’s 0.47%. A dividend that held through 2020 and a larger capital buffer matter most for reliable payouts.
Valuation and Analysts: Bank of America’s Growth Comes Cheaper
Wells Fargo’s forward P/E is 10 versus 11 for Bank of America. But Bank of America’s PEG ratio is 0.846 while Wells Fargo’s is 1.385. Bank of America’s second-quarter EPS rose 34% to $1.21, its fifth straight beat. Wells Fargo’s rose 25% to $2.
Analysts favor Bank of America. It has 6 strong buy and 15 buy ratings against 3 holds, with a consensus target of $67.33 suggesting about 24% upside. Wells Fargo has 4 strong buys, 13 buys and 9 holds, with a $99.20 target suggesting about 21% upside.
Verdict: Bank of America Is the Stronger Retirement Dividend
Bank of America leads in two of three categories and offers the stronger dividend profile for retirement portfolios. Its dividend held through 2020 and its CET1 buffer is larger, worth more to an income investor than Wells Fargo’s slightly higher yield. It pairs durability with faster earnings growth at a lower growth-adjusted price. CEO Brian Moynihan said “capital generation and capital returns to investors remain strong.”
Wells Fargo fits a different retiree: one needing maximum current income and steadier stock. Its beta is 0.952 versus 1.214 for Bank of America, and management says the bank is growing its balance sheet after the asset cap was removed. Watch whether Wells Fargo keeps its CET1 inside target range while buying back shares, and whether Bank of America’s net interest income holds up if rates fall.
The post Wells Fargo vs Bank of America: Which Big Bank Dividend Is the Better Buy appeared first on 24/7 Wall St..
]]>AppLovin (NASDAQ:APP) rose 6.5% to $284.48 in morning trading on Oct. 5. The move is an attempt to end a nine-session losing streak. Daily closing prices confirm that streak: shares fell every session from September 22 through October 2, slipping from a $330.17 close on Sept.21 to $268.22 on Oct. 2. That is a drop of 18.76% in under two weeks. The stock is now down 57.78% year to date and 58.39% over the past year. The question is whether the business supports a recovery or whether this is a relief bounce in a stock that still carries heavy issues.

AppLovin (APP): Three Separate Overhangs Sank a Profit Machine
What Actually Went Wrong
The selloff comes from three separate problems, and each needs to be judged on its own.
1. The August revenue miss. Second-quarter revenue came in at $1.92 billion, missing the $1.94 billion consensus by 0.94%. EPS of $3.76 was roughly in line with the $3.7549 estimate. On the call, management blamed the timing of its AI model upgrades. Adam Foroughi said “our pace of meaningful model improvement was lighter than normal during the quarter, and the next step up in model performance landed just after quarter end.” The market did not accept that explanation. Shares went from $433.71 at filing to $346.80 one day later and $312.67 a week after. A securities fraud class action tied to the miss now adds legal pressure, with a lead plaintiff deadline of November 16.

2. The Unity lawsuit blow. AppLovin had asked a court to stop Unity Software (NYSE:U) from using its ad auction data to train or improve competing AI tools (according to coverage of the filing). On Friday, October 2, the court denied AppLovin’s request for a temporary restraining order. Wedbush said the ruling signals a competitive shift that could pressure MAX take rates. MAX is AppLovin’s mediation platform for app publishers, and this is a structural concern separate from the earnings miss.
3. Doubts about the consumer ad push. A note from Wells Fargo (NYSE:WFC) called a spike in Pixel downloads a “false start”. That cast doubt on how fast AppLovin’s e-commerce advertiser base is really growing. HSBC (NYSE:HSBC) cut its price target to $409 from $450 but kept a Buy rating. The Street mean target sits near $497.

Named Catalyst: A Model Upgrade Already Live for Q3
The recovery case rests on one specific event: the model improvement that went live just after the second quarter ended. Management said it was already helping growth pick up again and that “Q3 is off to a strong start.” According to Foroughi, after the release, advertisers reported that “install rates went up, CPIs went down, performance has improved.”
Third-quarter guidance puts numbers on that claim:
- Revenue of $2.055 billion to $2.085 billion, up 46% to 48% year over year and 7% to 8% from Q2
- Adjusted EBITDA of $1.71 billion to $1.74 billion, at an adjusted EBITDA margin of about 83%
- Guidance includes model improvements already running but leaves out any new model releases not yet deployed
A second, slower-moving catalyst is the public launch of AppLovin Ads Manager, which is aimed first at mid-market e-commerce advertisers. Consumer advertiser spending ended Q2 28% above Q4 2025 levels. That gain came even though Q4 is the seasonal peak for those advertisers.
Valuation Has Reset From 69x to 24x Earnings
The stock has fallen much faster than earnings. At the end of 2025, shares closed at $673.82 against full-year 2025 EPS of $9.75, roughly 69x trailing earnings. Today the trailing P/E is about 24. Over the same period, quarterly EPS rose from $3.24 in Q4 2025 to $3.76 in Q2 2026. The price-to-free-cash-flow ratio stands at 20.71, a free cash flow yield of 4.83%.

Profitability is still strong. Q2 revenue grew 52.82% year over year. Net income reached $1.27 billion, and adjusted EBITDA margin rose to 84% from 81%. Buybacks continued: $551.3 million in Q2, following about $1.0 billion in Q1.
What Has to Go Right
- Q3 revenue at or above the guided range. A result inside $2.055 billion to $2.085 billion would support management’s view that the Q2 miss was a timing issue.
- Stable MAX share despite Unity. In August, management said its “share of publisher waterfalls remained consistent.” That needs to hold after the court ruling.
- Computing spending that pays for itself. Management said about 10 cents of each new revenue dollar goes to compute, and it is aiming for a long-term adjusted EBITDA margin in the low 80% range.
- More consumer advertisers. Management admitted the consumer business currently relies on “few advertisers contributing more today.” It needs to show that base rose.
What Would Break the Comeback Case
The case fails if Q3 revenue comes in below $2.055 billion. That would mean a model upgrade already in the guidance could not deliver, which would turn the “timing” explanation into a fundamental problem. Margin guidance falling below the low 80s would point to rising computing costs without matching revenue. Evidence that Unity is winning publisher mediation share would confirm Wedbush’s take-rate warning. Management also acknowledged that Android is more competitive because “there’s a very big competitor out there doing well there.”
Options and Retail Positioning on the Bounce
The full-chain put/call ratio is 0.55, which points toward calls. Calls expiring October 9 at strikes from $257.50 to $322.50 show volume above open interest, a sign of fresh trading activity. That data alone does not show whether traders were buying or selling. Reddit opinion improved to 77.52 from 60, though activity remains low. One recent post framed the debate as “AppLovin mispriced opportunity or value trap?” The rebound is also happening on below-average volume, which fits a bounce from oversold levels more than a lasting reversal.
The fundamentals support the recovery case better than the chart does: revenue growth above 45%, margins in the 80s, and a multiple that has fallen from about 69x to 24x earnings. One rebound session does not clear the Unity ruling, the class action, or the doubts about consumer ads. The Q3 earnings report is the real test. Revenue inside the guided range supports a re-rating. A result below $2.055 billion would show this bounce was a dead-cat rally, so keep an eye on the stock through that report.
The post AppLovin Stock is Soaring 6.5% — Will It Break a 9-Day Losing Streak? appeared first on 24/7 Wall St..
]]>Pre-Market Stock Futures:
Futures are trading lower as we get ready for the first full week of trading for the fourth quarter of 2026 after an outstanding Friday, which saw all of the major indices finish the day higher, after the non-farm payroll numbers for September came in well below estimates before the open and caused a large Treasury sell-off that countered Thursday’s buying spree.
On Friday, the Nasdaq stormed to an intraday all-time high before closing at 27,190, up 1.19%, while the small-cap Russell 2000 also finished strong, up 0.94% at 2,932. The S&P 500 closed the session at 7,7722 up 0.73%, while the Dow Jones Industrials closed the week at 51,176, up 0.49%. Wall Street strategists will watch the ISM Services results early in the week, a major gauge of economic strength, plus the FOMC notes on Wednesday, which will give investors color on why the Fed raised rates in September and what it may do at its late-month October meeting.
Treasury Bonds:
After a huge selling spree following the non-farm payroll results early Friday, some buyers stepped in, but by the close yields were higher across the Treasury curve except for the shortest T-bill maturities as the sellers returned in force by the afternoon. The very weak non-farm payrolls report signaled to many that a rate hike at the October meeting may be totally off the board. The 30-year bond closed Friday at 5.62%, while the 10-year note was last seen at 5.27%.
Oil and Gas:
The energy complex had a fairly mild end to the week as the G7 announced it would release 100 million barrels from reserves to counter the diesel fuel crisis in Europe and worldwide. Meanwhile, oil from Iran started flowing to Tajikistan despite U.S. sanctions, which could prove interesting. When the markets closed, Brent Crude finished the session at $102.80, up 0.47%, while West Texas Intermediate closed the day at $91.26, down 1.72%. Natural gas finished the week strong, closing at $3.05, up 2.73%.
Gold:
After a solid week for the bullion, the sellers showed up on Friday. A stronger dollar and initially weak jobs data drew buyers early in the session, but that reversed; by the close, gold was last seen at $4,139, down 0.88%, while Silver closed at $60.27, down 1%.
Crypto:
Cryptocurrency markets were highly volatile on Friday, surging early in the morning before erasing most gains after the U.S. jobs report. Bitcoin spiked above $87,200 early Friday, propelled by short covering, a brand-new $113,000 Citigroup price target, and a bullish “golden cross” chart pattern. However, as gold and equities pulled back, broader crypto markets faced strong selling pressure later in the day, dragging Bitcoin back to around $84,490 by the market close. At 8 AM EDT, Bitcoin was trading at $86,120, while Ethereum was quoted at $2,718.
24/7 Wall St. reviews dozens of analyst research reports every day to identify fresh investment ideas for investors and traders alike. These daily analyst notes include recommendations on stocks to buy, sell, or avoid, as well as new coverage initiations. Important reminder: No single analyst report should ever be the sole basis for buying or selling a stock.
Here are some of the top Wall Street analyst upgrades, downgrades, and initiations from Monday, October 5, 2026.
Upgrades:
- Estee Lauder (NYSE: EL) was upgraded to Outperform from Sector Perform at Barclays, which raised the price target for the stock to $108 from $97.
- Harley-Davidson (NYSE: HOG) was raised to Buy from Neutral at Citigroup, which bumped the target price to $33 from $31.
- Microsoft Corporation (NASDAQ: MSFT) was upgraded to Buy from Hold at Melius Research, which has a $665 target price for the technology giant.
- Ryder System (NYSE: R) was upgraded to Overweight from Neutral at JPMorgan, which nudged the target price to $298 from $296.
- Wells Fargo & Company (NYSE: WFC) was upgraded to Overweight from Equal Weight at Morgan Stanley, with an unchanged $102 target price.
Downgrades:
- Align Technology (NASDAQ: ALGN) was downgraded to In Line from Outperform at Evercore ISI, which slashed the target price for the shares to $155 from $220.
- AutoNation (NYSE: AN) was downgraded to Equal Weight from Overweight with a $175 target price.
- Group 1 Automotive (NYSE: GPI) was downgraded to Underweight from Equal Weight at Morgan Stanley, with a $232 target price.
- HubSpot (NASDAQ: HUBS) was cut to Market Perform from Outperform at Raymond James, without a target price.
- Mosaic Company (NYSE: MOS) was downgraded to Sector Perform from Outperform at RBC Capital, which trimmed the target price to $25 from $27.
Initiations:
- nVent Electric (NYSE: NVT) was initiated with an Outperform rating at BMO Capital, which has a $212 target price for the shares.
- Revolution Medicines (NASDAQ: RVMD) was resumed with an Outperform rating at Leerink, which has a $288 target price.
- Samsara (NYSE: IOT) was initiated with a Buy rating at Jefferies, with a $50 target price.
- Vertiv Holdings(NYSE: VRT) was initiated with an Outperform rating at BMO Capital, with a $329 target price.
- Vylor (NASDAQ: VYLR) was initiated with a Buy rating at Vertical Research with a $74 target price.
The post Here Are Monday’s Top Wall Street Analyst Research Calls: Align Technology, AutoNation, Estee Lauder, Harley-Davidson, HubSpot, Microsoft, Mosaic, Ryder System, Wells Fargo & Company, and More appeared first on 24/7 Wall St..
]]>A Vermont Gas Pump and a California Utility
On January 13, 1959, a Vermont man bought 39 shares of Pacific Gas & Electric for about $2,380. . A gas station attendant was buying part of a utility important for America.
Ronald Read worked as an attendant and mechanic at Haviland’s Service Station for about 25 years and spent 17 years as a part-time janitor at J.C. Penney, until 1997. These were working-class jobs.
How the First Purchase Started a Five-Decade Habit
Read’s fortune came from more than five decades of regular purchases paid for out of those two paychecks, plus dividends he reinvested along the way. That first block of utility stock is simply where the habit started.
A Portfolio Built From Boring Blue Chips
He eventually held 95+ stocks focused on dividend-paying blue chips: Procter & Gamble (NYSE:PG), Johnson & Johnson (NYSE:JNJ), General Electric (NYSE:GE), Wells Fargo (NYSE:WFC), Colgate-Palmolive (NYSE:CL) and Dow Chemical (NYSE:DOW). He bought these over his lifetime, held them rather than trading, and avoided tech stocks he didn’t understand.
Anyone could have used this method. He picked unglamorous companies that paid dividends, reinvested the income, rarely sold, and kept going for longer than most people work (we ranked ten of today’s longest-running dividend growers by valuation in a free Dividend Kings report if you want a starting short list).
Ronald Read’s Nearly $8 Million Reveal
Ronald Read died on June 2, 2014, at age 92 his portfolio was worth nearly $8 million.
Some people knew part of the picture. His bank and his family had some awareness of his holdings. What his community didn’t know was how big the portfolio had grown.
Where the Money Went
NBC News reported that $4.8 million went to Brattleboro Memorial Hospital. NBC News also reported that $1.2 million went to Brooks Memorial Library. According to NBC News, $2 million went to stepchildren, caregivers and friends.
What We Can Copy From Read’s Strategy, And What We Can’t.
He had modest wages and no financial training, and he got there through time and consistency alone. The parts we can copy are simple: reinvest dividends, hold for decades, keep adding money, and skip businesses we can’t explain.
On the other hand, five decades is longer than many investors have to stay in the market. Read’s strategy only generates massive returns by staying invested for the long haul.
The post In 1959, A Vermont Gas Station Attendant Spent $2,380 On His First 39 Shares Of Stock. Over The Next 5 Decades, He Built A 95+ Stock Portfolio Of Blue Chip Dividend Payers. By 2014, Ronald Read’s Portfolio Was Worth Nearly $8 Million appeared first on 24/7 Wall St..
]]>In September, Elon Musk was asked on stage why Tesla (NASDAQ:TSLA) and SpaceX (NASDAQ:SPCX) are still separate companies. He answered with a joke and a hint. On the All-In episode published September 15, 2026, where he appeared with Gwynne Shotwell, Musk said: “Yeah, great question. Wow. Nobody’s ever asked that one.” He then added: “With all this collaboration on so many levels, who can imagine what action one might take.”, according to Tesla
That is everything that happened. No board has approved a deal. No terms exist, and no one has named a completion date. Musk left the door open, and the size of the two companies makes that worth tracking: Tesla is worth about $1.47 trillion and SpaceX about $1.21 trillion.


Musk’s July Answer Had More Detail
The September joke followed a more careful answer on Tesla’s July 22 earnings call. An analyst at Wells Fargo (NYSE:WFC) asked about combining the companies. Musk said “we can’t talk about combining companies and that kind of thing” and that “it’s got to be done with the appropriate process.” Tesla’s general counsel then described “numerous beneficial transactions” with SpaceX, a relationship deepened “through an investment and a framework agreement.”
Shared Projects Already Run on Contracts
Tesla disclosed a about $2 billion investment in xAI Series E Preferred Stock in its Q1 2026 release. xAI’s Grok now sits inside SpaceX’s AI business. On the July call, Tesla’s finance chief said net income benefited from “a mark-to-market gain of $1 billion on our SpaceX holdings.” The two companies are building a semiconductor research fab at Gigafactory Texas. Grok runs in Tesla vehicles, Starlink is being built into the Cybercab, and SpaceX has bought Megapacks to smooth out power use during AI training runs.
All of this happens through contracts and a minority stake. The companies can work together without common ownership, so anyone pushing a merger has to show what combining adds that contracts cannot.
Exchange Ratio Decides Who Comes Out Ahead
SpaceX began trading on Nasdaq after its June 2026 IPO. SpaceX shares already trade publicly at $157.17. So any merger comes down to price. In an all-stock deal, each company’s shareholders get a negotiated share of the combined business.
The exchange ratio sets that share. It is the number of shares of one company that each share of the other converts into, and it reflects the valuations each board accepts, often plus a premium. A merger can create value overall and still move value from one shareholder group to the other if the ratio is wrong.
The terms would lock in a moment when the two businesses look very different. In Q2, Tesla revenue rose 25.5% to $28.24B. Operating income fell 56.9% to $398M, and non-GAAP EPS of $0.33 missed the $0.54 estimate. SpaceX revenue grew 92% to $7.81B, with AI revenue up 247%. Quarterly capex was $18.37B, and SpaceX’s filing shows $15.83B of that went to AI computing power. Tesla shares are down 16.98% year to date. SpaceX is down 2.35% since June 12.

Governance Questions Tesla Holders Should Raise
Musk runs both companies, so every valuation question is also a conflict-of-interest question. These are the questions to ask:
- Would each board set up a committee of independent directors with its own advisers and the power to turn down a deal?
- Would the deal need approval from a majority of Tesla shareholders who are not connected to Musk?
- How would the deal treat the 2025 CEO Performance Award, which is already pushing up stock-based compensation?
- What does the framework agreement cover, and how are current deals between the two companies priced?
- Who gets the fab’s chip output when both companies need more AI chips?
What to Watch Next
A real proposal would show up in SEC filings and on the Tesla and SpaceX investor relations sites. It would lay out the deal structure, the exchange ratio, and independent fairness opinions. Until that happens, Musk’s comments are a reason to value each stock on its own fundamentals and to have a clear view of what a fair ratio looks like before any proposal comes.
The post Elon Musk Hints at Tesla-SpaceX Merger: “Who Can Imagine What Action One Might Take” appeared first on 24/7 Wall St..
]]>A single research note is reopening the debate over how much real merchant traction sits behind AppLovin‘s (NASDAQ:APP) e-commerce push. AppLovin stock is down 3% to $281.31 this morning. Meanwhile, shares of The Trade Desk (NASDAQ:TTD) are up 0.2% to $12.20, sitting out the selling that has hit AppLovin stock.
Magnite (NASDAQ:MGNI) shares are sliding 0.7% to $25.08, a far softer decline than the one in AppLovin stock. The Invesco QQQ Trust (NASDAQ:QQQ) is also down 0.1% to $738.80, leaving large-cap technology close to flat. Taken together, those moves frame the drop in AppLovin stock as a repricing of one company’s growth story, with little evidence of a broad ad-tech selloff.
Wells Fargo Calls the Pixel Spike a False Start
The pressure traces to a note from Wells Fargo (NYSE:WFC) telling clients that a recent spike in merchant Pixel installs at AppLovin looks weaker than the raw count suggests. Investors asked about Pixel adds over the past two weeks. Wells Fargo found that raw installs did rise while the mix of new sites failed to improve. Most of the new sites, the firm determined, were Asia-Pacific storefronts built on Shopify (NASDAQ:SHOP) with little or no measurable web traffic.
On a traffic-weighted basis, Wells Fargo sees no meaningful pickup, pushing back on the idea that AppLovin’s e-commerce customer growth had suddenly accelerated. Calling the burst a false start, the firm stated that a real e-commerce turn at AppLovin still looks more like a story for next year. Wells Fargo kept an Equal Weight rating and a $325 price target on AppLovin stock.
Why Pixel Installs Matter for AppLovin
Analysts treat new Pixel installs as a merchant testing count. The tally is one of the few public indicators for whether AppLovin’s web advertising push is landing real stores. That role explains why a note on install quality is weighing on AppLovin stock, where selling centers on a measurement question with Wells Fargo challenging what the install count means for AppLovin’s merchant growth.
In any case, AppLovin stock is down 58% year-to-date. That steep slide has made AppLovin shares highly sensitive to any read on the company’s web advertising push, and a single note on install quality was enough to add fresh pressure.
Notably, Trade Desk stock is barely changed and Magnite shares are only slightly lower, which points to an AppLovin-specific repricing.
What to Watch Next
Fresh Pixel data showing installs from storefronts with measurable traffic could answer the core objection in the Wells Fargo note on AppLovin. A traffic-weighted pickup would challenge the firm’s view that a real e-commerce turn at AppLovin belongs to next year. Any shift in the mix toward higher-traffic merchants could matter more for AppLovin than the raw install total.
Careful calibration of one’s holdings makes sense given AppLovin’s 58% decline year-to-date and a Wells Fargo timeline that places a real e-commerce turn next year. Patience may be the best attitude toward AppLovin stock while the market sorts out how much of the company’s web growth reflects real merchants.
The post AppLovin Falls 3% as Wells Fargo Calls Pixel Install Spike a False Start; Trade Desk Sits Out the Selloff, Magnite Dips appeared first on 24/7 Wall St..
]]>A retiree has $500,000 in cash and wants all of it protected. She opens an individually owned savings account at two different FDIC-insured banks and puts $250,000 in each. That is exactly what deposit-insurance guidance tells people to do.
Then the two banks merge. Her coverage does not change on the legal merger date. Six months later, insurance on $250,000 of it can end, even though she never moved a dollar.
For many retirees, this is also where the monthly Social Security benefit lands, building the cash buffer that covers the gap between checks and bills.
Why Two $250,000 Accounts Cover All $500,000
The FDIC insures up to $250,000 per depositor, per insured bank, per ownership category. One individual account at Bank A and one at Bank B count as two separate banks, so each balance gets its own full limit.
| Stage | Deposits | Insured |
|---|---|---|
| Before merger | $250,000 + $250,000 | $500,000 |
| Six-month grace period | $500,000 at merged bank | $500,000 |
| After grace period | $500,000 at merged bank | $250,000 |
Six Months of Borrowed Protection After a Merger
When one insured bank buys another, the FDIC keeps insuring deposits from the two former banks separately for six months from the date of the merger. This gives depositors time to move their money.
When that window closes, savings balances in the same ownership category get added together. Her $500,000 now sits under one $250,000 limit. That leaves $250,000 potentially uninsured if the merged bank ever failed. She stayed within the limit the whole time. The banks changed around her.
CDs Run on a Different Clock
A CD acquired in a merger that matures after the six-month window stays separately insured until it matures. A CD that matures inside the window and renews for the same term and amount keeps separate coverage until its first maturity after that grace period. Changing the term or amount can end that treatment sooner.
Where Social Security Changes Her Math
The first link is direct deposit. If her benefit lands in an account already holding $250,000, every new payment can push more of the balance above the insured limit. Keeping the receiving account below the ceiling leaves room for those deposits and any interest the account earns.
The second link is taxes. Moving $250,000 is a natural time to hunt for a better yield. But additional interest counts toward the formula that determines how much of her Social Security can become taxable.
Add half her annual Social Security benefit to her other income, including interest. For a single filer, up to 50% of benefits can become taxable once combined income exceeds $25,000, and up to 85% can become taxable above $34,000.
She receives $24,000 a year and puts all $500,000 into Treasury bills. At the 26-week bill’s 4.36% annualized yield on September 25, that corresponds to about $21,800 in annualized interest. Add half her benefit and her combined income reaches about $33,800, just under the $34,000 threshold.
Treasury bills are another option. The federal government backs them, and FDIC limits don’t apply.
Bank Merger Chatter Makes This Timely
Talk about big lenders such as Wells Fargo (NYSE:WFC) shopping for acquisitions picked up in August 2026. Anyone who spread cash across banks to stay under FDIC limits should treat any merger announcement as a to-do item.
Checklist Before Month Six Arrives
- Find the legal merger date. The six-month period starts when the two banks legally become one institution, which is often months after the announcement.
- Confirm the two banks are actually becoming a single FDIC-insured bank. Two brand names on one charter count as one bank for insurance.
- Add up every deposit you’ll hold at the combined bank in each ownership category, including the account that gets your Social Security.
- Check your CD maturity dates, because some CDs keep separate coverage past the six-month mark.
- Move the excess early. Sending $250,000 to another separately chartered bank puts you back at $250,000 in each and full coverage. The FDIC’s Electronic Deposit Insurance Estimator helps when your accounts are set up in more complicated ways.
What Deserves the Most Attention
The hardest mistake to undo is letting the grace period run out without noticing. Insurance only matters if a bank fails, and by then it’s too late to move anything. It’s the kind of silent rule that can leave retirement money exposed without warning, and we mapped it alongside several others in a free guide to the traps retirees keep tripping over. When you transfer, run the new interest through the Social Security tax math so a higher yield doesn’t cost you more than expected.
She split the money so every dollar would be insured. Her balance stayed the same. What changed was how many banks protected it.
The post She Split $500,000 Between Two Banks for FDIC Protection. If They Merge, Half Her Coverage Could Expire Six Months Later appeared first on 24/7 Wall St..
]]>After a two-decade career at Bear Stearns, Lehman Brothers, and Morgan Stanley, I gained an institutional perspective on dividend stock investing. My tenure at these premier Wall Street firms exposed me to fundamental analysis, credit evaluation, and risk management practices that directly translate into selecting high-quality dividend-paying companies.
By analyzing cash flow generation, capital allocation strategies, and management quality at scale, I can identify companies with durable competitive advantages and the financial discipline to maintain and grow their dividends through economic cycles. Early in my career, I realized that dividend investing is not merely an income strategy but also a comprehensive framework for building wealth through companies that consistently return capital to shareholders while maintaining financial stability.
While much has changed since I started as a stockbroker in 1991, quality financial companies that dominate the industry and pay dependable dividends never go out of style. The big money-center banks and brokerage firms dominated then and still do. At the same time, investors can buy five companies now at reasonable valuations and hold them in a growth-and-income portfolio indefinitely.
Financial companies, particularly banks, generally perform better when interest rates rise because their net interest margins expand. When the Federal Reserve or other central banks raise benchmark interest rates, banks can widen the gap between what they earn on loans and what they pay to depositors, directly boosting their profitability.
Five top financial companies are poised to do well in the current rising-rate environment, and all pay reliable dividends that are often increased yearly. All five are buy-rated by top Wall Street firms we cover.
Bank of America
While Warren Buffett has trimmed his position over the past two years, selling a whopping 50 million shares in the fourth quarter of 2025 and 30 million more this year, this quality financial giant remains an exceptional long-term holding with a solid 1.93% dividend yield. The dividend was raised from $0.26 to $0.28, then to $0.32 per quarter, with two increases over the last 12 months. Bank of America (NYSE: BAC) is a bank holding company and financial holding company that reported impressive Q2 results.
Its segments include:
- Consumer Banking, which offers a range of credit, banking, and investment products and services to consumers and small businesses.
- Global Wealth & Investment Management comprises two businesses:
- Merrill Wealth Management, which offers tailored solutions to meet clients’ needs through a comprehensive suite of investment management, brokerage, banking, and retirement products.
- Bank of America Private Bank provides comprehensive wealth management solutions.
- Global Banking offers a range of lending-related products and services, including integrated working capital management and treasury solutions, as well as underwriting and advisory services.
- Global Markets offers sales and trading services, as well as research services, to institutional clients across fixed income, credit, currency, commodity, and equity markets.
UBS has a Buy rating with a $70 target price.
Citigroup
Rising interest rates and a very reasonable valuation make this a great stock to own now. It has a 1.82% dividend yield. Citigroup (NYSE: C) is a global diversified financial services holding company. Its segments include:
- Services
- Markets
- Banking
- Wealth
- U.S. Consumer Cards
The Services segment includes Treasury and Trade Solutions (TTS) and Securities Services. TTS provides an integrated suite of cash management, trade, and working capital solutions to multinational corporations, financial institutions, and public sector organizations.
The Markets segment provides corporate, institutional, and public sector clients with sales and trading services across equities, foreign exchange, rates, spread products, and commodities. The Banking segment includes investment banking, which supports client capital-raising needs. The Wealth segment includes Private Bank, Wealth at Work, and Citigold.
The U.S. Consumer Cards segment includes branded cards, co-branded cards, private label cards, and installment lending solutions.
Bank of America has a Buy rating with a $176 price target.
Goldman Sachs
Goldman Sachs (NYSE: GS) is an American multinational investment bank and financial services company. The white-glove banking giant offers industry-leading strength and pays a reliable 1.84% dividend. It provides a range of financial services to corporations, financial institutions, governments, and individuals worldwide.
It operates through these segments:
- Global Banking & Markets
- Asset & Wealth Management
- Platform Solutions
The Global Banking & Markets segment provides financial advisory services, including:
- Strategic advisory assignments related to mergers and acquisitions, divestitures, corporate defense activities, restructurings, and spin-offs
- Relationship lending, acquisition financing, and secured lending through structured credit and asset-backed lending and funding under securities-to-resale agreements
This segment also offers client execution activities for cash and derivative instruments, as well as credit and interest rate products, mortgages, currencies, commodities, and equities-related products, along with underwriting services.
The Asset & Wealth Management segment manages assets across various classes, including equity, fixed income, hedge funds, credit funds, private equity, real estate, currencies, and commodities. It provides:
- Customized investment advisory solutions
- Wealth advisory services
- Personalized financial planning
- Private banking services
- Investments in corporate equity, credit, real estate, and infrastructure assets
The Platform Solutions segment offers credit cards and point-of-sale financing for purchasing goods or services. It also provides cash management services, such as deposit-taking and payment solutions, for corporate and institutional clients.
Bank of America has a Buy rating and a target price of $1,300.

JPMorgan
JPMorgan Chase (NYSE: JPM) is the world’s fifth-largest bank by assets. This stock trades at a reasonable 12.5 times estimated 2026 earnings and comes with a 1.77% dividend. JPMorgan is one of the leading global financial services firms and the largest banking institution in the United States, with approximately $3.9 trillion in assets. The company was formed by merging Chase Manhattan’s retail banking operations and J.P. Morgan’s investment banking operations.
The company operates through four segments. The Consumer & Community Banking segment offers:
- Deposit, investment, and lending products
- Cash management, payments, and services
- Mortgage origination and servicing activities
- Residential mortgages and home equity loans
- Credit cards, auto loans, leases, and travel services are offered to consumers and small businesses through bank branches, ATMs, and digital and telephone banking
The Corporate & Investment Bank segment provides:
- Investment banking products and services, including corporate strategy and structure advisory, and equity and debt market capital-raising services
- Loan origination and syndication, payments, cash and derivative instruments, risk management solutions, prime brokerage, and research
This segment also offers securities services, including custody, fund accounting and administration, and securities lending products, for asset managers, insurance companies, and public and private investment funds.
The Commercial Banking segment provides financial solutions, including lending, payments, investment banking, and asset management to small and midsized companies, local governments, nonprofit clients, and large corporations, as well as investors, developers, and owners of multifamily, office, retail, industrial, and affordable housing properties.
The Asset & Wealth Management segment provides multi-asset investment management solutions, encompassing equities, fixed income, alternatives, and money market funds, to both institutional clients and retail investors. Additionally, it offers retirement products and services, brokerage, custody, estate planning, lending, deposit, and investment management services to high-net-worth clients.
Wells Fargo has an Overweight rating with a $390 target price.
Wells Fargo
Wells Fargo (NYSE: WFC) operates in 35 countries and serves over 70 million customers worldwide. This money-center giant makes sense, given its 2.19% dividend, as many of the issues that have plagued the company over the past five years appear to be resolved. Wells Fargo offers a diverse range of banking, investment, mortgage, and consumer and commercial finance products and services in the United States and internationally.
The company operates through four segments. The Consumer Banking and Lending segment offers a diverse range of financial products and services tailored to consumers and small businesses. These include checking and savings accounts, credit and debit cards, and home, auto, personal, and small business lending services. The Commercial Banking segment provides financial solutions to private, family-owned, and specific public companies. Its products and services include banking and credit products across various industry sectors and municipalities, as well as secured lending and lease products, and treasury management services.
The Corporate and Investment Banking segment offers a suite of capital markets, banking, and financial products and services, such as:
- Corporate banking
- Investment banking
- Treasury management
- Commercial real estate lending and servicing
- Equity and fixed-income solutions
- Sales, trading, and research capabilities and services to corporate, commercial real estate, government, and institutional clients
Wealth and Investment Management provides wealth management, brokerage, financial planning, lending, private banking, and trust and fiduciary products and services to affluent, high-net-worth, and ultra-high-net-worth clients.
The company also operates through financial advisors in brokerage and wealth offices, consumer bank branches, independent offices, and digitally through WellsTrade and Intuitive Investor.
UBS has a Buy rating with a $104 target price.
The post 20 Years on Wall Street, 1 Core Strategy: How I Play Rising Rates appeared first on 24/7 Wall St..
]]>A Book, a Welder, and a Bet That Wouldn’t Quit
In 1980, Stewart Horejsi was running his family’s welding supply company, Brown Welding Supply, in Salina, Kansas. Born in 1937 and a 1962 University of Kansas graduate, he picked up John Train’s The Money Masters, which profiled nine legendary investors, Warren Buffett among them. He put the book down and started buying Berkshire Hathaway (NYSE:BRK-A).
His first purchase was 40 Class A shares at $265 each. Two weeks later he added 60 more at $295. A month after, 200 more at $330. The three 1980 purchases totaled $94,300, funded by welding business profits. He kept buying for years.
Sale That Usually Gets Left Out
His position peaked at 5,800 Class A shares. By 1998 he had trimmed to 4,300 shares, a reduction of 1,500. That stake has remained unchanged since. The story usually gets told as pure buy-and-hold, but the sale makes the rest more credible.
Net Worth Figures, Each With a Date
Per Yahoo Finance and the Daily Ticker in 2013, his net worth was at least $1.1 billion. In 2019, Celebrity Net Worth pegged him at $1.1 billion, with the 4,300 shares worth nearly $750 million. In October 2023, Forbes debuted him on the Forbes 400 at $3 billion, ranked 379th. That report valued his stake at $2.2 billion and cited roughly $800 million in other assets.
Where the Stock Sits Right Now
Berkshire Class A traded at $757,884.54 as of 1:32 PM Eastern on September 22, 2026, up 0.76% in the session, on roughly fifteen-minute delayed data. Horejsi has held 4,300 Class A shares since 1998. Those two facts sit next to each other. Draw your own line. The $522,000 price behind the 2023 Forbes valuation is well below where the stock trades today.
Class A is up 83.92% over five years and up 248.05% over ten years. Year to date it is up 0.41% from $754,800 at year-end. The average annualized return has been roughly 19% since 1980.

Folding Chairs in a Cafeteria
Horejsi manages his money through Boulder Investment Advisors in Boulder, Colorado, and has held stakes in Wells Fargo (NYSE:WFC), IBM (NYSE:IBM) and Walmart (NYSE:WMT). He has attended more than 30 Berkshire annual meetings, including early ones with fewer than a dozen shareholders in folding chairs. This multi-decade outcome is exceptionally rare. A single concentrated position that works this well is survivorship at its most extreme (we studied the pattern behind a batch of recent runners most investors walked past in a free report here).
The post In 1980, a Kansas Welding Supplier Bought 40 Shares of Berkshire Hathaway, a Stock He Read About in a Book. Four Decades Later, Stewart Horejsi Was Number 379 on Forbes’ Billionaires List appeared first on 24/7 Wall St..
]]>The Federal Reserve lifted its target range to 4% on September 17, 2026, the first hike in three years.
Textbook finance calls this a gift to banks: loans reprice faster than deposits, net interest margins widen, profits follow. Instead, JPMorgan Chase (NYSE:JPM) fell 1%, Wells Fargo (NYSE:WFC) dropped 3%, and Goldman Sachs (NYSE:GS) gave back 4%. Prime rates rose the next day, but the stocks did not follow.
Positioning Ate the Catalyst
The move was the most telegraphed hike of the year, and the sector had already priced it in. The SPDR S&P Regional Banking ETF is up 12.6% over the past year and 13.55% year to date.
JPMorgan itself sits on a 13.75% one-year gain and a 151.42% five-year run. When everyone has already bought, the news arrives without a marginal buyer.
The curve is not helping either. The 10-year minus 2-year spread closed at 0.25% on September 18, down from 0.74% in February. A flatter curve compresses the very spread the hike was supposed to widen.
JPMorgan’s Mixed Signal
Q2 2026 looked pristine on the surface: adjusted EPS of $6.14, ROTCE of 23%, and net interest income up 10%. Management guided full-year NII to about $105.5 billion and raised the quarterly dividend to $1.65 per share.

CFO Jeremy Barnum, however, warned that deposit costs eventually catch up:
“At some point that kicks in.”
Jamie Dimon was blunter about the setup:
“It’s getting close to as good as it gets. We just don’t know how long it’s going to last.”
Credit Is the Real Question
Every extra hike squeezes borrowers. JPMorgan’s card net charge-off rate already sits at 3.33%, and its allowance for credit losses climbed 12% to $31.4 billion.
Wells Fargo carries a heavier consumer and commercial real estate book, so the same hike lands harder. Goldman earns most of its money from trading and advisory, so its 4% drop looked more like a crowded-long unwind than a credit signal.
Barnum has already flagged the swing variable:
“When it comes to consumer credit performance, it’s just about the labor market.”
Bull and Bear Case for JPM Stock
The bull case rests on scale and capital return. JPMorgan authorized a $50 billion buyback in July, delivered $21.16 billion of Q2 net income, and Dimon said the firm targets a 17% return on deployed capital.
The bear case is that the easy money in this trade is already priced in. The stock trades near $349.47, well above the $308.21 average Q2 buyback price, and further hikes tighten borrower cash flow before they widen bank spreads.
The deciding variable is Q3. If net interest margin expands and card losses stabilize, the September dip was noise. If deposit repricing accelerates while charge-offs drift higher, the market was front-running an earnings problem the NII bulls have been ignoring.
The post Fed Rate Hike Fails to Lift Bank Stocks as Market Reprices the Rally appeared first on 24/7 Wall St..
]]>“Father Time always wins.” That was Warren Buffett’s line, according to The New York Times, on September 18, 2026, the day he announced he was stepping down as chairman of Berkshire Hathaway. The New York Times reported he named his son to replace him, identified by Yahoo Finance as Howard. The Australian Financial Review noted he is stepping down at 96.
Berkshire got a new operator about a year ago, when Greg Abel became chief executive, and reporting on September 2, 2026 noted from finance.biggo.com that Berkshire shares barely budged in his first year. Chairman was the last title Buffett held, which is what makes today the actual close of one of the longest runs anyone has ever had at this job.
What follows is a walk through the five largest positions on Berkshire’s most recent 13F, disclosed as of June 30, 2026 and filed August 14, 2026. That filing describes what Berkshire held at the end of June and disclosed in August, so it is a portrait of a moment rather than a live account of what sits in the portfolio this morning. It also covers only US-listed equity. Some of Buffett’s finest calls, GEICO, See’s Candies, BNSF, do not appear here at all, because he bought the entire company rather than a slice of one. The filing captures half of what he built.
Apple, the Position That Rewrote the Book
The largest disclosed position was Apple (NASDAQ:AAPL), at 227,917,808 shares worth $65,950,296,923, representing 22.038266729497398% of the disclosed portfolio and 1.561703418760081% of Apple itself, according to Australian Financial Review. Apple designs the iPhone, the Mac, and the services stack that now hangs off both.
Fundamentally, Apple sits at a P/E of 44 with ROE of 171.4%, and its fiscal Q3 2026 report showed EPS of $2.02 versus $1.89 expected on revenue of $109.42B, up 16.4% year over year. Nine-month buybacks ran to $62.09B through June 27, 2026. Tim Cook told analysts Apple had its “strongest June quarter ever, with double-digit revenue growth across iPhone, Mac and Services, and in every geographic segment.” That Buffett let a single technology company grow into more than a fifth of the disclosed book is itself the point.
American Express, the Position That Started in the Salad Oil Scandal
American Express (NYSE:AXP) was second at 151,610,700 shares valued at $51,282,319,275, or 17.136745146261052% of the portfolio. Amex runs the closed-loop card and network that anchors the premium payments franchise Buffett has admired since the 1960s, according to Australian Financial Review.
Q2 2026 delivered EPS of $4.53 against $4.40 expected on revenue of $19.64B, with billed business of $455.8B, up 9%. Management raised FY26 revenue growth guidance to 10% and maintained EPS guidance of $17.30 to $17.90. CEO Stephen Squeri described the premium proposition this way: “a great premium value proposition is not just a product. It’s a multifaceted relationship between the brand and the customer.” The quarterly dividend has climbed to $0.95 per share. Six decades on, the thesis still reads like the same one.
Coca-Cola, and Owning a Tenth of the Company
Coca-Cola (NYSE:KO) is the position that best captures the Buffett method. Berkshire disclosed exactly 400,000,000 shares worth $32,508,000,000, a stake equal to 9.296814516232121% of the entire company, according to Australian Financial Review. He owned close to a tenth of Coca-Cola.
The business earned it. Q2 2026 delivered adjusted EPS of $0.97, revenue of $13.38B up 6.7%, and management raised FY26 guidance to comparable EPS growth of 9% to 10% and free cash flow of ~$12.4B. The quarterly dividend has climbed from $0.16 in 1999 to $0.53 today. New CEO Henrique Braun described the machine as “the strength of our total beverage portfolio” operating across “more than 200 countries and territories.” A brand held since the late 1980s, still compounding.
Alphabet, the Regret That Became a Holding
Alphabet (NASDAQ:GOOGL) came in at 78,791,167 Class A shares worth $28,157,599,351, or 9.40927810657434% of the portfolio. Berkshire’s filings historically report GOOGL and GOOG separately, and both classes represent the same company. Buffett had publicly called missing Google early one of his regrets, and eventually a position was established.
The fundamentals now look like a Buffett stock. Alphabet trades at a P/E of 15 with operating margin of 32.1% and ROE of 35.7%. Q2 2026 revenue was $119.80B, up 24.2%, with Google Cloud revenue of $24.77B, up 82%. Sundar Pichai told analysts “nearly 90% of the Fortune 100 using Gemini Enterprise.” The consensus analyst target sits at $428.07, with 13 strong buy, 45 buy, and 5 hold ratings. Better late than never.
Bank of America, the Warrant Deal That Became Common Stock
Bank of America (NYSE:BAC) rounded out the top five at 483,394,015 shares valued at $27,543,790,975, or 9.204164963158451% of the portfolio, according to Australian Financial Review. The position originated in Buffett’s 2011 preferred and warrant deal, later converted into common stock.
Q2 2026 was one of the better quarters the bank has printed: EPS of $1.21 versus $1.12 expected, revenue of $31.56B, and net income of $9.07B, up 27.5% year over year. Global Markets sales and trading came in at $7.2 billion, up 33%, with equities revenue at a record $3.6 billion, up 70%. CEO Brian Moynihan framed it plainly: “Our results show organic growth, operating leverage, and efficiency ratio improvement in every business segment.” A crisis-era rescue turned into a decade-plus core bank holding.
What the Top Five Says About Buffett’s Approach
Concentration is the through line. One consumer electronics company held 22.038266729497398% of the disclosed portfolio, one card network held 17.136745146261052%, and one soft-drink maker was owned at 9.296814516232121% of its entire share class, according to Australian Financial Review. The sector tilt is unmistakable: two financials in Amex and Bank of America, one branded consumer staple in Coca-Cola, and two dominant technology platforms in Apple and Alphabet. Behind the top five sat energy exposure, with Chevron at $13,986,141,890 and Occidental Petroleum at $12,868,205,304. Holding periods span from the 1960s salad oil trade in Amex to a recent Alphabet build, according to Australian Financial Review. Different decades, same pattern: a business he understood, held with unusual patience, sized with unusual conviction.
Arithmetic of a Life
A 96-year-old handing the chair to his son, with the company already in an operator’s hands, closing out one of the longest runs anyone has had at this, according to Australian Financial Review. The 13F is a backward-looking disclosure and none of this is investment advice. What it shows is a book built by someone who thought in decades and treated position size as a form of speech. He said what he thought about Coca-Cola by owning nearly a tenth of it. He said what he came to think about Apple by letting it grow into more than a fifth of the disclosed portfolio. Father Time gets everyone eventually. Very few get to hand off a body of work that reads like this one.
The post As Buffett Ends His Legendary Career, These Were His 5 Best Investments appeared first on 24/7 Wall St..
]]>Although income investors treat a dividend cut as the ultimate red flag, the historical record on Wall Street is more bifurcated than the reflex suggests. A slashed payout often marks the low point of an operational reset, the moment management concedes reality and begins deleveraging. But sometimes it marks only the first station on a longer decline. The difference matters right now, because VF Corporation (NYSE:VFC) holders are still living inside that experiment: the parent of The North Face and Vans took its quarterly dividend from roughly $0.51 to $0.09 starting with the December 2023 ex-date, and the payout has not budged since.
What’s particularly instructive is the peer set. The benchmark playbook of the past two decades gives us five clean historical mirrors, and they do not all rhyme.
Bank of America and the Financial-Crisis Template
Bank of America (NYSE:BAC) is the definitive precedent. The quarterly payout went from $0.64 through September 2008 to $0.32 that December and then to a token $0.01 beginning March 2009, where it stayed until 2014. A generation of income holders was wiped out. Yet the stock’s adjusted-price record shows a 371.26% ten-year change through Sept. 16, 2026, with the dividend rebuilt in eleven separate steps to a recent $0.32 declared for the Sept. 25, 2026 payment. The cut, painful as it was, marked a floor.
Wells Fargo: A Slower, More Faithful Restoration
Wells Fargo (NYSE:WFC) took its quarterly dividend from $0.51 to $0.10 in the summer of 2020 under Fed capital-return restrictions, an 80% haircut that stunned income holders. Six years later, the payout has climbed in six steps to $0.50 (ex-date Aug. 7, 2026), still narrowly below the pre-cut $0.51. The equity did not punish holders for waiting: WFC’s adjusted price is up 94.71% from Jan. 2, 2020 through Sept. 16, 2026. Under CEO Charlie Scharf, Q1 2026 diluted EPS reached $1.60 on revenue of $21.45B.
BP: The Cyclical Reset That Held
BP (NYSE:BP) delivered its first dividend cut in a decade in August 2020, slashing the quarterly amount from $0.63 to $0.315. Since then the payout has been raised in a slow, disciplined ladder to $0.5196 (ex-date Aug. 14, 2026). The stock has responded: BP is up 131.97% over five years through Sept. 16, 2026, aided by Q2 2026 EPS of $2.22 that beat the $1.78 estimate on Brent averaging $103.85/bbl.
GE: The Extreme Case
GE Aerospace (NYSE:GE) is the cautionary tale that eventually flipped. The dividend was chopped from $0.24 to $0.12 on Dec. 26, 2017, then to a symbolic $0.01 on Dec. 19, 2018, before the conglomerate broke itself apart. From Jan. 2, 2018 through Sept. 16, 2026, GE’s adjusted price rose 291.89%. The dividend has since been restored to $0.47 (ex-date July 6, 2026). Not without turbulence: Barron’s issued a Buy-to-Hold downgrade on Sept. 14, 2026, and the stock is down 13.86% over the past month. Recovery came on a long timeline.
AT&T: A Cut That Cleaned Up the Balance Sheet
AT&T (NYSE:T) trimmed its dividend from $0.52 to $0.2775 beginning with the April 13, 2022 ex-date alongside the WarnerMedia spin. Freed cash flow has since funded deleveraging and buybacks; management is targeting roughly $10B of repurchases in 2026, and Q2 2026 adjusted EPS of $0.65 beat the $0.59 estimate, per the company’s July 22 filing. The equity rewarded patience with an 80.67% rise from Jan. 3, 2022 through Sept. 16, 2026.
What Separated the Winners From the Losers
The pattern across BAC, WFC, BP, GE, and T is consistent: the cut worked when it accompanied a real deleveraging or portfolio reshuffle, and when management guided clearly about the new run-rate. VFC is where the jury remains out. Free cash flow was $405M in FY26 and CEO Bracken Darrell has guided FY27 revenue to +2% or better constant currency with net debt already down 20% YoY to $4.30B. The stock, though, is down 47.68% since Jan. 3, 2023 and 77.81% over five years. History says the tell is whether operating margin actually reaches the promised ~8%, and whether Vans stops shrinking after its -8% quarter. Long term, Wall Street still heads higher, and cut dividends have been restored more often than not. Spotting the cut before it lands is a separate discipline (we cataloged the seven warning signs in a free guide here: Dividend Traps). What income investors should watch, beyond the cut itself, are the two quarters that follow it: free cash flow direction, and net-debt trajectory. Those are the leading indicators the record actually validates.
The post VF Corporation Cut Its Dividend 82%. Five Historical Cases Show What Could Happen Next appeared first on 24/7 Wall St..
]]>UnitedHealth Group (NYSE:UNH) stock is down 3% to $388.58 in early Wednesday trading after Bloomberg reported the company sold an interest in part of its Florida WellMed primary-care clinics. The 3% slide comes even as UnitedHealth stock is still up 15% year to date, and it lands hours before management is set to reaffirm full-year 2026 financial guidance at an investor conference, according to UnitedHealth Group.
TPG (NASDAQ:TPG) is the buyer. The Fort Worth alternative asset manager ended Q2 2026 with $326.8 billion in assets under management and $76.2 billion in available capital, and its Capital and Healthcare Partners platforms have been active in senior-care buyouts.
WellMed sits inside Optum Health, the value-based care unit whose stumbles drove UnitedHealth’s ongoing turnaround. The reaction today looks company-specific rather than sector-wide, and that framing matters for anyone reading through from UnitedHealth into the broader managed-care group.

Selling a Piece of the Problem Child
Bloomberg reported Tuesday evening that UnitedHealth sold an interest in some of its Optum Health operations in Florida to TPG, centered on WellMed’s senior primary-care clinics. Terms weren’t disclosed, which leaves investors valuing a transaction with no headline dollar figure attached to it.
Chief Financial Officer Wayne DeVeydt told Bloomberg, “We didn’t need the dollars, we have the dollars to invest, but we needed the focus and somebody that could actually work with us locally.” He described the arrangement as a way to grow the clinic footprint faster than UnitedHealth could on its own while it executes a wider reset.
DeVeydt also told the outlet that Optum Health margins will reach 2% this year, ahead of prior expectations, and he guided to 4% next year. That trajectory matters because Optum Health was the source of last year’s disappointing profit and the reason the company replaced its chief executive and other senior leaders.
UnitedHealth reported Optum Health revenue of $23.47 billion in Q2 2026, down 5% year over year (YoY) as the unit shed 700,000 value-based care patients. The WellMed carve-in gives Optum a well-capitalized operating partner and hands TPG a foothold in Medicare-focused primary care during a stretch when the sector’s economics remain contested.
Sector Barely Flinches
The Health Care Select Sector SPDR ETF (NYSEARCA:XLV) is down 0.4% to $166.44, a fraction of UnitedHealth’s move and a sign the story isn’t reading as a broader healthcare selloff. UnitedHealth is a top-five weight in the fund at 6.57% of net assets, so a heavier sector drop would be showing up if the news were spilling into the group.
The SPDR S&P 500 ETF Trust (NYSEARCA:SPY) is down 0.35% to $763.31, so the broad tape is merely soft. Managed-care peers Elevance Health (NYSE:ELV), Cigna (NYSE:CI), and Humana (NYSE:HUM) aren’t posting a matching drop, which reinforces that today’s move is UnitedHealth-specific.
The tension is philosophical. A turnaround company is selling a slice of the exact division that caused the damage, and readers can view that as discipline or as retreat. Without transaction terms, both interpretations have room to breathe.
What to Watch
DeVeydt said UnitedHealth expects to reaffirm its financial guidance at an investor conference hosted by Wells Fargo (NYSE:WFC). That reaffirmation is the more meaningful near-term catalyst, since the July update lifted UnitedHealth’s full-year adjusted EPS guidance to $19.50 to $20 and raised the company’s operating cash flow outlook to $24 billion.

Analyst consensus for UnitedHealth’s full-year 2026 adjusted EPS sits at $19.81, inside management’s raised range, and the 2027 consensus sits at $22.44. A clean reaffirmation would keep those numbers intact, while any hedging language on Optum Health could reopen the debate the WellMed deal is trying to settle.

Investors could look for signs that UnitedHealth’s management ties the WellMed partnership to specific clinic growth targets or Optum margin milestones on stage. Position sizing on one’s UnitedHealth stock exposure may deserve a fresh look given today’s gap between the stock and its sector fund.
The post UnitedHealth Slips 3% as TPG Buys Into Florida WellMed Clinics Ahead of Guidance Reaffirmation appeared first on 24/7 Wall St..
]]>Three well-known dividend payers, operating in three unrelated businesses, all sent checks to their shareholders on September 1, 2026. For a holder of one share of each, the mailbox math was simple: $1.27 from Phillips 66 (NYSE:PSX), $1.16 from Target (NYSE:TGT), and $0.50 from Wells Fargo (NYSE:WFC).
Two of these three checks were the first at a newly raised per-share rate. Before getting into which is which, a quick refresher on the three dates that matter for every dividend payment.
- The declaration date is when the board formally approves the payment.
- The ex-dividend date is the cutoff: own the stock before that date and you get the check, buy on or after and you don’t.
- The payment date is when the money actually shows up in the brokerage account.
All three companies featured here share the same payment date. The declaration and ex-dividend dates tell the real story.
Phillips 66: Third Check at the Current Quarterly Rate
As mentioned, shareholders collected $1.27 per share on September 1. The payment was declared on July 9, 2026, and the stock went ex-dividend on August 18, 2026. The quarterly rate was set earlier in calendar year 2026, with the first payment at that rate landing on March 4, 2026, and a second on June 1, 2026. It is, however, a higher check than the comparable September payment a year earlier, when the company paid $1.20 per share on September 2, 2025. The trailing 12-month total is $5.01 per share, with an annualized forward figure of $5.08.
The backdrop is a strong operational quarter. Phillips 66 reported Q2 2026 adjusted EPS of $9.41, beating the $8.09 consensus, on revenue of $52.04 billion. The company returned $887 million to shareholders in Q2, including $508 million in dividends and $379 million in buybacks. Shares have been on a tear, up 97.4% year to date through the September 3 close of $254.66.

Target: First Check at the New Rate
Target shareholders received $1.16 per share on September 1, the first payment at the higher rate. The prior three quarterly payments in this cycle were each $1.14 per share. The board declared this payment on June 11, 2026, and the stock went ex-dividend on August 12, 2026. So the raise itself was set months ago; September 1 was simply when the higher check arrived in the account.
Target’s Q2 report supported the payout. Adjusted EPS came in at $4.11 on revenue of $26.54B, with comp sales up 3.8% and digital comps up 8.7%. The company also raised its FY26 guidance. The share price is up 67.8% year to date and closed at $164.01 on September 3.

One pattern worth flagging, without turning it into a prediction: Target’s declaration history shows a recurring second-half-September announcement of a new quarterly rate for the December payment. The company declared $1.14 per share on September 17, 2025, $1.12 on September 18, 2024, $1.10 on September 20, 2023, and $1.08 on September 22, 2022. It is a pattern in past declaration dates. It is not a promise.
Wells Fargo: The Other First Check
Wells Fargo shareholders received $0.50 per share on September 1, up from $0.45 per share on the previous quarterly payment dated June 1, 2026. This was the first payment at the higher rate. The board declared the payment on July 28, 2026, and the stock went ex-dividend on August 7, 2026. The annualized forward dividend now stands at $2 per share.
The bank is running hot on capital return. Wells Fargo reported Q1 2026 EPS of $1.60 on revenue of $21.45 billion and returned $5.4 billion to shareholders in Q1 2026, including $4.0 billion in common stock buybacks. CEO Charlie Scharf said, “We returned $4 billion to shareholders through common stock repurchases while continuing to operate with significant excess capital.” The Federal Reserve asset cap was removed in 2025, and management set a new medium-term ROTCE target of 17% to 18%. Shares closed at $89.19 on September 3.

What a Quiet, Staggered Raise Actually Means for Income Investors
For a retiree who owns all three, September 1 was a working example of how these payouts actually flow: two of the three checks arrived at a higher per-share rate than the June payment, and a third continued a rate that was already lifted earlier in the year. The raises were declared weeks or months before the money moved, on very different corporate calendars, and they still landed on the same day. Owning a small basket of committed dividend payers smooths that out by design (the whole idea behind a dividend ladder built to run without ever selling a share, which we laid out in a free guide here). Watch the second half of September for Target’s next declaration, watch Phillips 66’s next board action for a signal on the 2027 rate, and take Wells Fargo’s larger check as confirmation that the post-asset-cap capital-return story is now cash in hand.
The post Phillips 66, Target, and Wells Fargo Just Paid Shareholders. Here’s What They Got. appeared first on 24/7 Wall St..
]]>
Crypto was built around removing financial middlemen. Nearly two decades later, some of the world’s biggest financial institutions are preparing to become the middlemen on blockchain. A consortium of 21 banks and financial firms plans to create a new company in the second half of 2026 and launch a U.S. dollar-backed stablecoin in the first half of 2027.
The group includes Bank of America (NYSE:BAC), Citi (NYSE:C), Goldman Sachs (NYSE:GS), Wells Fargo (NYSE:WFC), Deutsche Bank (NYSE:DB), UBS (NYSE:UBS), and Fidelity Investments. The irony is hard to miss. The institutions crypto was designed to bypass are now building its payment rails.
Wall Street Is No Longer Watching Crypto
The consortium’s announcement, published by Wells Fargo on Sept. 1, represents a major change in strategy. The original group contained 10 banks when the project was announced last October. It has now more than doubled to 21 institutions spanning North America, Europe, Asia, the Middle East, and Africa.
The proposed stablecoin would be pegged 1-to-1 with the U.S. dollar and designed for wholesale, institutional, and retail uses, including cross-border payments and digital-asset settlement. The group also intends to expand into other G7 currencies, with the euro first in line.
It is an important development because stablecoins are increasingly becoming the bridge between traditional money and blockchain networks. The banks aren’t merely offering custody or allowing customers to trade crypto. They want to issue the digital dollars themselves.
Banks Want to Keep the Money in the Banking System
The strategic motivation is straightforward: stablecoins can compete with bank deposits.
A dollar sitting in a traditional checking account supports the banking system’s existing business model. A dollar moved into a stablecoin issued by a nonbank can potentially leave that ecosystem. Bank executives have increasingly recognized that risk as stablecoins have grown. Now banks have an alternative: compete.
The proposed venture would combine their existing distribution, compliance systems, customer relationships, and risk-management infrastructure with blockchain settlement. That could make stablecoins considerably easier for corporations and institutions to adopt.
Regulation is helping open the door. The U.S. Treasury said in August that the GENIUS Act is expected to take effect Jan. 18, 2027, establishing federal rules for payment stablecoins. The consortium says its product will comply with the GENIUS Act and Europe’s MiCA framework.
In other words, the regulatory plumbing is being built at roughly the same time as the financial plumbing.
Crypto Gets Legitimacy — and Competition
That creates a fascinating trade-off for investors. Crypto-native issuers such as Tether (CRYPTO:USDT) and Circle Internet Group (NASDAQ:CRCL) — the issuer of one of the world’s largest regulated stablecoins, USDC (CRYPTO:USDC) — have spent years building stablecoin networks. Now 21 major financial institutions are bringing enormous customer bases and established payment relationships into the market.
That could pressure existing issuers. But it could also expand the entire market.
If banks make blockchain-based dollars easier to use for international payments and securities settlement, more financial activity could migrate on-chain. Tokenized assets, decentralized finance, and digital-asset markets could all benefit from deeper liquidity and easier settlement.
Granted, bank involvement removes some of crypto’s original rebelliousness. It also introduces centralized governance and regulatory constraints. But investors shouldn’t confuse decentralization with adoption.
Key Takeaway
In short, while Wall Street is hijacking crypto to an extent, it is also validating one of crypto’s most commercially useful ideas — programmable digital money — and preparing to distribute it at institutional scale.
The biggest investment opportunity may therefore not be choosing between traditional finance and crypto. It may be identifying the companies that provide the infrastructure for both.
The 2027 launch will be the real test. If these banks can turn stablecoins into everyday payment and settlement tools, blockchain could finally move from an alternative financial system toward becoming part of the financial system itself.
The post Banks Just Hijacked Crypto’s Original Promise: The Revolution Against Wall Street Is Now Owned by Wall Street appeared first on 24/7 Wall St..
]]>A global bond selloff pushed the 10-year Treasury yield to 4.79% this afternoon, above its prior 52-week high of 4.75% set on July 31. Rising long rates typically help banks, yet the money-center group is soft, and so is the sector fund.
Notably, the Financial Select Sector SPDR ETF (NYSEARCA:XLF) was is 5% year to date (YTD) to $57.31, while the SPDR S&P 500 ETF Trust (NYSEARCA:SPY) is up 12%. This year so far, Morgan Stanley (NYSE:MS) stock is beating both of those funds.
Morgan Stanley stock was up 19% year to date through Monday’s close, leading every money-center peer this year on the strength of wealth management fees and capital markets activity. Shares are down 0.6% to $212.03 this afternoon as the rate spike tips risk sentiment negative. Breaking $250 requires Morgan Stanley to clear a 52-week high it hasn’t touched in a year, and analyst targets have to move higher.
Ranking the Big Six Banks
Five of the six largest U.S. banks beat XLF this year, and the fund’s lag reflects its broader mix of insurers, exchanges, and payment networks diluting money-center strength. Morgan Stanley led the group by a clear margin, while Wells Fargo’s more balance-sheet-oriented mix has left it below where it started 2026. The separation was earned in the earnings line.
| Bank | Ticker | YTD 2026 |
|---|---|---|
| Morgan Stanley | MS | +19% |
| Goldman Sachs (NYSE:GS) | GS | +14% |
| Bank of America (NYSE:BAC) | BAC | +13% |
| Citigroup (NYSE:C) | C | +13% |
| JPMorgan Chase (NYSE:JPM) | JPM | +10% |
| Wells Fargo (NYSE:WFC) | WFC | -7% |
Morgan Stanley’s mix is what set the firm apart from the pack. Its year-over-year (YoY) earnings growth reached 62.4%, classed as strong earnings acceleration, and its beta of 1.209 sits above the money-center average, which cuts both ways. The 2026 story combines that earnings acceleration with a rate environment that rewarded fee-based and capital markets revenue over pure spread income.
Q2 2026 anchored the year for Morgan Stanley. The firm posted record revenue of $21.35 billion and EPS of $3.46, a fifth consecutive beat. Equity trading revenue climbed 69% to $6.30 billion, investment banking rose 58% to $2.44 billion, and total client assets across wealth and investment management reached the $10 trillion milestone.
What It Takes to Reach $250
Morgan Stanley stock trades at $212.03, and its 52-week high is $230.98, so the first step is clearing a level Morgan Stanley shares haven’t reached in a year. The average analyst price target is $236.62, which sits below $250. Ratings break down as 2 Strong Buy, 9 Buy, 13 Hold, 1 Sell, and no Strong Sell.

Morgan Stanley’s forward EPS is $13.42, and the implied P/E ratio comes to 17x. That’s a reasonable multiple for a firm producing record wealth management fees and capital markets revenue, but it doesn’t leave much room for multiple expansion without stronger earnings revisions.
24/7 Wall St.’s price model puts Morgan Stanley’s base case at $248.27, implying 17.2% upside, with an optimistic case of $258.86 and a conservative case of $212.41. So $250 sits just above the base case and inside the optimistic case, marking it as an achievable bull-case level. That’s a materially different answer from stocks whose targets sit below their price.

Rising Rates Complicate the Setup
The 10-year Treasury yield at 4.79% sits above its prior one-year peak, and the move up in long rates has been sharp enough to unsettle risk assets even where it ought to help earnings. Higher long rates conventionally support bank net interest income, yet Morgan Stanley shares and XLF are both lower. A rate spike large enough to trigger risk-off can outweigh the margin benefit in a single session.
The yield curve stayed positive, with the 10-year minus 2-year spread at 0.41% at the latest read, a supportive backdrop for bank earnings over time. Morgan Stanley’s Q2 wealth-management net interest income rose to $2.3 billion, helped by higher sweep deposits and lending growth. The tension is between what today’s move does to trading positioning and what tomorrow’s curve does to lending economics.
What to Watch
Two things have to happen for $250 to come into view. Morgan Stanley stock has to clear $230 with heavy trading volume, and analyst targets have to move up toward the 24/7 Wall St. base case, which in practice depends on capital markets activity holding through year-end. Traders can watch for signs that IPO and M&A pipelines convert to booked revenue in Q3 2026.
Capital return also supports the case, with a reauthorized $20 billion repurchase program starting Q3 and the quarterly dividend raised to $1.15. Given Morgan Stanley’s higher beta and its dependence on markets activity, investors should size their positions with room for the volatility that comes with a fee- and capital-markets-heavy mix. Both the base case and the bull case rely on those revenue lines holding.
The post Morgan Stanley Stock Is Up Nearly 20% in 2026: What Will It Take to Break Through $250? appeared first on 24/7 Wall St..
]]>The setup into Dell Technologies‘ (NYSE:DELL) fiscal second-quarter results is unusually bullish, and the stock is falling anyway. That gap between an unusually strong setup and a red stock is the story. The move locates today’s selling in Dell’s own event risk rather than in the AI hardware corner.
Dell stock is down 4% to $437.81 in midday trading, coming off a run in which Dell stock was up 266% year to date through Monday’s close. That places Dell against a broad-market backdrop that is only mildly softer.
The SPDR S&P 500 ETF Trust (NYSEARCA:SPY) is down 0.5% to $763.39. Meanwhile, Super Micro Computer (NASDAQ:SMCI) stock is down 1% to $36.74, and Hewlett Packard Enterprise (NYSE:HPE) stock is down 2% to $51.17. Dell’s fade is running harder than either AI server peer, which points the selling at company-specific event risk.
AI Servers Are Doing the Heavy Lifting
Just to give you a quick glance at the need-to-know data, the reported Dell consensus estimate calls for earnings of $4.95 per share, up 113.4% from the year-ago period, on revenue of $45.34 billion, up 52%. That consensus sits above Dell’s own guide of $44 billion to $45 billion, so a straight beat means clearing a bar management already lifted.
The business driver is Dell’s Infrastructure Solutions Group and specifically its AI-optimized servers. Consensus looks for Infrastructure Solutions Group operating income of $3.38 billion this quarter against $1.47 billion a year ago. That line item is carrying the multiple.
In its most recent quarter, Dell reported non-GAAP earnings of $4.86 per share on revenue that rose 88% year over year, and Dell stock jumped 32% the following session. Management disclosed a $24.4 billion AI order backlog, framed a $60 billion AI-server opportunity, and guided full-year revenue to $165 billion to $169 billion.

Sympathy Selling and a Higher Bar
Super Micro and Hewlett Packard Enterprise are red alongside Dell, though both moves look mild against Dell’s slide. CoreWeave (NASDAQ:CRWV) sits in the frame as the customer whose partnership repositioned Dell from a legacy hardware vendor into a supplier for frontier AI infrastructure. The iShares U.S. Technology ETF (NYSEARCA:IYW) is the sector fund covering this cohort, and the picks-and-shovels names powering the data-center buildout beyond the chipmakers are the subject of a free report we put together here.
Several AI-linked names have beaten expectations this season and sold off anyway on anything short of perfection, so October-quarter guidance and any update to Dell’s full-year range may matter more than the quarter itself. A global bond selloff has lifted the 10-year Treasury note yield to 4.8%, and the highest-multiple AI winners carry the most sensitivity to that. Today, some traders are focused on strong demand for Dell’s AI-optimized servers, even as the DELL share price heads south.
Dell stock trades at a forward P/E ratio of 26x. The average price target among 27 analysts is $510, and Wells Fargo (NYSE:WFC) raised its DELL stock price target to $545.


What to Watch
Today’s fade reads as pre-earnings de-risking and profit taking after a large prior run on a risk-off session. The setup rewards clean, above-consensus guidance more than a headline beat.
Investors can watch for how Dell frames the October quarter and the full-year range against a consensus that already sits above management’s prior guide. The Infrastructure Solutions Group operating income line has a $3.38 billion setup to clear. Ultimately, DELL shareholders should consider keeping their position sizes modest into an event where beating alone may not clear the bar.
The post Dell Falls 4% Ahead of Earnings as Its 266% Rally Raises the Bar, Super Micro and Hewlett Packard Enterprise Slip appeared first on 24/7 Wall St..
]]>On a recent episode of Mad Money, Jim Cramer took a call from Jeff in San Francisco, a 20-year viewer, who ran his top five holdings through the “Am I Diversified” game. Jeff’s top 5 holdings were: Alphabet, NVIDIA, Apple, Caterpillar and Eli Lilly. Cramer saw that four of the top five positions carry meaningful AI or tech exposure, making a five-stock portfolio across four sectors less diversified than it appears.
On Caterpillar, “CAT, you know, I used to say that was earth moving. That’s so wrong. And now turbines. It’s really got a lot to do with the data center. We got to be careful. There’s a data center stock,“ Cramer said.
He then reached for an off-theme name to balance his portfolio: “I know TJX is going down. I know that the cheap retailers are good. I know Walmart’s at $102, but I want to do TJX.” He also flagged Wells Fargo as an alternative if the caller exited Caterpillar, and repeated his standing view on Apple and NVIDIA: own them, don’t trade them.
Why Caterpillar Now Trades Like an AI Infrastructure Name
Caterpillar (NYSE:CAT) reported its first-ever $20 billion sales quarter in Q2 2026, with revenue of $20.54 billion, up 23.98% year over year, and adjusted EPS of $8.17 versus a $6.20 estimate.
Segment revenue reached $8.24 billion, up 17%, with Power Generation up 29% to $3.10 billion, driven by data center demand for large reciprocating engines and turbines. On the call, management said power generation sales to users grew 72%, backlog expanded $9 billion sequentially to $72 billion, and some customers are placing orders as far out as 2030.

The market is already pricing the shift. CAT is up 43.5% year to date and 90.54% over the past year, and trades at a forward P/E of 32 with an average analyst price target of $979.22 vs a current share price of $791.08. That re-rating reflects an industrial carrying AI-linked demand rather than a pure late-cycle machinery play.
Many Companies Benefit from the Same AI Spending
Cramer’s Caterpillar point mirrors an argument JPMorgan Private Bank’s Stephen Parker made: AI is broadening into industrials and utilities.
Consider Generac (NYSE:GNRC), whose data center backlog reached $1.6 billion, including roughly $1 billion of orders in the last 90 days and a first hyperscale deal worth nearly $700 million for 2027 delivery. GNRC is up 44.67% year to date.
Cisco Systems (NASDAQ:CSCO) took $4 billion of hyperscaler AI infrastructure orders in Q4 FY26 and $9.3 billion for the full year, and guided FY27 AI infrastructure revenue to $7.5 billion. CEO Chuck Robbins called it a “networking super cycle.”
Micron Technology (NASDAQ:MU) reported fiscal Q3 revenue of $41.5 billion and non-GAAP EPS of $25.11, with HBM4 12-high ramping twice as fast as HBM3E. MU is up 227.94% year to date.
Why Cramer Chose TJX and WFC to Balance the Portfolio
Having tagged Caterpillar, Cramer needed exposure that doesn’t move with AI capex. TJX Companies (NYSE:TJX) posted Q2 FY27 adjusted EPS of $1.22 on comps up 4%, and raised full-year adjusted EPS guidance to $5.15 to $5.20. The stock is down 11.82% year to date, the kind of setup Cramer sees as an opportunity when management is still executing.
Wells Fargo (NYSE:WFC) reported Q2 2026 EPS of $2 with return on tangible common equity of 17.7%, and CEO Charlie Scharf described underwriting AI-related financing across chips, power, and data-center shell as distinct credit exposures.
Key Takeaways
Cramer’s point is that Caterpillar’s growing data center exposure can reinforce an existing AI bet rather than offset it. Adding a company with different demand drivers, such as TJX, could reduce that concentration without abandoning the portfolio’s technology holdings.
The post Jim Cramer Warns AI Is Making Even “Diversified” Portfolios More Concentrated appeared first on 24/7 Wall St..
]]>Jim Cramer used a recent CNBC Stop Trading segment to push back against what he sees as reflexive analyst enthusiasm for a narrow group of fintech names. His complaint was direct: “One of the more irritating parts of this market is the insistence of loving fintech. The analysts just love fintech, and the three that they love are SoFi, Klarna and now PayPal.”
His prescription was equally blunt. “We understand PayPal may be a takeover candidate. Klarna is really doing great so far. It’s going to come back. Just stop analysts stop recommending these. Let them go to where they are on the downside. And then you can recommend them.”
The frustration centers on crowded trades. When the same analysts publish the same view on the same tickers simultaneously, the recommendation itself becomes part of the price, leaving no room for upgrades later. His alternative was the boring stuff: “Just go buy Wells Fargo and JPMorgan, go buy JPMorgan over Klarna, over PayPal.” That claim about market structure is worth testing against the numbers.
The Crowded Trade Problem
PayPal (NASDAQ:PYPL) carries a Hold consensus, with 32 of 43 covering analysts rating it Hold, compared to 8 Buy and 3 Sell ratings. The analyst target sits at $59.68, essentially on top of the current price of $60.43. PayPal’s Q2 2026 earnings release filed with the SEC shows the beat did little to move the setup.
SoFi Technologies (NASDAQ:SOFI) shows the same pattern. The stock trades at $17.66 with an analyst target of $19.92, and even after a strong Q2 print, it is down 32.54% year to date. Insiders have been net sellers across 82 recent transactions.
Klarna Group (NYSE:KLAR) delivered its second consecutive beat and still fell hard. Revenue grew 26.6% year over year to $1.042 billion, transaction margin dollars grew 42% to $446 million, and the company posted net income of $9 million against a loss a year earlier. The stock fell 22.81% on the day and is down 47.91% year to date.
Klarna cut full-year revenue guidance to $4.08 to $4.16 billion from a prior above $4.34 billion, citing FX and softer German retail, and the reaction confirms Cramer’s structural point about how a crowded, over-loved trade behaves when guidance trims.
Why the Big Banks Look Different
The preference for JPMorgan and Wells Fargo is a value-and-risk call. JPMorgan Chase (NYSE:JPM) is up 14.32% year to date and generated $16.9 billion in net income at a 23% ROTCE in Q2. Jamie Dimon’s franchise also authorized a $50 billion buyback alongside earnings.
Wells Fargo (NYSE:WFC) returned $4 billion to shareholders through repurchases in Q1 and trades at $87.40. Both offer scale, dividends, and diversified revenue the fintech names cannot match today.
The counterargument is that big banks are a different bet on the same consumer. Wells already saw its net interest margin compress to 2.47% from 2.67%, and a softer consumer eventually pushes up bank credit costs. Cramer’s preference reads more like a risk-management call than a pure growth thesis.
The value case is straightforward. PayPal trades at a P/E of 12, which is not demanding, although its non-GAAP operating margin contracted 248 basis points to 17.4% in Q2. Banks earning mid-20s returns on tangible equity look more compelling on a risk-adjusted basis.
The Affirm Exception and the BNPL Nuance
Cramer carved out Affirm Holdings (NASDAQ:AFRM) from his criticism, arguing the stock should trade at $100 because he trusts Max Levchin and the growth story. Affirm currently trades at $73.56 against an analyst target of $91.20.
The fundamentals support the distinction. Affirm posted GMV growth of 35% to $11.6 billion in FQ3 2026, its tenth consecutive quarter above 30% growth, and generated GAAP net income of $102.9 million. The company has strung together consistent GAAP operating profits.
Cramer added a subtler point about the category. “Buy now, pay later just does very, very well in this situation.” The argument is that BNPL benefits when consumers trade down from revolving credit cards, a defensible read of the current cycle.
The counter is that a weaker consumer also increases credit losses on those same loan books, and Affirm’s 30-plus-day delinquencies ticked up 29 basis points year over year to 2.8%. His crowded-trade mechanics argument is stronger than his broader macro thesis, although both deserve careful weighing before acting on any recommendation.
The post Cramer Warns Fintech Bulls: These Three Stocks Are Priced for Perfection appeared first on 24/7 Wall St..
]]>The 2026 scoreboard among these three big financial names is decisive. BNY Mellon (NYSE:BNY) stock has vastly outrun both Bank of America (NYSE:BAC) and Wells Fargo (NYSE:WFC) year to date (YTD), reframing what winning the bank trade means this year. Certainly, today’s bond-market news is relevant, but the 2026-so-far story has other nuances.
BNY Mellon stock is up 38% YTD at $160.69, Bank of America shares have climbed 15% to $63.13, and Wells Fargo shares are down 8% at $85.80. For sector context, the Financial Select Sector SPDR Fund (NYSEARCA:XLF) is up just 5% at $57.71.
The gap reflects a business-model divide. BNY Mellon operates as a fee-driven capital markets platform, with revenue anchored in custody, servicing, clearing, and collateral fees that scale with asset values and transaction volumes rather than net interest margin. Bank of America and Wells Fargo carry heavier lending exposure, a structural reason the three diverged so widely.
BNY Mellon Leads the Field
BNY Mellon sits at the center of global capital markets, providing custody, administration, investment management, wealth management, payments, clearing, collateral management, corporate trust, depositary receipts, and foreign exchange services. The company oversees $62.6 trillion in assets under custody and/or administration and $2.2 trillion in assets under management as of June 30, 2026.
Furthermore, BNY Mellon serves over 90% of Fortune 100 companies and nearly all of the top 100 banks globally, with approximately 46,500 employees and a history spanning more than 240 years.
That fee-heavy mix has been the tailwind in 2026, since BNY Mellon monetizes rising asset values and active transaction volumes simultaneously. CEO Robin Vince stated on the Q2 2026 call that the period marked “our 14th consecutive quarter of year-over-year sales growth”, alongside two consecutive record sales quarters. That commercial momentum aligns with what worked in the market this year.
Bank of America Runs Second
Impressively, Bank of America serves nearly 70 million clients through Consumer Banking, Global Wealth & Investment Management, Global Banking, and Global Markets. The bank operates roughly 3,500 retail financial centers and approximately 15,000 ATMs, holds the top U.S. consumer deposit position, and manages around $4.9 trillion in client balances and $2.3 trillion in assets under management.
Bank of America stock’s 15% YTD gain places it a distant second to BNY Mellon. The Global Markets and investment banking franchises have been standouts, yet lending economics still anchor a large revenue share. That likely explains why Bank of America shares didn’t keep pace with BNY Mellon’s more purely fee-driven engine.
Wells Fargo Is the Laggard
Wells Fargo holds roughly $2.2 trillion in assets across Consumer Banking and Lending, Commercial Banking, Corporate and Investment Banking, and Wealth and Investment Management. It operates roughly 4,093 retail branches and serves over 33.5 million mobile active customers.
The firm manages roughly $2.5 trillion in company-wide client assets and holds 4.3% investment banking market share.
Wells Fargo stock is the only name in this trio trading lower in 2026 so far, and its business mix leans more heavily on lending than either peer. That leaves Wells Fargo shares more sensitive to net interest margin dynamics. The 30-year Treasury yield reached its highest level since 2007 earlier this week before easing after the Treasury Department said it would increase buybacks of long-dated government debt “by at least double” for securities from the 10-year to 30-year sector, broader context for why 2026 has been difficult for rate-sensitive lenders.
The Sector Fund Barely Moved
The Financial Select Sector SPDR Fund’s 5% YTD gain sits well below both BNY Mellon and Bank of America. XLF covers banks, insurers, and capital markets firms rather than large banks alone, so its return blends many business models. The blended read tempers what any single leader delivered.
That modest return highlights the concentration risk in diversified sector exposure. Owning BNY Mellon directly would have vastly outperformed buying the group through XLF this year. The sharpest read from 2026 is that the bank trade rewarded a specific business model, not the sector as a whole.
What to Watch
The winner in 2026 has been the platform earning fees on global capital markets plumbing, while traditional lenders struggled to keep pace. For those weighing exposure here, position sizing and business-model awareness may matter more than the sector label, and cautious sizing looks prudent when a single name has moved this far ahead.
Investors may want to keep an eye on whether BNY Mellon’s fee-driven momentum holds as capital markets activity normalizes into the fall. The next earnings cycle could sharpen the divide between fee-heavy platforms like BNY Mellon and lending-heavy franchises like Wells Fargo and Bank of America.
The post Which Big Bank Stock Has Dominated in 2026: Bank of America, Wells Fargo, or Bank of New York Mellon Corp.? appeared first on 24/7 Wall St..
]]>Bank CEOs usually talk about AI the way they talk about weather. Something happening, worth mentioning, no need to alarm anyone. Wells Fargo (NYSE:WFC) chief Charlie Scharf went the other way on CNBC’s Squawk on the Street this morning, saying automation will eliminate tens of thousands of positions at the bank, then immediately arguing the American consumer is strong enough to absorb the blow. Both halves of that argument matter for anyone holding the stock.
Wells Fargo trades at $88.39 as of this writing, up 14% over the past year and down 7.15% year to date. The market is treating Scharf’s comments as management doing exactly what management is supposed to do.
The Job Cut Admission
Scharf did not hedge. “Our headcount since I’ve been at the company is down 79,000 people. We’re down 15,000 over the past year, 7500 over the last quarter. And that has nothing to do with AI. But when we think about the ability to automate roles… it’s going to result in tens of thousands of fewer positions.”
The distinction matters. The 79,000 jobs already gone were a restructuring story. Wells Fargo has cut headcount for 24 consecutive quarters, ending Q2 2026 at 197,000 employees. The AI wave is a second, separate cut still ahead. Meanwhile, productivity gains are already showing up in the numbers.
Q1 2026 EPS was $1.60 on revenue of $21.446 billion, and Q2 diluted EPS jumped to $2.00, up 25% year over year while headcount fell 7%. Return on tangible common equity hit 17.7%, right at the top of the raised 17-18% medium-term target. Fewer people, more money, higher returns. You can see the strategy in the Q1 2026 8-K without squinting.
The Catch He Was Willing to Name
Then Scharf said the thing most CEOs skip. “I do believe that this is a great thing for the economy, but the time periods might not match up, the skill levels might not match up. And so we all have to work really hard in private industry and with government to figure out how we’re going to bridge that gap.”
Translated, productivity gains from AI arrive fast and land in earnings. Retraining, geographic mobility, and new job creation arrive slowly and land on individual households. That mismatch is the actual macro risk, and it is not one a single bank can hedge. Scharf’s hedge on progress so far was blunt. “There’s more talk about it, but not enough that the private sector is doing to work with the government.”
Why He’s Still Bullish on Your Wallet
Scharf can stay optimistic because he sees the receipts every day. “Our credit card spend is up 10%. Our debit card spend is up 7%. Affluent, mass affluent and mass market each are driving about a third of the spend. About 70% of the increase in spend is from the mass customers… Delinquencies are down, savings rates are up.” And on wages, “paychecks rising faster than inflation for our customer base.”
The public data lines up. National credit card delinquencies sat at 2.92% at the start of 2026, drifting down from 2.98% last summer, still normalizing and nowhere near the 2009 peak near 6.8%. Real average hourly earnings hit $11.32 in June 2026, up from $11.18 two years earlier in inflation-adjusted dollars. Unemployment ticked down to 4.2% in June. Total personal consumption expenditures ran at an annualized $22,184.1 billion in June, a fresh high.
Wells Fargo’s consumer franchise reflects that. Q1 2026 new consumer checking openings ran up more than 15% year over year, credit card new accounts nearly 60% higher, and Wealth and Investment Management client assets reached $2.2 trillion, up 11%. Customer growth and employee reduction are moving in opposite directions on the same P&L.

What WFC Holders Should Actually Track
Scharf handed investors the tell. If credit card and debit spend keep growing at those 10% and 7% paces and mass-market delinquencies stay tame, the AI productivity story stays clean, and Wells keeps returning cash.
The bank sent $4.0 billion back through buybacks in Q1 alone after $23 billion in 2025 total returns. If mass-market spend rolls over first, that is when the skills-and-timing mismatch stops being a policy essay and starts being a credit cycle. Watch the consumer.
The post Wells Fargo’s CEO Says AI Will Erase Tens of Thousands of Jobs. Here’s Why He’s Still Not Worried About Your Wallet appeared first on 24/7 Wall St..
]]>Jim Cramer, host of Mad Money, used his Tuesday morning appearance on CNBC’s “Squawk on the Street” on July 21, 2026 to fire a warning shot at investors who rode the AI trade to fresh highs and never trimmed. His message left no room for interpretation: “Because if you own too much tech, you’re going to be slaughtered. And you won’t even know what hit you. For the moment, it’s time to go to other sectors that can make you money without the volatility.”
With futures pointing higher on renewed semiconductor strength, Cramer’s instinct ran against the crowd. His rotation playbook centers on two sectors: financials and healthcare. Both offer cleaner valuations and earnings momentum that has already shown up in bank results from the prior week.
The Discipline: Take Off Half When a Group Goes Red Hot
Cramer’s call is rooted in position sizing, not a blanket top call on tech. “When you have a group that is red hot, you take off half. You have to be disciplined, and the reason why you have to be disciplined is because a lot of this last run, the parabolic move, is not cured by a 20% to 30% decline because the stock went up more than that.”
Micron Technology (NASDAQ:MU) is the clearest illustration of the risk he has in mind. Cramer suggested a few weeks before this appearance that investors sell half their position, and the performance numbers explain why. Shares were up roughly 240% year to date at the time of publication, making Micron one of the standout performers in the S&P 500. Fiscal Q3 2026 revenue came in at $41.46 billion, up 346% from the same quarter a year earlier, with non-GAAP EPS of $25.11 versus a consensus near $20.78 and non-GAAP gross margin of 84.9%, up from 39% a year earlier. The fundamentals are real. The move is parabolic, which is precisely Cramer’s point. Polymarket contracts at the time of his comments priced a 0.74 probability that Micron would close lower that same day.
Where Cramer Sees Value: Banks at 12 to 15 Times Earnings
The sector rotation has visible evidence behind it. Among the top ten Dow names year to date at the time of the interview, eight were either healthcare or financials. The July 14 bank earnings round gave the thesis fresh fuel, with several large lenders posting record quarterly results.
JPMorgan Chase (NYSE:JPM) posted Q2 EPS of $7.70 versus $5.80 expected on $57.35 billion in net revenue, a 28% year-over-year increase, and authorized a fresh $50 billion buyback. Equity markets revenue surged 86% in the quarter, helping net income reach $21.2 billion, the highest quarterly profit in the bank’s history. Cramer’s read on CEO Jamie Dimon: “You can buy his stock for 15 times earnings. It’s one of the brightest guys in the world. Jamie and his team is filled with brilliant people. 15 times. I’ll take it.”
Bank of America (NYSE:BAC) trades at 14 times earnings, delivered a fifth consecutive EPS beat at $1.21 (versus the $1.13 consensus), and posted revenue of $31.6 billion, up 15% year over year, with net income climbing 27% to $9.1 billion. Wells Fargo (NYSE:WFC) trades at 12 times earnings and had lagged the broader market year to date at the time, which is exactly the type of unloved name Cramer is willing to buy while others chase memory chips higher.
Healthcare: Lilly the GLP-1 Winner
Cramer’s second lane is pharma, and he has a specific winner in mind. “I will say, you know what? Let me go and buy some Lilly into the Novo Nordisk weakness.”
Eli Lilly (NYSE:LLY) had reported Q1 2026 EPS of $8.55 versus $6.79 expected and revenue of $19.80 billion, up 55.5% year over year, with 2026 guidance at the time set at $82.0 to $85.0 billion. Since this article was first published, Lilly reported an even stronger Q2 2026 on August 5, 2026: revenue rose 48% year over year to $22.97 billion, non-GAAP EPS came in at $8.38, and the company raised its full-year 2026 revenue guidance again, this time to $85.0 to $87.0 billion. Mounjaro alone generated $9.9 billion in Q2 revenue, up 91% from the prior year, while combined Mounjaro and Zepbound revenue reached $14.9 billion in the quarter, a new record for both products. Novo Nordisk, by contrast, has struggled, guiding full-year adjusted sales to a decline of 4% to 12% at constant currency and falling sharply over the past year, which is the weakness Cramer saw as a buying opportunity for Lilly.
The Takeaway
Cramer’s broader argument comes down to a single discipline: recognize when a trade has run past what any ordinary pullback could undo, trim into strength, and redeploy at reasonable multiples where earnings are compounding. Banks reporting record quarterly profits at 12 to 15 times earnings, and a pharma leader raising its guidance two quarters in a row, give him the landing spots for those profits. The rotation is not a call that tech is finished. It is a call that discipline, at a certain point in a parabolic run, beats conviction.
Editor’s note: This update corrects Micron’s fiscal Q3 2026 non-GAAP gross margin to 84.9% and adds post-publication context from Eli Lilly’s August 5, 2026 Q2 earnings report, including Q2 revenue of $22.97 billion, non-GAAP EPS of $8.38, a raised 2026 revenue guidance range of $85.0 to $87.0 billion, and Mounjaro Q2 revenue of $9.9 billion (up 91%). JPMorgan’s Q2 net income of $21.2 billion, a record for the bank, is also noted alongside confirmation of its $50 billion buyback authorization.
The post “If You Own Too Much Tech, You’re Going To Be Slaughtered.” Cramer Urges Investors To Take Profits appeared first on 24/7 Wall St..
]]>On the July 16, 2026 episode of Mad Money, a caller identified as D phoned in about his sizable Alibaba (NYSE:BABA) position and asked Jim Cramer whether patience was still the right call. Cramer’s response was to hold the position and let the investment cycle play out.
Cramer told D, “I think you need to have patience here. I think it’s just down on a dip. It’s really still the best way to play China.“ He then framed his own geopolitical stance, saying, “I am a harder line on the Chinese than most people you see on air. But you know what? I want to try to help people make money, and I think you can make money on Alibaba.“ Cramer also referenced China’s GDP growth figures as “down 20% and 4.4%” during the segment.
Alibaba Is Sacrificing Profits to Build Its AI Future
Alibaba, run by CEO Eddie Wu, is in a deliberate reinvestment phase. Fiscal Q4 2026, reported May 13, 2026, showed revenue of $35.28 billion, up 3% YoY, with EPS of $0.09 and an operating loss of $123 million. Adjusted EBITA collapsed 84% to $740 million as the company poured capital into AI infrastructure and quick commerce. Free cash flow ran to negative $2.508 billion on capex of $3.898 billion.
Cloud Revenue Jumps 40% as Alibaba’s AI Bet Takes Off
The bright spot was the business’s cloud unit. Cloud Intelligence Group revenue accelerated to 40% growth, with AI-related products at 30% of external cloud revenue, hitting an 11th consecutive quarter of triple-digit AI product growth. CEO Eddie Wu said, “Alibaba’s full-stack AI investments have progressed from incubation to commercialization at scale.”
BABA opened at $114.97 on Monday, July 20, before soaring 5.71% in intraday trading. The stock is down roughly 17.51% year-to-date but up 13.50% over the past month. Wall Street’s consensus target sits at $190.01, with 8 Strong Buy and 30 Buy ratings against just 2 negative calls.
Cramer Says Balance Alibaba With These 2 Long-Term Winners
Cramer paired his Alibaba call with 2 other top long-term ideas: “If you want some long-term winners, look at something like a J&J or Wells Fargo.” Both fit the steady-compounder profile that balances a volatile China ADR.
Johnson & Johnson (NYSE:JNJ) posted Q1 2026 revenue of $24.06B, up 9.9% YoY, and raised FY guidance to $100.3B-$101.3B in revenue with adjusted EPS of $11.45-$11.65. It just delivered its 64th consecutive year of dividend increases. Shares are up 23.63% YTD and carry a beta of 0.235.
Wells Fargo (NYSE:WFC), under CEO Charlie Scharf, reported Q1 2026 revenue of $21.45B and EPS of $1.60, returned $5.4B to shareholders including dividends, and now targets ROTCE of 17-18% after the Fed’s asset cap was removed in 2025. It trades at a forward P/E of just 12.
Key Takeaways
The post Jim Cramer: Alibaba Is “Still the Best Way to Play China” Despite Being Down 18% YTD appeared first on 24/7 Wall St..
]]>Wells Fargo (NYSE:WFC) just delivered a striking pair of price target hikes on cybersecurity leaders Okta (NASDAQ:OKTA) and Fortinet (NASDAQ:FTNT). The firm raised its Okta stock price target to $150 from $100 while keeping an Equal Weight rating, and lifted its Fortinet stock price target to $120 from $70 while keeping an Underweight rating. For investors, the size of these hikes matters more than the unchanged ratings: they mark a sector-wide re-rating rather than a green light to pile in.
The move lands as cybersecurity demand accelerates on the back of AI-driven threat proliferation and enterprise platform consolidation. Both Okta and Fortinet have posted five consecutive quarterly EPS beats, and management teams at each are pitching their platforms as essential infrastructure for securing AI agents and hybrid workloads.
Still, Wells Fargo kept Okta stock at Equal Weight and Fortinet stock at Underweight, signaling that valuation, not fundamentals, is the constraint. That gap between raised targets and cautious ratings is what investors need to weigh before adding exposure here.
| Ticker | Company | Firm | Action | Old Rating | New Rating | Old Target | New Target |
|---|---|---|---|---|---|---|---|
| OKTA | Okta | Wells Fargo | Price Target Raise | Equal Weight | Equal Weight | $100 | $150 |
| FTNT | Fortinet | Wells Fargo | Price Target Raise | Underweight | Underweight | $70 | $120 |
The Analyst’s Case
Wells Fargo’s rationale is identical for both names. Supplementing 14 field checks over the past month, the firm’s Q2 on-cycle reseller survey pointed to improving overall cyber demand driven by AI-related urgency. That’s a demand-side signal, and it’s why targets moved sharply higher on Okta stock and Fortinet stock.
Yet, the ratings didn’t budge. Equal Weight on Okta and Underweight on Fortinet suggest Wells Fargo sees prices catching up to fundamentals rather than fundamentals justifying a bullish stance.
Earnings Snapshots: Okta and Fortinet
Okta is the leading independent identity platform. In Q1 FY2027, Okta posted revenue of $765 million, up 11.2% year over year (YoY), with non-GAAP EPS of $0.91 and free cash flow of $271 million. Management is now positioning identity as the control plane for AI agents inside the enterprise.
Meanwhile, Fortinet is the firewall market leader. In Q1 FY26, Fortinet delivered revenue of $1.85 billion, up 20.1% YoY, non-GAAP EPS of $0.82, and a record $1.01 billion in free cash flow, supported by a hardware refresh cycle and the FortiOS 8.0 launch.
Why the Move Matters Now
The valuation backdrop is rich. Per Yahoo Finance as of July 20, Okta shares are up 76% year to date (YTD) with a TTM P/E ratio of 111x, while Fortinet shares are up 105% YTD with a TTM P/E ratio of 63x. The cybersecurity-sector peers look similar: Palo Alto Networks stock is up 95% YTD with a TTM P/E ratio of 312x, and CrowdStrike stock is up 75% YTD with TTM EPS of -$0.02, so no trailing P/E ratio applies.
Palo Alto Networks (NASDAQ:PANW) and CrowdStrike (NASDAQ:CRWD) are riding the same AI-driven demand wave, and both have shown accelerating platform consolidation among enterprise customers. That’s the sector thesis Wells Fargo is validating.
What It Means for Your Portfolio
These are fully valued names. The Wells Fargo price target raises on Okta and Fortinet stock reflect sector momentum, and investors can approach these names with restraint. Thus, it makes sense to keep one’s position sizes modest.
For diversified exposure, the First Trust NASDAQ Cybersecurity ETF (NASDAQ:CIBR) holds all four names, with PANW at 8.46%, CRWD at 8.25%, FTNT at 7.4%, and OKTA at 2.7% of net assets. It isn’t leveraged, but single-sector concentration risk is real. All in all, position sizing is just as important as diversification in this fast-moving market sector.
The post Wall Street Just Supersized Its Price Targets on Okta and Fortinet. Are Cybersecurity Stocks a Must-Own in 2026? appeared first on 24/7 Wall St..
]]>Goldman Sachs (NYSE:GS) is the acknowledged leader in the investment landscape on Wall Street and worldwide. The firm’s top-notch research department continues to provide institutional and high-net-worth clients with the best ideas across the investment spectrum and is likely to do so for years to come. Founded in 1869, Goldman Sachs is the world’s second-largest investment bank by revenue and is ranked 36th on the Fortune 500 list of the largest U.S. corporations by total revenue.
The Wall Street white-glove giant offers financing, advisory services, risk distribution, and hedging for the firm’s institutional and corporate clients. In addition, it provides advice, investing, and execution for institutions and individuals across public and private markets. At 24/7 Wall St., we have followed the company’s research for 15 years to bring our readers top stock ideas. One of our favorite avenues is the firm’s Conviction List of top picks, which is reviewed and often updated monthly. This month, the firm added two stocks that investors are very familiar with, and a third with massive upside potential.
Why we recommend Goldman Sachs Conviction List stocks
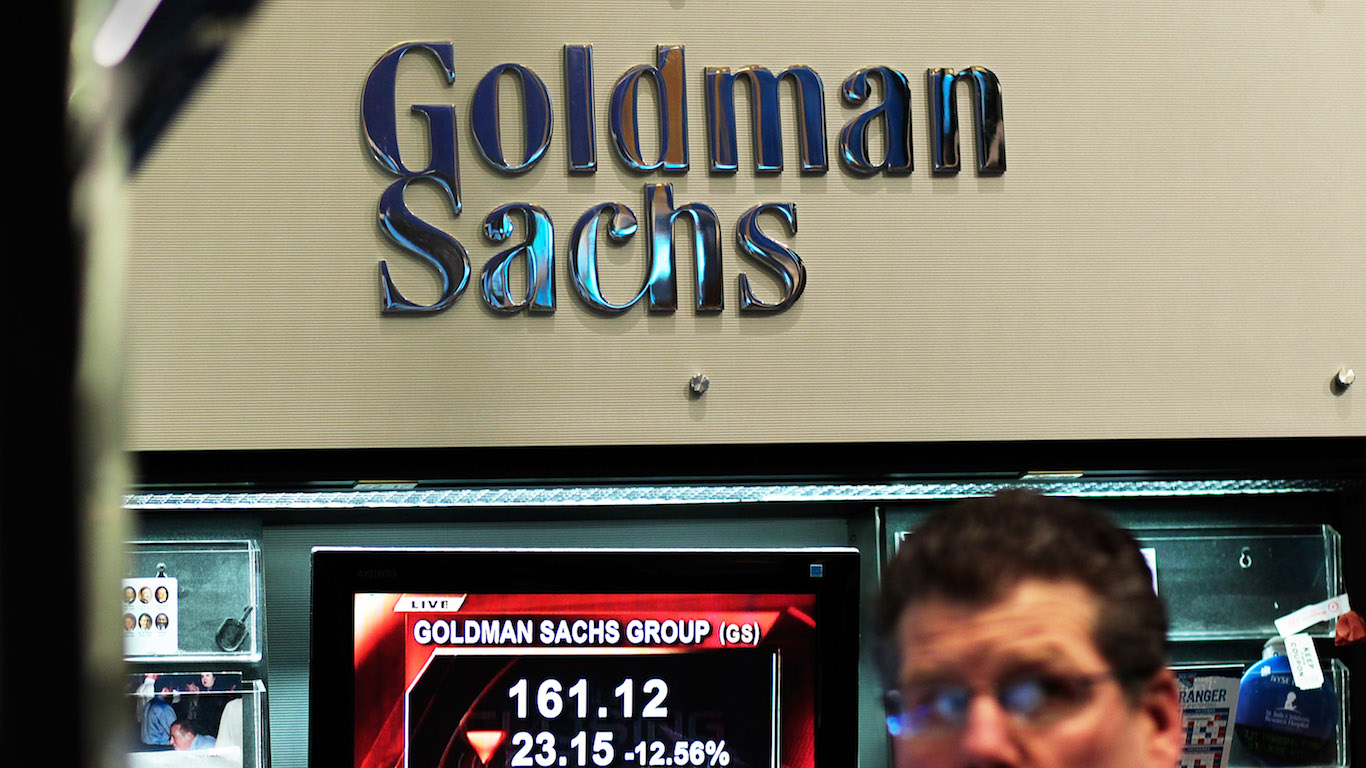
The Goldman Sachs Conviction List is a curated list of stocks that the firm’s research team believes are highly likely to outperform the market. It is a tool for investors to identify stocks with strong growth potential and is frequently updated to reflect changes in market conditions and company performance. The list aims to identify stocks where Goldman Sachs analysts have the “highest level of conviction” in their outperformance.
Estee Lauder
The fragrance and makeup giant has been added to the list and also offers a 1.69% dividend. Estee Lauder (NYSE:EL) is a manufacturer, marketer, and seller of skin care, makeup, fragrance, and hair care products.
Goldman Sachs analyst Bonnie Herzog noted this:
Following several years of execution challenges, it is heading into a positive, innovation-driven topline inflection that investors underappreciate in a prestige beauty market driven by innovation. Look for revenue growth, an improving business in China, and internal initiatives to drive 450bp of margin expansion over the next three years, alleviating investor concerns that the company will engage in value-dilutive M&A, and paving the way for multiple expansion as confidence returns to this historical high-end leader.
The company’s products are sold in approximately 150 countries and territories under several brand names, including:
- Estee Lauder
- Aramis
- Clinique
- Lab Series
- Origins
- M.A.C
- Bobbi Brown Cosmetics
- La Mer
- Aveda
- Jo Malone London
- Bumble and bumble
- Darphin Paris
- TOM FORD
- Smashbox
- AERIN Beauty
- Le Labo
- Editions de Parfums
- Frederic Malle
- GLAMGLOW
- Kilian Paris
- Too Faced
- Dr.Jart+
- The DECIEM family of brands, including The Ordinary and NIOD
It is a licensee for fragrances, cosmetics, and/or related products for AERIN, BALMAIN, and Dr. Andrew Weil. Its skin care products include moisturizers, serums, cleansers, toners, exfoliators, facial masks, body care products, sun care products, and more. The makeup products include lipsticks, lip glosses, mascaras, foundations, and others.
The Goldman Sachs price target is $100, which would be a 22% gain from current levels.

Nextpower
While off the radar of some, this company, previously known as Nextracker, could attract more attention as power demand surges. Nextpower (NASDAQ:NXT) is a global provider of solar and energy technology solutions for utility-scale power plants. The company specializes in solar tracking systems.
Goldman Sachs analyst Brian Lee said this:
NXT’s business model is evolving from a pure-play utility-scale solar-tracking company into a power technology platform built around a solar core, with the potential to sustain long-term growth and a premium valuation vs. peers in the space. Over time, look for tracking revenue to fall to two-thirds of total revenue, while other, value-added, and margin-enhancing services, including electrical work, batteries, and software solutions, grow to a third of total revenue, driving a ~10% non-GAAP EPS CAGR through FY 2029 (ended March).
The company delivers an integrated suite of structural, electrical, and digital solutions across the full lifecycle of solar power plants, from design and construction through operations and maintenance. The company delivers intelligent power generation systems and services.
Nextpower has developed solar trackers that enable rows to move independently. Its TrueCapture energy yield management system addresses power production shortfalls due to the variability of real-world site conditions.
The company’s customers include engineering, procurement, and construction firms, as well as solar project developers and owners. Its products include trackers, foundations, software, eBOS, controls, and module frames. Its trackers include NX Horizon, NX Horizon-XTR, and NX Horizon Low Carbon. Its solutions include AgriPV and Risk and Resilience.
The Goldman Sachs target price of $168 would represent a 63% gain.

Wells Fargo
Wells Fargo (NYSE:WFC) operates in 35 countries and serves over 70 million customers worldwide. This money-center giant makes sense, given its 2.06% dividend, as many of the issues that have plagued the company over the last five years appear to be resolved. Wells Fargo is a financial services company that offers a diverse range of banking, investment, mortgage, and consumer and commercial finance products and services in the United States and internationally.
Goldman Sachs analyst Richard Ramsden provided this:
WFC continues to shift from defense to offense, as it is in the midst of a balance sheet expansion initiative while simultaneously benefiting from a very strong capital markets backdrop and strength in its credit card business. Look for a supportive US economy, a constructive environment, and concerted efforts to control costs to help drive 300bp+ of margin expansion, helping to fuel a 17.6% ROTCE by 2028.
The company operates through four segments:
- Consumer Banking and Lending
- Commercial Banking
- Corporate and Investment Banking
- Wealth and Investment Management
The Consumer Banking and Lending segment offers a diverse range of financial products and services tailored to meet the needs of consumers and small businesses. These include checking and savings accounts, credit and debit cards, as well as home, auto, personal, and small business lending services.
The Commercial Banking segment provides financial solutions to private, family-owned, and specific public companies. Its products and services include banking and credit products across various industry sectors and municipalities, as well as secured lending and lease products, and treasury management services.
The Corporate and Investment Banking segment offers a suite of capital markets, banking, and financial products and services, such as:
- Corporate banking
- Investment banking
- Treasury management
- Commercial real estate lending and servicing
- Equity and fixed-income solutions
- Sales, trading, and research capabilities services to corporate, commercial real estate, government, and institutional clients
The Wealth and Investment Management provides wealth management, brokerage, financial planning, lending, private banking, and trust and fiduciary products and services to affluent, high-net-worth, and ultra-high-net-worth clients.
Wells Fargo also operates through financial advisors in brokerage and wealth offices, consumer bank branches, independent offices, and digitally through WellsTrade and Intuitive Investor.
The $93 Goldman Sachs price target would represent a 6% gain, so this is more of a total return idea.
The post 2 Goldman Sachs July Conviction List Additions Have Huge Double-Digit Upside Potential appeared first on 24/7 Wall St..
]]>On Thursday, July 16, during the broadcast of Mad Money, Jim Cramer pushed back on the market’s punishment of several blue-chip companies that had just posted strong quarters. He named five companies he believes deserve investors’ attention right now.
“It takes a lot of hubris, a lot of guts to disagree with the market’s judgment about a stock after it reports,” Cramer said. “You’re basically saying that the collective wisdom of millions of people and billions of dollars is just plain wrong.”
The Dow fell 106 points, the S&P 500 dropped 0.51%, and the Nasdaq lost 1.47% on the day. Cramer’s argument: in that session, quality names got thrown out alongside the growth trade, creating selective mispricings worth acting on.
GE Aerospace: A Guidance Raise Met With Selling
GE Aerospace (NYSE:GE) fell roughly 4% despite a clean beat and a broad guidance raise. In Q2 2026, adjusted EPS of $2.02 beat the $1.86 consensus by 8.6%, GAAP revenue climbed to $13.35 billion (up 21% year over year), and free cash flow jumped 43% to $3.0 billion. Management lifted full-year adjusted EPS guidance to $7.65-$7.85 and highlighted a total backlog of over $210 billion, including roughly $170 billion in commercial services.
Cramer’s take: “GE Aerospace remains the best institutional choice right now. You never sell the stock of GE, by the way, before Farnborough. The market’s dead wrong here.” Total orders for the quarter rose 17% to $16.5 billion, with the Commercial Engines and Services segment up 27% in revenue, marking GE’s fifth consecutive quarter of at least 20% adjusted revenue growth.
Wells Fargo: Cramer Calls It “A Steal” At 12x Earnings
Wells Fargo (NYSE:WFC) is the name Cramer told his Investing Club members was “a steal” at 12 times earnings. The Q2 2026 report, released July 14, delivered diluted EPS of $2.00, up 25% year over year, on revenue of $22.6 billion, up 9%. Net income grew 17% to $6.4 billion, with return on average tangible common equity hitting 17.7%. The bank returned $9.8 billion to shareholders in the first half through buybacks and dividends, and announced an expected 11% increase in its Q3 common stock dividend to $0.50 per share.
“Wells Fargo’s quarter wasn’t just good. I thought it was terrific,“ Cramer said. “The analysts were fixated on the sinkhole net interest income. And also they care about net interest margin. Sometimes it’s just so myopic.” Under CEO Charlie Scharf, Cramer sees Wells transforming into a merchant bank, with Markets revenue up 24% and Wealth and Investment Management client assets up 15% to $2.4 trillion. Management reaffirmed a medium-term ROTCE target of 17-18%.
Johnson & Johnson: Look Past the Heart Business Miss
Johnson & Johnson (NYSE:JNJ) took heat because its Abiomed heart-pump business underperformed, pressuring the stock. Cramer argues it is smarter for investors to focus on the pipeline: DARZALEX reached $4.2 billion in quarterly revenue (up 17.6% operationally), TREMFYA surpassed $2 billion for the first time (up 72.5%), and CARVYKTI hit $657 million (up 47.7% operationally). J&J also raised its full-year 2026 revenue guidance to a $101.1 billion midpoint and lifted adjusted EPS guidance to $11.68 at the midpoint. The company has now delivered its 64th consecutive year of dividend increases, raising the quarterly payout 3.1% to $1.34 per share in April 2026.
“ICOTYDE, a recently approved drug for moderate to severe plaque psoriasis, may actually become the biggest drug in J&J history,” Cramer said, urging viewers to “focus on the forest of green, not the 150 mistake.”
UnitedHealth: Margin Recovery, Muted Close
UnitedHealth Group (NYSE:UNH) closed on July 16 at just over $426 per share. The quarter itself was a genuine step-change in profitability: the medical care ratio improved sharply to 86.7% from 89.4% a year earlier, reflecting cost and pricing discipline as well as $860 million of net favorable prior-period medical development. Adjusted EPS came in at $6.38, up from $4.08 a year ago, and earnings from operations jumped 55% to $8.0 billion. Management raised full-year adjusted EPS guidance to $19.50-$20.00 and committed to at least $5 billion in share repurchases for the year.
Levi Strauss: Four Straight Beats, Skeptical Market Reaction
Levi Strauss (NYSE:LEVI) fits Cramer’s mismarked template. Q2 FY2026 adjusted EPS of $0.28 beat the $0.24 consensus by 16.67%, revenue grew 8.0% to $1.562 billion, and DTC hit 51% of revenue with e-commerce up 19%. Yet the stock fell 1.18% on earnings day, extending a frustrating pattern in which five consecutive beats have averaged a -2.07% one-week change in the share price.
The Broader Message
Cramer’s argument is that the market can overreact to a single weak metric in a company’s earnings while overlooking stronger results across the rest of the business. “I think it’s a much better game to find mismarked stocks that analysts don’t really care for that… I know better than they do.”
He believes that disconnect has created opportunities in GE, Wells Fargo, J&J, UnitedHealth, and Levi Strauss, each of which reported solid fundamentals that the market chose to ignore in favor of one headline miss.
Editor’s note: This article has been updated with Q2 2026 actual results for Wells Fargo (EPS of $2.00, revenue of $22.6 billion, Markets revenue up 24%, Wealth and Investment Management client assets up 15% to $2.4 trillion) and Johnson and Johnson (DARZALEX at $4.2 billion up 17.6%, TREMFYA at $2.0 billion up 72.5%, CARVYKTI at $657 million up 47.7%), replacing earlier figures that reflected the prior quarter. The GE Aerospace free cash flow figure has been rounded to the reported $3.0 billion.
The post Jim Cramer Says the Market Is “Dead Wrong” About These 5 Oversold Stocks appeared first on 24/7 Wall St..
]]>As always, the quarterly earnings were kicked off by the major large-cap money center banks, and as expected they all delivered solid earnings reports. The team at Jefferies remains very positive on the four top companies that beat earnings expectations and, most importantly, provided reassuring forward guidance. Net interest income, or NII, across all banks was impressive, and with the debate over where interest rates will be as we move through the rest of 2026 remaining a wild card for all the financial giants, the second half of the year could prove interesting.
The Jefferies team had this to say when discussing the results:
We’re out with our thoughts following large-cap bank earnings. We highlight that results were largely positive, with all four banks beating Earnings Per Share and Pre-Provision Net Revenue expectations. Loan growth came in modestly above expectations, while deposit trends were generally stable. NII growth remained healthy, supported by strong balance sheet momentum, deposit growth, and fixed-rate asset repricing. Fee income remained constructive, benefiting from strength in payments, treasury services, securities services, wealth management, and transaction banking. Meanwhile, capital markets were a standout performer, driven by robust trading activity, improving investment banking fees, and healthy client engagement.
Here are the four dividend-paying financial giants that Jefferies rates as Buy.
Bank of America
Warren Buffett has trimmed his position over the past two years and sold a 50 million shares in the fourth quarter. This quality financial giant remains an exceptional long-term holding with a solid 1.89% dividend yield. Bank of America (NYSE:BAC) is a bank holding company that reported impressive Q2 results. Berkshire Hathaway owns 513,624,165 shares, which is 7.9% of the portfolio and 7.2% of the float. Berkshire did lower its Bank of America position in Q1 2026, but only modestly. According to the Q1 2026 13F filing, it was reduced by just 0.71%, a very small cut compared to other positions.
The Jefferies analyst noted this:
Bank of America delivered a strong quarter, with core EPS and Pre-Provision Net Revenue ahead of expectations, driven primarily by strength in investment banking and sales & trading. While NII was largely in line, management reiterated growth at the upper end of 6-8% and raised FY26 operating leverage guide to 300-400 bp from >200 bp previously following 2Q’s POL of 640 bp. The return on tangible common equity of 17.0% vs our 16.1% reinforces the earnings power of the franchise.
Its segments include:
- Consumer Banking, which offers a range of credit, banking, and investment products and services to consumers and small businesses.
- Global Wealth & Investment Management (GWIM) comprises two businesses: Merrill Wealth Management, which offers tailored solutions to meet clients’ needs through a comprehensive suite of investment management, brokerage, banking, and retirement products. Bank of America Private Bank provides comprehensive wealth management solutions.
- Global Banking offers a range of lending-related products and services, including integrated working capital management and treasury solutions, as well as underwriting and advisory services.
- Global Markets offers sales and trading services, as well as research services, to institutional clients across fixed income, credit, currency, commodity, and equity markets.
The Jefferies price target is $75.
Citigroup
This money-center giant pays a solid 1.64% and could be poised to deliver continued upside. Citigroup (NYSE:C) is a global diversified financial services holding company. The Jefferies team had this to say when discussing the second-quarter results:
Citi delivered a strong quarter, with core earnings per share and pre-provision net revenue ahead of expectations, driven by stronger-than-expected NII, Markets, and Investment Bank results. Still, the expense outlook was worse than expected, as the return on tangible common equity guide for FY26 was reiterated at 10-11% despite 1H’26 ROTCE trending at 13%. Revenue outperformance could be offset by $5 billion of spending pulled forward that was originally planned for ’27/’28 related to US Card, growth, and productivity initiatives.
The company’s segments include:
- Services
- Markets
- Banking
- Wealth
- U.S. Personal Banking (USPB)
The Services segment includes Treasury and Trade Solutions (TTS) and securities services. TTS provides an integrated suite of tailored cash management, trade, and working capital solutions to multinational corporations, financial institutions, and public sector organizations.
The Markets segment provides corporate, institutional, and public-sector clients worldwide with a full range of sales and trading services across equities, foreign exchange, rates, spread products, and commodities.
The Banking segment includes investment banking, which supports client capital-raising needs to help strengthen and grow their businesses.
The Wealth segment includes Private Bank, Wealth at Work, and Citigold, and provides financial services to a range of client segments.
The USPB segment includes branded cards and retail services.
Jefferies has a $165 target price for the shares.
Goldman Sachs
The white-glove banking giant delivered exceptional results and pays a 1.47% dividend. Goldman Sachs (NYSE:GS) is a global financial institution that delivers a range of financial services to a large and diversified client base, including corporations, financial institutions, governments, and individuals.
The Jefferies team said this:
Following 2Q26 results, our EPS estimates for the second half of 2026 and FY2027 increase by 9% and 8%, respectively, following a record 1H26 in both markets and advisory. Record equities revenues, all-time-high prime balances, accelerating large-cap M&A, and a five-year-high backlog provide strong support for continued earnings momentum.
Its segments include:
- Global Banking & Markets
- Asset & Wealth Management
- Platform Solutions
The Global Banking & Markets segment offers a range of services, including financing, advisory services, risk distribution, and hedging for its institutional and corporate clients. It facilitates client transactions and makes markets in fixed income, equity, currency, and commodity products.
The Asset & Wealth Management segment manages assets and offers investment products across all asset classes to a diverse client base. It also provides investment and wealth advisory solutions.
The Platform Solutions segment includes consumer platforms, such as partnerships offering credit cards and point-of-sale financing, as well as transaction banking and other platform businesses.
Jefferies has set a price target of $1,299 for the shares.
Wells Fargo
With some difficult years in the rearview mirror, this bank could be one of the best values in the financial sector, and pays a 2.11% dividend. Wells Fargo (NYSE:WFC) is a financial services company. The company provides a diversified set of banking, investment, and mortgage products and services, as well as consumer and commercial finance, to individuals, businesses, and institutions.
Jefferies analysts noted this:
WFC posted a headline beat on strong fee income and continued expense discipline, and reiterated its FY26 NII and expense guidance. Despite a solid quarter, shares traded lower amid a net interest margin outlook that fell short of expectations and rising deposit costs. NIM compressed as expected, down 4 bp, in line with the guide, but better-than-expected AEA growth drove a modest NII beat. IB deposit costs rose 9 bps Q/Q, with continued pressure expected in 2H’26 as IB outpaces NIB growth.
Wells Fargo operates through four segments:
- Consumer Banking and Lending
- Commercial Banking
- Corporate and Investment Banking
- Wealth & Investment Management
The company provides consumer financial products and services, including checking and savings accounts, credit and debit cards, and auto, residential mortgage, and small business lending.
In addition, the company offers financial planning, private banking, investment management, and fiduciary services. It also provides financial solutions to businesses through products and services, including traditional commercial loans and lines of credit, letters of credit, asset-based lending and leasing, trade financing, treasury management, and investment banking services.
The Jefferies target price is $100.
The post Jefferies Bullish on 4 Dividend-Paying Money Center Bank Giants After Huge Q2 Earnings Results appeared first on 24/7 Wall St..
]]>Citigroup (NYSE:C) stock is down 4.7% to $134 Tuesday afternoon, a sharp sell-the-news reversal after the bank beat every analyst estimate for the second quarter. Citigroup shares had traded higher earlier in the session before turning red.
Zoom out, though, and Citigroup stock is still the clear year-to-date leader of the big three. Citigroup stock is up 13.75% in 2026, ahead of Bank of America (NYSE:BAC) stock at up 9.34% and Wells Fargo (NYSE:WFC) stock at down 8.82%.
All three banks reported strong Q2 2026 results powered by an AI-driven trading and dealmaking boom. Yet, the reaction across the group is mixed to negative, with Wells Fargo stock down 3.32% to $84.76 and Bank of America shares up only 1.29% to $60.27 after touching a record high earlier.
Citigroup Delivers a Blowout, Stock Reverses Anyway

Citigroup posted Q2 2026 earnings of $3.15 per share on $24.8 billion in revenue, marking the company’s highest revenue in a decade. The Street had expected about $2.74 in earnings per share, and record equity-trading revenue drove the upside.
Citigroup’s management paired the report with capital-return firepower, announcing a $30 billion buyback and a 12% dividend increase. That builds on the earlier hike from $0.56 to $0.60 per quarter that Citigroup pushed through last year.
The bear case that took over on Tuesday afternoon is straightforward. Citigroup’s CFO acknowledged that its equities franchise still trails larger rivals, and Citigroup stock now trades at a 16x P/E ratio. That’s the richest multiple of the three, which sets a higher bar even after a genuine beat.
Bank of America and Wells Fargo Also Beat, With Different Reactions
Bank of America reported EPS of $1.21 on revenue of $31.6 billion, its fifth consecutive quarterly EPS beat. The company’s Global Markets revenue jumped 34% to $8.02 billion, with equities sales and trading up 70% and investment banking fees up 50%.
CEO Brian Moynihan called it “one of our strongest quarters to date” and struck an upbeat tone on financing the AI buildout. Bank of America stock trades at a 15x P/E ratio, cheaper than Citigroup but richer than Wells Fargo.
Wells Fargo, meanwhile, posted EPS of $2, with investment banking fees up 35% and return on tangible common equity of 17.7%. The bank also announced a buyback and a planned dividend raise, but CEO Charlie Scharf’s “carefully deploying capital” tone weighed on Wells Fargo shares. Wells Fargo stock trades at a 13x P/E ratio, the cheapest of the group.
So Is Citigroup Actually Outperforming?
The short answer is yes, at least on the year-to-date scoreboard. Citigroup’s 13.75% run tops Bank of America and doubles down on the turnaround story CEO Jane Fraser has been selling, with 65.9% gains over the past year backing it up.
The nuance is that Citigroup carries the richest valuation and the smallest markets franchise of the three, so any wobble in trading or dealmaking hits harder. Tuesday’s reversal is a reminder that leadership at the top of a rally leaves less margin for error, and investors should consider sizing their positions accordingly.
For readers who prefer a broader lens, the Financial Select Sector SPDR ETF (NYSEARCA:XLF) offers diversified exposure to the big banks and the wider financials complex in one fund. That can smooth out days like this one, when three earnings beats produced three different market reactions.
What to Watch Next
The immediate cue is whether Citigroup stock can stabilize into Tuesday’s close after giving back ground from an earlier intraday high. Follow-through from the $8 billion in Bank of America capital returns and Wells Fargo’s guidance on its dividend plan could set the tone for the rest of bank earnings week.
Keep an eye on how the group trades over the next few sessions. If Citigroup holds most of its year-to-date lead through the JPMorgan Chase (NYSE:JPM) and regional bank earnings reports later this week, the outperformance thesis could remain intact even after a rough Tuesday.
The post Citigroup Is Up 14% This Year: Is It Outperforming Other Bank Stocks Like Wells Fargo and Bank of America? appeared first on 24/7 Wall St..
]]>Devin Ryan, Senior Research Analyst at Citizens, laid out a bullish setup for big banks on Monday’s CNBC segment ahead of Q2 earnings. He said: “Tomorrow is going to be, I think, a really good day to kick things off for the top six banks. We’re looking for about 25% year-over-year earnings growth.”
With Bank of America, Citigroup, Goldman Sachs, JPMorgan Chase, and Wells Fargo all reporting before the open on Tuesday, July 14, and Morgan Stanley following on Wednesday, July 15, the setup is concentrated and driven by the revival of capital markets along with commercial lending.
Goldman Sachs and Morgan Stanley Could Lead the Bank Earnings Boom
Ryan’s core call is that the biggest upside among the big banks could sit with the most capital-markets-levered franchises. “The companies that are going to do the best are probably the ones more exposed to capital markets. So SpaceX IPO, M&A announcements are up 50% year-to-date through the first half. And so Goldman Sachs, Morgan Stanley probably going to be standouts. We’re looking for almost 40% earnings growth out of both of those.”
Goldman Sachs Is Built for the Capital Markets Revival
Q1 2026 validated the direction. Goldman Sachs (NYSE:GS) posted EPS of $17.55 on $17.23 billion in revenue, with investment banking fees of $2.84 billion up 48% and advisory revenues nearly doubling at $1.49 billion, up 89%. CEO David Solomon said, “Goldman Sachs delivered very strong performance for our shareholders this quarter, even as market conditions became more volatile” in the firm’s Q1 release.
Morgan Stanley Enters Earnings With Record Momentum
Morgan Stanley (NYSE:MS) delivered its own record. Ted Pick’s team reported $20.58 billion in revenue, EPS of $3.43, ROTCE of 27.1%, and advisory revenue up 74% to $978 million. Ryan’s near 40% earnings growth expectation follows Q1 net income growth of 29%.
Wall Street’s Rebound Is Lifting America’s Biggest Banks
Ryan sees the capital markets tailwind lifting the rest of the group. JPMorgan Chase (NYSE:JPM) opened 2026 with EPS of $5.94, up 17%, record Markets revenue of $11.6 billion, and advisory fees up 82% to $1.27 billion. Jamie Dimon flagged “increased fiscal stimulus, the benefits of deregulation, AI-driven capital investment and the Fed’s asset purchases” as tailwinds.
Bank of America (NYSE:BAC) grew EPS 25% year-over-year to $1.11, with equities trading up 30% and investment banking fees up 21%. Citigroup (NYSE:C) delivered net income up 42% and Markets revenue crossing $7 billion for the first time, with equity markets up 39%. Wells Fargo grew EPS 15%, with CIB Markets up 19% and equity capital markets share expanding.
The Next Banking Opportunity May Be Hiding Outside the Mega Banks
Capital markets stocks were up nearly 50% last year and up 20% in 2026 to date, with the S&P 500 up 15% in the second quarter. Goldman shares are up 21.19% year-to-date, and Morgan Stanley is up 26.55%. Ryan’s cautious because: “We think a lot is actually baked in. And so we’re looking for areas where there’s probably more upside. We still think there’s areas of capital markets like middle market sponsors. Private equity still have quite a way to recover.”
On commercial lending re-acceleration, he pointed to two forces. “So data centers is a big piece of the reacceleration, but then also just capital markets turning back on. So as you think about [the] M&A market that’s been dormant, starting to get back to something more normal that leads to lending opportunities into those deals.”
Key Takeaways
The major banks enter Q2 earnings with strong momentum across investment banking, trading, and commercial lending. Goldman Sachs and Morgan Stanley may deliver the strongest results because of their greater exposure to the capital markets recovery, with Ryan expecting earnings growth of nearly 40% from both firms.
Expectations are already high, however, and much of the rebound may be reflected in mega-bank share prices. The next opportunities could emerge among middle-market firms and other lenders that stand to benefit as private equity activity, M&A, and data center investment recover. A broader market pullback or slowdown in AI-related spending remains the clearest risk to that outlook.
The post Senior Analyst: Banks Are Set for 25% Earnings Growth as the Capital Markets Boom Accelerates appeared first on 24/7 Wall St..
]]>For the retirement-focused investor who wants both a discount and a paycheck, the megabank aisle offers two obvious names: Bank of America (NYSE:BAC) and Wells Fargo (NYSE:WFC). Both posted strong Q1 2026 results, both are returning heavy capital to shareholders, and both trade at similar forward multiples. So which one actually delivers more value and income per dollar right now? Here is the head-to-head, judged on three dimensions that matter to a retiree: valuation, income, and safety.
Dimension 1: Valuation. Winner: Wells Fargo.
On the multiples that matter to a value investor, Wells Fargo trades more cheaply across the board. Bank of America has a trailing P/E of 14 and a forward P/E of 12, with a price-to-book ratio of 1.4. Wells Fargo trades at a trailing P/E of 13 and a forward P/E of 11, on TTM EPS of $6.47 versus Bank of America’s $4.03. Wells Fargo does trade at a slightly higher 1.6 price-to-book ratio, but on the forward earnings that a retirement investor actually cares about, Wells Fargo is meaningfully less expensive. Analysts appear to agree on upside asymmetry: the average target on Wells Fargo is $96.52 against a current price of $85.94 (12.3% implied upside), while Bank of America has already run to $58.36 versus a $64.12 target (9.9%).
Momentum backs the valuation case. Bank of America is up 21.2% over the past year and 6.1% year to date, while Wells Fargo is down 7.8% year to date but 5.5% higher year over year. The valuation gap exists because one has already been bid up and the other has not.
Dimension 2: Income. Winner: Wells Fargo.
This is the cleanest win on the scorecard. Wells Fargo pays $1.80 per share for a 2.1% yield, backed by a Q3 2025 raise from $0.40 to $0.45 quarterly, a 12.5% bump that has held steady into 2026. Bank of America’s dividend runs at $1.10 for a 1.9% yield. At today’s prices, Wells Fargo delivers more income per dollar invested.
The capital-return story is also lopsided. Wells Fargo returned $23 billion to shareholders in 2025, versus $16 billion at Bank of America. In Q1 2026 alone, Wells Fargo repurchased $4.0 billion in stock. Against a market cap of $263.0 billion, that represents aggressive reduction of the share count, and it directly boosts per-share dividends and earnings going forward.
Dimension 3: Safety and Balance Sheet. Winner: Bank of America.
Bank of America wins on the balance sheet. It runs a stronger capital position, with a Common Equity Tier 1 (CET1) ratio of 11.2% versus Wells Fargo’s 10.3%, which slipped from 11.1% a year ago as risk-weighted assets grew,. Bank of America’s franchise is bigger and more diversified: $2.02 trillion in average deposits, an 11th consecutive quarter of sequential deposit growth, and four straight EPS beats. Wells Fargo carries $2.5 billion in nonaccrual CRE office loans and a credit card net charge-off rate of 0.8%. For a retiree who cannot stomach a headline surprise, that combination matters.
The Verdict
Wells Fargo wins the value-and-income showdown, and it is not even close. It trades at a lower forward multiple, pays a higher yield, just raised its dividend by 12.5%, and has an unambiguous catalyst in the asset cap removal that CEO Charlie Scharf called a milestone that lets the bank grow in ways it could not while the asset cap was in place. Management raised its medium-term return on tangible common equity (ROTCE) target to 17% to 18%, and the stock has lagged the peer even as fundamentals improved. That is precisely the setup a value-and-income buyer wants.
Bank of America is the better pick for one specific retiree: the capital-preservation-first investor who prioritizes balance sheet strength, dividend reliability, and a diversified franchise over yield or upside. For everyone else seeking more bang per buck on both value and income, Wells Fargo is the stronger candidate.
The post More Bang for Your Buck: Is Bank of America or Wells Fargo the Better Value-and-Income Buy? appeared first on 24/7 Wall St..
]]>Retirement investors weighing Bank of America (NYSE: BAC) against Wells Fargo (NYSE: WFC) face a deceptively similar scorecard at the top of the analyst page: both megabanks carry a Buy consensus, and both project meaningful upside from current levels. So which belongs in a retirement portfolio right now? The headline numbers look close, but the conviction behind them, and the income, valuation, and risk profiles underneath, point to a clear winner for different investor types.
Start with the price-target scorecard. BofA trades at $57.88 against an analyst target of $63.70. Wells Fargo trades at $83.86 against a target of $96.30. Analysts on average recommend buying shares of each, but they diverge on conviction. While BofA has near-unanimous bullish coverage, Wells Fargo has notably more analysts sitting on the fence.
Dimension 1: Yield and Capital Return
Wells Fargo pays a $0.45 quarterly dividend, yielding 2.2%, versus Bank of America’s $0.28 quarterly payout at a 1.9% yield. Yet the buyback gap reverses the picture. Wells Fargo returned $23 billion to shareholders in 2025, including $18 billion in buybacks, and raised its dividend 13%. BofA returned about $30 billion in 2025 and had an 8% mid-year dividend hike. BofA is returning significantly more cash to shareholders, making it the decisive winner for income-focused retirees seeking total capital return.
Dimension 2: Valuation
Wells Fargo trades at a trailing P/E of 13 on TTM EPS of $6.47, versus BofA at 14 on TTM EPS of $4.03. Forward multiples are nearly identical at about 12, but the underlying catalyst supports a more attractive valuation for Wells Fargo. The Federal Reserve asset cap was removed in Q2 2025, allowing unrestricted balance sheet growth for the first time in years. Management raised its medium-term ROTCE target to 17% to 18%, up from 15%. Investors are thus paying a lower multiple for a structurally improving franchise. Wells Fargo is the winner.
Dimension 3: Balance Sheet Quality and Earnings Momentum
Bank of America’s balance sheet is the stronger of the two. CET1 stands at 11.4% versus Wells Fargo’s 10.3%, which declined from 11.1% a year ago. Q1 2026 EPS at BofA rose 25% year-over-year to $1.11, beating consensus for the fourth consecutive quarter. Wells Fargo grew EPS 15% to $1.60 but saw net interest margin compress to 2.47% from 2.67%. BofA’s revenue mix is also more diversified, with Q1 sales and trading up 13% and investment banking fees up 21%. Prediction markets reinforce this safety assessment: BofA’s implied failure probability of 2.4% is comfortably below that of the European megabank cohort.
The Verdict
Bank of America takes the head-to-head for the income-focused retiree. By leading on capital return, it offers a superior combination of current yield and dividend growth momentum. Combined with its stronger balance sheet and earnings momentum, CEO Brian Moynihan’s firm gives investors a robustly covered payout backed by fundamental tailwinds. For a retirement strategy that prioritizes total shareholder return alongside a strengthening operational profile, BofA provides the more compelling vehicle.
Wells Fargo wins for the value-conscious retiree whose primary focus is entry price and margin of safety. Winning strictly on valuation, the stock trades at a cheaper P/E multiple, offering a lower-volatility entry point for investors wary of paying a premium. The trade-off for this cheaper multiple is a thinner relative yield and less near-term capital return intensity compared to its peer.
For a retirement-focused investor today, Bank of America offers the more dynamic risk-reward profile. While Wells Fargo provides a cheaper valuation, BofA’s superior yield, aggressive buyback potential, and fundamental earnings momentum combine into a total-return setup that its rival’s cheaper multiple alone cannot match.
The post Bank of America or Wells Fargo: Which Mega-Cap Delivers Better Returns? appeared first on 24/7 Wall St..
]]>Bank of America has predicted that the Federal Reserve will be forced to raise interest rates by 75 basis points this year, with the first 25-basis-point hike in September. They also see additional 25-basis-point hikes in October and December. The energy shock from the war with Iran drove inflation higher, with the CPI rising in May to 3.8%, the sharpest increase in three years and well above the Fed’s 2% target. This, in turn, has prompted lenders to demand higher rates to protect returns. Meanwhile, investors sold bonds amid rising inflation and concerns about U.S. debt, which lifted Treasury yields. Since mortgage rates are based on the 10-year Treasury yield plus a risk premium, they rose in tandem. On the fiscal side, federal interest payments now exceed spending on Medicaid, national defense, and all nondefense discretionary programs combined, adding further upward pressure on long-term borrowing costs.
The team at Bank of America frames the rate increase argument on the hand that new Fed Chair Kevin Warsh was dealt, noting the following when discussing the potential for rate hikes this year:
We now expect three 25-basis-point Fed hikes this year, in September, October, and December. This would take the policy rate to 4.25-4.5%. We were skeptical of the need for cuts in 2025. Both the data and our updated read of the Fed’s reaction function suggest it will reverse those cuts in short order. We think the Fed will stay on hold next year. Inflation is likely to remain sticky, keeping the real policy rate from becoming overly restrictive. Meanwhile, the Fed’s inflation problem has gotten unambiguously worse. Core PCE could reach 3.5% in May, nearly 70bp higher than it was a year ago. The pickup has been partly due to tariffs and other one-offs. The Fed was willing to look through the tariffs, but it is losing patience after the latest round of supply shocks. Also, housing-driven disinflation has now mostly run its course, while other core services remain very sticky.
Typically, when interest rates go higher, these four sectors tend to win:
- Financials
- Energy
- Healthcare
- Consumer Staples
We screened our 24/7 Wall St. dividend stocks database for quality companies that pay big, dependable dividends and generate reliable passive income. We found four companies, one in each sector, that are solid bets if the upward trend in interest rates remains and Bank of America is correct in three rate hikes. All are rated Buy by the top Wall Street firms we cover.
Financials: Wells Fargo
Financials are the biggest winner. Banks earn a wider spread between what they pay depositors and what they charge borrowers. Insurers earn more on their investment portfolios. The sector almost mechanically benefits from rising rates, as net interest income rises.
Wells Fargo (NYSE: WFC) operates in 35 countries and serves over 70 million customers worldwide. This money-center giant makes sense, given its 2.09% dividend, as many of the issues that plagued the company over the past five years appear to have been resolved. This financial services company offers a diverse range of banking, investment, mortgage, and consumer and commercial finance products and services in the United States and internationally.
The company operates through four segments. The Consumer Banking and Lending segment offers a diverse range of financial products and services tailored to meet the needs of consumers and small businesses. These include checking and savings accounts, credit and debit cards, as well as home, auto, personal, and small business lending services.
The Commercial Banking segment provides financial solutions to private, family-owned, and specific public companies. Its products and services include banking and credit products across various industry sectors and municipalities, as well as secured lending and lease products, and treasury management services.
The Corporate and Investment Banking segment offers a suite of capital markets, banking, and financial products and services, such as:
- Corporate banking
- Investment banking
- Treasury management
- Commercial real estate lending and servicing
- Equity and fixed-income solutions
- Sales, trading, and research services to corporate, commercial real estate, government, and institutional clients
The Wealth and Investment Management segment provides wealth management, brokerage, financial planning, lending, private banking, and trust and fiduciary products and services to affluent, high-net-worth, and ultra-high-net-worth clients. It also operates through financial advisors in brokerage and wealth offices, consumer bank branches, independent offices, and digitally through WellsTrade and Intuitive Investor.
Barclays has an Overweight rating and a $108 target price.
Energy: Chevron
Energy benefits because rate hikes typically coincide with inflation, and oil and gas prices are a primary driver of inflation. Higher commodity prices equal higher revenues. It’s the inflation hedge play, and it has been the strongest-performing S&P sector so far in 2026.
Chevron (NYSE: CVX) is an American multinational energy company that primarily focuses on oil and gas. It is a safer option for investors looking to position themselves in the energy sector, and it pays a substantial 3.84% dividend, which was raised by 5% earlier this year. The company operates integrated energy and chemicals businesses worldwide.
Chevron operates in two segments. The Upstream segment is involved in:
- Exploration, development, production, and transportation of crude oil and natural gas
- Processing, liquefaction, transportation, and regasification associated with liquefied natural gas
- Transportation of crude oil through pipelines, and transportation, storage
- Marketing of natural gas, as well as operating a gas-to-liquids plant
The Downstream segment engages in:
- Refining crude oil into petroleum products
- Marketing crude oil, refined products, and lubricants
- Manufacturing and marketing renewable fuels
- Transporting crude oil and refined products by pipeline, marine vessel, motor equipment, and rail car
- Manufacturing and marketing of commodity petrochemicals, plastics for industrial uses, and fuel and lubricant additives
It also involves cash management, debt financing, insurance operations, real estate, and technology businesses.
Mizuho has an Outperform rating and a $230 target price.


Healthcare: Merck
Pricing power and steady demand insulate the top healthcare names. They don’t directly benefit from higher rates, but they tend to hold up well because their earnings do not erode as much as those of interest-sensitive sectors.
Merck (NYSE: MRK) develops and produces medicines, vaccines, biological therapies, and animal health products. It is not just a healthcare company but a global force in the industry, paying a solid 2.84% dividend.
Merck operates through two segments. The Pharmaceutical segment offers human health pharmaceutical products in:
- Oncology
- Hospital acute care
- Immunology
- Neuroscience
- Virology
- Cardiovascular
- Diabetes
- Vaccine products, such as preventive pediatric, adolescent, and adult vaccines
The Animal Health segment discovers, develops, manufactures, and markets veterinary pharmaceuticals, vaccines, health management solutions and services, and digitally connected identification, traceability, and monitoring products.
Merck serves:
- Drug wholesalers
- Retailers
- Hospitals
- Government agencies
- Managed healthcare providers, such as health maintenance organizations
- Pharmacy benefit managers and other institutions
- Physicians
- Physician distributors
- Veterinarians
- Animal producers
Merck’s growth is a result of its efforts and strategic collaborations. The company works with AstraZeneca, Bayer, Eisai, Ridgeback Biotherapeutics, and Gilead Sciences to jointly develop and commercialize long-acting HIV treatments, demonstrating a commitment to innovation and growth.
UBS has a Buy rating with a $145 target price.


Consumer Staples: Altria
Although consumer staples do not directly benefit from interest rates, they still emerge as relative winners. By delivering essential products, they maintain stable revenues regardless of the broader economic cycle, making them attractive to investors seeking a reliable safe haven.
Altria (NYSE: MO) is one of the world’s largest producers and marketers of cigarettes and other tobacco-related products. This stock offers value investors a great entry point. Altria manufactures and sells smokable and oral tobacco products in the United States and is the undisputed yield leader among consumer staples Dividend Kings. Its annual dividend of $4.24 per share currently yields 6.1%.
The company primarily sells cigarettes under the Marlboro brand, as well as:
- Cigars and pipe tobacco, principally under the Black & Mild and Middleton brands
- Moist smokeless tobacco and snus products under the Copenhagen, Skoal, Red Seal, and Husky brands
- on! Oral nicotine pouches
- e-vapor products under the NJOY ACE brand
It sells its tobacco products primarily to wholesalers, including distributors and large retail organizations, such as chain stores.
Altria used to own over 10% of Anheuser-Busch InBev (NYSE: BUD), the world’s largest brewer. In 2024, the company sold 35 million of its 197 million shares through a global secondary offering. That represents 18% of its holdings but still leaves 8% of the outstanding shares in its back pocket. Altria also announced a $2.4 billion stock repurchase plan partially funded by the sale.
UBS has a Buy rating with a $76 target price.


The post Bank of America Sees Interest Rates Exploding Higher Soon: Play It Safe With 4 Dividend Giants appeared first on 24/7 Wall St..
]]>Jim Cramer used his Mad Money platform this week to make the case that the Magnificent 7’s appetite for capital is sending an unmistakable signal to investors who actually pay attention to corporate plumbing: the big banks are about to print money.
On the June 18, 2026 episode, Cramer argued that Nvidia alone raised $25 billion in the debt market despite one of the best balance sheets in the country, Google is raising nearly $85 billion in capital, and rumors suggest Meta will soon raise billions as well. Every one of those deals routes fees through Wall Street’s underwriting desks.
The Four Drivers Behind Cramer’s Bank Thesis
Cramer laid out four structural tailwinds. First, a moderately higher short-term rate environment lifts bank earnings because what banks charge borrowers reprices faster than what they pay depositors. With the 10-year Treasury at 4.43% and the 2s/10s spread at 0.29%, the curve is flatter, but short rates remain high enough to keep net interest margins working.
Second, the consumer is holding. Cramer cited retail sales rising 0.9% month-over-month and 6.9% year-over-year, with credit card delinquencies remaining tame. FRED data confirms the spending side: retail sales hit $763.7B in May 2026, a +0.9% monthly gain, while credit card delinquencies sit at 2.92% as of January 2026, down from 3.04% in April 2025.
Third is the deal machine. Cramer flagged $1.2 trillion in public and private M&A activity in the first five months of the year, plus the Mag7 capital raises. Fourth is deregulation, what Cramer called “Prometheus unbound”, pointing to Banco Santander’s acquisition of Webster Financial as the kind of consolidation he expects to spread.
JPMorgan Chase: The Fee Pipeline Is Already Visible
JPMorgan Chase (NYSE:JPM) is the cleanest read. Q1 2026 EPS came in at $5.94, with Investment Banking fees up 28% to $2.88 billion and advisory fees surging 82% to $1.27 billion. CEO Jamie Dimon described “AI-driven capital investment” as a key tailwind in JPM’s Q1 2026 release.
Other Big Bank Beneficiaries
Bank of America (NYSE:BAC) posted Investment Banking fees of $1.84 billion, up 21% year-over-year, with Equities Sales & Trading jumping 30% to $2.84 billion. Wells Fargo (NYSE:WFC) reported Investment Banking revenue of $602 million, up 13%, with Markets revenue up 19%. CEO Charlie Scharf told investors the bank ended the quarter with “a strong investment banking pipeline”.
Why the Mag7 Is Borrowing With Cash Mountains on the Books
NVIDIA (NASDAQ:NVDA) generated $253.5B in trailing revenue with a 63% profit margin, yet still tapped debt markets. The reason: $119B in supply-related commitments tied to AI capacity. Alphabet (NASDAQ:GOOGL) issued $31.1 billion in senior unsecured notes in Q1 2026 per its Q1 8-K filing, with capex more than doubling. Meta Platforms raised 2026 capex guidance to $125-145 billion, an enormous funding gap that explains the rumored bond deal Cramer referenced.
The Valuation Setup
Bank stocks have already started moving. JPM is up 26.11% over the past year, BAC 31.55%, WFC 18.13%. Yet JPM still trades at a trailing P/E of 16 and forward P/E of 15, hardly stretched. Cramer’s point on Mad Money: “with a relatively cheap bank like JP Morgan or Bank of America or even a Wells Fargo, they can very well go up much more before they’re even considered reasonably priced, let alone fully valued.”
The Mag7 capex cycle is now a multi-year funding event. If Cramer is right that deal flow, NIM tailwinds, a resilient consumer, and looser regulation are stacking simultaneously, the underwriters of the AI buildout deserve a closer look than their multiples currently imply.
The post The Magnificent 7 Debt Binge is Sending a Crystal Clear Message to Wall Street. But Are Investors Paying Attention? appeared first on 24/7 Wall St..
]]>The Federal Reserve’s asset cap on Wells Fargo came off in 2025. JPMorgan’s board waved through a $50 billion repurchase authorization. Bank of America returned $9.30 billion to shareholders in a single quarter. The post-stress-test capital return cycle is already running, and the cash is being shoveled out the door faster than most retail investors have noticed. Here are the five names where that shovel is biggest.
1. KeyCorp (KEY): The Regional That’s Buying Back More Stock Than You Think
Start here, because nobody else is. KeyCorp (NYSE:KEY) is a $23.5 billion regional, dwarfed by every other name on this list. But the buyback-to-market-cap math is the most aggressive in the group, and CEO Chris Gorman is leaning on a Basel III tailwind nobody’s pricing in.
Q1 2026 EPS came in at $0.44, an 8% beat. The company plans to repurchase at least $1.3 billion in common shares in 2026, with $389 million already done in Q1 at an average price of $21.47. Gorman flagged that the updated Basel III proposal, if adopted, would imply “more than 100 basis point benefit to our marked CET1 ratio.”
The stock is up 42% over the past year. The Reg-bank rerating is happening in real time, and management is using the rip to retire shares. The bigger banks are doing the same thing, just with more zeros.
2. JPMorgan Chase (JPM): The $50 Billion Authorization Nobody Can Match
This is the heavyweight. JPMorgan Chase (NYSE:JPM) is sitting on $291 billion in CET1 capital and $1.5 trillion in cash and marketable securities. When Jamie Dimon talks about “fortress balance sheet,” this is what he means, and the fortress is now writing checks.
Q1 2026 EPS landed at $5.94, up 17% YoY, on revenue of $49.84 billion. The bank repurchased 27.5 million shares for $8.328 billion in the quarter at an average price of $302.75, on top of $4.10 billion in dividend payments. The quarterly dividend sits at $1.50 per share, with analyst consensus pegging a forward P/E of 14.
Dimon’s framing on the call was characteristically blunt: “We have ample amounts of capital and liquidity, with $291 billion in CET1 capital, $572 billion in total loss-absorbing capacity and $1.5 trillion in cash and marketable securities.” Translation: the buybacks aren’t slowing down. And one peer is actually returning a higher percentage of its market cap.
3. Bank of America (BAC): Capital Returns Up 41% Year-Over-Year
Bank of America (NYSE:BAC) has now seen 11 consecutive quarters of sequential deposit growth, with average deposits topping $2.02 trillion. The deposit franchise funds the lending book, the lending book funds the NII, the NII funds the buybacks. That flywheel is spinning faster.
Q1 2026 EPS hit $1.11, up 25% YoY, on revenue of $30.27 billion. Net interest income climbed 9% YoY to $15.74 billion, and the bank returned $9.30 billion to shareholders in the quarter, of which $7.2 billion went to buybacks. Brian Moynihan said: “Earnings per share rose 25% year-over-year, starting 2026 with strong momentum.”
Capital return in 2025 was 41% higher than the prior year, and the bank now sports a forward P/E of 12. Cheap, paying, buying. The next name on the list isn’t cheap, but it’s running the most profitable capital-markets engine on Wall Street.
4. Morgan Stanley (MS): The Record ROTCE Machine
Morgan Stanley (NYSE:MS) just printed the most profitable quarter in its history. ROTCE hit 27.1%, up from 23.0% a year earlier. For context, big banks generally chase 15% ROTCE as a stretch target. Morgan Stanley is lapping the field, and the dividend is the highest quarterly payout among this group.
Q1 2026 net revenues hit $20.58 billion, up 16% YoY, with net income up 29% YoY to $5.57 billion. The quarterly dividend sits at $1.00 per share, and the firm repurchased $1.75 billion of stock at an average price of $169.15. Wealth Management client assets now stand at $7.34 trillion, with $118.40 billion in net new assets in Q1 alone.
Ted Pick said: “Morgan Stanley reported a record quarter.” The stock has run 74% over the past year, so a chunk of the rerating is in the tape. The unleashed name on this list, however, hasn’t rerated at all.
5. Wells Fargo (WFC): The Asset Cap Came Off, and the Stock Is Down YTD
Here’s the punchline. Wells Fargo (NYSE:WFC) had its Federal Reserve asset cap lifted in 2025, multiple consent orders terminated, and the medium-term ROTCE target raised to 17-18% from the prior 15%. The handcuffs are off after nearly seven years. And the stock is down 11% year-to-date.
I’ve been watching this name for years, waiting for the regulatory unlock. It happened, and Mr. Market shrugged. Q1 2026 EPS came in at $1.60 on revenue of $21.45 billion, with $4.0 billion in buybacks (46.3 million shares) and $5.4 billion total returned to shareholders in the quarter. Full-year 2025 buybacks totaled $18 billion. The dividend has marched from $0.35 in early 2024 to $0.40 mid-2024 to $0.45 in mid-2025, and it’s held there ever since.
Charlie Scharf framed the capital position directly: “We returned $4 billion to shareholders through common stock repurchases while continuing to operate with significant excess capital.” Buy Wells Fargo IF you believe the regulatory unlock translates to ROTCE expansion the market hasn’t yet priced. The inverse: stay away if you think NIM compression at a 2.47% margin (down from 2.67% a year ago) caps the upside.
The Setup
The 10-year sits at 4.49%, in the 95.6th percentile of the past twelve months. The Fed funds upper bound is 3.75%, stable for over six months. That’s the setup banks have been waiting for: a yield curve that pays them to do their job, plus regulatory clarity that lets them return what they earn. KEY is the small-cap leverage play, JPM is the fortress, BAC is the value compounder, MS is the profitability king, and WFC is the unleashed giant the market has yet to re-rate. The capital is moving. Decide who gets yours.
The post Banks Are Paying Again: 5 Financial Dividend Stocks After the Stress Tests appeared first on 24/7 Wall St..
]]>The SPDR S&P Regional Banking ETF (NYSEARCA:KRE) has quietly become one of 2026’s better-performing financial trades, rising roughly 9% year to date and 28% over the past year to around $70 a share. The rally reflects what Q1 earnings just confirmed: regional bank net interest margins are finally widening as deposit costs roll over. For KRE holders, the next 12 months hinge on whether that NIM tailwind survives the Fed’s next move.
The Fund and Where It Sits Today
KRE tracks the S&P Regional Banks Select Industry Index on an equal-weighted basis, which means a roughly 2% to 3% slot for each name regardless of market cap. That construction is what differentiates it from cap-weighted bank funds, and it is also why the fund moves on the health of mid-tier banks like Citizens Financial Group (NYSE:CFG), Truist Financial (NYSE:TFC), and KeyCorp (NYSE:KEY) rather than the money-center giants.
Q1 results were unambiguously good. Citizens posted EPS of $1.13 with NIM expanding 24 basis points year over year to 3.14%. KeyCorp beat by 8% and raised full-year NII guidance to 9% to 10% growth. Truist lifted its 2026 buyback authorization to $5 billion from $4 billion. Capital return is aggressive across the group, which usually signals management confidence in the earnings trajectory.
The Macro Factor That Matters Most: The Fed’s Next Move
The single variable most likely to dictate KRE’s next 12 months is the trajectory of the federal funds rate, currently held at 3.75% since December 10, 2025 after 75 basis points of cuts. The 2s/10s spread sits at 49 basis points, the tightest level in a year, with the 10-year at 4.56%.
The transmission to KRE is direct. Regional banks borrow short and lend long. Further cuts compress deposit-cost relief faster than asset yields can adjust. Bank of America quantified this clearly: a 100 basis point parallel decline below the forward curve would reduce NII by $2 billion over 12 months. Equal-weighted regionals are even more rate-sensitive than the money-center banks, with peers such as Wells Fargo seeing NIM compress from 2.67% to 2.47% while regional peers expanded.
What to monitor: the CME FedWatch tool for cut probabilities, the FOMC dot plot at each meeting, and the monthly CPI release from the BLS. If markets begin pricing more than two cuts in 2026, KRE’s NIM-expansion thesis weakens. If the Fed holds through year-end, the regional bank reset is intact.
The Fund-Specific Factor: Equal-Weighting Plus CRE Concentration
Because KRE equal-weights its holdings, smaller community and regional banks get the same vote as the larger names. That structure amplifies one specific risk: commercial real estate, particularly General Office. Citizens flagged on its Q1 call that its General Office portfolio carries roughly a 20% potential loss rate, and that the bank’s allowance assumes a mild recession. Smaller KRE constituents typically have heavier CRE concentration than CFG does.
The offset is Basel III. KeyCorp CEO Chris Gorman noted the re-proposal “would imply more than 100 basis point benefit to our marked CET1 ratio”. A favorable final rule frees buyback capacity across the index. Track FDIC Quarterly Banking Profile data for CRE delinquency trends, and watch Federal Reserve comment letters on Basel III for the regulatory catalyst.
What Flips the Thesis
Investors who want regional bank exposure without CRE concentration risk can pair KRE with cap-weighted alternatives that tilt more toward larger banks via related sector funds. For KRE specifically: if the Fed holds at 3.75% through Q3 and Basel III is finalized as proposed, the fund’s NIM and capital-return story extends. The signal that flips the thesis is two or more cuts priced into the December 2026 SOFR strip combined with a tick higher in FDIC office-CRE delinquencies. That is the watchlist.
The post If Rates Fall Further, Here’s What Happens to the KRE Regional Banking ETF appeared first on 24/7 Wall St..
]]>The smart money read on Wells Fargo (NYSE: WFC) following the $110 million lending and hiring discrimination settlement approved by a federal judge is clearly constructive. Sell-side analysts carry a buy-skewed consensus and a 12-month price target well above where shares trade today, while insiders have been net buyers into the settlement window.
The Hard Data Behind the Bullish Tilt
Three data points anchor the institutional view on Wells Fargo. First, the analyst distribution: four Strong Buy ratings, 12 Buy ratings, nine Hold ratings, and zero Sell or Strong Sell calls. The consensus 12-month price target is $96.02, against a last trade of $75.81 on May 20, 2026. That is a sizable gap, and it has not narrowed since the settlement headlines crossed.
Second is positioning. Institutions own 78.74% of the float, and the most recent insider data shows 68 insider transactions with a net direction of buying. On April 28, 2026, twelve directors acquired common stock units at $81.50 per share in a coordinated transaction, weeks before the settlement was disclosed. There was no panic selling by the C-suite around the settlement window, and the General Counsel made no concentrated sales tied to the legal resolution.
Third, fundamentals reaffirm the thesis that the bulls are pricing. Wells Fargo Q1 2026 delivered diluted EPS of $1.60, revenue of $21.446 billion, and net income of $5.253 billion, with diluted EPS growth of 15% year over year. Every operating segment grew revenue, with Wealth and Investment Management up 14% and CIB Markets up 19%. The company returned $5.4 billion to shareholders in Q1 alone, including a $4.0 billion buyback, and reaffirmed 2026 net interest income guidance of approximately $50.0 billion.
The Gap Between Wall Street and the Market
The disconnect is unusual. Wells Fargo shares are down 18.7% year to date and 7.5% over the past month, even as fundamentals reaffirmed. The stock trades at a P/E of 12 on trailing earnings of $6.47 and a forward P/E of 11, with a price-to-book of 1.4 against book value of $53.19. The dividend yield is 2.4%, with the next payment dated June 1, 2026.
The settlement is a closed chapter, structured as a $100 million mortgage assistance fund for low- and moderate-income borrowers plus $10 million from the insurers of Board of Director Defendants. Compared to $2.205 trillion in total assets and a Q1 buyback program five times the settlement amount, the financial impact is immaterial. What the price action reflects is broader macro positioning: net interest margin compression from 2.67% to 2.47%, oil price uncertainty, and trade policy overhangs flagged on the earnings call.
The Verdict for Retail Investors
The institutional read is constructive. With zero sell ratings, a $96.02 consensus target, net insider buying, and director purchases at $81.50 setting a visible floor in management conviction, professional money is treating the discrimination settlement as a discrete, sized event with manageable financial impact. Wells Fargo investors watching CEO Charlie Scharf’s May 27, 2026, presentation at the Bernstein Strategic Decisions Conference should focus on commentary around the net interest income trajectory under potential rate cuts and the investment banking pipeline, which Scharf described as “strong” at quarter end. The signal: cautious-bullish. The gap between fundamentals and price is the trade Wall Street is already positioned for.
The post Wall Street’s Verdict on Wells Fargo After the $110 Million Discrimination Settlement appeared first on 24/7 Wall St..
]]>The Virtus InfraCap U.S. Preferred Stock ETF (NYSEARCA:PFFA) sits at $21.62 heading into the back half of 2026, paying a 9.5% yield that has drawn income investors looking for something between bond coupons and common stock dividends. PFFA raised its monthly payout to $0.1725 per share for 2026, up from $0.17 in 2025, extending a string of uninterrupted monthly distributions that now spans seven years. That cash flow is what most PFFA holders own the fund for, and it is exactly what the next 12 months will pressure-test.
The fund is actively managed, holds 188 preferred securities, carries roughly $1.91 billion in assets, and applies modest leverage to juice its income. That structure has worked: in Q4 2025, PFFA returned roughly 1% on NAV against essentially flat (0.29%) for the S&P U.S. Preferred Stock Index. Year to date in 2026, however, the price is down a fraction of a percent, and the one-year total return on price alone is about 3%. The distribution is doing the heavy lifting, which is why the macro setup matters more than usual.
The Macro Factor: The Fed’s 2026 Cutting Path
Preferred stocks behave like long-duration credit, and PFFA’s leverage roughly doubles its sensitivity to short-term funding rates. The single most important variable for the next 12 months is how aggressively the Federal Reserve actually cuts in 2026, beyond what the market is already pricing in. Virtus’s own portfolio manager flagged in October 2024 that “Fed rate cuts should favor preferred stocks, which offer a risk profile between bonds and common stocks”, and Seeking Alpha’s February 2026 PFFA review explicitly tied the bull case to anticipated rate cuts and declining inflation in 2026.
What to watch concretely: the CME FedWatch tool’s implied path for the December 2026 FOMC meeting, and the Fed’s quarterly dot plot. A faster cutting cycle compresses PFFA’s borrowing costs on its leverage line while lifting the market price of fixed-rate preferreds it already owns. A stall, like 2023’s higher-for-longer surprise, would do the opposite. Check FedWatch weekly and the BLS CPI release monthly. In 2022, when the Fed went the other direction, preferred stock indexes fell roughly 18% on price, and PFFA’s leverage amplified the drawdown.
The Fund-Specific Factor: Leverage Meets Financial-Sector Concentration
PFFA’s edge and its risk are the same thing. The fund layers leverage on top of a portfolio dominated by bank and insurance preferreds from Citigroup, JPMorgan, Bank of America, Wells Fargo, Apollo, and KKR, with growing real estate exposure. The roughly 3% expense ratio is steep, and it only pencils out if active sector rotation keeps outperforming passive preferred ETFs the way it did last quarter.
The signal to watch is credit stress at large U.S. banks: insider activity, dividend coverage, and any preferred deferral language in 10-Qs. The current news flow already shows PNC’s CEO and an EVP selling $14.8 million in shares over 90 days and Gabelli Funds trimming its Wells Fargo stake 13%. Check the FDIC Quarterly Banking Profile and each major holding’s earnings release. If bank net interest margins compress faster than PFFA’s funding costs drop, the leverage that powered 2025 outperformance flips into a headwind, and the distribution math gets tighter.
What to Track Through Year-End
Watch the December 2026 FedWatch probability of a sub-3.75% policy rate as the single cleanest read on PFFA’s tailwind. On the fund itself, watch the next semiannual holdings disclosure for any shift away from money-center bank preferreds toward real estate names, which would tell you the manager sees the financial-sector trade as played out.
The post The Fed’s 2026 Cutting Path Will Make or Break PFFA’s 9.5% Yield appeared first on 24/7 Wall St..
]]>I am opening with the bottom line. Wells Fargo (NYSE:WFC) trades at $79.18 as of May 4, 2026, and our price target for Wells Fargo is $92.25 over the next 12 months. That implies 16.51% upside, and we rate the stock a buy with a confidence level of 90%. The combination of the lifted Federal Reserve asset cap, broad segment momentum, and aggressive buybacks supports an above-consensus stance.
24/7 Wall St. Price Target Summary
| Metric | Value |
|---|---|
| Current Price | $79.18 |
| 24/7 Wall St. Price Target | $92.25 |
| Upside | 16.51% |
| Recommendation | BUY |
| Confidence Level | 90% |
A Rough Start to 2026 After a Banner 2025
Wells Fargo has been a tale of two periods. Shares are down 14.64% year to date after starting 2026 at $92.76, with a sharp pullback in March to $75.75 driving most of the damage. Over one year the stock is still up 9.6%, and over five years it has returned 93.76%.
Q1 2026 results, released April 14, 2026, showed EPS of $1.60 on revenue of $21.44 billion, with 15% diluted EPS growth and 11% loan growth. The stock still fell 5.7% after the earnings report as investors fixated on net interest margin compression to 2.47% from 2.67%.
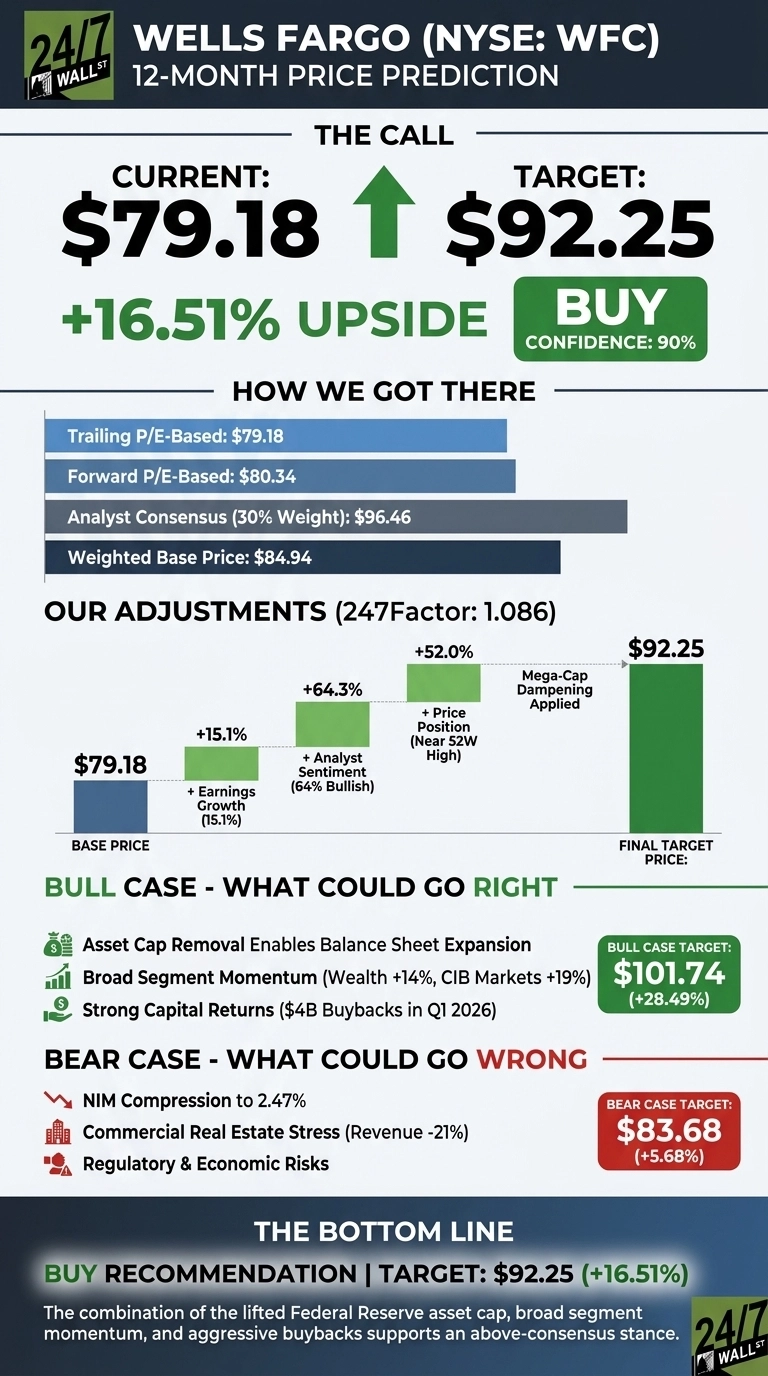
Why Bulls See a Breakout to $100+
The bull case rests on the asset cap removal in 2025, which finally lets Wells Fargo expand its balance sheet after years of regulatory constraint. Q1 2026 already showed period-end loans crossing $1 trillion for the first time since 2020. Segment performance is broad: CIB Markets revenue grew 19%, Wealth and Investment Management 14%, and credit card new accounts surged nearly 60% YoY.
CEO Charlie Scharf reaffirmed the medium-term ROTCE target of 17% to 18%, saying “We feel as confident as ever in that target.” Our bull-case scenario points to $101.74, a 28.49% total return. The Wall Street consensus target of $96.46 sits in the same neighborhood, with 18 buy ratings against 10 holds and zero sells.
What Could Go Wrong
The bear case starts with the 2.47% NIM, which CFO Michael Santomassimo said could compress further. The CET1 ratio fell to 10.3% from 11.1% a year ago, CIB Commercial Real Estate revenue dropped 21%, and credit card delinquencies sit at 2.77%. Higher oil prices could pressure lower-income consumer spending, with Scharf warning the impact “will likely take some time to materialize.”
Bulls would counter that the CET1 decline came alongside $5.4 billion returned to shareholders in the quarter, and that NIM compression partly reflects deliberate growth in lower-ROA Markets assets. Our bear-case scenario still lands at $83.68, a 5.68% return.
Our Take on Wells Fargo Here
The 24/7 Wall St. price target of $92.25 backs a buy at 90% confidence. The tipping factor is the post-asset-cap growth runway combined with shareholder returns of $23 billion in 2025. The bull thesis stays intact if loan growth holds at mid-single digits and the ROTCE target is reaffirmed. The thesis weakens if NIM falls below 2.40% and credit card delinquencies push past 3%.
| Year | 24/7 Wall St. Price Target |
|---|---|
| 2026 | $92.25 |
| 2030 | $128.96 |
These projections assume Wells Fargo continues executing on the 17% to 18% ROTCE plan. Significant upside or downside could come from M&A activity, regulatory changes around Basel III, or a sharp credit cycle turn.
The post Wells Fargo Set for 16% Upside Despite Recent Selloff appeared first on 24/7 Wall St..
]]>Wells Fargo (NYSE: WFC) stock was last seen changing hands at $80.56 per share, with Wall Street’s average price target up at $96.65. That leaves nearly 20% implied upside between where the bank trades and where analysts think it belongs.
The country’s fourth-largest bank has spent the past year as one of the more interesting rehabilitation stories in financials. The Federal Reserve lifted Wells Fargo’s asset cap in Q2 2025, removing a multi-year handcuff on the loan book and freeing CEO Charlie Scharf to grow the corporate and investment bank without regulatory friction. The bank has now resolved all 14 major consent orders that were part of its multi-year regulatory overhaul, and it spent $5.0 billion on buybacks in the final quarter of 2025.
So why is the stock trading well below where analysts say it should be? The market is paying attention to a different set of numbers.
What Knocked Wells Fargo Off Its December Highs
Q1 2026 earnings broke a long streak of beats. Wells Fargo posted EPS of $1.60, in line with expectations, after a quarterly miss in Q4 2025 when EPS came in at $1.62 versus $1.67 expected. Net interest margin compressed to 2.47% from 2.67%, the CET1 ratio slipped to 10.3% from 11.1% a year ago, and capital ratios tightened as risk-weighted assets grew.
Wells Fargo is down 13.6% year-to-date, having drifted from a December peak near $96 to a March dip below $75. The selloff has been a slow bleed rather than a capitulation event, with shares off 1.7% in the past week.
NIM compression, two consecutive disappointing earnings results, rising C&I nonaccruals, and roughly $2.5 billion in nonaccrual office loans are weighing harder than the bull catalysts.
Why Analysts Still See $97 in the Setup
The bull case rests on what the asset cap removal unlocks. Loans averaged 10% year-on-year growth, the loan book crossed $1 trillion for the first time since early 2020, and CIB Markets revenue jumped 19% year over year, with FICC up 15% and Equities Trading up 21%. Scharf reaffirmed full-year guidance for about $50 billion of net interest income and a medium-term ROTCE target of 17% to 18%, raised from 15%.
Of 25 analysts tracked, four rate it Strong Buy, 12 rate it Buy, nine rate it Hold, and none rate it Sell or Strong Sell. Jefferies initiated coverage with a Buy and a $100 price target after the Fed lifted the asset cap, while KGI moved to Hold at $88, capturing the bull/skeptic split. Scharf told investors that “we still see continued resiliency in the underlying economy and the financial health of the consumers and businesses we serve remains strong,” though he flagged that higher oil prices will take time to filter through.
There is also a personality footnote worth flagging. Jim Cramer has publicly said he bought Wells Fargo at $33 and has repeatedly endorsed Scharf’s turnaround. That’s more of a smart-money data point than a buy signal.
Where the Discount Actually Stands
Shares closed most recently at $80.56 against that consensus target of $96.65, drawn from 25 covering analysts. The forward P/E is 11 on a forward EPS estimate of $7.00, with the dividend at $0.45 quarterly.
While down 13.6% year to date, shares are up 15.5% over the past year. Wells Fargo has lagged the broad index by a wide margin in 2026, even as longer-dated returns remain strong.
An analyst target is a 12-month opinion, not a guarantee. The same Wall Street that holds a $96.65 consensus target has watched the stock slip below its 200-day moving average of $84.44 without rushing to cut their numbers.
Opportunity Outweighs the Trap, but Not by Much
The bull case holds if the post-asset-cap growth story plays out faster than NIM compression damages near-term EPS. The path to $97 runs through accelerating loan growth, sustained CIB momentum, continued buybacks against a 12 trailing P/E, and a clean second half that resumes a positive earnings streak. If Scharf’s 17% to 18% medium-term ROTCE target is credible, the stock is mispriced.
The bear case dominates if the misses are a trend rather than a stumble. Rising C&I nonaccruals, $2.5 billion of office CRE stress, credit card delinquencies at 2.77%, an upcoming governance fight, and lingering compliance overhang could keep multiple expansion locked up regardless of segment growth.
The setup beats the price action, but another miss would flip the story, and the market is already half-pricing that outcome.
The post Wall Street Sees Big Upside for Wells Fargo—Jim Cramer Saw It at $33 appeared first on 24/7 Wall St..
]]>Wells Fargo (NYSE:WFC) stock slipped on Wednesday after three Wall Street firms trimmed their price targets following the bank’s Q1 2026 earnings release on April 14. The cuts from Barclays, Bank of America, and Piper Sandler signal growing unease about whether Wells Fargo can deliver on its ambitious profitability targets. WFC stock trades near $80.75, down 13% year-to-date.
The headline numbers were solid for Wells Fargo: diluted EPS of $1.6, up 15% year-over-year, and revenue of $21.45 billion, up 6%. Yet Wells Fargo’s net interest margin compression and softer-than-expected fee income gave analysts reason to reassess the bank’s trajectory toward its medium-term ROTCE target of 17% to 18%.
| Ticker | Company | Firm | Action | Old Rating | New Rating | Old Target | New Target |
|---|---|---|---|---|---|---|---|
| WFC | Wells Fargo | Barclays | Price Target Cut | Overweight | Overweight | $113 | $108 |
| WFC | Wells Fargo | BofA | Price Target Cut | Buy | Buy | $107 | $95 |
| WFC | Wells Fargo | Piper Sandler | Price Target Cut | Overweight | Overweight | $100 | $94 |
The Analyst’s Case
Barclays analyst Jason Goldberg trimmed his WFC stock price target to $108 from $113 while keeping an Overweight rating. Earnings excluding a tax benefit were light, with net interest income, fees, and expenses all coming in below expectations, though Goldberg acknowledged that asset quality remained stable and buybacks continued.
BofA made the sharpest cut, dropping its Wells Fargo stock price target to $95 from $107 while maintaining a Buy. The firm called Wells Fargo’s net interest margin contraction of 13 basis points quarter-over-quarter the “real sticker shock,” and flagged that it raises further doubts around the ROTCE improvement thesis. BofA also lowered its FY26 and FY27 EPS estimates for Wells Fargo by 2% and 4%, respectively, and reduced its assigned multiples on diminished EPS visibility.
Moreover, Piper Sandler lowered its WFC stock price target to $94 from $100, keeping an Overweight rating. Its revised estimates put 2026 EPS at $6.72 (down from $6.82) and 2027 EPS at $7.36 (down from $7.42). These trims reflect a consistent theme: the path to 17% to 18% ROTCE is narrowing.
Why the Move Matters Now
NIM compression is the core concern. Wells Fargo’s net interest margin declined 13 basis points from Q4 2025, landing at 2%, down from 3% a year ago. Wells Fargo CFO Michael Santomassimo was direct on the earnings call, stating, “I would expect additional margin compression next quarter.”
The yield curve isn’t helping. The 10-year minus 2-year Treasury spread compressed sharply from 1% in early February to 1% as of April 14, squeezing the rate environment that banks rely on for NII expansion. Meanwhile, CIB Commercial Real Estate revenue fell 21% year-over-year, adding another drag.
What It Means for Your Portfolio
The bulls aren’t gone. All three firms kept constructive ratings on Wells Fargo stock, and the broader analyst consensus still carries 18 Buy or Strong Buy ratings against 10 Hold ratings and zero Sells, with a consensus target near $99. Wells Fargo CEO Charlie Scharf reinforced confidence on the earnings call, declaring, “We feel as confident as ever in that target. There is absolutely nothing that has changed.”
For long-term, income-focused investors, the $0.45 quarterly dividend and $4 billion in Q1 buybacks indicate that Wells Fargo is still returning serious capital. If NIM compression deepens and ROTCE progress stalls, the multiple could face further pressure.
Watch for whether Q2 NII guidance holds steady and whether margin trends stabilize before adding to a position in Wells Fargo stock. For broader context on how Wall Street is treating financial and other sector names right now, see our recent coverage of analyst activity across major sectors.
The post Wells Fargo Gets Three Price Target Cuts in One Day: Is the ROTCE Recovery Story Falling Apart? appeared first on 24/7 Wall St..
]]>On the April 14 episode of Mad Money, Jim Cramer delivered a sharp diagnosis of why so many investors missed one of the strongest market moves of the year: The catastrophes they feared never arrived. “It just didn’t happen,” Cramer said the session’s gains reflected a collapse of fear rather than a surge of new optimism. The Nasdaq rose 2% and the S&P 500 gained 1% on the day.
Geopolitical fears, private credit collapse warnings, and Magnificent Seven death narratives all failed to materialize. Investors positioned defensively around those narratives missed the move. Cramer’s charitable trust was selling into the overbought rally rather than adding new positions, signaling he sees the current level as a place to trim, not chase.
The Fear That Wasn’t
The VIX tells the story cleanly. The fear gauge stood at 19.12 as of April 13, down 30% over the prior month, after spiking as high as 31.05 on March 27. Meanwhile, University of Michigan consumer sentiment survey hit a record low in March and is deep in recessionary territory. Retail investors, anchored to fear, stayed sidelined as equities recovered.
Nvidia and Amazon Led the Charge
Nvidia (NASDAQ:NVDA) gained 9% over the past week, moving from $178.10 to $198.51. The fundamental case remains intact: Q4 FY2026 revenue came in at $68.13 billion, up 73% year over year, with Data Center networking revenue surging 263%. CEO Jensen Huang stated: “Computing demand is growing exponentially — the agentic AI inflection point has arrived.”
Amazon (NASDAQ:AMZN) was the week’s standout, rising more than 10% from $213.77 to $248.13. AWS grew 24% to $35.58 billion in Q4, its fastest pace in 13 quarters, and the company has $200 billion in capex planned for 2026. Apple (NASDAQ:AAPL) added 2% on the week, with its 2.5 billion active device installed base providing durable revenue visibility.
Cramer’s Bank Call: Santander Over the Field
Cramer’s banking preference is specific. He likes Banco Santander over Deutsche Bank, supported by the numbers. Banco Santander (NYSE:SAN) gained nearly 4% on the week and is up 85% over the past year. Full-year 2025 profit reached $12.81 billion, with a return on tangible equity of 16% and an efficiency ratio of 41%, the best in over 15 years. CEO Ana Botin is targeting RoTE above 20% by 2028.
Wells Fargo: Strong Fundamentals, Soft Reaction
Cramer views Wells Fargo (NYSE:WFC) as trying to bottom but disappointing. The stock was down slightly on the week, despite a solid Q1 report filed that morning. CEO Charlie Scharf noted “diluted earnings per share increasing 15%, revenue increasing 6%, loans increasing 11% and deposits increasing 7% compared to a year ago.” The muted response may reflect macro uncertainty rather than underlying business weakness.
One macro wildcard Cramer flagged: Larry Fink told him oil could be cut in half if the current conflict ends. With Brent crude at $94 per barrel as of April 15, a resolution scenario carries significant deflationary implications for consumers and corporate margins, removing one of the last genuine macro fears overhanging the market.
The post Jim Cramer Says ‘It Just Didn’t Happen’ — and That’s Why Many Americans Missed the Most Powerful Rally of 2026 appeared first on 24/7 Wall St..
]]>With the big banks about to kick off the new earnings-reporting season, this is a good moment to ask what three of the most influential financial institutions have delivered for long-term investors.
Three Banks, Three Very Different Journeys
Bank of America (NYSE: BAC) spent the decade quietly compounding. CEO Brian Moynihan leaned into digital banking, and the bank now counts 59 million active digital banking users. Net interest income (NII) grew for five consecutive quarters through 2025, and full-year net income topped $30 billion. Warren Buffett’s long-standing position gave the stock a credibility floor through volatile stretches.
Citigroup (NYSE: C) is the turnaround story. CEO Jane Fraser launched a sweeping simplification effort, divesting non-core franchises and restructuring around five core businesses. Record revenues across all five business segments in 2025 validated the strategy. The stock spent years trading below book value, making the recent re-rating especially sharp.
Wells Fargo (NYSE: WFC) carries the most dramatic arc. The 2016 fake-accounts scandal triggered a Federal Reserve asset cap that constrained growth for years. The asset cap was removed in Q2 2025, a landmark event. CEO Charlie Scharf called it a chance to “compete on a level playing field.” The market noticed.
What $1,000 Became Across Every Horizon
| Period | BAC Return | C Return | WFC Return | S&P 500 Return |
|---|---|---|---|---|
| 1-Year | 46.2% ($1,462) | 101.5% ($2,015) | 30.1% ($1,301) | 30.4% ($1,304) |
| 5-Year | 25.7% ($1,257) | 61.7% ($1,617) | 101.9% ($2,019) | 60.3% ($1,603) |
| 10-Year | 290.4% ($3,904) | 189.4% ($2,894) | 73.7% ($1,737) | 223.2% ($3,232) |
Citigroup’s one-year surge reflects a stock that spent years undervalued. Bank of America’s 10-year return of 290.4% is the quiet winner, well ahead of the S&P 500’s 223.2%. Wells Fargo’s returns suggest it has moved from being a scandal-ridden laggard to a growth-at-a-reasonable-price (GARP) stock, with investors reassessing after the asset cap removal.
The Verdict Heading Into Earnings Week
Bank of America is a steady compounder with visible earnings momentum. NII guidance calls for 5% to 7% growth in 2026, deposits topped $2 trillion, and the capital return program is accelerating. The bear case is rate sensitivity: a 100-basis-point downward shift in rates is estimated to reduce NII by $2.0 billion to $2.3 billion over 12 months.
Citigroup’s transformation is real, and management targets 10% to 11% return on tangible common equity (ROTCE) for 2026. But the stock has already doubled in a year, and the Q4 GAAP EPS miss of −26.54% is a reminder that headline numbers can still surprise badly.
Wells Fargo presents the most compelling structural case. The asset cap removal is a structural unlock. Management raised its medium-term ROTCE target to 17% to 18% and returned $23 billion to shareholders in 2025. The rerating from the asset cap removal may not yet be fully priced in.
The post If You Invested $1,000 in Bank of America, Citigroup, or Wells Fargo 10 Years Ago appeared first on 24/7 Wall St..
]]>Pre-Market Stock Futures:
Futures are trading higher after an explosive rally on Tuesday, sparked by the President’s comments that he wants to end the war soon. While this is hardly the final straw for the war, it appears that President Trump, who is finally getting some support from NATO members and Persian Gulf allies in the fight against Iran and its paid proxies, may be making some progress. Add in the fact that Iran’s infrastructure and weaponry have been devastated, and many of the military and Revolutionary Guard leaders have been killed. Toss in the massive short interest, and it all adds up to Tuesday’s huge rally, with the Nasdaq as the big winner, closing up a stunning 3.83% at 21,590, and the small-cap Russell 2000 not far behind, finishing the session at 2,496, up 3.41%. The S&P 500 closed Tuesday at 6,528, up 2.91%, and the Dow Jones Industrial finished the clean sweep of winners, closing at 46,341, up 2.49%.
Treasury Bonds:
Yields were lower across the curve, except at the very short T-bills and the long end, as buyers returned, as they did on Monday. Some of the same reasons we have cited recently for bond prices rising (and yields falling) were again driven by safe-haven demand amid intensified Middle East conflict. Investors shifted from fears of inflation to concerns about slower global growth, prompting a “bull steepening” of the yield curve and a rebound after a month of heavy selling.
Oil and Gas:
Prices were mixed across the energy complex, which experienced severe intraday volatility, initially dropping on reports of a potential de-escalation in Iran but remaining supported by lingering anxieties over supply disruptions, particularly after a tanker was hit near Dubai. Toss in futures contract expirations, and the stage was set for a crazy end to the quarter. Brent Crude closed up 4.94% at $118.30, while West Texas Intermediate closed down at $101.50, down 1.33%. Natural Gas finished the day at $2.84, dowm 0.10%.
Gold:
The precious metals joined in on the rally as gold, which has traded in a tight range for the better part of the first quarter, had an impressive day, closing trading up a whopping 3.49% at $4,667, while Silver really had some momentum buying and was last seen on Tuesday at $75, up a strong 7.18%. Wall Street analysts attributed the big moves higher to the recent decline to market overreaction, as investors moved to buy the dip. This rebound suggests a resilient bullish sentiment, even as the market grapples with rising oil prices, inflationary pressure, and weakening consumer confidence.
Crypto:
The cryptocurrency market endured a turbulent session marked by sharp price swings but demonstrated solid resilience, holding firm at key support levels amid heightened geopolitical tensions. Developments heavily influenced risk sentiment across the broader crypto space, as traders responded swiftly to shifting headlines. Bitcoin led the volatility, surging to an intraday high of $68,300 in early trading after reports emerged of potential peace negotiations between Iran and Israel briefly lifted market optimism. However, the rally proved short-lived, with the crypto giant retracing to a consolidation range of $67,000–$67,800 as uncertainty resurfaced and profit-taking set in. The speed of the reversal underscored how sensitive the market remains to geopolitical developments, with algorithmic trading and leveraged positions amplifying the intraday swings. At 8 AM EDT, Bitcoin was trading at $68,680 while Ethereum was quoted at $2,135.
24/7 Wall St. reviews dozens of analyst research reports daily to identify new investment ideas for both investors and traders. Some of these daily analyst calls cover stocks to buy. Other calls cover stocks to sell or avoid. Remember that no single analyst call should ever be used as a basis to buy or sell a stock.
Here are some of the top Wall Street analyst upgrades, downgrades, and initiations seen on Wednesday, April 1, 2026.
Upgrades:
- Formula One Group (NASDAQ: FWONK) was raised to Buy from Neutral at Bank of America, which has a $105 price target for the shares.
- Rivian Automotive Inc. (NASDAQ: RIVN) was upgraded to Neutral from Underperform at DA Davidson, with a $14 target price.
- United Health Group Inc. (NYSE: UNH) was upgraded to Outperform from Market Perform at Raymond James, which posted a $330 target price objective.
- Walt Disney Company (NYSE: DIS) was raised to Outperform from Market Perform at Raymond James, which has a $115 target for the entertainment giant.
- Wells Fargo & Company (NYSE: WFC) was upgraded to Buy from Hold at HSBC, with a $94 target price.
Downgrades:
- Apellis Pharmaceutical Inc. (NASDAQ: APLS) was downgraded to Hold from Buy at Stifel with a $41 target price as Biogen is acquiring the company.
- Centessa Pharmaceuticals Inc. (NASDAQ: CNTA) was downgraded to Market Perform from Outperform at Leerink, with a $40 target, as Eli Lilly is acquiring the company.
- First Citizens Bancshares Inc. (NASDAQ: FCNCA) was cut to Neutral from Overweight at JPMorgan, which dropped the target price for the shares to $2,200 from $2,450.
- Nike Inc. (NYSE: NKE) was downgraded to Neutral from Overweight at JPMorgan, which slashed the target price for the sports apparel and shoe giant to $52 from $86.
- PPG Industries Inc. (NYSE: PPG) was downgraded to Neutral from Buy at Citigroup, which trimmed the target price for the stock to $113 from $132.
Initiations:
- Boeing Company (NYSE: BA) was initiated with an Overweight rating at Wells Fargo, which has a $250 target price for the aerospace giant.
- Datadog Inc. (NASDAQ: DDOG) was started with a Buy rating at Benchmark, with a $150 target price.
- Northrop Grumman Corp. (NYSE: NOC) was started with an Overweight rating at Wells Fargo, with an $800 target price objective.
- Rocket Lab Corp. (NASDAQ: RKLB) was initiated with an Equal Weight rating at Wells Fargo, with a $60 target price.
- ServiceNow Inc. (NYSE: NOW) was initiated with a Buy rating at Benchmark with a $125 target price.
The post Here Are Wednesday’s Top Wall Street Analyst Research Calls: Boeing, Datadog, Disney, Formula One Group, Nike, Rivian, Rocket Lab, ServiceNow, and More appeared first on 24/7 Wall St..
]]>The 30-year fixed mortgage rate climbed to 6.22% as of March 19, 2026, a three-month high last seen in December of 2025, as the 10-year Treasury yield rose to 4.3% amid broader market unease. Rates had bottomed at 5.98% in late February before climbing steadily through March. The spring housing market is feeling the pressure. But for a select group of companies, higher rates are quietly working in their favor. Here are five stocks positioned to benefit most.
Five Companies Positioned for the High-Rate Environment
Rocket Companies (NYSE: RKT) has emerged as the most comprehensive play on elevated mortgage rates following its transformational $14.2 billion acquisition of Mr. Cooper in late 2025. Rocket now benefits from a “natural hedge”: while high rates dampen new loan volume, they maximize the value of its servicing portfolio. In this environment, homeowners are less likely to refinance, allowing loans to remain on the books longer and generate steady fee income. As of the close of Q4 2025, Rocket’s combined servicing portfolio reached a massive $2.1 trillion in unpaid principal balance, representing approximately one in every six mortgages in the United States and generating roughly $5 billion in annualized recurring cash flow.
JPMorgan Chase (NYSE: JPM) and Wells Fargo (NYSE: WFC) are the big-bank plays. Both of them earn more net interest income (NII) when rates are higher, paying depositors less than they earn on loans and securities. Wells Fargo guided for approximately $50 billion in NII excluding markets in 2026, up from $46.7 billion in 2025. JPMorgan reported NII up 7%, driven by higher deposit balances in Q4 2025. Neither is a pure mortgage play, but both benefit across their entire balance sheets.
The apartment real estate investment trusts (REITs) round out the group. AvalonBay Communities (NYSE: AVB) and Essex Property Trust (NYSE: ESS) benefit indirectly: when buying a home costs too much, people keep renting. AvalonBay’s CEO noted it is “over $2,000 per month more expensive to own a home” in their core markets given current mortgage rates and home prices. While REITs face higher borrowing costs themselves, the boost in rental demand (due to poor home affordability) often outweighs the interest expense, especially for companies with strong balance sheets.
How Each Business Is Positioned
The Rocket Companies model is most directly tied to the rate environment. High rates slow prepayments, extending the life of its mortgage servicing rights (MSRs) and attached cash flows. Following the acquisition of Mr. Cooper, Rocket’s combined servicing portfolio surged to $2.1 trillion in unpaid principal balance across 9.5 million clients. This massive scale now generates approximately $5 billion in annualized recurring cash flow, providing a robust capital base as the company targets a return to consistent double-digit equity growth in 2026.
Among the apartment REITs, Essex and AvalonBay show stronger near-term fundamentals. Essex posted same-property revenue growth of 3.8% year-over-year in Q4 with financial occupancy of 96.3%. Supply in Essex’s West Coast markets is declining, with units across Essex markets falling from 52,400 in 2025 to 42,300 in 2026. AvalonBay reported same-store residential occupancy of 95.8% and guided for 2026 core funds from operations of $11.00 to $11.50 per share.
What Management Is Saying
Rocket CEO Varun Krishna: “This is the power of an integrated homeownership ecosystem—massive top of funnel, scaled origination-servicing recapture, expansive distribution for industry professionals and a technologically advanced foundation for infinite capacity—built for the AI era.”
Wells Fargo CEO Charlie Scharf: “We are excited to now compete on a level playing field and are able to dedicate even more resources to growth with the ability to grow our balance sheet.” The Federal Reserve’s removal of Wells Fargo’s asset cap adds a meaningful growth lever beyond rate sensitivity alone.
AvalonBay CEO Benjamin Schall: “Given the challenges of getting entitlements and how lengthy the process is in our established regions, we expect this supply backdrop to serve as a tailwind for us for the foreseeable future.”
Who Actually Benefits Most
Mortgage rates at a three-month high create a clear hierarchy of winners. Rocket Companies is the clearest winner. By acquiring the world’s largest servicer, Rocket has transformed its business model and now controls a massive $2.1 trillion servicing portfolio. No other company in this group has that level of direct, concentrated exposure to the rate dynamic at play right now.
Essex and AvalonBay are the most compelling indirect beneficiaries, carrying strong occupancy, improving supply backdrops, and markets where the rent-versus-own math heavily favors renting. JPMorgan and Wells Fargo benefit through NII expansion, but mortgage is a small slice of their diversified businesses.
Watch the 10-year Treasury yield and what prediction markets say about the chance rates hit 6.30% by year-end as the key signals for how long this environment persists.
The post With Mortgage Rates at a 3-Month High, These Stocks Are Quietly Winning appeared first on 24/7 Wall St..
]]>When it comes to dividend stocks, the best policy is often the simplest one: buy them and leave them alone. A set-it-and-forget-it strategy can be remarkably effective, especially when your broker automatically reinvests dividend distributions back into the same shares. For investors who want to squeeze even more from their positions, conservative secondary yield strategies like covered calls can layer additional income on top of long-term holdings.
If you choose the right dividend-yielding stocks and hold them for years, you could set yourself up for a more comfortable retirement. The easy part is leaving those shares untouched; the hard part is identifying the right names to own in the first place.
The following four assets combine yield, financial durability, and long-term staying power. Paired with a disciplined buy-and-hold approach, they offer a straightforward path to building lasting passive income.
AT&T (T)
For a blue-chip telecommunications holding, few names are more familiar than AT&T (NYSE:T). The company has been a fixture of American business for well over a century, and its scale in wireless and broadband makes it one of the most defensible income stories in the market today.
AT&T’s earnings momentum has been steady and measurable. The company grew its adjusted EPS from $0.43 in the fourth quarter of 2024 to $0.52 in the fourth quarter of 2025, a meaningful improvement that reflects continued execution on its fiber and wireless growth strategy. Free cash flow expanded over the same period, from $4.0 billion to $4.2 billion on a quarterly basis, and the company has guided for over $18 billion in annual FCF in 2026, covering the dividend more than twice over. That cushion largely removes concerns about the sustainability of the payout. The current forward annual dividend yield sits at approximately 5.2%, which is well above the telecom sector average and offers genuine income heft for long-term holders.
Chevron (CVX)
Every durable income portfolio benefits from exposure to energy, and Chevron (NYSE:CVX) remains the gold standard for dividend reliability in that sector. The company has now raised its dividend for 39 consecutive years, the latest being a 4% increase declared in January 2026 that lifted the quarterly payment to $1.78 per share, or $7.12 annually. That streak, maintained through oil crashes, financial crises, and a global pandemic, is what separates Chevron from its peers.
The fundamental picture has grown more interesting since Chevron closed its $53 billion acquisition of Hess Corporation in mid-2025. The deal added significant Guyana deepwater production to Chevron’s portfolio, and Q1 2026 was the first full quarter reflecting that combined output: worldwide net oil-equivalent production surged 15% to 3,858 thousand barrels of oil equivalent per day. Chevron’s integrated business model, spanning upstream production and downstream refining, provides a natural hedge against commodity price swings that smaller, purer-play operators cannot match. For long-term income investors, the combination of a near-4% yield, a 39-year growth streak, and a production base that is measurably larger than it was a year ago makes Chevron a compelling hold.
Fidelity Enhanced High Yield ETF (FDHY)
Rounding out a stock-heavy income portfolio with a fixed-income component adds ballast, and Fidelity Enhanced High Yield ETF (NYSEARCA:FDHY) is one of the more thoughtfully constructed options in that space. The fund pays monthly distributions rather than the quarterly cadence of most equities, which suits investors who prefer a predictable, recurring cash flow. Its current annualized yield is approximately 6.3%, and the fund manages roughly $522 million in assets.
FDHY focuses on high-yield corporate debt but applies Fidelity’s quantitative research process to screen out the weakest issuers, prioritizing companies whose fundamentals can support their debt obligations across different rate environments. That active management layer is the key distinction from a passive junk bond index fund, and it is the primary reason the fund has delivered a three-year annualized total return of approximately 8.9%. Adding FDHY alongside individual blue-chip equities provides professional credit oversight without requiring constant portfolio attention from the investor.
Cisco Systems (CSCO)
A long-term income portfolio built entirely on traditional dividend sectors misses the compounding potential of high-quality technology businesses, and Cisco Systems (NASDAQ:CSCO) is the clearest example of a tech company that has earned its place in an income-focused allocation.
Cisco delivered record Q3 fiscal 2026 revenue of $15.8 billion, a 12% increase year over year, driven by an explosive acceleration in AI infrastructure demand. Product orders surged 35% compared to the prior-year quarter, and the company raised its full-year FY2026 AI infrastructure order expectation to $9 billion from an earlier estimate of $5 billion. Non-GAAP EPS came in at $1.06 for the quarter, up 10%, with full-year guidance lifted to $62.8 to $63.0 billion in revenue. The company ended Q3 with $16.6 billion in cash, equivalents, and investments, a balance sheet that leaves ample room for the continued dividend growth investors have come to expect. Cisco has raised its dividend for 14 consecutive years, most recently to $0.42 per quarter, translating to an annualized payout of $1.68 per share and a current yield of approximately 1.5%. That yield is modest relative to the other names on this list, but the earnings trajectory, anchored by AI-driven networking demand, provides confidence that the dividend will keep growing.
Editor’s note: This article was updated to reflect Chevron’s corrected 39-year dividend growth streak and raised quarterly payout of $1.78 per share, AT&T’s current forward yield of approximately 5.2% and its 2026 FCF guidance of $18 billion, Cisco’s Q3 fiscal 2026 record revenue of $15.8 billion and updated cash position of $16.6 billion, and FDHY’s current yield of approximately 6.3% and its NYSEARCA listing.
The post Set It and Forget It: The Dividend Stocks Worth Holding for the Rest of Your Life appeared first on 24/7 Wall St..
]]>Most dividend investors seek solid passive income streams from quality dividend stocks. Passive income is a steady stream of unearned income that doesn’t require active traditional work. Shared ideas for earning passive income include investments such as dividend stocks, bonds, and mutual funds, as well as real estate and additional income-producing side hustles. These days, investors, especially those nearing retirement, seek passive income streams to supplement Social Security, pension income, or qualified retirement account withdrawals.
For years, we have covered the Bank of America US1 List of top stock picks, and investors who bought them have done exceptionally well. With the first quarter well underway, many investors are seeking safer ideas amid a sustained market rally that could be on the brink, even as major indices remain near all-time highs. We have identified five US1 stocks with significant upside potential and substantial, reliable dividends.
Why do we cover the Bank of America US1 top picks?
The Bank of America US1 list is a collection of the best investment ideas from BofA Global Research analysts. It is drawn from the universe of Buy-rated, US-listed stocks, including American depository receipts (ADRs). The list is managed to provide superior long-term investment performance.
America Healthcare REIT
With a dependable 1.89% dividend and a red-hot sector, this is an outstanding idea. America Healthcare REIT (NYSE: AHR) is a real estate investment trust (REIT) that acquires, owns, and operates a diversified portfolio of clinical healthcare real estate, focusing primarily on senior housing, skilled nursing facilities, outpatient medical (OM) buildings, and other healthcare-related facilities across the United States, the United Kingdom, and the Isle of Man.
It owns and operates its integrated senior health campuses and senior housing operating properties (SHOP). The company’s segments include:
- Integrated senior health campuses, which provide a range of independent living, assisted living, memory care, skilled nursing services, and ancillary businesses.
- OM buildings are leased to multiple tenants under separate leases.
- SHOP includes senior housing providing assisted living care, as well as other services.
- Triple-net leased properties, which include senior housing, skilled nursing facilities, and hospitals.
The Bank of America price target is set at $60.
Cigna
Cigna Group (NYSE: CI) offers tailored health insurance and employee benefits programs. Healthcare names have been outperforming in 2026, yielding 2.08% and offering solid upside potential. This is another outstanding healthcare idea. Cigna provides insurance and related products and services in the United States.
The Evernorth Health Services segment provides a range of coordinated and point-of-service health services, including
- Pharmacy benefits
- Home delivery pharmacy
- Specialty pharmacy
- Distribution and care delivery
- Management solutions to health plans, employers, government organizations, and health care providers
The company’s Cigna Healthcare segment offers:
- Medical, pharmacy, behavioral health, dental, and other products and services for insured and self-insured customers
- Medicare Advantage, Medicare Supplement, and Medicare Part D plans for seniors, as well as individual health insurance plans; and health care coverage in its international markets, as well as health care benefits for mobile individuals and employees of multinational organizations
In addition, it offers permanent insurance contracts sold to corporations to provide coverage for the lives of certain employees, financing employer-paid future benefit obligations. The company distributes its products and services through insurance brokers and consultants, directly to employers, unions, and other groups and individuals, and through private and public exchanges.
The Bank of America target price is $378.
Merck
Merck (NYSE: MRK) develops and produces medicines, vaccines, biological therapies, and animal health products. It is not just a healthcare company but a global force in the industry. This healthcare giant is another no-brainer, paying a solid 2.67% dividend.
The company operates through two segments. The Pharmaceutical segment offers human health pharmaceutical products in:
- Oncology
- Hospital acute care
- Immunology
- Neuroscience
- Virology
- Cardiovascular
- Diabetes
- Vaccine products, such as preventive pediatric, adolescent, and adult vaccines
The Animal Health segment discovers, develops, manufactures, and markets veterinary pharmaceuticals, vaccines, health management solutions and services, and digitally connected identification, traceability, and monitoring products.
Merck serves:
- Drug wholesalers
- Retailers
- Hospitals
- Government agencies
- Managed healthcare providers, such as health maintenance organizations
- Pharmacy benefit managers and other institutions
- Physicians
- Physician distributors
- Veterinarians
- Animal producers
Merck’s growth is a result of its efforts and strategic collaborations. The company works with AstraZeneca, Bayer, Eisai, Ridgeback Biotherapeutics, and Gilead Sciences to jointly develop and commercialize long-acting HIV treatments, demonstrating a commitment to innovation and growth.
Bank of America currently has a $132.00 price target on this stock.
Public Service Enterprise
Off the radar for many, this dividend-paying utility stock still has room to run and yields 2.98%. Public Service Enterprise Group (NYSE: PEG) is a regulated infrastructure company operating New Jersey’s transmission and distribution utility, serving approximately 2.4 million electric and 1.9 million natural gas customers. The company also owns an independent fleet of 3,758 MW of carbon-free, baseload nuclear power-generating units.
The company principally conducts its business through two wholly owned subsidiaries. Public Service Electric and Gas (PSE&G) is a public utility engaged principally in the transmission of electricity and distribution of electricity and natural gas in certain areas of New Jersey. PSEG Power (PSEG Power) is an energy supply company that consists of merchant nuclear generating assets and fuel supply functions, and is engaged in competitive energy sales through its principal direct, wholly owned subsidiaries. The company also has other wholly owned subsidiaries.
The Bank of America target price is $84 and is likely to increase soon.
Wells Fargo
Wells Fargo (NYSE: WFC) operates in 35 countries and serves over 70 million customers worldwide. This money-center giant makes sense given its 2.06% dividend yield, as many of the issues that have plagued the company over the past five years appear to be resolved. This financial services company offers a diverse range of banking, investment, mortgage, and consumer and commercial finance products and services in the United States and internationally.
The company operates through four segments:
- Consumer Banking and Lending
- Commercial Banking
- Corporate and Investment Banking
- Wealth and Investment Management
The Consumer Banking and Lending segment offers a diverse range of financial products and services tailored to meet the needs of consumers and small businesses. These include checking and savings accounts, credit and debit cards, as well as home, auto, personal, and small business lending services.
The Commercial Banking segment provides financial solutions to private, family-owned, and specific public companies. Its products and services include banking and credit products across various industry sectors and municipalities, as well as secured lending and lease products, and treasury management services.
The Corporate and Investment Banking segment offers a suite of capital markets, banking, and financial products and services, such as:
- Corporate banking
- Investment banking
- Treasury management
- Commercial real estate lending and servicing
- Equity and fixed-income solutions
- Sales, trading, and research capabilities services to corporate, commercial real estate, government, and institutional clients
The Wealth and Investment Management provides wealth management, brokerage, financial planning, lending, private banking, and trust and fiduciary products and services to affluent, high-net-worth, and ultra-high-net-worth clients.
It also operates through financial advisors in brokerage and wealth offices, consumer bank branches, independent offices, and digitally through WellsTrade and Intuitive Investor.
Bank of America has set a $107 price target.
The post 5 of Bank of America’s US1 List Top Picks Also Pay Big Passive Income appeared first on 24/7 Wall St..
]]>Wells Fargo (NYSE: WFC) and Citigroup (NYSE: C) both reported Q4 2025 earnings on January 14, 2026, yet investors sold off both stocks despite solid results. The selloff reflects concern over net interest income pressure in a higher-for-longer rate environment. Since January 1, 2026, Wells Fargo has declined 4.98% while Citigroup has slipped just 0.36%, revealing how different business models respond to the same rate backdrop.
How the Quarter Landed: Asset Cap Removal vs. Cost Restructuring
Wells Fargo delivered $21.29 billion in revenue and $1.76 EPS, topping earnings expectations but falling short on the top line. Its Consumer, Small & Business Banking segment rose 9% to $6.59 billion, while Credit Card climbed 7% to $1.38 billion. CEO Charlie Scharf called the removal of the Federal Reserve asset cap transformational: “Strong financial performance, removal of the asset cap […] and stronger growth in both our consumer and commercial businesses make me proud of our 2025 results.” Net interest income grew 4% year-over-year on higher loan balances and fixed-rate asset repricing.
Citigroup posted $19.90 billion in revenue and $1.19 EPS, missing both estimates. Net income fell 13.8% to $2.5 billion, weighed down by 6% higher operating expenses tied to compensation, legal, and technology costs. Banking revenues surged 78% and Services rose 15%, but Markets slipped 1%. CEO Jane Fraser’s restructuring included 1,000 job cuts in January 2026. The bank’s presence in 180+ countries provides diversification but also exposes it to geopolitical volatility.
One Bet on Domestic Growth, One on Global Reach
With the asset cap lifted, Wells Fargo can grow deposits and loans without regulatory constraint. Management raised its medium-term return on tangible common equity target to 17% to 18% from 15%, expects mid-single-digit loan and deposit growth in 2026, and anticipates two more Fed rate cuts. The 10Y-2Y yield curve spread at 0.64% supports net interest margin expansion, though further cuts could compress that advantage.
Citigroup leans into institutional banking, cross-border services, and wealth management. Its $208 billion market cap reflects a lower valuation than Wells Fargo’s $278 billion, with Citi trading at 1.06x book value versus Wells Fargo’s 1.64x. Fraser’s turnaround targets a lower expense base while protecting Services and Banking revenue, though Russia-related tax impacts continue to surface.
| Metric | Wells Fargo | Citigroup |
| Dividend Yield | 1.95% | 2.06% |
| Q4 Buybacks + Dividends | $6.4B | $5.6B |
| Price-to-Book | 1.64x | 1.06x |
Why Wells Fargo Edges Ahead for Income
Wells Fargo increased its quarterly dividend 13% over 2025 to $0.45 and repurchased $5.0 billion in stock during Q4 alone. Citigroup’s 2.06% yield is slightly higher, but declining net income and rising expenses cloud the picture. Wells Fargo’s domestic focus also insulates it from geopolitical risk. For those drawn to a turnaround play, Citi’s discount to book value offers appeal, though the restructuring timeline remains uncertain. Trump’s proposed credit card interest rate cap poses a shared risk, though Wells Fargo’s diversified consumer banking portfolio may absorb it better than Citi’s card-heavy U.S. personal banking segment.
The post Citigroup vs Wells Fargo: Which Wins on Dividends, Buybacks, Interest Rate Exposure? appeared first on 24/7 Wall St..
]]>Live Updates
Got $1,000? Before You Buy MSFT, Read This
If you have cash sitting in your account right now, give this two minutes. After more than two decades of helping investors beat the market, our top analysts at 24/7 Wall St. put together a definitive report on the Top 10 Stocks To Buy Today. And MSFT wasn't one of them.
They combed the entire market. It's not 10 ideas, not 10 stocks everyone is talking about, it's what their research points to as the 10 best stocks to buy right now, and it's free. Read more here and see which stocks made the list -->>
APP Stock in Spotlight
AppLovin (Nasdaq: APP) is shaving 9.5% off its value today despite a bullish sign out of Wall Street. Evercore ISI analysts have begun coverage of the stock with an “outperform” rating and $835 price target attached, touting its leadership in mobile ad technology. Morgan Stanley is similarly bullish, with an $800 price target on APP stock. AAP shares currently hover just above $600.
Supreme Court Tariff Uncertainty
The U.S. Supreme Court was expected to hand down a ruling on President Trump’s tariff policy, which has already generated hundreds of billions of dollars for the Treasury, but has instead sidestepped the issue once again. The markets remain under pressure, with the Nasdaq Composite now down a steeper 1.5%, weighed down by the likes of Broadcom (Nasdaq; AVGO), which is losing nearly 5%, and Meta Platforms (Nasdaq: META), down 2%.
Wall Street Moves
Goldman Sachs has reemphasized its “buy” rating on Amazon (Nasdaq: AMZN) stock, lifting its price target by $10 to $300 per share.
Wells Fargo analysts have reemphasized their “overweight” rating on Nvidia stock given its dominance in the gaming market segment as well as data center opportunities.
UBS analysts have turned bearish on Rivian (Nasdaq: RIVN) stock, downgraded shares from “neutral” to a “sell” rating with a $15 price target amid a weakening risk/reward profile on the EV maker.
This article will be updated throughout the day, so check back often for more daily updates.
Markets have no shortage of headlines or earnings to respond to this morning. Overall it appears stock sentiment is being dragged lower by financial stocks as big banks continue to unveil their Q4 results and Wall Street is not impressed. The resilient consumer didn’t disappoint over the early holiday shopping season, with November retail sales 0.6% vs. the prior month and surpassing economist estimates. Results were also buoyed by strong auto sales in the period. President Trump has set his sights on acquiring Greenland for what he described as the “purpose of national security.”
Netflix (Nasdaq; NFLX) stock is getting a bump today as the content streaming giant flexes by potentially overhauling its Warner Bros. offer to an all-cash deal. Separately, Microsoft (Nasdaq: MSFT) reportedly has been deepening its relationship with AI company Anthropic, doling out approximately $500 million per year on AI to support its solutions.
Here’s a look at where things stand as of morning trading:
Dow Jones Industrial Average: 49,121.06 Down 54.82 (-0.11%)
Nasdaq Composite: 23,553.45 Down 164.39 (-0.69%)
S&P 500: 6,933.49 Down 30.25 (-0.43%)
Market Movers
Wall Street banks are selling off after unveiling their Q4 performance. Despite beating analyst estimates on strong net interest income and stock market trading, Bank of America (NYSE: BAC) stock is getting hammered, down 3.5% in early trading. Citi (NYSE: C) is managing a fractional gain despite profit pangs. Wells Fargo (NYSE: WFC) also reported Q4 results, missing on revenue while sending the stock spiraling by a steep 4.1%.
Nvidia (Nasdaq: NVDA) CEO Jensen Huang is not shying away from the Google/Alphabet (Nasdaq: GOOGL) effect, posting on social media that “Alphabet and NVIDIA are expanding their decade-long partnership to advance agentic AI, robotics, drug discovery, and more.”
The post Live Nasdaq Composite: Markets See Glass Half Empty amid Weakened Sentiment appeared first on 24/7 Wall St..
]]>Pre-Market Stock Futures:
The futures are little changed after a blockbuster day to open the first full trading week of 2026. The combination of no Santa Claus rally, the market shrugging off the capture of Venezuelan dictator Maduro, then embracing the action, plus some big pent-up money sitting on the sidelines, all helped to propel stocks dramatically higher on Monday. With a slew of economic data and fourth-quarter earnings (expected to be solid) on the way, investors may be resetting portfolios for the first quarter and beyond. The Dow Jones Industrials helped lead the way, surging 1.23% to close at 48,977, while the S&P 500 closed the session at 6,902, up 0.64%, followed by the Nasdaq, which was last seen on Monday at 23,395, up 0.69%. The star of the day was the Russell 2000, which finished trading up a whopping 1.58% at 2,547. Many feel small and midcap stocks could outperform this year, playing catch-up after being somewhat of an afterthought the last few years.
Treasury Bonds:
After a rough day on Friday, buyers returned to the Treasury market on Monday, driving yields down across the curve. Traders and analysts noted the strength on Monday was primarily due to surprisingly weak U.S. manufacturing data (ISM report) and bullish option trades betting on lower yields, alongside ongoing global factors like Bank of Japan policy shifts and market anticipation of future Federal Reserve actions and strong economic data. The 30-year bond closed at 4.84%, while the benchmark 10-year note finished at 4.16%.
Oil and Gas:
Prices were up across the energy complex on Monday as the capture of Maduro and the potential for significant oil investment in Venezuela were embraced as huge positives by traders. Brent Crude closed the day up 1.78% at $61.30, while West Texas Intermediate finished the session up 1.74% at $58.32. The only loser on the day was natural gas, which closed down 2.63% at $3.52. Despite massive LNG sales in 2025 and cold weather over much of the country, the sellers were back in force.
Gold:
Not willing to be left behind, Gold continued its relentless push higher, closing on Monday at $4,448, up 2.72%, while Silver continued to rage higher, finishing the day up a stunning 5.19% at $76.55. Continued industrial demand, combined with a surge in retail and institutional buying, kept a strong tailwind behind the precious metals. Many firms are raising their end-of-year Gold target to the $ 4,900-$5,000 range.
Crypto:
Last, but certainly not least, after a difficult fourth quarter, the crypto market saw a significant uplift on Monday, with Bitcoin breaking above $92,000 and briefly touching $93,000 before running higher, its highest level in four weeks. Traders cited oversold conditions and some short-covering. Top crypto traders noted that the market is attempting to consolidate at higher levels, with some analysts noting a return to monthly highs and a break above the 50-day moving average. At 8A EST, Bitcoin was trading at $93,850, while Ethereum was trading at $3,237.
24/7 Wall St. reviews dozens of analyst research reports daily to identify new investment ideas for both investors and traders. Some of these daily analyst calls cover stocks to buy. Other calls cover stocks to sell or avoid. Remember that no single analyst call should ever be used as a basis to buy or sell a stock.
Here are some of the top Wall Street analyst upgrades, downgrades, and initiations seen on Tuesday, January 6, 2026.
Upgrades:
- Brinker International Inc. (NYSE: EAT) was upgraded to Buy from Neutral at UBS, which lifted the target price for the restaurant giant to $175 from $144.
- Brunswick Corp. (NYSE: BC) was raised to Buy from Hold at Jefferies, which boosted the target price on the stock to $115 from $65.
- ServiceNow Inc. (NYSE: NOW) was raised to Buy from Neutral at Arete, which has a $200 target price for the stock.
- Shake Shack Inc. (NYSE: SHAK) was upgraded to Buy from Hold at Deutsche Bank with a $108 price target objective.
- SLB NV (NYSE: SLB) was upgraded to Outperform from In Line at Evercore ISI, which lifted the target price for the stock to $54 from $38.
- Styrker Corp. (NYSE: SYK) was upgraded to Outperform from Market Perform at Raymond James with a $418 target price.
Downgrades:
- AT&T Inc. (NYSE: T) was downgraded to Sell from Neutral at Arete with a $20 target price objective.
- D.R. Horton Inc. (NYSE: DHI) was cut to Equal Weight from Overweight at Wells Fargo, which has a $155 target price for the homebuilder.
- KeyCorp (NYSE: KEY) was downgraded to Underperform from Neutral at Baird, with an $18 target price.
- Shopify Inc. (NASDAQ: SHOP) was downgraded to Peer Perform from Outperform at Wolfe Research, which removed the firm’s $185 target price.
- Wells Fargo & Co. (NYSE: WFC) was downgraded to Underperform at Neutral at Baird, which keeps the target price for the bank at $90.
- Zimmer Biomet Holdings Inc. (NYSE: ZBH) is cut to Market Perform from Outperform at Raymond James with a $103 target price.
Initiations:
- Apple Hospitality REIT Inc. (NYSE: APLE) was started with an Overweight rating at Barclays with a $14 target price.
- CoreWeave Inc. (NASDAQ: CRWV) was started with a Hold rating at Truist with an $84 target price.
- Digital Realty Trust Inc. (NYSE: DLR) was initiated with a Buy rating at Deutsche Bank, which has set a $180 target price for the shares.
- Lemonade Inc. (NYSE: LMND) was initiated with a Buy rating at Truist with a $98 target price.
- Palantir Technologies Inc. (NASDAQ: PLTR) was initiated with a Buy rating at Truist, which has set a $223 target price for the stock.
- SoFi Technologies Inc. (NASDAQ: SOFI) was resumed in coverage withan Underperform rating at Bank of America with a $20.50 target price.
The post Here Are Tuesday’s Top Wall Street Analyst Research Calls: AT&T, CoreWeave, Digital Realty, Palantir Technologies, ServiceNow, Shopify, SoFi Technologies, and More appeared first on 24/7 Wall St..
]]>Jim Cramer is watched by hundreds of thousands of investors every day, and many of them consider him their only source of information. He believes Wells Fargo (NYSE:WFC) and AutoZone (NYSE:AZO) are “incredibly inexpensive” at the moment, and it’s worth looking into why. His picks have historically been hit or miss if you consider all his bearish and bullish positions. This year in particular has been quite good for his picks, as he has refused to back down on the AI rally being a bubble.
He remains bullish on the mega-cap tech stocks, doing impressively well on stocks like Palantir (NASDAQ:PLTR) and Nvidia (NASDAQ:NVDA). The tone did soften recently, with Cramer asking investors to look outside of tech for market winners. He believes the rally can become more broad-based as investors focus more on value.
Here are two that fit the bill.
Wells Fargo (WFC)
Wells Fargo has done immensely well in the past two years and has more than doubled in price. WFC stock has shown no sign of plateauing, and this is one pick that remains quite under-the-radar despite doing so well. Cramer is doubling down and thinks the stock is still undervalued.
On Mad Money‘s September 9 show this year, Cramer was discussing Apple (NASDAQ:AAPL) and Wells Fargo.
He said, “I want to pound the table on right here and right now, Wells Fargo and Apple.” He added, “Wells has bought back $5.5 billion of its stock so far this quarter. That’s the most the bank has bought back in a single quarter all year… That is a huge sign of confidence from CFO Mike Santomassimo, who said that he’s seeing green shoots now that the Fed has removed the asset cap penalty on Wells. I’d be a buyer if we didn’t already own so much of it from my charitable trust.”
He then said, “It’s worth braving today’s decline. Don’t forget… the incredibly inexpensive Wells Fargo. Buy, Buy, Buy!”
The stock is up 6.8% since that Mad Money episode.
WFC stock trades at 14 times earnings and a little bit over 12 times forward earnings. It’s easy to see why Cramer is so bullish here once you consider that the 3-year average share buyback ratio is 5.4% annually. This is better than 97.5% of companies in the banking industry. Wells Fargo also comes with a 2% dividend yield, with a 3-year dividend growth rate of 35.7% annually.
In short, Cramer likes cash cows, and WFC is one of the best ones to go for.
AutoZone (AZO)
On the same day, Cramer discussed AutoZone, saying the company had a “legendary buyback”.
“I checked out the share over the last decade, and it’s astounding. Ten years ago, it had roughly 31 million shares. Now, it’s less than 17 million shares. That’s what happens when you’re repurchasing at a clip of 6% every year. I like it,” Cramer added.
He also pointed out that the auto parts chain does very well in a slowdown. “Because more people want to fix up their old car, save some money rather than have to go buy a new one.”
His thesis is quite on point, considering the average age of civilian vehicles in the U.S. has hit 12.8 years in 2025. To add insult to injury, the catalog of truly “cheap” cars is getting smaller and smaller. Consumers are shelling out $50,080 on average for a new car as of September. That’s a record high.
AZO stock is down exactly 10% from that buy recommendation, but this stock has been on a terrific long-term uptrend. The stock is up 234.1% over the past five years and can keep outperforming due to the state of the auto market.
The post Jim Cramer Wants You to Buy These 2 “Incredibly Inexpensive” Stocks appeared first on 24/7 Wall St..
]]>A return to the forefront for initial public offerings (IPOs) and a relentless stock market rally, highlighted by a massive run by the Magnificent 7 tech stocks, in tandem with the Gold Mining stocks and Utilities, have led the stock market to print new all-time highs this year for all of the major indices. The initial third-quarter earnings results come from the large-cap money center banks, all of which posted outstanding results. Led by investment banking, a return to the market for IPOs, and huge trading profits, all of the major players in the finance sector blew away third-quarter earnings expectations, with all citing similar reasons for the strong quarter.
Based on the latest earnings results, here are some of the Q3 2025 earnings for major Wall Street banks:
- JPMorgan Chase (NYSE: JPM) delivered strong third-quarter results, crushing analyst expectations with earnings per share of $5.07 versus expected $4.84 and revenue of $47.12 billion compared to expectations of $45.4 billion, driven by stronger-than-anticipated trading and investment banking revenue of roughly $700 million above forecasts.
- Wells Fargo & Company (NYSE: WFC) also topped Q3 2025 earnings estimates with earnings per share of $1.73 and revenue of $21.44 billion, with the stock gaining as the bank raised profitability targets following relief from asset cap restrictions.
- Citigroup Inc. (NYSE: C) reported net income of $3.8 billion, or $1.86 per diluted share, on revenue of $22.1 billion for the quarter, compared to $3.2 billion, or $1.51 per diluted share, on revenue of $20.2 billion a year earlier.
- The Goldman Sachs Group Inc. (NYSE: GS) reported net revenues of $15.18 billion and net earnings of $4.10 billion for the third quarter ended September 30, 2025, with diluted earnings per common share of $12.25 and an annualized return on average common shareholders’ equity of 14.2%. The results beat expectations. Earnings per share of $12.25 exceeded the expected $11, and revenue of $15.18 billion surpassed the expected $14.1 billion. Profit surged 37% from a year earlier, and revenue rose 20%.
- BlackRock Inc. (NYSE: BLK) delivered one of its strongest quarterly flow results, with net inflows of $205 billion, powering 10% organic base fee growth in the third quarter and 8% over the last twelve months. The company reported third quarter diluted earnings per share of $8.43, or $11.55 as adjusted. BlackRock reported revenue of $6.51 billion, surpassing estimates. Despite this, the company saw a 25% revenue increase year-over-year, even though GAAP income was lower.
Given the powerful results for major banks and financial giants, it makes sense for investors to consider adding top companies like these to their portfolios. All of them pay reliable and rising dividends, and all the major Wall Street banks have stock buyback programs in place. Earlier this year, almost all of the major banks significantly increased their buyback activity, with some reporting their biggest repurchase levels in years, as high as $40 to $50 billion, signaling confidence despite economic uncertainty. With Bank of America (NYSE: BAC) set to report tomorrow, it’s a strong start to the quarterly earnings results from Wall Street.
After a few years of virtually no IPO activity, the market has come alive in 2025 with multiple high-profile deals that have soared to new heights. 2025’s IPO boom included, among others, Figma (NYSE: FIG), CoreWeave Inc. (NASDAQ: CRWV), and Circle Internet Group (NYSE: CRCL), all of which have delivered tremendous gains for investors. With a ton of retail and institutional demand, and a bursting pipeline of deals in the queue, you can bet that the trend will stay in place the rest of 2025 and next year.
The post IPOs and Trading Drive Big Banks With Big Dividends Earnings Higher In Q3 appeared first on 24/7 Wall St..
]]>One very positive item for investors when earnings season rolls around every quarter is that the big money center and investment banks are always among the first to report. This year was no different, as all the major financials were released early and, for the most part, all delivered outstanding numbers. As with all sectors, the tariffs are weighing on sentiment and affecting companies’ ability to provide forward guidance that they feel comfortable with. Following the solid reports for the second quarter, if we achieve some tariff resolution and geopolitical tensions subside, the rest of 2025 could be huge for the blue-chip giants that top Wall Street analysts favor.
While top Wall Street analysts are wary of the pitfalls that could face the top financial stocks for the rest of 2025, if tariffs and the economy combine to create headwinds for the sector, however, if things continue to smooth out, the top blue chips in the industry could produce some impressive total return numbers for growth and income investors. Add in the potential for rate cuts starting in September, and the banking index that tracks the largest 24 banks has surged to record highs for the first time in three years, and all the ingredients for a continued rally in the sector are in place.
We screened our 24/7 Wall St. research financial database list of strong buy stocks that top Wall Street firms are positive on, and four of the highest-yielding picks are outstanding ideas now.
Why do we cover blue-chip dividend financial stocks?

Dividend stocks offer investors a reliable source of passive income. Passive income is characterized by its ability to generate revenue without requiring the earner’s continuous active effort, making it a desirable financial strategy for those seeking to diversify their income streams or achieve financial independence.
Goldman Sachs
Goldman Sachs Group Inc. (NYSE: GS) is an American multinational investment bank and financial services company. The white-glove banking giant offers industry-leading strength and pays a reliable 2.15% dividend. It provides a range of financial services to corporations, financial institutions, governments, and individuals worldwide through three segments:
- Global Banking & Markets
- Asset & Wealth Management
- Platform Solutions
The Global Banking & Markets segment provides financial advisory services, including:
- Strategic advisory assignments related to mergers and acquisitions, divestitures, corporate defense activities, restructurings, and spin-offs
- Relationship lending, acquisition financing, and secured lending through structured credit and asset-backed lending and funding under securities-to-resale agreements
This segment also offers client execution activities for cash and derivative instruments, as well as credit and interest rate products, mortgages, currencies, commodities, and equities-related products, along with underwriting services.
The Asset & Wealth Management segment manages assets across various classes, including equity, fixed income, hedge funds, credit funds, private equity, real estate, currencies, and commodities.
It provides:
- Customized investment advisory solutions
- Wealth advisory services
- Personalized financial planning
- Private banking services
- Investments in corporate equity, credit, real estate, and infrastructure assets
The Platform Solutions segment offers credit cards and point-of-sale financing for the purchase of goods or services. It also provides cash management services, such as deposit-taking and payment solutions, for corporate and institutional clients.
Wells Fargo has assigned an Overweight rating and a target price of $785.
JPMorgan Chase
JPMorgan Chase & Co. (NYSE: JPM) is the fifth-largest bank in the world by assets. Its stock trades at a reasonable 12.5 times estimated 2026 earnings, and it offers a 1.87% dividend. JPMorgan is one of the leading global financial services firms and the largest banking institution in the United States, with approximately $3.9 trillion in assets. The company was formed by merging Chase Manhattan’s retail banking operations and J.P. Morgan’s investment banking operations.
The company operates through four segments:
- Consumer & Community Banking (CCB)
- Corporate & Investment Bank (CIB)
- Commercial Banking (CB)
- Asset & Wealth Management (AWM)
The CCB segment offers:
- Deposit, investment, and lending products
- Cash management, payments, and services
- Mortgage origination and servicing activities
- Residential mortgages and home equity loans
- Credit cards, auto loans, leases, and travel services are offered to consumers and small businesses through bank branches, ATMs, and digital and telephone banking
The CIB segment provides:
- Investment banking products and services, including corporate strategy and structure advisory, and equity and debt market capital-raising services
- Loan origination and syndication, payments, cash and derivative instruments, risk management solutions, prime brokerage, and research
This segment also offers securities services, including custody, fund accounting and administration, as well as securities lending products, for asset managers, insurance companies, and public and private investment funds.
The CB segment provides financial solutions, including lending, payments, investment banking, and asset management to small and midsized companies, local governments, nonprofit clients, and large corporations, as well as investors, developers, and owners of multifamily, office, retail, industrial, and affordable housing properties.
The AWM segment provides multi-asset investment management solutions, encompassing equities, fixed income, alternatives, and money market funds, to both institutional clients and retail investors. Additionally, it offers retirement products and services, brokerage, custody, estate planning, lending, deposit, and investment management services to high-net-worth clients.
Bank of America has a Buy rating with a $340 target price.
PNC Financial Services
PNC Financial Services Group Inc. (NYSE: PNC) is an American bank holding company and financial services corporation based in Pittsburgh, Pennsylvania. This bank has a vast client base and is among the top 10 largest U.S. banks by assets, and it pays investors a strong 3.30% dividend. PNC operates through three segments:
- Retail Banking
- Corporate & Institutional Banking
- Asset Management Group
The company’s Retail Banking segment offers:
- Checking, savings, and money market accounts, as well as time deposits
- Residential mortgages, home equity loans, and lines of credit
- Auto loans, credit cards, education loans, and personal and small business loans and lines of credit
- Brokerage, insurance, investment, and cash management services
This segment serves consumer and small business customers through branches, digital channels, ATMs, and phone-based customer contact centers.
The Corporate & Institutional Banking segment provides:
- Secured and unsecured loans, letters of credit, and equipment leases
- Cash and investment management services
- Receivables and disbursement management services
- Funds transfer services
- International payment services
- Access to online/mobile information management and reporting
- Securities underwriting, loan syndications, and customer-related trading
- Mergers and acquisitions, equity capital markets advisory-related services
- Commercial loan servicing and technology solutions
It serves mid-sized and large corporations as well as government and not-for-profit entities.
PNC Financial Services Group’s Asset Management Group segment offers:
- Investment and retirement planning, customized investment management, credit and cash management solutions, and trust management and administration services for high-net-worth and ultra-high-net-worth individuals and their families
- Multi-generational family planning services for ultra-high-net-worth individuals and their families
It provides outsourced chief investment officers, custody, private real estate, cash, fixed-income, and client solutions for retirement plans, as well as fiduciary investment services for institutional clients.
Bank of America’s price objective for the Buy-rated shares is $196.
Wells Fargo
Wells Fargo & Co. (NYSE: WFC) operates in 35 countries and serves over 70 million customers worldwide. This money-center giant makes sense, given its 2.18% dividend, as many of the issues that have plagued the company over the past five years appear to be resolved. Wells Fargo offers a diverse range of banking, investment, mortgage, and consumer and commercial finance products and services.
The company operates through four segments:
- Consumer Banking and Lending
- Commercial Banking
- Corporate and Investment Banking
- Wealth and Investment Management
The Consumer Banking and Lending segment offers a diverse range of financial products and services tailored to meet the needs of consumers and small businesses. These include checking and savings accounts, credit and debit cards, as well as home, auto, personal, and small business lending services.
The Commercial Banking segment provides financial solutions to private, family-owned, and specific public companies. Its products and services include banking and credit products across various industry sectors and municipalities, as well as secured lending and lease products, and treasury management services.
The Corporate and Investment Banking segment offers a suite of capital markets, banking, and financial products and services, such as:
- Corporate banking
- Investment banking
- Treasury management
- Commercial real estate lending and servicing
- Equity and fixed-income solutions
- Sales, trading, and research capabilities services to corporate, commercial real estate, government, and institutional clients
The Wealth and Investment Management provides wealth management, brokerage, financial planning, lending, private banking, and trust and fiduciary products and services to affluent, high-net-worth, and ultra-high-net-worth clients.
It also operates through financial advisors in brokerage and wealth offices, consumer bank branches, independent offices, and digitally through WellsTrade and Intuitive Investor.
The Goldman Sachs price target of $91 accompanies a Buy rating.
Four Warren Buffett Dividend Stocks You Can Buy Now and Hold Forever
The post Large Cap Dividend-Paying Banks Exploding Higher on Rate Cut Hopes appeared first on 24/7 Wall St..
]]>Live Updates
Got $1,000? Before You Buy JPM, Read This
If you have cash sitting in your account right now, give this two minutes. After more than two decades of helping investors beat the market, our top analysts at 24/7 Wall St. put together a definitive report on the Top 10 Stocks To Buy Today. And JPM wasn't one of them.
They combed the entire market. It's not 10 ideas, not 10 stocks everyone is talking about, it's what their research points to as the 10 best stocks to buy right now, and it's free. Read more here and see which stocks made the list -->>
Bank Stocks Continue Trending Down
It’s now a little past noon, and there’s been no turnaround for either Wells Fargo or BlackRock.
Wells Fargo is trading down about 5.5%, which is its daily low point. BlackRock has bounced back from its 11 a.m. lows, but is still down 5.7% on the day.
Why is Wells Fargo Down?
Wells Fargo beat estimates but its shares are down about 5% in early trading. Let’s look at some reasons the stock is down despite this earnings beat:
- The company lowered expectations for its net interest income. Previously the company had guided to 1 to 3% growth in 2025, but now says it expects interest income to be “roughly in line” with 2024.
- The stock has also performed strongly in 2025. Shares were up more than 18% headed into today, so taking a breather isn’t unusual.
We’ll continue monitoring what Wall Street has to say about Wells Fargo as the day progresses.
BLK slid about 0.45% around 10:41 AM as volume spiked over 170% in that minute.
BlackRock just saw a significant volume spike at 10:41 a.m. ET. Its slide has accelerated since and the stock is now down 6.9% as of 11:01 a.m. ET.
Major Outflow Weights on BlackRock Stock
Like Wells Fargo, BlackRock also reported solid earnings but is seeing its stock drop in early trading. One area that investors are watching is the company noting a $52 billion outflow from a major client. This led to a significant reduction in quarterly inflows (dropping the total down to $68 billion) and could be weighing on the stock this morning despite its solid EPS beat.
Earnings season kicked off this morning with a group of powerful financial companies. Wells Fargo (NYSE: WFC), and BlackRock (NYSE: BLK) each reported earnings before the bell.
As of 10:00 a.m., both stocks were down.
- Wells Fargo: Down 4.5%
- BlackRock: Down 6.4%
The morning has generally been unkind to stocks in the financial space. JPMorgan (NYSE: JPM) also reported earnings and is down about .6%. Citigroup (NYSE: C) is the lone bright spot in the financial space this morning, up 1.4%.
We’ve compiled the main need-to-know information about each company’s earnings below and will be updating this live article with earnings analysis throughout the morning.
Wells Fargo Q2’25 Earnings Highlights:
• Adj. EPS: $1.60  ; UP +20% YoY
• Revenue: $20.822B ; UP +1% YoY
• Net Income: $5.494B ; UP +12% YoY
Q2’25 Outlook:
– The company is focused on maintaining consistent revenue growth driven by fee-based income and managing expenses effectively.
– Continued investment in business segments is expected to support organic growth.
Q2 Segment Performance:
• Consumer Banking and Lending Revenue: $9.228B ; UP +2% YoY
• Commercial Banking Revenue: $2.933B ; DOWN -6% YoY
• Corporate and Investment Banking Revenue: $4.673B ; DOWN -3% YoY
• Wealth and Investment Management Revenue: $3.898B ; UP +1% YoY
Other Key Q2 Metrics:
• Adj. Operating Expenses: $13.379B ; UP +1% YoY
• Effective Tax Rate: 14.2% (vs. 20.3% YoY)
• Net Interest Income: $11.708B ; DOWN -2% YoY
• Noninterest Income: $9.114B ; UP +4% YoY
• Provision for Credit Losses: $1.005B ; UP +8% YoY
• Noninterest Expense: $13.379B ; UP +1% YoY
• Return on Equity (ROE): 12.8% (vs. 11.5% YoY)
• Return on Average Tangible Common Equity (ROTCE): 15.2% (vs. 13.7% YoY)
• Net Loan Charge-offs: $997M; DOWN -23% YoY
• Total Nonaccrual Loans: $7.757B; DOWN -8% YoY
• Total Nonperforming Assets: $7.964B; DOWN -8% YoY
CEO Commentary:
– Charlie Scharf: “Our second quarter results reflect the progress we are making to consistently produce stronger financial results with net income and diluted earnings per share up from both the first quarter and a year ago. Our efforts to increase fee-based income drove revenue growth and both net interest income and noninterest income grew from the first quarter. We are investing in our businesses but remain focused on expense management. While there continue to be risks as we look forward, activity levels have remained consistent and our strong credit performance continues to point to the strength of our commercial and consumer customers’ financial position.”
Strategic Updates:
– The lifting of the asset cap in the second quarter marked a pivotal milestone in Wells Fargo’s ongoing transformation, allowing for more aggressive growth strategies to serve consumers, businesses, and communities. The company has also terminated thirteen consent orders since 2019, including seven this year alone, indicating significant progress in regulatory compliance and operational strength.
Analyst Estimates:
– EPS Estimate: $1.41
– Analyst Price Target: $82.72
– Analyst Ratings: 6 Strong Buy, 11 Buy, 7 Hold, 0 Sell
BlackRock Q2’25 Earnings Highlights:
• Adj. EPS: $12.05 ; UP +16% YoY
• Revenue: $5.423B (Est. $10.81) ; UP +13% YoY
• Adj. Operating Income: $2.099B ; UP +12% YoY
• Net Income: $1.593B ; UP +7% YoY
• Diluted EPS: $10.19 ; UP +2% YoY
Q2 Segment Performance:
• Equity Revenue: $1.908B ; UP +6.6% YoY
• Fixed Income Revenue: $0.853B ; UP +5.7% YoY
• Alternatives Revenue: $0.656B ; UP +71.7% YoY
• Cash Management Revenue: $0.304B ; UP +23.0% YoY
Other Key Q2 Metrics:
• Adj. Operating Expenses: $3.692B ; UP +22.9% YoY
• Effective Tax Rate: 26.9% (vs. 24.2% YoY)
• Total AUM: $12.528T; UP +18% YoY
• Total Net Flows: $67.737B; DOWN -17% YoY
• Share Repurchases: $375M
CEO Commentary:
– Laurence D. Fink: “For many years, BlackRock has worked to serve the ambitions of each and every client around the world – from the largest asset owners to individuals just getting their start with investing. We design and deliver strategies and products that fit their unique long-term needs and aspirations. We deliver in the way that best serves each client, whether it’s through whole portfolio solutions, opportunistic investments, or customized models and SMAs. Our expanding client relationships are resonating in higher, more diversified organic base fee growth. We generated 6% organic base fee growth for the second quarter and the first half of 2025, and 7% over the last twelve months.”
CFO Commentary:
– Martin S. Small: “Our financial results reflect the strength of our diversified business model and the successful integration of our recent acquisitions. The growth in our technology services and subscription revenue is particularly encouraging, as it demonstrates our commitment to innovation and client service.”
Strategic Updates:
– Closed acquisition of HPS Investment Partners on July 1st, adding $165 billion of client AUM and $118 billion of fee-paying AUM.
– Surpassed fundraising target for GIP’s fifth flagship, raising $25.2 billion, marking the largest-ever client capital raise in a private infrastructure fund.
– Development of a custom target date fund glidepath that strategically allocates across public and private markets.
Analyst Estimates:
– EPS Estimate: $10.81
– Analyst Price Target: $1069.96
– Analyst Ratings: 7 Strong Buy, 9 Buy, 1 Hold, 0 Sell
The post Live Updates on Wells Fargo (NYSE: WFC) and BlackRock (NYSE: BLK) Earnings appeared first on 24/7 Wall St..
]]>Live Updates
Got $1,000? Before You Buy TSLA, Read This
If you have cash sitting in your account right now, give this two minutes. After more than two decades of helping investors beat the market, our top analysts at 24/7 Wall St. put together a definitive report on the Top 10 Stocks To Buy Today. And TSLA wasn't one of them.
They combed the entire market. It's not 10 ideas, not 10 stocks everyone is talking about, it's what their research points to as the 10 best stocks to buy right now, and it's free. Read more here and see which stocks made the list -->>
Tuesday Wrap-up
The Vanguard S&P 500 ETF closed at 571.95 Tuesday, down 0.4%.
Netflix Upgraded
BMO Capital raised its price target on S&P 500 component company Netflix (Nasdaq: NFLX) to $1,425 with an outperform rating. The banker cited record-breaking Squid Game 3 viewership and an attractive slate of content coming in H2 FY25, as well as “hundreds of billions” of “user interactions” annually as key to its buy thesis.
Another One (from Tesla) Bites the Dust
The Wall Street Journal is reporting that Tesla (Nasdaq: TSLA) VP of sales, service and delivery in North America Troy Jones, a 15-year veteran of Tesla, has left the company. The departure comes less than one month after head of manufacturing and operations Omead Afshar quit.
Tesla stock is down 0.9% on the news, but the Voo is still up 0.3%.
AmEx Downgraded
Not all today’s banking news is good. S&P 500 component company American Express (NYSE: AXP) got hit today with a downgraded to neutral from Monness, Crespi, Hardt analyst Gus Gala. “We are downgrading Amex to a Neutral … following a 45% runup since upgrading,” said Gala. Earnings estimates are unchanged, but the stock is trading towards the top end of its historical valuation range.
American Express shares responded by falling 1.7%. The Voo’s gain is slimmed to 0.3% in the first few minutes of trading.
This article will be updated throughout the day, so check back often for more daily updates.
The U.S. Bureau of Labor Statistics reported Tuesday morning that the consumer price index rose 0.3% in June, which is exactly what economists had predicted would happen. The monthly increase puts the annual inflation rate at 2.7% currently — also in line with expectations.
“Core” inflation (which excludes food and energy costs, both of which rose in June) was both better and worse, up only 0.2% for the month of June, but tracking for 2.9% annual inflation. Again, however, this is all exactly as economists had predicted.
The Vanguard S&P 500 ETF (NYSEMKT: VOO) is pretty pleased with the news, and up 0.5% premarket.
Earnings
Earnings are starting to come in fast and furious with multiple big bank S&P 500 component companies reporting Q2 results.
Wells Fargo (NYSE: WFC) reported $1.60 per share in profit, $0.20 better than expected.
Citigroup (NYSE: C) reported $1.96 per share in Q2 profits, $0.35 better than expected.
JPMorgan Chase (NYSE: JPM) reported $4.96 per share, $0.48 better than expected.
In each case, revenue also exceeded expectations.
Analyst Calls
Outside of banking, S&P 500 component company Otis Worldwide (NYSE: OTIS) gets an upgrade to overweight from J.P. Morgan with a $109 price target. And fellow component company Zimmer Biomet (NYSE: ZBH) is similarly upgraded to buy by Roth/MKM, with a $135 price target.
The post Stock Market Live July 15: Today’s S&P 500 (VOO) Rise Is No Surprise appeared first on 24/7 Wall St..
]]>Exchange-traded funds (ETFs) are must-haves if you’re currently in retirement and you’re looking for income. Many people focus solely on Treasuries or a mix of individual stocks and Treasuries, but you’re missing out if you’re not considering ETFs. Unless you’re a person in their late ’80s or ’90s with enough cash to ride out serious waves of inflation, I’d look into ETFs.
ETFs allow investors to invest in a basket of assets, thereby avoiding crashes in any particular asset. They are often tax-efficient and rebalance on their own if certain assets underperform for prolonged periods. These are truly passive investments, some of which are managed by extremely experienced teams. The best part is that you’re only paying a few dollars per $10,000 you invest for that service.
For the average retiree, I’d look for an ETF from a reputable provider that provides a strong yield and safety. A new retiree in his or her 60s or 70s could still have decades left in retirement. That’s why just holding cash or Treasuries on their own is not a smart idea. A $100 investment in 2020 is worth $124.21 today. Very few retirees can afford to survive another inflation wave like that. Sadly, even worse could happen in the coming decades.
As such, ETFs with some exposure to the stock market are recommended. Stocks act as a hedge against inflation, and shares of quality businesses won’t let you down in the long run. Invesco provides an extensive suite of ETFs, many of which are perfect if you are looking for retirement income. Here are two that can generate significant retirement income, and do so with an above-average margin of safety.
Key Points in This Article:
- SPHD gives you exposure to solid dividend-paying stocks, especially those with low volatility.
- PGX gives you an even higher dividend yield through preferred equities.
- Are you ahead, or behind on retirement? SmartAsset’s free tool can match you with a financial advisor in minutes to help you answer that today. Each advisor has been carefully vetted, and must act in your best interests. Don’t waste another minute; get started by clicking here. (Sponsor)
Invesco S&P 500 High Dividend Low Volatility ETF (SPHD)
The Invesco S&P 500 High Dividend Low Volatility ETF (NYSEARCA:SPHD) does exactly what it says. It is a specialized exchange-traded fund that gives you a high dividend yield and minimizes volatility.
The underlying index uses a sophisticated dual-screening process. S&P Dow Jones Indices first ranks S&P 500 securities by dividend yield, then sorts them in ascending order by their one-year trading volatility as measured by daily standard deviation. The ETF then selects stocks from that selection.
The SEC 30-day yield is at 4.84%. The annualized dividend yield is at 3.82%, with an expense ratio that is on the higher end at 0.3%. This is $30 per $10,000. What you’re getting for it is worth that expense ratio, in my eyes. This ETF pays monthly.
Monthly payments make it a true passive income generator. Most ETFs focused on equities will pay you quarterly. Being paid monthly will let you budget with more predictability and consistency, and they’ll also compound faster if you choose to reinvest.
The top three largest holdings are Altria Group (NYSE:MO) at 3.52%, Crown Castle (NYSE:CCI) at 3.51% and Verizon Holdings (NYSE:VZ) at 3.2%. These are well-established businesses that will generate dependable cash flow year after year. Altria’s financials are as steady as their customers’ pack-a-day habits, and both Crown Castle and Verizon are internet-related. They are much more stable than you’d expect due to how indispensable the internet has become.
Invesco Preferred ETF (PGX)
The Invesco Preferred ETF (NYSEARCA:PGX) is an exchange-traded fund that invests in preferred securities. It tracks the ICE BofAML Core Plus Fixed Rate Preferred Securities Index and focuses specifically on fixed-rate, U.S. dollar-denominated preferred securities.
At least 80% of its investments are in fixed-rate preferred securities, and these securities must be rated B3 or better. These preferred securities combine the features of both equity and fixed income investments. Plus, most preferred securities dividends are considered qualified dividends, meaning they are taxed at a lower rate than ordinary income.
Most of these preferred securities come from the Financials sector. Banks like JPMorgan Chase (NYSE:JPM), Wells Fargo (NYSE:WFC) and Bank of America (NYSE:BAC) are among its biggest fixed-income holdings. Roughly 71.4% of its sector allocation is from this sector.
Many see this as a negative thing due to memories from 2008, but banks have learned a lot since then. Stress tests are significantly more rigorous, there are no “NINJA” loans, and the Federal Reserve remains willing to step in as needed. In 2023, big banks actually benefited from the crisis as depositors moved money away from smaller regional banks into bigger ones.
PGX has an expense ratio of 0.5%, meaning you pay $50 per $10,000 invested. The SEC 30-day yield here is 6.27%, whereas the 12-month distribution rate is 6.15%. It also pays monthly. The ETF is down 21.9% in the past five years, but is highly likely to recover in the coming years. Interest rates are expected to start being cut starting in September. As rates continue going down, PGX will look significantly more attractive to investors.
The post 2 Invesco ETFs That Generate Retirement Income appeared first on 24/7 Wall St..
]]>Watch the Video
Transcript:
[00:00:04] Doug McIntyre: Lee, I thought Wells Fargo would be in prison. Forever. So did I I thought that. I thought that Wells Fargo would never stop shooting itself in the foot, that it would go on into eternity. However, I want you to tell me about the good news.
[00:00:22] Lee Jackson: Well, Wells Fargo got tossed into the penalty box seven or eight years ago for just a string of just incredibly bad.
[00:00:33] Lee Jackson: Bad decisions, fake accounts and transferring money in customer’s accounts and into other accounts and duplicating them. And it, it was unbelievable and it was. It probably all came to fruition 20 16, 20 17. and they got put into the penalty box. But good because it limited their total capital they could hold.
[00:00:59] Lee Jackson: Yeah. and that has been released, at least for now. And, I think that the stock has been strong. They were caught. I mean, I’m looking back on some of these, they were caught with some consumer, issues that, that almost seems impossible. That they got away from long as they did.
[00:01:23] Lee Jackson: But now that their capital, the holdings, the total holdings amount is not restricted, they can start to expand the company again.
[00:01:30] Doug McIntyre: Yeah. So to me, I, know the stock’s done well. Okay. And it’s done. Okay.
[00:01:36] Doug McIntyre: But if I’m a long-term investor and I like the current management, if I’m a long-term investor, I’m looking at Wells Fargo as maybe outperforming the other, what you and I used to call money center banks.
[00:01:51] Lee Jackson: Yeah. Big old money centers. That’s what they are. Yeah.
[00:01:54] Doug McIntyre: So. If I’m an investor, I’m looking at Wells Fargo as maybe the best stock in that sector.
[00:02:00] Lee Jackson: Well, yeah. I think a lot of people avoided it for years simply because there was no growth potential. if you can’t, if you can’t raise your whole asset base and grow ’cause you’re capped at whatever it was, 1.9 trillion or whatever it was, there’s no growth there.
[00:02:16] Lee Jackson: And then there’s just the pedestrian sort of earnings from checking and savings account and small banking deals. But yeah, I think now that the, they’re out of the penalty box and compare. All of the stocks have had a pretty good run. But I’ve seen, Warren Buffet sold a ton of Bank of America (NYSE: BAC), still has a fair amount.
[00:02:36] Lee Jackson: Sold all of his Citi group, recently. Yeah, which I thought was interesting. So yeah, I thought, I think looking at Wells Fargo and, I think Buffet owned Wells Fargo for years, back in the day, 10 years ago or so, maybe he’s looking at it again, thinking, okay, well may, maybe they’re not as bad off now as they were 7, 8, 9 years ago, but it’s been a long time coming and you can bet that the, C-suite guys there were high fiving the minute that came down.
The post I thought Well Fargo (WFC) Was Going To Forever Jail appeared first on 24/7 Wall St..
]]>One very positive item for investors when earnings season rolls around every quarter is that the big money center and investment banks are always among the first to report. This year was no different, as all of the big financials were out early and, for the most part, all delivered outstanding numbers. Like in all sectors, the tariffs weigh on sentiment and affect companies’ ability to provide forward guidance that they feel comfortable with. After the solid reports for the first quarter, if we get some tariff resolution, and some geopolitical sideshows quiet down, the rest of 2025 could be huge for the top blue-chip giants that the analysts at Bank of America are very bullish on.
While the BofA analysts are wary of the pitfalls that could face the top financial stocks for the rest of 2025, if the tariffs and the economy combine to provide headwinds to the sector, if things smooth out some, the top blue chips in the industry could produce some impressive total return numbers for growth and income investors. They noted this in their report:
Bank stocks will likely remain in the “sell the bounce” phase until investors can confidently see a reduced probability of a US recession. BofA’s Economics team still calls for positive GDP growth ~2% for 2025 and 2026. Healthy bank balance sheets, expectations for regulatory relief, a relatively resilient interest rate backdrop, and potential for improved clarity on tariff policy keep us positively biased. While bank stocks could remain rangebound and volatile over the coming months, we favor adding exposure to best-of-breed names.
We screened the list of strong buy stocks that BofA is positive on, and four of the highest-yielding picks are outstanding ideas now.
Why do we cover blue-chip dividend financial stocks?
Dividend stocks offer investors a reliable source of passive income. Passive income is characterized by its ability to generate revenue without requiring the earner’s continuous active effort, making it a desirable financial strategy for those seeking to diversify their income streams or achieve financial independence.
Goldman Sachs
Goldman Sachs Group Inc. (NYSE: GS) is an American multinational investment bank and financial services company. The white-glove banking giant offers industry-leading strength. It provides various financial services for corporations, financial institutions, governments, and individuals worldwide through three segments.
The Global Banking & Markets segment provides financial advisory services, including:
- Strategic advisory assignments related to mergers and acquisitions, divestitures, corporate defense activities, restructurings, and spin-offs
- Relationship lending, acquisition financing, and secured lending through structured credit and asset-backed lending and funding under securities-to-resale agreements.
This segment also offers client execution activities for cash and derivative instruments, credit and interest rate products, provision of mortgages, currencies, commodities, and equities-related products, as well as underwriting services.
The Asset & Wealth Management segment manages assets across various classes, including equity, fixed income, hedge funds, credit funds, private equity, real estate, currencies, and commodities.
It provides:
- Customized investment advisory solutions
- Wealth advisory services
- Personalized financial planning
- Private banking services
- Investments in corporate equity, credit, real estate, and infrastructure assets
The Platform Solutions segment offers credit cards and point-of-sale financing for the purchase of goods or services. It also provides cash management services, such as deposit-taking and payment solutions, for corporate and institutional clients.
The BofA stock price target is a stunning $700. Goldman Sachs is also on the firm’s US 1 list of top stock picks.
JPMorgan
JPMorgan Chase & Co. (NYSE: JPM) is the fifth-largest bank in the world by assets. Its stock trades at a reasonable 12.5 times estimated 2026 earnings. JPMorgan is one of the leading global financial services firms and one of the largest banking institutions in the United States, with about $3.9 trillion in assets. The company was formed by the merger of the Chase Manhattan retail banks and JP Morgan investment banks.
The company now operates through four segments. The Consumer & Community Banking segment offers:
- Deposit, investment, and lending products
- Cash management, payments, and services
- Mortgage origination and servicing activities
- Residential mortgages and home equity loans
- Credit cards, auto loans, leases, and travel services are offered to consumers and small businesses through bank branches, ATMs, and digital and telephone banking
The Corporate & Investment Bank segment provides:
- Investment banking products and services, including corporate strategy and structure advisory, and equity and debt market capital-raising services
- Loan origination and syndication, payments, cash and derivative instruments, risk management solutions, prime brokerage, and research
This segment also offers securities services, including custody, fund accounting and administration, and securities lending products for asset managers, insurance companies, and public and private investment funds.
The Commercial Banking segment provides financial solutions, including lending, payments, investment banking, and asset management to small and midsized companies, local governments, nonprofit clients, and large corporations, as well as investors, developers, and owners of multifamily, office, retail, industrial, and affordable housing properties.
The Asset & Wealth Management segment offers multi-asset investment management solutions in equities, fixed income, alternatives, and money market funds to institutional clients and retail investors; and retirement products and services, brokerage, custody, estate planning, lending, deposits, and investment management products to high-net-worth clients.
PNC Financial Services
This American bank holding company and financial services corporation is based in Pittsburgh, Pennsylvania. PNC Financial Services Group Inc. (NYSE: PNC) has a vast client base and is among the top 10 largest U.S. banks by assets. It operates through three segments.
The Retail Banking segment offers:
- Checking, savings, and money market accounts, as well as time deposits
- Residential mortgages, home equity loans, and lines of credit
- Auto loans, credit cards, education loans, and personal and small business loans and lines of credit
- Brokerage, insurance, investment, and cash management services
This segment serves consumer and small business customers through branches, digital channels, ATMs, and phone-based customer contact centers.
The Corporate & Institutional Banking segment provides:
- Secured and unsecured loans, letters of credit, and equipment leases
- Cash and investment management services
- Receivables and disbursement management services
- Funds transfer services
- International payment services
- Access to online/mobile information management and reporting
- Securities underwriting, loan syndications, and customer-related trading
- Mergers and acquisitions, equity capital markets advisory-related services
- Commercial loan servicing and technology solutions
It serves midsized and large corporations as well as government and not-for-profit entities.
The Asset Management Group segment offers:
- Investment and retirement planning, customized investment management, credit and cash management solutions, and trust management and administration services for high-net-worth and ultra-high-net-worth individuals and their families
- Multi-generational family planning services for ultra-high-net-worth individuals and their families
It provides outsourced chief investment officers, custody, private real estate, cash, fixed-income client solutions, and retirement plan fiduciary investment services for institutional clients.
BofA’s target price for the Buy-rated shares is $196.
Wells Fargo
Wells Fargo & Co. (NYSE: WFC) operates in 35 countries and serves over 70 million customers worldwide. This money-center giant makes sense for investors now, as many of the issues that have dogged the company over the past five years seem to be resolved. The financial services company offers a diverse range of banking, investment, mortgage, and consumer and commercial finance products and services in the United States and internationally.
Its Consumer Banking and Lending segment offers diversified financial products and services for consumers and small businesses. These include checking and savings accounts, credit and debit cards, and home, auto, personal, and small business lending services.
The Commercial Banking segment provides financial solutions to private, family-owned, and specific public companies. Its products and services include banking and credit products across various industry sectors and municipalities, secured lending and lease products, and treasury management services.
The Corporate and Investment Banking segment offers a suite of capital markets, banking, and financial products and services, such as:
- Corporate banking
- Investment banking
- Treasury management
- Commercial real estate lending and servicing
- Equity and fixed-income solutions
- Sales, trading, and research capabilities services to corporate, commercial real estate, government, and institutional clients
The Wealth and Investment Management provides wealth management, brokerage, financial planning, lending, private banking, and trust and fiduciary products and services to affluent, high-net-worth, and ultra-high-net-worth clients.
It also operates through financial advisors in brokerage and wealth offices, consumer bank branches, independent offices, and digitally through WellsTrade and Intuitive Investor.
The BofA price target for the bank is set at $83.
Warren Buffett Warned Investors: Grab Berkshire Hathaway’s Highest-Yielding Dividend Stocks Now
The post Bank of America Bullish on Blue-Chip Dividend Banks: 4 Strong Buy Stock Picks appeared first on 24/7 Wall St..
]]>Short and sweet. That’s how I’d describe this next letter from the Reddit mailbag. In 53 words, four of which are conjunctions, our caller today (let’s call him “Al”) polls the Reddit-verse advice on “the best” cash back credit card, to replace his current cash back card, which Al consider suboptimal.
“I’m looking for a credit card that has better cash back than my current ones. I don’t really care for the travel points or anything like that. Just strictly cash back. I’ve heard chase sapphire is good and discover it, but I’m wondering what you all have found to be the best. Thanks!”
In just 53 words, you wouldn’t expect Al could go far wrong with his request, and yet in fact he does. The problem with Al’s question you see, lies in his assumption that there must be one best cash back credit card out there. But there isn’t.
Rather, the best way to make use of credit cards to get cash back, is to use them in combination.
Think of it like this: Some cash back cards pay you a decent rate, say 2% on everything you buy. Other cash back cards pay you a superior rate, say 5% on purchases of gas (but only in certain time periods, like from January to March), or they may pay you back 3% on gas all the time, but 1% on everything else.
The devil, as the saying goes, is in the details. And it’s these details that make it hard to say if a card paying 5% on one thing, 3% on another, and 1% on everything else, is better than a card that just pays you a straight 2% cash back on whatever you charge on the card.
How to work the system on cash back credit cards
So you do you untangle this intricate web of rewards? I can answer that in two steps.
Step 1: You start off by getting one single, all-around cash back card that pays a decent rate on everything, all the time, and with no limits or fees. The Wells Fargo (NYSE: WFC) Active Cash card, Citi (NYSE: C) Double Cash, and SoFi‘s (Nasdaq: SOFI) Unlimited 2% credit card all pay 2% on all purchases in all categories, with no limit on how much cash you can get back, and none of these cards charges an annual fee for the privilege.
You only need one of these cards; there’s little point in having more than one, other than to increase the total amount you can charge across cards. If asked to choose, of the three, I prefer SoFi’s card over the others, because it does not charge foreign exchange fees when traveling outside the country (and unlike Al, I actually do “care for the travel”)!
Step 2: Now that you’re guaranteed a minimum of 2% cash back on all your spending, you try to bump up your average cash back from there, trying to inch past 2%. Add a Capital One (NYSE: COF) Savor Card for example, to get 3% cash back on groceries and restaurants. Add a Bank of America (NYSE: BAC) Customized Cash card and choose to get 3% back on gas for your car. Add a Citi Custom Cash card (similar concept, but from a different bank) and choose to get 5% back your internet provider’s bill (only up to $500 per month, but most internet bills are less than that). Then substitute the Capital One card for your SoFi card when buying food or visiting restaurants, substitute the BofA card when paying your internet bill, and substitute the Citi card when filling up.
Say in a given month you spend $700 on food, $200 on gas, $100 on internet, and $2000 on everything else. How does this work out? Well, your total cash back across the four cards will be:
$700 x 0.03 = $21
$200 x 0.03 = $6
$100 x 0.05 = $5
And $2000 x 0.02 = $40
Add it up, and you got $72 cash back on $3000 in spending. $3000 divided into $72 = 2.4%. That’s the total cash back you’re getting, and it’s 20% better than a plain vanilla 2% cash back card.
The post My Cash Back Cards Aren’t Great and I Don’t Care About Travel Rewards. Which Cards Are Best For Me? appeared first on 24/7 Wall St..
]]>What is “the best card that can give me the max amount of cash back for everyday purchases like gas etc?” This is the question posed in our next drawing from the Reddit mailbag. Our caller today, let’s call her “Gwen,” is a young adult fresh out of college and off to a good start with a credit score of 746 (which FICO considers “very good”), but looking for a better credit card to maximize her cash back.
Gwen is rocking a Chase Freedom Student card at present, a holdover from her college days that Chase Bank actually no longer offers. The Chase Freedom Student has been phased out and replaced by a similar card that’s now called “Chase Freedom Rise.”
It’s not a bad card as cashback cards go. It doesn’t charge any annual fee for example. But it only pays 1.5% cash back on purchases, which these days is really the absolute minimum you should demand in a cash back card.
Long story short, Gwen can do better. Let’s help her out with that.
Ordinarily, my advice when picking cash back cards is to go for a mixed approach, holding one card that pays a decent cash back rate on all purchases in all categories, with no limit on the cash back you can earn, and no annual fee. Any of several major branded credit cards fit this bill, including The Wells Fargo (NYSE: WFC) Active Cash card, Citi (NYSE: C) Double Cash, and SoFi‘s (Nasdaq: SOFI) Unlimited 2% credit card.
This all-around “good enough” card should then be paired with a handful of other cards that pay less than 2% for what Gwen might call “etc” purchases, but more than 2% for specific categories of purchases where she spends heavily. Whenever making one of these specific purchases, Gwen would switch out her good-enough card, and use one of these credit cards tailored to the specific purchase she’s making, be it gas, or groceries, or restaurants for example.
Good options for this part of the package might include Bank of America‘s (NYSE: BAC) Customized Cash card, which lets a cardholder pick one category of purchase to receive 3% cash back on; or Citi’s Custom Cash card, which let’s you pick a category to receive 5% cash back (albeit, only up to $500 in purchases per month).
Is the Blue Cash Preferred Card a good cash back card?
Gwen seems to be thinking along these same lines as well, asking specifically if she should ditch her Chase Freedom Student card in favor of the Blue Cash Preferred Card from American Express (NYSE: AXP).
So should she?
My first instinct is to say “no” without thinking, because unlike all of the cards I’ve named above, the AmEx card charges a $95 annual fee (after the first year). But on further reflection, the Blue Cash Preferred Card idea may have some merit, especially when used in conjunction with a second, good-enough card. Why?
Well, consider this: The Blue card pays a superb 6% cashback on grocery purchases, 6% more on “select” streaming subscriptions, and 3% on gas stations. It pays only 1% cashback on everything else, but Gwen already has a card that she can use for everything else, her Chase card, and it pays 1.5%.
The question really comes down to this: Will Gwen spend enough on groceries and streaming, to cover the $95 annual fee, and still give her more cash back than she’d get if she used a different card (or cards) paying only 3% on groceries and streaming? It’s not too hard to answer that question, though.
First, we need to know how much Gwen pays for groceries and streaming in an average month. Is it $500? If so, then at 6% cashback she’s getting $30 back a month on those purchases, or $360 a year, instead of the $15 a month, or $180 a year, she’d be getting with a 3% cash back card (or cards). The difference between $360 and $180 ($180), is more than the $95 annual fee, so Gwen is actually getting a good deal in this case.
Conversely, if Gwen spends only $200 a month on groceries and streaming, her cashback at 6% is $144 a year. Minus the $95 annual fee, she’s netting only $49 cash back, which is less than the $72 she’d get on a 3% cashback card with no annual fee.
In that case, she’s better off finding a different card, and leaving the AmEx card to bigger spenders.
The post What Cash Back Cards Make The Most Sense For Everyday Purchases, Like Gas or Groceries? appeared first on 24/7 Wall St..
]]>Live Updates
Got $1,000? Before You Buy AAPL, Read This
If you have cash sitting in your account right now, give this two minutes. After more than two decades of helping investors beat the market, our top analysts at 24/7 Wall St. put together a definitive report on the Top 10 Stocks To Buy Today. And AAPL wasn't one of them.
They combed the entire market. It's not 10 ideas, not 10 stocks everyone is talking about, it's what their research points to as the 10 best stocks to buy right now, and it's free. Read more here and see which stocks made the list -->>
Another market reversal
The stock market is shrugging off the latest salvo between the U.S. and China over trade. All stock indices opened slightly higher at the morning bell, with the Vanguard S&P 500 ETF (NYSEARCA:VOO) up 0.7%.
China raised its tariffs on U.S. goods to 125%, matching the rate President Trump had imposed on Chinese imports. Beijing, though, said it no longer matters what further increases the U.S. hits it with as it will not respond because “Given that, at the current tariff level, U.S. exports to China are no longer commercially viable, China will not respond to any further tariff hikes by the U.S. on Chinese goods.”
With Trump having essentially eliminated the de minimis rule that Chinese marketplaces like Temu and Schein used to ship cheap goods to the U.S. duty-free, it’s not unreasonable to say trade between the U.S. and China is dead.
Big names bolster market
Although most components of the Vanguard ETF are down, the biggest components of the index are moving higher. Nvidia (NASDAQ:NVDA), representing the second largest position in the exchange-traded fund at over 6%, is up more than 2%, helping to drive the ETF higher.
Even though top dog Apple (NASDAQ:AAPL) is in the red, it is almost at break-even so its impact is negligible.
Yet some components are up strongly in morning trading. Broadcom (NASDAQ:AVGO), which is the eighth largest position, is up 3.4%. The AI chipmaker’s stock has held up better than most over the tumultuous week with shares 22% higher.
Banking on trading turmoil
What is buoying stocks this morning are the results of bank stock earnings starting to come in with giants like JPMorgan Chase (NYSE:JPM) reported record revenue on higher trading despite caution over economic headwinds. JPM stock represents 1.5% of VOO’s portfolio, just behind 10th place Tesla (NASDAQ:TSLA) at 1.6%. JPMorgan is up 2% in morning trading.
Other financial stocks in the Vanguard S&P 500 ETF that reported earnings today include Wells Fargo (NYSE:WFC) and Morgan Stanley (NYSE:MS), both of which had better than expected results.
Yet banks were also being very cautious and were setting aside larger amounts for credit losses. It suggests they foresee tougher times coming and are preparing for the worst.
JPMorgan’s provision for credit losses in the fourth quarter rose to $3.3 billion from $2.6 billion. Wells Fargo’s provision, however, was lower than expected. It set aside $932 million, less than the $1.2 billion Wall Street wass anticipating. Morgan Stanley’s credit loss provision was just $135 million, but it is markedly higher than the $6 million et aside in its year-ago first quarter.
The post Live: Vanguard S&P 500 ETF (VOO) Ignores Tariffs, Rises on Bank Earnings appeared first on 24/7 Wall St..
]]>It can be gratifying to see cash dividend distributions show up in your investment account. Thus, in the quest for hefty dividends, you may be tempted to load up on a high-yielding exchange traded fund (ETF) such as the iShares Trust iShares Preferred and Income Securities ETF (NASDAQ:PFF).
Besides, the PFF ETF offers exposure to preferred stock shares, which might sound intriguing. Yet, it’s crucial to “learn before you earn,” as they say.
In other words, be sure to conduct your due diligence on PFF before deciding whether to take a share position. As we’ll discover now, there are several risks with this yield-bearing fund that may dissuade you from buying any shares at all.
The Dark Side of Preferred Stocks
Make no mistake about it: the primary selling point of the PFF ETF is its eye-popping 6.2% forward annualized dividend yield. You won’t often find such a high yield in individual large-cap stocks, not to mention in the world of ETFs.
Consequently, you might assume that a preferred stock ETF such as PFF would be the secret to stable income. The PFF ETF, iShares explains, focuses on “U.S. preferred stocks, which have characteristics of bonds (pay a fixed dividend) and stocks (represent ownership in a company).”
So, what could possibly go wrong? After all, preferred stocks “precede common stock in a company’s capital structure” and “may offer higher income than other asset classes,” right?
Sure, but this doesn’t mean the dividends of preferred stocks are 100% safe. What you might not know is that preferred stock is generally ranked lower than corporate bonds in a company’s capital structure. As a result, dividends are more likely to be cut from a company’s preferred stock than from the same company’s corporate bonds.
Now, we’re starting to discover the dark side of preferred stocks. Elite Capital Management Group founder Matthew Butler even goes so far as to warn, “Most companies with solid credit ratings don’t issue preferred stocks” because these stocks “are generally too expensive a form of capital for strong credits.”
Moreover, Butler continues, “A company might issue preferred shares if they are having trouble accessing other capital-raising options.” This isn’t confidence-inspiring if a prospective investor is considering whether a preferred dividend issuing company is on solid financial ground.
So, the first red flag for the PFF ETF is the simple fact that it’s a fund filled with preferred dividend stocks. In a company’s capital structure, preferred shares are typically a lower priority than corporate bonds; furthermore, businesses that issue preferred stocks may be desperate to raise capital by any means necessary.
Economic Uncertainty Raises Issues
Another concern is whether the component businesses represented in the PFF ETF will hold up well during these tumultuous times. In case you didn’t get the memo, the buzzword of 2025 so far is “uncertainty,” especially since the near-term outcomes of the ongoing trade war are certainly uncertain.
PFF is down by around 10% over the past 12 months. In contrast, the S&P 500 is only down by 3% to 4%. Granted, the PFF ETF would have made up for the share-price underperformance, more or less, with its sizable dividend payments.
Interest Rate Worries
In case these considerations aren’t enough to worry about, we’ll also have to think about the impact of interest rate changes on the PFF ETF. This is particularly important for PFF, since its top holdings are mostly financial firms.
I’m not suggesting that the PFF ETF isn’t diversified at all, but it’s eye-opening that seven of the fund’s top 10 holdings are stocks representing financial institutions. This may be problematic since banks like Wells Fargo (NYSE:WFC), Citigroup (NYSE:C), and Bank of America (NYSE:BAC) are highly susceptible to changes in interest rates.
Treasury bond yields have soared recently, and high interest rates are a mixed blessing, at best, for big banks. High rates allow financial institutions to collect more revenue from loans, yes, but they also dissuade potential borrowers from taking on loans in the first place.
This is a big risk that could get even bigger if interest rates continue to rise. It’s a risk that ties into economic uncertainty and the tendency of preferred dividend issuers to de-prioritize stockholders versus bondholders — a dark triad of considerations that may convince you to steer clear of the PFF ETF.
The post The 3 Biggest Risks to the iShares U.S. Preferred Stock (PFF) ETF’s 6% Yield appeared first on 24/7 Wall St..
]]>When a business has much more capital coming in than going out, it’s a sign that investors can buy shares and sleep well at night. Only a few premier companies truly deserve the title of “cash flow king,” however — and these businesses are definitely worth looking at in 2025.
To identify these cash flow kings, you’ll need to understand the concept of free cash flow (FCF). The mathematical definition of FCF is a company’s operating cash flow minus its capital expenditures.
By knowing a business’ FCF, investors can gauge whether the company’s cash generated from business operations exceeds its capital expenditures, and by how much. Then, you can compare the firm’s FCF to its competitors.
If there’s a clear winner, you’re probably looking at a tried-and-true cash flow king; if it’s a high-quality, well-known blue chip company, that’s even better. Hence, let’s put a couple of famous firms to the test, check their cash flow versus their peers, and consider whether they might deliver robust returns in 2025.
NVIDIA
When artificial intelligence (AI) became a major market theme a couple of years ago, NVIDIA (NASDAQ:NVDA) became a darling of the markets. That’s because NVIDIA’s processors were powerful enough to handle AI-intensive workloads.
Fast-forward to 2025, and NVIDIA is still a market darling and a member of the “Magnificent Seven” group of heavily favored mega-cap firms. It’s amazing to consider how NVIDIA ascended so quickly to blue-chip status and stayed there without losing its luster.
Granted, the NVIDIA stock price has wobbled lately, but that’s true for the stock market generally. No matter how you slice it, NVIDIA shares have delivered impressive returns to investors over the past one, two, and five years.
Some skeptics might contend that NVIDIA stock is overvalued or “stretched” to the upside. However, as of April 4, NVIDIA’s trailing 12-month (TTM) price-to-earnings (P/E) ratio was between 34x and 35x.
That’s not an extreme valuation multiple for a chip stock in the 2020s. For comparison, Advanced Micro Devices (NASDAQ:AMD) had a P/E ratio of almost 94x, while Broadcom’s (NASDAQ:AVGO) P/E ratio was around 71x.
Commentators talk about stock price action and valuations all the time. Yet, there’s a key metric that they sometimes overlook: FCF. Remember, if a company’s cash inflow isn’t much greater than its expenditures, there could be a serious problem even if the company is considered a blue-chip.
So, let’s compare NVIDIA with some of its chip-industry rivals. Here’s how NVIDIA matches up against the company’s main U.S.-based competitors in terms of TTM FCF:
- Advanced Micro Devices: $2.405 billion
- Broadcom: $20.734 billion
- Intel (NASDAQ:INTC): -$15.656 billion
- NVIDIA: $60.853 billion
As you can see, there’s really no contest here. NVIDIA’s vastly superior cash flow makes it crystal clear why the company is a market darling and a worthy blue-chip business to invest in today.
Wells Fargo
A new round of earnings reports will kick off soon, and among the earliest reporting companies will be financial-market giant Wells Fargo (NYSE:WFC). All eyes will be on Wells Fargo as it’s a bellwether big bank and a blue-chip among financial firms.
Like NVIDIA stock and many others, Wells Fargo stock has experienced some volatility recently. Still, the long-term trend is to the upside as Wells Fargo’s shareholders have enjoyed nearly 150% returns on their investment over the past five years.
There are other reasons to view Wells Fargo as a blue-chip of choice for selective investors. For example, passive income investors should be glad to know that Wells Fargo delivers an enticing forward annual dividend yield of 2.44%.
Value hunters should also check out Wells Fargo. Indeed, the company’s TTM P/E ratio of 12.23x suggests that there’s a bargain here.
Is Wells Fargo a cash flow king, though? Let’s see what the numbers tell us. Here’s the TTM FCF for Wells Fargo and some of its famous peers in the banking sector:
- Bank of America (NYSE:BAC): -$8.805 billion
- Citigroup (NYSE:C): -$26.169 billion
- JPMorgan Chase (NYSE:JPM): -$42.012 billion
- Wells Fargo: $3.035 billion
Sometimes, being “not negative” is a positive. During these challenging times, Wells Fargo stands out from the pack with its positive FCF.
Having comparatively strong cash flow can put blue-chip businesses like NVIDIA and Wells Fargo in a good position to deliver value to the shareholders. With that in mind, feel free to put a few NVDA and WFC shares in your portfolio and align yourself with a couple of bona fide cash flow kings.
The post Free Cash Flow Kings: 2 Blue Chip Stocks To Buy in Today’s Market appeared first on 24/7 Wall St..
]]>While legendary billionaire Charlie Munger passed away 15 months ago, investors cannot forget the man. His commentary about our world was just as riveting as his financial wisdom. He was an equal in every way to Warren Buffett, his longtime partner.
When Munger passed away on Nov. 28, 2023, the Daily Journal Corp. (NASDAQ:DJCO) published an excellent obituary by editor-in-chief David Houston. It’s a recommended read.
When anyone considers Charlie Munger’s career, they naturally think about all of the years he and Buffett answered hours of questions from shareholders at the annual shareholders’ meeting in early May in Omaha, where Berkshire Hathaway (NYSE:BRK.B).
Munger’s longtime chairmanship of Daily Journal, a company that went public in 1986, and grew out of Munger’s purchase of the Los Angeles Daily Journal in 1977 for $2.5 million, was an ode to the legal profession that he gave up to join Buffett in an investment partnership that lasted 45 years.
The Daily Journal operates two businesses: its Traditional Business, which publishes legal publications, and Journal Technologies, which provides case management software to the legal industry. At the end of fiscal year 2024 (September), the two segments generated nearly $70 million in operating revenues and $4 million in operating earnings.
However, the company’s investment portfolio is the focus of this article. At the end of 2024, Daily Journal had 97% of its $209 million investment portfolio invested in these three stocks.
Here’s why.
Key Points About This Article:
- The late Charlie Munger was many things. His prescient bet on three bank stocks in 2009 set the Daily Journal (NASDAQ:DJCO) up for decades to come.
- Munger is said to have bought Wells Fargo (NYSE:WFC) stock for as little as $8 a share.
- The billionaire didn’t make many mistakes. Alibaba (NYSE:BABA) was about the only one.
- Sit back and let dividends do the heavy lifting for a simple, steady path to serious wealth creation over time. Grab a free copy of “2 Legendary High-Yield Dividend Stocks” now.
Daily Journal Is the Banking Industry’s Biggest Fan

Three of the four stocks in its investment portfolio are banks: Wells Fargo (NYSE:WFC), Bank of America (NYSE:BAC), and U.S. Bancorp (NYSE:USB). As of Dec. 31, they accounted for 47.4%, 42.0%, and 7.9% of its $209 million assets from its Q4 2024 13F holdings report, respectively.
The first thing you’ll notice from WhaleWisdom.com’s 13F holdings report for the fourth quarter is that all three were first acquired in Q4 2013. That can’t be coincidental.
However, if you look at the Daily Journal’s SEC filings, you will notice that its Q4 2013F filing was its first. A Bloomberg article from August 2013 provides an answer to why.
The SEC investigated the company earlier in 2013, arguing that its large amount of marketable securities as a percentage of its assets made it an investment company under the Investment Company Act of 1940. Daily Journal responded to the SEC’s questions on March 18, 2013.
Essentially, Munger convinced the board in 2009, that it should move its investments from Treasury bills, into marketable securities such as stocks, and other liquid assets.
Remember that this was during the financial crisis, and markets crashed. Munger convinced the board that bucking traditional financial wisdom was the best way to ensure the business’s long-term survival.
“[The] board recognized that Daily Journal needed a long-term plan to protect the company from deterioration in its newspaper publishing business, provide an asset base for future takeovers and build a net worth that would allow its software unit to bid on government contracts, according to the letter,” Bloomberg’s Noah Buhayar wrote on Aug. 22, 2013.
The company’s letter to the SEC answered all five of the agency’s factors for determining whether the primary business is investing. The SEC ruled that the Daily Journal was not and closed the matter.
Why Those 3 Stocks?
They were incredibly cheap at the time.
Munger is said to have purchased the Wells Fargo stock at $8 a share, ultimately spending $20 million of Daily Journal’s excess cash on several stocks including the three banks.
The marketable securities first appeared on Daily Journal’s balance sheet in Q2 2009. All $24.7 million of it invested in common stocks. By the end of fiscal 2009, its common stocks had grown to $47.9 million, or 57% of its total assets.
Most importantly, Daily Journal shareholders’ pretax gain on those common stocks was $32.4 million, a 209% return in six months.
Fast forward to Q4 2013, the first time it filed a 13F.
Three of the four stocks are still held today. According to the holdings report, it had 1.59 million WFC shares valued at $72.3 million, accounting for 61% of the 13F assets of $118.8 million. At the end of 2024, it had 1.41 million shares of Wells Fargo, valued at $99.2 million, with 180,000 shares sold over 11 years.
Talk about buy-and-hold.
It gets better.
As of Dec. 31, 2024, the fair value of the Daily Journal’s common stocks was $372.1 million, meaning that in addition to its U.S. holdings, the company held approximately $163 million in international stocks.
The gains on its common stocks? $233 million. It finished 2024 with its common stocks accounting for 90% of its total assets.
Sadly, since Munger’s passing, the Daily Journal has said it will move on from this minor quirk in its business, which generated significant growth in its asset base.
“Given the loss of Mr. Munger, the Company does not expect the future financial performance of its marketable securities portfolio to rival its past performance, stated pg. 17 of its 2024 10-K.
“Henceforth, the Company expects to manage and harvest its marketable securities portfolio primarily to support the further development of Journal Technologies and its business. The Company does not anticipate initiating new investments in public common stocks unrelated to its core businesses.”
It’s the end of an era.
The post The Late Billionaire Charlie Munger’s ‘Other’ Firm Has 97% of Its Investments in These 3 Stocks appeared first on 24/7 Wall St..
]]>Are cash-back credit cards “worth having or not”?
That’s the basic question arising out of our latest draw from the Reddit mailbag. Our inquirer today, let’s call him “Tim,” says he’s “considering applying for a cash-back credit card,” but hasn’t decided upon any particular card he wants, and in fact, isn’t 100% certain he wants a cash-back card at all.
It’s a common question, so let’s help Tim out by beginning with the basics before moving on to the decision-making.
What is a cash-back credit card?
A cash-back credit card is a credit card that counts up how much money you have charged to it, and pays you a percentage of that spending back in cash. Cash “rewards” can usually be redeemed in multiple ways, for example, as a “credit” on your account statement (reducing the size of your bill) or as a check for you to deposit, or as virtual money that you can spend to buy physical goods or services, or gift cards.
But basically, they’re giving you cash back, in one form or another.
How much cash? That depends, because different cards have different offers. In olden times, the standard rate of cashback was about 1% of your purchases (i.e. for every $1 you spent on your card, you’d get a penny back). As competition for card customers has increased, however, credit card companies have had to sweeten the pot significantly.
Today, I’d say about 1.5% is the standard cash-back offer, the de minimis below which you shouldn’t even bother applying for a cashback card. Many cards pay even more than 1.5%. For example Wells Fargo’s (NYSE: WFC) Active Cash, Citi’s Double Cash, Fidelity Awards, and SoFi’s (Nasdaq: SOFI) credit card all pay 2% (with some quirks related to exactly when and how you can claim your rewards). They also all charge no annual fee.

How to choose a cashback card
Which raises an important point. Cashback cards are really only “worth having” if they put more money in your pocket than they withdraw.
If you carry a balance on your card, for example, and are paying 20% interest on your debt, but getting only 1.5% or 2% cashback, it’s pretty obvious that you’re going to lose more money to interest payments than you gain from cash back” If this is the situation you’re in, forget about what specific kind of card to apply for. Pay off that debt first!
Likewise if you’re habitually late paying your credit card bill, late fees can eat up any cashback rewards you might be getting. Make sure you pay your bills on time, or no amount of cashback is going to help you.
And annual fees. Many cards charge fees for the privilege of using them. Some fees are small, $39 a year for example. Some are very large, ranging into the hundreds of dollars per year. If the amount of the fee you’re paying exceeds the amount of cash you’re getting back, you’re getting a bum deal.
The simplest solution (unless you actually enjoy pinching pennies and are skilled at working the system to get the best deal) is simply to ignore any cashback card offers that involve annual fees, and focus on those cards that don’t.

Picking a card for Tim
Circling back now to Tim and his particular situation, Tim says he “would mainly be using the card for things like utility bills, groceries and gas,” and he buys most of his groceries at Target (NYSE: TGT) and Walmart (NYSE: WMT). He “very rarely eat(s) out, (or goes) to the movies.” So basically, he’s looking for just “a recommendation for a good, all-around cash-back card,” and specifically, one that doesn’t limit cashback rewards for purchases at the big box stores.
This simplifies matters greatly.
Tim basically has two choices here. Either he can go for a card (like those noted above) that pays a generous 2% cashback on all his purchases (utilities, gas, and groceries included, and with no limits on purchases at Target and Walmart). Or he can get a bit more aggressive, and try to find a card that on average pays more than 2%.
How might Tim do that?
Many cashback cards take a low-high approach, offering for example a 1% minimum cashback on all purchases, but an above-average cashback rate on specific categories of spending. Capital One’s (NYSE: COF) Savor Card is a great example. Like its name implies, the Savor card’s rewards are skewed towards buying things you can eat, paying 3% cashback for grocery and restaurant purchases, but only 1% cashback for “everything else”. Other cards, such as the Chase Freedom card, pay cashback of 5% on categories of spending that change quarterly across the year.
Carrying multiple cards, and focusing your card usage, when spending on specific categories, on the cards that pay you the most in those categories, can easily lift you average cashback rate to 3% or better. It does take a bit of work, though, to get the balance just right, and you have to juggle more credit card bills this way.
If you, like Tim, are looking just for “a good, all-around cash-back card” that’s usable anywhere, just picking a 2% cashback card and being happy with good enough should do you just fine.
The post I’m considering applying for a cash back credit card but want the most recent information and guidance. Where should I start? appeared first on 24/7 Wall St..
]]>Your first job, your first apartment, your first credit card. Being a young adult in America involves a whole lot of firsts, and you’re expected to accomplish all of them shortly after graduating high school or, at the very least after leaving college.
And this is the situation facing our latest inquirer from the Reddit mailbag (let’s call him “Tim”).
Tim just “left” college (he dropped out after a year), which sounds like a setback, but Tim’s actually doing pretty alright for his age. Currently 19, he already has a job and is working on building up enough of a credit history to apply for his first real credit card.
He’s also got a couple of credit cards… sort of.
As Tim explains, his parents added him as an authorized user on their Shell Gas card at age 18, so he’s got the benefit of at least a year’s vicarious exposure to their credit history working for him now. He followed that up by applying for what he calls “a Paypal credit card that is specifically for online purchases (not the mastercard)” in his own right. That sounds like what PayPal (Nasdaq: PYPL) itself calls “PayPal Credit,” which it describes as a “revolving line of credit” and which is essentially a buy now, pay later (BNPL) credit plan. It’s not quite the same thing as a credit card, though, and may be easier to get than an actual credit card.
Which as it turns out, is what’s next on Tim’s to-do list.
A real credit card for Tim
Tim’s putting the PayPal BNPL plan to good use with occasional online purchases, which should help to build up his credit FICO score over time. Tim doesn’t do a whole lot of shopping online, however. He doesn’t do a whole lot of shopping, period (waytago, Tim!) actually, spending only about $300 a month, with the bulk of that going to restaurants and gas.
Most of these charges he pays with a debit card, which does nothing for his credit history, and also gives Tim nothing in the way of card “rewards,” whether of the points, miles, or cashback varieties. Recognizing that he’s therefore missing out on what is essentially free money, Tim would like to get a no annual fee rewards card that will help to defray the cost of what shopping he does do.
Now what kind of card should he try to get?

How to pick your first real credit card
Let’s first break the bad news to Tim: Getting a first credit card can be easier attempted than accomplished. Credit card companies are issued by banks after all, and banks famously prefer to lend money to people who don’t need it, as opposed to those that do.
Young adults like Tim, with limited credit history, often struggle to get approved for a first credit card. This struggle can be complicated, too, as applications (that are rejected) accumulate on their credit reports as “hard inquiries,” depressing the credit score and making it even harder to get the next application approved!
That said, Tim has made a good start, and has already made all the right moves he reasonably can be expected to have made, to increase his chances. Again, he’s started with becoming an authorized user on a parent’s card, he’s taken a job so that he can show some income, he’s proceeded to win at least some kind of credit line in his own name, and he’s accumulated a year or more of credit history to support his application.
So yes, I’m saying there’s a chance Tim will be approved.
With fingers crossed, therefore, what kind of card should Tim try to get?
Considering his young age, limited income, and limited spending, I see little reason to seek a travel rewards card at this time. Probably a card paying a modest cashback reward is a more useful tool for Tim. In the best possible world, he’d specifically want to get a no annual fee card which offers superior cashback rewards in the categories where he spends the most, specifically, restaurants and gas.
The good news here is that there are several possibilities to choose from.
Capital One (NYSE: COF) for example, offers a “Savor” credit card that pays 3% on restaurant purchases (and groceries as well), and 1% cashback on all other purchases. The “Freedom” credit card from Chase likewise pays 3% on restaurant purchases, with rotating categories (that sometimes include gas) paying 5% cashback.
An even better option might be Wells Fargo’s (NYSE: WFC) Autograph card, which pays 3 “points,” which can be converted into cash, for purchases of both gas and restaurant meals. Yet another option might be US Bank’s (NYSE: USB) Cash+ Signature card, which pays 2% cashback on both gas and restaurant purchases, plus 5% cashback on two other categories of spending, which the user can choose, and which can include such big-ticket items as cell phone service and home utilities.
That could come in handy when Tim moves on to his next big quest, after securing his first credit card: Moving out of his parents’ house, and getting his first apartment, too!
The post I’m a slight beginner. What is the best cash back credit card for me? appeared first on 24/7 Wall St..
]]>Wells Fargo & Co. (NYSE: WFC) is rewarding its shareholders once again with a quarterly dividend of $0.40, payable on Saturday, March 1. That is in line with the prior two payouts.
This bank posted better-than-expected quarterly earnings and is enthusiastic about its prospects for this year. The ongoing dividend payment underscores management’s commitment to delivering consistent value to investors.
Why Investors Like Dividends

Investors favor dividend stocks for two main reasons. The first is that they offer enticing total return potential. Total return is a comprehensive measure of investment performance that includes interest, capital gains, dividends, and distributions realized over time. In other words, the total return on an investment or a portfolio consists of income and stock appreciation. It is one of the most effective ways to boost the prospects of overall investing success.
Dividend stocks can also provide investors with a steady, reliable stream of passive income. Passive income is money that is earned with little to no ongoing effort, usually from assets that generate cash flow. This income can come from a variety of sources, including stock dividends. Generating passive income is a desirable financial strategy for those seeking to diversify their income streams or achieve financial independence.
Wells Fargo’s Dividend
This financial giant has paid a quarterly dividend since 1995. While the payout has varied, it has increased annually since late 2020, when the payout was $0.10. That works out to be a compound annual growth rate of more than 30% since 2020.
The current dividend yield is about 2.1%, which is lower than the industry and sector averages but higher than the S&P 500 average figure. Wells Fargo’s share price is around 367% higher since 2000. So, it has offered investors some growth along with income.
Wells Fargo, the Company
This financial services company provides diversified banking, investment, mortgage, and consumer and commercial finance products and services in the United States and internationally.
Its Consumer Banking and Lending segment offers diversified financial products and services for consumers and small businesses. Its offerings include checking and savings accounts, credit and debit cards, and home, auto, personal, and small business lending services.
The Commercial Banking segment provides financial solutions to private, family-owned, and certain public companies. Its offerings include banking and credit products across various industry sectors and municipalities, secured lending and lease products, and treasury management services.
The Corporate and Investment Banking segment offers a suite of capital markets, banking, and financial products and services. These include corporate banking, investment banking, treasury management, commercial real estate lending and servicing, equity, and fixed-income solutions, as well as sales, trading, and research capabilities services to corporate, commercial real estate, government, and institutional clients.
The Wealth and Investment Management segment provides personalized wealth management, brokerage, financial planning, lending, private banking, and trust and fiduciary products and services to affluent, high-net-worth, and ultra-high-net-worth clients.
Its headquarters are in San Francisco. The company was founded in 1852 to provide express and banking services to California in the gold rush era. Wells Fargo went public in June of 1972. It now is considered one of the “big four” American banks, along with these rivals:
Wells Fargo has been released from a handful of consent orders in the past month. Its chief financial offer recently predicted that artificial intelligence would affect every part of the company. The bank also recently recruited an advisor team from UBS. And it handily exceeded fourth-quarter earnings expectations and said it expects net interest income to be higher this year.
Wells Fargo, the Stock

The share price is 87% or so higher than five years ago, underperforming the S&P 500. The stock has outperformed the broader market year to date with about a 9% gain thus far. Shares recently hit an all-time high of $81.50. The mean price target is even higher at $84.48, which signals more than 10% upside in the coming 12 months. Fourteen of 23 analysts recommend buying shares, five of them with Strong Buy ratings. Barclays and Morgan Stanley each reiterated its Overweight rating last month.
Note that the stock used to be a Warren Buffett favorite, but Berkshire Hathaway sold off its Wells Fargo stake in 2022. Institutional investors hold more than 78% of the shares. Blackstone, FMR, and Vanguard have notable stakes. Note that more than 27 million shares, or almost 1% of the float, are held short. Also, there have been no notable insider transactions reported in the past few months.
Two Blue Chip Dividend Giants Make Up Almost 40% of Warren Buffett’s Portfolio
The post Wells Fargo Just Paid Investors: How Much Did They Get? appeared first on 24/7 Wall St..
]]>Credit card companies want your business. I mean, they really want it, and there’s a reason for that. Every time you use a credit card, the place you shop has to pay the credit card issuer (the bank) and the payment network (MasterCard (NYSE: MA), Visa (NYSE: V), or similar) stand in line to earn as much as 3% in various interchange, assessment, and processing fees. Card companies make even more money off card users, in the form of annual fees, cash advance fees, interest payments on card balances, late payment fees, foreign transaction fees, balance transfer fees, and on and on.
More fees than you can shake a proverbial stick at, probably.
All of which is to say, there’s a lot of revenue flowing into the credit card companies. Enough revenue that they can afford to kick back a goodly portion of this money to you, the customer, in order to win your business and keep the credit card game going. Knowing this, when a credit card company offers you a deal in the form of cashback, or “points,” or “miles” in an effort to win your business, it only makes sense that your answer should be: “yes, please.”
But how do you know which credit card deal to accept? How do you cut through the confusion of competing offers, often involving different levels of “rewards” for different kinds of spending, especially when the rewards often depending on the time of year? A good start is to make sure to carry around in your wallet at least one card that offers a decent cashback deal no matter what you buy, and no matter when you shop, all year round.
In fact, that’s exactly what our next inquirer from the Reddit mailbag is looking for.
For simplicity, let’s call our guest Redditor today “Samantha,” or “Sam” for short. Because her request today is mercifully short, sweet, and to the point:
“Just wonder if there is a No-Fee card that earns more than 1.5% cash back for ALL purchases, regardless categories?”
Ask and ye shall receive
And the answer to Sam’s query is even shorter: Yes, there is. In fact, there are several to choose from. Here’s just a sampling:
- Wells Fargo Active Cash from Wells Fargo (NYSE: WFC) pays 2% cash back on all categories of spending.
- Citi Double Cash is sponsored by Citigroup (NYSE: C), and pays 2% cash back in two stages, 1% immediately when you make your purchase, and 1% more when you pay your bill.
- Fidelity Awards links a credit card to a Fidelity investment account, and deposits 2% cash back in the latter for any purchase you make.
- SoFi similarly deposits 2% cashback into a SoFi (Nasdaq: SOFI) savings or checking account, assuming you have those.
- And arguably best of all is the Alliant Cashback card, sponsored by credit union Alliant. Open an account with them, and they’ll deposit 2.5% cashback in your account. (Don’t open a credit union account, though, and the reward drops to 1.5%).
None of these cards, by the way, charge an annual fee, which makes the 2% (or 2.5%!) rewards even sweeter, because you get to keep all the cash, and not have to hand back some of it, for the privilege of being able to collect any of it.

A little effort can yield a big payoff
Now, is this the best Sam can do, “just” 2%? Not necessarily, no. As multiple respondents on Reddit pointed out, many consumers can outperform 2% cashback by carrying multiple cards that pay better than 2% in specific categories.
For example, you might have one card that pays 3% cashback on restaurant purchases (such as the Chase Freedom card), a second that pays 3% on gas purchases (such as the Blue Cash Everyday card from American Express (NYSE: AXP)), and a third card that pays 5% on whatever eligible category of spending you spend most on in a month, up to $500, such as Citigroup’s Custom Cash Card. Average those three out, and the bulk of your spending in a month may well earn you more than 3% cash back, so more than a 50% improvement over a universal 2% cashback card.
Still, there’s something to be said for the simplicity of just sticking with a 2%-on-everything card. Not least the fact that it’s already 33% better than a 1.5%-on-everything card!
If there’s no more effort to apply for the one than the other, there’s really no reason why you shouldn’t take the card that pays you the most.
The post Which No-Fee credit card has the most cash back reward % for ALL purchases across the board, regardless categories? appeared first on 24/7 Wall St..
]]>24/7 Wall St. Key Points:
- Strong earnings were announced by big banks including JPMorgan Chase (NYSE: JPM), Bank of America (NYSE: BAC), Wells Fargo (NYSE: WFC), and Citigroup (NYSE: C), but now they seem fully valued
- With 4% dividend yields and exposure to quickly expanding markets, super regional banks including Comerica (NYSE: CMA), U.S. Bancorp (NYSE: USB), Regions Financial (NYSE: RF), and PNC Financial (NYSE: PNC) offer more appealing for investors today
- Also: most banks pay little to no interest, but one is paying 7-10x the national average, AND paying out $300 cash bonuses for new accounts today. Click here to learn more now.
Watch the Video
Transcript:
[00:00:04] Doug McIntyre: So the banks and the investment banks had really bust out earnings. I mean, blew them out, right? Every single one of the biggies. So what do you think happens to those stocks now?
[00:00:18] Lee Jackson: Well, you know, they did good in the fourth quarter. They did extremely well in the fourth quarter, and they had a lot of steam through the last half of last year.
[00:00:27] Lee Jackson: But they’re getting to the point where for the big money center banks. for for B of A and J.P. Morgan and Wells and City, they’re starting to get a little bit rich. I mean, and this is rich comparatively speaking, rich for a bank is 11 times earnings. You know, when, you know, six months ago, they were at nine times earnings or eight.
[00:00:45] Lee Jackson: But if you own them now, there’s no reason not to hold them, you know, because they’re solid good investments. But boy, if you’re looking at them now in terms of new money, I’d be careful.
[00:00:56] Doug McIntyre: If you like banking, where do you go?
[00:01:02] Lee Jackson: Well, we wrote about this recently on 24 7 Wall Street and one good place for people to look is the big super regional banks and that can be Comerica based down in Dallas, which has got a ton of business and the symbol for that is CMA on the New York Stock Exchange. Another good one is U. S Bank Corp
[00:01:26] Lee Jackson: They’re based up in Minnesota. They have that huge stadium that the Minnesota Vikings play in. And then also Regions Financial, which is also down here in the south and is all over the south and into Florida. And they all pay about a 4 percent dividend and t upside at this juncture a more total return potential than the big money sort of banks
[00:01:49] Doug McIntyre: Listen, I understand the blowout earnings with the biggies, but it sounds to me like there’s at least a chance that now all of that is priced in.
[00:01:57] Lee Jackson: Yeah, I think so. And you could probably even throw PNC up into the mix. Oh, sure. They’re like kind of a super regional based in Pittsburgh. And uh, the good thing about a lot of these banks, especially Comerica and Region’s Financial, is they’re in fast growing areas of the market very fast. And the, where all the people are moving and
[00:02:21] Lee Jackson: It’s strangely enough, same with with U. S. Bank up in Minnesota in the upper midwest region. Those are solid growth areas. So I think for people thinking about adding some financials, they may be the best place to go. And again, after every big run, maybe it’s smart to buy half of if you’re going to buy 200 by 100.
[00:02:42] Lee Jackson: And see how earnings go for everybody on the regional side. And then maybe add some more, but with a 4 percent dividend and some good upside potential, they could be the best area to look at in the financial sector.
The post Pay Attention, The Best Bank Investment Today Are ‘Super Regionals’ appeared first on 24/7 Wall St..
]]>JPMorgan Chase & Co. (NYSE: JPM) is rewarding its shareholders once again with a quarterly dividend of $1.25 per share, payable on Friday, Jan. 31. That is in line with the prior payout. The bank just posted record results, and the industry has been looking forward to the change of administration in Washington. The ongoing dividend payment underscores the JPMorgan management’s commitment to delivering consistent value to investors.
Why Investors Like Dividends
Investors favor dividend stocks for two main reasons. The first is that they offer enticing total return potential. Total return is a comprehensive measure of investment performance that includes interest, capital gains, dividends, and distributions realized over time. In other words, the total return on an investment or a portfolio consists of income and stock appreciation. It is one of the most effective ways to boost the prospects of overall investing success.
Dividend stocks can also provide investors with a steady, reliable stream of passive income. Passive income is money that is earned with little to no ongoing effort, usually from assets that generate cash flow. This income can come from a variety of sources, including stock dividends. Generating passive income is a desirable financial strategy for those seeking to diversify their income streams or achieve financial independence.
JPMorgan’s Dividend
JPMorgan has not cut its dividend since 2009, when the payout shrank from $0.38 a share to $0.05. The compound annual growth rate of the payout since then is 22.2%. The current dividend yield is about 1.9%, which is less than the industry and sector averages. It is also lower than those of the competitors listed below.
Note that JPMorgan’s share price has grown by more than 945% since 2009 as well, offering investors plenty of growth along with the income.
JPMorgan, the Company
This financial services company operates worldwide and is the result of the merger of several large U.S. banking companies. It is the largest bank in the United States and was the world’s largest bank by market capitalization in 2023.
The company offers deposit, investment, and lending products, cash management, and payments and services; mortgage origination and servicing activities; residential mortgages and home equity loans; and credit cards, auto loans, leases, and travel services to consumers and small businesses through bank branches, ATMs, and digital and telephone banking. It also provides investment banking products and services, as well as securities services, for asset managers, insurance companies, and public and private investment funds.
In addition, the company provides financial solutions to small and midsized companies, local governments, nonprofit clients, and large corporations, as well as investors, developers, and owners of multifamily, office, retail, industrial, and affordable housing properties. And the company offers retirement products and services, brokerage, custody, estate planning, lending, deposits, and investment management products to high net worth clients.
Its headquarters are in New York City, and the company was founded in 1799 by Aaron Burr. The current incarnation of the company went public in October of 1978. Now it competes with or is similar to, among others:
- Bank of America Corp. (NYSE: BAC)
- Citibank Inc. (NYSE: C)
- Morgan Stanley (NYSE: MS)
- Wells Fargo & Co. (NYSE: WFC)
JPMorgan crushed expectations in its recent quarterly report, including a record profit for 2024. Legendary CEO Jamie Dimon also recently suggested that he would step down in the next few years. Earlier in the year, the company agreed to pay $151 million to resolve five U.S. SEC enforcement cases, including allegations of misleading brokerage disclosures. Also, the company opened a new state-of-the-art office in Glasgow in the spring, and reportedly it is now looking at former Credit Suisse offices in London.
JPMorgan, the Stock
Shares of this Dow Jones industrial component are about 102% higher than five years ago, outperforming the S&P 500. The stock hit an all-time high of $270.68 after the earnings report, and it is up more than 11% year to date and over 54% higher than a year ago. The mean price target of $265.55 is less than the current share price. which suggests analysts see no upside in the next year, at least until targets are hiked. The consensus recommendation is to buy shares, including six Strong Buy recommendations. Barclays and UBS reiterated Buy-equivalent ratings recently, but Truist initiated coverage with a Hold rating.
The stock remains popular with hedge funds. Institutional investors hold almost 74% of the shares. BlackRock, State Street, and Vanguard have notable stakes. Note that more than 29 million shares, or about 1% of the float, are held short. Also, several executives have parted with shares this month.
Three Surprising Things Billionaires Look for in Dividend Stocks
The post JPMorgan Just Paid Investors: How Much Did They Receive? appeared first on 24/7 Wall St..
]]>Two Sigma Investments founders John Overdeck and David Siegel are worth an estimated $14 billion. The duo founded the company in 2001. In August 2024, they stepped down as co-CEOs, replaced by the company’s chief business officer, Carter Lyons, and Scott Hoffman, former chief administrative officer and general counsel of Lazard.
“The founders disagreed over myriad matters related to operations — including organizational and succession planning, defining roles and responsibilities for top executives, and the firm’s design and management structure, according to the filing,” Bloomberg reported on Jan. 9.
“Two Sigma’s biggest funds, Spectrum and Absolute Return Enhanced, respectively returned 10.9% and 14.3% last year, one of the people said. The funds mostly make quant equity wagers but also invest in other strategies.”
According to Bloomberg’s reporting, the two founders are headed to arbitration to try to settle their disagreements.
At the same time as the founders stepped down in August, the firm made some changes in Q3 2024 to its large, $46 billion portfolio.
Out were Intel (NASDAQ:INTC) and Johnson & Johnson (NYSE:JNJ). Bank of America (NYSE:BAC), one of America’s largest banks, took their place among the 3,000+ securities held.
Here’s why.
Key Points About This Article:
- Despite Two Sigma Investments feuding billionaire founders, it managed to make some significant moves in Q3 2024.
- It closed out positions in excess of $100 million in both Intel (NASDAQ:INTC) and Johnson & Johnson (NYSE:JNJ) in third quarter.
- It rolled the proceeds into Bank of America (NYSE:BAC), which overnight became the hedge fund’s largest bank stock.
- Sit back and let dividends do the heavy lifting for a simple, steady path to serious wealth creation over time. Grab a free copy of “2 Legendary High-Yield Dividend Stocks” now.
Intel Goes Away

Two Sigma uses sophisticated algorithms to power its trading. In addition to the $46 billion in its latest 13F holdings report, it also manages an additional $40 billion for some very wealthy clients.
With 3,085 securities held as of Sept. 30, no position accounts for more than 1% of its assets except for the SPDR S&P 500 ETF Trust (NYSEARCA:SPY) at 1.09%. In the third quarter the hedge fund cut its SPY weight by 237 basis points from 3.46% as of June 30.
Given the algorithmic nature of its trading, it suggests that the S&P 500 has gotten quite expensive, at least for the trading models anyway.
Between options and bonds owned in the portfolio, it’s not a straightforward task finding material stock moves, whether it be stock sales or purchases. However, of the equities held by Two Sigma in the third quarter, Intel and Johnson & Johnson stand out.
The former accounted for 0.37% of the portfolio at the end of Q2 2024, up from 0.19% in the previous quarter. The hedge fund added 3.32 million shares bringing its total to 5.19 million. It dumped them all in the third quarter.
Intel was and is significantly underperforming its peers, both financially and in the market. The last straw had to have been the Aug. 2 announcement by the chip maker that it was cutting 15% of its jobs, suspending its dividend, and forecasting lower than expected Q3 2024 results. Its shares lost 26% on the news.
Since the Aug. 2 news, its shares have moved sideways. The shares are likely dead money until a successor is named and investors like the choice.
No More J&J Either
As for healthcare, Two Sigma dumped its entire position in Johnson & Johnson in the third quarter, selling 649,754 shares for potential proceeds in excess of $100 million. The pharmaceutical and medical technologies business was the firm’s 110th largest position as of June 30.
It first acquired JNJ stock in Q2 2014. The estimated average price paid according to WhaleWisdom is $153.25. Its shares are currently below that. If I had to guess, the algorithmic modeling likely moved in and out of the position over the past decade, squeezing trading profits out of those moves.
The shares hit a 52-week high of $168.85 in early September. I wouldn’t be surprised if Two Sigma sold its JNJ at or near this high. It’s been dead money over the past five years, down 1%.
Combined with the Intel sale, the hedge fund generated over $200 million during the third quarter from closing out the two positions.
It rolled the proceeds into Bank of America.
Why Bank of America?
In the third quarter, Two Sigma purchased 5.68 million shares of BAC stock at an average price of $39.96. The move makes Bank of America the hedge fund’s 31st-largest position with a 0.49% weighting. Of the top 100 positions in the portfolio, 96 are stocks. All have market values of at least $100 million.
Bank of America isn’t the largest financial services stock, but it is the hedge fund’s most significant bank holding. The next largest position is Wells Fargo (NYSE:WFC) in 45th spot (0.17% weight) and that’s it for the top 100. That’s just two out of 13 financial services stocks in the top 100 holdings.
Two things come to mind.
First, it doesn’t see much to like about bank stocks at this point, or it would own more in the top 100. Secondly, BAC, and WFC to a lesser extent, are the large-cap bank stocks to buy if you are bullish about America’s largest lending institutions.
Analysts are generally optimistic about Bank of America’s future. Of the 24 covering its stock, 20 rate it a Buy, with a target price of $53, above its current share price. The analyst earnings per share estimate for 2025 and 2026 are $3.71 and $4.37, respectively. It trades at a reasonable 10.7 times the 2026 estimate.
Recently, Donald Trump alleged that the big banks, including Bank of America, discriminate against conservative voters, suggesting that they are purposely not lending to this particular group of people.
As the saying goes, “It’s a nothing burger.”
At least in the eyes of Two Sigma, one of the largest hedge funds in the U.S., Bank of America is a stock worth owning.
The post Two Sigma Sells These Stocks Amidst Departure of Billionaire Founders appeared first on 24/7 Wall St..
]]>Live Updates
Got $1,000? Before You Buy JPM, Read This
If you have cash sitting in your account right now, give this two minutes. After more than two decades of helping investors beat the market, our top analysts at 24/7 Wall St. put together a definitive report on the Top 10 Stocks To Buy Today. And JPM wasn't one of them.
They combed the entire market. It's not 10 ideas, not 10 stocks everyone is talking about, it's what their research points to as the 10 best stocks to buy right now, and it's free. Read more here and see which stocks made the list -->>
Magnificent 7 Check-In
With stocks rallying after today’s CPI number, let’s take a look at how the Magnificent 7 is performing.
- NVIDIA: 2.84%
- Microsoft: 2.53%
- Apple: 1.83%
- Meta Platforms: 4.26%
- Tesla: 5.76%
- Alphabet: 3.01%
- Amazon: 2.20%
In news around the Magnificent 7, NVIDIA is holding a Quantum Computing Day at it’s GTC event. The company may be reaching out an olive branch of sorts after comments from CEO Jensen Huang sent stocks in the sector plummeting.
Hyperscalers – Microsoft, Alphabet, and Amazon – may prove to be big winners if new AI regulations from the Biden Administration stick. Analysts on Wall Street have commented today that the regulations may serve as a form of “regulatory capture” that gives all three companies additional demand in the cloud computing space.
Sectors Outperforming Today
What sectors are performing well in a generally red-hot market day?
Communications Services (headlined by Meta Platforms and Alphabet) is up 2.3%. Financials are up 2.17% after a series of outstanding earnings we detailed below. Below those two sectors, Consumer Discretionary is up 2.08% and Information Technology is up 1.74%.
Even though markets are generally seeing outstanding returns today, two sectors are down. Health Care stocks are down .23% and Consumer Staples are down .21%.
It appears with interest rates falling, investors are moving from areas of safety (like Consumer Staples) back to more ‘risky’ segments of the market.
Have we already reached peak interest rates? After a CPI release that shows inflation running less hot than expected, the yield on 10-year Treasuries is plummeting. Yields now stand at 4.65%, a nearly 3% drop from yesterday.
And as yields on Treasuries drop, the market rises. The single biggest headwind to the market so far in 2025 is the belief that rising rates will slow economic growth. We’ll dive into today’s CPI data more below.
First, let’s check in on the performance of major indexes today.
- Nasdaq Composite: Up 414.91 (+2.17%)
- S&P 500: Up 94.64 (+1.62%)
- Dow Jones Industrial Average: Up 637.94 (+1.50%)
Here are the biggest stories driving the market today.
CPI Data Leads to Market Rally
The biggest storyline so far in 2025 is interest rates. After bottoming at 3.62% last September, the yield on 10-year Treasuries has been steadily on the rise. In recent days it set reached its highest point since 2023, breaking 4.8%.
The two numbers the market is focused on most closely are employment and inflation data. The belief is that if the job market continues showing significant strength and inflation stays elevated, the Federal Reserve will keep rates at their current level. Then with rates at their current level, the economy will be slow enough that corporate earnings will miss their estimates this year.
Yesterday wholesale inflation numbers were released that came in below expectations.
The big economic release today is CPI, which is the most broadly watched inflation figure. The headline figure is that CPI rose 2.9%, which is above recent readings (such as 2.4% in September). On the surface, that might sound bad, especially with the Federal Reserve having a target of driving inflation down to 2% over time.
However, digging into the number more, core inflation fell to 3.2%, which was below median expectations from economists. That’s the figure that Wall Street is focusing on today as the market resumes its rally.
As of this morning, it’s now implied that the Federal Reserve will cut rates twice in 2025. That’s a jump from recent expectations and why the market is on the rise today.
Big Banks Report Earnings
Earnings season kicked off today and the first group of companies reporting is heavily concentrated in the banking sector. We are following the results of these baking earnings in a separate live blog.
But the headline is the results have beat across the board.
JPMorgan saw profits soar 58% from last year, Wells Fargo saw a jump of 66%, Goldman Sachs EPS hit $11.95 versus an expectation of $8.22, and Citigroup reported an EPS of $1.34 versus estimates of $1.22.
JPMorgan Chase is currently up 1.6%, Goldman Sachs up 4.8%, Citigroup up 6.1%, and Wells Fargo up 6.1%.
The post Stock Market Today: Nasdaq Composite Rips Higher as Inflation Slows appeared first on 24/7 Wall St..
]]>Live Updates
Got $1,000? Before You Buy JPM, Read This
If you have cash sitting in your account right now, give this two minutes. After more than two decades of helping investors beat the market, our top analysts at 24/7 Wall St. put together a definitive report on the Top 10 Stocks To Buy Today. And JPM wasn't one of them.
They combed the entire market. It's not 10 ideas, not 10 stocks everyone is talking about, it's what their research points to as the 10 best stocks to buy right now, and it's free. Read more here and see which stocks made the list -->>
Checking in on Banking Performance
How are banks doing after earnings? Here’s a rundown of the sector:
- JPMorgan Chase: +1.68%
- Wells Fargo: +6.82%
- Citigroup: +7.09%
- Bank of New York Mellon: +7.98%
- Goldman Sachs: +5.88%
Clearly, investors are happy with earnings releases across the board today.
BlackRock seeing Strong Gains
BlackRock reported earnings this morning and is seeing strong gains as well. The company’s stock is currently up 3.65% in premarket trading.
The headline figure is $11.6 trillion. That’s the assets under management the company hit in the fourth quarter. Overall, earnings were up 21% from last year.
CPI Due at 8:30 a.m. ET
Banks are seeing strong price gains in premarket trading so far, but keep in mind that CPI numbers will release at 8:30 a.m. and could change the direction of the market.
Median headline CPI estimates stand at 2.9% while CORE CPI estimates are higher at 3.3%.
Watch whether we come at, below, or above those numbers and you’ll probably know where major indexes are headed today.
The list of banks reporting this morning is long. Here’s a snapshot of some of the major banking companies issuing earnings:
- JPMorgan Chase (NYSE: JPM)
- Wells Fargo (NYSE: WFC)
- BlackRock (NYSE: BLK)
- Citigroup (NYSE: C)
- Goldman Sachs (NYSE: GS)
- BNY Mellon (NYSE: BK)
Let’s look at the highlights of each earnings report and how the market is reacting. We will update this article throughout the day as Wall Street reactions come in and banking stocks continue to move.
JPMorgan Earnings
Another year, and another new record for JPMorgan Chase. The company is currently up about 1% in premarket trading as of 8 a.m. ET.
The highlight is revenue up 10% year-over-year. Here are some of their most important financials:
- Revenue of $43.74 billion (Estimates $41.7 billion)
- EPS of $4.81 (Estimates of $4.11)
- Commercial & Investment Banking Revenue Up 18% year-over-year
The highlight of JPMorgan’s earnings is the EPS number, which is up 58% year-over-year.
Jaime Dimon highlighted client asset inflows into their wealth management and payments revenues – saying the economy is “resilient.”
As we’ll see in other earnings, EPS numbers are beating by a significant amount at many banks, but JPMorgan’s revenue number stands out.
Wells Fargo Earnings
Wells Fargo is up 3% in premarket trading after announcing its own earnings. Net income rose by an impressive 66% from last year.
- Revenue of $20.38 billion (misses estimates of $20.59 billion)
- EPS of $1.43 (estimates of $1.34)
In their conference call, Wells Fargo CEO Carles Scharf called out net checking accounts as an area of strength.
However, the company also noted that while the economy is on firm footing, consumer confidence hasn’t led to an increase in borrowing.
Goldman Sachs Earnings
Goldman Sachs beat Wall Street estimates across the board and is up 2.35% in premarket trading.
- Revenue of $13.87 billion (versus estimates of $12.37 billion)
- EPS of $11.95 (versus estimates of $8.22)
- Global Banking & Markets revenue up 33% from last year driven by trading revenues.
Like other banks reporting this morning, Net Interest Income was strong, coming in at $2.35 billion, which was above Wall Street estimates.
Citigroup Earnings
Finally, let’s check in on Citigroup’s earnings. The company is seeing the strongest share price reaction in premarket trading, up nearly 4%. The story at Citigroup is the same as most other major banks: a big EPS beat.
- Revenue of $19.58 billion (versus estimates of $19.45 billion)
- EPS of $1.34 (versus estimates of $1.22)
- Declared a $20 billion share buyback program
Overall, it was a solid quarter for Citigroup. The company saw sales beat on Fixed Income and Equity trading, Investment Banking, and Markets.
Next year Net Interest Income (NII) should slow, but the company’s outlook of $84 billion in 2025 sales still topped estimates of $83.2 billion.
Come back to this page throughout the day as we’ll update as prices move and Wall Street weighs in with upgrades and downgrades.
The post Live Earnings Analysis: JPMorgan (JPM), Goldman Sachs (GS), Wells Fargo (WFC) and Other Banks Report appeared first on 24/7 Wall St..
]]>We have covered Jim Cramer for almost 20 years here at 24/7 Wall St., and like all opinionated Wall Street stock pickers, he has had more than his fair share of home runs and some swings and misses. One thing is for sure: His opinions, either good, bad, or indifferent, do not go unheard, as he has maintained one of the most prominent bully pulpits in the financial industry for years. So, with that in mind, when Cramer bellows from that bully pulpit, we listen.
With a career that started at Goldman Sachs, from the formation of his hedge fund, Cramer Berkowitz, to his founding of The Street, which he wrote for from 1996 to 2021, to his popular Mad Money show, Jim Cramer has something in his pocket that many on Wall Street do not have—access to almost everybody, regardless of their Wall Street status. As opposed to many who churn out Wall Street platitudes and stock-picking advice, Jim Cramer at least does the homework required for the masses who see him via television or the internet to get a reasonable look at what he is covering at any given time.
A recent article covering Cramer’s thoughts and the start of the fourth quarter 2024 earnings season on CNBC noted that he is optimistic about the sector’s top stocks in front of the large money-center banks that will report on Wednesday and Thursday this week. We screened the banks that will officially kick off the fourth-quarter earnings season, and four look like outstanding ideas to buy before the earnings release. All are rated Buy at top Wall Street firms we cover.
Bank of America
The company posted solid third-quarter results, so this week’s print should be interesting. It pays a solid 2.31% dividend and is looking to increase the repurchasing of its shares. Bank of America Corp. (NYSE: BAC) is a ubiquitous presence in the United States and is a bank and financial holding company.
Its segments include:
- Consumer Banking
- Global Wealth & Investment Management (GWIM)
- Global Banking
- Global Markets
The Consumer Banking segment offers a range of credit, banking, and investment products and services to consumers and small businesses.
The GWIM includes two businesses:
- Merrill Wealth Management, which provides tailored solutions to meet clients’ needs through a full set of investment management, brokerage, banking and retirement products
- Bank of America Private Bank, which provides comprehensive wealth management solutions
The Global Banking segment provides a range of lending-related products and services, integrated working capital management and treasury solutions, and underwriting and advisory services.
Global Markets segment offers sales, trading, and research services to institutional clients across fixed-income, credit, currency, commodity, and equity businesses.
The Truist Securities price target objective for the shares is $52.
Citigroup
This is a top money center bank, and Warren Buffett bought a massive $2.5 billion worth of stock in the summer of 2022. The stock pays a dependable 3.15% dividend. Citigroup Inc. (NYSE: C) is a leading global diversified financial service company that provides consumers, corporations, and governments with a broad range of financial products and services.
Citigroup offers:
- Consumer banking and credit
- Corporate and investment banking
- Securities brokerage
- Transaction services
- Wealth management services
Citi operates and does business in more than 160 countries/jurisdictions in North America, Latin America, Asia, Europe/Middle East and Africa (EMEA).
Trading at a reasonable 9.2 times estimated 2025 earnings; this company looks very reasonable in what remains a volatile stock market and in a sector that has lagged some in 2024 but looks to be gaining ground.
Bank of America has a Buy rating with a solid $95 target price.
PNC Financial Services
This bank has a vast client base, pays a hefty 3.27% dividend, and is among the top 10 largest U.S. banks by assets. Importantly, Jim Cramer feels the bank is a favorite among Wall Street analysts. PNC Financial Services Group Inc. (NYSE: PNC) operates through three segments:
- Retail Banking
- Corporate & Institutional Banking
- Asset Management Group
The company’s Retail Banking segment offers:
- Checking, savings, and money market accounts, as well as time deposits
- Residential mortgages, home equity loans, and lines of credit
- Auto loans, credit cards; education loans, and personal and small business loans and lines of credit
- Brokerage, insurance, and investment and cash management services
This segment serves consumer and small business customers through branches, digital channels, ATMs, and phone-based customer contact centers.
The Corporate & Institutional Banking segment provides:
- Secured and unsecured loans, letters of credit, and equipment leases
- Cash and investment management services
- Receivables and disbursement management services
- Funds transfer services
- International payment services
- Access to online/mobile information management and reporting
- Securities underwriting, loan syndications, customer-related trading
- Mergers and acquisitions and equity capital markets advisory-related services
- Commercial loan servicing and technology solutions.
It serves mid-sized and large corporations as well as government and not-for-profit entities.
PNC Financial Service Groups Asset Management Group segment offers:
- Investment and retirement planning, customized investment management, credit and cash management solutions, and trust management and administration services for high-net-worth and Ultra-high net worth individuals and their families
- Multi-generational family planning services for ultra-high-net-worth individuals and their families
It provides outsourced chief investment officers, custody, private real estate, cash and fixed-income client solutions, and retirement plan fiduciary investment services for institutional clients.
The Barclays target price objective for the buy-rated shares is $229.
Wells Fargo
With a solid 2.30% dividend and many headline issues in the rearview mirror, this money-center giant makes sense now. Wells Fargo & Co. (NYSE: WFC) is a financial services company that provides diversified banking, investment, mortgage, and consumer and commercial finance products and services in the United States and internationally.
The company operates through four segments:
- Consumer Banking and Lending
- Commercial Banking
- Corporate and Investment Banking
- Wealth and Investment Management
The Consumer Banking and Lending segment offers diversified financial products and services for consumers and small businesses. These include checking and savings accounts, credit and debit cards, and home, auto, personal, and small business lending services.
The Commercial Banking segment provides financial solutions to private, family-owned, and certain public companies. Its products and services include banking and credit products across various industry sectors and municipalities, secured lending and lease products, and treasury management services.
The Corporate and Investment Banking segment offers a suite of capital markets, banking, and financial products and services, such as:
- Corporate banking
- Investment banking
- Treasury management
- Commercial real estate lending and servicing
- Equity and fixed-income solutions
- Sales, trading, and research capabilities services to corporate, commercial real estate, government, and institutional clients
The Wealth and Investment Management segment provides wealth management, brokerage, financial planning, lending, private banking, and trust and fiduciary products and services to affluent, high-net-worth, and ultra-high-net-worth clients.
It also operates through financial advisors in brokerage and wealth offices, consumer bank branches, independent offices, and digitally through WellsTrade and Intuitive Investor.
Truist Financial has a Buy rating with an $82 target.
Four High-Yield Stocks With 7% and Higher Dividends Are 2025 Home Runs
The post Jim Cramer Positive on Top Blue Chip Bank Dividend Stocks: Buy These 4 Right Now Before Earnings appeared first on 24/7 Wall St..
]]>Investors love dividend stocks, especially the blue-chip variety, because they offer a significant income stream and have massive total return potential. Total return includes interest, capital gains, dividends, and distributions realized over time. In other words, the total return on an investment or a portfolio consists of income and stock appreciation. Blue chip stocks are shares of large, well-established companies considered less risky and more financially stable than other stocks. They are often industry leaders with strong brand names and reputations and a history of consistent growth.
24/7 Wall St. Key Points:
- Many are thinking it, but BofA Securities said it: No rate cuts for 2025
- The economists at the bank cited the ” Straw that broke the camels back was the huge December jobs report”
- With interest rates seemingly set unless there is a market crash, blue chip dividend stocks make sense now
- Does your portfolio have the proper allocation of blue chip dividend stocks? Now’s the time to meet with a financial advisor near you for a portfolio check-up. Click here to get started finding the right one for you. (Sponsored)
If the team of economists at BofA Securities is correct and rate cuts are over, it could also mean the two-year raging bull market is over. With the S&P 500 up over 20% for 2023 and 2024, the first time that has happened since the late 1990s, and trading at an enormous price-to-earnings ratio of 24.59, which has dropped some to start the year, we could be in for a sizable correction at some point.
We screened the most recent BofA Securities U.S. 1 list of top stock picks to start 2025, and five blue-chip dividend giants look like great ideas for growth and income investors who are wary of an overbought stock market. All are, of course, rated Buy and have solid upside to the assigned price targets.
Why do we cover blue-chip dividend stocks?
Blue-Chip dividend stocks provide investors with reliable streams of passive income. Passive income is characterized by its ability to generate revenue without requiring the earner’s continuous active effort, making it a desirable financial strategy for those seeking to diversify their income streams or achieve financial independence.
Chevron

This integrated giant is a safer way for investors looking to position themselves in the energy sector. It pays a rich 4.26% dividend. Chevron Corporation (NYSE: CVX) engages in integrated energy and chemicals operations worldwide through its subsidiaries.
The company operates in two segments:
- Upstream
- Downstream
The Upstream segment is involved in the following:
- Exploration, development, production, and transportation of crude oil and natural gas
- Processing, liquefaction, transportation, and regasification associated with liquefied natural gas
- Transportation of crude oil through pipelines
- Transportation, storage, and marketing of natural gas, as well as operating a gas-to-liquids plant
The Downstream segment engages in:
- Refining crude oil into petroleum product
- Marketing crude oil, refined products, and lubricants
- Manufacturing and marketing renewable fuels
- Transporting crude oil and advanced products by pipeline, marine vessel, motor equipment, and rail car
- Manufacturing and marketing of commodity petrochemicals, plastics for industrial uses, and fuel and lubricant additives
Chevron announced in 2023 that it has entered into a definitive agreement with Hess Corporation (NYSE: HES) to acquire all of the outstanding shares of Hess in an all-stock transaction valued at $53 billion, or $171 per share based on Chevron’s closing price on October 20, 2023. Under the terms of the agreement, Hess shareholders will receive 1.0250 shares of Chevron for each Hess share.
The transaction’s total enterprise value, including debt, is $60 billion. The Federal Trade Commission approved the deal last fall, and it should be completed by this summer.
Cisco
This legacy technology giant is close to reaching a 52-week high and offers a solid 2.75% dividend Cisco Systems, Inc. (NASDAQ: CSCO) designs, manufactures, and sells Internet Protocol-based networking and other products related to the communications and information technology industry in:
- The Americas
- Europe
- The Middle East
- Africa
- The Asia Pacific
- Japan
- China
The company also offers a switching portfolio that encompasses campus switching as well as:
- Data center switching
- Enterprise routing portfolio interconnects public and private wireline and mobile networks, delivering highly secure and reliable connectivity to campus, data center, and branch networks
- Wireless products include wireless access points and controllers
- Compute portfolio including the Cisco unified computing system, hyperflex, and software management capabilities, which combine computing, networking, and storage infrastructure management and virtualization
In addition, it provides Internet for future products consisting of:
- Routed optical networking
- 5G
- Silicon and optics solutions
- Collaboration products, such as meetings, collaboration devices, calling, contact centers, and communication platforms as a service
- End-to-end security product consists of network security, cloud security, security endpoints, unified threat management, and zero trust
- Optimized application experience products, including full-stack observability and network assurance
Further, the company offers a range of service and support options for its customers, including technical support, advanced services, and advisory services. It serves businesses of various sizes, public institutions, governments, and service providers.
Mid-America Apartment Communities

With rents soaring, this is an ideal stock for growth and income investors, and it pays a hefty 4.10% dividend. Mid-America Apartment Communities, Inc. (NYSE: MAA) is a real estate investment trust (REIT) focused on delivering full-cycle and superior investment performance for shareholders through the ownership, management, acquisition, development, and redevelopment of quality apartment communities, primarily in the Southeast, Southwest, and Mid-Atlantic regions of the United States.
As of June 30, 2024, the company was interested in 103,614 apartment units across 16 states and the District of Columbia, including communities currently in development.
The company posted very strong third-quarter results, as core funds from operations exceeded Wall Street expectations, driven by better-than-forecasted same-store net operating income. In addition, record low resident turnover and substantial collections contributed positively to the quarter’s performance.
Mid-America Apartment Communities also reported early positive trends in new lease pricing, suggesting that the worst pricing pressures from new supply may be behind them.
Sempra

Like the entire sector, this utility has run hard but still offers a solid 3.15% dividend. Sempra (NYSE: SRE) operates as an energy infrastructure company in the United States and internationally.
It operates through three segments:
- Sempra California
- Sempra Texas Utilities
- Sempra Infrastructure
The Sempra California segment provides San Diego County electric and natural gas services. As of December 31, 2023, it offered electric services to approximately 3.6 million people and natural gas services to approximately 3.3 million people, covering 4,100 square miles.
This segment owns and operates a natural gas distribution, transmission, and storage system that supplies natural gas. As of December 31, 2023, it serves a population of 21 million, covering 24,000 square miles.
The Sempra Texas Utilities segment engages in regulated electricity transmission and distribution. As of December 31, 2023, its transmission system included:
- 18,298 circuit miles of transmission lines
- 1,257 transmission and distribution substations
- Interconnection to 173 third-party generation facilities totaling 54,277 MW
- The distribution system included approximately 4.0 million points of delivery and consisted of 125,116 miles of overhead and underground lines.
The Sempra Infrastructure segment develops, builds, operates, and invests in energy infrastructure to help enable the energy transition in North American markets and worldwide.
Wells Fargo
With a solid 2.30% dividend and many headline issues in the rearview mirror, this money-center giant makes sense now. Wells Fargo & Company (NYSE: WFC) is a financial services company that provides diversified banking, investment, mortgage, and consumer and commercial finance products and services in the United States and internationally.
The company operates through four segments:
- Consumer Banking and Lending
- Commercial Banking
- Corporate and Investment Banking
- Wealth and Investment Management
The Consumer Banking and Lending segment offers diversified financial products and services for consumers and small businesses. These include checking and savings accounts, credit and debit cards, and home, auto, personal, and small business lending services.
The Commercial Banking segment provides financial solutions to private, family-owned, and certain public companies. Its products and services include banking and credit products across various industry sectors and municipalities, secured lending and lease products, and treasury management services.
The Corporate and Investment Banking segment offers a suite of capital markets, banking, and financial products and services, such as:
- Corporate banking
- Investment banking
- Treasury management
- Commercial real estate lending and servicing
- Equity and fixed-income solutions
- Sales, trading, and research capabilities services to corporate, commercial real estate, government, and institutional clients
The Wealth and Investment Management segment provides wealth management, brokerage, financial planning, lending, private banking, and trust and fiduciary products and services to affluent, high-net-worth, and ultra-high-net-worth clients.
It also operates through financial advisors in brokerage and wealth offices, consumer bank branches, independent offices, and digitally through WellsTrade and Intuitive Investor.
.
The post BofA Securities Says No Rate Cuts in 2025 – 5 Blue Chip Dividend Stocks Are Top Picks This Year appeared first on 24/7 Wall St..
]]>Bank of America Corp. (NYSE: BAC) is rewarding its shareholders once again with a quarterly dividend of $0.26, payable on Friday, Dec. 27. That is in line with the prior payout. Despite all the recent attention to Warren Buffett trimming his stake, the ongoing dividend payment underscores the management’s commitment to delivering consistent value to investors.
Why Investors Like Dividends
Investors favor dividend stocks for two main reasons. The first is that they offer enticing total return potential. Total return is a comprehensive measure of investment performance that includes interest, capital gains, dividends, and distributions realized over time. In other words, the total return on an investment or a portfolio consists of income and stock appreciation. It is one of the most effective ways to boost the prospects of overall investing success.
Dividend stocks can also provide investors with a steady, reliable stream of passive income. Passive income is money that is earned with little to no ongoing effort, usually from assets that generate cash flow. This income can come from a variety of sources, including stock dividends. Generating passive income is a desirable financial strategy for those seeking to diversify their income streams or achieve financial independence.
A Buffett Pick
Though Warren Buffett’s Berkshire Hathaway has long held a notable stake in Bank of America, the firm has been trimming those holdings this year. In fact, Berkshire Hathaway is no longer a beneficial owner, as the stake is now less than 10%. On last look, it owned 775 million shares, which makes it still the bank’s largest institutional holder. Buffett, who is renowned for value investing based on the financial health of a company, first invested in Bank of America in 2011.
Bank of America has increased its dividend annually since 2009. The current dividend yield is 2.3%, which is about the same as the industry average but less than the sector average. For Berkshire Hathaway, that works out to almost $1.0 billion in dividends annually.
The Company
The company provides banking and financial products and services for individual consumers, small and middle-market businesses, institutional investors, large corporations, and governments worldwide.
Its Consumer Banking segment offers traditional and money market savings accounts, certificates of deposit and IRAs, non-interest and interest-bearing checking accounts, credit and debit cards, residential mortgages, home equity loans, and automotive, recreational vehicle, and consumer personal loans.
The Global Wealth & Investment Management segment provides investment management, brokerage, banking, and trust and retirement products and services, as well as wealth management solutions, including specialty asset management services.
The Global Banking segment offers lending products and services, including commercial loans, leases, commitment facilities, trade finance, and commercial real estate and asset-based lending. It offers treasury solutions, such as treasury management, foreign exchange, short-term investing options, and merchant services, as well as working capital management solutions, debt and equity underwriting and distribution, fixed-income and equity research, and certain market-based services.
And its Global Markets segment provides market-making, financing, securities clearing, settlement, and custody services. It offers securities and derivative products, as well as risk management products using interest rate, equity, credit, currency and commodity derivatives, foreign exchange, fixed-income, and mortgage-related products.
Company headquarters are in Charlotte, North Carolina. It was founded in 1784, the first federally chartered joint-stock owned bank in the United States and only the second bank in the country to receive a charter. Now, it competes with or is similar to, among others:
- Citigroup Inc. (NYSE: C)
- JPMorgan Chase & Co. (NYSE: JPM)
- PNC Financial Services Group Inc. (NYSE: PNC)
- U.S. Bancorp. (NYSE: USB)
- Wells Fargo & Co. (NYSE: WFC)
The Republican takeover of Congress and the White House provided a boost to Bank of America stock and those of other big banks, as Wall Street looks forward to less regulation. Bank stocks are expected to be a top play in 2025. However, Bank of America is one of the big banks that the Consumer Financial Protection Bureau (CFPB) is suing over Zelle fraud.
The Stock
The share price is about 25% higher than five years ago, underperforming the S&P 500 in that time. However, in the past year, the stock is up more than 32%, about the same as the S&P 500. The recent 52-week high of $48.08 per share is less than the $49.13 consensus price target. Analysts anticipate that the share price will rise more than 12% in the next 52 weeks, and 15 out of 22 of them who follow the stock recommend buying shares. Although, Morgan Stanley did recently downgrade the stock to Equal Weight.
Institutional investors hold more than 63% of the shares. Besides Berkshire Hathaway, BlackRock, State Street, and Vanguard have notable stakes. Almost 75 million shares, or about 1% of the float, are held short.
Doing This Is the ‘Quickest Way to Get Poor’ According to Warren Buffett
The post Bank of America Just Paid Investors: Here’s How Much They Got appeared first on 24/7 Wall St..
]]>Since 1926, dividends have contributed approximately 32% of the total return for the S&P 500, while capital appreciations have contributed 68%. Therefore, sustainable dividend income and capital appreciation potential are essential for total return expectations. A study from Hartford Funds, in collaboration with Ned Davis Research, found that dividend stocks delivered an annualized return of 9.18% over the past half-century (1973-2023). Over the same timeline, this was more than double the annualized return for non-payers (3.95%).
24/7 Wall St. Key Points:
- 2024 will likely be the second straight year with huge double-digit gains.
- With a sea of change on the way when Donald Trump is elected, gains may taper next year.
- Now is an excellent time to do an end-of-the-year portfolio with a qualified financial advisor. Click here to learn how to find one. (sponsored)
We have covered the BofA Securities US 1 List of top stock picks for years, and investors who bought them have done exceptionally well. With the fourth quarter almost over and 2025 right around the corner, many investors are looking for safer ideas amid a sustained market rally. With major indices reaching all-time highs, we’ve identified five US 1 stocks that offer serious upside potential and pay substantial, reliable dividends.
The BofA Securities US 1 list is a collection of BofA Global Research analysts’ best investment ideas drawn from the firm’s universe of Buy-rated, U.S.-listed stocks, including American depository receipts (ADRs). The list is managed to provide superior long-term investment performance.
Why do we cover dividend stocks?
Dividend stocks provide investors with reliable streams of passive income. Passive income is characterized by its ability to generate revenue without requiring the earner’s continuous active effort, making it a desirable financial strategy for those seeking to diversify their income streams or achieve financial independence.
American Healthcare REIT

With an aging population, this is an outstanding idea with a rich 3.65% dividend. American Healthcare REIT Inc. (NYSE: AHR) is a self-managed real estate investment trust (REIT) that acquires, owns, and operates a diversified portfolio of clinical healthcare real estate properties, focusing primarily on outpatient medical buildings, senior housing, skilled nursing facilities, and other healthcare-related facilities.
Its properties are in 36 states, the United Kingdom, and the Isle of Man.
The California-based real estate investment trust reported $47.7 million, or 36 cents per share, in funds from operations during the third quarter versus the average estimate of three analysts that cover the company for funds from operations of 32 cents per share. The company expects full-year funds from operations from $1.40 to $1.43 per share.
Cisco
This legacy technology giant is close to reaching a 52-week high and offers a solid 2.80% dividend. Cisco Systems Inc. (NASDAQ: CSCO) designs, manufactures, and sells Internet Protocol-based networking and other products related to the communications and information technology industry in:
- The Americas
- Europe
- The Middle East
- Africa
- The Asia Pacific
- Japan
- China
The company also offers a switching portfolio that encompasses campus switching as well as:
- Data center switching
- Enterprise routing portfolio interconnects public and private wireline and mobile networks, delivering highly secure and reliable connectivity to campus, data center, and branch networks
- Wireless products include wireless access points and controllers
- Compute portfolio including the Cisco unified computing system, hyperflex, and software management capabilities, which combine computing, networking, and storage infrastructure management and virtualization
In addition, it provides Internet for future products consisting of:
- Routed optical networking
- 5G
- Silicon and optics solutions
- Collaboration products, such as meetings, collaboration devices, calling, contact centers, and communication platforms as a service
- End-to-end security product consists of network security, cloud security, security endpoints, unified threat management, and zero trust
- Optimized application experience products, including full-stack observability and network assurance
Further, the company offers its customers a range of service and support options, including technical support, advanced services, and advisory services. It serves businesses of various sizes, public institutions, governments, and service providers.
Mid-America Apartment Communities

With rents soaring, this is an ideal stock for growth and income investors, and it pays a hefty 3.75% dividend. Mid-America Apartment Communities Inc. (NYSE: MAA) is a REIT focused on delivering full-cycle and superior investment performance for shareholders through the ownership, management, acquisition, development, and redevelopment of quality apartment communities, primarily in the Southeast, Southwest, and Mid-Atlantic regions of the United States.
As of June 30, 2024, the company had an ownership interest in 103,614 apartment units, including communities currently in development, across 16 states and the District of Columbia.
The company posted very strong third-quarter results, as core funds from operations exceeded Wall Street expectations, driven by better-than-forecasted same-store net operating income. In addition, record low resident turnover and substantial collections contributed positively to the quarter’s performance.
Mid-America Apartment Communities also reported early positive trends in new lease pricing, suggesting that the worst pricing pressures from new supply may be behind them.
Sempra

Like the entire sector, this utility has run hard but still offers a solid 2.70% dividend. Sempra (NYSE: SRE) operates as an energy infrastructure company in the United States and internationally.
It operates through three segments:
- Sempra California
- Sempra Texas Utilities
- Sempra Infrastructure
The Sempra California segment provides San Diego County electric and natural gas services. As of December 31, 2023, it offered electric services to approximately 3.6 million people and natural gas services to approximately 3.3 million people, covering 4,100 square miles.
This segment owns and operates a natural gas distribution, transmission, and storage system that supplies natural gas. As of December 31, 2023, it serves a population of 21 million, covering 24,000 square miles.
The Sempra Texas Utilities segment engages in regulated electricity transmission and distribution. As of December 31, 2023, its transmission system included:
- 18,298 circuit miles of transmission lines
- 1,257 transmission and distribution substations
- Interconnection to 173 third-party generation facilities totaling 54,277 MW
- The distribution system included approximately 4.0 million points of delivery and consisted of 125,116 miles of overhead and underground lines.
The Sempra Infrastructure segment develops, builds, operates, and invests in energy infrastructure to help enable the energy transition in North American markets and worldwide.
Wells Fargo
With a solid 2.90% dividend and many headline issues in the rearview mirror, this money-center giant makes sense now. Wells Fargo & Co. (NYSE: WFC) is a financial services company that provides diversified banking, investment, mortgage, and consumer and commercial finance products and services in the United States and internationally.
The company operates through four segments:
- Consumer Banking and Lending
- Commercial Banking
- Corporate and Investment Banking
- Wealth and Investment Management
The Consumer Banking and Lending segment offers diversified financial products and services for consumers and small businesses. These include checking and savings accounts, credit and debit cards, and home, auto, personal, and small business lending services.
The Commercial Banking segment provides financial solutions to private, family-owned, and certain public companies. Its products and services include banking and credit products across various industry sectors and municipalities, secured lending and lease products, and treasury management services.
The Corporate and Investment Banking segment offers a suite of capital markets, banking, and financial products and services, such as:
- Corporate banking
- Investment banking
- Treasury management
- Commercial real estate lending and servicing
- Equity and fixed-income solutions
- Sales, trading, and research capabilities services to corporate, commercial real estate, government, and institutional clients
The Wealth and Investment Management provides wealth management, brokerage, financial planning, lending, private banking, and trust and fiduciary products and services to affluent, high-net-worth, and ultra-high-net-worth clients.
It also operates through financial advisors in brokerage and wealth offices, consumer bank branches, independent offices, and digitally through WellsTrade and Intuitive Investor.
The 3 Highest Yielding Dogs of the Dow Are December Holiday Bargains
The post 5 Top BofA Securities December Stock Picks Also Pay High-Yield Dividends appeared first on 24/7 Wall St..
]]>Key Points
- Credit Card reward programs are a big reason to use credit cards.
- There is no question that cash-back is king.
- Travel rewards still appeal to a large group of people.
- Also: Are You On Track to Retire? Take This Quiz and Find Out (Sponsored)
If there is one online shopping benefit that came out of the COVID pandemic, it’s that credit card use continued to climb. In 2016, around 31% of all purchases were handled with cash, and today, the number of purchases with cash is half what it was six years ago, to the tune of around 16%.
Along with battery security and purchase protection, credit card companies’ perks and rewards have only improved. As popular as travel rewards can be, cash-back cards have become the most popular option for many consumers, who can earn hundreds of dollars back every year.
Cash-Back Rewards Have Improved
One of the biggest reasons to favor cash-back rewards is how well the rewards have improved over time. There was a time not too long ago when the best cash-back cards offered at most were 1% cash-back on purchases. Today, cards like the Capital One Quicksilver and Chase Freedom Unlimited all offer 1.5% back on all purchases.
However, cards like Discover It can get even more interesting, which offer 5% rotating categories on gas, groceries, retail stores like Walmart, and more. With many of these cards allowing you no limits on cash-back rewards, you can shoot for the stars with your earning potential depending on how much you spend annually.
For example, if you spent $20,000 on your Chase Freedom Unlimited card, you could earn around $300. Alternatively, if you go for the Wells Fargo Active Cash card, which offers unlimited 2% cash rewards, you would have $400 in rewards. This is free money!
Rewards Are Easy to Claim
Another big benefit of a cash-back card over another reward type like travel is that the rewards are far easier to claim. Most credit card companies offer the option of putting your cash-back rewards toward your balance, sending you a check, or depositing the money in your bank account. In other words, the redemption rules are straightforward to follow and understand, as you have to claim the money and then spend it however you choose.
On the other hand, with a travel credit card, you have to jump through hoops to find the correct travel dates, choose only from the hotels listed, and pick from an airline the credit card partners with, etc.
This isn’t to say it’s impossible to book a once-in-a-lifetime trip, but receiving your cash-back rewards can take no time at all. Booking travel using something like the Capital One Venture card with accrued points takes much more time to think through, plan, and book.
Rotating Reward Categories
When you think about ways to boost your cash-back reward, something like the Chase Freedom card can do that. You will get 1.5% cash back on all your purchases, and over a year, rotating categories will help you earn even more. The benefits of these categories can help you double or even triple the value of your cash-back rewards at the end of any quarter and over 12 months.
For example, in the first quarter of 2024, Chase offered a 5% bonus on every grocery store purchase, fitness club membership, and spa service. The second quarter had 5% cash-back rewards on hotel, restaurant, and qualifying Amazon purchases.
Fast forward to the third quarter, and any purchase at a gas station, live entertainment, or movie theater earned 5% cash back. Last but not least, in the fourth quarter, you can get 4% cash back on purchases made at McDonald’s, pet shops, veterinary services, and even select charities.
Cash-Back Cards Are For Everyone
The good news for cash-back rewards cards is that there is something for everyone. If you love grocery shopping and often have big bills, something like the Blue Cash Preferred card from American Express might be the answer. This card earns 6% cashback up to $6,000 yearly in purchases at any US supermarket.
If you love going out all the time, the Capital One Savor Cash Rewards offers a 3% cash-back bonus on dining and entertainment. Of course, the Wells Fargo Active Cash Back rewards card is a good option for the all-around spender, allowing you to earn 2% cash back on every purchase. In other words, you earn $2 for every $100 you spend, which is hard to ignore.
Are you someone who shops at Walmart or Amazon? Both of their respective credit cards offer 5% cash back on all purchases, and if you’re anything like me and my family with Amazon, this quickly adds up over the year.
Best of all, only two or three cash-back rewards cards have an annual fee, including a few American Express cards and a few scattered others. Add the benefit of multiple sign-up bonuses that offer even more cash-back in your first 3 months, and the benefits of going with a cash-back rewards card are super clear.
Cash-Back Versus Travel Points
There is no question that the cash-back versus travel point argument isn’t going away in the credit card world. Both sides have plenty of supporters, and there are arguments in favor of both, even if we’re already proving that cash-back is king.
If you love to travel throughout the year, travel credit cards can be highly beneficial if you navigate the appropriate redemption guidelines. Travel credit cards can also offer better travel insurance and rental car protection, and some cards, like those from the airlines directly like American Airlines, Delta, or United Airlines, can even give you better boarding lines and access to their exclusive lounges.
However, it’s much easier to argue that cash-back rewards will benefit more people overall.
|
Cash-Back Credit Cards |
Travel Credit Cards |
|
|
Pros |
|
|
|
Cons |
|
|
The post I Like Credit Card Rewards as Much as Anyone – but Cash Back Cards Are Simply Better appeared first on 24/7 Wall St..
]]>24/7 Wall St. Insights:
- AbbVie (ABBV) took a big hit after an adult schizophrenia drug missed its primary endpoint in mid-stage trials.
- Analysts are now questioning the pharma’s pipeline, raising doubts about how much ABBV stock can grow.
- Sit back and let dividends do the heavy lifting for a simple, steady path to serious wealth creation over time. Grab a free copy of “2 Legendary High-Yield Dividend Stocks“ now.
Pharmaceutical giant AbbVie (NYSE:ABBV) has suffered a meltdown over the past week, with shares losing 15% of their value. Despite reporting earnings that beat on the top and bottom line and also announcing a new dividend increase, the collapse came after announcing its adult schizophrenia treatment emraclidine failed to meet is primary endpoint in Phase 2 trials.
Although drugmakers often miss in clinical trials, it was a significant failure for AbbVie because it had spent $8.7 billion acquiring the schizophrenia drug when it bought Cerevel Therapeutics last year.
It also comes as AbbVie is looking for new blockbuster drugs to replace its rheumatoid arthritis treatment Humira, which lost patent protection last year and is seeing incursions on sales by biosimilars from rivals like Amgen (NASDAQ:AMGN).
A double setback

In September, things were made worse as Bristol-Myers Squibb (NYSE:BMY) received Food & Drug Administration approval of its own schizophrenia therapy. Emraclidine had been seen as a way to keep pace in the space. When AbbVie purchased Cerevel, it said the biotech “positions us to deliver sustainable long-term performance into the next decade and beyond.”
Had the schizophrenia drug successfully completed its clinical trials, that may have been the case as it was deemed a potential best-in-class, next-generation antipsychotic treatment. With over 24 million potential patients globally, it offered significant growth potential for the pharmaceutical stock.
Now that it missed its endpoint, analysts are calling into question the rest of AbbVie’s pipeline.
Analysts for Wells Fargo (NYSE:WFC), for example, says the blow presents potential $25 to $30 per share downside risk to the stock even as Bristol-Myers Squibb earns $5 to $6 per share upside potential. Investors are right to wonder whether ABBV stock can rebound and eventually double in value going forward.
A history of strong shareholder returns
Over the past decade, the pharma has been a monster stock for investors, especially those who bought it for its dividend. ABBV had a total return of 827% over that period, nearly twice that of the S&P 500 and well ahead of Bristol-Myers Squibb’s 140% return.
AbbVie has raised its dividend at a torrid 15% compound annual growth rate (CAGR) for the last 10 years, though over the past five years it has been at a smaller 9% CAGR. Its most recent dividend increase was just 5.8% to $1.64 per share. That’s a healthy raise, but well below its five- and 10-year average.
The reason why is likely due to Humira. That had been its cash cow, generating over $19 billion in annual sales at its peak. Last year the arthritis drug generated $14.4 billion while over the first three quarters of 2024 they stand at $7.3 billion.
Although AbbVie is considered a Dividend King, it really gained entry to the club through the back door. Spinoff stocks are allowed to claim their former parent’s dividend history as their own, so AbbVie got admitted based on Abbott Labs (NYSE:ABT) record after being spun off in 2013. Still, AbbVie’s own record of increases has been impressive, though as we see it is slowing.
Key takeaways

Pharmaceuticals live and die by their drug pipelines. Even when they have winning therapies on the market, their path to long-term growth is through their bench of treatments in trial. Up until emraclidine’s failure, AbbVie was seen as having a fairly deep, robust bench.
Buying their way to pipeline strength is a typical strategy for pharma giant’s — Bristol-Myers had bought Karuna Therapeutics for $14 billion to acquire its schizophrenia drug — but it’s clear these acquisitions can go sideways very fast.
Now, I believe Wall Street is freaking out a bit too much over AbbVie’s pipeline. The pharma has over 90 therapies under development, more than half of which are in mid- to late-stage trials. It spent $7.8 billion on research and development last year.
A single failure should not undermine its entire drug portfolio. AbbVie has launched numerous solid drugs from its pipeline, including Skyrizi, which produced sales of $7.9 billion year-to-date; Rinvoq, with $4.1 billion in sales; and several others with more than $2 billion in sales each.
The emraclidine failure is a big blow, but I wouldn’t count AbbVie out at all. While its stock still trades at a premium, a further weakening in its price should be viewed as a buying opportunity, even if ABBV stock takes a while to finally hit $400 a share.
The post Can This Dividend King Ever Hit $400 After This Major Fail? appeared first on 24/7 Wall St..
]]>Key Points
- Large Cap financials underperformed for much of the last two years
- The biggest banks also have strong brokerage units
- Investors looking to add quality banking names may want to enlist the help of an experienced financial advisor. Click here to get started.
Since 1926, dividends have contributed approximately 32% of the total return for the S&P 500, while capital appreciations have contributed 68%. Therefore, sustainable dividend income and capital appreciation potential are essential for total return expectations.
A study from Hartford Funds, in collaboration with Ned Davis Research, found that dividend stocks delivered an annualized return of 9.18% over the past half-century (1973-2023). Over the same timeline, this was more than double the annualized return for non-payers (3.95%).
In a recent research note, the analysts at Goldman Sachs pointed out that many of the top hedge funds had been buying the shares of some of the top money center banks at the fastest pace in three years. The traders on Goldman Sachs’ prime brokerage desk reported that banks and trading companies were the most bought sectors in recent weeks. Many on Wall Street are pointing to a new era of lighter regulation as the wind behind the buying.
We screened our 24/7 Wall Street financial research database, looking for the top companies in the sector that also pay solid and dependable dividends. Four money center giants hit our screens, all rated Buy at major firms that we cover on Wall Street. In addition, all make sense for growth and income investors looking to add financial stocks to a well-rounded portfolio.
Why do we cover dividend stocks?
Dividend stocks provide investors with reliable streams of passive income. Passive income is characterized by its ability to generate revenue without requiring the earner’s continuous active effort, making it a desirable financial strategy for those seeking to diversify their income streams or achieve financial independence.
Bank of America
The company posted strong third-quarter results and pays a solid 2.30% dividend. Bank of America Corporation (NYSE: BAC) is a ubiquitous presence in the United States, providing various banking and financial products and services for:
- Individual consumers
- Small and middle-market businesses
- Institutional investors
- Corporations and governments in the United States and internationally
Bank of America operates 5,100 banking centers, 16,300 ATMs, call centers, and online and mobile banking platforms.
Bank of America has expanded into several new US markets, and its global scale ideally positions it to benefit from accelerating loan growth over the next two years. Moreover, unlike smaller peers, scale allows the bank to substantially increase investment over the next few years without notably jeopardizing returns, driving further market share gains.
Despite selling a large number of shares this year, Warren Buffett still owns 766,305,462 bank shares, 03% of the float, and 11.8% of Berkshire Hathaway’s portfolio.
Citigroup
Citigroup Inc. or Citi is an American multinational investment bank and financial services company in New York City.
This is another top bank that Warren Buffett owns. He bought a massive $2.5 billion worth of the shares in the summer of 2022. The stock pays a dependable 3.20% dividend. Citigroup Inc. (NYSE: C) is a leading global diversified financial service company that provides consumers, corporations, and governments with a broad range of financial products and services.
Citigroup offers:
- Consumer banking and credit
- Corporate and investment banking
- Securities brokerage
- Transaction services
- Wealth management services.
Citi operates and does business in more than 160 countries/ jurisdictions in North America, Latin America, Asia, Europe/Middle East and Africa (EMEA).
Trading at a reasonable 9.7 times estimated 2025 earnings, this company looks very reasonable in an expensive stock market and in a sector that has lagged some in 2024 but looks to be gaining ground in a big way.
JPMorgan Chase
This stock trades at a still reasonable 12.7 times estimated 2024 earnings. JPMorgan Chase & Co. (NYSE: JPM) is one of the leading global financial services firms and one of the largest banking institutions in the US, with about $3.9 trillion in assets. The company was formed through the merger of retail bank Chase Manhattan and investment bank JP Morgan.
The bank operates through four segments:
- Consumer and Community Banking (CCB)
- Corporate and Investment Bank (CIB)
- Commercial Banking (CB)
- Asset and wealth Management (AWM)
The CCB segment offers:
- Deposit, investment and lending products
- Cash management and payments and services
- Mortgage origination and servicing activities
- Residential mortgages and home equity loans
- Credit cards, auto loans, leases, and travel services to consumers and small businesses through bank branches, ATMs, and digital and telephone banking.
The CIB segment provides:
- Investment banking products and services, including corporate strategy and structure advisory
- Equity and debt market capital-raising services, as well as loan origination and syndication
- Payments, cash, and derivative instruments
- Risk management solutions, prime brokerage, and research.
This segment also offers securities services, including custody, fund accounting and administration, and securities lending products for asset managers, insurance companies, and public and private investment funds.
The CB segment provides financial solutions, including lending, payments, investment banking, and asset management to small and midsized companies, local governments, nonprofit clients, and large corporations, as well as investors, developers, and owners of multifamily, office, retail, industrial, and affordable housing properties.
The AWM segment offers multi-asset investment management solutions in equities, fixed income, alternatives, and money market funds to institutional clients and retail investors; retirement products and services; brokerage, custody, estate planning, lending, deposits, and investment management products to high-net-worth clients.
Wells Fargo
With a solid 2.30% dividend and many headline issues in the rearview mirror, this money-center giant makes sense now. Wells Fargo & Company (NYSE: WFC) is a financial services company that provides diversified banking, investment, mortgage, and consumer and commercial finance products and services in the United States and internationally.
The company operates through four segments:
- Consumer Banking and Lending
- Commercial Banking
- Corporate and Investment Banking
- Wealth and Investment Management
The Consumer Banking and Lending segment offers consumers and small businesses diversified financial products and services. These include checking and savings accounts, credit and debit cards, and home, auto, personal, and small business lending services.
The Commercial Banking segment provides financial solutions to private, family-owned, and certain public companies. Its products and services include banking and credit products across various industry sectors and municipalities, secured lending and lease products, and treasury management services.
The Corporate and Investment Banking segment offers a suite of capital markets, banking, and financial products and services, such as:
Corporate banking
- Investment banking
- Treasury management
- Commercial real estate lending and servicing
- Equity and fixed-income solutions
- Sales, trading, and research capabilities services to corporate, commercial real estate, government, and institutional clients
The Wealth and Investment Management segment provides wealth management, brokerage, financial planning, lending, private banking, and trust and fiduciary products and services to affluent, high-net-worth, and ultra-high-net-worth clients.
It also operates through financial advisors in brokerage and wealth offices, consumer bank branches, independent offices, and digitally through WellsTrade and Intuitive Investor.
The post Hedge Funds Are Buying These 4 Blue-Chip Dividend Bank Stocks Hand-Over-Fist appeared first on 24/7 Wall St..
]]>24/7 Wall St. Insights
- The fourth quarter is underway, and Wall Street is out with top stock picks.
- Stocks paying dividends should perform well as interest rates drop.
- Sit back and let dividends do the heavy lifting for a simple, steady path to serious wealth creation over time. Grab a free copy of “7 Things I Demand in a Dividend Stock,” plus get our two best dividend stocks to own today. Access two legendary, high-yield dividend stocks Wall Street loves.
Since 1926, dividends have contributed approximately 32% of the total return for the S&P 500, while capital appreciations have contributed 68%. Therefore, sustainable dividend income and capital appreciation potential are essential for total return expectations.
A study from Hartford Funds, in collaboration with Ned Davis Research, found that dividend stocks delivered an annualized return of 9.18% over the past half-century (1973-2023). Over the same timeline, this was more than double the annualized return for non-payers (3.95%).
With the fourth quarter underway, most of the top firms we cover on Wall Street are releasing their top stock ideas for the final three months of 2024. BofA Securities, whom we have covered for years, always has 10 new top picks at the start of every quarter. The 10 stocks, nine of which are Buy-rated, and one is Underperform-rated and ostensibly a short sale idea, are out, and we decided to screen the list for the top dividend ideas.
Three companies with serious upside potential to the BofA Securities price targets look like great ideas. As mentioned, all of them pay dependable dividends to shareholders.
Why do we cover dividend stocks?
Dividend stocks provide investors with reliable streams of passive income. Passive income is characterized by its ability to generate revenue without requiring the earner’s continuous active effort, making it a desirable financial strategy for those seeking to diversify their income streams or achieve financial independence.
Hasbro

With the holidays on the way and offering a hefty 3.85% dividend, this toy giant is a solid fourth-quarter idea. Hasbro Inc. (NYSE: HAS), together with its subsidiaries, operates as a toy and game company in:
- The United States
- Europe
- Canada
- Mexico
- Latin America
- Australia
- China
- Hong Kong
The company operates through Consumer Products, Wizards of the Coast, Digital Gaming, Entertainment, and Corporate and Other segments.
The Consumer Products segment sources, markets, and sells toy and game products. This segment also promotes its brands by out-licensing trademarks, characters, and other brand and intellectual property rights to third parties and selling branded consumer products such as toys and apparel.
Its toys and games include:
- Action figures
- Arts and crafts and creative play products
- Dolls, play sets, preschool toys, plush products
- Sports action blasters and accessories
- vehicles and toy-related specialty products
- Games and other consumer products
- Licensed products, such as apparel, publishing, home goods, electronics, and toy products.
The Wizards of the Coast and Digital Gaming segment promotes its brands by developing trading cards, role-playing, and digital game experiences based on Hasbro and Wizards of the Coast games.
The Entertainment segment develops, produces, and sells entertainment content, including film, television, children’s programming, digital content, and live entertainment.
The company sells its products to:
- Retailers
- Distributors
- Wholesalers
- Discount stores
- Specialty hobby stores,
- Drug stores
- Mail-order houses, catalog stores, department stores, and other traditional retailers
- e-commerce retailers, and directly to customers through its e-commerce websites under the Magic: The Gathering, Hasbro Gaming, Play-Doh, Nerf, Transformers, Dungeons & Dragons, Peppa Pig, and other brand names.
The BofA Securities price target is set at $90.
Starbucks
The ubiquitous coffee retailer has had a rough year, but with a new CEO and 2.35% dividend, this could be a home run total return idea. Starbucks Inc. (NASDAQ: SBUX), together with its subsidiaries, roasts, markets, and retails coffee worldwide.
The company operates through three segments:
- North America
- International
- Channel Development
Its stores offer:
- Coffee and tea beverages
- Roasted whole beans and ground coffee
- Single-serve products
- Ready-to-drink beverages
- Various food products, such as pastries, breakfast sandwiches, and lunch items
The company also licenses its trademarks through licensed stores and grocery and food service accounts.
Starbucks offers its products under these brands:
- Starbucks Coffee
- Teavana
- Seattle’s Best Coffee
- Ethos
- Starbucks Reserve
- Princi
BofA Securities has set a $118 price target for the shares.
Wells Fargo
With a solid 2.90% dividend and many headline issues in the rear-view mirror, this money-center giant makes sense now. Wells Fargo & Co. (NYSE: WFC) is a financial services company that provides diversified banking, investment, mortgage, and consumer and commercial finance products and services in the United States and internationally.
The company operates through four segments:
- Consumer Banking and Lending
- Commercial Banking
- Corporate and Investment Banking
- Wealth and Investment Management
The Consumer Banking and Lending segment offers diversified financial products and services for consumers and small businesses. These include checking and savings accounts, credit and debit cards, and home, auto, personal, and small business lending services.
The Commercial Banking segment provides financial solutions to private, family-owned, and certain public companies. Its products and services include banking and credit products across various industry sectors and municipalities, secured lending and lease products, and treasury management services.
The Corporate and Investment Banking segment offers a suite of capital markets, banking, and financial products and services, such as:
- Corporate banking
- Investment banking
- Treasury management
- Commercial real estate lending and servicing
- Equity and fixed income solutions
- Sales, trading, and research capabilities services to corporate, commercial real estate, government, and institutional clients
The Wealth and Investment Management segment provides wealth management, brokerage, financial planning, lending, private banking, and trust and fiduciary products and services to affluent, high-net-worth, and ultra-high-net-worth clients.
It also operates through financial advisors in brokerage and wealth offices, consumer bank branches, independent offices, and digitally through WellsTrade and Intuitive Investor.
The BofA Securities price target for the company is posted at $70.
Why Five Dividend Gold Stocks May Be the Best October Trade Ever
The post BofA Securities Has 3 Top Q4 Dividend US Stock Picks With Huge Upside Potential appeared first on 24/7 Wall St..
]]>Famed value investor Chris Davis runs Davis Selected Advisors, a hedge fund with $19.9 billion in assets under management.
While there are many value investors I admire, Davis is among my favorites. He is the grandson of one of the market’s greats, Shelby Davis, who turned a $50,000 grubstake into a $900 million fortune.
The heir to that investing tradition looks for durable, well-managed businesses trading at a discount to their intrinsic value. He then holds onto them for the long term. The average holding period of stocks in Davis Select Advisors is between five and seven years. He will only sell a stock if it achieves excessive valuations, exhibits declining fundamentals, or there is a negative change to the management team or its strategy.
There are over 100 stocks in his portfolio, but a good percentage of them are financial stocks, including Capital One Financial (NYSE:COF), Wells Fargo (NYSE:WFC), and Bank of America (NYSE:BAC). In the second quarter, Davis trimmed his position in every single bank stock except two. For them, he added more shares to his holdings. Let’s see why they might have merited greater love than their peers.
Key Points About This Article:
- Chris Davis runs the Davis Selected Advisors hedge fund and hails from a family famous for its value investing tradition.
- A significant percentage of Davis’s portfolio consists of bank stocks, but he only added to his position in two of them, while paring back all the others.
- If you’re looking for some stocks with huge potential, make sure to grab a free copy of our brand-new “The Next NVIDIA” report. It features a software stock we’re confident has 10X potential.
PNC Financial Services Group (PNC)
The first bank Davis bought more of was PNC Financial Services Group (NYSE:PNC), a regional bank located primarily in the east and midwest. It has dramatically increased its size over the years through acquisitions, most recently in 2021 when it acquired Banco Bilbao Vizcaya Argentaria’s (NYSE:BBVA) American banking business.
PNC has proved adept at integrating the commercial and retail banking operations of its targets and is a solid regional bank that was never at risk during last year’s financial market’s crisis that led to the collapse of Silicon Valley Bank and Signature Bank, and saw First Republic acquired by JPMorgan Chase (NYSE:JPM).
By acquiring BBVA, however, PNC sets itself apart from many of its regional banking peers. It has a greater national footprint and could see better than expected fee growth for years to come.
Davis owns $79 million dollars worth of PNC stock, or some 510,000 shares after adding an additional 11,000 shares to his holdings. He bought them at an average price of around $158.50 per share, giving him a a 15% gain on the new tranche. As his average buy-in price stands at $113 a share, he has a nice 62% gain going so far.
Since he was adding to his holdings, it appears he doesn’t see PNC Financial as being at an extreme valuation.
U.S. Bancorp (USB)
The other bank that Davis added to was U.S. Bancorp (NYSE:USB), another regional banking giant. There was some concern about the bank during last year’s crisis and it saw some customers flee with their deposits, but it was short-lived. U.S. Bancorp is in a much better position today.
Part of the worry was its purchase of Mitsubishi UFJ Financial Group‘s (NYSE:MUFG) Union Bank in late 2022. While the acquisition was a bit of poor timing considering the tumult to the industry that followed shortly after, U.S. Bancorp has seen its common equity Tier 1 ratio, or CET1, markedly improve.
The CET1 ratio measures a bank’s capital to its assets with a higher percentage being better. U.S. Bancorp’s ratio dropped from 9.7% to 8.4% after the acquisition, but it has been steadily rebuilding it. At the end of the second quarter, USB’s CET1 ratio stood at 10.3%, an improvement on the 10% it had after the first quarter’s close.
Davis owns 14.2 million shares of U.S. Bancorp stock, valued at $565 million. That makes it one of the billionaire investor’s top 10 holdings. He only added an additional 43,000 shares at around $42 a share. With USB trading around $45 a stub, he has a small gain on the tranche, though his overall buy-in is just under $46 a share so he is essentially breakeven at the moment.
The post Value Investor Chris Davis Cut All of His Bank Stock Holdings Except These Two appeared first on 24/7 Wall St..
]]>Michael Burry is best-known as the billionaire investor who correctly predicted the housing market crash in 2007 that was detailed in the book, The Big Short. It was subsequently made into a movie of the same name, but ultimately Burry understood the government’s subprime mortgage policies would wreck the housing market.
His Scion Capital hedge fund made nearly $1 billion in profits by betting against the housing market. Yet Burry is lesser known as the investor who also unwittingly sparked the meme stock craze.
Two years prior to the stock trading frenzy that erupted, Burry bought shares in GameStop (NYSE:GME) believing its shares were undervalued. He wrote to management several times and told them to buy back their shares and get their house in order.
After amassing a 5% stake in the company for about $14 million, he was joined by Chewy (NASDAQ:CHWY) founder Ryan Cohen who acquired a 13%, $76 million stake in the video game retailer in early 2021. That was picked up by traders on the Reddit (NASDAQ:RDDT) social media platform led by Keith Gill, better known as Roaring Kitty, who banded together to force a “gamma squeeze” on the stock.
GameStop stock ended up rocketing 2,500% higher. Although Burry did not stay in for the long haul, he profited by some $250 million off his $14 million investment.
Today, Burry runs Scion Asset Management that has $52.5 million in assets under management. It holds just nine stocks in its portfolio, but almost half (49%) is in just the three stocks listed below.
Key Points About This Article:
- Billionaire investor Michael Burry made his market on the investing world with his notable “big short” of the housing market during the 2007 financial crisis.
- He was also the catalyst for the meme stock trading frenzy a few years ago, but today his Scion Asset Management hedge fund is concentrated in just a handful of stocks.
- If you’re looking for some stocks with huge potential, make sure to grab a free copy of our brand-new “The Next NVIDIA” report. It features a software stock we’re confident has 10X potential.
Alibaba (BABA)

The largest holding in the hedge fund’s portfolio is Chinese e-commerce giant Alibaba (NYSE:BABA). Burry owns 155,000 shares valued at $11.2 million, which represents a 21% share of the total.
Burry began buying the stock late last year and has been steadily accumulating more shares each quarter. In the second quarter, he bought an additional 30,000 shares and has an average buy-in price of around $79 a stub. That’s about a 7% gain so far.
The stock is up 10% year-to-date though it is down 2.5% over the past 12 months. After undergoing intense regulatory scrutiny by Beijing several years ago that saw it fined $2.1 billion for monopolistic practices, the e-commerce leader recently completed a three-year “recertification process” that brought it back into regulatory compliance.
Alibaba has faced an intense competitive environment. Not only does it square off against JD.com (NASDAQ:JD), but upstarts such as Schein and PDD Holdings (NYSE:PDD) Temu have eaten into its market share. Growth is starting to return, but it will be slower going from here.
Shift4 Payments (FOUR)

Burry just acquired his first tranche of shares in fintech stock Shift4 Payments (NASDAQ:FOUR), buying 100,000 shares for $7.3 million, making it his second-largest holding at 14% of the total. With an average buy-in price of less than $70 a share, Burry is already sitting on a 19% gain.
Shift4 is a payments processing company that initially focused on the restaurant industry, but diversified its business so that hotels and resorts now account for one-third of the volume it processes. It has over 200,000 customers across the hospitality, leisure, restaurant, and retail industries.
FOUR stock is up 55% over the past year as volume and revenue has grown. Volume rose 50% in the second quarter to $40.1 billion leading to a 30% jump in revenue to $827 million. Profits grew 48% to $54 million resulting in adjusted EBITDA rising by a similar percentage.
Despite having nearly doubled from recent lows, Shift4 Payments is not overvalued. The stock goes for 17 times earnings estimates, less than twice sales, and 19x the free cash flow it produces. With Wall Street forecasting long-term earnings growth for the payments processor growing at an annual rate of 49%, there seems plenty of capital appreciation still in the cards.
Molina Healthcare (MOH)

The third-largest holding in Burry’s portfolio at just under 14% is Molina Healthcare (NYSE:MOH). It’s another new position for the billionaire investor who picked up 24,500 shares worth $7.3 million. He has an average buy price of $354 per share.
While MOH stock is essentially flat so far in 2024, the stock has jumped 26% off the lows it hit in July. Molina’s second-quarter earnings showed robust gains in revenue as premiums soared during the period helping to lift profits ahead of expectations. The health insurer saw its membership rolls grow across each of its business lines, but there are concerns about declining Medicaid enrollment.
Rival insurer Centene (NYSE:CNC) told a Wells Fargo (NYSE:WFC) conference it was experiencing lower Medicaid enrollments due to eligibility questions, and it sent shares of most insurers tumbling. The Wall Street Journal reports some 20 million people have been disenrolled from Medicaid over the past year, leaving insurers with higher-cost members, which is hitting profits.
Molina also reported higher Medicaid costs in the second quarter, but it expects that to be offset in the back half of the year. MOH stock has since regained all the lost ground after Centene’s statement. Shares trade at just 13 times estimates and a fraction of its sales, indicating plenty of upside is still available.
The post No Big Short Here: Michael Burry Put 50% of His Money in These 3 Stocks appeared first on 24/7 Wall St..
]]>Jim Cramer is probably the closest thing we have to stock market superstar influencer. The host of CNBC’s “Mad Money” show is entertaining and popular with a broad swath of investors who like his passion and showmanship. Arguably, the best-liked segment is his Lightning Round where he gives buy-sell-hold advice on viewer stock picks. Occasionally he’s even right!
There are many sites that track his stock picks and often people say you should do the exact opposite of what Cramer recommends. If he’s upbeat about a stock, you should sell it, and vice versa.
So even though he’s smart, articulate, and funny, should you be taking investment advice from him? Below are three stocks he is bearish on. Let’s see if you really should be contrarian and be a buyer instead.
Key Points About This Article:
- Mad Money host Jim Cramer is a popular figure among investors, but his showmanship turns off some who believe doing the exact opposite of his recommendation can be a successful investment strategy.
- Here are three companies the investing guru says to avoid, but let’s take a closer look and see whether you should really be buying them.
- If you’re looking for some stocks with huge potential, make sure to grab a free copy of our brand-new “The Next NVIDIA” report. It features a software stock we’re confident has 10X potential.
Citigroup (C)
A confused mind always says “no” is a salesman’s mantra to remind him to keep things simple. Cramer is confused about banking stock Citigroup (NYSE:C) and the relationship between its book value and the stock price. As a result, the Mad Money host says, “I’m going to say no” to the bank.
Cramer’s confusion is not unfounded. While Citigroup is a company in turnaround mode, the market has assigned a deeply discounted price on the stock, which trades at just a fraction of its book value. Yet therein lies the opportunities for investors.
No doubt Citi has its problems. It operates under consent orders from regulators and was recently admonished again by the Federal Reserve for making insufficient progress on data and risk management and was fined $60 million. Its global operations makes it a complex business, though it is in the process of simplifying its far-flung banking and investment arms.
The asset sales should help make more capital available to invest in the business while lowering the risk associated with it. And precisely because it is trading at such a discount to its tangible book value, it is a low bar to step over. It might not reach the premiums peers like JPMorgan Chase (NYSE:JPM) or Wells Fargo (NYSE:WFC) sport, but it presents some considerable upside from current levels.
Coca-Cola (KO)

Cramer has no hesitation with his recommendation against buying Coca-Cola (NYSE:KO) at these prices. While he admits the beverage stock is a good company overall, the stock-picking guru says, “Straight up, way too far, way too fast…Doesn’t work for me, let it come in.”
What Cramer is referring to is Coke enjoying fast growth this year relative to its earnings. KO stock is up 20% in 2024 and has jumped 16% in just the last six months, raising its valuation to more than 28 times earnings. Shares also go for more than 6 times sales and 33 times the free cash flow it produces.
Yet the reason Coca-Cola is enjoying such a strong run is the excellent earnings it has produced over the past few quarters. Management is now guiding full-year currency-adjusted earnings per share to grow between 13% and 15% over 2023.
While Cramer isn’t wrong about KO’s valuation, a long-term investor shouldn’t be too concerned about whether he can earn an extra point or two by waiting for a lower price. You could safely buy in now and still earn generous returns over the coming decades.
Viking Therapeutics (VKTX)

Biotech Viking Therapeutics (NASDAQ:VKTX) is the third stock Cramer isn’t hot on despite the bright future it holds. The stock guru says that even though its weight-loss drug currently in clinical trials looks good, “it costs so much money to build the factories, they’re going to have to get a takeover to be able to do that.”
Viking has made a big splash in the pool currently owned by Novo Nordisk (NYSE:NVO) and Eli Lilly (NYSE:LLY). These pharmaceutical giants are pulling in billions of dollars from their GLP-1 drugs Wegovy and Zepbound that result in dramatic weight loss by patients. Viking’s lead drug candidate VK2735 also targets the GLP-1 receptor, but it is a once-a-day pill rather than a weekly injection like the competition.
That opens up a much wider universe of potential patients than the pharma giants target. Although a number of biotechs (and the pharmas, too) are pursuing pill dosing options, the safety and tolerance of patients to Viking’s treatment is encouraging.
It also has other therapies under investigation. And though Cramer is correct that building out facilities is expensive, once Viking gains approval, financing shouldn’t be an issue. Further, a buyout also becomes a distinct possibility at that point. For all those reasons, Viking Therapeutics still looks like a buy.
The post Not So Fast Jim Cramer, You Should Buy These 3 Stocks He Says to Sell appeared first on 24/7 Wall St..
]]>The Federal Reserve will be holding its next meeting in just one week. The market is anticipating the central bank will cut interest rates for the first time in over a year. But while the rate cuts are expected, the announcement may spur a new growth spurt for stocks. This might not be an instance of buy the rumor, sell the news.
Although the market has been bouncing along at its top, the S&P 500 index is currently sitting 5% below its high. That’s because the economy has been giving mixed signals about whether a recession is in the cards. It explains why stocks could soar again if the Fed cuts rates. It could provide a needed lift to the economy.
Yet a lot of factors go into whether a stock will move higher or not. Ultimately, it’s the business that will determine which way its stock goes. So whether the central bank acts or not, Wells Fargo (NYSE:WFC) has identified the three growth stocks below as ones that will charge higher over the next year.
Key Points About This Article:
- The market is awaiting the Federal Reserve’s decision on interest rate cuts at its scheduled meeting next week, which could send the market higher if and when the central bank cuts rates.
- Ultimately, a stock’s growth will be its business fundamentals and Wells Fargo identified three growth stocks with average upside potential of 78% over the next year.
- If you’re looking for some stocks with huge potential, make sure to grab a free copy of our brand-new “The Next NVIDIA” report. It features a software stock we’re confident has 10X potential.
Alimentation Couche-Tard (ANCTF)

Many investors might not be familiar with Canadian convenience store operator Alimentation Couche-Tard (OTC:ANCTF), although there is a good chance they have visited one of its many stores.
While Couche-Tard is the c-store chain’s flagship brand in Quebec, it operates about 6,700 Circle K locations in the U.S., the largest independent convenience store operator in the country in terms of the number of company-operated stores. There are also some 500 Holiday stores in 10 states. Globally, it operates over 16,000 stores.
Shares of the c-store operator are down more than 3% in 2024 though they are up 8% over the last year. Wells Fargo recently raised its target price on its Toronto Stock Exchange-traded stock from $86 Canadian to $88 Canadian. Couche-Tard also trades over-the-counter in the U.S. under the ticker symbol ANCTF. The target price implies 77% upside in the stock.
Although Couche-Tard’s earnings results have been hit-or-miss in recent quarters, the company is attempting to acquire Japan’s 7-Eleven chain owner Seven & i Holdings (OTC:SVNDY) for $38.5 billion. The Canadian company wants to increase EBITDA by 11.7% per year through 2028, and last quarter EBITDA actually fell. Its takeover offer was also rejected, but Couche-Tard is not giving up.
Still, any deal might have difficulty passing regulatory muster under the Biden administration as 7-Eleven is the largest c-store chain in the U.S. by stores. Despite the industry being highly fragmented, the Federal Trade Commission has an almost knee-jerk aversion to large mergers.
Nvidia (NVDA)
Certainly not an unknown quantity, chipmaker Nvidia (NASDAQ:NVDA) also got a price target increase from Wells Fargo. The stock has lost 26% of its value after reaching an all-time high and becoming the world’s most valuable company in June. It has since fallen back to third place behind Apple (NASDAQ:AAPL) and Microsoft (NASDAQ:MSFT).
Wells Fargo raised its price to $165 per share from $155 after Nvidia trounced analyst expectations in the second quarter and raised its guidance for the third quarter ahead of forecasts. At just under $103 per share, the new price target implies 60% upside remains in the stock.
Data center adoption of Nvidia’s artificial intelligence chips continues to add billions of dollars to the chipmaker’s top line and will continue to do so for the foreseeable future. A recent wrinkle, though, was the Justice Dept. sending Nvidia a subpoena as it investigates possible antitrust practices. Rivals have complained Nvidia is using its market positioning to unfairly gain business.
While the subpoena adds uncertainty to Nvidia’s sustained growth, the long-term adoption of AI and the ability of data centers to continue spending the way they have creates further opaqueness to Nvidia’s growth potential.
Crescent Energy (CRGY)

Crescent Energy (NASDAQ:CRGY) is a small, but fast-growing integrated oil and gas company operating primarily in the Eagle Ford Shale region of Texas. It is not content to stay small, though, and is pursuing a growth-by-acquisition strategy, including its announcement last week that it would purchase a private operator in the region for $168 million. The deal adds 30 new locations to Crescent’s existing portfolio as well as 5,300 net royalty acres of minerals, surface, and midstream assets.
The oil and gas stock also recently closed on its $2.1 billion acquisition of another Eagle Ford operator, SilverBow Resources. The region is strategically important because of its ability to produce both natural gas and more oil than other shale plays.
Wells Fargo nudged its Crescent Energy target price higher by $1 to $21 per share on the new acquisition deal. As it will pay for the private operator in cash, it indicates the oil and gas stock has the financial wherewithal to finance its growth strategy. Crescent, though, trades at less than $11 per share, implying better than 96% upside in the stock over the next year.
As there remains a long tail to fossil fuel demand, Crescent Energy stock looks attractive at just 6 times next year’s earnings, a fraction of its sales, and a minuscule 3.5 times free cash flow.
The post Wells Fargo Says Buy These 3 Stocks for 78% Returns appeared first on 24/7 Wall St..
]]>24/7 Wall St. Insights
- Quality dividend stocks can deliver dependable passive income for years.
- Dividend stocks could get a big boost as interest rates come down over the next two years.
- Take advantage of this incredible free report: Access 2 legendary, high-yield dividend stocks Wall Street loves.
Since 1926, dividends have contributed approximately 32% of the total return for the S&P 500, while capital appreciations have contributed 68%. Therefore, sustainable dividend income and capital appreciation potential are essential for total return expectations.
A study from the Hartford Funds, in collaboration with Ned Davis Research, found that dividend stocks delivered an annualized return of 9.18% over the past half-century (1973 to 2023). Over the same timeline, this was more than double the annualized return for non-payers (3.95%).
Not only do quality dividend stocks deliver total return potential, but they are also a tremendous vehicle for generating passive income. Passive income is characterized by its ability to generate revenue without requiring the earner’s continuous active effort, making it a desirable financial strategy for those seeking to diversify their income streams or achieve financial independence.
We screened our 24/7 Wall St. dividend stock research database looking for companies that investors could buy today and safely hold forever. Six magnificent dividend stocks that investors can buy and hold forever made the cut, and all are rated Buy at major Wall Street firms. In addition, check out this incredible free report covering dividend legends.
Altria
This tobacco company offers value investors a great entry point. Now trading at a cheap 8.8 times estimated 2025 earnings, it pays a rich 8.16% dividend. Altria Group Inc. (NYSE: MO) manufactures and sells smokable and oral tobacco products in the United States through its subsidiaries.
The company provides cigarettes primarily under the Marlboro brand, as well as:
- Cigars and pipe tobacco, principally under the Black & Mild brand
- Moist smokeless tobacco and snus products under the Copenhagen, Skoal, Red Seal, and Husky brands
- on! Oral nicotine pouches.
It sells its tobacco products primarily to wholesalers, including distributors and large retail organizations, such as chain stores.
Altria used to own over 10% of Anheuser-Busch InBev, the world’s largest brewer. The company sold 35 million of its 197 million shares through a global secondary offering. That represents 18% of their holdings but still leaves 8% of the outstanding shares in their back pocket. They also announced a $2.4 billion stock repurchase plan partially funded by the sale.
Bristol-Myers Squibb
This top company remains a solid pharmaceutical stock to own long-term, offering an outstanding entry point and a massive 5.83% dividend. Bristol-Myers Squibb Co. (NYSE: BMY) discovers, develops, licenses, manufactures, and markets pharmaceutical products worldwide.
The company offers products in:
- Hematology
- Oncology
- Cardiovascular
- Immunology therapeutic classes
Bristol-Myers Squibb products include:
- Revlimid, an oral immunomodulatory drug for the treatment of multiple myeloma
- Opdivo for anti-cancer indications
- Eliquis, an oral inhibitor indicated for the reduction in risk of stroke/systemic embolism in NVAF and for the treatment of DVT/PE
- Orencia for adult patients with active RA and psoriatic arthritis, as well as reducing signs and symptoms in pediatric patients with active polyarticular juvenile idiopathic arthritis
The company also provides:
- Sprycel for the treatment of Philadelphia chromosome-positive chronic myeloid leukemia
- Yervoy for the treatment of patients with unresectable or metastatic melanoma
- Abraxane, a protein-bound chemotherapy product
- Implicit for the treatment of multiple myeloma
- Reblozyl for the treatment of anemia in adult patients with beta-thalassemia
Comcast
This top media and entertainment company remains a Wall Street favorite and pays a solid 3.18% dividend. Comcast Corp. (NYSE: CMCSA) is a global media and technology company.
It operates through four segments:
- Residential Connectivity & Platforms
- Business Services Connectivity
- Media, Studios
- Theme Parks segments
The Residential Connectivity & Platforms segment provides residential broadband and wireless connectivity services, residential and business video services, sky-branded entertainment television networks, and advertising.
The Business Services Connectivity segment offers connectivity services for small business locations, which include broadband, wireline voice, and wireless services, as well as solutions for medium-sized customers and larger enterprises and small business connectivity services in the United Kingdom.
The Media segment operates NBCUniversal’s television and streaming business, including:
- National and regional cable networks
- The NBC and Telemundo broadcast networks
- Owned local broadcast television stations
- Peacock, a direct-to-consumer streaming service
It also operates international television networks comprising the Sky Sports and other digital properties.
The Studios segment operates NBCUniversal and Sky film and television studio production and distribution operations.
The Theme Parks segment operates Universal theme parks in:
- Orlando, Florida
- Hollywood, California
- Osaka, Japan
- Beijing, China
Dominion Energy

Many of the Wall Street firms we cover are still very positive on utilities despite the sharp move higher this year, and this company pays a strong 5.21% dividend. Dominion Energy Inc. (NYSE: D) operates through four segments:
- Dominion Energy Virginia
- Gas Distribution
- Dominion Energy South Carolina
- Contracted Assets
The Dominion Energy Virginia segment generates, transmits, and distributes regulated electricity to residential, commercial, industrial, and governmental customers in Virginia and North Carolina.
The Gas Distribution segment engages in
- Regulated natural gas gathering
- Transportation
- Distribution and sales activities
- Distributes nonregulated renewable natural gas
This segment serves residential, commercial, and industrial customers.
The Dominion Energy South Carolina segment generates, transmits, and distributes electricity and natural gas to residential, commercial, and industrial customers in South Carolina.
The company’s portfolio of assets included approximately:
- 30.2 gigawatts of electric generating capacity
- 10,500 miles of electric transmission lines
- 85,600 miles of electric distribution lines
- 94,200 miles of gas distribution lines
Dominion serves approximately 7 million customers.
Exxon Mobil
The slow but steady increase in oil prices still offers investors an excellent entry point, and they will gladly grab a strong 3.27% dividend. Exxon Mobil Corp. (NYSE: XOM) is the world’s largest international integrated oil and gas company, exploring for and producing crude oil and natural gas in:
- The United States
- Canada/South America
- Europe
- Africa
- Asia
- Australia/Oceania
Exxon Mobil also manufactures and markets commodity petrochemicals, including olefins, aromatics, polyethylene and polypropylene plastics, and specialty products, and transports and sells crude oil, natural gas, and petroleum products.
Top Wall Street analysts expect the company to remain a key beneficiary in a higher oil price environment, and most remain very optimistic about the company’s sharp positive inflection in capital allocation strategy, upstream portfolio, and leverage to a further demand recovery.
Exxon Mobil offers greater Downstream/Chemicals exposure than its peers.
Exxon Mobil has completed its purchase of oil shale giant Pioneer Natural Resources Company in a $59.5 billion all-stock purchase. The deal created the largest U.S. oil field producer and guaranteed a decade of low-cost production.
Wells Fargo
This money center giant posted very solid results for the quarter, looks ready to break out to new highs, and offers a dependable 2.32% dividend. Wells Fargo & Co. (NYSE: WFC) is a financial services company that provides diversified banking, investment, mortgage, and consumer and commercial finance products and services in the United States and internationally.
The company operates through four segments:
- Consumer Banking and Lending
- Commercial Banking
- Corporate and Investment Banking
- Wealth and Investment Management
The Consumer Banking and Lending segment offers diversified financial products and services for consumers and small businesses. Its financial products and services include checking and savings accounts, credit and debit cards, and home, auto, personal, and small business lending services.
The Commercial Banking segment provides financial solutions to private, family-owned, and specific public companies. Its products and services include:
- Banking and credit products across various industry sectors and municipalities
- Secured lending and lease products
- Treasury management services
The Corporate and Investment Banking segment offers a suite of capital markets, banking, and financial products and services, such as:
- Corporate banking
- Investment banking
- Treasury management
- Commercial real estate lending and servicing
- Equity, and fixed-income solutions, as well as sales, trading, and research capabilities services to corporate, commercial real estate, government, and institutional clients
The Wealth and Investment Management segment provides personalized wealth management, brokerage, financial planning, lending, private banking, and trust and fiduciary products and services to affluent, high-net-worth, and ultra-high-net-worth clients.
∴
The post 6 Magnificent Dividend Stocks to Buy Now and Hold Forever appeared first on 24/7 Wall St..
]]>ETFs have become an exceptionally popular choice for investors seeking diversification and exposure to large market segments.
Thematic ETFs, like the iShares S&P 500 Value ETF (NYSE: IVE), capture investor interest in specific market segments, while established broad market options like the Vanguard S&P 500 ETF (NYSE: VOO) provide a proven approach to diversification. Choosing between these two types of ETFs can be challenging, to say the least.
This article is here to help you do just that, though. While VOO offers a diversified, low-cost approach to the S&P 500, IVE focuses on value stocks within the S&P 500, potentially offering a higher-reward, higher-risk option.
We’ll take a look at things like investment focus and historical performance to help you choose between them.
What is VOO?
The Vanguard S&P 500 ETF tracks the performance of the Standard & Poor’s 500 Index (S&P 500). This index tracks the 500 largest publically traded companies in the U.S. When you invest in VOO, you gain exposure to a broad range of established and well-known companies across several American sectors.
VOO provides instant diversification across the US stock market, reducing your overall risk. The S&P 500 also has a very long history of growth, making VOO relatively stable compared to other investment choices.
That said, VOO does have some limited growth potential. It’s not focused on growth companies, which may grow more than established companies. However, that also makes VOO less risky, so there is a trade-off.
What is IVE?
The iShares S&P 500 Value ETF takes a more specific approach to the US market than VOO. IVE tracks the S&P 500 Value Index but focuses specifically on value stocks. These stocks have a lower price compared to their earnings and other factors. There is potential in these stocks for both growth, though this isn’t guaranteed.
While IVE does look at growth stocks, it’s still tethered to the S&P 500. Therefore, it doesn’t grow as much as some other ETFs that just focus on all growth stocks.
IVE offers diversification like all other ETFs, but it can be a bit more volatile. It also has a potentially lower trading volume, which can somewhat impact the ease of buying and selling shares.
IVE vs. VOO: Which Fund is Right for You?
Fees
Every ETF has an expense ratio, which pays for the fund’s management. These fees directly reduce the profits you keep, so they’re very important to consider.
Luckily, IVE and VOO have low expense ratios, making them cost-effective investments. Currently, IVE’s expense ratio is 0.18%, while VOO’s is 0.03%. As you can see, while they’re both pretty low, VOO has a much lower expense ratio. Depending on how much you invest and how long you hold the stock, this difference can add up to thousands of dollars.
If you want the absolute cheapest option, VOO is the best choice. It beats IVE quite a bit in terms of expense ratio!
Risk
Both VOO and IVE are inherently exposed to market risk, meaning their performance will be impacted by overall market fluctuations. This is true of most investments, after all! However, some investments are riskier than others.
To figure out exactly how volatile these ETFs are, let’s explore the concept of Beta. Beta is a measurement of a stock’s fluctuations compared to the overall market. The market has a baseline Beta of 1. If a stock has a Beta of more than one, that means it moves more than the baseline. If a stock has a Beta of less than one, it means it moves less than the baseline.
Very volatile stocks tend to be riskier than less volatile stocks. Luckily, neither of these stocks is incredibly volatile. VOO has a Beta of close to 1, as it tracks the market very well.
IVE has an even lower Beta despite its focus on value stocks. It’s Beta is 0.88. While that does make it less risky, it also means it likely won’t grow as much as VOO. You’ll need to consider your risk tolerance.
Historical Performance
Fees and risk are important, but you should also look at historical performance. How an ETF has looked in the past can mirror how it will act. However, past performance is not necessarily indicative of future results. Many “safe” stocks with strong historical performances have tanked.
Here’s a comparison of these two ETFs:
| IVE | VOO | |
| 1-Year | 23.81% | 28.15% |
| 3-Year | 9.21% | 9.52% |
| 5-Year | 13.60% | 15.76% |
| 10-Year | 10.01% | 12.65% |
While IVE can perform very well in bull markets, it doesn’t quite keep up with VOO in any timeframe. Despite its focus on value stocks, it doesn’t have the same oomph that VOO can have.
List Top Holdings
The holdings of both of these stocks can change at any time. However, they both tend to remain relatively stable.
VOO is a broad market ETF, so you’ll find established companies from many different sectors within it. This diversification offers a snapshot of America’s top-performing companies and allows it to mirror the US economy.
Here are VOO’s current top holdings:
- Microsoft Corporation (NASDAQ: MSFT)
- Apple Inc. (NASDAQ: AAPL)
- NVIDIA Corporation (NASDAQ: NVDA)
- Amazon.com, Inc. (NASDAQ: AMZN)
- Meta Platforms, Inc. (NASDAQ: META)
- Alphabet Inc. (NASDAQ: GOOGL)
- Alphabet Inc. (NASDAQ: GOOG)
- Berkshire Hathaway Inc. (NYSE: BRK-B)
- Eli Lilly and Company (NYSE: LLY)
- JPMorgan Chase & Co (NYSE: JPM)
IVE also mirrors the S&P 500, but it focuses on value stocks. As we’ve seen, that doesn’t necessarily mean it does have more growth or is more risky. It does mean that its top holdings are slightly different, though:
- Berkshire Hathaway Inc
- JPMorgan Chase & Co
- Exxon Mobil Corp (NYSE: XOM)
- Johnson & Johnson (NYSE: JNJ)
- UnitedHealth Group Inc (NYSE: UNH)
- Chevron Corp (NYSE: CVX)
- Walmart Inc (NYSE: WMT)
- Bank of America Corp (NYSE: BAC)
- Procter & Gamble Co (NYSE: PG)
- Wells Fargo & Co (NYSE: WFC)
As you can see, the holdings are very different, though there is a little overlap. This difference causes a slight historical performance variation between the two ETFs.
Choosing Between IVE and VOO

Choosing between IVE and VOO depends on your unique investment goals.
VOO is a low-cost, diversified approach that mirrors the S&P 500. It also performs better than IVE historically. For this reason, we recommend it for most investors, especially those looking for long-term growth. It’s a good investment for buy-and-hold investors.
IVE focuses on value stocks within the S&P 500. It holds the potential for higher returns, but this hasn’t proved to be true over the years. It can cater to investors with more risk tolerance who want to take advantage of higher short-term gains. However, it isn’t the best choice for buying and holding stocks.
Consider incorporating both IVE and VOO into your portfolio for a balanced approach. VOO offers broad market exposure, while IVE provides targeted value investing within the S&P 500. This diversification can help mitigate risk and potentially enhance returns. Remember, diversification doesn’t guarantee profits or eliminate the risk of loss.
However, you don’t necessarily have to choose between these two stocks.
If you go this route, be sure to rebalance your portfolio regularly. Otherwise, your risk profile will tip one way or the other as your money grows.
You may also want to consider SWPPX, a mutual fund offered by Charles Schwab. We have an article on VOO vs. SWPPX for you to consider, too.
The post IVE vs. VOO: Which ETF Should You Buy? appeared first on 24/7 Wall St..
]]>