Hurricane 2019 NH Hurricane/Typhoon season

trappers

Safety not guaranteed
Moderator
Jul 28, 1999
41,692
10,799
1,525
An airport
First named storm was Hurricane Alvin (#01E) which petered out after briefly reaching Cat 1 strength.

Tropical Storm Barbara (#02E) is currently intensifying, however, and could be more interesting although also likely to be a fish storm

JTWC is predicting it to be a decent fish storm peaking at 95 kt (1 min sustained) which is a high end Cat 2 Hurricane (~Cat 3 TC on Aus Scale).

Current presentation not great with no clear banding and LLCC covered by CDO. SST's later into the track are not great either (27-28 °C) but she is presently over 29-30C water which helps.

20190701 - 02E - Barbara VIS.gif
20190701.0000.goes15.x.vis2km.02EBARBARA.40kts-1003mb-107N-1114W.100pc.jpg
20190630.2309.f16.x.91h.02EBARBARA.40kts-1003mb-107N-1114W.095pc.jpg 20190701 - 02E - Barbara VIS GEOS16.gif 20190701.0000.goes15.x.wv1km.02EBARBARA.40kts-1003mb-107N-1114W.100pc.jpg ep022019.19063012.gif
 
I haven’t looked at it in any detail but looks like some considerably dry air to it’s north?
 
GOES17_1km_wv_201907010515_6.75_15.25_-120.00_-106.50_wv1_ltng17_hgwy_warn_latlon_weathernerds.gif Looks to be in RI with aleast 50% of a eyewall atm.

GOES17_1km_wv_201907010515_6.75_15.25_-120.00_-106.50_wv1_ltng17_hgwy_warn_latlon_weathernerds.gif
 
GOES17_1km_wv_201907010515_6.75_15.25_-120.00_-106.50_wv1_ltng17_hgwy_warn_latlon_weathernerds.gif Looks to be in RI with aleast 50% of a eyewall atm.

GOES17_1km_wv_201907010515_6.75_15.25_-120.00_-106.50_wv1_ltng17_hgwy_warn_latlon_weathernerds.gif
Yep definitely rapidly intensifying, but dont see an eyewall yet - everything covered by CDO and no recent MW passes to check - RGB over the last 6 hrs showing the increase in convection.

20190701 - 02E - Barbara RGB GEOS16.gif
 
Yeah not on visible sat yet. but micro showed the half wall spiral low level cyan inner ring.

20190701.0129.coriolis.x.color37.02EBARBARA.40kts-1003mb-107N-1114W.089pc.jpg

20190701.0129.coriolis.x.color37.02EBARBARA.40kts-1003mb-107N-1114W.089pc.jpg
 
Advertisement
Yeah not on visible sat yet. but micro showed the half wall spiral low level cyan inner ring.

20190701.0129.coriolis.x.color37.02EBARBARA.40kts-1003mb-107N-1114W.089pc.jpg

20190701.0129.coriolis.x.color37.02EBARBARA.40kts-1003mb-107N-1114W.089pc.jpg
Ahhh I was looking at the later MW shot (02:23Z) which is not quite as clear (see below) - it is 6:10 UTC now so these were 4-5 hrs ago. The most recent convective explosion only has taken place in the last hour, so will be interesting to see the next MW image.
20190701.0223.f17.x.color37.02EBARBARA.45kts-1000mb-109N-1133W.074pc.jpg
 
Good night #Hurricane #Barbara. This image taken shortly before nightfall (20 min ago) from #GOES17 shows lovely overshooting tops in relief thanks to the low sun angle - 02 July 2019 01:20UTC GOES-WEST Band 3 - 860 nm (near IR) #HurricaneBarbara #02E Levels slightly modified to highlight cloud top relief, light sharpening applied, light vignetting applied ... cos it looks cool :) .
20191830120_GOES17-ABI-tpw-03-7200x4320MOD.jpg
 
Be no supise to see this system when @ major status (cat 3 sshs),
durring a eyewall replacement, take on a annular tuck tyre structure
wth the model sst and moderate mid level shear combo.
 
Some potential for a tropical system to develop in the northern gulf over the next week. Climatology would suggest this system remains relatively weak however conditions at this stage do not appear to be too hostile overall so probably worth keeping an eye on.

two_atl_5d0.png

Tropical Weather Outlook
NWS National Hurricane Center Miami FL
800 PM EDT Mon Jul 8 2019

For the North Atlantic...Caribbean Sea and the Gulf of Mexico:

1. A trough of low pressure located over south-central Georgia is
producing disorganized showers. This disturbance is expected to
move southward or southwestward during the next day or two, and a
broad area of low pressure is forecast to form over the northeastern
Gulf of Mexico on Wednesday. Environmental conditions are expected
to be conducive for development and a tropical depression is likely
to form by the end of the week while the low moves slowly westward
across the northern Gulf of Mexico. Regardless of whether or not a
tropical cyclone develops, this system has the potential to produce
heavy rainfall along portions of the northern and eastern U.S. Gulf
Coast later this week. For more information about the rainfall
threat, please see products issued by your local weather forecast
office and the NOAA Weather Prediction Center. Interests along the
Gulf Coast from the Upper Texas coast to the western Florida
peninsula should monitor the progress of this system.
* Formation chance through 48 hours...low...30 percent.
* Formation chance through 5 days...high...80 percent.

Forecaster Cangialosi

92L_tracks_latest (1).png
 
Most recent EC and GFS runs have it hitting Houston between 980 hPa and 1000 hPa ... not massive, but if she stalls in the GOM for any length of time the outcome could be very different! The Ensembles seem fairly consistent though.

ecmwf_z500_mslp_us_fh0-168.gif
 
  • Like
Reactions: Orebound
NHC has begun issuing advisories for this system with the cyclone expected to reach minimal hurricane strength prior to landfall on the Louisiana coast sometime on Saturday. Regardless of any potential wind threats this system looks likely to be a major rain maker and subsequently cause problems with flooding in an area that is extremely low lying and susceptible to large flood events.

173249_5day_cone_no_line_and_wind.png

Potential Tropical Cyclone Two Discussion Number 1
NWS National Hurricane Center Miami FL AL022019
1000 AM CDT Wed Jul 10 2019

High-resolution satellite imagery along with surface and upper-air
data indicate that the broad low pressure system located over the
northeastern Gulf of Mexico has become a little better defined. The
initial intensity of 25 kt is based on an average of 1-minute wind
speeds of 20-33 kt reported by ships and buoys well south of the
poorly defined center. Although the system is currently experiencing
some northerly vertical wind shear, the shear is expected to
gradually subside over the next day or so, and the low has a high
chance of becoming a tropical depression or tropical storm by
Thursday. Since this system has the potential to bring tropical
storm conditions and storm surge to portions of the coast of
Louisiana by late Thursday or Friday, Potential Tropical Cyclone
advisories are being initiated at this time.

The initial motion estimate is an uncertain 245/07 kt. Some erratic
motion will be possible during the 24 hours or until a well-defined
center develops. However, the general motion as indicated by the
global and regional models is expected to be toward the west-
southwest or southwest. By Friday, the cyclone is forecast to turn
toward the west-northwest and then turn northwestward by Saturday
into a developing break in a deep-layer ridge that currently extends
from the southeastern U.S. westward across the southern Plains and
into the Desert Southwest. The timing of the ridge breakdown owing
to a shortwave trough moving southeastward out of the northern
Plains will be critical since a later/earlier turn by the cyclone
would shift the track west/east of the current forecast. The model
guidance is widely divergent after 48 hours with the UKMET model the
farthest west showing landfall along the Upper Texas coast, and the
GFS and HMON models farther east with landfall in south-central
Louisiana. The ECMWF model is about midway between these two
extremes, and the official track forecast leans toward that
model since it has performed well during this system's
pre-development phase. Note that forecast uncertainty for
disturbances is generally larger than for tropical cyclones,
especially beyond 48-72 hours.

Only slow strengthening is expected for the next 24-36 hours due to
the lack of a well-defined center and inner-core wind field, along
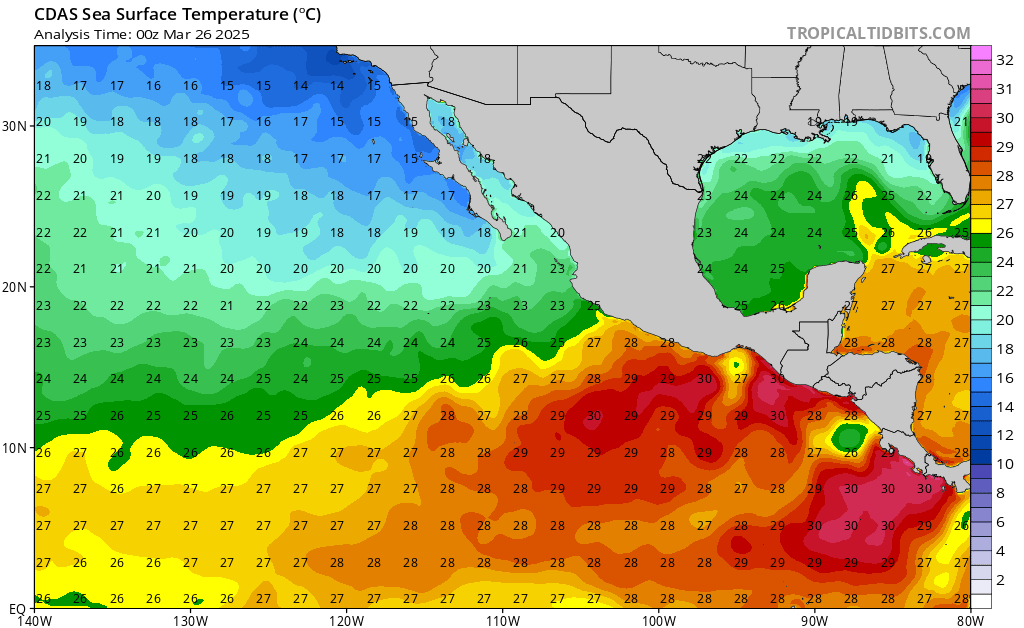
with some modest northerly wind shear. By 48 hours and beyond,
however, the combination of atmospheric and oceanic conditions
become ideal for intensification. The very low shear shear
conditions, an impressive outflow pattern forecast by all of the
global and regional models, and anomalously warm sea-surface
temperatures of 30-31C argue for quick intensification, but given
that the system is still in the formative stages, the official
intensity forecast is a little below IVCN consensus through 48
hours and trends higher toward the ECMWF-based SHIPS guidance at
72 hours.

Key Messages:

1. A tropical depression is expected to form later today or
Thursday. Conditions appear favorable for this system to strengthen
to a hurricane at it approaches the central Gulf Coast by the
weekend.

2. Dangerous storm surge is possible in portions of southeast
Louisiana, and a Storm Surge Watch has been issued for this area.
The risk for dangerous storm surge impacts also exists farther west
along the Louisiana coast into the Upper Texas coast, and additional
storm surge watches may be needed later today or tonight. Residents
in these areas should monitor the progress of this system and listen
to any advice given by local officials.

3. A Tropical Storm Watch has been issued for portions of the
Louisiana coast and additional Tropical Storm or Hurricane Watches
could be needed later today or tonight for the remainder of the
Louisiana coast and the Upper Texas Coast.

4. The system has the potential to produce very heavy rainfall along
and inland of the central Gulf Coast through early next week. For
more information, see products from your local National Weather
Service office and the NOAA Weather Prediction Center.

FORECAST POSITIONS AND MAX WINDS

INIT 10/1500Z 28.5N 86.4W 25 KT 30 MPH...POTENTIAL TROP CYCLONE
12H 11/0000Z 27.9N 87.3W 25 KT 30 MPH...POTENTIAL TROP CYCLONE
24H 11/1200Z 27.5N 88.2W 30 KT 35 MPH...TROPICAL DEPRESSION
36H 12/0000Z 27.4N 89.3W 40 KT 45 MPH
48H 12/1200Z 27.6N 90.4W 50 KT 60 MPH
72H 13/1200Z 28.7N 92.3W 75 KT 85 MPH
96H 14/1200Z 30.7N 93.0W 65 KT 75 MPH...INLAND
120H 15/1200Z 32.6N 94.1W 30 KT 35 MPH...INLAND

$$
Forecaster Stewart

173249WPCQPF_sm.gif

Still a fair spread in model forecast tracks but the general theme is for a landfall somewhere over LA.

Intensity forecasts are in that strong tropical storm to minimal hurricane range but as mentioned in the above forecast discussion a period of RI cannot be ruled out.

aal02_2019071012_track_early.png

aal02_2019071012_intensity_early.png
 
Yeah mw shows some nw shear. I never really look @ dvorak in that basin when aerial reconnaissance running..
 
Now named TS Barry. Looks like winds will die off not long after landfall, though sustained rainfall continuing well beyond landfall.
Image 1 below 5 day Wind Swath.
Image 2 below 5 day Rain Swath - note depths are in inches.
Both from HWRF 12Z.
swath_10m.TWO02L.2019071112.png

swath_rain.TWO02L.2019071112.png
 
Still only modest pressure falls in TS Barry via latest recon data with the system still being adversely affected by northerly shear. Hard to see this shear relaxing too much for the duration of the storms life over water in my opinion. Model intensity guidance is tending towards reflecting this with a distinct downtrend over the past couple of model cycles.

aal02_2019071118_intensity_early.png
 
Even with the shear this lopsided tc is slowly getting a little stronger.


Maximum Flight Level Wind: 46kts (~ 52.9mph) which was observed 74 nautical miles (85 statute miles) to the NE (43°) from the flight level center at 0:04:30Z
 
  • Like
Reactions: Orebound
Old Barry is still having his fair share of issues.

Image speaks for itself really though some of the smaller mesovortices rotating around the broader circulation have been interesting to observe.

D_S1Rz0XkAA-UOZ.jpg

Bring on the Westpac stuff!
 
Last edited:
Humm is someone itching on a chase i wonder. Global models atm thinking wpac will do its thing.
 
  • Like
Reactions: Orebound
Humm is someone itching on a chase i wonder. Global models atm thinking wpac will do its thing.

;) @Jwintermix Ha yeah it's getting to that time of the year where we start looking forward to a few trips up to the Westpac for sure! I still think it will be well into August before there is anything significant enough to bother with up there however, although as you know it doesn't take much to catch you off guard with something developing quickly against the odds.

Always got an eye on it.

MJO still not heading towards that "game on" mode just yet.

diagram_40days_forecast_GEFS_member.gif
 
19071415.png JMA has the area of interest marked.


TROPICAL DEPRESSION 1004 HPA AT 13N 135E WNW 10 KT.

19071415.pngdownload.png Looks a large monsoonal gyre.
download.png
The GFS develops two systems eventually outta the gyre.

44.gif
44.gif
The model see's divergence in the uppers. See how it pans out @ the least any system that
forms and tracks into the scs should inhence the sw monsoon. A good thing for the PI.


a-00.png
092 WTPQ20 RJTD 150300 RSMC TROPICAL CYCLONE ADVISORY NAME TD ANALYSIS PSTN 150300UTC 15.8N 132.5E FAIR MOVE W 10KT PRES 1002HPA MXWD 030KT GUST 045KT FORECAST 24HF 160300UTC 17.2N 126.9E 80NM 70% MOVE WNW 15KT PRES 998HPA MXWD 035KT GUST 050KT = NNNN

a-00.png

.........................................................................................................................


May get some help from a cckw. 18-24
2019-07-15 23_18_27-chi200.orig.sum.pacific.7 - Windows Photo Viewer.png

2019-07-15 23_18_27-chi200.orig.sum.pacific.7 - Windows Photo Viewer.png
 
sat_20190716_0800_animation (1).gif

JMA

TS 1905 (Danas)
Issued at 07:00 UTC, 16 July 2019

<Analysis at 06 UTC, 16 July>
Scale -
Intensity -
Center position N17°05' (17.1°)
E125°40' (125.7°)
Direction and speed of movement W 15 km/h (9 kt)
Central pressure 994 hPa
Maximum sustained wind speed 18 m/s (35 kt)
Maximum wind gust speed 25 m/s (50 kt)
≥ 30 kt wind area SE 560 km (300 NM)
NW 390 km (210 NM)

<Forecast for 18 UTC, 16 July>
Intensity -
Center position of probability circle N17°50' (17.8°)
E124°05' (124.1°)
Direction and speed of movement WNW 15 km/h (8 kt)
Central pressure 994 hPa
Maximum sustained wind speed 18 m/s (35 kt)
Maximum wind gust speed 25 m/s (50 kt)
Radius of probability circle 60 km (30 NM)

<Forecast for 06 UTC, 17 July>
Intensity -
Center position of probability circle N19°00' (19.0°)
E123°10' (123.2°)
Direction and speed of movement NW 15 km/h (7 kt)
Central pressure 990 hPa
Maximum sustained wind speed 20 m/s (40 kt)
Maximum wind gust speed 30 m/s (60 kt)
Radius of probability circle 90 km (50 NM)

<Forecast for 06 UTC, 18 July>
Intensity -
Center position of probability circle N22°05' (22.1°)
E122°05' (122.1°)
Direction and speed of movement NNW 15 km/h (8 kt)
Central pressure 985 hPa
Maximum sustained wind speed 23 m/s (45 kt)
Maximum wind gust speed 35 m/s (65 kt)
Radius of probability circle 220 km (120 NM)

<Forecast for 06 UTC, 19 July>
Intensity -
Center position of probability circle N25°55' (25.9°)
E122°30' (122.5°)
Direction and speed of movement N 20 km/h (10 kt)
Central pressure 985 hPa
Maximum sustained wind speed 23 m/s (45 kt)
Maximum wind gust speed 35 m/s (65 kt)
Radius of probability circle 330 km (180 NM)

<Forecast for 06 UTC, 20 July>
Intensity -
Center position of probability circle N29°55' (29.9°)
E122°30' (122.5°)
Direction and speed of movement N 20 km/h (10 kt)
Central pressure 990 hPa
Maximum sustained wind speed 20 m/s (40 kt)
Maximum wind gust speed 30 m/s (60 kt)
Radius of probability circle 480 km (260 NM)

<Forecast for 06 UTC, 21 July>
Intensity -
Center position of probability circle N33°00' (33.0°)
E121°35' (121.6°)
Direction and speed of movement N 15 km/h (8 kt)
Central pressure 994 hPa
Maximum sustained wind speed 18 m/s (35 kt)
Maximum wind gust speed 25 m/s (50 kt)
Radius of probability circle 650 km (350 NM)

For the moment, this one looks like swinging in a northerly arc to hit southern Japan (Kyushu) and S. Korea around Friday next week.
There was a bad one last year that hit just as the rainy season was pushing north, and the combined moisture produced huge rain totals and devastating floods. Is could be in exactly the same area, albeit 3 weeks later.